growthrate regulation acetyl coenzyme a …jb.asm.org/content/175/2/332.full.pdf · growthrate...
TRANSCRIPT

Vol. 175, No. 2JOURNAL OF BACTERIOLOGY, Jan. 1993, p. 332-3400021-9193/93/020332-09$02.00/0Copyright © 1993, American Society for Microbiology
Growth Rate Regulation of Escherichia coli Acetyl Coenzyme ACarboxylase, Which Catalyzes the First Committed
Step of Lipid BiosynthesisSHYR-JIANN LIt AND JOHN E. CRONAN, JR.2*
Departments ofMicrobiology' and Biochemistry University of Illinois atUrbana-Champaign, Urbana, Illinois 61801
Received 28 July 1992/Accepted 11 November 1992
Acetyl coenzyme A (CoA) carboxylase catalyzes the synthesis of malonyl-CoA, the first intermediate of fattyacid synthesis. The Escherichia coli enzyme is encoded by four subunits located at three different positions onthe E. coli chromosome. The accBC genes lie in a small operon at min 72, whereas accA and accD are locatedat min 4.3 and 50, respectively. We examined the expression of the genes that encode the E. coli acetyl-CoAcarboxylase subunits (accA, accBC, and accD) under a variety of growth conditions by quantitative Northern(RNA) blot analysis. We found a direct correlation between the levels of transcription of the acc genes and therate of cellular growth. Consistent results were also obtained upon nutritional upshift and downshiftexperiments and upon dilution of stationary-phase cultures into fresh media. We also determined the 5' end ofthe accA and accD mRNAs by primer extension and did transcriptional fusion analysis of the previouslyreported accBC promoter. Several interesting features were found in the promoter regions of these genes,including a bent DNA sequence and an open reading frame within the unusually long leader mRNA of theaccBC operon, potential stem-loop structures in the accA and accD mRNA leader regions, and a stretch ofGC-rich sequences followed by AT-rich sequences common to all three promoters. In addition, both accA andaccD are located in complex gene clusters. For example, the accA promoter was localized within the upstreampoiC gene (which encodes the DNA polymerase III catalytic subunit), suggesting that additional regulatorymechanisms exist.
Acetyl-coenzyme A (CoA) carboxylase catalyzes the firstcommitted step of fatty acid synthesis, the synthesis ofmalonyl-CoA (1). The overall reaction consists of two dis-tinct half-reactions, the carboxylation of biotin with bicar-bonate and transfer of the CO2 group from carboxy-biotin toacetyl-CoA to form malonyl-CoA (1, 32). In Escherichiacoli, the half-reactions are catalyzed by two different acetyl-CoA carboxylase subunits, biotin carboxylase and carboxy-ltransferase (1, 32). A third subunit, biotin carboxyl carrierprotein (BCCP), carries the essential biotin cofactor co-valently bound to a lysine residue proximal to its carboxylterminus.
Since acetyl-CoA carboxylase catalyzes the initial step offatty acid biosynthesis, it has been the subject of veryintensive study (37, 38). Several mechanisms have beenproposed for the regulation of mammalian acetyl-CoA car-boxylases. These include allosteric regulation by citrate andisocitrate (23), feedback inhibition by the end product,long-chain acyl-CoA (30), and covalent modification byphosphorylation and dephosphorylation (18). Recently, reg-ulation of acetyl-CoA carboxylase at the level of geneexpression has also been demonstrated in mouse preadipo-cytes (24). Unlike its eukaryotic counterpart, almost noinformation is available on the regulation of acetyl-CoAcarboxylase in E. coli and other prokaryotes (11). Physio-logical studies to determine the rate-limiting step in E. coliphospholipid biosynthesis have led to the suggestion thatacetyl-CoA carboxylase is the controlling step (16). Since94% of the ATP consumed in phospholipid biosynthesis is
* Corresponding author.t Present address: Department of Biophysics and Biochemistry,
Yale University, New Haven, CT 06511.
expended in the synthesis of the fatty acid components, itappears logical that acetyl-CoA carboxylase could be aprimary site for regulation of lipid biosynthesis (16).We have previously reported molecular cloning of the
genes that encode BCCP (accB), biotin carboxylase (accC),and the carboxyltransferase a (accA) and 1B (accD) subunits(20-22). The BCCP and biotin carboxylase genes arecotranscribed (accBC) and map at min 72, whereas the genesthat encode the two carboxyltransferase subunits map atdisparate regions in the E. coli chromosome (accA at min 4.3and accD at min 50). The four components of E. coliacetyl-CoA carboxylase function as an enzyme complex,presumably of defined stoichiometry (1, 14). These datasuggest that these genes are coregulated. Here we report thatthe rates of transcription of the genes that encode all foursubunits of acetyl-CoA carboxylase are directly related tothe rate of cell growth. We also report the promoter se-quences of these genes and certain features found in theirrespective promoter regions that may have regulatory im-portance.
MATERIALS AND METHODS
Strains and growth conditions. All of the bacterial strainsused in this study are derivatives of E. coli K-12 (Table 1).Strains LS317, LS318, LS319, and LS320, which carrycointegrated fusion plasmids on the F' element (see Fig. 4),were obtained by the method of Henry and Cronan (15). Thephenotypes of these strains were confirmed by the ability totransfer antibiotic resistance conjugationally to other recip-ient strains and by sensitivity to 0.05% methyl methane-sulfonate (hence, polA). Strain LS110 was derived fromstrain LS109 by P1 transduction and verified by determining
332
on August 9, 2018 by guest
http://jb.asm.org/
Dow
nloaded from

E. COLI COENZYME A CARBOXYLASE 333
TABLE 1. Bacterial strains and plasmids
SourceRelevant characteristic(s) (reference)
araD139 AlacU(169) rpsL thibirA+ (bioFC-lacZ)SO1
thyA36 deoC2Alac(169) araD rpsL thi nonnal4 metE pol41 zig::TnlO
lacZ(L8 UVS) reLUI spoTI thi-1metB reLA gyrA(pMFH15)W3110(pLS104)W3110(pLS104:.pMFH15)CA8224.1 lacZ(L8 UV5)zah::TnlO
W3110 lacZ(L8 UV5) zah::TnlOW3110poLUI zig::TnlOW3110(pLS177::pMFH15)W3110(pLS120::pMFH15)W3110(pLS121::pMFH15)W3110(pLS122::pMFH15)
Apr TcrCmr TcrAprApr, promoterless cat genepOX38::TnJOOOCYInsertion of gene for Cmr into
site of pTZ18UDeletion of the AspI-NsiI
fragment of pLS177Transcriptional fusion of accBCand cat in pKK232-8
pTZ18U carrying the accBCoperon
pBR322 carrying the accBCoperon
pACYC184 carrying the accBCoperon
Deletion of the AspI-HindIIIfragment of pLS177
Resection of the NsiI site ofpLS177
Deletion of the NsiI-HindIIIfragment of pLS177
This laboratory
This laboratoryL. C. DeVeaux
CGSCaM. F. HenryThis workThis workThis work
This workThis workThis workThis workThis workThis work
This laboratoryThis laboratoryB. Kemper (15)PromegaM. F. HenryThis work
This work
This work
This work
This work
This work
This work
This work
This work
a CGSC, E. coli Genetic Stock Center, Yale University, New Haven,Conn.
the ,B-galactosidase activities of cells grown in M9-glucoseand M9-glycerol media in the presence of 1 mM isopropyl-P-D-thiogalactopyranoside.
Bacteria were grown in RB (10 g of tryptone, 1 g of yeastextract, 5 g of sodium chloride per liter), M9 (27) supple-mented with 0.5% casein hydrolysate and 0.4% glucose, orM9 with 0.4% glucose, 0.4% glycerol, 0.4% succinate, or0.4% acetate as the sole carbon source. For phosphate-limiting conditions, MOPS (morpholinepropanesulfonic ac-id)-buffered media (29) supplemented with 0.4% glucose andeither 0.1 mM K2HPO4 or 1 [uM polyphosphate (sodiumphosphate glass, type 75+, Sigma) were used (33).RNA analysis. For Northern (RNA) blotting analysis, total
RNA was isolated as described by Kornblum et al. (19).Bacterial cells were grown as specified in the figure legends(see Fig. 1 to 3). Northern transfer, prehybridization, andhybridization were carried out as described previously (25).Stringent washing conditions were 680C, 0.1 x SSC (1x SSC
is 0.15 M NaCl plus 0.015 M sodium citrate), and 0.1%sodium dodecyl sulfate (SDS). The DNA probes were pre-pared by using the random primer kit and [CL-32P]dCTPpurchased from Amersham. The DNA probes were the1.8-kbp HindIII-PstI fragment of pLS1 (for accBC; 20), the484-bp ClaI-RsaI fragment of pLS152 (for accA; 21), and the689-bp AvaII fragment of pSJ9 (for accD; 21). Quantitationof the resulting Northern blots was done either by cutting thefilters and counting radioactivity in a BCS scintillator (Am-ersham) or by using a PhosphoImager densitometer asspecified by the manufacturer (Molecular Dynamics).
Primer extension analysis was performed by using meth-ods based on those of Ausubel et al. (3). Total RNA wasprepared by the hot SDS-phenol extraction method (2). Theprimers used were 5' GTATTAGTCAAACTCCAGTTCCACCTGCTC 3', 5' GTGCATCCGCCCTCTGATAGTA 3' (bothfor accA), and 5'GGACC1TTlCTGTCTGAACCTGGTFTCGATGC 3' (for accD). Primer extension reactions were car-ried out with 100 ng of a 5'-end-labeled (by [-y-32P]ATP; 5,000mCi/mmol; Amersham) primer, and T4 polynucleotide ki-nase, and 40 ,ug of purified RNA. The transcriptional startsites were determined by electrophoresis of the primerextension products on an 8% polyacrylamide gel containing8 M urea alongside DNA sequencing reactions generated byusing the same primer.DNA manipulations. Transformation, isolation of DNA,
restriction enzyme digestions, and agarose gel electrophore-sis were based on methods described by Maniatis et al. (25).Plasmid pLS177 was constructed by ligation of a blunt-ended(T4 DNA polymerase-treated) 834-bp KpnI-AspI fragment ofpLS1 (20) in to the SmaI site of plasmid pKK232-8(Promega). Plasmid pLS120 was obtained by deletion of theAspI-HindIII fragment of pLS177, which removed the entireleader mRNA sequence. Plasmid pLS121 was constructedby religation of the T4 DNA polymerase-treated NsiI site ofpLS177, which introduced a translational stop codon in theopen reading frame (ORF). Plasmid pLS122 was constructedby deletion of the NsiI-HindIII fragment of pLS177, whichremoved the C-terminal half of the ORF. Plasmid pLS106was made by deletion of the AspI-NsiI fragment of plasmidpLS177, which removed the bent DNA sequence and theN-terminal half of the ORF.
Detection of BCCP. Proteins of crude cell extracts (see thelegend to Fig. 3 for details of samples preparation) wereseparated by 12.5% polyacrylamide gel electrophoresis(PAGE) and electroblotted to polyvinylidene difluoridemembranes. The membranes were preblocked with TBST(10 mM Tris-HCl [pH 8.0], 150 mM NaCl, 0.2% Tween 20)buffer containing bovine serum albumin at 1 mg/ml for 3 hand then placed in fresh TBST buffer plus horseradishperoxidase-conjugated streptavidin (Zymed) with constantshaking at room temperature for 1 h. After the membranewas washed three times in fresh TBST buffer, the biotinatedBCCP protein band was detected either by providing achemiluminescence peroxidase substrate and exposure tox-ray film or by staining with 3, 3'-diaminobenzidine (Sigma)and H202. In the case of [3H]biotin-labeled samples, the22-kDa 3,3'-diaminobenzidine-stained protein bands werecut from the membrane and counted in a BCS scintillator.Alternatively, the BCCP protein level was measured bytrichloracetic acid (TCA) precipitation of [3H]biotin-labeledcells. BCCP is the sole biotin-containing protein in E. coli(10). Growth of cells and labeling with [3H]biotin were doneas described in the legend to Fig. 1. A 100-,ul culture samplewas pipetted onto a Whatman 3 MM filter previously soakedwith 0.5 mM d-biotin. The filter was washed twice with 10%
Strain orplasmid
E. colistrainsCY481
W3110LCD69
CA8224.1MFH61LS39LS40LS109
LS11OLS111LS317LS318LS319LS320
PlasmidspBR322pACYC184pTZ18UpKK232-8pMFH15pLS104
pLS106
pLS177
pLS1
pLS5
pLS6
pLS120
pLS121
pLS122
VOL. 175, 1993
on August 9, 2018 by guest
http://jb.asm.org/
Dow
nloaded from
334 LI AND CRONAN
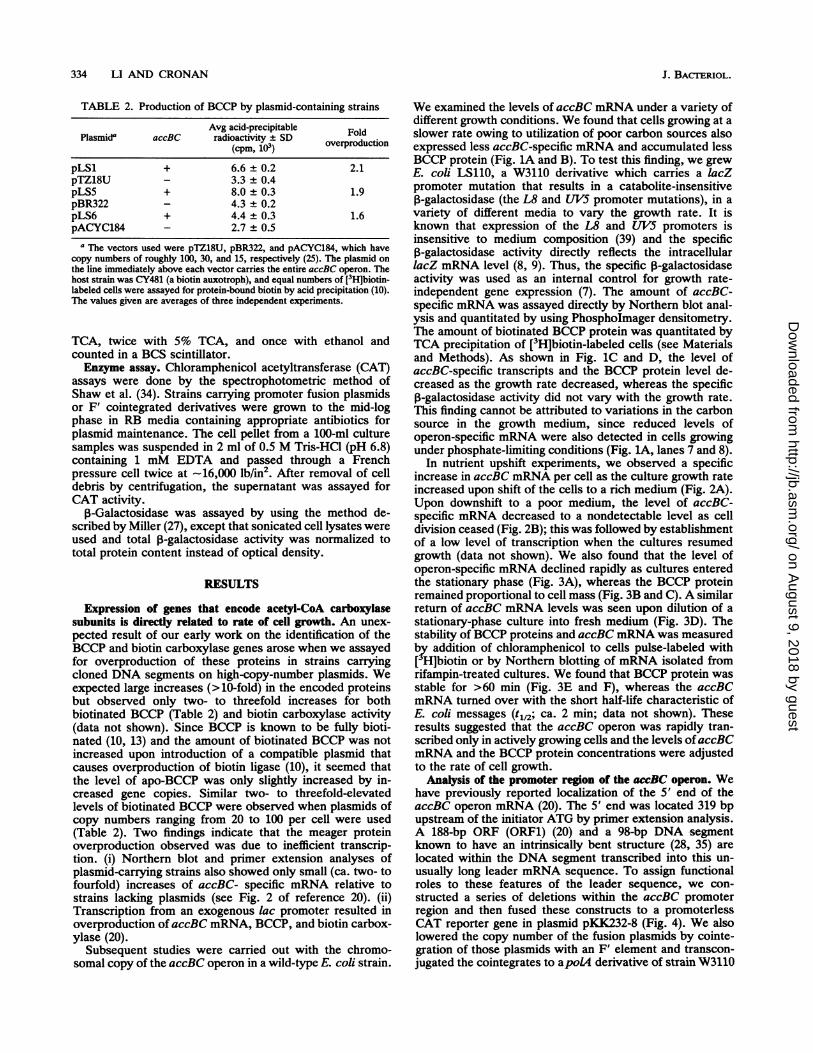
TABLE 2. Production of BCCP by plasmid-containing strains
Avg acid-precipitable FoldPlasmid0 accBC radioactivity + SD Fod
(cpm, 103) overproduction
pLSl + 6.6 + 0.2 2.1pTZ18U - 3.3 + 0.4pLS5 + 8.0 ± 0.3 1.9pBR322 - 4.3 ± 0.2pLS6 + 4.4 + 0.3 1.6pACYC184 - 2.7 ± 0.5
a The vectors used were pTZ18U, pBR322, and pACYC184, which havecopy numbers of roughly 100, 30, and 15, respectively (25). The plasmid onthe line immediately above each vector carries the entire accBC operon. Thehost strain was CY481 (a biotin auxotroph), and equal numbers of [3Hlbiotin-labeled cells were assayed for protein-bound biotin by acid precipitation (10).The values given are averages of three independent experiments.
TCA, twice with 5% TCA, and once with ethanol andcounted in a BCS scintillator.Enzyme assay. Chloramphenicol acetyltransferase (CAT)
assays were done by the spectrophotometric method ofShaw et al. (34). Strains carrying promoter fusion plasmidsor F' cointegrated derivatives were grown to the mid-logphase in RB media containing appropriate antibiotics forplasmid maintenance. The cell pellet from a 100-ml culturesamples was suspended in 2 ml of 0.5 M Tris-HCl (pH 6.8)containing 1 mM EDTA and passed through a Frenchpressure cell twice at -16,000 lb/in2. After removal of celldebris by centrifugation, the supernatant was assayed forCAT activity.
1-Galactosidase was assayed by using the method de-scribed by Miller (27), except that sonicated cell lysates wereused and total 0-galactosidase activity was normalized tototal protein content instead of optical density.
RESULTS
Expression of genes that encode acetyl-CoA carboxylasesubunits is directly related to rate of cell growth. An unex-pected result of our early work on the identification of theBCCP and biotin carboxylase genes arose when we assayedfor overproduction of these proteins in strains carryingcloned DNA segments on high-copy-number plasmids. Weexpected large increases (>10-fold) in the encoded proteinsbut observed only two- to threefold increases for bothbiotinated BCCP (Table 2) and biotin carboxylase activity(data not shown). Since BCCP is known to be fully bioti-nated (10, 13) and the amount of biotinated BCCP was notincreased upon introduction of a compatible plasmid thatcauses overproduction of biotin ligase (10), it seemed thatthe level of apo-BCCP was only slightly increased by in-creased gene copies. Similar two- to threefold-elevatedlevels of biotinated BCCP were observed when plasmids ofcopy numbers ranging from 20 to 100 per cell were used(Table 2). Two findings indicate that the meager proteinoverproduction observed was due to inefficient transcrip-tion. (i) Northern blot and primer extension analyses ofplasmid-carrying strains also showed only small (ca. two- tofourfold) increases of accBC- specific mRNA relative tostrains lacking plasmids (see Fig. 2 of reference 20). (ii)Transcription from an exogenous lac promoter resulted inoverproduction of accBC mRNA, BCCP, and biotin carbox-ylase (20).
Subsequent studies were carried out with the chromo-somal copy of the accBC operon in a wild-type E. coli strain.
We examined the levels of accBC mRNA under a variety ofdifferent growth conditions. We found that cells growing at aslower rate owing to utilization of poor carbon sources alsoexpressed less accBC-specific mRNA and accumulated lessBCCP protein (Fig. 1A and B). To test this finding, we grewE. coli LS110, a W3110 derivative which carries a lacZpromoter mutation that results in a catabolite-insensitive3-galactosidase (the L8 and UVS promoter mutations), in a
variety of different media to vary the growth rate. It isknown that expression of the L8 and UV5 promoters isinsensitive to medium composition (39) and the specificP-galactosidase activity directly reflects the intracellularlacZ mRNA level (8, 9). Thus, the specific 3-galactosidaseactivity was used as an internal control for growth rate-independent gene expression (7). The amount of accBC-specific mRNA was assayed directly by Northern blot anal-ysis and quantitated by using Phospholmager densitometry.The amount of biotinated BCCP protein was quantitated byTCA precipitation of [3H]biotin-labeled cells (see Materialsand Methods). As shown in Fig. 1C and D, the level ofaccBC-specific transcripts and the BCCP protein level de-creased as the growth rate decreased, whereas the specificP-galactosidase activity did not vary with the growth rate.This finding cannot be attributed to variations in the carbonsource in the growth medium, since reduced levels ofoperon-specific mRNA were also detected in cells growingunder phosphate-limiting conditions (Fig. 1A, lanes 7 and 8).
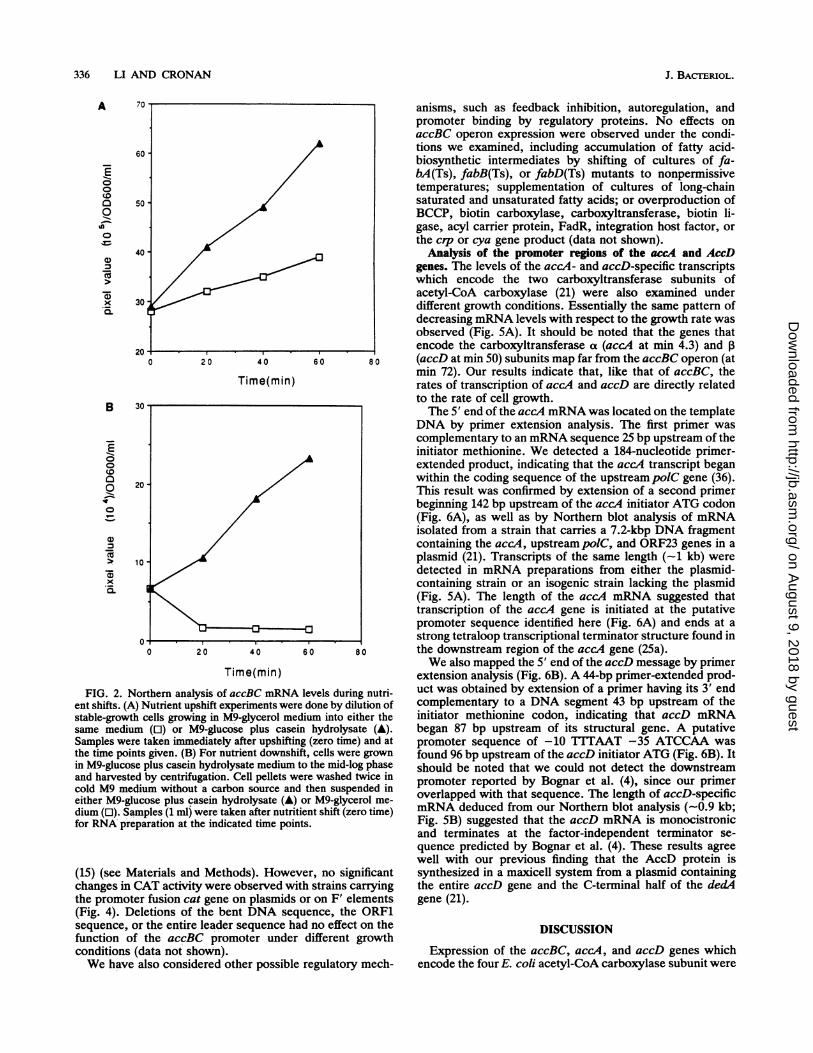
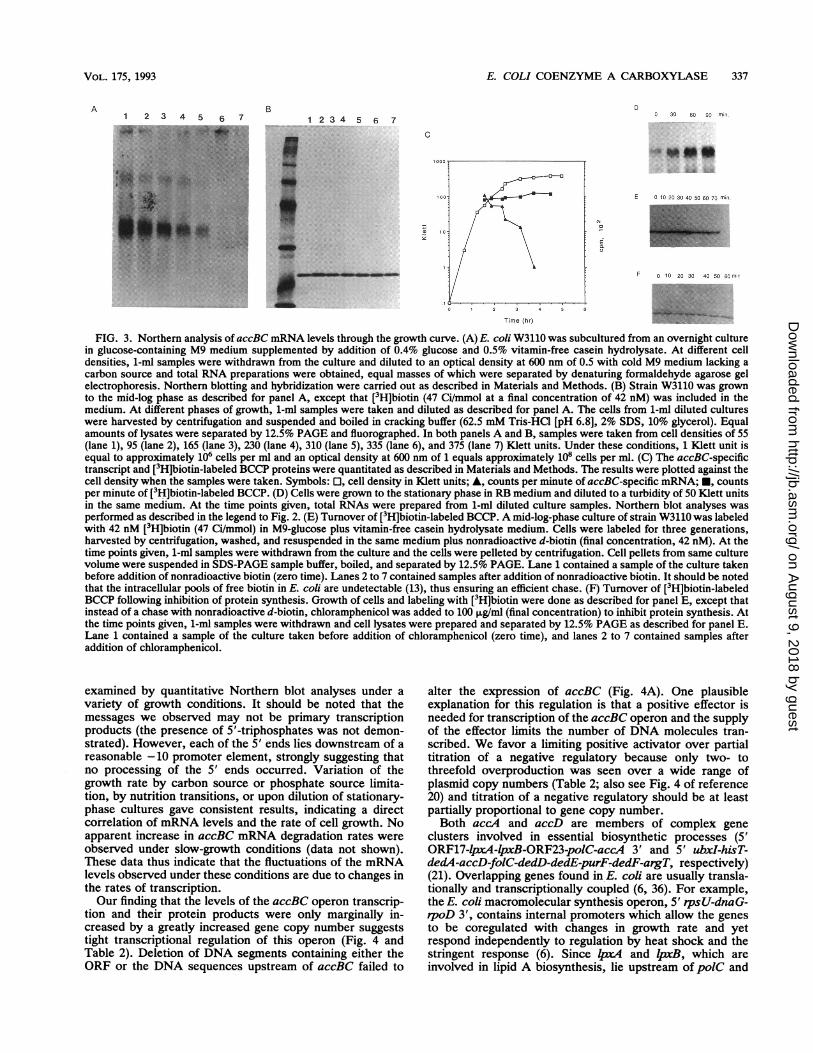
In nutrient upshift experiments, we observed a specificincrease in accBC mRNA per cell as the culture growth rateincreased upon shift of the cells to a rich medium (Fig. 2A).Upon downshift to a poor medium, the level of accBC-specific mRNA decreased to a nondetectable level as celldivision ceased (Fig. 2B); this was followed by establishmentof a low level of transcription when the cultures resumedgrowth (data not shown). We also found that the level ofoperon-specific mRNA declined rapidly as cultures enteredthe stationary phase (Fig. 3A), whereas the BCCP proteinremained proportional to cell mass (Fig. 3B and C). A similarreturn of accBC mRNA levels was seen upon dilution of astationary-phase culture into fresh medium (Fig. 3D). Thestability of BCCP proteins and accBC mRNA was measuredb addition of chloramphenicol to cells pulse-labeled with[ H]biotin or by Northern blotting of mRNA isolated fromrifampin-treated cultures. We found that BCCP protein wasstable for >60 min (Fig. 3E and F), whereas the accBCmRNA turned over with the short half-life characteristic ofE. coli messages (t112; ca. 2 min; data not shown). Theseresults suggested that the accBC operon was rapidly tran-scribed only in actively growing cells and the levels ofaccBCmRNA and the BCCP protein concentrations were adjustedto the rate of cell growth.
Analysis of the promoter region of the accBC operon. Wehave previously reported localization of the 5' end of theaccBC operon mRNA (20). The 5' end was located 319 bpupstream of the initiator ATG by primer extension analysis.A 188-bp ORF (ORF1) (20) and a 98-bp DNA segmentknown to have an intrinsically bent structure (28, 35) arelocated within the DNA segment transcribed into this un-usually long leader mRNA sequence. To assign functionalroles to these features of the leader sequence, we con-structed a series of deletions within the accBC promoterregion and then fused these constructs to a promoterlessCAT reporter gene in plasmid pKK232-8 (Fig. 4). We alsolowered the copy number of the fusion plasmids by cointe-gration of those plasmids with an F' element and transcon-jugated the cointegrates to apolA derivative of strain W3110
J. BACTERIOL.
on August 9, 2018 by guest
http://jb.asm.org/
Dow
nloaded from

VOL. 175, 1993 E. COLI COENZYME A CARBOXYLASE 335
Cu
C.)+
C
A' ' 0 C <
1 2 3 4 5 6
B
(3a-QI >
EL
C
C
0.0
b-
E
00
0.
D
coCOC)
1 2 3 4 5 6
-5
CI'
0
E0.
300co
X ~~~~~~o0~~~~~C+~~~~~~C
200- /
200
'A A
A
0
0 1 2 3
0 1~0
1/9 (hr
5-
4U
3
2
A A AA
0
0 3
300
Q0cu
._
Q
CuaCuw
0)100 0v
co
'a0)
soo0
._
I
500
.3
400 X.2._i
mu200 'a
00co
100 X0m
0
1/g (hr )FIG. 1. Analysis of accBC operon expression at various growth rates. (A) An overnight culture of strain LS110 grown in M9-glycerol
medium was diluted 200-fold into 20 ml of M9 medium containing various sole carbon sources or into MOPS medium with various phosphatesources (see Materials and Methods), and isopropyl-13-D-thiogalactopyranoside (final concentration, 1 mM) was added to all of the media usedin this experiment. After each culture attained a constant growth rate, cells were harvested by centrifugation and suspended to an opticaldensity at 600 nm of 1 in cold M9 medium without a carbon source and total RNAs were prepared. Samples (10 ml) of the same cultures wereharvested by centrifugation and used for 3-galactosidase assay and protein determination from sonicated cell lysates. Equal masses of totalRNA preparations were loaded on formaldehyde gels, and the hybridization signals were normalized to the protein concentrations of theoriginal cultures. Northern blot analysis was carried out as described previously (19), with an accBC-specific probe. (The DNA probe wasthe 1.8-kbp HindIII-PstI fragment of pLS1 [20].) Lanes 1 to 6 contained samples taken from cells grown in different carbon sourcesAbbreviations: RB, rich broth; Glu + Caa, glucose plus casein hydrolysate; Glu, glucose; Gly, glycerol; Suc, succinate; Ace, acetate. Lanes7 and 8 contained samples taken from cells grown in MOPS-glucose medium with 0.1 mM K2HPO4 (lane 7) or 1 FM polyphosphate (Poly-P)(lane 8) as the sole phosphate source (see Materials and Methods). (B) BCCP levels in cells grown at different rates. Equal amounts of totalprotein from lysates of cells grown in different media were separated by 12.5% PAGE (cells were grown as described for panel A, except that[3H]biotin [47 Ci/mmol at a final concentration of 42 nM] was included in the medium). This concentration of biotin is sufficient to repress E.coli endogenous biotin biosynthesis (10). [3H]biotin-labeled BCCP protein bands were detected by fluorography, and the growth conditionswere as indicated above the lanes. (C) The Northern blots shown in panel A were quantitated by PhosphoImager densitometry asrecommended by the manufacturer. The resulting pixel values (0; the pixel value is an arbitrary unit employed by the PhosphoImagerquantitation system and is linear over >5 orders of magnitude with the radioactivity of the sample) were plotted against the number ofdoublings per hour (g-1;g is generation time) of cultures grown in different media. Total RNAwas normalized to protein concentration ratherthan cell optical density because cells grown in differ carbon sources have different sizes and, hence, refractive indices (38). The specificP-galactosidase activity (A; 103 x A optical density at 420 nm per minute per milligram of protein) in each sample was used as an internalcontrol of gene expression (see text). (D) Growth of the cells and labeling with [3H]biotin were done as described for panel B. The[3H]biotin-labeled protein in cells grown in different carbon sources was quantitated by TCA precipitation (see Materials and Methods). Theresulting counts per minute per milligram of protein (-) were plotted against generation time and 3-galactosidase activity (A) as describedfor panel C.
on August 9, 2018 by guest
http://jb.asm.org/
Dow
nloaded from
336 LI AND CRONAN
A 70
60
so l
0
0),
200 20 40 60 80
Time(min)
B 30
0
0 2(0
00
0
> 10-
0 20 40 60 80
Time(min)
FIG. 2. Northern analysis of accBC mRNA levels during nutri-ent shifts. (A) Nutrient upshift experiments were done by dilution ofstable-growth cells growing in M9-glycerol medium into either thesame medium (0) or M9-glucose plus casein hydrolysate (A).Samples were taken immediately after upshifting (zero time) and atthe time points given. (B) For nutrient downshift, cells were grownin M9-glucose plus casein hydrolysate medium to the mid-log phaseand harvested by centrifugation. Cell pellets were washed twice incold M9 medium without a carbon source and then suspended ineither M9-glucose plus casein hydrolysate (A) or M9-glycerol me-dium (0). Samples (1 ml) were taken after nutritient shift (zero time)for RNA preparation at the indicated time points.
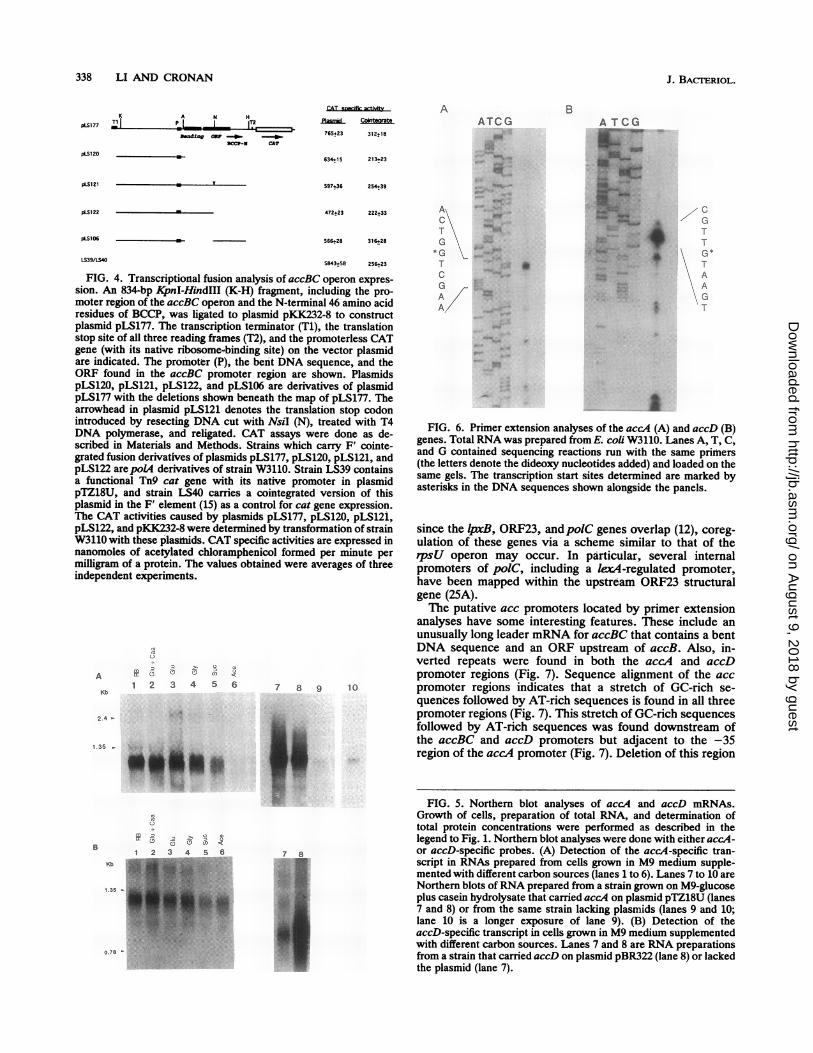
(15) (see Materials and Methods). However, no significantchanges in CAT activity were observed with strains carryingthe promoter fusion cat gene on plasmids or on F' elements(Fig. 4). Deletions of the bent DNA sequence, the ORF1sequence, or the entire leader sequence had no effect on thefunction of the accEC promoter under different growthconditions (data not shown).We have also considered other possible regulatory mech-
anisms, such as feedback inhibition, autoregulation, andpromoter binding by regulatory proteins. No effects onaccBC operon expression were observed under the condi-tions we examined, including accumulation of fatty acid-biosynthetic intermediates by shifting of cultures of fa-bA(Ts), fabB(Ts), or fabD(Ts) mutants to nonpermissivetemperatures; supplementation of cultures of long-chainsaturated and unsaturated fatty acids; or overproduction ofBCCP, biotin carboxylase, carboxyltransferase, biotin li-gase, acyl carrier protein, FadR, integration host factor, orthe crp or cya gene product (data not shown).
Analysis of the promoter regions of the accA and AccDgenes. The levels of the accA- and accD-specific transcriptswhich encode the two carboxyltransferase subunits ofacetyl-CoA carboxylase (21) were also examined underdifferent growth conditions. Essentially the same pattern ofdecreasing mRNA levels with respect to the growth rate wasobserved (Fig. SA). It should be noted that the genes thatencode the carboxyltransferase a (accA at min 4.3) and 1(accD at min 50) subunits map far from the accBC operon (atmin 72). Our results indicate that, like that of accBC, therates of transcription of accA and accD are directly relatedto the rate of cell growth.The 5' end of the accA mRNAwas located on the template
DNA by primer extension analysis. The first primer wascomplementary to an mRNA sequence 25 bp upstream of theinitiator methionine. We detected a 184-nucleotide primer-extended product, indicating that the accA transcript beganwithin the coding sequence of the upstream polC gene (36).This result was confirmed by extension of a second primerbeginning 142 bp upstream of the accA initiator ATG codon(Fig. 6A), as well as by Northern blot analysis of mRNAisolated from a strain that carries a 7.2-kbp DNA fragmentcontaining the accA, upstream polC, and ORF23 genes in aplasmid (21). Transcripts of the same length (-1 kb) weredetected in mRNA preparations from either the plasmid-containing strain or an isogenic strain lacking the plasmid(Fig. 5A). The length of the accA mRNA suggested thattranscription of the accA gene is initiated at the putativepromoter sequence identified here (Fig. 6A) and ends at astrong tetraloop transcriptional terminator structure found inthe downstream region of the accA gene (25a).We also mapped the 5' end of the accD message by primer
extension analysis (Fig. 6B). A 44-bp primer-extended prod-uct was obtained by extension of a primer having its 3' endcomplementary to a DNA segment 43 bp upstream of theinitiator methionine codon, indicating that accD mRNAbegan 87 bp upstream of its structural gene. A putativepromoter sequence of -10 TllTAAT -35 ATCCAA wasfound 96 bp upstream of the accD initiator ATG (Fig. 6B). Itshould be noted that we could not detect the downstreampromoter reported by Bognar et al. (4), since our primeroverlapped with that sequence. The length of accD-specificmRNA deduced from our Northern blot analysis (-0.9 kb;Fig. SB) suggested that the accD mRNA is monocistronicand terminates at the factor-independent terminator se-quence predicted by Bognar et al. (4). These results agreewell with our previous finding that the AccD protein issynthesized in a maxicell system from a plasmid containingthe entire accD gene and the C-terminal half of the dedAgene (21).
DISCUSSION
Expression of the accBC, accA, and accD genes whichencode the four E. coli acetyl-CoA carboxylase subunit were
J. BACTERIOL.
on August 9, 2018 by guest
http://jb.asm.org/
Dow
nloaded from
E. COLI COENZYME A CARBOXYLASE 337
A B1 2 3 45 6 7 1 2 3 4 5 6 7
=:r:
E 01020304050 60 70 min.
2oEF
F 0 10 20 30 40 50 60 min
FIG. 3. Northern analysis of accBC mRNA levels through the growth curve. (A) E. coli W3110 was subcultured from an overnight culturein glucose-containing M9 medium supplemented by addition of 0.4% glucose and 0.5% vitamin-free casein hydrolysate. At different celldensities, 1-ml samples were withdrawn from the culture and diluted to an optical density at 600 nm of 0.5 with cold M9 medium lacking acarbon source and total RNA preparations were obtained, equal masses of which were separated by denaturing formaldehyde agarose gelelectrophoresis. Northern blotting and hybridization were carried out as described in Materials and Methods. (B) Strain W3110 was grownto the mid-log phase as described for panel A, except that [3H]biotin (47 Ci/mmol at a final concentration of 42 nM) was included in themedium. At different phases of growth, 1-ml samples were taken and diluted as described for panel A. The cells from 1-ml diluted cultureswere harvested by centrifugation and suspended and boiled in cracking buffer (62.5 mM Tris-HCl [pH 6.8], 2% SDS, 10% glycerol). Equalamounts of lysates were separated by 12.5% PAGE and fluorographed. In both panels A and B, samples were taken from cell densities of 55(lane 1), 95 (lane 2), 165 (lane 3), 230 (lane 4), 310 (lane 5), 335 (lane 6), and 375 (lane 7) Klett units. Under these conditions, 1 Klett unit isequal to approximately 106 cells per ml and an optical density at 600 nm of 1 equals approximately 108 cells per ml. (C) The accBC-specifictranscript and [3H]biotin-labeled BCCP proteins were quantitated as described in Materials and Methods. The results were plotted against thecell density when the samples were taken. Symbols: E, cell density in Klett units; A, counts per minute of accBC-specific mRNA; *, countsper minute of [3H]biotin-labeled BCCP. (D) Cells were grown to the stationary phase in RB medium and diluted to a turbidity of 50 Klett unitsin the same medium. At the time points given, total RNAs were prepared from 1-ml diluted culture samples. Northern blot analyses wasperformed as described in the legend to Fig. 2. (E) Turnover of [3H]biotin-labeled BCCP. A mid-log-phase culture of strain W3110 was labeledwith 42 nM [3H]biotin (47 Ci/mmol) in M9-glucose plus vitamin-free casein hydrolysate medium. Cells were labeled for three generations,harvested by centrifugation, washed, and resuspended in the same medium plus nonradioactive d-biotin (final concentration, 42 nM). At thetime points given, 1-ml samples were withdrawn from the culture and the cells were pelleted by centrifugation. Cell pellets from same culturevolume were suspended in SDS-PAGE sample buffer, boiled, and separated by 12.5% PAGE. Lane 1 contained a sample of the culture takenbefore addition of nonradioactive biotin (zero time). Lanes 2 to 7 contained samples after addition of nonradioactive biotin. It should be notedthat the intracellular pools of free biotin in E. coli are undetectable (13), thus ensuring an efficient chase. (F) Turnover of [3H]biotin-labeledBCCP following inhibition of protein synthesis. Growth of cells and labeling with [3H]biotin were done as described for panel E, except thatinstead of a chase with nonradioactive d-biotin, chloramphenicol was added to 100 ,ug/ml (final concentration) to inhibit protein synthesis. Atthe time points given, 1-ml samples were withdrawn and cell lysates were prepared and separated by 12.5% PAGE as described for panel E.Lane 1 contained a sample of the culture taken before addition of chloramphenicol (zero time), and lanes 2 to 7 contained samples afteraddition of chloramphenicol.
examined by quantitative Northern blot analyses under a
variety of growth conditions. It should be noted that themessages we observed may not be primary transcriptionproducts (the presence of 5'-triphosphates was not demon-strated). However, each of the 5' ends lies downstream of areasonable -10 promoter element, strongly suggesting thatno processing of the 5' ends occurred. Variation of thegrowth rate by carbon source or phosphate source limita-tion, by nutrition transitions, or upon dilution of stationary-phase cultures gave consistent results, indicating a directcorrelation of mRNA levels and the rate of cell growth. Noapparent increase in accBC mRNA degradation rates wereobserved under slow-growth conditions (data not shown).These data thus indicate that the fluctuations of the mRNAlevels observed under these conditions are due to changes inthe rates of transcription.Our finding that the levels of the accBC operon transcrip-
tion and their protein products were only marginally in-creased by a greatly increased gene copy number suggeststight transcriptional regulation of this operon (Fig. 4 andTable 2). Deletion of DNA segments containing either theORF or the DNA sequences upstream of accBC failed to
alter the expression of accBC (Fig. 4A). One plausibleexplanation for this regulation is that a positive effector isneeded for transcription of the accBC operon and the supplyof the effector limits the number of DNA molecules tran-scribed. We favor a limiting positive activator over partial
titration of a negative regulatory because only two- tothreefold overproduction was seen over a wide range ofplasmid copy numbers (Table 2; also see Fig. 4 of reference20) and titration of a negative regulatory should be at leastpartially proportional to gene copy number.Both accA and accD are members of complex gene
clusters involved in essential biosynthetic processes (5'ORF17-lpx4-lpxB-ORF23-polC-accA 3' and 5' ubxI-hisT-dedA-accD-folC-dedD-dedE-purF-dedF-argT, respectively)(21). Overlapping genes found in E. coli are usually transla-tionally and transcriptionally coupled (6, 36). For example,the E. coli macromolecular synthesis operon, 5' rpsU-dnaG-rpoD 3', contains internal promoters which allow the genes
to be coregulated with changes in growth rate and yetrespond independently to regulation by heat shock and thestringent response (6). Since lpxA and lpxB, which areinvolved in lipid A biosynthesis, lie upstream of poiC and
c
I I1Bd
3
Time (hr)
VOL. 175, 1993
on August 9, 2018 by guest
http://jb.asm.org/
Dow
nloaded from
338 LI AND CRONAN
K A NPLS177 I
Banding 0
p2I120
p1S121 - v
pLS122
P1S106
AN H
Wcc-xs car
ATr- r.BCAT spe 312i2 ±18
Ma2im d Cokrtearate
765+23 312+18
634+15 213+23
597+36 254+39
472+23 222+33
566+28 316+28
LS39/140 5843+58 256+23
FIG. 4. Transcriptional fusion analysis of accBC operon expres-sion. An 834-bp KpnI-HindIII (K-H) fragment, including the pro-moter region of the accBC operon and the N-terminal 46 amino acidresidues of BCCP, was ligated to plasmid pKK232-8 to constructplasmid pLS177. The transcription terminator (Ti), the translationstop site of all three reading frames (T2), and the promoterless CATgene (with its native ribosome-binding site) on the vector plasmidare indicated. The promoter (P), the bent DNA sequence, and theORF found in the accBC promoter region are shown. PlasmidspLS120, pLS121, pLS122, and pLS106 are derivatives of plasmidpLS177 with the deletions shown beneath the map of pLS177. Thearrowhead in plasmid pLS121 denotes the translation stop codonintroduced by resecting DNA cut with NsiI (N), treated with T4DNA polymerase, and religated. CAT assays were done as de-scribed in Materials and Methods. Strains which carry F' cointe-grated fusion derivatives of plasmids pLS177, pLS120, pLS121, andpLS122 are poL4 derivatives of strain W3110. Strain LS39 containsa functional Tn9 cat gene with its native promoter in plasmidpTZ18U, and strain LS40 carries a cointegrated version of thisplasmid in the F' element (15) as a control for cat gene expression.The CAT activities caused by plasmids pLS177, pLS120, pLS121,pLS122, and pKK232-8 were determined by transformation of strainW3110 with these plasmids. CAT specific activities are expressed innanomoles of acetylated chloramphenicol formed per minute permilligram of a protein. The values obtained were averages of threeindependent experiments.
A
Kb
0
1, (2 (2
6c
2.4 -
1.35 -
7 8 9 10
4n
~ A,_A s a~~~~~~~~~~~~~a~~
AC\T\
*GTCGAA/
/cTT
\G*TAAGT
FIG. 6. Primer extension analyses of the accA (A) and accD (B)genes. Total RNA was prepared from E. coli W3110. Lanes A, T, C,and G contained sequencing reactions run with the same primers(the letters denote the dideoxy nucleotides added) and loaded on thesame gels. The transcription start sites determined are marked byasterisks in the DNA sequences shown alongside the panels.
since the lpxB, 0RF23, andpolC genes overlap (12), coreg-ulation of these genes via a scheme similar to that of therpsU operon may occur. In particular, several internalpromoters of poiC, including a exA-regulated promoter,have been mapped within the upstream 0RF23 structuralgene (25A).The putative acc promoters located by primer extension
analyses have some interesting features. These include anunusually long leader mRNA for accBC that contains a bentDNA sequence and an ORF upstream of accB. Also, in-verted repeats were found in both the accA and accDpromoter regions (Fig. 7). Sequence alignment of the accpromoter regions indicates that a stretch of GC-rich se-quences followed by AT-rich sequences is found in all threepromoter regions (Fig. 7). This stretch of GC-rich sequencesfollowed by AT-rich sequences was found downstream ofthe accBC and accD promoters but adjacent to the -35region of the accA promoter (Fig. 7). Deletion of this region
ale0
e .-AB (9 O Cn:
1 2 2 A A a
FIG. 5. Northern blot analyses of accA and accD mRNAs.Growth of cells, preparation of total RNA, and determination oftotal protein concentrations were performed as described in thelegend to Fig. 1. Northern blot analyses were done with either accA-or accD-specific probes. (A) Detection of the accA-specific tran-script in RNAs prepared from cells grown in M9 medium supple-mented with different carbon sources (lanes 1 to 6). Lanes 7 to 10 areNorthern blots ofRNA prepared from a strain grown on M9-glucoseplus casein hydrolysate that carried accA on plasmid pTZ18U (lanes7 and 8) or from the same strain lacking plasmids (lanes 9 and 10;lane 10 is a longer exposure of lane 9). (B) Detection of theaccD-specific transcript in cells grown in M9 medium supplementedwith different carbon sources. Lanes 7 and 8 are RNA preparationsfrom a strain that carried accD on plasmid pBR322 (lane 8) or lackedthe plasmid (lane 7).
1.35 -
0.78 I
J. BACTERIOL.
on August 9, 2018 by guest
http://jb.asm.org/
Dow
nloaded from
E. COLI COENZYME A CARBOXYLASE 339
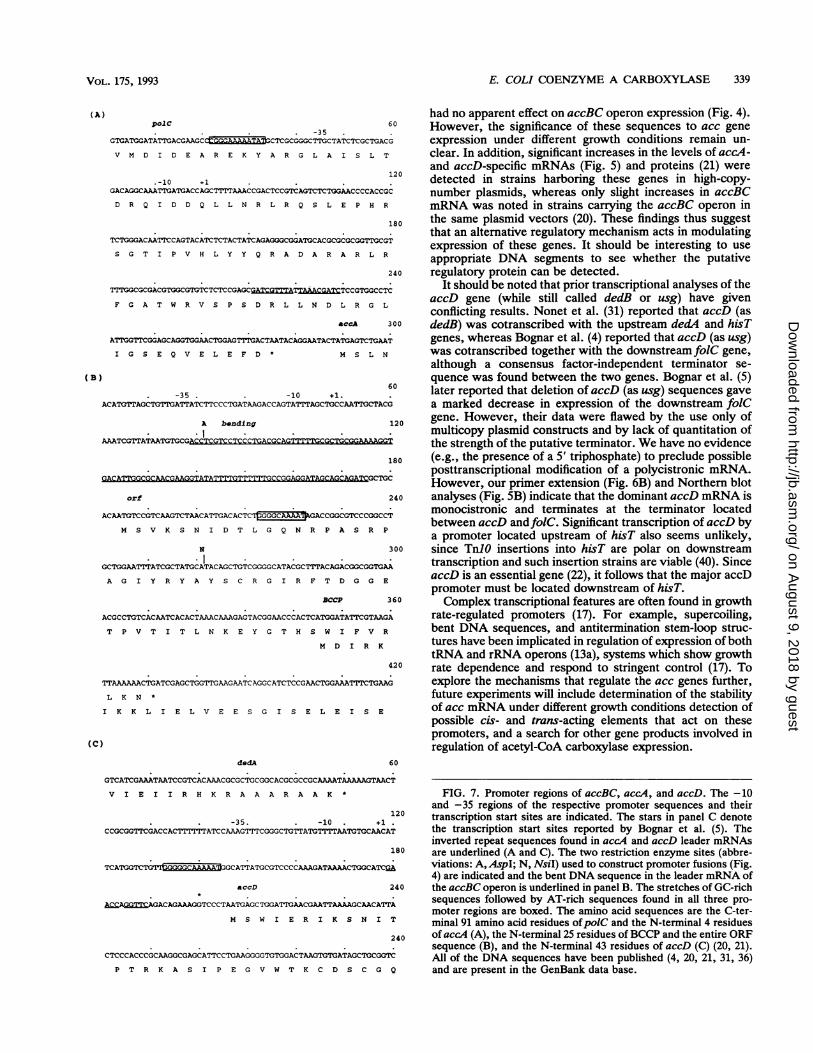
,) had no apparent effect on accBC operon expression (Fig. 4).polC 60 However, the significance of these sequences to acc gene
GTGATGGATATTGACGAAGC TAAAAcTCGCGGGCTI'GCTATCTCGCTGACG expression under different growth conditions remain un-V M D I D E A R E K Y A R G L A I S L T clear. In addition, significant increases in the levels of accA-
120and accD-specific mRNAs (Fig. 5) and proteins (21) were
-10 +1 . detected in strains harboring these genes in high-copy-GACAGGCAAATTGATGACCAGCTTTTAAACCGACTCCGTCAGTCTCTGGAACCCCACCGC number plasmids, whereas only slight increases in accBCD R Q I D D Q L L N R L R Q S L E P H R mRNA was noted in strains carrying the accBC operon in
180 the same plasmid vectors (20). These findings thus suggestthat an alternative regulatory mechanism acts in modulating
TCTGGGACAATTCCAGTACATCTCTACTATCAGAGGGCGGATGCACGCGCGCGGTTGCGT e o g
SGTIPVH LY Y R D A R R L Rexpression of these genes. It should be interesting to useS G T I P V H L Y Y Q R A D A R A R L R appropriate DNA segments to see whether the putative
240 regulatory protein can be detected.TTTGGCGCGACGTGGCGTGTCTCTCCGAGCGATCG*rr~wI:9TCCGTGGCCC.It should be noted that prior transcriptional analyses of the7'rTI'IuGCGACGTGGCGTTCTCTCCGAGC A&T~AAACGACCGTGGCCTC
accD gene (while still called dedB or usg) have givenF G A T W R V S P S D R L L N D L R G L conflicting results. Nonet et al. (31) reported that accD (as
accA 300 dedB) was cotranscribed with the upstream dedA and hisTAIGGTICGGAGCAGGTGGAACTGGAGITTGACTAATACAGGAATACTATGAGTCTGAAT genes, whereas Bognar et al. (4) reported that accD (as usg)I G S E Q V E L E F D M S L N was cotranscribed together with the downstream folC gene,
although a consensus factor-independent terminator se-)0 quence was found between the two genes. Bognar et al. (5)
-35 , . -10 1 60 later reported that deletion of accD (as usg) sequences gaveACATGTTAGCTGTTGATTATCTTCCCTGATAAGACCAGTATITAGCTGCCAATTGCTACG a marked decrease in expression of the downstream foiC
A bending 120 gene. However, their data were flawed by the use only of. I * multicopy plasmid constructs and by lack of quantitation of
AAATCGTrATAATGTGCG- the strength of the putative terminator. We have no evidence180 (e.g., the presence of a 5' triphosphate) to preclude possible
posttranscriptional modification of a polycistronic mRNA.GACA'=""" kWTATA'1"==M QQ-Q x1'1'.ATAGQAGCAGATQGCMC However, our primer extension (Fig. 6B) and Northern blot
orf 240 analyses (Fig. SB) indicate that the dominant accD mRNA ismonocistronic and terminates at the terminator locatedbetween accD andfolC. Significant transcription of accD byM S V K S N I D T L G Q N R P A S R P a promoter located upstream of hisT also seems unlikely,
N 300 since Tn1O insertions into hisT are polar on downstreamGCTGAATTATGCTAGCAACACTGCGGGCATCGCTTACGACGCGAItranscription and such insertion strains are viable (40). SinceG.CTGGAATITATCGCTATGCATACAGCTGTCGGGGCATACGC¶TTTACAGACGGX.CGGTGAA
A G I Y R Y A Y S C R G I R F T D G G E accD is an essential gene (22), it follows that the major accDpromoter must be located downstream of hisT.
BCCP 360 Complex transcriptional features are often found in growthAC;CCTGTCACAATCACACTAAACAAAGAGTACGGAACCCACTCATGATATTCGTAAGA rate-regulated promoters (17). For example, supercoiling,T P V T I T L N K E Y G T H S W I F V R bent DNA sequences, and antitermination stem-loop struc-
M D I R K tures have been implicated in regulation of expression of bothtRNA and rRNA operons (13a), systems which show growth
420 rate dependence and respond to stringent control (17). ToITAAAAAACTGATCGAGCTGGTTGAAGAATCAGGCATCTCCGAACTGGAAATTTCTGAAG explore the mechanisms that regulate the acc genes further,L K N * future experiments will include determination of the stability
I K K L I E L V E E S G I S E L E I S E of acc mRNA under different growth conditions detection ofpossible cis- and trans-acting elements that act on thesepromoters, and a search for other gene products involved inregulation of acetyl-CoA carboxylase expression.
dedA 60
GTCATCGAAATAATCCGTCACAAACGCGCTGCGGCACGCGCCGCAAAATAAAAAGTAACT
V I E I I R H K R A A A R A AK *
120-35. . -10 +1 .
CCGCGGTTCGACCACTNTI-TATCCAAAGTTTCGGGCTGTTATGTTTTAATGTGCAACAT
180
TCATGGTCTGTCfi5555CATTCArrATGCGTCCCCAAAGATAAAACTGGCATCQA
accD 240
A=AQf9AGACAGAAAGGTCCCTAATGAGCTGGATTGAACGAATTAAAAGCAACATTAM S W I E R I K S N I T
240
CTCCCACCCGCAAGGCGAGCATTCCTGAAGGGGTGTGGACTAAGTGTGATAGCTGCGGTC
P T R K A S I P E G V W T K C D S C G Q
FIG. 7. Promoter regions of accBC, accA, and accD. The -10and -35 regions of the respective promoter sequences and theirtranscription start sites are indicated. The stars in panel C denotethe transcription start sites reported by Bognar et al. (5). Theinverted repeat sequences found in accA and accD leader mRNAsare underlined (A and C). The two restriction enzyme sites (abbre-viations: A, AspI; N, NsiI) used to construct promoter fusions (Fig.4) are indicated and the bent DNA sequence in the leader mRNA ofthe accBC operon is underlined in panel B. The stretches of GC-richsequences followed by AT-rich sequences found in all three pro-moter regions are boxed. The amino acid sequences are the C-ter-minal 91 amino acid residues ofpoIC and the N-terminal 4 residuesofaccA (A), the N-terminal 25 residues ofBCCP and the entire ORFsequence (B), and the N-terminal 43 residues of accD (C) (20, 21).All of the DNA sequences have been published (4, 20, 21, 31, 36)and are present in the GenBank data base.
(A
(B)
(Cl
VOL. 175, 1993
on August 9, 2018 by guest
http://jb.asm.org/
Dow
nloaded from

340 LI AND CRONAN
ACKNOWLEDGMENTS
We thank John D'Elia for assistance and advice early in thesestudies.
This work was supported by NIH grant AI 15650.
REFERENCES1. Alberts, A., and P. R. Vagelos. 1972. Acyl CoA carboxylase, p.
37-82. In P. D. Boyer (ed.), The enzymes, vol. 6., 3rd ed.Academic Press, Inc., New York.
2. Arps, P. J., and M. E. Winkler. 1987. Structural analysis of theEscherichia coli K-12 hisT operon by a kanamycin resistancecassette. J. Bacteriol. 169:1061-1070.
3. Ausubel, F. M., R. Brent, R E. Kingston, D. D. Moore, J. G.Sudman, J. A. Smith, and K Struhl (ed.). 1987. Preparation andanalysis of RNA, p. 4.8.1-4.8.3. In Current protocols in molec-ular biology, vol. I. Wiley-Interscience, New York.
3a.Barker, D., and A. Campbell. 1981. The birA gene of Es-cherichia coli encodes a biotin holoenzyme synthetase. J. Mol.Biol. 146:451-467.
4. Bognar, A., C. Osborne, and B. Shane. 1987. Primary structureof the E. coli folC gene and its folylpolyglutamate synthetase-dihydrofolate synthetase product and regulation of expressionby an upstream gene. J. Biol. Chem. 262:12337-12343.
5. Bognar, A., C. Pyne, M. Yu, and G. Basi. 1989. Transcription ofthe folC gene encoding folylpolyglutamate synthetase-dihydrofo-late synthetase in Escherichia coli. J. Bacteriol. 171:1854-1861.
6. Burton, Z. F., C. A. Gross, K. K. Watanabe, and R. R. Burgess.1983. The operon that encodes the sigma subunit of RNApolymerase also encodes ribosomal protein S21 and DNAprimerase in E. coli K-12. Cell 32:335-349.
7. Cashel, M., and K E. Rudd. 1987. The stringent response, p.1410-1438. In F. C. Neidhardt, J. L. Ingraham, K. B. Low, B.Magasanik, M. Schaechter, and H. E. Umbarger (ed.), Es-cherichia coli and Salmonella typhimurinum: cellular and molec-ular biology, vol. 2. American Society for Microbiology, Wash-ington, D.C.
8. Cooper, T. G., and B. MagasaniLk. 1974. Transcription of the lacoperon of E. coli. J. Biol. Chem. 249:6556-6561.
9. Cooper, T. G., P. Whitney, and B. Magasanik. 1974. Reaction oflac specific ribonucleic acid from E. coli with lac deoxyribonu-cleic acid. J. Biol. Chem. 249:6548-6555.
10. Cronan, J. E., Jr. 1989. The E. coli bio operon: transcriptionrepression by an essential protein modification enzyme. Cell58:427-429.
11. Cronan, J. E., Jr., and C. 0. Rock. 1987. Biosynthesis ofmembrane lipids, p. 474-497. In F. C. Neidhardt, J. L. Ingra-ham, K. B. Low, B. Magasanik, M. Schaechter, and H. E.Umbarger (ed.), Escherichia coli and Salmonella typhimurium:cellular and molecular biology, vol. 1. American Society forMicrobiology, Washington, D.C.
12. Crowell, D. N., W. S. Reznikoff, and C. R. H. Raetz. 1987.Nucleotide sequence of the Escherichia coli gene for lipid Adisaccharide synthase. J. Bacteriol. 169:5727-5734.
13. Fall, R. R., and P. R. Vagelos. 1972. Acetyl-CoA carboxylase:molecular forms and subunit composition of biotin carboxylcarrier protein. J. Biol. Chem. 247:8005-8015.
13a.Gourse, R. L., A. de Boer, and M. Nomura. 1986. DNAdeterminants of rRNA synthesis in E. coli: growth rate depen-dent regulation, feed back inhibition, upstream activation, ant-itermination. Cell 44:197-205.
14. Guchhait, R. B., E. Polakis, P. Dimroth, E. Stoll, J. Moss, andM. D. Lane. 1974. Acetyl-CoA carboxylase system of E. coli:purification and properties of the biotin carboxylase, carboxyl-transferase, and carboxyl carrier proteins. J. Biol. Chem. 249:6633-6645.
15. Henry, M. F., and J. E. Cronan, Jr. 1989. A facile and reversiblemethod to decrease the copy number of the Col El-relatedcloning vectors commonly used in Escherichia coli. J. Bacteriol.171:5254-5261.
16. Jackowski, S., J. E. Cronan, Jr., and C. 0. Rock. 1991. Lipidmetabolism in procaryotes, p. 43-85. In D. E. Vance and J.Vance (ed.), Biochemistry of lipids, lipoproteins and mem-
branes. Elsevier Science Publishers B.V., Amsterdam.17. Jinks-Robertson, S., and M. Nomura. 1987. Ribosomes and
tRNA, p. 1358-1385. In F. C. Neidhardt, J. L. Ingraham, K. B.Low, B. Magasanik, M. Schaechter, and H. E. Umbarger (ed.),Escherichia coli and Salmonella typhimurium: cellular andmolecular biology, vol. 2. American Society for Microbiology,Washington, D.C.
18. Kim, K.-H. 1983. Regulation of acetyl-CoA carboxylase. Curr.Top. Cell. Regul. 22:143-172.
19. Kornblum, J. S., S. J. Projan, S. L. Moghazek, and R. P. Novik.1988. A rapid method to quantitate non-labeled RNA species inbacterial cells. Gene 63:75-85.
20. Li, S.-J., and J. E. Cronan, Jr. 1992. The gene encoding thebiotin carboxylase subunit of E. coli acetyl-CoA carboxylase. J.Biol. Chem. 267:855-863.
21. Li, S.-J., and J. E. Cronan, Jr. 1992. The genes encoding thetwo carboxyltransferase subunits of E. coli acetyl-CoA carbox-ylase. J. Biol. Chem. 267:16841-16847.
22. Li, S.-J., C. 0. Rock, and J. E. Cronan, Jr. 1992. The dedB (usg)open reading frame of Escherichia coli encodes a subunit ofacetyl-coenzyme A carboxylase. J. Bacteriol. 174:5755-5757.
23. Lopez-Casillas, F., M. E. Pape, D.-H. Bai, D. N. Kuhn, J. E.Dixon, and K.-H. Kim. 1987. Preparation of functional acetyl-CoA carboxylase mRNA from rat mammary gland. Arch.Biochem. Biophys. 257:63-68.
24. Luo, X., and K.-H. Kim. 1990. An enhancer element in thehouse-keeping promoter for acetyl-CoA carboxylase gene. Nu-cleic Acids Res. 18:3249-3254.
25. Maniatis, T., E. F. Fritsch, and J. Sambrook. 1982. Molecularcloning: a laboratory manual. Cold Spring Harbor Laboratory,Cold Spring Harbor, N.Y.
25a.McHenry, C. S. Personal communication.26. Mead, D. A., E. Szczesna-Skorupa, and B. Kemper. 1986.
Single-stranded DNA 'blue' T7 promoter plasmid: a versatiletandem promoter for cloning and protein engineering. ProteinEng. 1:67-74.
27. Miller, J. H. 1972. Experiments in molecular genetics. ColdSpring Harbor Laboratory, Cold Spring Harbor, N.Y.
28. Muramatsu, S., and T. Mizuno. 1989. Nucleotide sequence ofthe fabE gene and flanking regions containing a bent DNAsequence of E. coli. Nucleic Acids Res. 17:3982.
29. Neidhardt, F. C., P. L. Bloch, and D. F. Smith. 1974. Culturemedium for enterobacteria. J. Bacteriol. 119:736-747.
30. Nikawa, J., T. Tanabe, H. Ogiwara, T. Shiba, and S. Numa.1979. Inhibitory effects of long-chain acyl-CoA analogues on ratliver acetyl-CoA carboxylase. FEBS Lett. 102:223-278.
31. Nonet, M. L., C. C. Marvel, and D. R. Tolan. 1987. ThehisT-purF region of the E. coli K-12 chromosome. J. Biol.Chem. 262:12209-12217.
32. Polakis, S. E., R. B. Guchhait, E. E. Zwergel, M. D. Lane, andT. G. Cooper. 1974. Acetyl-CoA carboxylase system of E. coli:studies on the mechanisms of the biotin carboxylase and carbox-yltransferase catalyzed reactions. J. Biol. Chem. 244:6657-667.
33. Rao, N. N., and A. Torriani. 1988. Utilization by Escherichiacoli of a high-molecular-weight, linear polyphosphate: roles ofphosphatases and pore proteins. J. Bacteriol. 170:5216-5223.
34. Shaw,W. V. 1975. Chloramphenicol acetyl-transferase from chlor-amphenicol resistant bacteria. Methods Enzymol. 43:737-753.
35. Tanaka, K., S. Muramatsu, H. Yamada, and T. Mizuno. 1991.Systematic characterization of curved DNA segments randomlycloned from E. coli and their functional significance. Mol. Gen.Genet. 226:367-376.
36. Tomasiewicz, H. G., and C. S. McHenry. 1987. Sequenceanalysis of the Escherichia coli dnaE gene. J. Bacteriol. 169:5735-5744.
37. Volpe, J. J., and P. R. Vagelos. 1976. Saturated fatty acidbiosynthesis and its regulation. Physiol. Rev. 567:339-417.
38. Wakil, S. J., J. K. Stoops, and V. C. Joshi. 1983. Fatty acidsynthesis and its regulation. Annu. Rev. Biochem. 52:537-579.
39. Wanner, B. L., R Kodaira, and F. C. Neidhardt. 1977. Physio-logical regulation of a decontrolled lac operon. J. Bacteriol.130:212-222.
40. Winkler, M. E. Personal communication.
J. BACTERIOL.
on August 9, 2018 by guest
http://jb.asm.org/
Dow
nloaded from