growth years of
TRANSCRIPT

2016 Annual Report
General Mills
GrowthBranded Growth • Global Growth • Shareholder Value Growth
150 Years of

$16,563
$17,630
$17,910
$17,774
$16,658
$2.92
$2.86
$2.82
$2.72
$2.56
$3,000
$3,035
$3,154
$3,223
$3,012
Our Fiscal 2016 Financial Highlights
In Millions, Except per Share, Profit Margin and Return on Capital Data
52 Weeks Ended May 29, 2016
53 Weeks Ended May 31, 2015 Change
Change on a Constant
Currency Basis*
Net Sales $ 16,563 $ 17,630 – 6% – 2%
Total Segment Operating Profit* $ 3,000 $ 3,035 – 1% + 1%
Adjusted Operating Profit Margin* 16.8% 15.9% +90 basis points
Net Earnings Attributable to General Mills $ 1,697 $ 1,221 + 39%
Diluted Earnings per Share (EPS) $ 2.77 $ 1.97 + 41%
Adjusted Diluted EPS, Excluding Certain Items Affecting Comparability* $ 2.92 $ 2.86 + 2% + 5%
Adjusted Return on Average Total Capital* 11.3% 11.2% +10 basis points +40 basis points
Average Diluted Shares Outstanding 612 619 – 1%
Dividends per Share $ 1.78 $ 1.67 + 7%
Net Sales(dollars in millions)
Total Segment Operating Profit*(dollars in millions)
Adjusted Diluted Earnings per Share*(dollars)
Left: Wheaties cereal print ad, 1939Below: Gold Medal flour recipe book, 1907
*See page 31 for a discussion of these non-GAAP measures.

52%36%
12%24%
23%21%
19%
13%
43%
22%
20%
15%
82%
18%
150 Years of GrowthGeneral Mills is celebrating its 150th anniversary this year! From our grain-milling roots in the upper Midwest of the U.S., we have grown to become a global packaged food company that generates nearly $18 billion in annual sales with products available in more than 100 markets worldwide. We owe our longevity to our ability to adapt to a changing marketplace and, with our Consumer First strategy, we are excited about our prospects for growth for the next 150 years.
General Mills at a Glance
U.S. RetailNet Sales by Operating Unit
Joint VenturesNet Sales by Joint Venture(not consolidated, proportionate share)
Convenience Stores and FoodserviceNet Sales by Brand Type
InternationalNet Sales by Region
$4.6 Billion
43% Europe
22% Asia/Pacific
20% Canada
15% Latin America
$10.0 Billion
24% Meals
23% Cereal
21% Snacks
19% Baking Products
13% Yogurt and Other
$1.9 Billion
52% Branded to Foodservice Operators
36% Branded to Consumers
12% Unbranded
$1.0 Billion
82% Cereal Partners Worldwide (CPW)
18% Häagen-Dazs Japan (HDJ)
2016 Annual Report 1

13%
12%
15%
Latest 3 Years
2016
Latest 5 Years
12%
11%
2%
1.78
1.67
1.55
1.32
1.22
1.92
To Our ShareholdersFiscal 2016 was a milestone year for us at General
Mills as we celebrated our 150th anniversary.
During our history, we have introduced some
of the most iconic food brands around the
world. We’ve grown globally and now compete
in more than 100 markets worldwide. And we’ve
consistently delivered solid shareholder value.
Our operating performance this year slightly
exceeded our plan and we generated double-digit
returns for our shareholders. And as our history
shows, we are adaptable and are positioning
ourselves well for future growth.
150 Years of Growth
Our company began with a single flour mill built in 1866 on the banks
of the Mississippi River in Minneapolis, Minn. Over the years, our
business portfolio expanded to include a broad range of industries —
from flour to apparel, from toys to restaurants — before refocusing on
consumer foods in 1995. We’ve grown our company by developing
and nurturing great brands that consumers trust. Our seven largest
brands — Cheerios, Betty Crocker, Pillsbury, Nature Valley, Yoplait, Old El Paso
and Häagen-Dazs— each generate more than $1 billion in annual retail
sales. Most of our brands hold the No. 1 or No. 2 share positions in their
Ken Powell
Chairman and
Chief Executive Officer
Total Shareholder Return(fiscal years, stock price appreciation plus reinvested dividends, compound annual growth)
Dividends per Share(dollars)
General Mills S&P 500 Index
Source: Bloomberg
New Annualized Rate
2 General Mills

categories, and they’ve proven to be resilient as market conditions
and consumer tastes have changed through the years.
We’ve also grown by substantially increasing our global presence.
Over the past decade alone, combined net sales for our consolidated
International operations plus our 50- percent share of joint venture
revenues have more than doubled. Today, these businesses combined
generate nearly $6 billion in international net sales, or about one third
of total company sales. We’ve been increasing our global footprint
by acquiring new brands in international markets and expanding our
current brands into more markets around the world. A great example
is our recent introduction of Yoplait yogurt in China; you can read
about that on page 6 of this report.
By driving branded growth and global growth, we’ve generated strong
increases in shareholder value over time. General Mills incorporated
in 1928 and began trading on the New York Stock Exchange (NYSE) in
November of that year. As a matter of fact, General Mills is the 48th
longest-trading company of the 2,400 companies currently listed on the
NYSE. Delivering value to our shareholders has been the cornerstone
of our existence, and dividends are a key part of that. General Mills
and its predecessor firm have paid a dividend for 117 consecutive years.
Over the past five fiscal years, our annual dividend has grown at a
10 percent compound rate. And our total shareholder return, which is a
combination of stock price appreciation plus dividends, has consistently
outperformed the broader market, generating double-digit returns over
nearly any extended period of time. Fiscal 2016 was no exception as our
shareholder return totaled 15 percent, well ahead of the S&P 500 Index.
We attribute our longevity to our ability to adapt to changing
consumer needs, and never has that been more vital than today as
consumers’ food interests are evolving rapidly. Increasingly, consumers
value simplicity in their food, often in the form of fewer, natural
ingredients. They seek foods that meet their definition of wellness,
which can mean more protein, more whole grains, or less sugar. And
they’re snacking more than ever. Internationally, as the middle class
grows around the world, consumer demand for convenient, great-
tasting food is expanding. In fiscal 2016, we brought a variety of
renovation and innovation news to our brands designed to leverage
these changing consumer demands.
Fiscal 2016 PerformanceGeneral Mills net sales for the fiscal year ended May 29, 2016, declined
6 percent to $16.6 billion, reflecting the sale of the Green Giant
vegetable business in North America, foreign currency headwinds
and a comparison to a 53-week fiscal year in 2015. Excluding the
impact of foreign exchange, our net sales declined 2 percent in
fiscal 2016.* Total segment operating profit decreased 1 percent to
$3.0 billion. On a constant- currency basis, total segment operating
profit increased 1 percent.
1941
Cheerios cereal was first introduced.
Thirty-seven years later, we launched a second
variety: Honey Nut Cheerios.
Growing Our Core Cereal Brands
Cheerios is the best-selling cereal
franchise in the U.S. and Honey Nut
Cheerios is the best-selling cereal.
In fiscal 2016, we made five of the
top-selling Cheerios flavors gluten
free, driving low single-digit retail
sales growth on these varieties. We’ll
transition two more Cheerios varieties
to gluten free in fiscal 2017. More
than half of U.S. consumers told us
they want to avoid artificial colors
and flavors. So we announced our
commitment to remove artificial flavors
and colors from artificial sources from
all of our cereals. Today, 90 percent
of our cereals meet this claim, and we
continue to work on the remainder
of our portfolio. In addition, all of our
cereals are free of high fructose corn
syrup. By putting the consumer first,
we saw improved retail sales trends
for our U.S. cereals in fiscal 2016.
*See page 31 for a reconciliation of this and other non-GAAP measures used in this letter.
categories, and they
and consumer taste
We’ve also grown by
Over the past decad
International operat
revenues have more
generate nearly $6 b
of total company sa
by acquiring new br
current brands into
is our recent introdu
about that on page
By driving branded g
increases in shareho
in 1928 and began t
November of that ye
longest-trading com
NYSE. Delivering va
of our existence, an
and its predecessor
O th t fi fi
Growing Our Core Cereal Brands
Cheerios is the best-selling cereal
franchise in the U.S. and Honey Nut
Cheerios is the best-selling cereal.
2016 Annual Report 3

Diluted earnings per share increased 41 percent to $2.77 in fiscal
2016. Adjusted diluted earnings per share, which excludes certain
items affecting comparability of results, rose 2 percent to $2.92.
Excluding the impact of foreign exchange, adjusted diluted earnings
per share increased 5 percent.
Net sales for U.S. Retail, our largest business segment, declined to
$10.0 billion, due in part to the divestiture of the Green Giant vegetable
business and a comparison to last year’s 53-week fiscal year. As we
saw consumer food preferences changing, we went to work to bring
renovation and innovation news to many of our brands to drive growth.
For example, we made product improvements to our Nature Valley
snacks and brought gluten-free messaging to 20 percent of the line.
We introduced the Annie’s organic brand to new categories, including
yogurt, soup and cereal. And we drove growth on many of our cereal
brands with gluten-free messaging and the removal of artificial flavors
and colors. In fiscal 2017, we’ll continue to innovate on our brands to
drive sales growth for us and our categories.
Our Convenience Stores and Foodservice segment had another
year of solid results in fiscal 2016. While net sales declined 4 percent,
driven by market index pricing on bakery flour and the exit of some
low- margin businesses last year, segment operating profit grew
7 percent to a record $379 million. These results reflect our continued
focus on six key product platforms in growing foodservice channels:
cereal, snacks, yogurt, mixes, biscuits and frozen meals. These
priority businesses, which account for half of the segment’s sales and
70 percent of the segment’s operating profit, posted combined net
sales growth of 5 percent for the year.
Net sales for our International segment declined 10 percent to
$4.6 billion, and segment operating profit declined 15 percent, reflecting
negative foreign currency translation effects. On a constant- currency
basis, International net sales increased 3 percent and segment operating
profit declined 3 percent. Net sales grew 12 percent in Latin America,
with good performance in Brazil, including the acquisition of Carolina
yogurt in that market. Net sales increased 3 percent in the Europe
region as we posted good growth on Old El Paso Mexican products
and Häagen-Dazs ice cream. Net sales in the Asia/Pacific region were
up 1 percent, led by double-digit sales growth in India. And net sales
declined 4 percent in Canada, driven by the divestiture of the Green
Giant vegetable business in that market.*
Segment Operating Profit
Profit Margin(operating profit divided by net sales)
International Growth by Geographic Region(fiscal 2016, dollars in millions)
Net Sales
% Growth in Constant
Currency*
Europe $1,998 +3%
Asia/Pacific $996 +1%
Canada $929 -4%
Latin America $709 +12%
Total International $4,632 +3%
Convenience Stores and Foodservice Segment Operating Profit(fiscal years, dollars in millions)
*International net sales growth figures are in constant currency. See page 31 for a discussion of these non-GAAP measures.
$178
$379
2009
2016
8.9%
19.7%
1964
General Mills entered the snack
food market with Bugles, Daisy*s and Whistles. In
1975, we introduced Nature Valley granola bars — and
the country has been eating up our snacks
ever since.
4 General Mills

In addition to these three operating segments, we hold 50- percent
non- consolidated interests in two joint ventures outside of North
America. Together, Cereal Partners Worldwide (CPW) and Häagen-
Dazs Japan (HDJ) contributed $88 million in after-tax earnings in
2016. This was 12 percent above last year on a constant- currency basis,
driven primarily by favorable input costs and strong sales performance
from HDJ.
In fiscal 2016, we returned $1.5 billion to shareholders through
share repurchases and dividends. We repurchased approximately
11 million shares of common stock, reducing our average number
of diluted shares outstanding by 1 percent. We also increased our
annual dividend by 7 percent. In June 2016, we increased the quarterly
dividend rate another 4 percent. The new annualized rate of $1.92 per
share represents a yield between 2.5 and 3 percent at recent prices for
General Mills stock. Our goal is to continue to increase dividends as
earnings grow.
Building for the Future
At General Mills, we serve the world by making food people love.
This has been our guiding purpose over the past 150 years and will
continue to shape our company in the years ahead. We aspire to
continued levels of strong growth for our brands and our company.
Our goal is to create market- leading growth that will deliver top-tier
returns to shareholders.
General Mills Long-term Growth Model
Growth Factor Compound Growth Rate
Net Sales Low single-digit
Total Segment Operating Profit Mid single-digit
Adjusted Diluted Earnings per Share High single-digit
Dividend Yield 2 to 3 percent
Total Return to Shareholders Double-digit
Reshaping Our Portfolio with More Natural & Organic Offerings
Our natural and organic products
generated $750 million in pro forma
net sales in fiscal 2016, and given
organic foods are projected to grow
at a double-digit compound rate over
the next five years, we are expanding
our offerings to leverage this growing
food trend. Since acquiring Annie’s
foods in 2014, we’ve expanded this
trusted brand into the soup, yogurt
and cereal categories. We further
increased our portfolio in fiscal 2016
with the addition of EPIC Provisions,
a line of meat-based snacks. And this
summer, Liberté yogurt will go organic.
With net sales for our natural and
organic offerings growing double
digits in fiscal 2016, we are well
on our way to our goal of reaching
$1 billion in net sales for this U.S.
portfolio by 2019, a full year ahead
of our original plan.
2016 Annual Report 5

We remain committed to our long-term growth model. We believe
our businesses can generate low single-digit net sales growth, mid
single-digit total segment operating profit growth and high single-
digit growth in adjusted diluted earnings per share. When you add in a
dividend yield of between 2 and 3 percent, we should deliver double-
digit returns to shareholders over the long term.
As we enter fiscal 2017, we will build on our successes while
maintaining our focus on our Consumer First strategy. Consumers
are at the core of what we do. We work to gain a deep understanding
of their needs and respond quickly to give them what they want.
We’re also sharpening the way we think about our portfolio to
make more strategic choices about our level of investments and
expectations for growth across our businesses. We’ll manage
three-quarters of our portfolio as Growth businesses, where we see
the best opportunities for long-term growth. The remaining quarter
of our portfolio consists of Foundation businesses. They deliver
strong, consistent profit that helps fund topline growth initiatives.
We will make selective investments in these businesses, focusing on
strong returns.
Keeping our Consumer First strategy and our Growth and Foundation
designations in mind, we’re centering our efforts on four key priorities
described below.
Drive More from the Core
Our core brands, like Cheerios, Pillsbury, Nature Valley, Häagen-Dazs
and more, are the economic engines of our company, and we
know that driving growth from these well- established brands tends
to generate the best return for investors. Retail sales for our Nature
Valley grain snacks in the U.S. grew 3 percent in fiscal 2016 as we
introduced new varieties of this 40-year-old brand and also made
our crunchy bars easier to bite. Retail sales for Old El Paso Mexican
meals have been growing in markets around the world as we offer
more innovation and convenience. Our Häagen-Dazs super- premium
ice cream bars have been a big hit with European consumers,
driving 10 percent retail sales growth for the brand in Europe. And
Expanding Yogurt Around the World
With its health profile and great taste,
yogurt is a fast-growing food around
the world, and Yoplait is the No. 2
global yogurt brand. In fiscal 2016, we
launched Yoplait yogurt in Shanghai,
China, and the results have been
strong. In the last quarter of 2016,
Yoplait garnered a 10 percent share
of the yogurt category in Shanghai,
and we have our sights set on
continued expansion in the $16 billion
yogurt category in China. We’re also
expanding our portfolio of yogurt
brands. Last fall, we acquired the
Carolina yogurt business in Brazil. The
Brazilian yogurt category generates
$5 billion in annual sales, and we
see great opportunity for further
expansion of the many yogurt varieties
marketed under the Carolina brand.
1983
Pillsbury acquired the Häagen-Dazs
ice cream brand from businessman Reuben Mattus who dreamt up the brand name
back in 1961.
6 General Mills

the Pillsbury brand has been growing in U.S. schools as we added
mini-bagels and cheesy pull- aparts to our line of frozen meals
designed for school cafeterias.
Funding Our Future
We believe creating superior long-term shareholder value requires
a balance of growth and returns. We have a long history of funding
our future by generating cost savings we use to invest in topline
growth-driving ideas while still expanding our margins. Through
Holistic Margin Management (HMM), we are removing non-value
adding costs across the company. We are well on our way to
generating a cumulative $4 billion in cost-of-goods savings over the
decade ending in 2020. In the past two years, we have implemented
additional cost savings initiatives to streamline our global supply chain
and restructure our organization. These additional initiatives have
delivered $350 million in annual savings through 2016, and we expect
them to deliver $600 million in total annual savings by fiscal 2018.
These efforts, along with our sharpened focus on strategic investments
across our portfolio going forward, will help us achieve our goal of an
adjusted operating profit margin of 20 percent by fiscal 2018.
Reshaping Our Portfolio
We’re acquiring and divesting products to increase the growth profile
of our businesses. We’re also getting our brands into the fastest- growing
outlets where people buy food and expanding into new geographies to
reach more consumers around the world. In fiscal 2016, we divested our
Green Giant vegetable business in the U.S. and Canada. We expanded
our international portfolio with the acquisition of Carolina yogurt in
Brazil, and see page 5 for how we’re increasing our natural and organic
product portfolio.
Building an Advantaged and Agile Organization
We are developing new capabilities throughout our organization to
enable growth in a rapidly changing marketplace. We’re integrating
Consumer First principles into our innovation process to drive faster,
Funding Our Future with a Rectangular Pizza
Totino’s is a leading brand in the
$4 billion frozen pizza category in
the U.S. On any given day, we can
produce more than 1 million pizzas,
so we thought our manufacturing
process was already very efficient until
we asked the question “Does a pizza
have to be round?” By changing to a
rectangular shape, we’ve identified
significant costs savings while
maintaining the value and quality of
the product. The new rectangular
pizzas come in a plastic overwrap
instead of a paperboard carton. This
change reduces packaging costs
and waste and also allows us to put
more pizzas on a truck, reducing
transportation costs. In addition to
cost savings, we’re also decreasing
the environmental impact with
less packaging waste and reduced
emissions from fewer trucks on
the road.
2016 Annual Report 7

Our Business Portfolio is a Strategic Advantage
We’re focused on five global growth
categories — cereal, snacks, yogurt,
convenient meals and ice cream.
According to Euromonitor, retail sales
in these categories are projected to
grow at attractive rates because they
are on-trend with consumers’ food
interests. More than 75 percent of our
worldwide net sales are concentrated
in these five platforms, and we see
strong opportunities to leverage our
technical know-how to grow our
leading brands in these categories.
more successful product introductions. We’re also investing in
e-commerce capabilities to capture growth from this emerging
channel. And we’re adopting new tools such as net revenue
management to optimize our promotions, prices and mix of products
to drive sales growth.
Our employees are at the heart of our organization. Their skills and
commitment give me confidence we will achieve our performance
goals. We also are guided by an experienced and diverse board of
directors. I’d like to acknowledge the contributions of Mike Rose and
Paul Danos who are retiring from our board in September. They have
provided invaluable advice and counsel during their combined 39 years
of service to our company. I’d also like to recognize Dave Dudick,
Senior Vice President; President, Canada, who retired this summer
after a distinguished 36-year career with General Mills.
In closing, I want to thank you for your investment in General Mills.
Through our Consumer First strategy and our four key priorities, we
are committed to driving solid returns for you, our shareholders.
We appreciate your confidence in our plans for growth, and we look
forward to reporting on our continued strong performance for the
next 150 years.
Kendall J. Powell
Chairman and Chief Executive Officer
August 1, 2016
Fiscal 2016Net Sales by Platform
Cereal
Snacks
Yogurt
Convenient Meals
Super-premium Ice Cream
Dough
Baking Mixes and Ingredients
Vegetables
Other
* Non-GAAP measure. Includes $16.6 billion consolidated net sales plus $0.8 billion proportionate share of CPW (cereal) net sales plus $0.2 billion proportionate share of HDJ (ice cream) net sales.
20%
19%
16%
16%
5%
10%
10%
3% 1%
$17.6BILLION*
8 General Mills

Financial Summary 10
Selected Financial Data 12
Management’s Discussion and Analysis of FinancialCondition and Results of Operations 13
Non-GAAP Measures 31
Reports of Management and Independent RegisteredPublic Accounting Firm 41
Consolidated Financial Statements 43
Notes to Consolidated Financial Statements
1 Basis of Presentation and Reclassifications 47
2 Summary of Significant Accounting Policies 47
3 Acquisition and Divestitures 50
4 Restructuring, Impairment, and Other Exit Costs 51
5 Investments in Unconsolidated Joint Ventures 54
6 Goodwill and Other Intangible Assets 54
7 Financial Instruments, Risk Management Activities, and Fair Values 56
8 Debt 65
9 Redeemable and Noncontrolling Interests 66
10 Stockholders’ Equity 67
11 Stock Plans 69
12 Earnings per Share 71
13 Retirement Benefits and Postemployment Benefits 72
14 Income Taxes 78
15 Leases, Other Commitments, and Contingencies 80
16 Business Segment and Geographic Information 81
17 Supplemental Information 82
18 Quarterly Data 84
Glossary 85
Total Return to Stockholders 87
Contents
Financial Review
2016 Annual Report 9

2014
2015
2016
2013
2012
2,630
2,543
2,541
2,926
2,407
Margin Expansion Helps Fund Our Future
For the past several years, we have been increasing our productivity
and efficiency to offset input cost inflation and fuel our Consumer First
initiatives. While input cost inflation slowed to 2 percent in fiscal 2016
from an average of 4 to 5 percent over the previous five years, we still
expect costs to remain inflationary for the foreseeable future. Holistic
Margin Management (HMM) is our company-wide initiative to use
productivity savings, mix management and price realization to offset
input cost inflation, protect margins and generate funds to reinvest
in sales- generating activities. Due to HMM, we’ve been able to hold
our adjusted gross margin relatively steady over the past five years,
and we have a strong pipeline of additional HMM cost- savings
opportunities ahead.
Last year, we took additional actions to increase our efficiency and
generate cost savings. Projects Century, Catalyst and Compass were
implemented to streamline our global supply chain and restructure
our organization. We also implemented zero-based budgeting, which
drove further administrative cost savings. These initiatives combined
generated $350 million in total annual savings through fiscal 2016.
We expect them to deliver $600 million in total annual savings by 2018,
which is a $100 million increase over our previous target. In addition,
we are sharpening our focus in fiscal 2017 to accelerate our margin
expansion efforts, building on our success from fiscal 2016 when we
grew our adjusted operating profit margin by 90 basis points.* All told,
our goal is to achieve an adjusted operating profit margin of 20 percent
by fiscal 2018.
Generating Cash
Our businesses have a long history of strong cash generation. In fiscal
2016, our cash flow from operations totaled $2.6 billion, up 3 percent
from last year. Our free cash flow, which is operating cash flow less
capital expenditures, was $1.9 billion in fiscal 2016, a 4 percent increase
over the previous year. We have a goal of converting 95 percent of
our adjusted after-tax earnings to free cash on a long-term basis. Our
rolling three-year cumulative free cash flow has improved substantially,
and we exceeded our goal in the most recent three-year period with a
conversion rate of 102 percent.
Our continued discipline on core working capital, which is accounts
receivable plus inventories less accounts payable, has contributed to
our operating cash flow. In fiscal 2016, we reduced our core working
capital 41 percent versus last year’s fourth quarter, primarily due to
operational improvements across our business as well as the divestiture
of the Green Giant vegetable business in North America. We have
now posted year-over-year reductions in our core working capital for
13 consecutive quarters.
Financial Summary
Adjusted Operating Profit Margin*(percent of net sales)
Cash Flow From Operations(dollars in millions)
Free Cash Flow*(dollars in millions)
Core Working Capital(dollars in millions)
16.8%
15.9%
16.2%
16.3%
16.7%
1,900
1,830
1,878
2,312
1,731
729
1,244
1,432
1,569
1,654
10 General Mills

Uses of Cash
Our first priority for our cash is investment in growth opportunities and
cost- savings projects we’ve identified across our businesses. In fiscal
2016, fixed asset investments totaled $729 million, largely in line with
our long-term target of 4 percent of net sales. In fiscal 2017, we expect
capital expenditures to be comparable to 2016 levels as we continue
to fund Project Century and other projects to increase our efficiency.
After capital investment, we prioritize cash returns to shareholders
through dividends and share repurchases. Cash dividends to
shareholders totaled nearly $1.1 billion in fiscal 2016. Since fiscal
2012, our dividends per share have grown at a 10 percent compound
rate. In June 2016, our board of directors approved an increase to
our quarterly dividend rate, effective with the August 2016 payment.
The new annualized dividend rate of $1.92 per share represents an
8 percent increase over the annual dividend paid in fiscal 2016. And
this marks the eighth increase in our quarterly dividend rate since 2010.
General Mills and its predecessor firm have paid regular dividends for
117 years. Our goal is to continue increasing dividends over time, in line
with our earnings growth.
We also return cash to shareholders through share repurchases.
Net share repurchases in fiscal 2016 totaled $435 million. We reduced
average net shares outstanding by 1 percent, slightly below our long-
term share reduction target of 2 percent, as we had higher cash needs
for capital investment related to restructuring activities in fiscal 2016.
For fiscal 2017, we are targeting a net reduction of 1 to 2 percent in
average diluted shares outstanding. Our goal is to return 90 percent
of our free cash flow to shareholders through dividends and share
repurchases. Over the past several years, we have exceeded that goal
with more than 100 percent of free cash flow returned to shareholders
between fiscal 2014 and 2016.
Net income growth and disciplined uses of cash are the drivers of
increasing adjusted returns on average total capital (ROC). General
Mills adjusted ROC has declined in recent years, primarily due to the
acquisitions of Yoplait International, Yoki and Annie’s. In fiscal 2016, we
saw an increase in adjusted ROC over the previous year, due to earnings
growth and continued prudent capital management.
* See page 31 for a reconciliation of this and other non-GAAP measures used in this summary.
Fixed Asset Investment(percent of net sales)
Dividends Paid(dollars in millions)
Average Diluted Shares Outstanding(shares in millions)
Adjusted Return on Average Total Capital* (percent)
4.4%
4.0%
3.7%
3.4%
4.1%
1,072
1,018
983
868
800
612
619
646
666
667
11.3%
11.2%
11.6%
12.0%
12.7%
2016 Annual Report 11

Selected Financial Data
Th e following table sets forth selected fi nancial data for each of the fi scal years in the fi ve-year period ended May 29, 2016:
Fiscal Year In Millions, Except Per Share Data, Percentages and Ratios 2016 2015 (a) 2014 2013 2012
Operating data: Net sales $ 16,563.1 $ 17,630.3 $ 17,909.6 $ 17,774.1 $ 16,657.9Gross margin (b) 5,829.5 5,949.2 6,369.8 6,423.9 6,044.7Selling, general, and administrative expenses 3,118.9 3,328.0 3,474.3 3,552.3 3,380.7Operating profi t 2,707.4 2,077.3 2,957.4 2,851.8 2,562.4Total segment operating profi t (c) 2,999.5 3,035.0 3,153.9 3,222.9 3,011.6Divestitures (gain) (148.2) — (65.5) — —Net earnings attributable to General Mills 1,697.4 1,221.3 1,824.4 1,855.2 1,567.3Advertising and media expense 754.4 823.1 869.5 895.0 913.7Research and development expense 222.1 229.4 243.6 237.9 245.4Average shares outstanding: Diluted 611.9 618.8 645.7 665.6 666.7Earnings per share: Diluted $ 2.77 $ 1.97 $ 2.83 $ 2.79 $ 2.35 Diluted, excluding certain items aff ecting comparability (c) $ 2.92 $ 2.86 $ 2.82 $ 2.72 $ 2.56Operating ratios: Gross margin as a percentage of net sales 35.2% 33.7% 35.6% 36.1% 36.3%Selling, general, and administrative expenses as a percentage of net sales 18.8% 18.9% 19.4% 20.0% 20.3%Operating profi t as a percentage of net sales 16.3% 11.8% 16.5% 16.0% 15.4%Adjusted operating profi t as a percentage of net sales (b) (c) 16.8% 15.9% 16.2% 16.3% 16.7%Total segment operating profi t as a percentage of net sales (c) 18.1% 17.2% 17.6% 18.1% 18.1%Eff ective income tax rate 31.4% 33.3% 33.3% 29.2% 32.1%Return on average total capital (b) 12.9% 9.1% 12.5% 13.4% 12.8%Adjusted return on average total capital (b) (c) 11.3% 11.2% 11.6% 12.0% 12.7%Balance sheet data: Land, buildings, and equipment $ 3,743.6 $ 3,783.3 $ 3,941.9 $ 3,878.1 $ 3,652.7Total assets 21,712.3 21,832.0 23,044.7 22,505.7 21,014.8Long-term debt, excluding current portion 7,057.7 7,575.3 6,396.6 5,901.8 6,139.5Total debt (b) 8,430.9 9,191.5 8,758.9 7,944.8 7,407.2Cash fl ow data: Net cash provided by operating activities $ 2,629.8 $ 2,542.8 $ 2,541.0 $ 2,926.0 $ 2,407.2Capital expenditures 729.3 712.4 663.5 613.9 675.9Free cash fl ow (b) (c) 1,900.5 1,830.4 1,877.5 2,312.1 1,731.3Fixed charge coverage ratio (b) 7.40 5.54 8.04 7.62 6.26Operating cash fl ow to debt ratio (b) 31.2% 27.7% 29.0% 36.8% 32.5%Share data: Low stock price $ 54.12 $ 48.86 $ 46.86 $ 37.55 $ 34.95High stock price 65.36 57.14 54.40 50.93 41.05Closing stock price 62.87 56.15 53.81 48.98 39.08Cash dividends per common share 1.78 1.67 1.55 1.32 1.22Number of full- and part-time employees 39,000 42,000 43,000 41,000 34,500
(a) Fiscal 2015 was a 53-week year; all other fi scal years were 52 weeks.(b) See “Glossary” on page 85 of this report for defi nition. (c) See “Non-GAAP Measures” on page 31 of this report for our discussion of this measure not defi ned by generally accepted accounting principles.
12 General Mills

EXECUTIVE OVERVIEW
We are a global consumer foods company. We develop distinctive value-added food products and market them under unique brand names. We work continuously to improve our core products and to create new products that meet consumers’ evolving needs and preferences. In addition, we build the equity of our brands over time with strong consumer-directed marketing, innovative new products, and eff ective merchandising. We believe our brand-building strategy is the key to winning and sustaining leading share positions in markets around the globe.
Our fundamental fi nancial goal is to generate supe-rior returns for our shareholders over the long term. We believe that increases in net sales, segment oper-ating profi t, earnings per share (EPS), free cash fl ow conversion, cash return to shareholders, and return on average total capital are key drivers of fi nancial perfor-mance for our business.
Our long-term growth objectives are to consistently deliver:• low single-digit annual growth in net sales; • mid single-digit annual growth in total segment oper-
ating profi t; • high single-digit annual growth in diluted EPS exclud-
ing certain items aff ecting comparability;• improvement in adjusted return on average total
capital;• free cash fl ow conversion averaging above 95 percent
of adjusted net earnings aft er tax; and • cash return to shareholders averaging above 90 per-
cent of free cash fl ow, including an attractive divi-dend yield.We believe that this fi nancial performance should
result in long-term value creation for shareholders.Fiscal 2016 was an important step toward return-
ing to our long-term growth objectives. Our U.S. Retail segment improved its operating profi t performance in fi scal 2016, excluding the impact of acquisitions and divestitures, primarily the North American Green Giant business (Green Giant) divestiture and 6 incremen-tal months of results from the acquisition of Annie’s, Inc. (Annie’s). Net sales as reported declined 5 percent-age points in fi scal 2016, which included 2 percentage points of decline from the net impact of Green Giant and Annie’s and 1 percentage point of decline from a 53rd week in fi scal 2015. While net sales growth did not meet our expectations, operating profi t increased
1 percent, despite the 53rd week in fi scal 2015 and the net unfavorable impact of the Green Giant dives-titure and Annie’s acquisition. Operating profi t for the Convenience Stores and Foodservice segment increased 7 percent, driven primarily by our 6 priority prod-uct platforms. Operating results for the International segment had good growth in developed markets that was tempered by slowdowns in developing markets. International net sales as reported declined 10 percent, including 1 percentage point of decline from the dives-titure of Green Giant, our Venezuela business, and our foodservice business in Argentina, but grew 3 percent on a constant-currency basis. International segment operating profi t declined 15 percent and was impacted by 12 percentage points of unfavorable foreign currency exchange and slowing economic growth in China and Brazil, as well as the eff ect of divestitures.
Our consolidated net sales for fi scal 2016 declined 6 percent to $16.6 billion, primarily driven by unfavor-able foreign exchange, a 53rd week in fi scal 2015, and the net impact of acquisitions and divestitures. On a constant-currency basis, net sales decreased 2 percent. Operating profi t of $2.7 billion increased 30 percent. Total segment operating profi t of $3.0 billion declined 1 percent and grew 1 percent on a constant-currency basis. Diluted EPS increased 41 percent to $2.77 per share. Adjusted diluted EPS, which excludes certain items aff ecting comparability of results, rose 2 percent to $2.92 per share and increased 5 percent on a con-stant-currency basis. Our return on average total capital was 12.9 percent, and return on adjusted average total capital increased 10 basis points to 11.3 percent. (See the “Non-GAAP Measures” section below for discussion of total segment operating profi t, adjusted diluted EPS, constant-currency net sales growth rates, constant-cur-rency International segment net sales growth rate, con-stant-currency total segment operating profi t growth rate, constant-currency adjusted diluted EPS growth rate, and adjusted return on average total capital, which are not defi ned by generally accepted accounting prin-ciples (GAAP)).
Net cash provided by operations totaled $2.6 billion in fi scal 2016 at a conversion rate of 151 percent of net earnings, including earnings attributable to redeem-able and noncontrolling interests. Th is cash generation supported capital investments totaling $729 million, and our resulting free cash fl ow was $1.9 billion at a conversion rate of 104 percent of adjusted net earn-ings, including earnings attributable to redeemable and
Management’s Discussion and Analysis of Financial Condition and Results of Operations
2016 Annual Report 13
noncontrolling interests. We also returned signifi cant cash to shareholders through a 7 percent dividend increase and share repurchases totaling $607 mil-lion. Total cash returned to shareholders represented 79 percent of our free cash fl ow (see the “Non-GAAP Measures” section below for a description of our use of measures not defi ned by GAAP).
We recorded the following achievements related to our other key operating objectives for fi scal 2016:• We took steps to reshape our business portfolio to drive future growth with the divestiture of our North American Green Giant vegetable business and two smaller divestures, the Venezuela canned meat business and the foodservice dough business in Argentina. We also acquired EPIC Provisions LLC (Epic), broadening our product off erings in our U.S. natural and organic portfolio to include meat snacks, and we entered the growing Brazilian yogurt market through the acquisi-tion of Laticinios Carolina Ltda. (Carolina).• We generated strong levels of supply chain productiv-ity savings in fi scal 2016 through our ongoing Holistic Margin Management (HMM) eff orts. We also continued to execute our cost savings and organizational initiatives during the fi scal year. We expanded Project Century, an initiative to streamline our North American distribution and manufacturing network, to our International seg-ment supply chain. We also initiated Project Compass, with a focus on increasing the agility and eff ectiveness of our International segment. Finally, we continued to realize benefi ts from Project Catalyst, a fi scal 2015 restructuring plan to increase organizational eff ective-ness and reduce overhead expense. In aggregate, the ini-tiatives taken in fi scal 2015 and 2016 generated almost $350 million in cost savings during fi scal 2016.
A detailed review of our fi scal 2016 performance appears below in the section titled “Fiscal 2016 Consolidated Results of Operations.”
With strong savings in Fiscal 2016 and visibility to further savings over the next two years, we now expect our previously announced organizational restructur-ing and cost-reduction initiatives, including Projects Century, Catalyst, and Compass, as well as administra-tive cost reductions, to generate total annual savings of $600 million by fi scal 2018. We are also undertaking further eff orts to prioritize investments, reduce com-plexity, and streamline our operations to drive profi table sales growth. As a result, we are increasing and accel-erating our adjusted operating profi t margin expan-sion target. We expect to achieve an adjusted operating
profi t margin of 20 percent by fi scal 2018, an increase of 400 basis points over fi scal 2015 levels. Key drivers of margin expansion over the next two years will include: • Strong levels of HMM productivity gains;• Continuing savings from previously announced
cost-reduction initiatives;• Increased effi ciency and prioritization of commercial
investments, including trade and consumer spending;• Continuing focus on complexity reduction through
SKU optimization;• Further supply chain optimization; and• Continued expansion of zero-based budgeting across
the business.We will focus our fi scal 2017 and fi scal 2018 growth
investments on our brands and platforms with the strongest profi table growth potential, including:• In the U.S. Retail segment – Cereal, snack bars, the natural and organic portfolio, hot snacks, Mexican products, and yogurt; • Our International segment; • In the Convenience Stores and Foodservice segment – Cereal, yogurt, snacks, frozen meals, biscuits, and bak-ing mixes – the segment’s current Focus 6 platforms.
Net sales for these “growth” businesses, which com-prise 75 percent of total company net sales and a simi-lar proportion of operating profi t, are expected to grow at a low single-digit organic rate in fi scal 2017. In our “foundation” businesses, which comprise the remainder of the portfolio, we will only pursue selective growth investments and will focus on reducing SKU complex-ity, optimizing commercial investments, and prioritiz-ing profi table volume while making selective Consumer First investments. We expect organic net sales to decline mid single-digits for these businesses in fi scal 2017. With this focused approach, we expect:• Fiscal 2017 organic net sales growth ranging from fl at to down 2 percent compared to fi scal 2016, but deliver a 6 to 8 percent increase in constant-currency total seg-ment operating profi t.• Fiscal 2017 adjusted operating profit margin to increase by approximately 150 basis points; and• Constant-currency adjusted diluted EPS to grow 6 to 8 percent from the base of $2.92 earned in fi scal 2016.
Our fi scal 2017 plans call for continued strong cash returns to shareholders. Th e current annualized divi-dend rate of $1.92 per share is up 8 percent from the annual dividend paid in fi scal 2016. Share repurchases in fi scal 2017 are expected to result in a net reduction
14 General Mills

in average diluted shares outstanding of approximately 1 to 2 percent.
Th e foregoing non-GAAP forward-looking fi nancial measures are not reconcilable to the equivalent GAAP measure because we cannot accurately predict the excluded variables that may impact these measures.
Certain terms used throughout this report are defi ned in a glossary on page 85 of this report.
FISCAL 2016 CONSOLIDATED RESULTS OF OPERATIONS
Fiscal 2016 had 52 weeks compared to 53 weeks in fi s-cal 2015. Included in fi scal 2016 is an additional month of results from Annie’s and Yoplait SAS (please refer to Note 1 to the Consolidated Financial Statements on page 47 of this report).
Fiscal 2016 net sales declined 6 percent to $16,563 million and decreased 2 percent on a constant-currency basis. Operating profi t of $2,707 million was 30 percent higher than fi scal 2015. Total segment operating profi t was $3,000 million, 1 percent lower than fi scal 2015 and 1 percent higher on a constant-currency basis. In fi scal 2016, net earnings attributable to General Mills were $1,697 million, up 39 percent from $1,221 million in fi s-cal 2015, and we reported diluted EPS of $2.77 in fi s-cal 2016, up 41 percent from $1.97 in fi scal 2015. Fiscal 2016 results include restructuring-related charges, a net gain from divestitures, and gains from the mark-to-market valuation of certain commodity positions and grain inventories. Fiscal 2015 results include restructur-ing-related charges, an indefi nite-lived intangible asset impairment charge, tax impacts from the repatriation of historical foreign earnings, losses from the mark-to-market valuation of certain commodity positions and grain inventories, integration costs resulting from the acquisition of Annie’s, and the impact of Venezuela cur-rency devaluation. Diluted EPS excluding these items aff ecting comparability totaled $2.92 in fi scal 2016, up 2 percent from $2.86 in fi scal 2015. Diluted EPS excluding certain items aff ecting comparability on a constant-cur-rency basis increased 5 percent compared to fiscal 2015 (see the “Non-GAAP Measures” section below for a description of our use of measures not defi ned by GAAP).
Net sales declined 6 percent to $16,563 million in fi s-cal 2016 from $17,630 in fi scal 2015. Th e components of net sales growth are shown in the following table:
Fiscal 2016 vs. 2015
Contributions from volume growth (a) (3) ptsNet price realization and mix 1 ptForeign currency exchange (4) ptsNet sales growth (6) pts
(a) Measured in tons based on the stated weight of our product shipments.
Net sales growth for fi scal 2016 included a 1 percent decrease from acquisitions and divestitures, primar-ily Green Giant and Annie’s, refl ecting 2 percentage points of decline from volume (please refer to Note 3 to the Consolidated Financial Statements on page 50 of this report). Th e 53rd week in fi scal 2015 contributed approximately 1 percentage point of net sales decline in fi scal 2016, refl ecting 1 percentage point of decline from volume.
Cost of sales decreased $948 million in fi scal 2016 to $10,734 million. In fi scal 2016, product mix drove a $486 million decrease in cost of sales and lower volume drove a $369 million decrease. We recorded a $63 million net decrease in cost of sales related to mark-to-market valu-ation of certain commodity positions and grain invento-ries as described in Note 7 to the Consolidated Financial Statements on page 56 of this report, compared to a net increase of $90 million in fi scal 2015. In fi scal 2016, we recorded $78 million of restructuring charges in cost of sales compared to $60 million in fi scal 2015. We also recorded a $3 million foreign exchange loss in cost of sales in fi scal 2015 related to Venezuela currency devaluation.
We also expect to incur approximately $109 million of restructuring initiative project-related cash costs and recorded $58 million of these costs in cost of sales in fi scal 2016 compared to $13 million in fi scal 2015 (please refer to Note 4 to the Consolidated Financial Statements on page 51 of this report).
Gross margin declined 2 percent in fi scal 2016 versus fi scal 2015. Gross margin as a percent of net sales of 35 percent increased 150 basis points compared to fi scal 2015.
Selling, general and administrative (SG&A) expenses decreased $209 million in fi scal 2016 versus fi scal 2015 primarily due to an 8 percent decrease in advertising and media expense, and savings from Project Catalyst, Project Compass, and our other cost-management initiatives (please refer to Note 4 to the Consolidated Financial Statements on page 51 of this report). In fi s-cal 2015, we recorded a $5 million charge in SG&A
2016 Annual Report 15

Interest, net for fi scal 2016 totaled $304 million, $12 million lower than fi scal 2015, primarily driven by lower average debt balances, partially off set by changes in the mix of debt.
Our consolidated eff ective tax rate for fi scal 2016 was 31.4 percent compared to 33.3 percent in fi scal 2015. Th e 1.9 percentage point decrease was primarily due to the unfavorable impact of our repatriation of historical for-eign earnings in fi scal 2015, partially off set by non-de-ductible expenses related to the Green Giant divestiture in fi scal 2016. Our eff ective tax rate excluding certain items aff ecting comparability was 29.8 percent in fi scal 2016 compared to 30.5 percent in fi scal 2015 (see the “Non-GAAP Measures” section below for a description of our use of measures not defi ned by GAAP).
After-tax earnings from joint ventures for fiscal 2016 increased to $88 million compared to $84 million in fi scal 2015 primarily driven by favorable input costs
in fi scal 2016, favorable product mix for Häagen-Dazs Japan, Inc. (HDJ), and lapping an impairment charge of $3 million at Cereal Partners Worldwide (CPW) in South Africa in fi scal 2015, partially off set by unfavor-able foreign currency. On a constant-currency basis, aft er-tax earnings from joint ventures increased 12 per-cent (see the “Non-GAAP Measures” section below for a description of our use of this measure not defi ned by GAAP). Th e change in net sales for each joint venture is set forth in the following table:
As Reported Constant-Currency Basis Fiscal 2016 Fiscal 2016 vs. 2015 vs. 2015
CPW (12)% FlatHDJ Flat 5Joint Ventures (10)% 1%
expenses related to Venezuela currency devaluation and $16 million of integration costs related to our acquisi-tion of Annie’s. SG&A expenses as a percent of net sales decreased 10 basis points compared to fi scal 2015.
During fi scal 2016, we recorded an $148 million dives-titures gain (net) from the sale of Green Giant, our sub-sidiary in Venezuela, and our foodservice business in Argentina (please refer to Note 3 of the Consolidated Financial Statements on page 50 of this report).
Restructuring, impairment, and other exit costs totaled $151 million in fi scal 2016 compared to $544 mil-lion in fi scal 2015.
In fi scal 2015, we made a strategic decision to redirect certain resources supporting our Green Giant business in our U.S. Retail segment to other businesses within the segment. As a result, we recorded a $260 million impairment charge in fi scal 2015 related to the Green Giant brand intangible asset.
Restructuring charges recorded in restructuring, impairment, and other exit costs were $151 million in fi scal 2016 compared to $284 million in fi scal 2015. Total charges associated with our restructuring initia-tives recognized in fi scal 2016 and 2015 consisted of the following:
As Reported EstimatedIn Millions Fiscal 2016 Fiscal 2015 Future Total Charge Cash Charge Cash Charge Cash Charge Cash Savings(b)
Compass $ 54.7 $ 36.1 $ — $ — $ 5 $ 24 $ 60 $ 60Total Century (a) 182.6 34.1 181.8 12.0 75 120 439 166Catalyst (7.5) 47.8 148.4 45.0 — 25 141 118Combination of certain operational facilities — 4.5 13.9 6.5 1 2 15 12Other — 0.1 (0.6) 0.1 — — — —Total restructuring charges (a) 229.8 122.6 343.5 63.6 81 171 655 356Project-related costs 57.5 54.5 13.2 9.7 38 45 109 109Restructuring charges and project-related costs $ 287.3 $ 177.1 $ 356.7 $ 73.3 $ 119 $ 216 $ 764 $ 465Future cumulative annual savings $ 600
(a) Includes restructuring charges recorded in cost of sales of $78.4 million in fi scal 2016 and $59.6 million in fi scal 2015.
(b) Cumulative annual savings estimated by fi scal 2018. Includes savings from SG&A cost reduction projects.
Please refer to Note 4 to the Consolidated Financial Statements on page 51 of this report for more information regarding our restructuring activities.
16 General Mills

The components of our joint ventures’ net sales growth are shown in the following table:
Fiscal 2016 vs. Fiscal 2015 CPW HDJ
Contributions from volume growth (a) Flat 11 ptsNet price realization and mix Flat (6) ptsForeign currency exchange (12) pts (5) ptsNet sales growth (12) pts Flat
(a) Measured in tons based on the stated weight of our product shipments.
Average diluted shares outstanding decreased by 7 million in fi scal 2016 from fi scal 2015 due to share repurchases, partially off set by option exercises.
FISCAL 2015 CONSOLIDATED RESULTS OF OPERATIONS
Fiscal 2015 had 53 weeks compared to 52 weeks in fi scal 2014.
Fiscal 2015 net sales declined 2 percent to $17,630 million and increased 1 percent on a constant-currency basis. Operating profi t of $2,077 million was 30 percent lower than fi scal 2014. Total segment operating profi t was $3,035 million, 4 percent lower than fi scal 2014 and 2 percent lower on a constant-currency basis. In fi scal 2015, net earnings attributable to General Mills were $1,221 million, down 33 percent from $1,824 mil-lion in fi scal 2014, and we reported diluted EPS of $1.97 in fi scal 2015, down 30 percent from $2.83 in fi scal 2014. Fiscal 2015 results include restructuring-related charges, an indefi nite-lived intangible asset impairment charge, tax impacts from the repatriation of historical foreign earnings, losses from the mark-to-market valu-ation of certain commodity positions and grain invento-ries, integration costs resulting from the acquisition of Annie’s, and the impact of Venezuela currency devalua-tion. Fiscal 2014 results include the impact of Venezuela currency devaluation, a gain on the divestiture of cer-tain grain elevators, losses from the mark-to-market valuation of certain commodity positions and grain inventories, and restructuring charges related to our fi s-cal 2012 productivity and cost savings plan. Diluted EPS excluding these items aff ecting comparability totaled $2.86 in fi scal 2015, up 1 percent from $2.82 in fi scal 2014 (see the “Non-GAAP Measures” section below for a description of our use of these measures not defi ned by GAAP).
Net sales declined 2 percent to $17,630 million in fi s-cal 2015 from $17,910 in fi scal 2014. Th e components of net sales growth are shown in the following table:
Fiscal 2015 vs. 2014
Contributions from volume growth (a) (1) ptNet price realization and mix 2 ptsForeign currency exchange (3) ptsNet sales growth (2) pts
(a) Measured in tons based on the stated weight of our product shipments.
Th e 53rd week in fi scal 2015 contributed approxi-mately 1 percentage point of net sales growth, refl ecting 1 percentage point of growth from volume.
Cost of sales increased $141 million in fi scal 2015 to $11,681 million. In fi scal 2015, we recorded a $90 mil-lion net increase in cost of sales related to mark-to-market valuation of certain commodity positions and grain inventories, compared to a net decrease of $49 million in fi scal 2014. In fi scal 2015, we recorded $60 million of restructuring charges in cost of sales. Product mix drove a $17 million increase in cost of sales. We also recorded a $3 million foreign exchange loss in fi s-cal 2015 related to Venezuela currency devaluation com-pared to a $23 million loss in fi scal 2014. Lower volume drove a $68 million decrease in cost of sales in fi scal 2015. We recorded $13 million of restructuring initiative project-related cash costs in cost of sales in fi scal 2015.
Gross margin declined 7 percent in fi scal 2015 versus fi scal 2014. Gross margin as a percent of net sales of 34 percent decreased 190 basis points compared to fi scal 2014.
SG&A expenses decreased $146 million in fi scal 2015 versus fi scal 2014 primarily due to a 5 percent decrease in advertising and media expense, and savings from Project Catalyst and our other cost management initia-tives. In fi scal 2015, we recorded a $5 million charge in SG&A expenses related to Venezuela currency devalua-tion compared to a $39 million charge in fi scal 2014. In addition, we recorded $16 million of integration costs in SG&A expenses in fi scal 2015 related to our acquisition of Annie’s. SG&A expenses as a percent of net sales decreased 50 basis points compared to fi scal 2014.
Th ere were no divestitures in fi scal 2015. During fi s-cal 2014, we recorded a divestiture gain of $66 million related to the sale of certain grain elevators in our U.S. Retail segment.
2016 Annual Report 17

Restructuring, impairment, and other exit costs totaled $544 million in fi scal 2015 compared to $4 mil-lion in fi scal 2014.
In fi scal 2015, we made a strategic decision to redirect certain resources supporting our Green Giant business in our U.S. Retail segment to other businesses within the segment. As a result, we recorded a $260 million impairment charge in fi scal 2015 related to the Green Giant brand intangible asset.
Restructuring charges recorded in restructuring, impairment, and other exit costs were $284 million in fi scal 2015 compared to $4 million in fi scal 2014. Total charges associated with our restructuring initiatives recognized in fi scal 2015 and 2014 consisted of the following: As Reported Fiscal 2015 Fiscal 2014
In Millions Charge Cash Charge Cash
Total Century (a) $181.8 $12.0 $ — $ —Catalyst 148.4 45.0 — —International 13.9 6.5 1.0 6.0Other (0.6) 0.1 2.6 16.4Total restructuring charges (a) 343.5 63.6 3.6 22.4Project-related costs recorded in costs of sales 13.2 9.7 — —Restructuring charges and project-related costs $356.7 $73.3 $3.6 $22.4
(a) Includes $59.6 million of restructuring charges recorded in cost of sales during fi scal 2015.
Please refer to Note 4 to the Consolidated Financial Statements on page 51 of this report for more informa-tion regarding our restructuring activities.
Interest, net for fi scal 2015 totaled $315 million, $13 million higher than fi scal 2014, primarily driven by higher average debt balances, partially off set by changes in the mix of debt.
Our consolidated eff ective tax rate for fi scal 2015 of 33.3 percent was consistent with fi scal 2014. Th e 4.5 percentage point impact resulting from the repatriation
of $606 million of historical foreign earnings in fi scal 2015 was off set by changes in earnings mix by country, certain favorable discrete items, and favorable state tax rate changes. Our eff ective tax rate excluding certain items aff ecting comparability was 30.5 percent in fi scal 2015 compared to 32.2 percent in fi scal 2014 (see the “Non-GAAP Measures” section below for a description of our use of measures not defi ned by GAAP).
After-tax earnings from joint ventures for fiscal 2015 decreased to $84 million compared to $90 million in fi scal 2014 primarily driven by unfavorable foreign currency exchange and an asset impairment charge of $3 million at CPW in South Africa. On a constant-cur-rency basis, aft er-tax earnings from joint ventures were fl at (see the “Non-GAAP Measures” section below for a description of our use of this measure not defi ned by GAAP). Th e change in net sales for each joint venture is set forth in the following table:
As Reported Constant Currency Basis Fiscal 2015 Fiscal 2015 vs. 2014 vs. 2014
CPW (10)% (2)%HDJ (4) 6Joint Ventures (9)% (1)%
The components of our joint ventures’ net sales growth are shown in the following table:
Fiscal 2015 vs. Fiscal 2014 CPW HDJ
Contributions from volume growth (a) (1) pt (5) ptsNet price realization and mix (1) pt 11 ptsForeign currency exchange (8) pts (10) ptsNet sales growth (10) pts (4) pts
(a) Measured in tons based on the stated weight of our product shipments.
Average diluted shares outstanding decreased by 27 million in fi scal 2015 from fi scal 2014 due to share repurchases.
18 General Mills
RESULTS OF SEGMENT OPERATIONS
Our businesses are organized into three operating segments: U.S. Retail; International; and Convenience Stores and Foodservice.
In fi scal 2015, we changed how we assess segment operating performance to exclude the asset and liability
remeasurement impact from hyperinfl ationary econo-mies. Th is impact is now included in unallocated corpo-rate items. All periods presented have been changed to conform to this presentation.
Segment operating profi t excludes unallocated cor-porate items, net gain on divestitures, and restructur-ing, impairment, and other exit costs because these items aff ecting operating profi t are centrally managed at the corporate level and are excluded from the mea-sure of segment profi tability reviewed by our executive management.
U.S. Retail Segment In fi scal 2015, we realigned cer-tain operating units within our U.S. Retail operating segment. We also changed the name of our Yoplait operating unit to Yogurt and our Big G operating unit to Cereal. Frozen Foods transitioned into Meals and Baking Products. Small Planet Foods transitioned into Snacks, Cereal, and Meals. Th e Yogurt operating unit was unchanged. We revised the amounts previously reported in the net sales and net sales percentage change by operating unit within our U.S. Retail segment to conform to the new operating unit structure. Th ese realignments had no eff ect on previously reported con-solidated net sales, operating segments’ net sales, oper-ating profi t, segment operating profi t, net earnings
attributable to General Mills, or EPS. In addition, results from the acquired Annie’s business are included in the Meals and Snacks operating units.
Our U.S. Retail segment refl ects business with a wide variety of grocery stores, mass merchandisers, mem-bership stores, natural food chains, drug, dollar and discount chains, and e-commerce grocery providers operating throughout the United States. Our product categories in this business segment are ready-to-eat cereals, refrigerated yogurt, soup, meal kits, refrigerated and frozen dough products, dessert and baking mixes, frozen pizza and pizza snacks, grain, fruit and savory snacks, and a wide variety of organic products includ-ing meal kits, granola bars, and cereal.
Th e following tables provide the dollar amount and percentage of net sales and operating profi t from each seg-ment for fi scal years 2016, 2015, and 2014: Fiscal Year 2016 2015 2014
Percent Percent PercentIn Millions Dollars of Total Dollars of Total Dollars of Total
Net Sales U.S. Retail $10,007.1 60% $10,507.0 60% $10,604.9 59%International 4,632.2 28 5,128.2 29 5,385.9 30Convenience Stores and Foodservice 1,923.8 12 1,995.1 11 1,918.8 11Total $16,563.1 100% $17,630.3 100% $17,909.6 100%
Segment Operating Profi tU.S. Retail $2,179.0 72% $2,159.3 71% $2,311.5 73%International 441.6 15 522.6 17 535.1 17Convenience Stores and Foodservice 378.9 13 353.1 12 307.3 10Total $2,999.5 100% $3,035.0 100% $3,153.9 100%
2016 Annual Report 19

Th e net impact of acquisitions and divestitures, pri-marily Green Giant and Annie’s, decreased net sales growth by 2 percentage points in fi scal 2016, refl ecting 3 percentage points of decline from volume. Th e 53rd week in fi scal 2015 contributed approximately 1 per-centage point of net sales decline in fi scal 2016, refl ect-ing 2 percentage points of decline from volume. In fi scal 2015, the acquisition of Annie’s added 1 percentage point of net sales growth, refl ecting 1 percentage point of growth from volume. Th e 53rd week contributed approximately 1 percentage point of net sales growth in fi scal 2015, refl ecting 1 percentage point of growth from volume.
Net sales for our U.S. retail operating units are shown in the following table:
Fiscal YearIn Millions 2016 2015 2014
Meals (a) $ 2,393.9 $ 2,674.3 $ 2,772.4Cereal 2,312.8 2,330.1 2,410.2Snacks (a) 2,094.3 2,134.4 1,997.8Baking Products 1,903.4 1,969.8 2,096.1Yogurt and other 1,302.7 1,398.4 1,328.4Total $ 10,007.1 $ 10,507.0 $ 10,604.9
(a) Fiscal 2016 net sales for the Meals and Snacks operating units include an additional month of results from Annie’s.
U.S. Retail net sales percentage change by operating unit are shown in the following table:
Fiscal 2016 Fiscal 2015 vs. 2015 vs. 2014
Meals (a) (10)% (4)%Yogurt (7) 5Baking Products (3) (6) Snacks (a) (2) 7 Cereal (1) (3)Total (5)% (1)%
(a) Th e impact due to an additional month of results from Annie’s was not material to the Meals and Snacks operating units. Th e impact to fi scal 2016 net sales growth for the U.S. Retail segment was not material.
Segment operating profi t of $2,179 million in fi scal 2016 increased $20 million, or 1 percent, from fi scal 2015. Th e increase was primarily driven by high levels of promotional expense in fi scal 2015, cost savings from Project Catalyst and other cost management initiatives, a decrease in media and advertising expenses, and lower supply chain costs, partially off set by the net impact of the Green Giant divestiture and Annie’s acquisition.
Segment operating profi t of $2,159 million in fi scal 2015 declined $152 million, or 7 percent, from fi scal 2014. Th e decrease was primarily driven by lower vol-ume and an increase in supply chain costs, partially off -set by a 6 percent reduction in media and advertising expenses.
International Segment Our International segment con-sists of retail and foodservice businesses outside of the United States. Our product categories include ready-to-eat cereals, shelf stable and frozen vegetables, meal kits, refrigerated and frozen dough products, dessert and baking mixes, frozen pizza snacks, refrigerated yogurt, grain and fruit snacks, and super-premium ice cream and frozen desserts. We also sell super-pre-mium ice cream and frozen desserts directly to con-sumers through owned retail shops. Our International segment also includes products manufactured in the United States for export, mainly to Caribbean and Latin American markets, as well as products we manufacture for sale to our international joint ventures. Revenues from export activities and franchise fees are reported in the region or country where the end customer is located.
U.S. Retail net sales were as follows: Fiscal Fiscal Fiscal 2016 vs. 2015 Fiscal 2015 vs. 2014 Fiscal 2016 Percentage Change 2015 Percentage Change 2014
Net sales (in millions) $10,007.1 (5)% $10,507.0 (1)% $10,604.9Contributions from volume growth (a) (7) pts (1) ptNet price realization and mix 2 pts Flat
(a) Measured in tons based on the stated weight of our product shipments.
20 General Mills
Th e impact of acquisition and divestitures, primarily Green Giant, decreased net sales growth by 1 percent-age point in fi scal 2016. Th e 53rd week in fi scal 2015 contributed approximately 1 percentage point of net sales decline in fi scal 2016, refl ecting 1 percentage point of decline from volume. Th e 53rd week contributed approximately 1 percentage point of net sales growth in fi scal 2015, refl ecting 1 percentage point of growth from volume.
Net sales for our International segment by geographic region are shown in the following table:
Fiscal YearIn Millions 2016 2015 2014
Europe (a) $1,998.0 $2,126.5 $2,188.8Canada 929.5 1,105.1 1,195.3Asia/Pacifi c 995.7 1,023.5 981.8Latin America 709.0 873.1 1,020.0Total $4,632.2 $5,128.2 $5,385.9
(a) Fiscal 2016 net sales for the Europe region include an additional month of results from Yoplait SAS.
International percentage change in net sales by geo-graphic region are shown in the following table:
Percentage Change in Percentage Change in Net Sales on Constant Net Sales as Reported Currency Basis (a)
Fiscal 2016 Fiscal 2015 Fiscal 2016 Fiscal 2015 vs. 2015 vs. 2014 vs. 2015 vs. 2014
Europe (b) (6)% (3)% 3% 5%Canada (16) (8) (4) FlatAsia/Pacifi c (3) 4 1 5Latin America (19) (14) 12 17Total (10)% (5)% 3% 6%
(a) See the “Non-GAAP Measures” section below for our use of this measure.
(b) Fiscal 2016 percentage change in net sales as reported for the Europe region includes 3 percentage points of growth due to an additional month of results from Yoplait SAS. Th e impact to fi scal 2016 net sales growth for the International segment was not material.
Segment operating profit for fiscal 2016 declined 15 percent to $442 million from $523 million in fi s-cal 2015, primarily driven by unfavorable foreign cur-rency exchange, an increase in SG&A expenses, and the impact of the Green Giant divestiture. International segment operating profi t decreased 3 percent on a con-stant-currency basis in fi scal 2016 compared to fi scal 2015 (see the “Non-GAAP Measures” section below for our use of this measure).
Segment operating profit for fiscal 2015 declined 2 percent to $523 million from $535 million in fi scal 2014, primarily driven by unfavorable foreign currency exchange and higher input costs, partially off set by favorable net price realization and mix. International segment operating profi t increased 9 percent on a con-stant-currency basis in fi scal 2015 compared to fi scal 2014 (see the “Non-GAAP Measures” section below for our use of this measure).
Convenience Stores and Foodservice Segment In our Convenience Stores and Foodservice segment our major product categories are ready-to-eat cereals, snacks, refrigerated yogurt, frozen meals, unbaked and fully baked frozen dough products, and baking mixes. Many products we sell are branded to the consumer and nearly all are branded to our customers. We sell to distributors and operators in many customer channels including foodservice, convenience stores, vending, and supermarket bakeries. Substantially all of this segment’s operations are located in the United States.
International net sales were as follows: Fiscal Fiscal Fiscal 2016 vs. 2015 Fiscal 2015 vs. 2014 Fiscal 2016 Percentage Change 2015 Percentage Change 2014
Net sales (in millions) $4,632.2 (10)% $5,128.2 (5)% $5,385.9Contributions from volume growth (a) 3 pts FlatNet price realization and mix Flat 6 ptsForeign currency exchange (13) pts (11) pts
(a) Measured in tons based on the stated weight of our product shipments.
2016 Annual Report 21

Th e 53rd week in fi scal 2015 contributed approx-imately 2 percentage points of net sales decline in fi scal 2016, refl ecting 2 percentage points of decline from volume. In fi scal 2015, the 53rd week contributed approximately 2 percentage points of net sales growth, refl ecting 2 percentage points of growth from volume.
In fi scal 2016, segment operating profi t was $379 million, up 7 percent from $353 million in fi scal 2015 primarily driven by favorable product mix and cost sav-ings from Project Catalyst and other cost management initiatives. In fi scal 2015, segment operating profi t was up 15 percent from $307 million in fi scal 2014 primarily driven by favorable net price realization and mix and higher volume.
Unallocated Corporate Items Unallocated corporate items include corporate overhead expenses, variances to planned domestic employee benefi ts and incentives, contributions to the General Mills Foundation, asset and liability remeasurement impact of hyperinfl ationary economies, restructuring initiative project-related costs, and other items that are not part of our measurement of segment operating performance. Th is includes gains and losses from the mark-to-market valuation of certain commodity positions until passed back to our operating segments in accordance with our policy as discussed in Note 7 to the Consolidated Financial Statements on page 56 of this report.
For fi scal 2016, unallocated corporate expense totaled $289 million compared to $414 million last year. In fi scal 2016, we recorded a $63 million net decrease in expense related to mark-to-market valuation of certain commodity positions and grain inventories compared to a $90 million net increase in expense in the prior year. In addition, we recorded $78 million of restructuring charges, and $58 million of restructuring initiative proj-ect-related costs in cost of sales in fi scal 2016, compared to $60 million of restructuring charges and $13 million of restructuring initiative project-related costs in cost of
sales in fi scal 2015. We recorded an $8 million foreign exchange loss related to the remeasurement of assets and liabilities of our Venezuelan subsidiary in fi scal 2015. We also recorded $16 million of integration costs resulting from the acquisition of Annie’s in fi scal 2015. Th e decrease in unallocated corporate expense also refl ects cost savings from Project Catalyst and other cost management initiatives.
For fi scal 2015, unallocated corporate expense totaled $414 million compared to $258 million in fi scal 2014. In fi scal 2015, we recorded a $90 million net increase in expense related to mark-to-market valuation of certain commodity positions and grain inventories compared to a $49 million net decrease in fi scal 2014. In addition, we recorded $60 million of restructuring charges and $13 million of restructuring initiative project-related costs in cost of sales in fi scal 2015. In fi scal 2015, we recorded an $8 million foreign exchange loss related to the remea-surement of assets and liabilities of our Venezuelan sub-sidiary compared to $62 million in fi scal 2014. We also recorded $16 million of integration costs resulting from the acquisition of Annie’s in fi scal 2015.
Venezuela is a highly infl ationary economy and as such, we remeasured the value of the assets and liabil-ities of our former Venezuelan subsidiary based on the exchange rate at which we expected to remit dividends in U.S. dollars from the SIMADI market. In fi scal 2015, we recorded an $8 million foreign currency exchange loss related to remeasurement. In fi scal 2016, we sold our General Mills de Venezuela CA subsidiary to a third party and exited our business in Venezuela. As a result of this transaction, we recorded a loss on the sale of $38 million pre-tax.
In fi scal 2015, we changed how we assess segment operating performance to exclude the asset and liability remeasurement impact from hyperinfl ationary econo-mies. Th is impact is now included in unallocated corpo-rate items. All periods presented have been changed to conform to this presentation.
Convenience Stores and Foodservice net sales were as follows:
Fiscal Fiscal Fiscal 2016 vs. 2015 Fiscal 2015 vs. 2014 Fiscal 2016 Percentage Change 2015 Percentage Change 2014
Net sales (in millions) $1,923.8 (4)% $1,995.1 4% $1,918.8Contributions from volume growth (a) (3) pts 1 pt Net price realization and mix (1) pt 3 ptsForeign currency exchange NM NM
(a) Measured in tons based on the stated weight of our product shipments.
22 General Mills

IMPACT OF INFLATION
Our gross margin performance in fi scal 2016 refl ects the impact of 2 percent input cost infl ation, primarily on commodity inputs. We expect input cost infl ation of 2 percent in fi scal 2017. We attempt to minimize the eff ects of infl ation through HMM, planning, and oper-ating practices. Our risk management practices are dis-cussed on page 40 of this report.
LIQUIDITY
Th e primary source of our liquidity is cash fl ow from operations. Over the most recent three-year period, our operations have generated $7.7 billion in cash. A sub-stantial portion of this operating cash fl ow has been returned to shareholders through share repurchases and dividends. We also use cash from operations to fund our capital expenditures and acquisitions. We typically use a combination of cash, notes payable, and long-term debt to fi nance signifi cant acquisitions and major capital expansions.
As of May 29, 2016, we had $645 million of cash and cash equivalents held in foreign jurisdictions, which will be used to fund foreign operations and acquisitions. Th ere is currently no need to repatriate these funds in order to meet domestic funding obligations or sched-uled cash distributions. If we choose to repatriate his-torical earnings held in foreign jurisdictions, we intend to do so only in a tax-neutral manner.
Cash Flows from Operations
Fiscal YearIn Millions 2016 2015 2014
Net earnings, including earnings attributable to redeemable and noncontrolling interests $1,736.8 $1,259.4 $1,861.3Depreciation and amortization 608.1 588.3 585.4Aft er-tax earnings from joint ventures (88.4) (84.3) (89.6)Distributions of earnings from joint ventures 75.1 72.6 90.5Stock-based compensation 89.8 106.4 108.5Deferred income taxes 120.6 25.3 172.5Tax benefi t on exercised options (94.1) (74.6) (69.3)Pension and other postretirement benefi t plan contributions (47.8) (49.5) (49.7)Pension and other postretirement benefi t plan costs 118.1 91.3 124.1Divestitures (gain) (148.2) — (65.5)Restructuring, impairment, and other exit costs 107.2 531.1 (18.8)Changes in current assets and liabilities, excluding the eff ects of acquisitions and divestitures 258.2 214.7 (32.2)Other, net (105.6) (137.9) (76.2)Net cash provided by operating activities $2,629.8 $2,542.8 $2,541.0
In fi scal 2016, our operations generated $2.6 billion of cash compared to $2.5 billion in fi scal 2015. Th e $477 million increase in net earnings included a $96 million change in deferred income taxes and a $148 million net gain on divestitures and was also off set by a $424 million decrease in non-cash restructuring charges. Th e $43 million change in current assets and liabilities was primarily driven by the timing of accounts payable including the impact of longer terms off set by the tim-ing of inventory build.
We strive to grow core working capital at or below the rate of growth in our net sales. For fi scal 2016, core working capital decreased 41 percent, primarily due to an increase in accounts payable, largely driven by lon-ger payables terms and a decrease in inventory, com-pared to a net sales decline of 6 percent. In fi scal 2015, core working capital decreased 13 percent, compared to a net sales decline of 2 percent, and in fi scal 2014, core
2016 Annual Report 23
working capital decreased 9 percent, compared to net sales growth of 1 percent.
In fi scal 2015, our operations generated $2.5 billion of cash, fl at compared to fi scal 2014. Th e $247 million change in current assets and liabilities was primarily driven by the timing of trade and promotion accruals, changes in tax accruals, and changes in derivative posi-tions. Th is was largely off set by lower net earnings, which included a $260 million non-cash impairment charge, $271 million of non-cash restructuring charges, and a $147 million change in net deferred income taxes.
Cash Flows from Investing Activities
Fiscal YearIn Millions 2016 2015 2014
Purchases of land, buildings, and equipment $ (729.3) $ (712.4) $ (663.5)Acquisitions, net of cash acquired (84.0) (822.3) —Investments in affi liates, net 63.9 (102.4) (54.9)Proceeds from disposal of land, buildings, and equipment 4.4 11.0 6.6Proceeds from divestitures 828.5 — 121.6Exchangeable note 21.1 27.9 29.3Other, net (11.2) (4.0) (0.9)Net cash provided (used) by investing activities $ 93.4 $ (1,602.2) $ (561.8)
In fiscal 2016, we generated $93 million of cash through investing activities compared to a use of $1.6 billion in fi scal 2015. We invested $729 million in land, buildings, and equipment in fi scal 2016, $17 million more than last year. In fi scal 2016, we received proceeds of $828 million from the divestitures of certain busi-nesses, primarily Green Giant. In fi scal 2015, we acquired Annie’s for an aggregate purchase price of $809 million, net of $12 million of cash acquired.
In fiscal 2015, cash used by investing activities increased by $1.0 billion from fi scal 2014. We invested $712 million in land, buildings, and equipment in fi s-cal 2015, $49 million more than in fi scal 2014. In fi s-cal 2015, we acquired Annie’s. We made $102 million of investments in affi liates, primarily CPW, in fi scal 2015. In fi scal 2014, we sold certain grain elevators for $124 million in cash.
We expect capital expenditures to be approximately $734 million in fi scal 2017. Th ese expenditures will fund initiatives that are expected to fuel International
growth, support innovative products, and continue HMM initiatives throughout the supply chain.
Cash Flows from Financing Activities
Fiscal YearIn Millions 2016 2015 2014
Change in notes payable $ (323.8) $ (509.8) $ 572.9Issuance of long-term debt 542.5 2,253.2 1,673.0Payment of long-term debt (1,000.4) (1,145.8) (1,444.8)Proceeds from common stock issued on exercised options 171.9 163.7 108.1Tax benefi t on exercised options 94.1 74.6 69.3Purchases of common stock for treasury (606.7) (1,161.9) (1,745.3)Dividends paid (1,071.7) (1,017.7) (983.3)Addition of noncontrolling interest — — 17.6Distributions to noncontrolling and redeemable interest holders (84.3) (25.0) (77.4)Other, net (7.2) (16.1) (14.2)Net cash used by fi nancing activities $ (2,285.6) $ (1,384.8) $ (1,824.1)
Net cash used by fi nancing activities increased by $901 million in fi scal 2016. We had $1.4 billion less net debt issuances in fi scal 2016 than the prior year. For more information on our debt issuances and payments, please refer to Note 8 to the Consolidated Financial Statements on page 65 of this report.
During fi scal 2016, we received $172 million in pro-ceeds from common stock issued on exercised options compared to $164 million in fi scal 2015, an increase of $8 million. During fi scal 2014, we received $108 million in proceeds from common stock issued on exercised options.
In May 2014, our Board of Directors authorized the repurchase of up to 100 million shares of our common stock. Purchases under the authorization can be made in the open market or in privately negotiated trans-actions, including the use of call options and other derivative instruments, Rule 10b5-1 trading plans, and accelerated repurchase programs. Th e authorization has no specifi ed termination date.
During fi scal 2016, we repurchased 11 million shares of our common stock for $607 million. During fi scal 2015, we repurchased 22 million shares of our common stock for $1,162 million. During fi scal 2014, we repurchased 36 million shares of our common stock for $1,745 million.
Dividends paid in fi scal 2016 totaled $1,072 million, or $1.78 per share, a 7 percent per share increase from
24 General Mills

fi scal 2015. Dividends paid in fi scal 2015 totaled $1,018 million, or $1.67 per share, an 8 percent per share increase from fi scal 2014 dividends of $1.55 per share.
Selected Cash Flows from Joint Ventures
Selected cash fl ows from our joint ventures are set forth in the following table: Fiscal YearInfl ow (Outfl ow), in Millions 2016 2015 2014
Repayments from (advances to) joint ventures, net $63.9 $(102.4) $(54.9)Dividends received 75.1 72.6 90.5
CAPITAL RESOURCES
Total capital consisted of the following:
In Millions May 29, 2016 May 31, 2015
Notes payable $ 269.8 $ 615.8Current portion of long-term debt 1,103.4 1,000.4Long-term debt 7,057.7 7,575.3Total debt 8,430.9 9,191.5Redeemable interest 845.6 778.9Noncontrolling interests 376.9 396.0Stockholders’ equity 4,930.2 4,996.7Total capital $14,583.6 $15,363.1
Th e following table details the fee-paid committed and uncommitted credit lines we had available as of May 29, 2016:
Facility BorrowedIn Billions Amount Amount
Credit facility expiring: May 2021 $2.7 $ — June 2019 0.2 0.1Total committed credit facilities 2.9 0.1Uncommitted credit facilities 0.4 0.1Total committed and uncommitted credit facilities $3.3 $0.2
In May 2016, we entered into a $2.7 billion fee-paid committed credit facility that is scheduled to expire in May 2021. Concurrent with the execution of this credit facility, we terminated our $1.7 billion and $1.0 billion credit facilities.
In June 2014, our subsidiary, Yoplait S.A.S. entered into a €200.0 million fee-paid committed credit facility that is scheduled to expire in June 2019.
To ensure availability of funds, we maintain bank credit lines suffi cient to cover our outstanding notes payable. Commercial paper is a continuing source of short-term fi nancing. We have commercial paper pro-grams available to us in the United States and Europe. We also have uncommitted and asset-backed credit lines that support our foreign operations. Th e credit facilities contain several covenants, including a require-ment to maintain a fi xed charge coverage ratio of at least 2.5 times.
Certain of our long-term debt agreements, our credit facilities, and our noncontrolling interests contain restrictive covenants. As of May 29, 2016, we were in compliance with all of these covenants.
We have $1,103 million of long-term debt maturing in the next 12 months that is classifi ed as current, includ-ing $1,000 million of 5.7 percent fi xed rate notes due February 2017. We believe that cash fl ows from opera-tions, together with available short- and long-term debt fi nancing, will be adequate to meet our liquidity and capital needs for at least the next 12 months.
As of May 29, 2016, our total debt, including the impact of derivative instruments designated as hedges, was 78 percent in fi xed-rate and 22 percent in fl oat-ing-rate instruments, compared to 72 percent in fi xed-rate and 28 percent in fl oating-rate instruments on May 31, 2015.
Return on average total capital was 12.9 percent in fi scal 2016 compared to 9.1 percent in fi scal 2015. Improvement in return on adjusted average total capital is one of our key performance measures (see the “Non-GAAP Measures” section below for our discussion of this measure, which is not defi ned by GAAP). Adjusted return on average total capital increased 10 basis points from 11.2 percent in fi scal 2015 to 11.3 percent in fi s-cal 2016 as fi scal 2016 earnings increased. On a con-stant-currency basis, adjusted return on average total capital increased 40 basis points.
We also believe that our fi xed charge coverage ratio and the ratio of operating cash fl ow to debt are import-ant measures of our fi nancial strength. Our fi xed charge coverage ratio in fi scal 2016 was 7.40 compared to 5.54 in fi scal 2015. Th e measure increased from fi scal 2015 as earnings before income taxes and aft er-tax earnings from joint ventures increased by $642 million in fi scal 2016. Our operating cash fl ow to debt ratio increased 3.5 percentage points to 31.2 percent in fi scal 2016, driven by a decrease in total debt.
2016 Annual Report 25

We have a 51 percent controlling interest in Yoplait SAS and a 50 percent interest in Yoplait Marques SNC and Liberté Marques Sàrl. Sodiaal holds the remaining interests in each of these entities. We consolidate these entities into our consolidated fi nancial statements. We record Sodiaal’s 50 percent interest in Yoplait Marques SNC and Liberté Marques Sàrl as noncontrolling inter-ests, and its 49 percent interest in Yoplait SAS as a redeemable interest on our Consolidated Balance Sheets. Th ese euro- and Canadian dollar-denominated interests are reported in U.S. dollars on our Consolidated Balance Sheets. Sodiaal has the ability to put all or a portion of its redeemable interest to us at fair value once per year, up to three times before December 2024. As of May 29, 2016, the redemption value of the redeemable interest was $846 million which approximates its fair value.
Th e third-party holder of the General Mills Cereals, LLC (GMC) Class A Interests receives quarterly pre-ferred distributions from available net income based on the application of a fl oating preferred return rate to the holder’s capital account balance established in the most recent mark-to-market valuation (currently $252 million). On June 1, 2015, the fl oating preferred return rate on GMC’s Class A Interests was reset to the sum of three-month LIBOR plus 125 basis points. Th e pre-ferred return rate is adjusted every three years through a negotiated agreement with the Class A Interest holder or through a remarketing auction.
We have an option to purchase the Class A Interests for consideration equal to the then current capital account value, plus any unpaid preferred return and the prescribed make-whole amount. If we purchase these interests, any change in the third-party holder’s capital account from its original value will be charged directly to retained earnings and will increase or decrease the net earnings used to calculate EPS in that period.
OFF-BALANCE SHEET ARRANGEMENTS AND CONTRACTUAL OBLIGATIONS
As of May 29, 2016, we have issued guarantees and comfort letters of $383 million for the debt and other obligations of consolidated subsidiaries, and guarantees and comfort letters of $239 million for the debt and other obligations of non-consolidated affi liates, mainly CPW. In addition, off-balance sheet arrangements are generally limited to the future payments under non-cancelable operating leases, which totaled $398 million as of May 29, 2016.
As of May 29, 2016, we had invested in fi ve variable interest entities (VIEs). None of our VIEs are material to our results of operations, fi nancial condition, or liquidity as of and for the fi scal year ended May 29, 2016.
Our defi ned benefi t plans in the United States are subject to the requirements of the Pension Protection Act (PPA). In the future, the PPA may require us to make additional contributions to our domestic plans. We do not expect to be required to make any contribu-tions in fi scal 2017.
Th e following table summarizes our future estimated cash payments under existing contractual obligations, including payments due by period:
Payments Due by Fiscal Year 2022 andIn Millions Total 2017 2018-19 2020-21 Th ereaft er
Long-term debt (a) $ 8,190.2 $1,103.0 $1,754.2 $1,611.6 $3,721.4Accrued interest 90.4 90.4 — — —Operating leases (b) 397.6 107.9 150.7 89.2 49.8Capital leases 2.7 0.9 1.3 0.4 0.1Purchase obligations (c) 3,082.1 1,955.9 603.7 497.4 25.1Total contractual obligations 11,763.0 3,258.1 2,509.9 2,198.6 3,796.4Other long-term obligations (d) 1,957.0 — — — —Total long-term obligations $13,720.0 $3,258.1 $2,509.9 $2,198.6 $3,796.4
(a) Amounts represent the expected cash payments of our long-term debt and do not include $2 million for capital leases or $31 million for net unamortized debt issuance costs, premiums and discounts, and fair value adjustments.
(b) Operating leases represents the minimum rental commitments under non-cancelable operating leases.
(c) Th e majority of the purchase obligations represent commitments for raw material and packaging to be utilized in the normal course of business and for consumer marketing spending commitments that support our brands. For purposes of this table, arrangements are considered purchase obliga-tions if a contract specifi es all signifi cant terms, including fi xed or minimum quantities to be purchased, a pricing structure, and approximate timing of the transaction. Most arrangements are cancelable without a signifi cant penalty and with short notice (usually 30 days). Any amounts refl ected on the Consolidated Balance Sheets as accounts payable and accrued liabilities are excluded from the table above.
(d) Th e fair value of our foreign exchange, equity, commodity, and grain derivative contracts with a payable position to the counterparty was $44 million as of May 29, 2016, based on fair market values as of that date. Future changes in market values will impact the amount of cash ultimately paid or received to settle those instruments in the future. Other long-term obligations mainly consist of liabilities for accrued compensation and ben-efi ts, including the underfunded status of certain of our defi ned benefi t pension, other postretirement benefi t, and postemployment benefi t plans, and miscellaneous liabilities. We expect to pay $22 million of benefi ts from our unfunded postemployment benefi t plans and $14 million of deferred compensation in fi scal 2017. We are unable to reliably estimate the amount of these payments beyond fi scal 2017. As of May 29, 2016, our total liability for uncertain tax positions and accrued interest and penalties was $209 million.
26 General Mills

SIGNIFICANT ACCOUNTING ESTIMATES
For a complete description of our signifi cant account-ing policies, see Note 2 to the Consolidated Financial Statements on page 47 of this report. Our signifi cant accounting estimates are those that have a meaning-ful impact on the reporting of our fi nancial condition and results of operations. Th ese estimates include our accounting for promotional expenditures, valuation of long-lived assets, intangible assets, redeemable interest, stock-based compensation, income taxes, and defi ned benefit pension, other postretirement benefit, and postemployment benefi t plans.
Promotional Expenditures Our promotional activities are conducted through our customers and directly or indirectly with end consumers. Th ese activities include: payments to customers to perform merchandising activities on our behalf, such as advertising or in-store displays; discounts to our list prices to lower retail shelf prices; payments to gain distribution of new products; coupons, contests, and other incentives; and media and advertising expenditures. Th e recognition of these costs requires estimation of customer participation and per-formance levels. Th ese estimates are based on the fore-casted customer sales, the timing and forecasted costs of promotional activities, and other factors. Diff erences between estimated expenses and actual costs are recog-nized as a change in management estimate in a subse-quent period. Our accrued trade, coupon, and consumer marketing liabilities were $564 million as of May 29, 2016, and $565 million as of May 31, 2015. Because our total promotional expenditures (including amounts clas-sifi ed as a reduction of revenues) are signifi cant, if our estimates are inaccurate we would have to make adjust-ments in subsequent periods that could have a signifi -cant eff ect on our results of operations.
Valuation of Long-Lived Assets We estimate the useful lives of long-lived assets and make estimates concerning undiscounted cash fl ows to review for impairment when-ever events or changes in circumstances indicate that the carrying amount of an asset (or asset group) may not be recoverable. Fair value is measured using discounted cash fl ows or independent appraisals, as appropriate.
Intangible Assets Goodwill and other indefi nite-lived intangible assets are not subject to amortization and are tested for impairment annually and whenever events
or changes in circumstances indicate that impairment may have occurred. Our estimates of fair value for goodwill impairment testing are determined based on a discounted cash fl ow model. We use inputs from our long-range planning process to determine growth rates for sales and profi ts. We also make estimates of discount rates, perpetuity growth assumptions, market compara-bles, and other factors.
We evaluate the useful lives of our other intangible assets, mainly brands, to determine if they are fi nite or indefi nite-lived. Reaching a determination on useful life requires signifi cant judgments and assumptions regard-ing the future eff ects of obsolescence, demand, compe-tition, other economic factors (such as the stability of the industry, known technological advances, legislative action that results in an uncertain or changing regula-tory environment, and expected changes in distribution channels), the level of required maintenance expendi-tures, and the expected lives of other related groups of assets. Intangible assets that are deemed to have defi -nite lives are amortized on a straight-line basis, over their useful lives, generally ranging from 4 to 30 years. Our estimate of the fair value of our brand assets is based on a discounted cash fl ow model using inputs which include projected revenues from our long-range plan, assumed royalty rates that could be payable if we did not own the brands, and a discount rate.
As of May 29, 2016, we had $12.9 billion of goodwill and indefi nite-lived intangible assets. While we currently believe that the fair value of each intangible exceeds its carrying value and that those intangibles so classifi ed will contribute indefi nitely to our cash fl ows, materially dif-ferent assumptions regarding future performance of our businesses or a diff erent weighted-average cost of capital could result in material impairment losses and amortiza-tion expense. We performed our fi scal 2016 assessment of our intangible assets as of August 31, 2015. As of our annual assessment date, there was no impairment of any of our intangible assets as their related fair values were substantially in excess of the carrying values, except for the Mountain High and Uncle Toby’s brands. Th e excess fair value above the carrying value of these brand assets were as follows:
Excess Fair Value Above Carrying Carrying In Millions Value Value
Mountain High $ 35.4 20%Uncle Toby’s $ 52.2 11%
2016 Annual Report 27
Our Mountain High and Uncle Toby’s brands have experienced declining business performance, and we will continue to monitor these businesses.
Our strategies for fi scal 2017 and fi scal 2018 will focus our growth investments on our brands and platforms with the strongest profi table growth potential. As a result, certain parts of our U.S. Retail segment could experience reduced future sales projections. We per-formed a sensitivity analysis for certain brand intangi-ble assets and determined that, while not impaired as of May 29, 2016, the Progresso and Food Should Taste Good brands had risk of decreasing coverage. We will continue to monitor these businesses.
Redeemable Interest In fi scal 2016, we adjusted the redemption value of Sodiaal’s redeemable interest in Yoplait SAS based on a discounted cash fl ow model. The significant assumptions used to estimate the redemption value include projected revenue growth and profi tability from our long-range plan, capital spending, depreciation and taxes, foreign currency exchange rates, and a discount rate. As of May 29, 2016, the redemp-tion value of the redeemable interest was $846 million.
Stock-based Compensation The valuation of stock options is a significant accounting estimate that requires us to use judgments and assumptions that are likely to have a material impact on our fi nancial statements. Annually, we make predictive assumptions regarding future stock price volatility, employee exer-cise behavior, dividend yield, and the forfeiture rate. For more information on these assumptions, please refer to Note 11 to the Consolidated Financial Statements on page 69 of this report.
Th e estimated fair values of stock options granted and the assumptions used for the Black-Scholes option-pricing model were as follows:
Fiscal Year 2016 2015 2014
Estimated fair values of stock options granted $7.24 $7.22 $6.03Assumptions: Risk-free interest rate 2.4% 2.6% 2.6% Expected term 8.5 years 8.5 years 9.0 years Expected volatility 17.6% 17.5% 17.4% Dividend yield 3.2% 3.1% 3.1%
Th e risk-free interest rate for periods during the expected term of the options is based on the U.S. Treasury zero-coupon yield curve in eff ect at the time of grant. An increase in the expected term by 1 year, leaving all other assumptions constant, would increase the grant date fair value by less than 1 percent. If all other assumptions are held constant, a one percentage point increase in our fi scal 2016 volatility assumption would increase the grant date fair value of our fi scal 2016 option awards by 7 percent.
To the extent that actual outcomes diff er from our assumptions, we are not required to true up grant-date fair value-based expense to fi nal intrinsic values. However, these diff erences can impact the classifi ca-tion of cash tax benefi ts realized upon exercise of stock options, as explained in the following two paragraphs. Furthermore, historical data has a signifi cant bearing on our forward-looking assumptions. Signifi cant vari-ances between actual and predicted experience could lead to prospective revisions in our assumptions, which could then signifi cantly impact the year-over-year com-parability of stock-based compensation expense.
Any corporate income tax benefi t realized upon exer-cise or vesting of an award in excess of that previously recognized in earnings (referred to as a windfall tax benefi t) is presented in the Consolidated Statements of Cash Flows as a fi nancing cash fl ow. Th e actual impact on future years’ fi nancing cash fl ows will depend, in part, on the volume of employee stock option exercises during a particular year and the relationship between the exercise-date market value of the underlying stock and the original grant-date fair value previously deter-mined for fi nancial reporting purposes.
Realized windfall tax benefi ts are credited to addi-tional paid-in capital within the Consolidated Balance Sheets. Realized shortfall tax benefi ts (amounts which are less than that previously recognized in earnings) are fi rst off set against the cumulative balance of windfall tax benefi ts, if any, and then charged directly to income tax expense, potentially resulting in volatility in our consolidated eff ective income tax rate. We calculated a cumulative amount of windfall tax benefi ts for the pur-pose of accounting for future shortfall tax benefi ts and currently have suffi cient cumulative windfall tax bene-fi ts to absorb projected arising shortfalls, such that we do not currently expect future earnings to be aff ected by this provision. However, as employee stock option exercise behavior is not within our control, it is possible
28 General Mills
that signifi cantly diff erent reported results could occur if diff erent assumptions or conditions were to prevail.
Income Taxes We apply a more-likely-than-not thresh-old to the recognition and derecognition of uncertain tax positions. Accordingly, we recognize the amount of tax benefi t that has a greater than 50 percent likelihood of being ultimately realized upon settlement. Future changes in judgment related to the expected ultimate resolution of uncertain tax positions will aff ect earnings in the quarter of such change. For more information on income taxes, please refer to Note 14 to the Consolidated Financial Statements on page 78 of this report.
Defi ned Benefi t Pension, Other Postretirement Benefi t, and Postemployment Benefi t Plans We have defi ned benefi t pension plans covering many employees in the United States, Canada, France, and the United Kingdom. We also sponsor plans that provide health care benefi ts to many of our retirees in the United States, Canada, and Brazil. Under certain circumstances, we also provide accruable benefi ts to former and inactive employees in the United States, Canada, and Mexico, and members of our Board of Directors, including severance and certain other benefi ts payable upon death. Please refer to Note 13 to the Consolidated Financial Statements on page 72 of this report for a description of our defi ned benefi t pension, other postretirement benefi t, and postemploy-ment benefi t plans.
We recognize benefi ts provided during retirement or following employment over the plan participants’ active working lives. Accordingly, we make various assump-tions to predict and measure costs and obligations many years prior to the settlement of our obligations. Assumptions that require signifi cant management judg-ment and have a material impact on the measurement of our net periodic benefi t expense or income and accu-mulated benefi t obligations include the long-term rates of return on plan assets, the interest rates used to dis-count the obligations for our benefi t plans, and health care cost trend rates.
Expected Rate of Return on Plan Assets Our expected rate of return on plan assets is determined by our asset allocation, our historical long-term investment perfor-mance, our estimate of future long-term returns by asset class (using input from our actuaries, investment services, and investment managers), and long-term
inflation assumptions. We review this assumption annually for each plan; however, our annual investment performance for one particular year does not, by itself, signifi cantly infl uence our evaluation.
Our historical investment returns (compound annual growth rates) for our United States defi ned benefi t pen-sion and other postretirement benefi t plan assets were 0.7 percent, 7.8 percent, 6.6 percent, 7.4 percent, and 8.6 percent for the 1, 5, 10, 15, and 20 year periods ended May 29, 2016.
On a weighted-average basis, the expected rate of return for all defi ned benefi t plans was 8.53 percent for fi scal 2016, 8.53 percent for fi scal 2015, and 8.53 percent for fi scal 2014. During fi scal 2016, we lowered our weighted-average expected rate of return on plan assets for our principal defi ned benefi t pension and other postretirement plans in the United States to 8.25 percent due to asset changes that decreased investment risk in the portfolio.
Lowering the expected long-term rate of return on assets by 100 basis points would increase our net pen-sion and postretirement expense by $64 million for fi scal 2017. A market-related valuation basis is used to reduce year-to-year expense volatility. Th e market-related valu-ation recognizes certain investment gains or losses over a fi ve-year period from the year in which they occur. Investment gains or losses for this purpose are the dif-ference between the expected return calculated using the market-related value of assets and the actual return based on the market-related value of assets. Our outside actuaries perform these calculations as part of our deter-mination of annual expense or income.
Discount Rates Our discount rate assumptions are determined annually as of the last day of our fi scal year for our defi ned benefi t pension, other postretirement benefi t, and postemployment benefi t plan obligations. We work with our outside actuaries to determine the timing and amount of expected future cash outfl ows to plan participants and, using the Aa Above Median corporate bond yield, to develop a forward interest rate curve, including a margin to that index based on our credit risk. Th is forward interest rate curve is applied to our expected future cash outfl ows to determine our discount rate assumptions.
2016 Annual Report 29

Our weighted-average discount rates were as follows:
Defi ned Other Benefi t Postretirement Postemployment Pension Benefi t Benefi t Plans Plans Plans
Obligations as of May 29, 2016, and fi scal 2017 expense 4.19% 3.97% 2.94%Obligations as of May 31, 2015, and fi scal 2016 expense 4.38% 4.20% 3.55%Fiscal 2015 expense 4.54% 4.51% 3.82%
Lowering the discount rates by 100 basis points would increase our net defi ned benefi t pension, other post-retirement benefi t, and postemployment benefi t plan expense for fi scal 2017 by approximately $96 million. All obligation-related experience gains and losses are amortized using a straight-line method over the average remaining service period of active plan participants.
Health Care Cost Trend Rates We review our health care cost trend rates annually. Our review is based on data we collect about our health care claims experi-ence and information provided by our actuaries. Th is information includes recent plan experience, plan design, overall industry experience and projections, and assumptions used by other similar organizations. Our initial health care cost trend rate is adjusted as neces-sary to remain consistent with this review, recent expe-riences, and short-term expectations. Our initial health care cost trend rate assumption is 7.5 percent for retir-ees age 65 and over and 7.3 percent for retirees under age 65 at the end of fi scal 2016. Rates are graded down annually until the ultimate trend rate of 5.0 percent is reached in 2024 for all retirees. Th e trend rates are applicable for calculations only if the retirees’ benefi ts increase as a result of health care infl ation. Th e ulti-mate trend rate is adjusted annually, as necessary, to approximate the current economic view on the rate of long-term infl ation plus an appropriate health care cost premium. Assumed trend rates for health care costs have an important eff ect on the amounts reported for the other postretirement benefi t plans.
A one percentage point change in the health care cost trend rate would have the following eff ects:
One One Percentage Percentage Point PointIn Millions Increase Decrease
Eff ect on the aggregate of the service and interest cost components in fi scal 2017 $ 3.1 $ (2.7)Eff ect on the other postretirement accumulated benefi t obligation as of May 29, 2016 71.2 (63.8)
Any arising health care claims cost-related experience gain or loss is recognized in the calculation of expected future claims. Once recognized, experience gains and losses are amortized using a straight-line method over 10 years, resulting in at least the minimum amortization required being recorded.
Financial Statement Impact In fi scal 2016, we recorded net defi ned benefi t pension, other postretirement ben-efi t, and postemployment benefi t plan expense of $163 million compared to $153 million of expense in fi scal 2015 and $140 million of expense in fi scal 2014. As of May 29, 2016, we had cumulative unrecognized actu-arial net losses of $1.9 billion on our defi ned benefi t pension plans and $72 million on our postretirement and postemployment benefi t plans, mainly as the result of liability increases from lower interest rates, partially off set by recent increases in the values of plan assets. Th ese unrecognized actuarial net losses will result in increases in our future pension and postretirement benefi t expenses because they currently exceed the cor-ridors defi ned by GAAP.
Assumed mortality rates of plan participants are a critical estimate in measuring the expected payments a participant will receive over their lifetime and the amount of expense we recognize. On October 27, 2014, the Society of Actuaries published RP-2014 Mortality Tables and Mortality Improvement Scale MP-2014, which both refl ect improved longevity. In fi scal 2015, we adopted the change to the mortality assumptions to remeasure our defi ned benefi t pension plans and other postretirement benefi t plans obligations, which increased the total of these obligations by $437 million in fi scal 2015. In addition, these assumptions increased the fi scal 2016 expense associated with these plans by $72 million.
Actual future net defined benefit pension, other postretirement benefit, and postemployment bene-fi t plan income or expense will depend on investment
30 General Mills
performance, changes in future discount rates, changes in health care cost trend rates, and other factors related to the populations participating in these plans.
RECENTLY ISSUED ACCOUNTING PRONOUNCEMENTS
In March 2016, the Financial Accounting Standards Board (FASB) issued new accounting requirements for the accounting and presentation of stock-based pay-ments. Th is will result in realized windfall and short-fall tax benefi ts upon exercise or vesting of stock-based awards being recorded in our Consolidated Statements of Earnings in addition to other presentation changes. Th e requirements of the new standard are eff ective for annual reporting periods beginning aft er December 15, 2016, and interim periods within those annual periods, which for us is the fi rst quarter of fi scal 2018. Early adoption is permitted. We are in the process of analyz-ing the impact on our results of operations and fi nan-cial position.
In February 2016, the FASB issued new accounting requirements for accounting, presentation and classifi -cation of leases. Th is will result in most leases being capitalized as a right of use asset with a related liability on our Consolidated Balance Sheets. Th e requirements of the new standard are eff ective for annual reporting periods beginning aft er December 15, 2018, and interim periods within those annual periods, which for us is the fi rst quarter of fi scal 2020. We are in the process of analyzing the impact on our results of operations and fi nancial position.
In May 2015, the FASB issued new accounting requirements for the presentation of certain invest-ments using the net asset value, providing a practical expedient to exclude such investments from catego-rization within the fair value hierarchy and separate disclosure. Th e requirements of the new standard are eff ective for annual reporting periods beginning aft er December 15, 2015, and interim periods within those annual periods, which for us is the fi rst quarter of fi scal 2017. We do not expect this guidance to have a material impact on our results of operations or fi nancial position.
In April 2015, the FASB issued new accounting requirements which permits reporting entities with a fi scal year-end that does not coincide with a month-end to apply a practical expedient that permits the entity to measure defi ned benefi t plan assets and obli-gations using the month-end that is closest to the
entity’s fi scal year-end and apply such practical expedi-ent consistently to all plans. Th e requirements of the new standard are eff ective for annual reporting periods beginning aft er December 15, 2015, and interim periods within those annual periods, which for us is the fi rst quarter of fi scal 2017. We do not expect this guidance to have a material impact on our results of operations or fi nancial position.
In May 2014, the FASB issued new accounting requirements for the recognition of revenue from con-tracts with customers. Th e requirements of the new standard and its subsequent amendments are eff ective for annual reporting periods beginning aft er December 15, 2017, and interim periods within those annual peri-ods, which for us is the fi rst quarter of fi scal 2019. We do not expect this guidance to have a material impact on our results of operations or fi nancial position.
NON-GAAP MEASURES
We have included in this report measures of fi nancial performance that are not defi ned by GAAP. We believe that these measures provide useful information to investors, and include these measures in other commu-nications to investors.
For each of these non-GAAP fi nancial measures, we are providing below a reconciliation of the diff erences between the non-GAAP measure and the most directly comparable GAAP measure, an explanation of why our management or the Board of Directors believes the non-GAAP measure provides useful information to investors and any additional purposes for which our manage-ment or Board of Directors uses the non-GAAP measure. Th ese non-GAAP measures should be viewed in addition to, and not in lieu of, the comparable GAAP measure.
Constant-currency Net Sales Growth Rates Th is mea-sure is used in reporting to our executive management and as a component of the Board of Directors’ mea-surement of our performance for incentive compensa-tion purposes. We believe that this measure provides useful information to investors because it provides transparency to underlying performance in our con-solidated net sales by excluding the eff ect that foreign currency exchange rate fl uctuations have on the year-to-year comparability given volatility in foreign cur-rency exchange markets.
2016 Annual Report 31
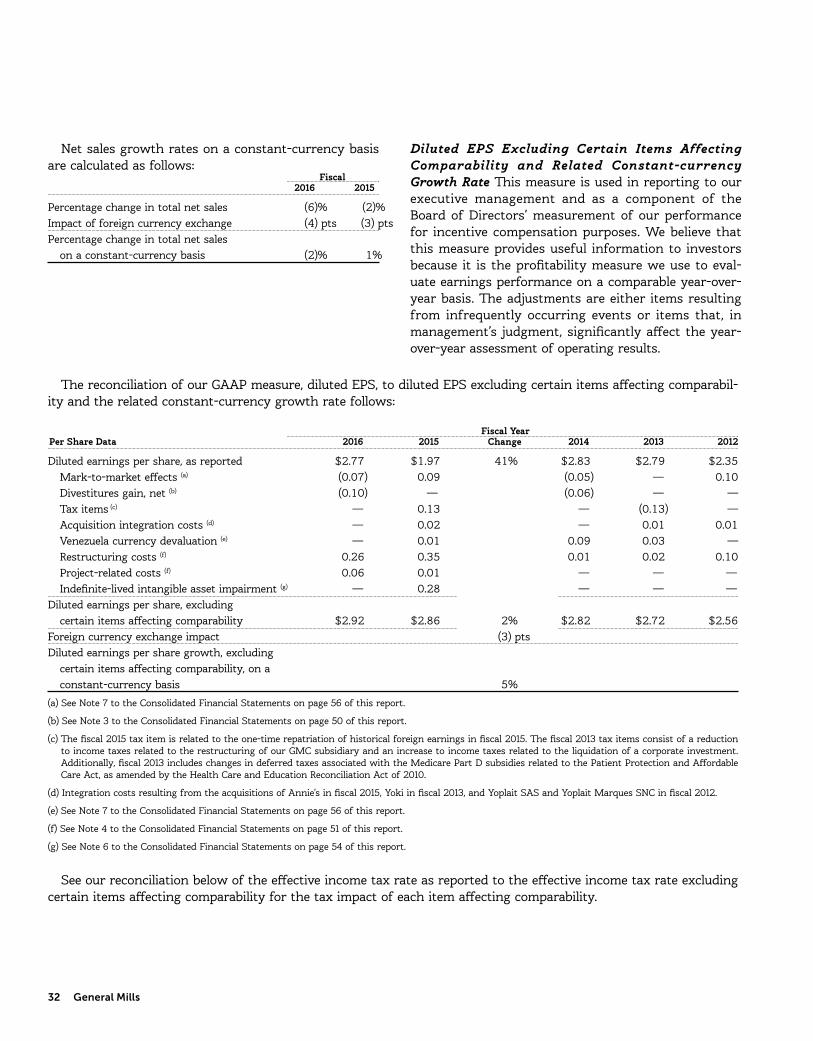
Net sales growth rates on a constant-currency basis are calculated as follows: Fiscal 2016 2015
Percentage change in total net sales (6)% (2)%Impact of foreign currency exchange (4) pts (3) ptsPercentage change in total net sales on a constant-currency basis (2)% 1%
Diluted EPS Excluding Certain Items Affecting Comparability and Related Constant-currency Growth Rate Th is measure is used in reporting to our executive management and as a component of the Board of Directors’ measurement of our performance for incentive compensation purposes. We believe that this measure provides useful information to investors because it is the profi tability measure we use to eval-uate earnings performance on a comparable year-over-year basis. Th e adjustments are either items resulting from infrequently occurring events or items that, in management’s judgment, signifi cantly aff ect the year-over-year assessment of operating results.
Th e reconciliation of our GAAP measure, diluted EPS, to diluted EPS excluding certain items aff ecting comparabil-ity and the related constant-currency growth rate follows:
Fiscal YearPer Share Data 2016 2015 Change 2014 2013 2012
Diluted earnings per share, as reported $2.77 $1.97 41% $2.83 $2.79 $2.35 Mark-to-market eff ects (a) (0.07) 0.09 (0.05) — 0.10 Divestitures gain, net (b) (0.10) — (0.06) — — Tax items (c) — 0.13 — (0.13) — Acquisition integration costs (d) — 0.02 — 0.01 0.01 Venezuela currency devaluation (e) — 0.01 0.09 0.03 — Restructuring costs (f) 0.26 0.35 0.01 0.02 0.10 Project-related costs (f) 0.06 0.01 — — — Indefi nite-lived intangible asset impairment (g) — 0.28 — — —Diluted earnings per share, excluding certain items aff ecting comparability $2.92 $2.86 2% $2.82 $2.72 $2.56Foreign currency exchange impact (3) ptsDiluted earnings per share growth, excluding certain items aff ecting comparability, on a constant-currency basis 5%
(a) See Note 7 to the Consolidated Financial Statements on page 56 of this report.
(b) See Note 3 to the Consolidated Financial Statements on page 50 of this report.
(c) Th e fi scal 2015 tax item is related to the one-time repatriation of historical foreign earnings in fi scal 2015. Th e fi scal 2013 tax items consist of a reduction to income taxes related to the restructuring of our GMC subsidiary and an increase to income taxes related to the liquidation of a corporate investment. Additionally, fi scal 2013 includes changes in deferred taxes associated with the Medicare Part D subsidies related to the Patient Protection and Aff ordable Care Act, as amended by the Health Care and Education Reconciliation Act of 2010.
(d) Integration costs resulting from the acquisitions of Annie’s in fi scal 2015, Yoki in fi scal 2013, and Yoplait SAS and Yoplait Marques SNC in fi scal 2012.
(e) See Note 7 to the Consolidated Financial Statements on page 56 of this report.
(f) See Note 4 to the Consolidated Financial Statements on page 51 of this report.
(g) See Note 6 to the Consolidated Financial Statements on page 54 of this report.
See our reconciliation below of the eff ective income tax rate as reported to the eff ective income tax rate excluding certain items aff ecting comparability for the tax impact of each item aff ecting comparability.
32 General Mills

Total Segment Operating Profit and Related Constant-currency Growth Rate Th is measure is used in reporting to our executive management and as a component of the Board of Directors’ measurement of our performance for incentive compensation purposes. We believe that this measure provides useful informa-tion to investors because it is the profi tability measure we use to evaluate segment performance. A reconcil-iation of total segment operating profi t to operating profi t, the relevant GAAP measure, is included in Note 16 to the Consolidated Financial Statements on page 81 of this report.
Total segment operating profi t growth rates on a constant-currency basis are calculated as follows:
Fiscal 2016 2015
Percentage change in total segment operating profi t as reported (1)% (4)%Impact of foreign currency exchange (2) pts (2) ptsPercentage change in total segment operating profi t on a constant-currency basis 1% (2)%
Constant-currency Aft er-tax Earnings from Joint Ventures Growth Rates We believe that this mea-sure provides useful information to investors because it provides transparency to underlying performance of our joint ventures by excluding the eff ect that foreign currency exchange rate fl uctuations have on year-to-year comparability given volatility in foreign currency exchange markets.
Aft er-tax earnings from joint ventures growth rates on a constant-currency basis are calculated as follows:
Fiscal 2016 2015
Percentage change in aft er-tax earnings from joint ventures as reported 5% (6)%Impact of foreign currency exchange (7) pts (6) ptsPercentage change in aft er-tax earnings from joint ventures on a constant-currency basis 12% Flat
Net Sales Growth Rates for Our International Segment on Constant-currency Basis We believe this measure of our International segment and region net sales provides useful information to investors because it provides transpar-ency to the underlying performance by excluding the eff ect that foreign currency exchange rate fl uctuations have on year-to-year comparability given volatility in foreign currency exchange markets.
Fiscal 2016 Percentage Change Impact of Foreign Percentage Change in in Net Sales Currency Net Sales on Constant as Reported Exchange Currency Basis
Europe (6)% (9) pts 3%Canada (16) (12) (4)Asia/Pacifi c (3) (4) 1Latin America (19) (31) 12Total International (10)% (13) pts 3%
Fiscal 2015 Percentage Change Impact of Foreign Percentage Change in in Net Sales Currency Net Sales on Constant as Reported Exchange Currency Basis
Europe (3)% (8) pts 5%Canada (8) (8) FlatAsia/Pacifi c 4 (1) 5Latin America (14) (31) 17Total International (5)% (11) pts 6%
2016 Annual Report 33

Constant-currency International Segment Operating Profi t Growth Rates We believe that this measure provides useful information to investors because it provides transparency to underlying performance of the International seg-ment by excluding the eff ect that foreign currency exchange rate fl uctuations have on year-to-year comparability given volatility in foreign currency exchange markets.
International segment operating profi t growth rates on a constant-currency basis are calculated as follows:
Fiscal 2016 2015
Percentage change in International segment operating profi t as reported (15)% (2)%Impact of foreign currency exchange (12) pts (11) ptsPercentage change in International segment operating profi t on a constant-currency basis (3)% 9%
34 General Mills

Adjusted Return on Average Total Capital Change in adjusted return on average total capital is a measure used in reporting to our executive management and as a component of the Board of Director’s measurement of our perfor-mance for incentive compensation purposes. We believe that this measure provides useful information to investors because it is important for assessing the utilization of capital and it eliminates certain items that aff ect year-to-year comparability. Th e calculation of adjusted return on average total capital and return on average total capital, its GAAP equivalent follows:
Fiscal YearIn Millions 2016 2015 2014 2013 2012 2011
Net earnings, including earnings attributable to redeemable and noncontrolling interests $ 1,736.8 $ 1,259.4 $ 1,861.3 $ 1,892.5 $ 1,589.1Interest, net, aft er-tax 193.1 199.8 190.9 201.2 238.9Earnings before interest, aft er-tax 1,929.9 1,459.2 2,052.2 2,093.7 1,828.0 Adjustments, aft er-tax: (a)
Mark-to-market eff ects (39.6) 56.5 (30.5) (2.8) 65.6 Divestitures gain, net (66.0) — (36.0) — — Tax items — 78.6 — (85.4) — Acquisition integration costs — 10.4 — 8.8 9.7 Venezuela currency devaluation — 8.0 57.8 20.8 — Restructuring costs 160.8 217.7 3.6 15.9 64.3 Project-related costs 36.8 8.3 — — — Indefi nite-lived intangible impairment — 176.9 — — —Adjusted earnings before interest, aft er-tax for adjusted return on capital calculation $ 2,021.9 $ 2,015.6 $ 2,047.1 $ 2,051.0 $ 1,967.6Current portion of long-term debt $ 1,103.4 $ 1,000.4 $ 1,250.6 $ 1,443.3 $ 741.2 $ 1,031.3Notes payable 269.8 615.8 1,111.7 599.7 526.5 311.3Long-term debt 7,057.7 7,575.3 6,396.6 5,901.8 6,139.5 5,524.1 Total debt 8,430.9 9,191.5 8,758.9 7,944.8 7,407.2 6,866.7Redeemable interest 845.6 778.9 984.1 967.5 847.8 —Noncontrolling interests 376.9 396.0 470.6 456.3 461.0 246.7Stockholders’ equity 4,930.2 4,996.7 6,534.8 6,672.2 6,421.7 6,365.5Total capital 14,583.6 15,363.1 16,748.4 16,040.8 15,137.7 13,478.9 Accumulated other comprehensive loss 2,612.2 2,310.7 1,340.3 1,585.3 1,743.7 1,010.8 Aft er-tax earnings adjustments (b) 439.1 347.1 (209.3) (204.2) (161.5) (301.1)Adjusted total capital $ 17,634.9 $ 18,020.9 $ 17,879.4 $ 17,421.9 $ 16,719.9 $ 14,188.6Average total capital (c) $ 14,973.4 $ 16,055.8 $ 16,394.6 $ 15,589.2 $ 14,308.3Return on average total capital (c) 12.9% 9.1% 12.5% 13.4% 12.8%Adjusted average total capital (c) $ 17,827.9 $ 17,950.1 $ 17,650.6 $ 17,070.8 $ 15,454.3Adjusted return on average total capital (c) 11.3% 11.2% 11.6% 12.0% 12.7% Change in adjusted return on average total capital 10 bpsForeign currency exchange impact (30) bpsChange in adjusted return on average total capital on a constant-currency basis 40 bps
(a) See our reconciliation below of the eff ective income tax rate as reported to the eff ective income tax rate excluding certain items aff ecting comparability for the tax impact of each item aff ecting comparability.
(b) Sum of current year and previous year aft er-tax adjustments.
(c) See “Glossary” on page 85 of this report for defi nition.
2016 Annual Report 35

Eff ective Income Tax Rate Excluding Certain Items Aff ecting Comparability We believe this measure provides useful information to investors because it is important for assessing the eff ective tax rate excluding certain items aff ecting comparability and presents the income tax eff ects of certain items aff ecting comparability.
Eff ective income tax rates excluding certain items aff ecting comparability are calculated as follows:
Fiscal Year Ended May 29, 2016 May 31, 2015 May 25, 2014 May 26, 2013 May 27, 2012 May 29, 2011 May 30, 2010 Pretax Pretax Pretax Pretax Pretax Pretax Pretax Earnings Income Earnings Income Earnings Income Earnings Income Earnings Income Earnings Income Earnings Income In Millions (a) Taxes (a) Taxes (a) Taxes (a) Taxes (a) Taxes (a) Taxes (a) Taxes
As reported $2,403.6 $755.2 $1,761.9 $586.8 $2,655.0 $883.3 $2,534.9 $741.2 $2,210.5 $709.6 $2,428.2 $721.1 $2,204.5 $771.2 Mark-to-market eff ects (b) (62.8) (23.2) 89.7 33.2 (48.5) (18.0) (4.4) (1.6) 104.2 38.6 (95.2) (35.2) 7.1 2.6 Divestitures (gain) (c) (148.2) (82.2) — — (65.5) (29.5) — — — — — — — — Tax items (d) — — — (78.6) — — — 85.4 — — — 88.9 — (35.0) Acquisition integration costs (e) — — 16.0 5.6 — — 12.3 3.5 11.2 1.5 — — — — Venezuela currency devaluation (b) — — 8.0 — 62.2 4.4 25.2 4.4 — — — — — — Restructuring costs (f) 229.8 69.0 343.5 125.8 3.6 — 18.6 2.7 100.6 36.3 4.4 1.6 31.4 11.6 Project-related costs (f) 57.5 20.7 13.2 4.9 — — — — — — — — — — Intangible asset impairment (f) — — 260.0 83.1 — — — — — — — — — —As adjusted $2,479.9 $739.5 $2,492.3 $760.8 $2,606.8 $840.2 $2,586.6 $835.6 $2,426.5 $786.0 $2,337.4 $776.4 $2,243.0 $750.4Eff ective tax rate: As reported 31.4% 33.3% 33.3% 29.2% 32.1% As adjusted 29.8% 30.5% 32.2% 32.3% 32.4%Sum of adjustments to income taxes $(15.7) $174.0 $(43.1) $94.4 $76.4Average number of common shares - diluted EPS 611.9 618.8 645.7 665.6 666.7Impact of income tax adjustments on diluted EPS excluding certain items aff ecting comparability $0.03 $(0.28) $0.07 $(0.14) $(0.11)
(a) Earnings before income taxes and aft er-tax earnings from joint ventures.
(b) See Note 7 to the Consolidated Financial Statements on page 56 of this report.
(c) See Note 3 to the Consolidated Financial Statements on page 50 of this report.
(d) Th e fi scal 2015 tax item is related to the one-time repatriation of historical foreign earnings in fi scal 2015. Th e fi scal 2013 tax items consist of a reduction to income taxes related to the restructuring of our GMC subsidiary and an increase to income taxes related to the liquidation of a corporate investment. Additionally, fi scal 2013 includes changes in deferred taxes associated with the Medicare Part D subsidies related to the Patient Protection and Aff ordable Care Act, as amended by the Health Care and Education Reconciliation Act of 2010.
(e) Integration costs resulting from the acquisitions of Annie’s in fi scal 2015, Yoki in fi scal 2013, and Yoplait SAS and Yoplait Marques SNC in fi scal 2012.
(f) See Note 4 to the Consolidated Financial Statements on page 51 of this report.
36 General Mills

Free Cash Flow Conversion Rate and Total Cash Returned to Shareholders as a Percentage of Free Cash Flow We believe these measures provide useful information to investors because they are important for assessing our effi -ciency in converting earnings to cash and returning cash to shareholders. Th e calculation of free cash fl ow conver-sion rate and net cash provided by operating activities conversion rate, its equivalent GAAP measure follows:
Fiscal YearIn Millions 2016 2015 2014 2013 2012 2011 2010
Net earnings, including earnings attributable to redeemable and noncontrolling interests as reported $ 1,736.8 $ 1,259.4 $ 1,861.3 $ 1,892.5 $ 1,589.1 $ 1,803.5 $ 1,535.0 Mark-to-market, net of tax (a) $ (39.6) $ 56.5 $ (30.5) $ (2.8) $ 65.6 $ (60.0) $ 4.5 Divestiture (gain), net of tax (b) $ (66.0) — $ (36.0) — — — — Tax items (c) — $ 78.6 — $ (85.4) — $ (88.9) $ 35.0 Acquisition integration costs, net of tax (b) — $ 10.4 — $ 8.8 $ 9.7 — — Venezuela currency devaluation, net of tax (a) — $ 8.0 $ 57.8 $ 20.8 — — — Restructuring costs, net of tax (d) $ 160.8 $ 217.7 $ 3.6 $ 15.9 $ 64.3 $ 2.8 $ 19.8 Project-related costs, net of tax (d) $ 36.8 $ 8.3 — — — — — Intangible asset impairment, net of tax (e) — $ 176.9 — — — — — Adjusted net earnings, including earnings attributable to redeemable and noncontrolling interests $ 1,828.8 $ 1,815.8 $ 1,856.2 $ 1,849.8 $ 1,728.7 $ 1,657.4 $ 1,594.3 Net cash provided by operating activities, as reported $ 2,629.8 $ 2,542.8 $ 2,541.0 $ 2,926.0 $ 2,407.2 $ 1,531.1 $ 2,185.1 Purchases of land, buildings, and equipment $ (729.3) $ (712.4) $ (663.5) $ (613.9) $ (675.9) $ (648.8) $ (649.9)Free cash fl ow $ 1,900.5 $ 1,830.4 $ 1,877.5 $ 2,312.1 $ 1,731.3 $ 882.3 $ 1,535.2Net cash provided by operating activities conversion rate 151% 202% 137% 155% 151% 85% 142%Free cash fl ow conversion rate 104% 101% 101% 125% 100% 53% 96%
Fiscal Fiscal Fiscal Fiscal FiscalRolling 3 Years, In Millions 2014-2016 2013-2015 2012-2014 2011-2013 2010-2012
Adjusted earnings, including earnings attributable to redeemable and noncontrolling interests $ 5,500.8 $ 5,521.8 $ 5,434.7 $ 5,235.9 $ 4,980.4Free cash fl ow, rolling 3 years 5,608.4 6,020.0 5,920.9 4,925.7 4,148.8Free cash fl ow conversion rate, rolling 3 years 102% 109% 109% 94% 83%
Th e calculation of total cash returned to shareholders as a percentage of free cash fl ow follows: Fiscal YearIn Millions 2016 2015 2014
Dividends paid $ 1,071.7 $ 1,017.7 $ 983.3Purchases of common stock for treasury 606.7 1,161.9 1,745.3Proceeds from common stock issued on exercised options (171.9) (163.7) (108.1)Total cash returned to shareholders $ 1,506.5 $ 2,015.9 $ 2,620.5Total cash returned to shareholders as a percentage of free cash fl ow 79% 110% 140%Total cash returned to shareholders as a percentage of free cash fl ow – cumulative 2014-2016 110%(a) See Note 7 to the Consolidated Financial Statements on page 56 of this report.(b) See Note 3 to the Consolidated Financial Statements on page 50 of this report.(c) Th e fi scal 2015 tax item is related to the one-time repatriation of historical foreign earnings in fi scal 2015. Th e fi scal 2013 tax items consist of a reduction
to income taxes related to the restructuring of our GMC subsidiary and an increase to income taxes related to the liquidation of a corporate investment. Additionally, fi scal 2013 includes changes in deferred taxes associated with the Medicare Part D subsidies related to the Patient Protection and Aff ordable Care Act, as amended by the Health Care and Education Reconciliation Act of 2010.
(d) See Note 4 to the Consolidated Financial Statements on page 51 of this report.(e) See Note 6 to the Consolidated Financial Statements on page 54 of this report.
See our reconciliation above of the eff ective income tax rate as reported to the eff ective income tax rate excluding certain items aff ecting comparability for the tax impact of each item aff ecting comparability.
2016 Annual Report 37
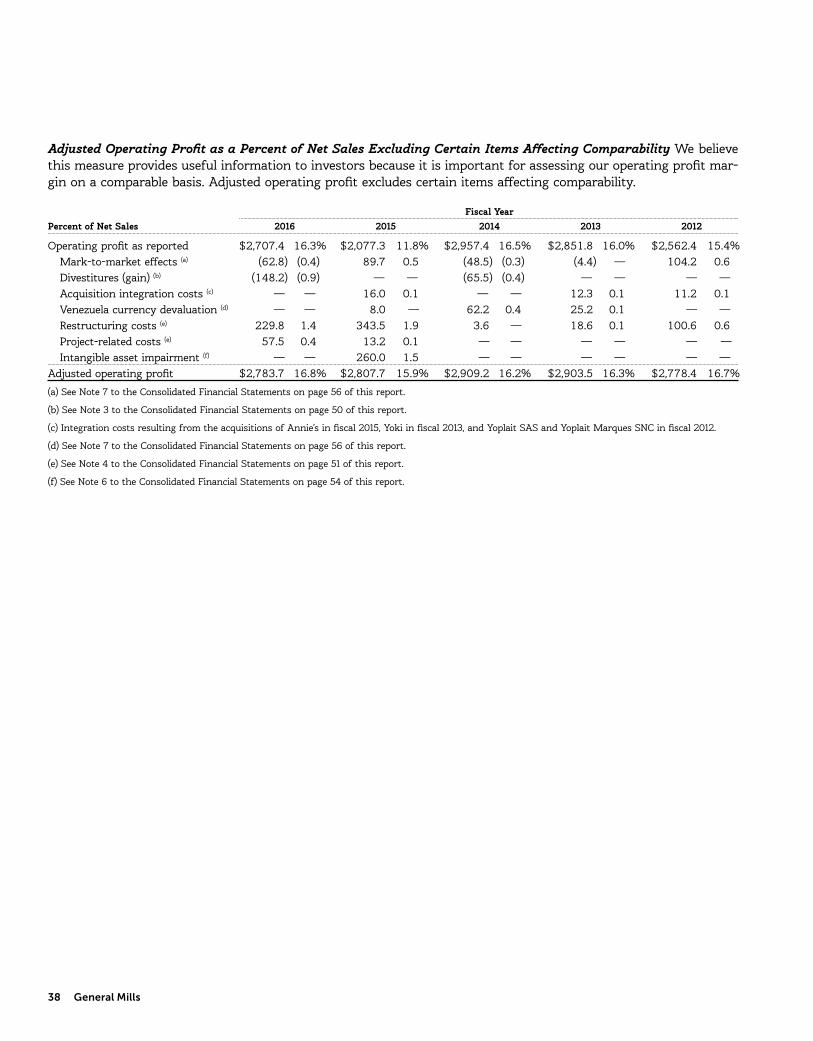
Adjusted Operating Profi t as a Percent of Net Sales Excluding Certain Items Aff ecting Comparability We believe this measure provides useful information to investors because it is important for assessing our operating profi t mar-gin on a comparable basis. Adjusted operating profi t excludes certain items aff ecting comparability.
Fiscal YearPercent of Net Sales 2016 2015 2014 2013 2012
Operating profi t as reported $2,707.4 16.3% $2,077.3 11.8% $2,957.4 16.5% $2,851.8 16.0% $2,562.4 15.4% Mark-to-market eff ects (a) (62.8) (0.4) 89.7 0.5 (48.5) (0.3) (4.4) — 104.2 0.6 Divestitures (gain) (b) (148.2) (0.9) — — (65.5) (0.4) — — — — Acquisition integration costs (c) — — 16.0 0.1 — — 12.3 0.1 11.2 0.1 Venezuela currency devaluation (d) — — 8.0 — 62.2 0.4 25.2 0.1 — — Restructuring costs (e) 229.8 1.4 343.5 1.9 3.6 — 18.6 0.1 100.6 0.6 Project-related costs (e) 57.5 0.4 13.2 0.1 — — — — — — Intangible asset impairment (f) — — 260.0 1.5 — — — — — —Adjusted operating profi t $2,783.7 16.8% $2,807.7 15.9% $2,909.2 16.2% $2,903.5 16.3% $2,778.4 16.7%
(a) See Note 7 to the Consolidated Financial Statements on page 56 of this report.
(b) See Note 3 to the Consolidated Financial Statements on page 50 of this report.
(c) Integration costs resulting from the acquisitions of Annie’s in fi scal 2015, Yoki in fi scal 2013, and Yoplait SAS and Yoplait Marques SNC in fi scal 2012.
(d) See Note 7 to the Consolidated Financial Statements on page 56 of this report.
(e) See Note 4 to the Consolidated Financial Statements on page 51 of this report.
(f) See Note 6 to the Consolidated Financial Statements on page 54 of this report.
38 General Mills

CAUTIONARY STATEMENT RELEVANT TO FORWARD-LOOKING INFORMATION FOR THE PURPOSE OF “SAFE HARBOR” PROVISIONS OF THE PRIVATE SECURITIES LITIGATION REFORM ACT OF 1995
Th is report contains or incorporates by reference for-ward-looking statements within the meaning of the Private Securities Litigation Reform Act of 1995 that are based on our current expectations and assumptions. We also may make written or oral forward-looking statements, including statements contained in our fi l-ings with the SEC and in our reports to shareholders.
The words or phrases “will likely result,” “are expected to,” “will continue,” “is anticipated,” “estimate,” “plan,” “project,” or similar expressions identify “for-ward-looking statements” within the meaning of the Private Securities Litigation Reform Act of 1995. Such statements are subject to certain risks and uncertain-ties that could cause actual results to diff er materially from historical results and those currently anticipated or projected. We wish to caution you not to place undue reliance on any such forward-looking statements.
In connection with the “safe harbor” provisions of the Private Securities Litigation Reform Act of 1995, we are identifying important factors that could aff ect our fi nancial performance and could cause our actual results in future periods to diff er materially from any current opinions or statements.
Our future results could be aff ected by a variety of factors, such as: competitive dynamics in the con-sumer foods industry and the markets for our products, including new product introductions, advertising activ-ities, pricing actions, and promotional activities of our competitors; economic conditions, including changes in infl ation rates, interest rates, tax rates, or the avail-ability of capital; product development and innovation; consumer acceptance of new products and product
improvements; consumer reaction to pricing actions and changes in promotion levels; acquisitions or dispo-sitions of businesses or assets; changes in capital struc-ture; changes in the legal and regulatory environment, including labeling and advertising regulations and liti-gation; impairments in the carrying value of goodwill, other intangible assets, or other long-lived assets, or changes in the useful lives of other intangible assets; changes in accounting standards and the impact of sig-nifi cant accounting estimates; product quality and safety issues, including recalls and product liability; changes in consumer demand for our products; eff ectiveness of advertising, marketing, and promotional programs; changes in consumer behavior, trends, and preferences, including weight loss trends; consumer perception of health-related issues, including obesity; consolidation in the retail environment; changes in purchasing and inventory levels of signifi cant customers; fl uctuations in the cost and availability of supply chain resources, including raw materials, packaging, and energy; disrup-tions or ineffi ciencies in the supply chain; eff ectiveness of restructuring and cost savings initiatives; volatility in the market value of derivatives used to manage price risk for certain commodities; benefi t plan expenses due to changes in plan asset values and discount rates used to determine plan liabilities; failure or breach of our information technology systems; foreign economic con-ditions, including currency rate fl uctuations; and politi-cal unrest in foreign markets and economic uncertainty due to terrorism or war.
You should also consider the risk factors that we identify in Item 1A of our 2016 Form 10-K, which could also aff ect our future results.
We undertake no obligation to publicly revise any forward-looking statements to refl ect events or circum-stances aft er the date of those statements or to refl ect the occurrence of anticipated or unanticipated events.
2016 Annual Report 39
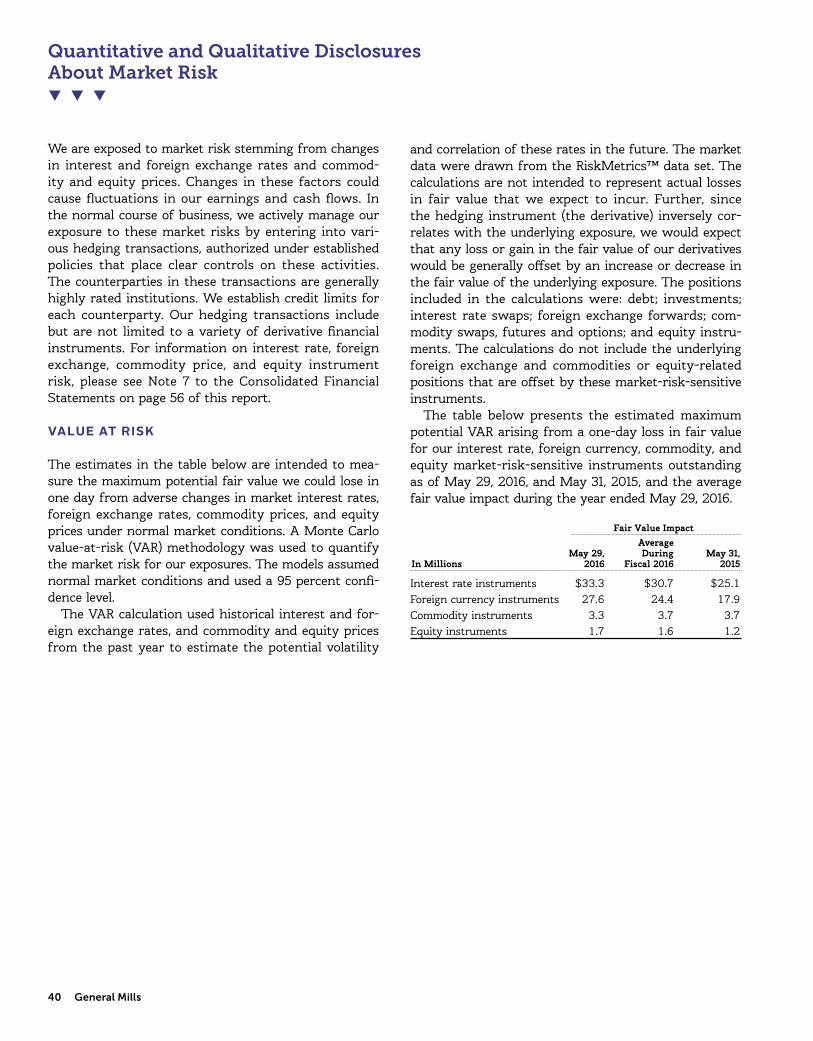
We are exposed to market risk stemming from changes in interest and foreign exchange rates and commod-ity and equity prices. Changes in these factors could cause fl uctuations in our earnings and cash fl ows. In the normal course of business, we actively manage our exposure to these market risks by entering into vari-ous hedging transactions, authorized under established policies that place clear controls on these activities. Th e counterparties in these transactions are generally highly rated institutions. We establish credit limits for each counterparty. Our hedging transactions include but are not limited to a variety of derivative fi nancial instruments. For information on interest rate, foreign exchange, commodity price, and equity instrument risk, please see Note 7 to the Consolidated Financial Statements on page 56 of this report.
VALUE AT RISK
Th e estimates in the table below are intended to mea-sure the maximum potential fair value we could lose in one day from adverse changes in market interest rates, foreign exchange rates, commodity prices, and equity prices under normal market conditions. A Monte Carlo value-at-risk (VAR) methodology was used to quantify the market risk for our exposures. Th e models assumed normal market conditions and used a 95 percent confi -dence level.
Th e VAR calculation used historical interest and for-eign exchange rates, and commodity and equity prices from the past year to estimate the potential volatility
and correlation of these rates in the future. Th e market data were drawn from the RiskMetrics™ data set. Th e calculations are not intended to represent actual losses in fair value that we expect to incur. Further, since the hedging instrument (the derivative) inversely cor-relates with the underlying exposure, we would expect that any loss or gain in the fair value of our derivatives would be generally off set by an increase or decrease in the fair value of the underlying exposure. Th e positions included in the calculations were: debt; investments; interest rate swaps; foreign exchange forwards; com-modity swaps, futures and options; and equity instru-ments. Th e calculations do not include the underlying foreign exchange and commodities or equity-related positions that are off set by these market-risk-sensitive instruments.
Th e table below presents the estimated maximum potential VAR arising from a one-day loss in fair value for our interest rate, foreign currency, commodity, and equity market-risk-sensitive instruments outstanding as of May 29, 2016, and May 31, 2015, and the average fair value impact during the year ended May 29, 2016.
Fair Value Impact Average May 29, During May 31,In Millions 2016 Fiscal 2016 2015
Interest rate instruments $33.3 $30.7 $25.1Foreign currency instruments 27.6 24.4 17.9Commodity instruments 3.3 3.7 3.7Equity instruments 1.7 1.6 1.2
Quantitative and Qualitative Disclosures About Market Risk
40 General Mills

REPORT OF MANAGEMENT RESPONSIBILITIES
Th e management of General Mills, Inc. is responsible for the fairness and accuracy of the consolidated fi nan-cial statements. Th e statements have been prepared in accordance with accounting principles that are gener-ally accepted in the United States, using management’s best estimates and judgments where appropriate. Th e fi nancial information throughout the Annual Report on Form 10-K is consistent with our consolidated fi nancial statements.
Management has established a system of inter-nal controls that provides reasonable assurance that assets are adequately safeguarded and transactions are recorded accurately in all material respects, in accor-dance with management’s authorization. We maintain a strong audit program that independently evaluates the adequacy and eff ectiveness of internal controls. Our internal controls provide for appropriate separation of duties and responsibilities, and there are documented policies regarding use of our assets and proper fi nancial reporting. Th ese formally stated and regularly commu-nicated policies demand highly ethical conduct from all employees.
Th e Audit Committee of the Board of Directors meets regularly with management, internal auditors, and our independent registered public accounting fi rm to review internal control, auditing, and fi nancial reporting mat-ters. Th e independent registered public accounting fi rm, internal auditors, and employees have full and free access to the Audit Committee at any time.
Th e Audit Committee reviewed and approved the Company’s annual financial statements. The Audit Committee recommended, and the Board of Directors approved, that the consolidated fi nancial statements be included in the Annual Report. Th e Audit Committee also appointed KPMG LLP to serve as the Company’s independent registered public accounting firm for fi scal 2017.
K. J. Powell D. L. Mulligan Chairman of the Board Executive Vice Presidentand Chief Executive Offi cer and Chief Financial Offi cer June 30, 2016
REPORT OF INDEPENDENT REGISTERED PUBLIC ACCOUNTING FIRM
Th e Board of Directors and Stockholders General Mills, Inc.:
We have audited the accompanying consolidated balance sheets of General Mills, Inc. and subsidiaries as of May 29, 2016 and May 31, 2015, and the related consolidated statements of earnings, comprehensive income, total equity and redeemable interest, and cash fl ows for each of the fi scal years in the three-year period ended May 29, 2016. In connection with our audits of the consolidated fi nancial statements, we have audited the accompany-ing fi nancial statement schedule. We also have audited General Mills, Inc.’s internal control over fi nancial report-ing as of May 29, 2016, based on criteria established in Internal Control – Integrated Framework (2013) issued by the Committee of Sponsoring Organizations of the Treadway Commission (COSO). General Mills, Inc.’s man-agement is responsible for these consolidated fi nancial statements and fi nancial statement schedule, for main-taining eff ective internal control over fi nancial reporting, and for its assessment of the eff ectiveness of internal control over fi nancial reporting, included in Item 9a Management’s Report on Internal Control over Financial Reporting in our 2016 Form 10-K. Our responsibility is to express an opinion on these consolidated fi nancial state-ments and fi nancial statement schedule and an opinion on the Company’s internal control over fi nancial report-ing based on our audits.
We conducted our audits in accordance with the standards of the Public Company Accounting Oversight Board (United States). Th ose standards require that we plan and perform the audits to obtain reasonable assur-ance about whether the fi nancial statements are free of material misstatement and whether eff ective internal control over fi nancial reporting was maintained in all material respects. Our audits of the consolidated fi nan-cial statements included examining, on a test basis, evi-dence supporting the amounts and disclosures in the fi nancial statements, assessing the accounting princi-ples used and signifi cant estimates made by manage-ment, and evaluating the overall fi nancial statement presentation. Our audit of internal control over fi nan-cial reporting included obtaining an understanding of internal control over fi nancial reporting, assessing the risk that a material weakness exists, and testing and
Reports of Management and Independent Registered Public Accounting Firm
2016 Annual Report 41

evaluating the design and operating eff ectiveness of internal control based on the assessed risk. Our audits also included performing such other procedures as we considered necessary in the circumstances. We believe that our audits provide a reasonable basis for our opinions.
A company’s internal control over fi nancial reporting is a process designed to provide reasonable assurance regarding the reliability of fi nancial reporting and the preparation of fi nancial statements for external pur-poses in accordance with generally accepted accounting principles. A company’s internal control over fi nancial reporting includes those policies and procedures that (1) pertain to the maintenance of records that, in rea-sonable detail, accurately and fairly refl ect the transac-tions and dispositions of the assets of the Company; (2) provide reasonable assurance that transactions are recorded as necessary to permit preparation of fi nan-cial statements in accordance with generally accepted accounting principles, and that receipts and expendi-tures of the Company are being made only in accor-dance with authorizations of management and directors of the Company; and (3) provide reasonable assurance regarding prevention or timely detection of unautho-rized acquisition, use, or disposition of the Company’s assets that could have a material eff ect on the fi nancial statements.
Because of its inherent limitations, internal control over financial reporting may not prevent or detect
misstatements. Also, projections of any evaluation of eff ectiveness to future periods are subject to the risk that controls may become inadequate because of changes in conditions, or that the degree of compliance with the policies or procedures may deteriorate.
In our opinion, the consolidated fi nancial statements referred to above present fairly, in all material respects, the fi nancial position of General Mills, Inc. and subsid-iaries as of May 29, 2016 and May 31, 2015, and the results of their operations and their cash fl ows for each of the fi scal years in the three-year period ended May 29, 2016, in conformity with U.S. generally accepted accounting principles. Also in our opinion, the accom-panying fi nancial statement schedule, when considered in relation to the basic consolidated fi nancial state-ments taken as a whole, presents fairly, in all material respects, the information set forth therein. Also in our opinion, General Mills, Inc. maintained, in all material respects, eff ective internal control over fi nancial report-ing as of May 29, 2016, based on criteria established in Internal Control – Integrated Framework (2013) issued by the Committee of Sponsoring Organizations of the Treadway Commission.
Minneapolis, MinnesotaJune 30, 2016
42 General Mills

Fiscal YearIn Millions, Except per Share Data 2016 2015 2014
Net sales $ 16,563.1 $ 17,630.3 $ 17,909.6 Cost of sales 10,733.6 11,681.1 11,539.8 Selling, general, and administrative expenses 3,118.9 3,328.0 3,474.3 Divestitures (gain) (148.2) — (65.5) Restructuring, impairment, and other exit costs 151.4 543.9 3.6Operating profi t 2,707.4 2,077.3 2,957.4 Interest, net 303.8 315.4 302.4Earnings before income taxes and aft er-tax earnings from joint ventures 2,403.6 1,761.9 2,655.0Income taxes 755.2 586.8 883.3Aft er-tax earnings from joint ventures 88.4 84.3 89.6Net earnings, including earnings attributable to redeemable and noncontrolling interests 1,736.8 1,259.4 1,861.3Net earnings attributable to redeemable and noncontrolling interests 39.4 38.1 36.9Net earnings attributable to General Mills $ 1,697.4 $ 1,221.3 $ 1,824.4Earnings per share - basic $ 2.83 $ 2.02 $ 2.90Earnings per share - diluted $ 2.77 $ 1.97 $ 2.83Dividends per share $ 1.78 $ 1.67 $ 1.55
See accompanying notes to consolidated fi nancial statements.
GENERAL MILLS, INC. AND SUBSIDIARIES
Consolidated Statements of Earnings
Fiscal YearIn Millions 2016 2015 2014
Net earnings, including earnings attributable to redeemable and noncontrolling interests $ 1,736.8 $ 1,259.4 $ 1,861.3Other comprehensive income (loss), net of tax: Foreign currency translation (108.7) (957.9) (11.3) Net actuarial income (loss) (325.9) (358.4) 206.0Other fair value changes: Securities 0.1 0.8 0.3 Hedge derivatives 16.0 4.1 5.0Reclassifi cation to earnings: Hedge derivatives (9.5) 4.9 (4.6) Amortization of losses and prior service costs 128.6 105.1 107.6Other comprehensive income (loss), net of tax (299.4) (1,201.4) 303.0Total comprehensive income 1,437.4 58.0 2,164.3 Comprehensive income (loss) attributable to redeemable and noncontrolling interests 41.5 (192.9) 94.9Comprehensive income attributable to General Mills $ 1,395.9 $ 250.9 $ 2,069.4
See accompanying notes to consolidated fi nancial statements.
GENERAL MILLS, INC. AND SUBSIDIARIES
Consolidated Statements of Comprehensive Income
2016 Annual Report 43

GENERAL MILLS, INC. AND SUBSIDIARIES
In Millions, Except Par Value May 29, 2016 May 31, 2015
ASSETSCurrent assets: Cash and cash equivalents $ 763.7 $ 334.2 Receivables 1,360.8 1,386.7 Inventories 1,413.7 1,540.9 Prepaid expenses and other current assets 399.0 423.8 Total current assets 3,937.2 3,685.6Land, buildings, and equipment 3,743.6 3,783.3Goodwill 8,741.2 8,874.9Other intangible assets 4,538.6 4,677.0Other assets 751.7 811.2 Total assets $ 21,712.3 $ 21,832.0
LIABILITIES AND EQUITYCurrent liabilities: Accounts payable $ 2,046.5 $ 1,684.0 Current portion of long-term debt 1,103.4 1,000.4 Notes payable 269.8 615.8 Other current liabilities 1,595.0 1,589.9 Total current liabilities 5,014.7 4,890.1Long-term debt 7,057.7 7,575.3Deferred income taxes 1,399.6 1,450.2Other liabilities 2,087.6 1,744.8 Total liabilities 15,559.6 15,660.4Redeemable interest 845.6 778.9Stockholders’ equity: Common stock, 754.6 shares issued, $0.10 par value 75.5 75.5 Additional paid-in capital 1,177.0 1,296.7 Retained earnings 12,616.5 11,990.8 Common stock in treasury, at cost, shares of 157.8 and 155.9 (6,326.6) (6,055.6) Accumulated other comprehensive loss (2,612.2) (2,310.7) Total stockholders’ equity 4,930.2 4,996.7Noncontrolling interests 376.9 396.0 Total equity 5,307.1 5,392.7Total liabilities and equity $ 21,712.3 $ 21,832.0
See accompanying notes to consolidated fi nancial statements.
Consolidated Balance Sheets
44 General Mills
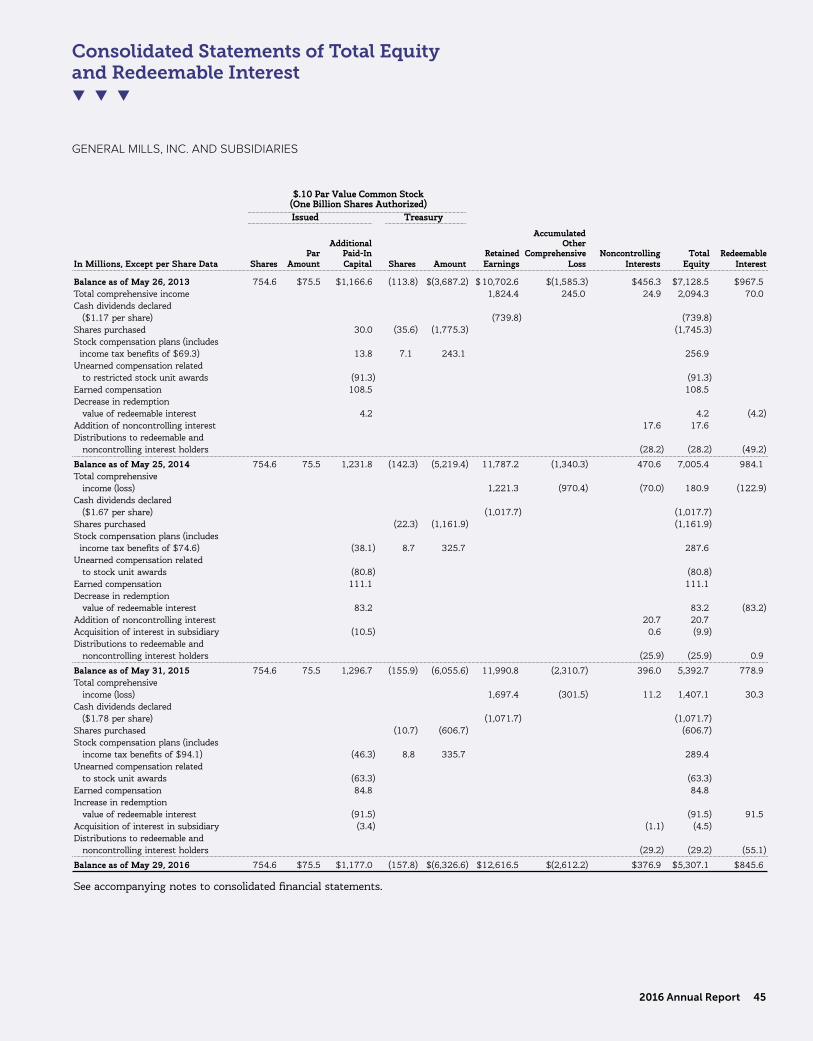
GENERAL MILLS, INC. AND SUBSIDIARIES
$.10 Par Value Common Stock (One Billion Shares Authorized) Issued Treasury
Accumulated Additional Other Par Paid-In Retained Comprehensive Noncontrolling Total RedeemableIn Millions, Except per Share Data Shares Amount Capital Shares Amount Earnings Loss Interests Equity Interest
Balance as of May 26, 2013 754.6 $75.5 $1,166.6 (113.8) $(3,687.2) $ 10,702.6 $(1,585.3) $456.3 $7,128.5 $967.5Total comprehensive income 1,824.4 245.0 24.9 2,094.3 70.0Cash dividends declared ($1.17 per share) (739.8) (739.8)Shares purchased 30.0 (35.6) (1,775.3) (1,745.3)Stock compensation plans (includes income tax benefi ts of $69.3) 13.8 7.1 243.1 256.9Unearned compensation related to restricted stock unit awards (91.3) (91.3)Earned compensation 108.5 108.5Decrease in redemption value of redeemable interest 4.2 4.2 (4.2)Addition of noncontrolling interest 17.6 17.6Distributions to redeemable and noncontrolling interest holders (28.2) (28.2) (49.2)
Balance as of May 25, 2014 754.6 75.5 1,231.8 (142.3) (5,219.4) 11,787.2 (1,340.3) 470.6 7,005.4 984.1Total comprehensive income (loss) 1,221.3 (970.4) (70.0) 180.9 (122.9)Cash dividends declared ($1.67 per share) (1,017.7) (1,017.7)Shares purchased (22.3) (1,161.9) (1,161.9)Stock compensation plans (includes income tax benefi ts of $74.6) (38.1) 8.7 325.7 287.6Unearned compensation related to stock unit awards (80.8) (80.8)Earned compensation 111.1 111.1Decrease in redemption value of redeemable interest 83.2 83.2 (83.2)Addition of noncontrolling interest 20.7 20.7Acquisition of interest in subsidiary (10.5) 0.6 (9.9)Distributions to redeemable and noncontrolling interest holders (25.9) (25.9) 0.9
Balance as of May 31, 2015 754.6 75.5 1,296.7 (155.9) (6,055.6) 11,990.8 (2,310.7) 396.0 5,392.7 778.9Total comprehensive income (loss) 1,697.4 (301.5) 11.2 1,407.1 30.3Cash dividends declared ($1.78 per share) (1,071.7) (1,071.7)Shares purchased (10.7) (606.7) (606.7)Stock compensation plans (includes income tax benefi ts of $94.1) (46.3) 8.8 335.7 289.4Unearned compensation related to stock unit awards (63.3) (63.3)Earned compensation 84.8 84.8Increase in redemption value of redeemable interest (91.5) (91.5) 91.5Acquisition of interest in subsidiary (3.4) (1.1) (4.5)Distributions to redeemable and noncontrolling interest holders (29.2) (29.2) (55.1)
Balance as of May 29, 2016 754.6 $75.5 $1,177.0 (157.8) $(6,326.6) $12,616.5 $(2,612.2) $376.9 $5,307.1 $845.6
See accompanying notes to consolidated fi nancial statements.
Consolidated Statements of Total Equity and Redeemable Interest
2016 Annual Report 45

GENERAL MILLS, INC. AND SUBSIDIARIES
Fiscal Year
In Millions 2016 2015 2014
Cash Flows - Operating Activities Net earnings, including earnings attributable to redeemable and noncontrolling interests $ 1,736.8 $ 1,259.4 $ 1,861.3 Adjustments to reconcile net earnings to net cash provided by operating activities: Depreciation and amortization 608.1 588.3 585.4 Aft er-tax earnings from joint ventures (88.4) (84.3) (89.6) Distributions of earnings from joint ventures 75.1 72.6 90.5 Stock-based compensation 89.8 106.4 108.5 Deferred income taxes 120.6 25.3 172.5 Tax benefi t on exercised options (94.1) (74.6) (69.3) Pension and other postretirement benefi t plan contributions (47.8) (49.5) (49.7) Pension and other postretirement benefi t plan costs 118.1 91.3 124.1 Divestitures (gain), net (148.2) — (65.5) Restructuring, impairment, and other exit costs 107.2 531.1 (18.8) Changes in current assets and liabilities, excluding the eff ects of acquisitions and divestitures 258.2 214.7 (32.2) Other, net (105.6) (137.9) (76.2) Net cash provided by operating activities 2,629.8 2,542.8 2,541.0Cash Flows - Investing Activities Purchases of land, buildings, and equipment (729.3) (712.4) (663.5) Acquisitions, net of cash acquired (84.0) (822.3) — Investments in affi liates, net 63.9 (102.4) (54.9) Proceeds from disposal of land, buildings, and equipment 4.4 11.0 6.6 Proceeds from divestitures 828.5 — 121.6 Exchangeable note 21.1 27.9 29.3 Other, net (11.2) (4.0) (0.9) Net cash provided (used) by investing activities 93.4 (1,602.2) (561.8)Cash Flows - Financing Activities Change in notes payable (323.8) (509.8) 572.9 Issuance of long-term debt 542.5 2,253.2 1,673.0 Payment of long-term debt (1,000.4) (1,145.8) (1,444.8) Proceeds from common stock issued on exercised options 171.9 163.7 108.1 Tax benefi t on exercised options 94.1 74.6 69.3 Purchases of common stock for treasury (606.7) (1,161.9) (1,745.3) Dividends paid (1,071.7) (1,017.7) (983.3) Addition of noncontrolling interest — — 17.6 Distributions to noncontrolling and redeemable interest holders (84.3) (25.0) (77.4) Other, net (7.2) (16.1) (14.2) Net cash used by fi nancing activities (2,285.6) (1,384.8) (1,824.1)Eff ect of exchange rate changes on cash and cash equivalents (8.1) (88.9) (29.2)Increase (decrease) in cash and cash equivalents 429.5 (533.1) 125.9Cash and cash equivalents - beginning of year 334.2 867.3 741.4Cash and cash equivalents - end of year $ 763.7 $ 334.2 $ 867.3Cash Flow from Changes in Current Assets and Liabilities, excluding the eff ects of acquisitions and divestitures: Receivables $ (6.9) $ 6.8 $ (41.0) Inventories (146.1) (24.2) (88.3) Prepaid expenses and other current assets (0.1) (50.5) 10.5 Accounts payable 318.7 145.8 191.5 Other current liabilities 92.6 136.8 (104.9)Changes in current assets and liabilities $ 258.2 $ 214.7 $ (32.2)
See accompanying notes to consolidated fi nancial statements.
Consolidated Statements of Cash Flows
46 General Mills

GENERAL MILLS, INC. AND SUBSIDIARIES
NOTE 1. BASIS OF PRESENTATION AND RECLASSIFICATIONS
Basis of Presentation Our Consolidated Financial Statements include the accounts of General Mills, Inc. and all subsidiaries in which we have a controlling financial interest. Intercompany transactions and accounts, including any noncontrolling and redeemable interests’ share of those transactions, are eliminated in consolidation.
Our fi scal year ends on the last Sunday in May. Fiscal years 2016 and 2014 consisted of 52 weeks, while fi scal year 2015 consisted of 53 weeks.
Change in Reporting Period As part of a long-term plan to conform the fi scal year ends of all our opera-tions, in fi scal 2016 we changed the reporting period of Yoplait SAS and Yoplait Marques SNC within our International segment and Annie’s, Inc. (Annie’s) within our U.S. Retail segment from an April fi scal year-end to a May fi scal year-end to match our fi scal calen-dar. Accordingly, in fi scal 2016, our results included 13 months of results from the aff ected operations. Th e impact of these changes was not material to our con-solidated results of operations. Our General Mills Brasil Alimentos Ltda (Yoki) and India businesses remain on an April fi scal year end.
Certain reclassifi cations to our previously reported fi nancial information have been made to conform to the current period presentation.
NOTE 2. SUMMARY OF SIGNIFICANT ACCOUNTING POLICIES
Cash and Cash Equivalents We consider all invest-ments purchased with an original maturity of three months or less to be cash equivalents.
Inventories All inventories in the United States other than grain are valued at the lower of cost, using the last-in, fi rst-out (LIFO) method, or market. Grain inven-tories and all related cash contracts and derivatives are valued at market with all net changes in value recorded in earnings currently.
Inventories outside of the United States are generally valued at the lower of cost, using the fi rst-in, fi rst-out (FIFO) method, or market.
Shipping costs associated with the distribution of fi nished product to our customers are recorded as cost of sales, and are recognized when the related fi nished product is shipped to and accepted by the customer.
Land, Buildings, Equipment, and Depreciation Land is recorded at historical cost. Buildings and equipment, including capitalized interest and internal engineering costs, are recorded at cost and depreciated over esti-mated useful lives, primarily using the straight-line method. Ordinary maintenance and repairs are charged to cost of sales. Buildings are usually depreciated over 40 years, and equipment, furniture, and soft ware are usually depreciated over 3 to 10 years. Fully depreciated assets are retained in buildings and equipment until disposal. When an item is sold or retired, the accounts are relieved of its cost and related accumulated depre-ciation and the resulting gains and losses, if any, are recognized in earnings. As of May 29, 2016, assets held for sale were insignifi cant.
Long-lived assets are reviewed for impairment when-ever events or changes in circumstances indicate that the carrying amount of an asset (or asset group) may not be recoverable. An impairment loss would be recog-nized when estimated undiscounted future cash fl ows from the operation and disposition of the asset group are less than the carrying amount of the asset group. Asset groups have identifi able cash fl ows and are largely independent of other asset groups. Measurement of an impairment loss would be based on the excess of the carrying amount of the asset group over its fair value. Fair value is measured using a discounted cash fl ow model or independent appraisals, as appropriate.
Goodwill and Other Intangible Assets Goodwill is not subject to amortization and is tested for impairment annually and whenever events or changes in circum-stances indicate that impairment may have occurred. In fi scal 2016, we changed the date of our annual goodwill and indefi nite-lived intangible asset impairment assess-ment from the fi rst day of the third quarter to the fi rst day of the second quarter to more closely align with the timing of our annual long-range planning process. Impairment testing is performed for each of our report-ing units. We compare the carrying value of a reporting unit, including goodwill, to the fair value of the unit. Carrying value is based on the assets and liabilities associated with the operations of that reporting unit, which oft en requires allocation of shared or corporate
Notes to Consolidated Financial Statements
2016 Annual Report 47

items among reporting units. If the carrying amount of a reporting unit exceeds its fair value, we revalue all assets and liabilities of the reporting unit, excluding goodwill, to determine if the fair value of the net assets is greater than the net assets including goodwill. If the fair value of the net assets is less than the carrying amount of net assets including goodwill, impairment has occurred. Our estimates of fair value are deter-mined based on a discounted cash fl ow model. Growth rates for sales and profi ts are determined using inputs from our long-range planning process. We also make estimates of discount rates, perpetuity growth assump-tions, market comparables, and other factors.
We evaluate the useful lives of our other intangible assets, mainly brands, to determine if they are fi nite or indefi nite-lived. Reaching a determination on useful life requires signifi cant judgments and assumptions regard-ing the future eff ects of obsolescence, demand, compe-tition, other economic factors (such as the stability of the industry, known technological advances, legislative action that results in an uncertain or changing regula-tory environment, and expected changes in distribution channels), the level of required maintenance expendi-tures, and the expected lives of other related groups of assets. Intangible assets that are deemed to have defi -nite lives are amortized on a straight-line basis, over their useful lives, generally ranging from 4 to 30 years.
Our indefi nite-lived intangible assets, mainly intan-gible assets primarily associated with the Pillsbury, Totino’s, Progresso, Yoplait, Old El Paso, Yoki, Häagen-Dazs, and Annie’s brands, are also tested for impairment annually and whenever events or changes in circumstances indicate that their carrying value may not be recoverable. Our estimate of the fair value of the brands is based on a discounted cash fl ow model using inputs which included projected revenues from our long-range plan, assumed royalty rates that could be payable if we did not own the brands, and a dis-count rate.
Our fi nite-lived intangible assets, primarily acquired franchise agreements and customer relationships, are reviewed for impairment whenever events or changes in circumstances indicate that the carrying amount of an asset may not be recoverable. An impairment loss would be recognized when estimated undiscounted future cash fl ows from the operation and disposition of the asset are less than the carrying amount of the asset. Assets generally have identifi able cash fl ows and are largely independent of other assets. Measurement
of an impairment loss would be based on the excess of the carrying amount of the asset over its fair value. Fair value is measured using a discounted cash fl ow model or other similar valuation model, as appropriate.
Investments in Unconsolidated Joint Ventures Our investments in companies over which we have the abil-ity to exercise signifi cant infl uence are stated at cost plus our share of undistributed earnings or losses. We receive royalty income from certain joint ventures, incur various expenses (primarily research and develop-ment), and record the tax impact of certain joint ven-ture operations that are structured as partnerships. In addition, we make advances to our joint ventures in the form of loans or capital investments. We also sell certain raw materials, semi-fi nished goods, and fi nished goods to the joint ventures, generally at market prices.
In addition, we assess our investments in our joint ventures if we have reason to believe an impairment may have occurred including, but not limited to, as a results of ongoing operating losses, projected decreases in earnings, increases in the weighted average cost of capital, or signifi cant business disruptions. Th e signif-icant assumptions used to estimate fair value include revenue growth and profi tability, royalty rates, capi-tal spending, depreciation and taxes, foreign currency exchange rates, and a discount rate. By their nature, these projections and assumptions are uncertain. If we were to determine the current fair value of our invest-ment was less than the carrying value of the invest-ment, then we would assess if the shortfall was of a temporary or permanent nature and write down the investment to its fair value if we concluded the impair-ment is other than temporary.
Redeemable Interest We have a 51 percent controlling interest in Yoplait SAS, a consolidated entity. Sodiaal International (Sodiaal) holds the remaining 49 percent interest in Yoplait SAS. Sodiaal has the ability to put all or a portion of its redeemable interest to us at fair value once per year, up to three times before December 2024. Th is put option requires us to classify Sodiaal’s interest as a redeemable interest outside of equity on our Consolidated Balance Sheets for as long as the put is exercisable by Sodiaal. When the put is no longer exercisable, the redeemable interest will be reclassifi ed to noncontrolling interests on our Consolidated Balance Sheets. We adjust the value of the redeemable interest through additional paid-in capital on our Consolidated
48 General Mills

Balance Sheets quarterly to the redeemable interest’s redemption value, which approximates its fair value. During the second quarter of fi scal 2016, we adjusted the redeemable interest’s redemption value based on a discounted cash fl ow model. Th e signifi cant assump-tions used to estimate the redemption value include projected revenue growth and profi tability from our long-range plan, capital spending, depreciation, taxes, foreign currency exchange rates, and a discount rate.
Revenue Recognition We recognize sales revenue when the shipment is accepted by our customer. Sales include shipping and handling charges billed to the customer and are reported net of consumer coupon redemption, trade promotion and other costs, including estimated allowances for returns, unsalable product, and prompt pay discounts. Sales, use, value-added, and other excise taxes are not recognized in revenue. Coupons are recorded when distributed, based on estimated redemp-tion rates. Trade promotions are recorded based on esti-mated participation and performance levels for off ered programs at the time of sale. We generally do not allow a right of return. However, on a limited case-by-case basis with prior approval, we may allow customers to return product. In limited circumstances, product returned in saleable condition is resold to other cus-tomers or outlets. Receivables from customers gener-ally do not bear interest. Terms and collection patterns vary around the world and by channel. Th e allowance for doubtful accounts represents our estimate of prob-able non-payments and credit losses in our existing receivables, as determined based on a review of past due balances and other specifi c account data. Account balances are written off against the allowance when we deem the amount is uncollectible.
Environmental Environmental costs relating to exist-ing conditions caused by past operations that do not contribute to current or future revenues are expensed. Liabilities for anticipated remediation costs are recorded on an undiscounted basis when they are probable and reasonably estimable, generally no later than the com-pletion of feasibility studies or our commitment to a plan of action.
Advertising Production Costs We expense the produc-tion costs of advertising the fi rst time that the adver-tising takes place.
Research and Development All expenditures for research and development (R&D) are charged against earnings in the period incurred. R&D includes expen-ditures for new product and manufacturing process innovation, and the annual expenditures are comprised primarily of internal salaries, wages, consulting, and supplies attributable to R&D activities. Other costs include depreciation and maintenance of research facil-ities, including assets at facilities that are engaged in pilot plant activities.
Foreign Currency Translation For all significant foreign operations, the functional currency is the local currency. Assets and liabilities of these opera-tions are translated at the period-end exchange rates. Income statement accounts are translated using the average exchange rates prevailing during the period. Translation adjustments are refl ected within accumu-lated other comprehensive loss (AOCI) in stockholders’ equity. Gains and losses from foreign currency transac-tions are included in net earnings for the period, except for gains and losses on investments in subsidiaries for which settlement is not planned for the foreseeable future and foreign exchange gains and losses on instru-ments designated as net investment hedges. Th ese gains and losses are recorded in AOCI.
Derivative Instruments All derivatives are recognized on our Consolidated Balance Sheets at fair value based on quoted market prices or our estimate of their fair value, and are recorded in either current or noncurrent assets or liabilities based on their maturity. Changes in the fair values of derivatives are recorded in net earn-ings or other comprehensive income, based on whether the instrument is designated and eff ective as a hedge transaction and, if so, the type of hedge transaction. Gains or losses on derivative instruments reported in AOCI are reclassifi ed to earnings in the period the hedged item aff ects earnings. If the underlying hedged transaction ceases to exist, any associated amounts reported in AOCI are reclassifi ed to earnings at that time. Any ineff ectiveness is recognized in earnings in the current period.
Stock-based Compensation We generally measure compensation expense for grants of restricted stock units using the value of a share of our stock on the date of grant. We estimate the value of stock option grants using a Black-Scholes valuation model. Stock-based
2016 Annual Report 49
compensation is recognized straight line over the vest-ing period. Our stock-based compensation expense is recorded in selling, general and administrative (SG&A) expenses and cost of sales in our Consolidated Statements of Earnings and allocated to each report-able segment in our segment results.
Certain equity-based compensation plans contain provisions that accelerate vesting of awards upon retirement, termination, or death of eligible employees and directors. We consider a stock-based award to be vested when the employee’s retention of the award is no longer contingent on providing subsequent service. Accordingly, the related compensation cost is generally recognized immediately for awards granted to retire-ment-eligible individuals or over the period from the grant date to the date retirement eligibility is achieved, if less than the stated vesting period.
We report the benefi ts of tax deductions in excess of recognized compensation cost as a fi nancing cash fl ow, thereby reducing net operating cash fl ows and increas-ing net fi nancing cash fl ows.
Defined Benefit Pension, Other Postretirement Benefi t, and Postemployment Benefi t Plans We spon-sor several domestic and foreign defi ned benefi t plans to provide pension, health care, and other welfare ben-efi ts to retired employees. Under certain circumstances, we also provide accruable benefi ts to former or inactive employees in the United States, Canada, and Mexico and members of our Board of Directors, including sever-ance and certain other benefi ts payable upon death. We recognize an obligation for any of these benefi ts that vest or accumulate with service. Postemployment ben-efi ts that do not vest or accumulate with service (such as severance based solely on annual pay rather than years of service) are charged to expense when incurred. Our postemployment benefi t plans are unfunded.
We recognize the underfunded or overfunded status of a defi ned benefi t pension plan as an asset or liability and recognize changes in the funded status in the year in which the changes occur through AOCI.
Use of Estimates Preparing our Consolidated Financial Statements in conformity with accounting principles generally accepted in the United States requires us to make estimates and assumptions that aff ect reported amounts of assets and liabilities, disclosures of contin-gent assets and liabilities at the date of the fi nancial statements, and the reported amounts of revenues and
expenses during the reporting period. Th ese estimates include our accounting for promotional expenditures, valuation of long-lived assets, intangible assets, redeem-able interest, stock-based compensation, income taxes, and defi ned benefi t pension, other postretirement ben-efi t and postemployment benefi t plans. Actual results could diff er from our estimates.
Other New Accounting Standards In the fi rst quar-ter of fi scal 2015, we adopted new accounting require-ments on the financial statement presentation of unrecognized tax benefi ts when a net operating loss, a similar tax loss, or a tax credit carryforward exists. Th e adoption of this guidance did not have an impact on our results of operations or fi nancial position.
In the second quarter of fi scal 2015, we adopted new accounting requirements for share-based payment awards issued based upon specifi c performance targets. Th e adoption of this guidance did not have a material impact on our results of operations or fi nancial position.
In the fi rst quarter of fi scal 2016, we adopted new accounting requirements for the classifi cation of debt issuance costs presented in the balance sheet as a direct reduction from the carrying amount of the debt liability. This presentation change has been imple-mented retroactively. Th e adoption of this guidance did not have a material impact on our fi nancial position.
In the fourth quarter of fiscal 2016, we adopted new accounting requirements for the presentation of deferred tax assets and liabilities, requiring noncurrent classifi cation for all deferred tax assets and liabilities on the statement of fi nancial position. Th is presentation change has been implemented retroactively. Th e adop-tion of this guidance did not have a material impact on our fi nancial position.
NOTE 3. ACQUISITION AND DIVESTITURES
During the fourth quarter of fi scal 2016, we sold our General Mills de Venezuela CA subsidiary to a third party and exited our business in Venezuela. As a result of this transaction, we recorded a pre-tax loss of $37.6 million. In addition, we sold our General Mills Argentina S.A. foodservice business in Argentina to a third party and recorded a pre-tax loss of $14.8 million.
During the second quarter of fi scal 2016, we sold our North American Green Giant product lines for $822.7 million in cash, and we recorded a pre-tax gain of $199.1 million. We received net cash proceeds of $788.0 million
50 General Mills

aft er transaction related costs. Aft er the divestiture, we retained a brand intangible asset on our Consolidated Balance Sheets of $30.1 million related to our continued use of the Green Giant brand in certain markets out-side of North America.
During the second quarter of fi scal 2015, we acquired Annie’s, a publicly traded food company headquartered in Berkeley, California, for an aggregate purchase price of $821.2 million, which we funded by issuing debt. We consolidated Annie’s into our Consolidated Balance Sheets and recorded goodwill of $589.8 million, an indefi nite lived intangible asset for the Annie’s brand of $244.5 million, and a fi nite lived customer relationship asset of $23.9 million. Th e pro forma eff ects of this acquisition were not material.
NOTE 4. RESTRUCTURING, IMPAIRMENT, AND OTHER EXIT COSTS
Intangible Asset Impairment In fiscal 2015, we recorded a $260.0 million charge related to the impair-ment of our Green Giant brand intangible asset in restructuring, impairment, and other exit costs. See Note 6 for additional information.
Restructuring Initiatives We view our restructuring activities as actions that help us meet our long-term growth targets. Activities we undertake must meet internal rate of return and net present value targets. Each restructuring action normally takes one to two years to complete. At completion (or as each major stage is completed in the case of multi-year programs), the project begins to deliver cash savings and/or reduced depreciation. Th ese activities result in various restruc-turing costs, including asset write-off s, exit charges including severance, contract termination fees, and decommissioning and other costs. Accelerated depre-ciation associated with restructured assets, as used in the context of our disclosures regarding restructuring activity, refers to the increase in depreciation expense caused by shortening the useful life or updating the salvage value of depreciable fi xed assets to coincide with the end of production under an approved restruc-turing plan. Any impairment of the asset is recognized immediately in the period the plan is approved.
We are currently pursuing several multi-year restruc-turing initiatives designed to increase our effi ciency and focus our business behind our key growth strate-gies. Charges recorded in fi scal 2016 and 2015 related to these initiatives were as follows:
Fiscal 2016 Fiscal 2015 Asset Pension Accelerated Asset Pension AcceleratedIn Millions Severance Write-off s Related Depreciation Other Total Severance Write-off s Related Depreciation Other Total
Project Compass $ 45.4 $ — $ 1.4 $ — $ 7.9 $ 54.7 $ — $ — $ — $ — $ — $ —Project Catalyst (8.7) 1.2 — — — (7.5) 121.5 12.3 6.6 — 8.0 148.4Project Century 30.9 30.7 19.1 76.5 25.4 182.6 44.3 42.3 31.2 53.1 10.9 181.8Combination of certain operational facilities — — — — — — 13.0 0.7 — — 0.2 13.9Charges associated with restructuring actions previously announced — — — — — — (0.6) — — — — (0.6)Total $ 67.6 $ 31.9 $ 20.5 $ 76.5 $ 33.3 $ 229.8 $ 178.2 $ 55.3 $ 37.8 $ 53.1 $ 19.1 $ 343.5
2016 Annual Report 51

In the fi rst quarter of fi scal 2016, we approved Project Compass, a restructuring plan designed to enable our International segment to accelerate long-term growth through increased organizational effectiveness and reduced administrative expense. In connection with this project, we expect to eliminate approximately 725 to 775 positions. We expect to incur approximately $60 million of net expenses relating to this action of which approximately $60 million will be cash. We recorded $54.7 million of restructuring charges relating to this action in fi scal 2016. We expect this action to be com-pleted by the end of fi scal 2017.
Project Century (Century) began in fi scal 2015 as a review of our North American manufacturing and dis-tribution network to streamline operations and identify potential capacity reductions. In the second quarter of fi scal 2016, we broadened the scope of Project Century to identify opportunities to streamline our supply chain outside of North America. As part of the expanded project, we approved a restructuring plan to close man-ufacturing facilities in our International segment sup-ply chain located in Berwick, United Kingdom and East Tamaki, New Zealand. Th ese actions aff ected approxi-mately 285 positions. We expect to incur total restruc-turing charges of approximately $41 million relating to these actions, of which approximately $20 million will be cash. We recorded $30.0 million of restructur-ing charges relating to these actions in fi scal 2016. We expect these actions to be completed by the end of fi s-cal 2018.
As part of Century, in the first quarter of fiscal 2016, we approved a restructuring plan to close our West Chicago, Illinois cereal and dry dinner manufac-turing plant in our U.S. Retail segment supply chain. Th is action will aff ect approximately 500 positions, and we expect to incur approximately $117 million of net expenses relating to this action, of which approxi-mately $53 million will be cash. We recorded $79.2 mil-lion of restructuring charges relating to this action in fi scal 2016. We expect this action to be completed by the end of fi scal 2019.
As part of Century, in the fi rst quarter of fi scal 2016, we approved a restructuring plan to close our Joplin, Missouri snacks plant in our U.S. Retail segment supply chain. Th is action aff ected approximately 120 positions, and we incurred $6.3 million of net expenses relating to this action, of which less than $1 million was cash. We recorded $6.3 million of restructuring charges relating
to this action in fi scal 2016. Th is action was completed in fi scal 2016.
As part of Century, in the third quarter of fi scal 2015, we approved a restructuring plan to reduce our refrig-erated dough capacity and exit our Midland, Ontario, Canada and New Albany, Indiana facilities, which sup-port our U.S. Retail, International, and Convenience Stores and Foodservice supply chains. Th e Midland action will affect approximately 100 positions, and we expect to incur approximately $23 million of net expenses relating to this action, of which approxi-mately $16 million will be cash. We recorded $2.7 mil-lion of restructuring charges relating to this action in fi scal 2016. We recorded $6.5 million of restructuring charges relating to this action in fi scal 2015. Th e New Albany action will aff ect approximately 400 positions, and we expect to incur approximately $82 million of net expenses relating to this action of which approxi-mately $40 million will be cash. We recorded $17.1 mil-lion of restructuring charges relating to this action in fi scal 2016 and $51.3 million in fi scal 2015. We expect these actions to be completed by the end of fi scal 2018.
As part of Century, in the second quarter of fi scal 2015, we approved a restructuring plan to consolidate yogurt manufacturing capacity and exit our Methuen, Massachusetts facility in our U.S. Retail segment and Convenience Stores and Foodservice segment supply chains. Th is action aff ected approximately 175 posi-tions. We expect to incur approximately $58 million of net expenses relating to this action of which approxi-mately $12 million will be cash. We recorded $15.6 mil-lion of restructuring charges relating to this action in fi scal 2016 and $43.6 million in fi scal 2015. Th is action was largely completed in fi scal 2016.
As part of Century, in the second quarter of fi s-cal 2015, we approved a restructuring plan to elimi-nate excess cereal and dry mix capacity and exit our Lodi, California facility in our U.S. Retail supply chain. Th is action aff ected approximately 430 positions. We incurred $93.8 million of net expenses relating to this action of which $20 million was cash. We recorded $30.6 million of restructuring charges relating to this action in fi scal 2016 and $63.2 million in fi scal 2015. Th is action was completed in fi scal 2016.
In addition to the actions taken at certain facilities described above, we incurred $1.1 million of restructur-ing charges in fi scal 2016, relating to Century, and $17.2 million in fi scal 2015, of which $6 million was cash.
52 General Mills

During the second quarter of fi scal 2015, we approved Project Catalyst, a restructuring plan to increase orga-nizational eff ectiveness and reduce overhead expense. In connection with this project, we eliminated approx-imately 750 positions primarily in the United States. We incurred $140.9 million of net expenses relating to these actions of which $118 million will be cash. In fi s-cal 2016, we reduced the estimate of charges related to this action by $7.5 million. We recorded $148.4 million of restructuring charges relating to this action in fi s-cal 2015. Th ese actions were largely completed in fi scal 2015.
During the fi rst quarter of fi scal 2015, we approved a plan to combine certain Yoplait and General Mills operational facilities within our International segment to increase effi ciencies and reduce costs. Th is action will aff ect approximately 240 positions. We expect to incur approximately $15 million of net expenses relat-ing to this action of which approximately $12 million will be cash. We recorded $13.9 million of restructuring charges relating to this action in fi scal 2015. We expect this action to be completed in fi scal 2017.
In fi scal 2014, we recorded $3.6 million of restruc-turing charges related to a productivity and cost sav-ings plan approved in the fourth quarter of fi scal 2012. Th ese restructuring actions were completed in fi scal 2014.
In fi scal 2016, we paid $122.6 million in cash relating to restructuring initiatives. In fi scal 2015, we paid $63.6 million in cash relating to restructuring initiatives. In fi scal 2014, we paid $22.4 million in cash related to restructuring actions.
In addition to restructuring charges, we expect to incur approximately $109 million of additional proj-ect-related costs, which will be recorded in cost of sales, all of which will be cash. We recorded project-related costs in cost of sales of $57.5 million in fi scal 2016 and $13.2 million in fi scal 2015. In addition, we paid $54.5 million in cash in fi scal 2016 and $9.7 million in fi scal 2015 for project-related costs.
Restructuring charges and project-related costs are classifi ed in our Consolidated Statements of Earnings as follows:
Fiscal YearIn Millions 2016 2015 2014
Cost of sales $ 78.4 $ 59.6 $ —Restructuring, impairment, and other exit costs 151.4 283.9 3.6Total restructuring charges 229.8 343.5 3.6Project-related costs classifi ed in cost of sales $ 57.5 $ 13.2 $ —
Th e roll forward of our restructuring and other exit cost reserves, included in other current liabilities, is as follows:
Contract Other In Millions Severance Termination Exit Costs Total
Reserve balance as of May 26, 2013 $ 19.5 $ — $ — $ 19.52014 charges, including foreign currency translation 6.4 — — 6.4Utilized in 2014 (22.4) — — (22.4)Reserve balance as of May 25, 2014 3.5 — — 3.52015 charges, including foreign currency translation 176.4 0.6 8.1 185.1Utilized in 2015 (61.3) — (6.5) (67.8)Reserve balance as of May 31, 2015 118.6 0.6 1.6 120.82016 charges, including foreign currency translation 64.3 1.6 4.3 70.2Utilized in 2016 (109.3) (0.7) (4.4) (114.4)Reserve balance as of May 29, 2016 $ 73.6 $1.5 $1.5 $ 76.6
Th e charges recognized in the roll forward of our reserves for restructuring and other exit costs do not include items charged directly to expense (e.g., asset impairment charges, the gain or loss on the sale of restructured assets, and the write-off of spare parts) and other periodic exit costs recognized as incurred, as those items are not refl ected in our restructuring and other exit cost reserves on our Consolidated Balance Sheets.
2016 Annual Report 53

NOTE 5. INVESTMENTS IN UNCONSOLIDATED JOINT VENTURES
We have a 50 percent equity interest in Cereal Partners Worldwide (CPW), which manufactures and markets ready-to-eat cereal products in more than 130 coun-tries outside the United States and Canada. CPW also markets cereal bars in several European countries and manufactures private label cereals for customers in the United Kingdom. We have guaranteed a portion of CPW’s debt and its pension obligation in the United Kingdom.
We also have a 50 percent equity interest in Häagen-Dazs Japan, Inc. (HDJ). Th is joint venture manufactures and markets Häagen-Dazs ice cream products and fro-zen novelties.
Results from our CPW and HDJ joint ventures are reported for the 12 months ended March 31.
Joint venture related balance sheet activity follows:
May 29, May 31, In Millions 2016 2015
Cumulative investments $518.9 $530.6Goodwill and other intangibles 469.2 465.1Aggregate advances included in cumulative investments 300.3 390.3
Joint venture earnings and cash fl ow activity follows:
Fiscal Year
In Millions 2016 2015 2014
Sales to joint ventures $ 10.5 $ 11.6 $12.1Net advances (repayments) (63.9) 102.4 54.9Dividends received 75.1 72.6 90.5
Summary combined fi nancial information for the joint ventures on a 100 percent basis follows:
Fiscal YearIn Millions 2016 2015 2014
Net sales: CPW $1,674.8 $1,894.5 $2,107.9 HDJ 369.4 370.2 386.9Total net sales 2,044.2 2,264.7 2,494.8Gross margin 867.6 925.4 1,030.3Earnings before income taxes 234.8 220.9 219.1Earnings aft er income taxes 186.7 170.7 168.8
May 29, May 31, In Millions 2016 2015
Current assets $ 814.1 $ 800.1Noncurrent assets 959.9 962.1Current liabilities 1,457.3 1,484.8Noncurrent liabilities 81.7 118.2
NOTE 6. GOODWILL AND OTHER INTANGIBLE ASSETS
Th e components of goodwill and other intangible assets are as follows: May 29, May 31, In Millions 2016 2015
Goodwill $ 8,741.2 $ 8,874.9Other intangible assets: Intangible assets not subject to amortization: Brands and other indefi nite-lived intangibles 4,147.5 4,262.1 Intangible assets subject to amortization: Franchise agreements, customer relationships, and other fi nite-lived intangibles 536.9 544.0 Less accumulated amortization (145.8) (129.1) Intangible assets subject to amortization 391.1 414.9Other intangible assets 4,538.6 4,677.0Total $13,279.8 $13,551.9
Based on the carrying value of fi nite-lived intangi-ble assets as of May 29, 2016, amortization expense for each of the next fi ve fi scal years is estimated to be approximately $28 million.
54 General Mills
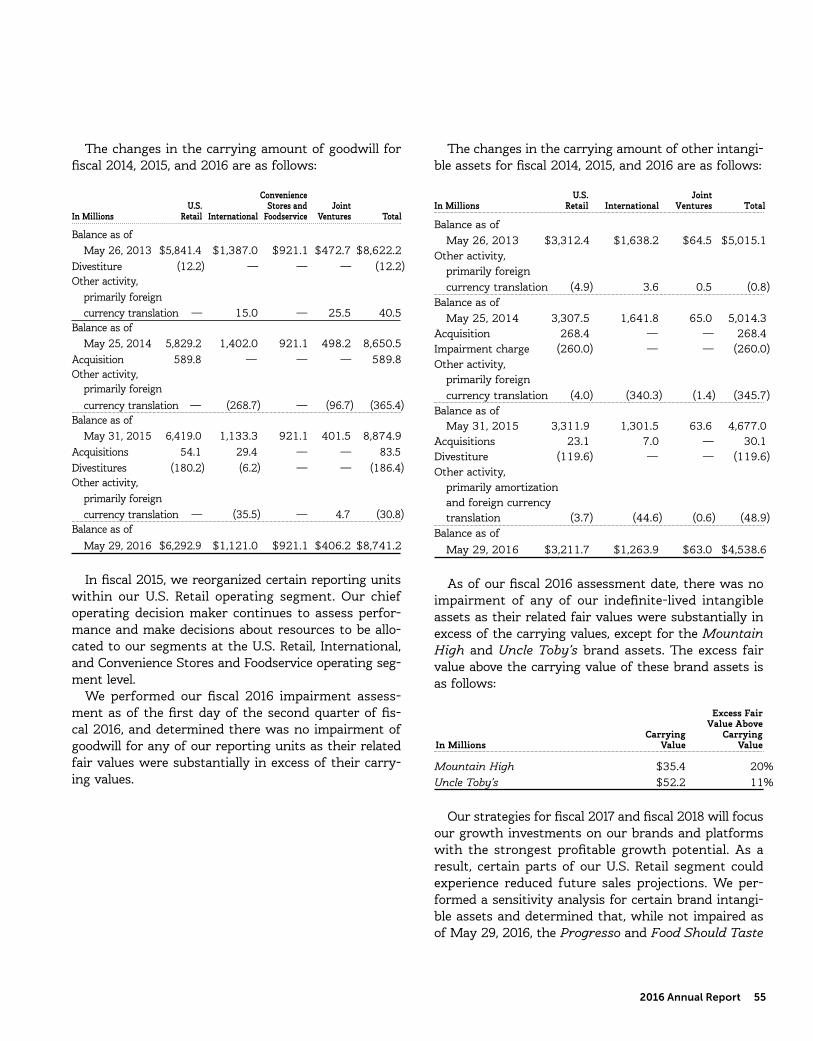
Th e changes in the carrying amount of goodwill for fi scal 2014, 2015, and 2016 are as follows:
Convenience U.S. Stores and JointIn Millions Retail International Foodservice Ventures Total
Balance as of May 26, 2013 $5,841.4 $1,387.0 $921.1 $472.7 $8,622.2Divestiture (12.2) — — — (12.2)Other activity, primarily foreign currency translation — 15.0 — 25.5 40.5Balance as of May 25, 2014 5,829.2 1,402.0 921.1 498.2 8,650.5Acquisition 589.8 — — — 589.8Other activity, primarily foreign currency translation — (268.7) — (96.7) (365.4)Balance as of May 31, 2015 6,419.0 1,133.3 921.1 401.5 8,874.9Acquisitions 54.1 29.4 — — 83.5Divestitures (180.2) (6.2) — — (186.4)Other activity, primarily foreign currency translation — (35.5) — 4.7 (30.8)Balance as of May 29, 2016 $6,292.9 $1,121.0 $921.1 $406.2 $8,741.2
In fi scal 2015, we reorganized certain reporting units within our U.S. Retail operating segment. Our chief operating decision maker continues to assess perfor-mance and make decisions about resources to be allo-cated to our segments at the U.S. Retail, International, and Convenience Stores and Foodservice operating seg-ment level.
We performed our fi scal 2016 impairment assess-ment as of the fi rst day of the second quarter of fi s-cal 2016, and determined there was no impairment of goodwill for any of our reporting units as their related fair values were substantially in excess of their carry-ing values.
Th e changes in the carrying amount of other intangi-ble assets for fi scal 2014, 2015, and 2016 are as follows:
U.S. Joint In Millions Retail International Ventures Total
Balance as of May 26, 2013 $3,312.4 $1,638.2 $64.5 $5,015.1Other activity, primarily foreign currency translation (4.9) 3.6 0.5 (0.8)Balance as of May 25, 2014 3,307.5 1,641.8 65.0 5,014.3Acquisition 268.4 — — 268.4Impairment charge (260.0) — — (260.0)Other activity, primarily foreign currency translation (4.0) (340.3) (1.4) (345.7)Balance as of May 31, 2015 3,311.9 1,301.5 63.6 4,677.0Acquisitions 23.1 7.0 — 30.1Divestiture (119.6) — — (119.6)Other activity, primarily amortization and foreign currency translation (3.7) (44.6) (0.6) (48.9)Balance as of May 29, 2016 $3,211.7 $1,263.9 $63.0 $4,538.6
As of our fi scal 2016 assessment date, there was no impairment of any of our indefi nite-lived intangible assets as their related fair values were substantially in excess of the carrying values, except for the Mountain High and Uncle Toby’s brand assets. Th e excess fair value above the carrying value of these brand assets is as follows:
Excess Fair Value Above Carrying Carrying In Millions Value Value
Mountain High $35.4 20%Uncle Toby’s $52.2 11%
Our strategies for fi scal 2017 and fi scal 2018 will focus our growth investments on our brands and platforms with the strongest profi table growth potential. As a result, certain parts of our U.S. Retail segment could experience reduced future sales projections. We per-formed a sensitivity analysis for certain brand intangi-ble assets and determined that, while not impaired as of May 29, 2016, the Progresso and Food Should Taste
2016 Annual Report 55

Good brands had risk of decreasing coverage. We will continue to monitor these businesses.
In fi scal 2015, we made a strategic decision to redi-rect certain resources supporting our Green Giant busi-ness in our U.S. Retail segment to other businesses within the segment. Th erefore, future sales and prof-itability projections in our long-range plan for this business declined. As a result of this triggering event, we performed an interim impairment assessment of the Green Giant brand intangible asset as of May 31, 2015, and determined that the fair value of the brand asset no longer exceeded the carrying value of the asset. Signifi cant assumptions used in that assessment included our updated long-range cash flow projec-tions for the Green Giant business, an updated royalty rate, a weighted-average cost of capital, and a tax rate. We recorded a $260.0 million impairment charge in restructuring, impairment, and other exit costs in fi scal 2015 related to this asset.
NOTE 7. FINANCIAL INSTRUMENTS, RISK MANAGEMENT ACTIVITIES, AND FAIR VALUES
Financial InstrumentsTh e carrying values of cash and cash equivalents, receiv-ables, accounts payable, other current liabilities, and notes payable approximate fair value. Marketable secu-rities are carried at fair value. As of May 29, 2016 and May 31, 2015, a comparison of cost and market val-ues of our marketable debt and equity securities is as follows:
Fair Gross Gross Cost Value Gains Losses Fiscal Year Fiscal Year Fiscal Year Fiscal YearIn Millions 2016 2015 2016 2015 2016 2015 2016 2015
Available for sale:
Debt securities $165.7 $2.6 $165.8 $ 2.6 $0.1 $ — $ — $ —
Equity securities 1.8 1.8 8.4 8.3 6.6 6.5 — —
Total $167.5 $4.4 $174.2 $10.9 $6.7 $6.5 $ — $ —
Th ere were no realized gains or losses from sales of available-for-sale marketable securities. Gains and losses are determined by specifi c identifi cation. Classifi cation of marketable securities as current or noncurrent is dependent upon our intended holding period, and/or the security’s maturity date. Th e aggregate unrealized gains and losses on available-for-sale securities, net of tax eff ects, are classifi ed in AOCI within stockholders’ equity.
Scheduled maturities of our marketable securities are as follows:
Available for Sale Market In Millions Cost Value
Under 1 year (current) $ 165.7 $ 165.8Equity securities 1.8 8.4Total $ 167.5 $ 174.2
As of May 29, 2016, cash and cash equivalents total-ing $7.5 million were pledged as collateral for derivative contracts. As of May 29, 2016, $9.1 million of certain accounts receivable were pledged as collateral against a foreign uncommitted line of credit.
Th e fair value and carrying amounts of long-term debt, including the current portion, were $8,629.0 mil-lion and $8,161.1 million, respectively, as of May 29, 2016. Th e fair value of long-term debt was estimated using market quotations and discounted cash fl ows based on our current incremental borrowing rates for similar types of instruments. Long-term debt is a Level 2 liability in the fair value hierarchy.
Risk Management ActivitiesAs a part of our ongoing operations, we are exposed to market risks such as changes in interest and foreign currency exchange rates and commodity and equity prices. To manage these risks, we may enter into var-ious derivative transactions (e.g., futures, options, and swaps) pursuant to our established policies.
Commodity Price RiskMany commodities we use in the production and dis-tribution of our products are exposed to market price risks. We utilize derivatives to manage price risk for our principal ingredients and energy costs, including grains (oats, wheat, and corn), oils (principally soybean), dairy products, natural gas, and diesel fuel. Our primary objective when entering into these derivative contracts is to achieve certainty with regard to the future price of commodities purchased for use in our supply chain. We manage our exposures through a combination of purchase orders, long-term contracts with suppliers, exchange-traded futures and options, and over-the-counter options and swaps. We off set our exposures based on current and projected market conditions and generally seek to acquire the inputs at as close to our planned cost as possible.
56 General Mills

We use derivatives to manage our exposure to changes in commodity prices. We do not perform the assessments required to achieve hedge account-ing for commodity derivative positions. Accordingly, the changes in the values of these derivatives are recorded currently in cost of sales in our Consolidated Statements of Earnings.
Although we do not meet the criteria for cash fl ow hedge accounting, we believe that these instruments are eff ective in achieving our objective of providing cer-tainty in the future price of commodities purchased for use in our supply chain. Accordingly, for purposes of measuring segment operating performance these gains and losses are reported in unallocated corporate items outside of segment operating results until such time that the exposure we are managing aff ects earnings. At that time we reclassify the gain or loss from unal-located corporate items to segment operating profi t, allowing our operating segments to realize the eco-nomic eff ects of the derivative without experiencing any resulting mark-to-market volatility, which remains in unallocated corporate items.
Unallocated corporate items for fi scal 2016, 2015 and 2014 included:
Fiscal YearIn Millions 2016 2015 2014
Net loss on mark-to-market valuation of commodity positions $ (69.1) $ (163.7) $ (4.9)Net loss on commodity positions reclassifi ed from unallocated corporate items to segment operating profi t 127.9 84.4 51.2Net mark-to-market revaluation of certain grain inventories 4.0 (10.4) 2.2Net mark-to-market valuation of certain commodity positions recognized in unallocated corporate items $ 62.8 $ (89.7) $ 48.5
As of May 29, 2016, the net notional value of com-modity derivatives was $295.4 million, of which $189.1 million related to agricultural inputs and $106.3 mil-lion related to energy inputs. Th ese contracts relate to inputs that generally will be utilized within the next 12 months.
Interest Rate RiskWe are exposed to interest rate volatility with regard to future issuances of fi xed-rate debt, and existing and future issuances of fl oating-rate debt. Primary exposures include U.S. Treasury rates, LIBOR, Euribor, and commercial paper rates in the United States and Europe. We use interest rate swaps, forward-starting interest rate swaps, and treasury locks to hedge our exposure to interest rate changes, to reduce the vola-tility of our fi nancing costs, and to achieve a desired proportion of fi xed rate versus fl oating-rate debt, based on current and projected market conditions. Generally under these swaps, we agree with a counterparty to exchange the diff erence between fi xed-rate and fl oat-ing-rate interest amounts based on an agreed upon notional principal amount.
Floating Interest Rate Exposures — Floating-to-fi xed interest rate swaps are accounted for as cash fl ow hedges, as are all hedges of forecasted issuances of debt. Eff ectiveness is assessed based on either the perfectly eff ective hypothetical derivative method or changes in the present value of interest payments on the underlying debt. Eff ective gains and losses deferred to AOCI are reclassifi ed into earnings over the life of the associated debt. Ineff ective gains and losses are recorded as net interest. Th e amount of hedge ineff ec-tiveness was less than $1 million in each of fi scal 2016, 2015, and 2014.
Fixed Interest Rate Exposures — Fixed-to-fl oating interest rate swaps are accounted for as fair value hedges with eff ectiveness assessed based on changes in the fair value of the underlying debt and derivatives, using incremental borrowing rates currently available on loans with similar terms and maturities. Ineff ective gains and losses on these derivatives and the under-lying hedged items are recorded as net interest. Th e amount of hedge ineff ectiveness was less than $1 mil-lion in fi scal 2016, an $1.6 million gain in fi scal 2015, and less than $1 million in fi scal 2014.
In fi scal 2016, in advance of planned debt fi nancing, we entered into $400.0 million of treasury locks with an average fi xed rate of 2.1 percent due February 15, 2017.
In advance of planned debt fi nancing, we entered into €600.0 million of forward starting swaps with an average fi xed rate of 0.5 percent. All of these forward starting swaps were cash settled for $6.5 million in fi s-cal 2015, coincident with the issuance of our €500 mil-lion 8-year fi xed-rate notes and €400 million 12-year fi xed-rate notes.
2016 Annual Report 57

In fi scal 2015, we entered into swaps to convert $500.0 million of 1.4 percent fixed-rate notes due October 20, 2017, and $500.0 million of 2.2 percent fi xed-rate notes due October 21, 2019, to fl oating rates.
In advance of planned debt fi nancing, we entered into $250.0 million of treasury locks with an average fi xed rate of 1.99 percent. All of these treasury locks were cash settled for $17.9 million in fi scal 2014, coin-cident with the issuance of our $500.0 million 10-year fi xed-rate notes.
As of May 29, 2016, the pre-tax amount of cash-set-tled interest rate hedge gain or loss remaining in AOCI, which will be reclassifi ed to earnings over the remain-ing term of the related underlying debt, follows:
In Millions Gain/(Loss)
5.7% notes due February 15, 2017 $ (1.6)5.65% notes due February 15, 2019 1.43.15% notes due December 15, 2021 (54.9)1.0% notes due April 27, 2023 (1.7)3.65% notes due February 15, 2024 13.81.5% notes due April 27, 2027 (3.6)5.4% notes due June 15, 2040 (13.4)4.15% notes due February 15, 2043 10.5Net pre-tax hedge loss in AOCI $ (49.5)
Th e following table summarizes the notional amounts and weighted-average interest rates of our interest rate derivatives. Average fl oating rates are based on rates as of the end of the reporting period.
May 29, May 31, In Millions 2016 2015
Pay-fl oating swaps - notional amount $ 1,000.0 $ 1,250.0 Average receive rate 1.8% 1.6% Average pay rate 1.1% 0.7%
Th e swap contracts mature as follows:
In Millions Pay Floating
2018 $ 500.02020 500.0Total $ 1,000.0
58 General Mills

Th e following tables reconcile the net fair values of assets and liabilities subject to off setting arrangements that are recorded in our Consolidated Balance Sheets to the net fair values that could be reported in our Consolidated Balance Sheets:
May 29, 2016
Assets Liabilities Gross Amounts Not Gross Amounts Not Off set in the Off set in the Balance Sheet (e) Balance Sheet (e) Gross Gross Gross Liabilities Gross Assets Amounts of Off set in Net Cash Amounts of Off set in Net Cash Recognized the Balance Amounts of Financial Collateral Net Recognized the Balance Amounts of Financial Collateral NetIn Millions Assets Sheet (a) Assets (b) Instruments Received Amount (c) Liabilities Sheet (a) Liabilities (b) Instruments Pledged Amount (d)
Commodity contracts $ 4.4 $ — $ 4.4 $ (3.9) $ — $ 0.5 $(22.2) $ — $(22.2) $ 3.9 $7.5 $(10.8)Interest rate contracts 8.5 — 8.5 — — 8.5 (3.0) — (3.0) — — (3.0)Foreign exchange contracts 25.4 — 25.4 (8.7) — 16.7 (13.7) — (13.7) 8.7 — (5.0)Equity contracts 2.4 — 2.4 — — 2.4 — — — — — —Total $40.7 $ — $40.7 $(12.6) $ — $28.1 $(38.9) $ — $(38.9) $12.6 $7.5 $(18.8)
(a) Includes related collateral off set in our Consolidated Balance Sheets.
(b) Net fair value as recorded in our Consolidated Balance Sheets.
(c) Fair value of assets that could be reported net in our Consolidated Balance Sheets.
(d) Fair value of liabilities that could be reported net in our Consolidated Balance Sheets.
(e) Fair value of assets and liabilities reported on a gross basis in our Consolidated Balance Sheets.
May 31, 2015
Assets Liabilities Gross Amounts Not Gross Amounts Not Off set in the Off set in the Balance Sheet (e) Balance Sheet (e) Gross Gross Gross Liabilities Gross Assets Amounts of Off set in Net Cash Amounts of Off set in Net Cash Recognized the Balance Amounts of Financial Collateral Net Recognized the Balance Amounts of Financial Collateral NetIn Millions Assets Sheet (a) Assets (b) Instruments Received Amount (c) Liabilities Sheet (a) Liabilities (b) Instruments Pledged Amount (d)
Commodity contracts $ 10.1 $ — $ 10.1 $ (1.3) $ — $ 8.8 $ (59.4) $ — $ (59.4) $ 1.3 $40.1 $(18.0)Interest rate contracts 4.0 — 4.0 — — 4.0 — — — — — —Foreign exchange contracts 25.9 — 25.9 (12.5) — 13.4 (65.3) — (65.3) 12.5 — (52.8)Total $40.0 $ — $40.0 $(13.8) $ — $26.2 $(124.7) $ — $(124.7) $13.8 $40.1 $(70.8)
(a) Includes related collateral off set in our Consolidated Balance Sheets.
(b) Net fair value as recorded in our Consolidated Balance Sheets.
(c) Fair value of assets that could be reported net in our Consolidated Balance Sheets.
(d) Fair value of liabilities that could be reported net in our Consolidated Balance Sheets.
(e) Fair value of assets and liabilities reported on a gross basis in our Consolidated Balance Sheets.
2016 Annual Report 59
Foreign Exchange RiskForeign currency fl uctuations aff ect our net invest-ments in foreign subsidiaries and foreign currency cash fl ows related to third party purchases, intercompany loans, product shipments, and foreign-denominated debt. We are also exposed to the translation of for-eign currency earnings to the U.S. dollar. Our principal exposures are to the Australian dollar, Brazilian real, British pound sterling, Canadian dollar, Chinese ren-minbi, euro, Japanese yen, Mexican peso, and Swiss franc. We primarily use foreign currency forward con-tracts to selectively hedge our foreign currency cash fl ow exposures. We also generally swap our foreign-de-nominated commercial paper borrowings and nonfunc-tional currency intercompany loans back to U.S. dollars or the functional currency of the entity with foreign exchange exposure. Th e gains or losses on these deriv-atives off set the foreign currency revaluation gains or losses recorded in earnings on the associated borrow-ings. We generally do not hedge more than 18 months in advance.
As of May 29, 2016, the net notional value of foreign exchange derivatives was $997.7 million. Th e amount of hedge ineff ectiveness was less than $1 million in each of fi scal 2016, 2015, and 2014.
We also have many net investments in foreign sub-sidiaries that are denominated in euros. We previously hedged a portion of these net investments by issu-ing euro-denominated commercial paper and foreign exchange forward contracts. In fi scal 2016, we entered into a net investment hedge for a portion of our net investment in foreign operations denominated in euros by issuing €500.0 million of euro-denominated bonds. In fi scal 2015, we entered into a net investment hedge for a portion of our net investment in foreign opera-tions denominated in euros by issuing €900.0 million of euro-denominated bonds. In fi scal 2014, we entered into a net investment hedge for a portion of our net investment in foreign operations denominated in euros by issuing €500.0 million of euro-denominated bonds. As of May 29, 2016, we had deferred net foreign cur-rency transaction losses of $20.1 million in AOCI asso-ciated with hedging activity.
Venezuela is a highly infl ationary economy and as such, we remeasured the value of the assets and liabil-ities of our former Venezuelan subsidiary based on the exchange rate at which we expected to remit dividends in U.S. dollars from the SIMADI market. In fi scal 2015,
we recorded an $8 million foreign exchange loss. In the fourth quarter of fi scal 2016, we sold our General Mills de Venezuela CA subsidiary to a third party and exited our business in Venezuela.
Equity InstrumentsEquity price movements affect our compensation expense as certain investments made by our employees in our deferred compensation plan are revalued. We use equity swaps to manage this risk. As of May 29, 2016, the net notional amount of our equity swaps was $113.5 million. Th ese swap contracts mature in fi scal 2017.
60 General Mills

Fair Value Measurements and Financial Statement PresentationTh e fair values of our assets, liabilities, and derivative positions recorded at fair value and their respective levels in the fair value hierarchy as of May 29, 2016 and May 31, 2015, were as follows:
May 29, 2016 May 29, 2016 Fair Values of Assets Fair Values of LiabilitiesIn Millions Level 1 Level 2 Level 3 Total Level 1 Level 2 Level 3 Total
Derivatives designated as hedging instruments: Interest rate contracts (a) (b) $ — $ 7.7 $ — $ 7.7 $ — $ (3.0) $ — $ (3.0) Foreign exchange contracts (c) (d) — 12.2 — 12.2 — (12.2) — (12.2)Total — 19.9 — 19.9 — (15.2) — (15.2)Derivatives not designated as hedging instruments: Foreign exchange contracts (c) (d) — 13.2 — 13.2 — (1.5) — (1.5) Commodity contracts (c) (e) 2.6 1.7 — 4.3 (0.6) (21.6) — (22.2) Grain contracts (c) (e) — 1.8 — 1.8 — (5.5) — (5.5)Total 2.6 16.7 — 19.3 (0.6) (28.6) — (29.2)Other assets and liabilities reported at fair value: Marketable investments (a) (f) 8.4 165.8 — 174.2 — — — — Long-lived assets (g) — 26.0 — 26.0 — — — —Total 8.4 191.8 — 200.2 — — — —Total assets, liabilities, and derivative positions recorded at fair value $ 11.0 $ 228.4 $ — $ 239.4 $ (0.6) $ (43.8) $ — $ (44.4)
(a) Th ese contracts and investments are recorded as prepaid expenses and other current assets, other assets, other current liabilities or other liabilities, as appropriate, based on whether in a gain or loss position. Certain marketable investments are recorded as cash and cash equivalents.
(b) Based on LIBOR and swap rates.
(c) Th ese contracts are recorded as prepaid expenses and other current assets or as other current liabilities, as appropriate, based on whether in a gain or loss position.
(d) Based on observable market transactions of spot currency rates and forward currency prices.
(e) Based on prices of futures exchanges and recently reported transactions in the marketplace.
(f) Based on prices of common stock and bond matrix pricing.
(g) We recorded $11.4 million in non-cash impairment charges in fi scal 2016 to write down certain long-lived assets to their fair value. Fair value was based on recently reported transactions for similar assets in the marketplace. Th ese assets had a carrying value of $28.2 million and were associated with the restructuring actions described in Note 4.
2016 Annual Report 61

May 31, 2015 May 31, 2015 Fair Values of Assets Fair Values of LiabilitiesIn Millions Level 1 Level 2 Level 3 Total Level 1 Level 2 Level 3 Total
Derivatives designated as hedging instruments: Interest rate contracts (a) (b) $ — $ 4.0 $ — $ 4.0 $ — $ — $ — $ — Foreign exchange contracts (c) (d) — 25.5 — 25.5 — (23.3) — (23.3)Total — 29.5 — 29.5 — (23.3) — (23.3)Derivatives not designated as hedging instruments: Foreign exchange contracts (c) (d) — 0.4 — 0.4 — (42.0) — (42.0) Commodity contracts (c) (e) 7.2 2.9 — 10.1 — (59.4) — (59.4) Grain contracts (c) (e) — 3.3 — 3.3 — (7.8) — (7.8)Total 7.2 6.6 — 13.8 — (109.2) — (109.2)Other assets and liabilities reported at fair value: Marketable investments (a) (f) 8.3 2.6 — 10.9 — — — — Long-lived assets (g) — 37.8 — 37.8 — — — — Indefi nite-lived intangible asset (h) — — 154.3 154.3 — — — —Total 8.3 40.4 154.3 203.0 — — — —Total assets, liabilities, and derivative positions recorded at fair value $15.5 $76.5 $154.3 $246.3 $ — $(132.5) $ — $(132.5)
(a) Th ese contracts and investments are recorded as prepaid expenses and other current assets, other assets, other current liabilities or other liabilities, as appropriate, based on whether in a gain or loss position. Certain marketable investments are recorded as cash and cash equivalents.
(b) Based on LIBOR and swap rates.
(c) Th ese contracts are recorded as prepaid expenses and other current assets or as other current liabilities, as appropriate, based on whether in a gain or loss position.
(d) Based on observable market transactions of spot currency rates and forward currency prices.
(e) Based on prices of futures exchanges and recently reported transactions in the marketplace.
(f) Based on prices of common stock and bond matrix pricing.
(g) We recorded $30.3 million in non-cash impairment charges in fi scal 2015 to write down certain long-lived assets to their fair value. Fair value was based on recently reported transactions for similar assets in the marketplace. Th ese assets had a carrying value of $68.1 million and were associated with the restructuring actions described in Note 4.
(h) We recorded a $260.0 million non-cash impairment charge in fi scal 2015 to write down our Green Giant brand asset to its fair value of $154.3 million. Th is asset had a carrying value of $414.3 million. See Note 6 for additional information.
We did not signifi cantly change our valuation techniques from prior periods.
62 General Mills

Information related to our cash fl ow hedges, fair value hedges, and other derivatives not designated as hedging instruments for the fi scal years ended May 29, 2016 and May 31, 2015, follows:
Interest Rate Foreign Exchange Equity Commodity Contracts Contracts Contracts Contracts Total
Fiscal Year Fiscal Year Fiscal Year Fiscal Year Fiscal YearIn Millions 2016 2015 2016 2015 2016 2015 2016 2015 2016 2015
Derivatives in Cash Flow Hedging Relationships: Amount of gain (loss) recognized in other comprehensive income (OCI) (a) $ (2.6) $ (5.9) $21.2 $13.3 $ — $ — $ — $ — $18.6 $7.4 Amount of net gain (loss) reclassifi ed from AOCI into earnings (a) (b) (10.6) (10.6) 22.1 5.0 — — — — 11.5 (5.6) Amount of net gain (loss) recognized in earnings (c) (0.1) (0.6) (0.7) 0.1 — — — — (0.8) (0.5)Derivatives in Fair Value Hedging Relationships: Amount of net gain recognized in earnings (d) 0.1 1.6 — — — — — — 0.1 1.6Derivatives in Net Investment Hedging Relationships: Amount of loss recognized in OCI (a) — — (0.2) (6.9) — — — — (0.2) (6.9)Derivatives Not Designated as Hedging Instruments: Amount of net gain (loss) recognized in earnings (d) — — 1.1 (54.3) (4.5) 9.6 (56.1) (163.7) (59.5) (208.4)
(a) Eff ective portion.
(b) Gain (loss) reclassifi ed from AOCI into earnings is reported in interest, net for interest rate swaps and in cost of sales and SG&A expenses for foreign exchange contracts.
(c) Gain (loss) recognized in earnings is related to the ineff ective portion of the hedging relationship, including SG&A expenses for foreign exchange contracts and interest, net for interest rate contracts. No amounts were reported as a result of being excluded from the assessment of hedge eff ectiveness.
(d) Gain (loss) recognized in earnings is reported in interest, net for interest rate contracts, in cost of sales for commodity contracts, and in SG&A expenses for equity contracts and foreign exchange contracts.
2016 Annual Report 63

Amounts Recorded in Accumulated Other Comprehensive Loss As of May 29, 2016, the aft er-tax amounts of unreal-ized gains and losses in AOCI related to hedge deriva-tives follows:
In Millions Aft er-Tax Gain/(Loss)
Unrealized losses from interest rate cash fl ow hedges $ (31.3)Unrealized gains from foreign currency cash fl ow hedges 5.8Aft er-tax loss in AOCI related to hedge derivatives $ (25.5)
Th e net amount of pre-tax gains and losses in AOCI as of May 29, 2016, that we expect to be reclassifi ed into net earnings within the next 12 months is $1.2 million of loss.
Credit-Risk-Related Contingent FeaturesCertain of our derivative instruments contain provi-sions that require us to maintain an investment grade credit rating on our debt from each of the major credit rating agencies. If our debt were to fall below invest-ment grade, the counterparties to the derivative instru-ments could request full collateralization on derivative instruments in net liability positions. Th e aggregate fair value of all derivative instruments with credit-risk-re-lated contingent features that were in a liability posi-tion on May 29, 2016, was $21.9 million. We have posted $7.5 million of collateral under these contracts. If the credit-risk-related contingent features underlying these agreements had been triggered on May 29, 2016, we would have been required to post $14.4 million of collateral to counterparties.
Concentrations Of Credit And Counterparty Credit RiskDuring fiscal 2016, customer concentration was as follows:
Convenience Stores andPercent of total Consolidated U.S. Retail International Foodservice
Wal-Mart: (a) Net sales 20% 30% 5% 8% Accounts receivable 26% 4% 8%Five largest customers: Net sales 53% 22% 45%
(a) Includes Wal-Mart Stores, Inc. and its affi liates.
No customer other than Wal-Mart accounted for 10 percent or more of our consolidated net sales.
We enter into interest rate, foreign exchange, and certain commodity and equity derivatives, primarily with a diversifi ed group of highly rated counterparties. We continually monitor our positions and the credit ratings of the counterparties involved and, by policy, limit the amount of credit exposure to any one party. Th ese transactions may expose us to potential losses due to the risk of nonperformance by these counter-parties; however, we have not incurred a material loss. We also enter into commodity futures transactions through various regulated exchanges.
Th e amount of loss due to the credit risk of the counterparties, should the counterparties fail to per-form according to the terms of the contracts, is $14.8 million against which we do not hold collateral. Under the terms of our swap agreements, some of our trans-actions require collateral or other security to support fi nancial instruments subject to threshold levels of exposure and counterparty credit risk. Collateral assets are either cash or U.S. Treasury instruments and are held in a trust account that we may access if the coun-terparty defaults.
We off er certain suppliers access to a third party ser-vice that allows them to view our scheduled payments online. Th e third party service also allows suppliers to fi nance advances on our scheduled payments at the sole discretion of the supplier and the third party. We have no economic interest in these fi nancing arrange-ments and no direct relationship with the suppliers, the third party, or any fi nancial institutions concerning this service. All of our accounts payable remain as obli-gations to our suppliers as stated in our supplier agree-ments. As of May 29, 2016, $537.0 million of our total accounts payable is payable to suppliers who utilize this third party service.
64 General Mills

NOTE 8. DEBT
Notes Payable Th e components of notes payable and their respective weighted-average interest rates at the end of the periods were as follows:
May 29, 2016 May 31, 2015
Weighted- Weighted- average average Notes Interest Notes InterestIn Millions Payable Rate Payable Rate
U.S. commercial paper $ — —% $432.0 0.3%Financial institutions 269.8 8.6 183.8 9.5Total $269.8 8.6% $615.8 3.0%
To ensure availability of funds, we maintain bank credit lines suffi cient to cover our outstanding notes payable. Commercial paper is a continuing source of short-term fi nancing. We have commercial paper pro-grams available to us in the United States and Europe. We also have uncommitted and asset-backed credit lines that support our foreign operations.
Th e following table details the fee-paid committed and uncommitted credit lines we had available as of May 29, 2016:
Facility BorrowedIn Billions Amount Amount
Credit facility expiring: May 2021 $ 2.7 $ — June 2019 0.2 0.1Total committed credit facilities 2.9 0.1Uncommitted credit facilities 0.4 0.1Total committed and uncommitted credit facilities $ 3.3 $ 0.2
In fi scal 2016, we entered into a $2.7 billion fee-paid committed credit facility that is scheduled to expire in May 2021. Concurrent with the execution of this credit facility, we terminated our $1.7 billion and $1.0 billion credit facilities.
In fi scal 2015, our subsidiary, Yoplait S.A.S., entered into a €200.0 million fee-paid committed credit facility that is scheduled to expire in June 2019.
Th e credit facilities contain covenants, including a requirement to maintain a fi xed charge coverage ratio of at least 2.5 times. We were in compliance with all credit facility covenants as of May 29, 2016.
Long-Term Debt In January 2016, we issued €500.0 million principal amount of fl oating-rate notes due January 15, 2020. Interest on the notes are pay-able quarterly in arrears. Th e notes are not generally redeemable prior to maturity. Th ese notes are senior unsecured obligations that include a change of control repurchase provision. Th e net proceeds were used to repay a portion of our maturing long-term debt.
In January 2016, we repaid $250 million of 0.875 per-cent fi xed-rate notes and $750 million of fl oating-rate notes.
In April 2015, we issued €500.0 million principal amount of 1.0 percent fi xed-rate notes due April 27, 2023 and €400.0 million principal amount of 1.5 per-cent fi xed-rate notes due April 27, 2027. Interest on the notes is payable annually in arrears. Th e notes may be redeemed in whole, or in part, at our option at any time at the applicable redemption price. Th ese notes are senior unsecured obligations that include a change of control repurchase provision. Th e net proceeds were used for general corporate purposes and to reduce our commercial paper borrowings.
In March 2015, we repaid $750.0 million of 5.2 per-cent notes.
In October 2014, we issued $500.0 million aggregate principal amount of 1.4 percent fi xed-rate notes due October 20, 2017 and $500.0 million aggregate princi-pal amount of 2.2 percent fi xed-rate notes due October 21, 2019. Interest on the notes is payable semi-annually in arrears. Th e notes may be redeemed in whole, or in part, at our option at any time at the applicable redemp-tion price. Th e notes are senior unsecured obligations that include a change of control repurchase provision. Th e net proceeds were used to fund our acquisition of Annie’s and for general corporate purposes.
In June 2014, our subsidiary, Yoplait S.A.S., issued €200.0 million principal amount of 2.2 percent fi xed-rate senior notes due June 24, 2021 in a private placement off ering. Interest on the notes is payable semi-annually in arrears. Th e notes may be redeemed in whole, or in part, at our subsidiary’s option at any time at the applicable redemption price. Th e notes are senior unsecured obligations that include a change of control repurchase provision. Th e net proceeds were used to refi nance existing debt.
In June 2014, we repaid €290.0 million of float-ing-rate notes.
2016 Annual Report 65

A summary of our long-term debt is as follows:
In Millions May 29, 2016 May 31, 2015
5.65% notes due February 15, 2019 $1,150.0 $1,150.05.7% notes due February 15, 2017 1,000.0 1,000.03.15% notes due December 15, 2021 1,000.0 1,000.0Euro-denominated 2.1% notes due November 16, 2020 555.8 549.4Euro-denominated 1.0% notes due April 27, 2023 555.8 549.4Floating-rate euro-denominated notes due January 15, 2020 555.8 —1.4% notes due October 20, 2017 500.0 500.05.4% notes due June 15, 2040 500.0 500.04.15% notes due February 15, 2043 500.0 500.03.65% notes due February 15, 2024 500.0 500.02.2% notes due October 21, 2019 500.0 500.0Floating-rate notes due January 29, 2016 — 500.0Euro-denominated 1.5% notes due April 27, 2027 444.6 439.50.875% notes due January 29, 2016 — 250.0Floating-rate notes due January 28, 2016 — 250.0Euro-denominated 2.2% notes due June 24, 2021 221.0 219.7Medium-term notes, 0.02% to 6.44%, due fi scal 2017 or later 204.2 204.2Other, including debt issuance costs and capital leases (26.1) (36.5) 8,161.1 8,575.7Less amount due within one year (1,103.4) (1,000.4)Total long-term debt $7,057.7 $7,575.3
Principal payments due on long-term debt in the next fi ve years based on stated contractual maturities, our intent to redeem, or put rights of certain note hold-ers are $1,103.4 million in fi scal 2017, $604.7 million in fi scal 2018, $1,150.4 million in fi scal 2019, $1,056.0 mil-lion in fi scal 2020, and $555.9 million in fi scal 2021.
Certain of our long-term debt agreements contain restrictive covenants. As of May 29, 2016, we were in compliance with all of these covenants.
As of May 29, 2016, the $49.5 million pre-tax loss recorded in AOCI associated with our previously des-ignated interest rate swaps will be reclassifi ed to net interest over the remaining lives of the hedged trans-actions. Th e amount expected to be reclassifi ed from AOCI to net interest in fi scal 2017 is a $10.0 million pre-tax loss.
NOTE 9. REDEEMABLE AND NONCONTROLLING INTERESTS
Our principal redeemable and noncontrolling interests relate to our Yoplait SAS, Yoplait Marques SNC, Liberté Marques Sàrl, and General Mills Cereals, LLC (GMC) subsidiaries. In addition, we have six foreign subsid-iaries that have noncontrolling interests totaling $7.0 million as of May 29, 2016.
We have a 51 percent controlling interest in Yoplait SAS and a 50 percent interest in Yoplait Marques SNC and Liberté Marques Sàrl. Sodiaal holds the remaining interests in each of the entities. On the acquisition date, we recorded the $904.4 million fair value of Sodiaal’s 49 percent euro-denominated interest in Yoplait SAS as a redeemable interest on our Consolidated Balance Sheets. Sodiaal has the ability to put all or a portion of its redeemable interest to us at fair value once per year, up to three times before December 2024. We adjust the value of the redeemable interest through additional paid-in capital on our Consolidated Balance Sheets quarterly to the redeemable interest’s redemption value, which approximates its fair value. Yoplait SAS pays dividends annually if it meets certain fi nancial metrics set forth in its shareholders agreement. As of May 29, 2016, the redemption value of the euro-denominated redeemable interest was $845.6 million.
On the acquisition dates, we recorded the $281.4 million fair value of Sodiaal’s 50 percent euro-denom-inated interest in Yoplait Marques SNC and 50 per-cent Canadian dollar-denominated interest in Liberté Marques Sàrl as noncontrolling interests on our Consolidated Balance Sheets. Yoplait Marques SNC earns a royalty stream through a licensing agree-ment with Yoplait SAS for the rights to Yoplait and related trademarks. Liberté Marques Sàrl earns a roy-alty stream through licensing agreements with cer-tain Yoplait group companies for the rights to Liberté and related trademarks. Th ese entities pay dividends annually based on their available cash as of their fi scal year end.
During fi scal 2016, we paid $74.5 million of dividends to Sodiaal under the terms of the Yoplait SAS and Yoplait Marques SNC shareholder agreements.
A subsidiary of Yoplait SAS has entered into an exclu-sive milk supply agreement for its European operations with Sodiaal at market-determined prices through July 1, 2021. Net purchases totaled $321.0 million for fi scal 2016 and $271.3 million for fi scal 2015.
66 General Mills

Th e holder of the GMC Class A Interests receives quarterly preferred distributions from available net income based on the application of a fl oating preferred return rate to the holder’s capital account balance estab-lished in the most recent mark-to-market valuation (currently $251.5 million). On June 1, 2015, the fl oating preferred return rate on GMC’s Class A interests was reset to the sum of three-month LIBOR plus 125 basis points. Th e preferred return rate is adjusted every three years through a negotiated agreement with the Class A Interest holder or through a remarketing auction.
For fi nancial reporting purposes, the assets, liabilities, results of operations, and cash fl ows of our non-wholly owned subsidiaries are included in our Consolidated Financial Statements. Th e third-party investor’s share of the net earnings of these subsidiaries is refl ected in net earnings attributable to redeemable and noncontrolling interests in our Consolidated Statements of Earnings.
Our noncontrolling interests contain restrictive cove-nants. As of May 29, 2016, we were in compliance with all of these covenants.
NOTE 10. STOCKHOLDERS’ EQUITY
Cumulative preference stock of 5.0 million shares, with-out par value, is authorized but unissued.
On May 6, 2014, our Board of Directors authorized the repurchase of up to 100 million shares of our com-mon stock. Purchases under the authorization can be made in the open market or in privately negotiated transactions, including the use of call options and other derivative instruments, Rule 10b5-1 trading plans, and accelerated repurchase programs. Th e authorization has no specifi ed termination date.
Share repurchases were as follows:
Fiscal YearIn Millions 2016 2015 2014
Shares of common stock 10.7 22.3 35.6Aggregate purchase price $ 606.7 $ 1,161.9 $ 1,774.4
Th e following table provides details of total comprehensive income:
Fiscal 2016 Noncontrolling Redeemable General Mills Interests Interests In Millions Pretax Tax Net Net Net
Net earnings, including earnings attributable to redeemable and noncontrolling interests $ 1,697.4 $ 8.4 $ 31.0Other comprehensive income (loss): Foreign currency translation $ (107.6) $ — (107.6) 2.8 (3.9) Net actuarial loss (514.2) 188.3 (325.9) — — Other fair value changes: Securities 0.2 (0.1) 0.1 — — Hedge derivatives 16.5 (2.2) 14.3 — 1.7 Reclassifi cation to earnings: Hedge derivatives (a) (13.5) 2.5 (11.0) — 1.5 Amortization of losses and prior service costs (b) 206.8 (78.2) 128.6 — —Other comprehensive income (loss) (411.8) 110.3 (301.5) 2.8 (0.7)Total comprehensive income $ 1,395.9 $ 11.2 $ 30.3
(a) Gain reclassifi ed from AOCI into earnings is reported in interest, net for interest rate swaps and in cost of sales and SG&A expenses for foreign exchange contracts.
(b) Loss reclassifi ed from AOCI into earnings is reported in SG&A expense.
2016 Annual Report 67
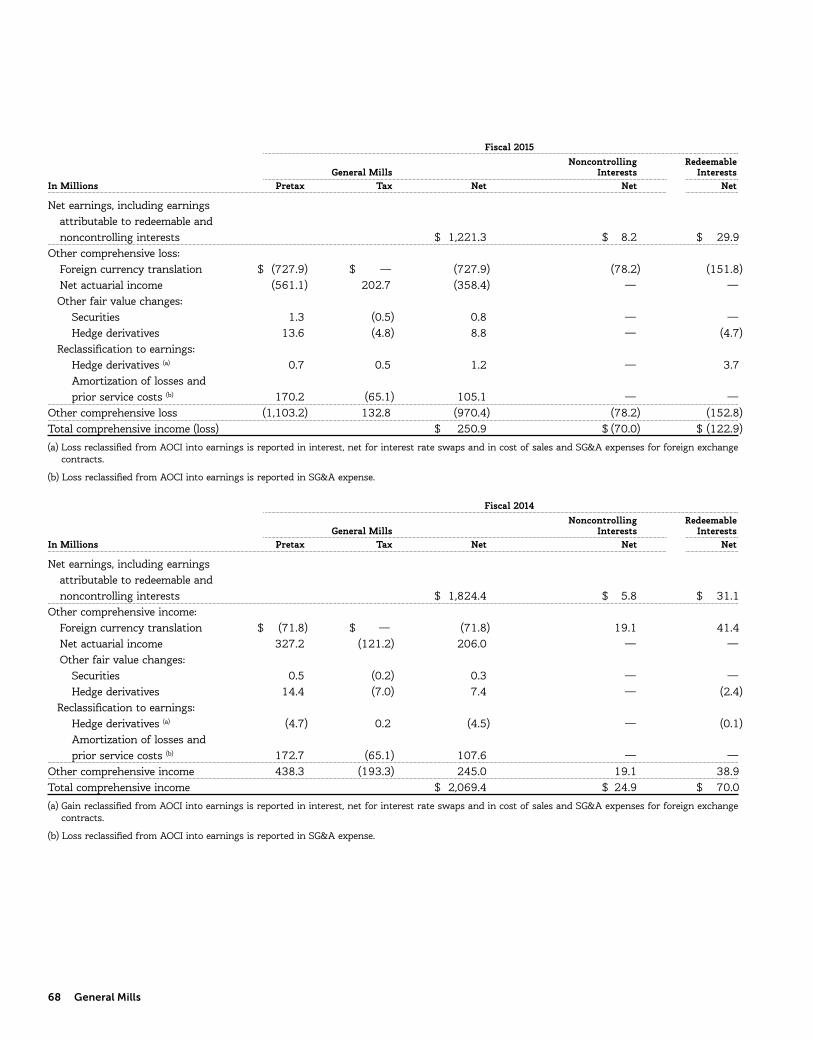
Fiscal 2015 Noncontrolling Redeemable General Mills Interests Interests In Millions Pretax Tax Net Net Net
Net earnings, including earnings attributable to redeemable and noncontrolling interests $ 1,221.3 $ 8.2 $ 29.9Other comprehensive loss: Foreign currency translation $ (727.9) $ — (727.9) (78.2) (151.8) Net actuarial income (561.1) 202.7 (358.4) — — Other fair value changes: Securities 1.3 (0.5) 0.8 — — Hedge derivatives 13.6 (4.8) 8.8 — (4.7) Reclassifi cation to earnings: Hedge derivatives (a) 0.7 0.5 1.2 — 3.7 Amortization of losses and prior service costs (b) 170.2 (65.1) 105.1 — —Other comprehensive loss (1,103.2) 132.8 (970.4) (78.2) (152.8)Total comprehensive income (loss) $ 250.9 $ (70.0) $ (122.9)
(a) Loss reclassifi ed from AOCI into earnings is reported in interest, net for interest rate swaps and in cost of sales and SG&A expenses for foreign exchange contracts.
(b) Loss reclassifi ed from AOCI into earnings is reported in SG&A expense.
Fiscal 2014 Noncontrolling Redeemable General Mills Interests Interests In Millions Pretax Tax Net Net Net
Net earnings, including earnings attributable to redeemable and noncontrolling interests $ 1,824.4 $ 5.8 $ 31.1Other comprehensive income: Foreign currency translation $ (71.8) $ — (71.8) 19.1 41.4 Net actuarial income 327.2 (121.2) 206.0 — — Other fair value changes: Securities 0.5 (0.2) 0.3 — — Hedge derivatives 14.4 (7.0) 7.4 — (2.4) Reclassifi cation to earnings: Hedge derivatives (a) (4.7) 0.2 (4.5) — (0.1) Amortization of losses and prior service costs (b) 172.7 (65.1) 107.6 — —Other comprehensive income 438.3 (193.3) 245.0 19.1 38.9Total comprehensive income $ 2,069.4 $ 24.9 $ 70.0
(a) Gain reclassifi ed from AOCI into earnings is reported in interest, net for interest rate swaps and in cost of sales and SG&A expenses for foreign exchange contracts.
(b) Loss reclassifi ed from AOCI into earnings is reported in SG&A expense.
68 General Mills
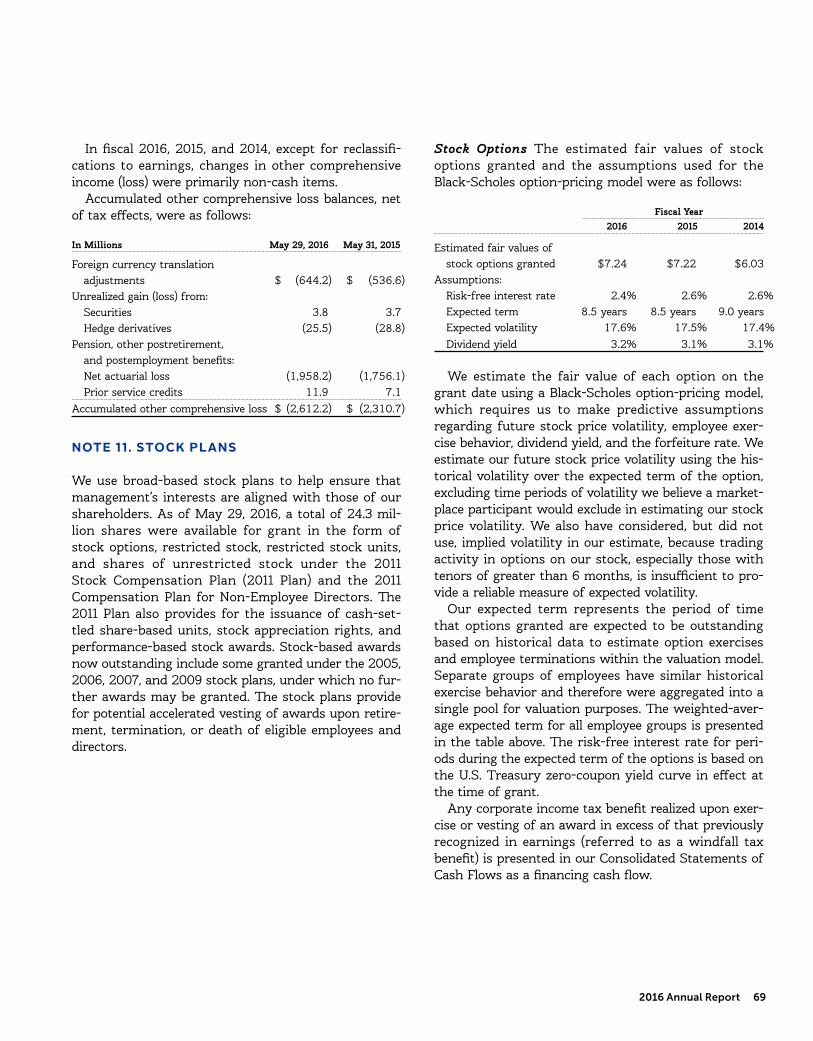
In fi scal 2016, 2015, and 2014, except for reclassifi -cations to earnings, changes in other comprehensive income (loss) were primarily non-cash items.
Accumulated other comprehensive loss balances, net of tax eff ects, were as follows:
In Millions May 29, 2016 May 31, 2015
Foreign currency translation adjustments $ (644.2) $ (536.6)Unrealized gain (loss) from: Securities 3.8 3.7 Hedge derivatives (25.5) (28.8)Pension, other postretirement, and postemployment benefi ts: Net actuarial loss (1,958.2) (1,756.1) Prior service credits 11.9 7.1Accumulated other comprehensive loss $ (2,612.2) $ (2,310.7)
NOTE 11. STOCK PLANS
We use broad-based stock plans to help ensure that management’s interests are aligned with those of our shareholders. As of May 29, 2016, a total of 24.3 mil-lion shares were available for grant in the form of stock options, restricted stock, restricted stock units, and shares of unrestricted stock under the 2011 Stock Compensation Plan (2011 Plan) and the 2011 Compensation Plan for Non-Employee Directors. Th e 2011 Plan also provides for the issuance of cash-set-tled share-based units, stock appreciation rights, and performance-based stock awards. Stock-based awards now outstanding include some granted under the 2005, 2006, 2007, and 2009 stock plans, under which no fur-ther awards may be granted. Th e stock plans provide for potential accelerated vesting of awards upon retire-ment, termination, or death of eligible employees and directors.
Stock Options The estimated fair values of stock options granted and the assumptions used for the Black-Scholes option-pricing model were as follows:
Fiscal Year 2016 2015 2014
Estimated fair values of stock options granted $7.24 $7.22 $6.03Assumptions: Risk-free interest rate 2.4% 2.6% 2.6% Expected term 8.5 years 8.5 years 9.0 years Expected volatility 17.6% 17.5% 17.4% Dividend yield 3.2% 3.1% 3.1%
We estimate the fair value of each option on the grant date using a Black-Scholes option-pricing model, which requires us to make predictive assumptions regarding future stock price volatility, employee exer-cise behavior, dividend yield, and the forfeiture rate. We estimate our future stock price volatility using the his-torical volatility over the expected term of the option, excluding time periods of volatility we believe a market-place participant would exclude in estimating our stock price volatility. We also have considered, but did not use, implied volatility in our estimate, because trading activity in options on our stock, especially those with tenors of greater than 6 months, is insuffi cient to pro-vide a reliable measure of expected volatility.
Our expected term represents the period of time that options granted are expected to be outstanding based on historical data to estimate option exercises and employee terminations within the valuation model. Separate groups of employees have similar historical exercise behavior and therefore were aggregated into a single pool for valuation purposes. Th e weighted-aver-age expected term for all employee groups is presented in the table above. Th e risk-free interest rate for peri-ods during the expected term of the options is based on the U.S. Treasury zero-coupon yield curve in eff ect at the time of grant.
Any corporate income tax benefi t realized upon exer-cise or vesting of an award in excess of that previously recognized in earnings (referred to as a windfall tax benefi t) is presented in our Consolidated Statements of Cash Flows as a fi nancing cash fl ow.
2016 Annual Report 69

Realized windfall tax benefi ts are credited to addi-tional paid-in capital within our Consolidated Balance Sheets. Realized shortfall tax benefi ts (amounts which are less than that previously recognized in earnings) are fi rst off set against the cumulative balance of wind-fall tax benefi ts, if any, and then charged directly to income tax expense, potentially resulting in volatility in our consolidated eff ective income tax rate. We calcu-lated a cumulative memo balance of windfall tax ben-efi ts for the purpose of accounting for future shortfall tax benefi ts.
Options may be priced at 100 percent or more of the fair market value on the date of grant, and generally vest four years aft er the date of grant. Options gen-erally expire within 10 years and one month aft er the date of grant.
Information on stock option activity follows:
Weighted- Weighted- Average Average Options Exercise Options Exercise Exercisable Price Per Outstanding Price Per (Th ousands) Share (Th ousands) Share
Balance as of May 26, 2013 29,290.3 $27.69 47,672.1 $30.22 Granted 2,789.8 48.33 Exercised (6,181.3) 24.78 Forfeited or expired (111.6) 38.74Balance as of May 25, 2014 29,452.8 28.37 44,169.0 32.10 Granted 2,253.1 53.70 Exercised (7,297.2) 26.68 Forfeited or expired (47.7) 43.73Balance as of May 31, 2015 26,991.5 30.44 39,077.2 34.35 Granted 1,930.2 55.72 Exercised (8,471.0) 28.49 Forfeited or expired (134.8) 48.16Balance as of May 29, 2016 22,385.1 $32.38 32,401.6 $37.09
Stock-based compensation expense related to stock option awards was $14.8 million in fi scal 2016, $18.1 million in fi scal 2015, and $18.2 million in fi scal 2014. Compensation expense related to stock-based pay-ments recognized in our Consolidated Statements of Earnings includes amounts recognized in restructur-ing, impairment, and other exit costs for fi scal 2016 and 2015.
Net cash proceeds from the exercise of stock options less shares used for minimum withholding taxes and the intrinsic value of options exercised were as follows: Fiscal YearIn Millions 2016 2015 2014
Net cash proceeds $171.9 $163.7 $108.1Intrinsic value of options exercised $268.4 $201.9 $166.6
Restricted Stock, Restricted Stock Units, and Performance Share Units Stock and units settled in stock subject to a restricted period and a purchase price, if any (as determined by the Compensation Committee of the Board of Directors), may be granted to key employees under the 2011 Plan. Restricted stock and restricted stock units generally vest and become unre-stricted four years aft er the date of grant. Performance share units are earned based on our future achievement of three-year goals for average organic net sales growth and cumulative free cash fl ow. Performance share units are settled in common stock and are generally subject to a three year performance and vesting period. Th e sale or transfer of these awards is restricted during the vesting period. Participants holding restricted stock, but not restricted stock units or performance share units, are entitled to vote on matters submitted to holders of common stock for a vote. Th ese awards accumulate dividends from the date of grant, but participants only receive payment if the awards vest.
70 General Mills
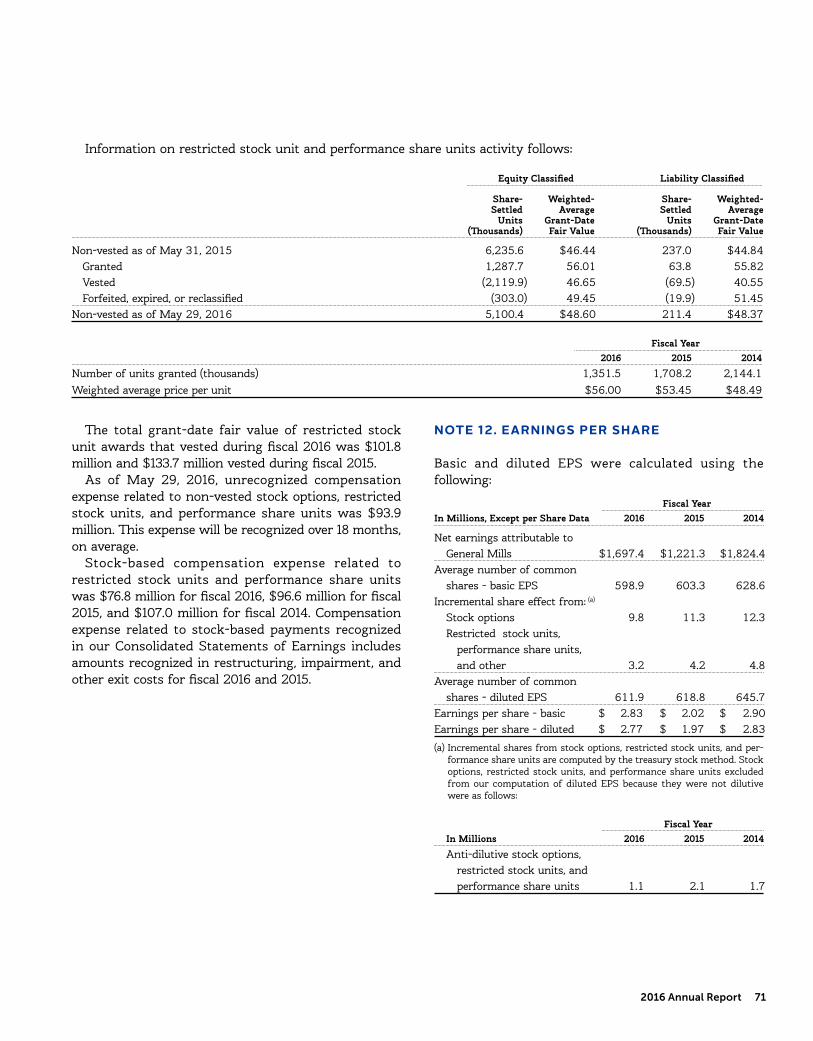
Information on restricted stock unit and performance share units activity follows:
Equity Classifi ed Liability Classifi ed
Share- Weighted- Share- Weighted- Settled Average Settled Average Units Grant-Date Units Grant-Date (Th ousands) Fair Value (Th ousands) Fair Value
Non-vested as of May 31, 2015 6,235.6 $46.44 237.0 $44.84 Granted 1,287.7 56.01 63.8 55.82 Vested (2,119.9) 46.65 (69.5) 40.55 Forfeited, expired, or reclassifi ed (303.0) 49.45 (19.9) 51.45Non-vested as of May 29, 2016 5,100.4 $48.60 211.4 $48.37
Fiscal Year 2016 2015 2014
Number of units granted (thousands) 1,351.5 1,708.2 2,144.1Weighted average price per unit $56.00 $53.45 $48.49
Th e total grant-date fair value of restricted stock unit awards that vested during fi scal 2016 was $101.8 million and $133.7 million vested during fi scal 2015.
As of May 29, 2016, unrecognized compensation expense related to non-vested stock options, restricted stock units, and performance share units was $93.9 million. Th is expense will be recognized over 18 months, on average.
Stock-based compensation expense related to restricted stock units and performance share units was $76.8 million for fi scal 2016, $96.6 million for fi scal 2015, and $107.0 million for fi scal 2014. Compensation expense related to stock-based payments recognized in our Consolidated Statements of Earnings includes amounts recognized in restructuring, impairment, and other exit costs for fi scal 2016 and 2015.
NOTE 12. EARNINGS PER SHARE
Basic and diluted EPS were calculated using the following:
Fiscal YearIn Millions, Except per Share Data 2016 2015 2014
Net earnings attributable to General Mills $1,697.4 $1,221.3 $1,824.4Average number of common shares - basic EPS 598.9 603.3 628.6Incremental share eff ect from: (a)
Stock options 9.8 11.3 12.3 Restricted stock units, performance share units, and other 3.2 4.2 4.8Average number of common shares - diluted EPS 611.9 618.8 645.7Earnings per share - basic $ 2.83 $ 2.02 $ 2.90Earnings per share - diluted $ 2.77 $ 1.97 $ 2.83
(a) Incremental shares from stock options, restricted stock units, and per-formance share units are computed by the treasury stock method. Stock options, restricted stock units, and performance share units excluded from our computation of diluted EPS because they were not dilutive were as follows:
Fiscal Year In Millions 2016 2015 2014
Anti-dilutive stock options, restricted stock units, and performance share units 1.1 2.1 1.7
2016 Annual Report 71

NOTE 13. RETIREMENT BENEFITS AND POSTEMPLOYMENT BENEFITS
Defi ned Benefi t Pension Plans We have defi ned benefi t pension plans covering many employees in the United States, Canada, France, and the United Kingdom. Benefi ts for salaried employees are based on length of service and fi nal average compensation. Benefi ts for hourly employees include various monthly amounts for each year of credited service. Our funding policy is con-sistent with the requirements of applicable laws. We made no voluntary contributions to our principal U.S. plans in fi scal 2016, 2015 and 2014. We do not expect to be required to make any contributions in fi scal 2017. Our principal domestic retirement plan covering sala-ried employees has a provision that any excess pen-sion assets would be allocated to active participants if the plan is terminated within fi ve years of a change in control. All salaried employees hired on or aft er June 1, 2013 are eligible for a retirement program that does not include a defi ned benefi t pension plan.
Other Postretirement Benefi t Plans We also sponsor plans that provide health care benefi ts to many of our retirees in the United States, Canada, and Brazil. Th e United States salaried health care benefi t plan is con-tributory, with retiree contributions based on years of service. We make decisions to fund related trusts for certain employees and retirees on an annual basis. We made $24.0 million in voluntary contributions to these plans in fi scal 2016 and $24.0 million in voluntary con-tributions to these plans in fi scal 2015.
Health Care Cost Trend Rates Assumed health care cost trends are as follows:
Fiscal Year 2016 2015
Health care cost trend rate for next year 7.3% and 7.5% 6.5% and 7.3%Rate to which the cost trend rate is assumed to decline (ultimate rate) 5.0% 5.0%Year that the rate reaches the ultimate trend rate 2024 2025
We review our health care cost trend rates annu-ally. Our review is based on data we collect about our health care claims experience and information pro-vided by our actuaries. Th is information includes recent
plan experience, plan design, overall industry experience and projections, and assumptions used by other simi-lar organizations. Our initial health care cost trend rate is adjusted as necessary to remain consistent with this review, recent experiences, and short-term expectations. Our initial health care cost trend rate assumption is 7.5 percent for retirees age 65 and over and 7.3 percent for retirees under age 65 at the end of fi scal 2016. Rates are graded down annually until the ultimate trend rate of 5.0 percent is reached in 2024 for all retirees. Th e trend rates are applicable for calculations only if the retirees’ benefi ts increase as a result of health care infl ation. Th e ultimate trend rate is adjusted annually, as necessary, to approximate the current economic view on the rate of long-term infl ation plus an appropriate health care cost premium. Assumed trend rates for health care costs have an important eff ect on the amounts reported for the other postretirement benefi t plans.
A one percentage point change in the health care cost trend rate would have the following eff ects:
One One Percentage Percentage Point PointIn Millions Increase Decrease
Eff ect on the aggregate of the service and interest cost components in fi scal 2017 $ 3.1 $ (2.7)Eff ect on the other postretirement accumulated benefi t obligation as of May 29, 2016 71.2 (63.8)
Th e Patient Protection and Aff ordable Care Act, as amended by the Health Care and Education Reconciliation Act of 2010 (collectively, the Act) was signed into law in March 2010. Th e Act codifi es health care reforms with staggered eff ective dates from 2010 to 2018. Estimates of the future impacts of several of the Act’s provisions are incorporated into our postretirement benefi t liability.
Postemployment Benefi t Plans Under certain circum-stances, we also provide accruable benefi ts to former or inactive employees in the United States, Canada, and Mexico, and members of our Board of Directors, including severance and certain other benefi ts pay-able upon death. We recognize an obligation for any of these benefi ts that vest or accumulate with service. Postemployment benefi ts that do not vest or accumu-late with service (such as severance based solely on annual pay rather than years of service) are charged to expense when incurred. Our postemployment benefi t plans are unfunded.
72 General Mills
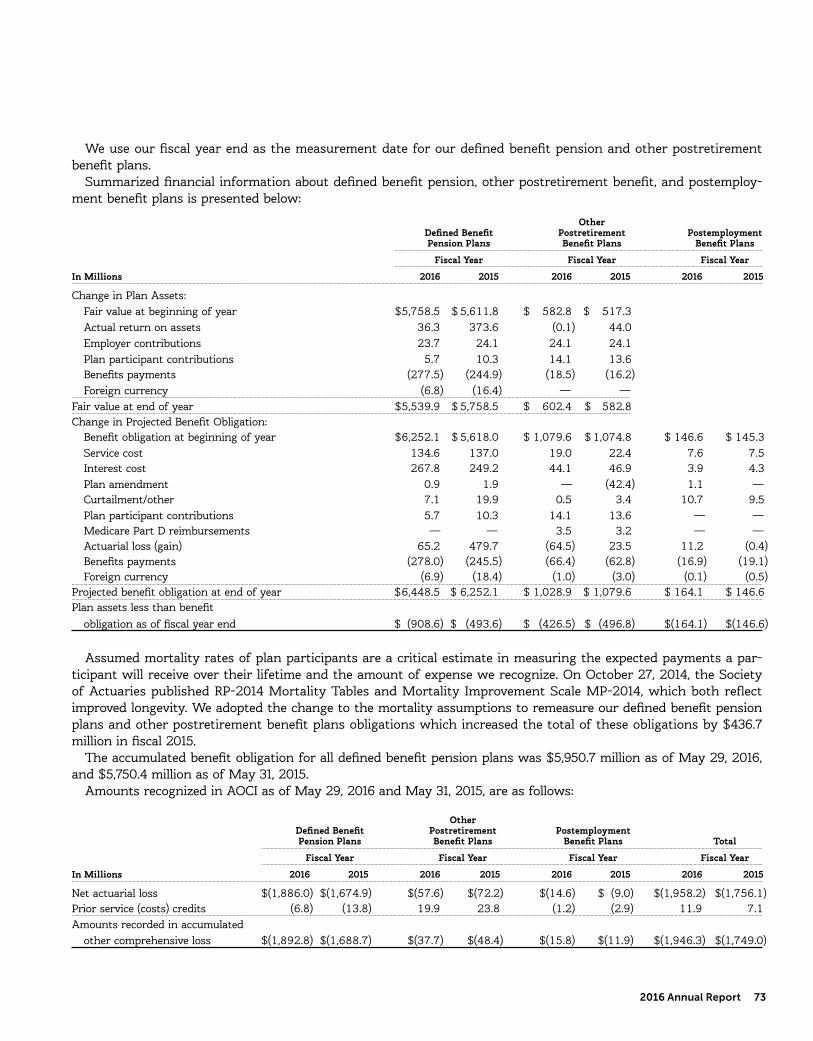
We use our fi scal year end as the measurement date for our defi ned benefi t pension and other postretirement benefi t plans.
Summarized fi nancial information about defi ned benefi t pension, other postretirement benefi t, and postemploy-ment benefi t plans is presented below:
Other Defi ned Benefi t Postretirement Postemployment Pension Plans Benefi t Plans Benefi t Plans
Fiscal Year Fiscal Year Fiscal Year
In Millions 2016 2015 2016 2015 2016 2015
Change in Plan Assets: Fair value at beginning of year $5,758.5 $ 5,611.8 $ 582.8 $ 517.3 Actual return on assets 36.3 373.6 (0.1) 44.0 Employer contributions 23.7 24.1 24.1 24.1 Plan participant contributions 5.7 10.3 14.1 13.6 Benefi ts payments (277.5) (244.9) (18.5) (16.2) Foreign currency (6.8) (16.4) — —Fair value at end of year $5,539.9 $ 5,758.5 $ 602.4 $ 582.8Change in Projected Benefi t Obligation: Benefi t obligation at beginning of year $6,252.1 $ 5,618.0 $ 1,079.6 $ 1,074.8 $ 146.6 $ 145.3 Service cost 134.6 137.0 19.0 22.4 7.6 7.5 Interest cost 267.8 249.2 44.1 46.9 3.9 4.3 Plan amendment 0.9 1.9 — (42.4) 1.1 — Curtailment/other 7.1 19.9 0.5 3.4 10.7 9.5 Plan participant contributions 5.7 10.3 14.1 13.6 — — Medicare Part D reimbursements — — 3.5 3.2 — — Actuarial loss (gain) 65.2 479.7 (64.5) 23.5 11.2 (0.4) Benefi ts payments (278.0) (245.5) (66.4) (62.8) (16.9) (19.1) Foreign currency (6.9) (18.4) (1.0) (3.0) (0.1) (0.5)Projected benefi t obligation at end of year $ 6,448.5 $ 6,252.1 $ 1,028.9 $ 1,079.6 $ 164.1 $ 146.6Plan assets less than benefi t obligation as of fi scal year end $ (908.6) $ (493.6) $ (426.5) $ (496.8) $ (164.1) $ (146.6)
Assumed mortality rates of plan participants are a critical estimate in measuring the expected payments a par-ticipant will receive over their lifetime and the amount of expense we recognize. On October 27, 2014, the Society of Actuaries published RP-2014 Mortality Tables and Mortality Improvement Scale MP-2014, which both refl ect improved longevity. We adopted the change to the mortality assumptions to remeasure our defi ned benefi t pension plans and other postretirement benefi t plans obligations which increased the total of these obligations by $436.7 million in fi scal 2015.
Th e accumulated benefi t obligation for all defi ned benefi t pension plans was $5,950.7 million as of May 29, 2016, and $5,750.4 million as of May 31, 2015.
Amounts recognized in AOCI as of May 29, 2016 and May 31, 2015, are as follows:
Other Defi ned Benefi t Postretirement Postemployment Pension Plans Benefi t Plans Benefi t Plans Total
Fiscal Year Fiscal Year Fiscal Year Fiscal Year
In Millions 2016 2015 2016 2015 2016 2015 2016 2015
Net actuarial loss $(1,886.0) $(1,674.9) $(57.6) $(72.2) $ (14.6) $ (9.0) $(1,958.2) $(1,756.1)Prior service (costs) credits (6.8) (13.8) 19.9 23.8 (1.2) (2.9) 11.9 7.1Amounts recorded in accumulated other comprehensive loss $(1,892.8) $(1,688.7) $(37.7) $(48.4) $(15.8) $(11.9) $(1,946.3) $(1,749.0)
2016 Annual Report 73
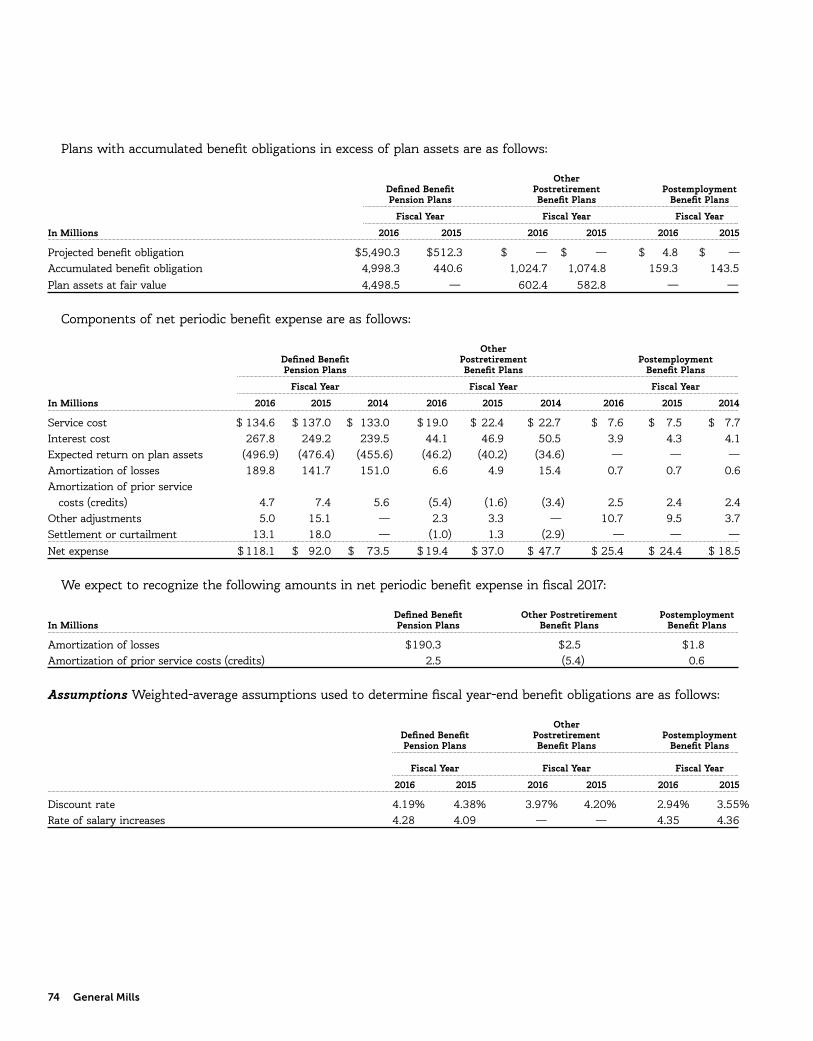
Plans with accumulated benefi t obligations in excess of plan assets are as follows:
Other Defi ned Benefi t Postretirement Postemployment Pension Plans Benefi t Plans Benefi t Plans
Fiscal Year Fiscal Year Fiscal Year
In Millions 2016 2015 2016 2015 2016 2015
Projected benefi t obligation $5,490.3 $512.3 $ — $ — $ 4.8 $ —Accumulated benefi t obligation 4,998.3 440.6 1,024.7 1,074.8 159.3 143.5Plan assets at fair value 4,498.5 — 602.4 582.8 — —
Components of net periodic benefi t expense are as follows:
Other Defi ned Benefi t Postretirement Postemployment Pension Plans Benefi t Plans Benefi t Plans
Fiscal Year Fiscal Year Fiscal Year
In Millions 2016 2015 2014 2016 2015 2014 2016 2015 2014
Service cost $ 134.6 $ 137.0 $ 133.0 $ 19.0 $ 22.4 $ 22.7 $ 7.6 $ 7.5 $ 7.7Interest cost 267.8 249.2 239.5 44.1 46.9 50.5 3.9 4.3 4.1Expected return on plan assets (496.9) (476.4) (455.6) (46.2) (40.2) (34.6) — — —Amortization of losses 189.8 141.7 151.0 6.6 4.9 15.4 0.7 0.7 0.6Amortization of prior service costs (credits) 4.7 7.4 5.6 (5.4) (1.6) (3.4) 2.5 2.4 2.4Other adjustments 5.0 15.1 — 2.3 3.3 — 10.7 9.5 3.7Settlement or curtailment 13.1 18.0 — (1.0) 1.3 (2.9) — — —Net expense $ 118.1 $ 92.0 $ 73.5 $ 19.4 $ 37.0 $ 47.7 $ 25.4 $ 24.4 $ 18.5
We expect to recognize the following amounts in net periodic benefi t expense in fi scal 2017:
Defi ned Benefi t Other Postretirement PostemploymentIn Millions Pension Plans Benefi t Plans Benefi t Plans
Amortization of losses $190.3 $2.5 $1.8Amortization of prior service costs (credits) 2.5 (5.4) 0.6
Assumptions Weighted-average assumptions used to determine fi scal year-end benefi t obligations are as follows:
Other Defi ned Benefi t Postretirement Postemployment Pension Plans Benefi t Plans Benefi t Plans
Fiscal Year Fiscal Year Fiscal Year
2016 2015 2016 2015 2016 2015
Discount rate 4.19% 4.38% 3.97% 4.20% 2.94% 3.55%Rate of salary increases 4.28 4.09 — — 4.35 4.36
74 General Mills

Weighted-average assumptions used to determine fi scal year net periodic benefi t expense are as follows:
Defi ned Benefi t Other Postretirement Postemployment Pension Plans Benefi t Plans Benefi t Plans
Fiscal Year Fiscal Year Fiscal Year
2016 2015 2014 2016 2015 2014 2016 2015 2014
Discount rate 4.38% 4.54% 4.54% 4.20% 4.51% 4.52% 3.55% 3.82% 3.70%Rate of salary increases 4.31 4.44 4.44 — — — 4.36 4.44 4.44Expected long-term rate of return on plan assets 8.53 8.53 8.53 8.14 8.13 8.11 — — —
Discount Rates Our discount rate assumptions are determined annually as of the last day of our fi scal year for our defi ned benefi t pension, other postretirement benefi t, and postemployment benefi t plan obligations. We also use the same discount rates to determine defi ned benefi t pension, other postretirement benefi t, and postemployment benefi t plan income and expense for the following fi scal year. We work with our out-side actuaries to determine the timing and amount of expected future cash outfl ows to plan participants and, using the Aa Above Median corporate bond yield, to
develop a forward interest rate curve, including a mar-gin to that index based on our credit risk. Th is forward interest rate curve is applied to our expected future cash outfl ows to determine our discount rate assumptions.
Fair Value of Plan Assets Th e fair values of our pen-sion and postretirement benefi t plans’ assets and their respective levels in the fair value hierarchy at May 29, 2016 and May 31, 2015, by asset category were as follows:
2016 Annual Report 75

May 29, 2016 May 31, 2015 Total TotalIn Millions Level 1 Level 2 Level 3 Assets Level 1 Level 2 Level 3 Assets
Fair value measurement of pension plan assets: Equity (a) $ 1,543.7 $ 943.7 $ 458.0 $ 2,945.4 $ 1,634.4 $ 1,010.3 $ 542.9 $ 3,187.6 Fixed income (b) 903.8 745.8 — 1,649.6 486.3 1,158.5 — 1,644.8 Real asset investments (c) 193.6 160.8 395.0 749.4 124.3 116.7 498.1 739.1 Other investments (d) — — 0.4 0.4 — — 0.4 0.4 Cash and accruals 195.1 — — 195.1 186.6 — — 186.6Total fair value measurement of pension plan assets $ 2,836.2 $ 1,850.3 $ 853.4 $ 5,539.9 $ 2,431.6 $ 2,285.5 $ 1,041.4 $ 5,758.5Fair value measurement of postretirement benefi t plan assets: Equity (a) $ 128.9 $ 124.1 $ 23.4 $ 276.4 $ 134.0 $ 120.6 $ 23.7 $ 278.3 Fixed income (b) 18.0 83.4 — 101.4 14.0 73.7 — 87.7 Real asset investments (c) — 30.6 13.8 44.4 0.2 25.7 16.6 42.5 Other investments (d) — 171.3 — 171.3 — 168.9 — 168.9 Cash and accruals 8.9 — — 8.9 5.4 — — 5.4Fair value measurement of postretirement benefi t plan assets $ 155.8 $ 409.4 $ 37.2 $ 602.4 $ 153.6 $ 388.9 $ 40.3 $ 582.8
(a) Primarily publicly traded common stock and private equity partnerships for purposes of total return and to maintain equity exposure consistent with policy allocations. Investments include: United States and international equity securities, mutual funds, and equity futures valued at closing prices from national exchanges; and commingled funds, privately held securities, and private equity partnerships valued at unit values or net asset values provided by the invest-ment managers, which are based on the fair value of the underlying investments. Various methods are used to determine fair values and may include the cost of the investment, most recent fi nancing, and expected cash fl ows. For some of these investments, realization of the estimated fair value is dependent upon transactions between willing sellers and buyers.
(b) Primarily government and corporate debt securities and futures for purposes of total return, managing fi xed income exposure to policy allocations, and managing duration targets. Investments include: fi xed income securities and bond futures generally valued at closing prices from national exchanges, fi xed income pricing models, and independent fi nancial analysts; and fi xed income commingled funds valued at unit values provided by the investment managers, which are based on the fair value of the underlying investments.
(c) Publicly traded common stock and limited partnerships in the energy and real estate sectors for purposes of total return. Investments include: energy and real estate securities generally valued at closing prices from national exchanges; and commingled funds, private securities, and limited partnerships valued at unit values or net asset values provided by the investment managers, which are generally based on the fair value of the underlying investments.
(d) Global balanced fund of equity, fi xed income, and real estate securities for purposes of meeting Canadian pension plan asset allocation policies, and insur-ance and annuity contracts to provide a stable stream of income for retirees and to fund postretirement medical benefi ts. Fair values are derived from unit values provided by the investment managers, which are generally based on the fair value of the underlying investments and contract fair values from the providers.
76 General Mills

Th e following table is a roll forward of the Level 3 investments of our pension and postretirement benefi t plans’ assets during the years ended May 29, 2016 and May 31, 2015:
Fiscal 2016
Net Net Purchases, Balance as of Transfers Sales, Issuances, Net Gain Balance as ofIn Millions May 31, 2015 Out and Settlements (Loss) May 29, 2016
Pension benefi t plan assets: Equity $ 542.9 $ — $ (92.6) $ 7.7 $ 458.0 Real asset investments 498.1 — (72.8) (30.3) 395.0 Other investments 0.4 — — — 0.4Fair value activity of level 3 pension plan assets $ 1,041.4 $ — $ (165.4) $ (22.6) $ 853.4Postretirement benefi t plan assets: Equity $ 23.7 $ — $ (1.2) $ 0.9 $ 23.4 Real asset investments 16.6 — (1.8) (1.0) 13.8Fair value activity of level 3 postretirement benefi t plan assets $ 40.3 $ — $ (3.0) $ (0.1) $ 37.2
Fiscal 2015
Net Net Purchases, Balance as of Transfers Sales, Issuances, Net Gain Balance as ofIn Millions May 25, 2014 Out and Settlements (Loss) May 31, 2015
Pension benefi t plan assets: Equity $ 568.2 $ — $ (61.0) $ 35.7 $ 542.9 Real asset investments 602.9 — (18.2) (86.6) 498.1 Other investments 0.3 — 0.2 (0.1) 0.4Fair value activity of level 3 pension plan assets $ 1,171.4 $ — $ (79.0) $ (51.0) $ 1,041.4Postretirement benefi t plan assets: Equity $ 21.1 $ — $ 0.3 $ 2.3 $ 23.7 Real asset investments 17.9 — 0.5 (1.8) 16.6Fair value activity of level 3 postretirement benefi t plan assets $ 39.0 $ — $ 0.8 $ 0.5 $ 40.3
Th e net change in level 3 assets attributable to unre-alized losses at May 29, 2016, was $108.2 million for our pension plan assets and $3.2 million for our postre-tirement benefi t plan assets.
Expected Rate of Return on Plan Assets Our expected rate of return on plan assets is determined by our asset allocation, our historical long-term investment performance, our estimate of future long-term returns by asset class (using input from our actuaries, invest-ment services, and investment managers), and long-term infl ation assumptions. We review this assumption annually for each plan; however, our annual investment performance for one particular year does not, by itself, signifi cantly infl uence our evaluation.
Weighted-average asset allocations for the past two fi scal years for our defi ned benefi t pension and other postretirement benefi t plans are as follows:
Defi ned Benefi t Other Postretirement Pension Plans Benefi t Plans
Fiscal Year Fiscal Year
2016 2015 2016 2015
Asset category: United States equities 30.5% 28.9% 37.2% 38.7% International equities 19.0 18.4 23.4 24.1 Private equities 8.3 9.5 3.9 4.1 Fixed income 28.6 30.3 29.4 26.3 Real assets 13.6 12.9 6.1 6.8Total 100.0% 100.0% 100.0% 100.0%
Th e investment objective for our defi ned benefi t pen-sion and other postretirement benefi t plans is to secure the benefi t obligations to participants at a reasonable cost to us. Our goal is to optimize the long-term return
2016 Annual Report 77

on plan assets at a moderate level of risk. Th e defi ned benefi t pension plan and other postretirement bene-fi t plan portfolios are broadly diversifi ed across asset classes. Within asset classes, the portfolios are further diversifi ed across investment styles and investment organizations. For the defi ned benefi t pension plans, the long-term investment policy allocation is: 25 per-cent to equities in the United States; 15 percent to international equities; 10 percent to private equities; 35 percent to fi xed income; and 15 percent to real assets (real estate, energy, and timber). For other postretire-ment benefi t plans, the long-term investment policy allocations are: 30 percent to equities in the United States; 20 percent to international equities; 10 percent to private equities; 30 percent to fi xed income; and 10 percent to real assets (real estate, energy, and timber). Th e actual allocations to these asset classes may vary tactically around the long-term policy allocations based on relative market valuations.
Contributions and Future Benefi t Payments We do not expect to be required to make contributions to our defi ned benefi t pension, other postretirement benefi t, and postemployment benefi t plans in fi scal 2017. Actual fi scal 2017 contributions could exceed our current pro-jections, as infl uenced by our decision to undertake discretionary funding of our benefi t trusts and future changes in regulatory requirements. Estimated bene-fi t payments, which refl ect expected future service, as appropriate, are expected to be paid from fi scal 2017 to 2026 as follows:
Defi ned Other Benefi t Postretirement Medicare Postemployment Pension Benefi t Plans Subsidy Benefi tIn Millions Plans Gross Payments Receipts Plans
2017 $ 277.7 $ 61.3 $ 4.8 $ 22.12018 287.9 65.5 5.2 20.62019 297.1 67.1 5.6 19.22020 306.8 68.3 5.2 17.82021 316.4 69.2 4.2 17.02022-2026 1,731.5 355.2 23.2 75.6
Defi ned Contribution Plans Th e General Mills Savings Plan is a defi ned contribution plan that covers domestic salaried, hourly, nonunion, and certain union employ-ees. Th is plan is a 401(k) savings plan that includes a number of investment funds, including a Company stock fund and an Employee Stock Ownership Plan
(ESOP). We sponsor another money purchase plan for certain domestic hourly employees with net assets of $21.0 million as of May 29, 2016, and $21.9 million as of May 31, 2015. We also sponsor defi ned contribution plans in many of our foreign locations. Our total recog-nized expense related to defi ned contribution plans was $61.2 million in fi scal 2016, $44.0 million in fi scal 2015, and $44.8 million in fi scal 2014.
We match a percentage of employee contributions to the General Mills Savings Plan. Th e Company match is directed to investment options of the participant’s choosing. Th e number of shares of our common stock allocated to participants in the ESOP was 6.9 million as of May 29, 2016, and 7.5 million as of May 31, 2015. Th e ESOP’s only assets are our common stock and tempo-rary cash balances.
Th e Company stock fund and the ESOP collectively held $711.5 million and $655.6 million of Company common stock as of May 29, 2016 and May 31, 2015, respectively.
NOTE 14. INCOME TAXES
Th e components of earnings before income taxes and aft er-tax earnings from joint ventures and the corre-sponding income taxes thereon are as follows:
Fiscal YearIn Millions 2016 2015 2014
Earnings before income taxes and aft er-tax earnings from joint ventures: United States $1,941.4 $1,338.6 $2,181.4 Foreign 462.2 423.3 473.6Total earnings before income taxes and aft er-tax earnings from joint ventures $ 2,403.6 $ 1,761.9 $ 2,655.0Income taxes: Currently payable: Federal $ 489.8 $ 392.7 $ 526.7 State and local 30.8 29.3 37.8 Foreign 114.0 139.5 146.3 Total current 634.6 561.5 710.8 Deferred: Federal 123.0 70.3 159.1 State and local (6.9) (8.7) 21.3 Foreign 4.5 (36.3) (7.9) Total deferred 120.6 25.3 172.5Total income taxes $ 755.2 $ 586.8 $ 883.3
78 General Mills
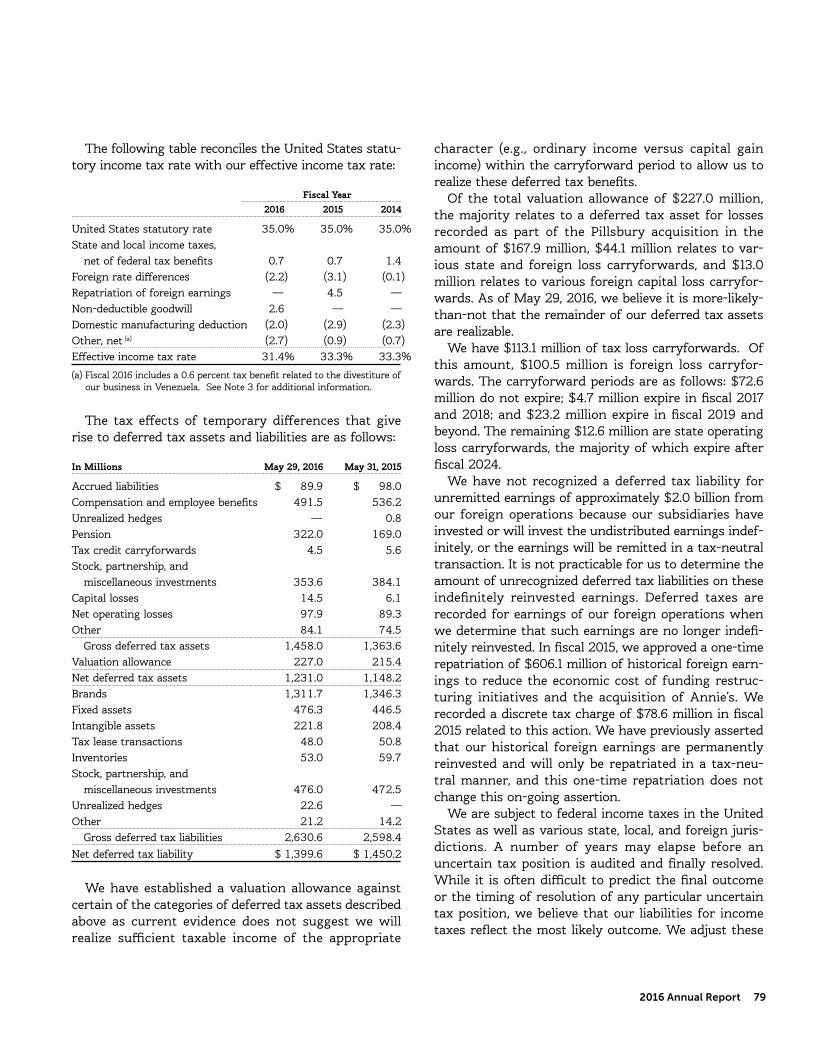
Th e following table reconciles the United States statu-tory income tax rate with our eff ective income tax rate:
Fiscal Year 2016 2015 2014
United States statutory rate 35.0% 35.0% 35.0%State and local income taxes, net of federal tax benefi ts 0.7 0.7 1.4 Foreign rate diff erences (2.2) (3.1) (0.1) Repatriation of foreign earnings — 4.5 —Non-deductible goodwill 2.6 — —Domestic manufacturing deduction (2.0) (2.9) (2.3) Other, net (a) (2.7) (0.9) (0.7) Eff ective income tax rate 31.4% 33.3% 33.3%
(a) Fiscal 2016 includes a 0.6 percent tax benefi t related to the divestiture of our business in Venezuela. See Note 3 for additional information.
Th e tax eff ects of temporary diff erences that give rise to deferred tax assets and liabilities are as follows:
In Millions May 29, 2016 May 31, 2015
Accrued liabilities $ 89.9 $ 98.0Compensation and employee benefi ts 491.5 536.2Unrealized hedges — 0.8Pension 322.0 169.0Tax credit carryforwards 4.5 5.6Stock, partnership, and miscellaneous investments 353.6 384.1Capital losses 14.5 6.1Net operating losses 97.9 89.3Other 84.1 74.5 Gross deferred tax assets 1,458.0 1,363.6Valuation allowance 227.0 215.4Net deferred tax assets 1,231.0 1,148.2Brands 1,311.7 1,346.3Fixed assets 476.3 446.5Intangible assets 221.8 208.4Tax lease transactions 48.0 50.8Inventories 53.0 59.7Stock, partnership, and miscellaneous investments 476.0 472.5Unrealized hedges 22.6 —Other 21.2 14.2 Gross deferred tax liabilities 2,630.6 2,598.4Net deferred tax liability $ 1,399.6 $ 1,450.2
We have established a valuation allowance against certain of the categories of deferred tax assets described above as current evidence does not suggest we will realize suffi cient taxable income of the appropriate
character (e.g., ordinary income versus capital gain income) within the carryforward period to allow us to realize these deferred tax benefi ts.
Of the total valuation allowance of $227.0 million, the majority relates to a deferred tax asset for losses recorded as part of the Pillsbury acquisition in the amount of $167.9 million, $44.1 million relates to var-ious state and foreign loss carryforwards, and $13.0 million relates to various foreign capital loss carryfor-wards. As of May 29, 2016, we believe it is more-likely-than-not that the remainder of our deferred tax assets are realizable.
We have $113.1 million of tax loss carryforwards. Of this amount, $100.5 million is foreign loss carryfor-wards. Th e carryforward periods are as follows: $72.6 million do not expire; $4.7 million expire in fi scal 2017 and 2018; and $23.2 million expire in fi scal 2019 and beyond. Th e remaining $12.6 million are state operating loss carryforwards, the majority of which expire aft er fi scal 2024.
We have not recognized a deferred tax liability for unremitted earnings of approximately $2.0 billion from our foreign operations because our subsidiaries have invested or will invest the undistributed earnings indef-initely, or the earnings will be remitted in a tax-neutral transaction. It is not practicable for us to determine the amount of unrecognized deferred tax liabilities on these indefi nitely reinvested earnings. Deferred taxes are recorded for earnings of our foreign operations when we determine that such earnings are no longer indefi -nitely reinvested. In fi scal 2015, we approved a one-time repatriation of $606.1 million of historical foreign earn-ings to reduce the economic cost of funding restruc-turing initiatives and the acquisition of Annie’s. We recorded a discrete tax charge of $78.6 million in fi scal 2015 related to this action. We have previously asserted that our historical foreign earnings are permanently reinvested and will only be repatriated in a tax-neu-tral manner, and this one-time repatriation does not change this on-going assertion.
We are subject to federal income taxes in the United States as well as various state, local, and foreign juris-dictions. A number of years may elapse before an uncertain tax position is audited and fi nally resolved. While it is oft en diffi cult to predict the fi nal outcome or the timing of resolution of any particular uncertain tax position, we believe that our liabilities for income taxes refl ect the most likely outcome. We adjust these
2016 Annual Report 79

liabilities, as well as the related interest, in light of chang-ing facts and circumstances. Settlement of any particu-lar position would usually require the use of cash.
Th e number of years with open tax audits varies depending on the tax jurisdiction. Our major taxing jurisdictions include the United States (federal and state) and Canada. Various tax examinations by United States state taxing authorities could be conducted for any open tax year, which vary by jurisdiction, but are generally from 3 to 5 years.
Th e Internal Revenue Service (IRS) is currently audit-ing our federal tax returns for fi scal 2013 and 2014. Several state and foreign examinations are currently in progress. We do not expect these examinations to result in a material impact on our results of operations or fi nancial position.
During fi scal 2014, the IRS concluded its fi eld exam-ination of our federal tax returns for fi scal 2011 and 2012. Th e audit closure and related adjustments did not have a material impact on our results of operations or fi nancial position. As of May 29, 2016, we have eff ec-tively settled all issues with the IRS for fi scal years 2012 and prior.
We apply a more-likely-than-not threshold to the rec-ognition and derecognition of uncertain tax positions. Accordingly, we recognize the amount of tax benefi t that has a greater than 50 percent likelihood of being ultimately realized upon settlement. Future changes in judgment related to the expected ultimate resolution of uncertain tax positions will aff ect earnings in the period of such change.
Th e following table sets forth changes in our total gross unrecognized tax benefit liabilities, exclud-ing accrued interest, for fi scal 2016 and fi scal 2015. Approximately $79 million of this total in fi scal 2016 represents the amount that, if recognized, would aff ect our eff ective income tax rate in future periods. Th is amount diff ers from the gross unrecognized tax benefi ts presented in the table because certain of the liabilities below would impact deferred taxes if recog-nized. We also would record a decrease in U.S. federal income taxes upon recognition of the state tax benefi ts included therein.
Fiscal YearIn Millions 2016 2015
Balance, beginning of year $161.1 $150.9Tax positions related to current year: Additions 31.6 34.8Tax positions related to prior years: Additions 23.9 17.4 Reductions (25.7) (21.8) Settlements (4.0) (12.0)Lapses in statutes of limitations (10.4) (8.2)Balance, end of year $176.5 $161.1
As of May 29, 2016, we expect to pay approximately $14.7 million of unrecognized tax benefi t liabilities and accrued interest within the next 12 months. We are not able to reasonably estimate the timing of future cash fl ows beyond 12 months due to uncertainties in the timing of tax audit outcomes. Th e remaining amount of our unrecognized tax liability was classifi ed in other liabilities.
We report accrued interest and penalties related to unrecognized tax benefi t liabilities in income tax expense. For fi scal 2016, we recognized a net benefi t of $2.7 million of tax-related net interest and penalties, and had $32.1 million of accrued interest and penalties as of May 29, 2016. For fi scal 2015, we recognized a net benefi t of $0.2 million of tax-related net interest and penalties, and had $35.2 million of accrued interest and penalties as of May 31, 2015.
NOTE 15. LEASES, OTHER COMMITMENTS, AND CONTINGENCIES
The Company’s leases are generally for warehouse space and equipment. Rent expense under all operating leases from continuing operations was $189.1 million, $193.5 million, and $189.0 million in fi scal 2016, 2015, and 2014, respectively.
Some operating leases require payment of property taxes, insurance, and maintenance costs in addition to the rent payments. Contingent and escalation rent in excess of minimum rent payments and sublease income netted in rent expense were insignifi cant.
80 General Mills
Noncancelable future lease commitments are:
Operating CapitalIn Millions Leases Leases
2017 $ 107.9 $ 0.92018 83.5 0.72019 67.2 0.62020 49.6 0.32021 39.6 0.1Aft er 2021 49.8 0.1Total noncancelable future lease commitments $ 397.6 $ 2.7Less: interest (0.2)Present value of obligations under capital leases $ 2.5
Th ese future lease commitments will be partially off -set by estimated future sublease receipts of approxi-mately $1 million. Depreciation on capital leases is recorded as depreciation expense in our results of operations.
As of May 29, 2016, we have issued guarantees and comfort letters of $383.2 million for the debt and other obligations of consolidated subsidiaries, and guarantees and comfort letters of $239.1 million for the debt and other obligations of non-consolidated affi liates, mainly CPW. In addition, off-balance sheet arrangements are generally limited to the future payments under non-cancelable operating leases, which totaled $397.6 million as of May 29, 2016.
NOTE 16. BUSINESS SEGMENT AND GEOGRAPHIC INFORMATION
We operate in the consumer foods industry. We have three operating segments by type of customer and geographic region as follows: U.S. Retail, 60.4 percent of our fi scal 2016 consolidated net sales; International, 28.0 percent of our fi scal 2016 consolidated net sales; and Convenience Stores and Foodservice, 11.6 percent of our fi scal 2016 consolidated net sales.
In fi scal 2015, we changed how we assess operating segment performance to exclude the asset and liability remeasurement impact from hyperinfl ationary econo-mies. Th is impact is now included in unallocated corpo-rate items. All periods presented have been changed to conform to this presentation.
In fi scal 2015, we realigned certain operating units within our U.S. Retail operating segment. We also changed the name of our Yoplait operating unit to Yogurt and our Big G operating unit to Cereal. Frozen
Foods transitioned into Meals and Baking Products. Small Planet Foods transitioned into Snacks, Cereal, and Meals. Th e Yogurt operating unit was unchanged. We revised the amounts previously reported in the net sales and net sales percentage change by operating unit within our U.S. Retail segment to conform to the new operating unit structure. Th ese realignments had no eff ect on previously reported consolidated net sales, operating segments’ net sales, operating profi t, segment operating profi t, net earnings attributable to General Mills, or EPS. In addition, results from the acquired Annie’s business are included in the Meals and Snacks operating units.
Our chief operating decision maker continues to assess performance and make decisions about resources to be allocated to our segments at the U.S. Retail, International, and Convenience Stores and Foodservice operating segment level.
Our U.S. Retail segment refl ects business with a wide variety of grocery stores, mass merchandisers, mem-bership stores, natural food chains, drug, dollar and discount chains, and e-commerce grocery providers operating throughout the United States. Our product categories in this business segment are ready-to-eat cereals, refrigerated yogurt, soup, meal kits, refrigerated and frozen dough products, dessert and baking mixes, frozen pizza and pizza snacks, grain, fruit and savory snacks, and a wide variety of organic products includ-ing meal kits, granola bars, and cereal.
Our International segment consists of retail and foodservice businesses outside of the United States. Our product categories include ready-to-eat cereals, shelf stable and frozen vegetables, meal kits, refriger-ated and frozen dough products, dessert and baking mixes, frozen pizza snacks, refrigerated yogurt, grain and fruit snacks, and super-premium ice cream and fro-zen desserts. We also sell super-premium ice cream and frozen desserts directly to consumers through owned retail shops. Our International segment also includes products manufactured in the United States for export, mainly to Caribbean and Latin American markets, as well as products we manufacture for sale to our inter-national joint ventures. Revenues from export activities and franchise fees are reported in the region or country where the end customer is located.
In our Convenience Stores and Foodservice segment our major product categories are ready-to-eat cereals, snacks, refrigerated yogurt, frozen meals, unbaked and fully baked frozen dough products, and baking mixes.
2016 Annual Report 81

Many products we sell are branded to the consumer and nearly all are branded to our customers. We sell to distributors and operators in many customer channels including foodservice, convenience stores, vending, and supermarket bakeries. Substantially all of this segment’s operations are located in the United States.
Operating profi t for these segments excludes unallo-cated corporate items, gain on divestitures, and restruc-turing, impairment, and other exit costs. Unallocated corporate items include corporate overhead expenses, variances to planned domestic employee benefi ts and incentives, contributions to the General Mills Foundation, asset and liability remeasurement impact of hyperinfl a-tionary economies, restructuring initiative project-re-lated costs, and other items that are not part of our measurement of segment operating performance. Th ese include gains and losses arising from the revaluation of certain grain inventories and gains and losses from mark-to-market valuation of certain commodity posi-tions until passed back to our operating segments. Th ese items aff ecting operating profi t are centrally managed at the corporate level and are excluded from the measure of segment profi tability reviewed by executive manage-ment. Under our supply chain organization, our man-ufacturing, warehouse, and distribution activities are substantially integrated across our operations in order to maximize effi ciency and productivity. As a result, fi xed assets and depreciation and amortization expenses are neither maintained nor available by operating segment.
Our operating segment results were as follows:
Fiscal YearIn Millions 2016 2015 2014
Net sales: U.S. Retail $10,007.1 $10,507.0 $10,604.9 International 4,632.2 5,128.2 5,385.9 Convenience Stores and Foodservice 1,923.8 1,995.1 1,918.8Total $16,563.1 $17,630.3 $17,909.6Operating profi t: U.S. Retail $ 2,179.0 $ 2,159.3 $ 2,311.5 International 441.6 522.6 535.1 Convenience Stores and Foodservice 378.9 353.1 307.3Total segment operating profi t 2,999.5 3,035.0 3,153.9Unallocated corporate items 288.9 413.8 258.4Divestitures (gain) (148.2) — (65.5)Restructuring, impairment, and other exit costs 151.4 543.9 3.6Operating profi t $ 2,707.4 $ 2,077.3 $ 2,957.4
Net sales by class of similar products were as follows:
Fiscal YearIn Millions 2016 2015 2014
Snacks $ 3,297.2 $ 3,392.0 $ 3,232.5 Convenient meals 2,779.0 2,810.3 2,844.2 Yogurt 2,760.9 2,938.3 2,964.7 Cereal 2,731.5 2,771.3 2,860.1 Dough 1,820.0 1,877.0 1,890.2 Baking mixes and ingredients 1,704.3 1,867.7 1,996.4 Super-premium ice cream 731.2 769.5 756.6 Vegetables 532.3 937.3 1,014.7 Other 206.7 266.9 350.2Total $16,563.1 $17,630.3 $17,909.6
Th e following table provides fi nancial information by geographic area: Fiscal YearIn Millions 2016 2015 2014
Net sales: United States $11,930.9 $12,501.8 $12,523.0 Non-United States 4,632.2 5,128.5 5,386.6Total $16,563.1 $17,630.3 $17,909.6
May 29, May 31,In Millions 2016 2015
Cash and cash equivalents: United States $ 118.5 $ 22.9 Non-United States 645.2 311.3Total $ 763.7 $ 334.2
May 29, May 31,In Millions 2016 2015
Land, buildings, and equipment: United States $ 2,755.1 $ 2,727.5 Non-United States 988.5 1,055.8Total $ 3,743.6 $ 3,783.3
NOTE 17. SUPPLEMENTAL INFORMATION
Th e components of certain Consolidated Balance Sheet accounts are as follows:
May 29, May 31,In Millions 2016 2015
Receivables: Customers $ 1,390.4 $ 1,412.0 Less allowance for doubtful accounts (29.6) (25.3)Total $ 1,360.8 $ 1,386.7
82 General Mills
May 29, May 31,In Millions 2016 2015
Inventories: Raw materials and packaging $ 397.3 $ 390.8 Finished goods 1,163.1 1,268.6 Grain 72.6 95.7 Excess of FIFO over LIFO cost (a) (219.3) (214.2)Total $ 1,413.7 $ 1,540.9
(a) Inventories of $841.0 million as of May 29, 2016, and $867.5 million as of May 31, 2015, were valued at LIFO. During fi scal 2015, LIFO inventory layers were reduced. Results of operations were not materially aff ected by these liquidations of LIFO inventory. Th e diff erence between replace-ment cost and the stated LIFO inventory value is not materially diff er-ent from the reserve for the LIFO valuation method.
May 29, May 31,In Millions 2016 2015
Prepaid expenses and other current assets: Other receivables $ 159.3 $ 148.8 Prepaid expenses 177.9 169.3 Derivative receivables, primarily commodity-related 44.6 80.9 Grain contracts 1.8 3.3 Miscellaneous 15.4 21.5Total $ 399.0 $ 423.8
May 29, May 31,In Millions 2016 2015
Land, buildings, and equipment: Land $ 92.9 $ 96.0 Buildings 2,236.0 2,272.7 Buildings under capital lease 0.3 0.3 Equipment 5,945.6 6,091.1 Equipment under capital lease 3.0 9.8 Capitalized soft ware 523.0 499.0 Construction in progress 702.7 622.2 Total land, buildings, and equipment 9,503.5 9,591.1Less accumulated depreciation (5,759.9) (5,807.8)Total $ 3,743.6 $ 3,783.3
May 29, May 31,In Millions 2016 2015
Other assets: Investments in and advances to joint ventures $ 518.9 $ 530.6 Pension assets 90.9 138.2 Exchangeable note with related party 12.7 30.7 Life insurance 26.3 26.6 Miscellaneous 102.9 85.1Total $ 751.7 $ 811.2
May 29, May 31,In Millions 2016 2015
Other current liabilities: Accrued trade and consumer promotions $ 563.7 $ 564.7 Accrued payroll 386.4 361.8 Dividends payable 23.8 27.9 Accrued taxes 110.5 20.7 Accrued interest, including interest rate swaps 90.4 91.8 Grain contracts 5.5 7.8 Restructuring and other exit costs reserve 76.6 120.8 Derivative payable 35.6 122.9 Miscellaneous 302.5 271.5Total $1,595.0 $1,589.9
May 29, May 31,In Millions 2016 2015
Other noncurrent liabilities: Accrued compensation and benefi ts, including obligations for underfunded other postretirement benefi t and postemployment benefi t plans $1,755.0 $1,451.4 Accrued taxes 204.0 202.5 Miscellaneous 128.6 90.9Total $2,087.6 $1,744.8
Certain Consolidated Statements of Earnings amounts are as follows: Fiscal YearIn Millions 2016 2015 2014
Depreciation and amortization $608.1 $588.3 $585.4Research and development expense 222.1 229.4 243.6Advertising and media expense (including production and communication costs) 754.4 823.1 869.5
Th e components of interest, net are as follows: Fiscal YearExpense (Income), in Millions 2016 2015 2014
Interest expense $319.6 $335.5 $323.4Capitalized interest (7.7) (6.9) (4.9)Interest income (8.1) (13.2) (16.1)Interest, net $303.8 $315.4 $302.4
Certain Consolidated Statements of Cash Flows amounts are as follows: Fiscal YearIn Millions 2016 2015 2014
Cash interest payments $292.0 $305.3 $288.3Cash paid for income taxes 533.8 562.6 757.2
2016 Annual Report 83

NOTE 18. QUARTERLY DATA (UNAUDITED)
Summarized quarterly data for fi scal 2016 and fi scal 2015 follows: First Quarter Second Quarter Th ird Quarter Fourth Quarter Fiscal Year Fiscal Year Fiscal Year Fiscal YearIn Millions, Except Per Share Amounts 2016 2015 2016 2015 2016 2015 2016 2015
Net sales $4,207.9 $4,268.4 $4,424.9 $4,712.2 $4,002.4 $4,350.9 $3,927.9 $4,298.8Gross margin 1,554.6 1,438.7 1,540.6 1,619.1 1,357.5 1,375.9 1,376.8 1,515.5Net earnings attributable to General Mills 426.6 345.2 529.5 346.1 361.7 343.2 379.6 186.8EPS: Basic $ 0.71 $ 0.56 $ 0.88 $ 0.58 $ 0.61 $ 0.57 $ 0.63 $ 0.31 Diluted $ 0.69 $ 0.55 $ 0.87 $ 0.56 $ 0.59 $ 0.56 $ 0.62 $ 0.30Dividends per share $ 0.44 $ 0.41 $ 0.44 $ 0.41 $ 0.44 $ 0.41 $ 0.46 $ 0.44Market price of common stock: High $ 59.55 $ 55.56 $ 59.23 $ 53.82 $ 60.14 $ 55.11 $ 65.36 $ 57.14 Low $ 54.36 $ 50.15 $ 55.41 $ 48.86 $ 54.12 $ 51.13 $ 58.85 $ 51.70
During the fourth quarter of fi scal 2016, we sold our General Mills de Venezuela CA subsidiary to a third party and exited our business in Venezuela. As a result of this transaction, we recorded a pre-tax loss of $37.6 million. In addition, we sold our General Mills Argentina S.A. foodservice business in Argentina to a third party and recorded a pre-tax loss of $14.8 million.
Th e eff ective tax rate for the fourth quarter of fi scal 2016 was 19.2 percent, primarily driven by tax credits and the impact of the divestiture of our business in Venezuela.
During the fourth quarter of fi scal 2015, we made a strategic decision to redirect certain resources supporting our Green Giant business in our U.S. Retail segment to other businesses within the segment. Th erefore, we recorded a $260 million impairment charge in the fourth quarter of fi scal 2015 related to the Green Giant brand intangible asset. See Note 6 for additional information.
During the fourth quarter of fi scal 2015, we approved a one-time repatriation of $606.1 million of foreign earnings and recorded a discrete income tax charge of $78.6 million.
84 General Mills

Accelerated depreciation associated with restructured assets. Th e increase in depreciation expense caused by updating the salvage value and shortening the useful life of depreciable fi xed assets to coincide with the end of production under an approved restructuring plan, but only if impairment is not present.
AOCI. Accumulated other comprehensive income (loss).
Adjusted average total capital. Notes payable, long-term debt including current portion, redeemable inter-est, noncontrolling interests, and stockholders’ equity excluding AOCI, and certain aft er-tax earnings adjust-ments are used to calculate adjusted return on average total capital. Th e average is calculated using the aver-age of the beginning of fi scal year and end of fi scal year Consolidated Balance Sheet amounts for these line items.
Adjusted operating profi t margin. Operating profi t adjusted for certain items aff ecting year-over-year com-parability, divided by net sales.
Adjusted return on average total capital. Net earn-ings including earnings attributable to redeemable and noncontrolling interests, excluding aft er-tax net inter-est, and adjusted for certain items aff ecting year-over-year comparability, divided by adjusted average total capital.
Average total capital. Notes payable, long-term debt including current portion, redeemable interest, noncon-trolling interests, and stockholders’ equity are used to calculate return on average total capital. Th e average is calculated using the average of the beginning of fi scal year and end of fi scal year Consolidated Balance Sheet amounts for these line items.
Constant currency. Financial results translated to U.S. dollars using constant foreign currency exchange rates based on the rates in eff ect for the comparable prior-year period. To present this information, current period results for entities reporting in currencies other than United States dollars are translated into United States dollars at the average exchange rates in eff ect during the corresponding period of the prior fi scal year, rather than the actual average exchange rates in eff ect during the current fi scal year. Th erefore, the foreign currency impact is equal to current year results in local currencies multiplied by the change in the average
foreign currency exchange rate between the current fi scal period and the corresponding period of the prior fi scal year.
Core working capital. Accounts receivable plus inventories less accounts payable, all as of the last day of our fi scal year.
Derivatives. Financial instruments such as futures, swaps, options, and forward contracts that we use to manage our risk arising from changes in commodity prices, interest rates, foreign exchange rates, and equity prices.
Euribor. European Interbank Off ered Rate.
Fair value hierarchy. For purposes of fair value mea-surement, we categorize assets and liabilities into one of three levels based on the assumptions (inputs) used in valuing the asset or liability. Level 1 provides the most reliable measure of fair value, while Level 3 gen-erally requires signifi cant management judgment. Th e three levels are defi ned as follows:
Level 1: Unadjusted quoted prices in active markets for identical assets or liabilities.
Level 2: Observable inputs other than quoted prices included in Level 1, such as quoted prices for similar assets or liabilities in active markets or quoted prices for identical assets or liabili-ties in inactive markets.
Level 3: Unobservable inputs refl ecting management’s assumptions about the inputs used in pricing the asset or liability.
Fixed charge coverage ratio. Th e sum of earnings before income taxes and fi xed charges (before tax), divided by the sum of the fi xed charges (before tax) and interest.
Free cash fl ow. Net cash provided by operating activ-ities less purchases of land, buildings, and equipment.
Free cash flow conversion rate. Free cash flow divided by our net earnings, including earnings attrib-utable to redeemable and noncontrolling interests adjusted for certain items affecting year-over-year comparability.
Glossary
2016 Annual Report 85

Generally accepted accounting principles (GAAP). Guidelines, procedures, and practices that we are required to use in recording and reporting accounting information in our fi nancial statements.
Goodwill. Th e diff erence between the purchase price of acquired companies plus the fair value of any non-controlling and redeemable interests and the related fair values of net assets acquired.
Gross margin. Net sales less cost of sales.
Hedge accounting. Accounting for qualifying hedges that allows changes in a hedging instrument’s fair value to off set corresponding changes in the hedged item in the same reporting period. Hedge accounting is permit-ted for certain hedging instruments and hedged items only if the hedging relationship is highly eff ective, and only prospectively from the date a hedging relationship is formally documented.
LIBOR. London Interbank Off ered Rate.
Mark-to-market. Th e act of determining a value for fi nancial instruments, commodity contracts, and related assets or liabilities based on the current market price for that item.
Net mark-to-market valuation of certain commod-ity positions. Realized and unrealized gains and losses on derivative contracts that will be allocated to seg-ment operating profi t when the exposure we are hedg-ing aff ects earnings.
Net price realization. Th e impact of list and pro-moted price changes, net of trade and other price pro-motion costs.
Noncontrolling interests. Interests of subsidiaries held by third parties.
Notional principal amount. Th e principal amount on which fi xed-rate or fl oating-rate interest payments are calculated.
OCI. Other comprehensive income (loss).
Operating cash fl ow conversion rate. Net cash pro-vided by operating activities, divided by net earnings, including earnings attributable to redeemable and non-controlling interests.
Operating cash fl ow to debt ratio. Net cash provided by operating activities, divided by the sum of notes pay-able and long-term debt, including the current portion.
Organic net sales growth. Net sales growth adjusted for foreign currency translation, as well as acquisitions, divestitures, and a 53rd week impact, when applicable.
Project-related costs. Costs incurred related to our restructuring initiatives not included in restructuring charges.
Redeemable interest. Interest of subsidiaries held by a third party that can be redeemed outside of our control and therefore cannot be classifi ed as a noncon-trolling interest in equity.
Reporting unit. An operating segment or a business one level below an operating segment.
Return on average total capital. Net earnings includ-ing earnings attributable to redeemable and noncon-trolling interests, excluding after-tax net interest, divided by average total capital.
Segment operating profi t margin. Segment operat-ing profi t divided by net sales for the segment.
SKU. Shop keeping unit.
Supply chain input costs. Costs incurred to produce and deliver product, including costs for ingredients and conversion, inventory management, logistics, and warehousing.
Total debt. Notes payable and long-term debt, includ-ing current portion.
Translation adjustments. Th e impact of the con-version of our foreign affi liates’ fi nancial statements to U.S. dollars for the purpose of consolidating our fi nan-cial statements.
Variable interest entities (VIEs). A legal structure that is used for business purposes that either (1) does not have equity investors that have voting rights and share in all the entity’s profi ts and losses or (2) has equity investors that do not provide suffi cient fi nancial resources to support the entity’s activities.
Working capital. Current assets and current liabili-ties, all as of the last day of our fi scal year.
86 General Mills
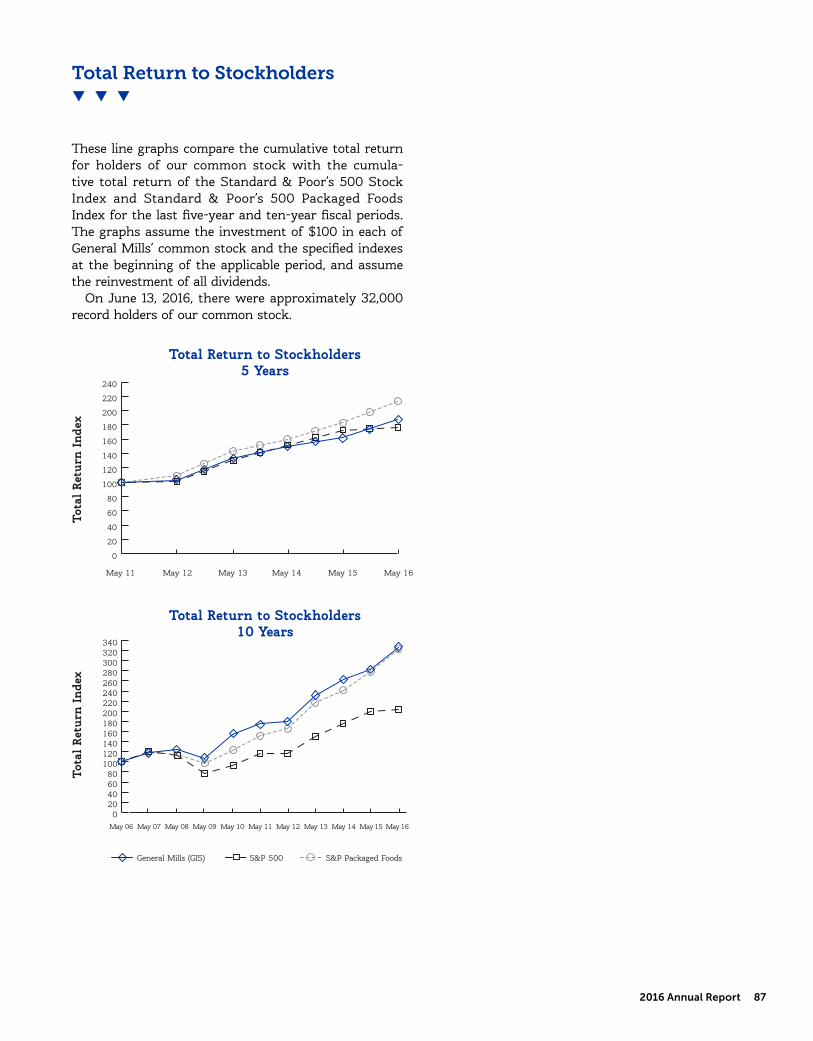
Tota
l Ret
urn
Inde
x
Total Return to Stockholders5 Years
May 11 May 12 May 13 May 14 May 15 May 16
0
20
40
60
80
100
120
140
160
180
200
220
240
Tota
l Ret
urn
Inde
x
Total Return to Stockholders10 Years
May 06 May 07 May 08 May 09 May 10 May 11 May 12 May 13 May 14 May 15 May 16
General Mills (GIS) S&P 500 S&P Packaged Foods
020406080
100120140160180200220240260280300320340
Total Return to Stockholders
Th ese line graphs compare the cumulative total return for holders of our common stock with the cumula-tive total return of the Standard & Poor’s 500 Stock Index and Standard & Poor’s 500 Packaged Foods Index for the last fi ve-year and ten-year fi scal periods. Th e graphs assume the investment of $100 in each of General Mills’ common stock and the specifi ed indexes at the beginning of the applicable period, and assume the reinvestment of all dividends.
On June 13, 2016, there were approximately 32,000 record holders of our common stock.
2016 Annual Report 87
Board of Directors �As of August 1, 2016
Bradbury H. Anderson 2*,5
Retired Chief Executive Officer and Vice Chairman, Best Buy Co., Inc. (electronics retailer)
R. Kerry Clark 3,4,**
Retired Chairman and Chief Executive Officer, Cardinal Health, Inc.(medical services and supplies)
David M. Cordani 1,2
President and Chief Executive Officer, Cigna Corporation(health insurance and services)
Paul Danos 3,5,†
Dean Emeritus, Tuck School of Business and Laurence F. Whittemore Professor of Business Administration, Dartmouth College
Roger W. Ferguson Jr. 3,4
President and Chief Executive Officer, TIAA (financial services)
Henrietta H. Fore 4,5*
Chairman and Chief Executive Officer, Holsman International (manufacturing, consulting and investment services)
Maria G. Henry 1,2
Senior Vice President and Chief Financial Officer, Kimberly-Clark Corporation(consumer products)
Heidi G. Miller 1*,3
Retired President, J.P. Morgan International,J.P. Morgan Chase & Co. (banking and financial services)
Steve Odland 2,4* President and Chief Executive Officer, Committee for Economic Development(public policy) and Former Chairman and Chief Executive Officer, Office Depot, Inc. (office products retailer)
Kendall J. Powell Chairman and Chief Executive Officer, General Mills, Inc.
Michael D. Rose 2,4,†
Retired Chairman of the Board, First Horizon National Corporation (banking and financial services)
Robert L. Ryan 1,3*
Retired Senior Vice President and Chief Financial Officer, Medtronic, Inc. (medical technology)
Eric D. Sprunk 1,5
Chief Operating Officer, NIKE, Inc.(athletic footwear and apparel)
Dorothy A. Terrell 4,5
Managing Partner, FirstCap Advisors(venture capital)
Jorge A. Uribe 2,5
Retired Global Productivity and Organization Transformation Officer, Procter & Gamble Company (consumer products)
Board Committees
1 Audit
2 Compensation
3 Finance
4 Corporate Governance
5 Public Responsibility
* Denotes Committee Chair
** Independent Lead Director
† Retiring from the board
September 2016
Senior Management �As of August 1, 2016
Richard C. AllendorfSenior Vice President; General Counsel and Secretary
Gary ChuSenior Vice President;President, Greater China
John R. ChurchExecutive Vice President,Supply Chain
David V. ClarkVice President; President, Yogurt USA
Mary J. EkmanSenior Vice President,U.S. Retail Finance
Peter C. EricksonExecutive Vice President,Innovation, Technology and Quality
Olivier FaujourVice President; President, International Yogurt and Ice Cream Strategic Business Unit
Ricardo FernandezVice President; President, Latin America
John M. ForakerVice President; President, Annie’s Foods
Jeffrey L. HarmeningPresident; Chief Operating Officer
David P. HomerSenior Vice President;Chief Executive Officer,Cereal Partners Worldwide
Christina LawVice President; President, Asia, Middle East and Africa
Michele S. MeyerSenior Vice President;President, Meals
Donal L. MulliganExecutive Vice President;Chief Financial Officer
James H. MurphySenior Vice President; President, Big G Cereals
Kimberly A. NelsonSenior Vice President,External Relations; President, General Mills Foundation
Elizabeth M. NordlieVice President;President, Baking
Jonathon J. NudiSenior Vice President; President, Europe, Australia and New Zealand
Shawn P. O’GradySenior Vice President; President, Sales and Channel Development
Christopher D. O’LearyExecutive Vice President;Chief Operating Officer,International
Kendall J. PowellChairman and Chief Executive Officer
Bethany C. QuamVice President; President, Convenience Stores and Foodservice
Ann W. H. SimondsSenior Vice President;Chief Marketing Officer
Anton V. VincentVice President; President, Snacks
Sean N. Walker*Senior Vice President
Jacqueline R. Williams-RollSenior Vice President;Chief Human Resources Officer
Keith A. WoodwardSenior Vice President;Treasurer
Jerald A. YoungVice President; Controller
*on leave of absence
88 General Mills

Shareholder Information
World HeadquartersNumber One General Mills BoulevardMinneapolis, MN 55426-1347Phone: (763) 764-7600
WebsiteGeneralMills.com
MarketsNew York Stock ExchangeTrading Symbol: GIS
Independent AuditorKPMG LLP4200 Wells Fargo Center90 South Seventh StreetMinneapolis, MN 55402-3900Phone: (612) 305-5000
Investor InquiriesGeneral Shareholder Information:Investor Relations DepartmentPhone: (800) 245-5703 or (763) 764-3202
Analysts/Investors:Jeff SiemonDirector, Investor RelationsPhone: (763) 764-2301
Transfer Agent and RegistrarOur transfer agent can assist you with a variety of services, including change of address or questions about dividend checks:
Wells Fargo Bank, N.A.1110 Centre Pointe CurveMendota Heights, MN 55120-4100Phone: (800) 670-4763 or (651) 450-4084shareowneronline.com
Electronic Access to Proxy Statement, Annual Report and Form 10-KShareholders who have access to the Internet are encouraged to enroll in the electronic delivery program. Please see the Investors section of GeneralMills.com, or go directly to the website, ICSDelivery.com/GIS and follow the instructions to enroll. If your General Mills shares are not registered in your name, contact your bank or broker to enroll in this program.
Notice of Annual MeetingThe annual meeting of shareholders will be held at 8:30 AM, Central Daylight Time, Tuesday, Sept. 27, 2016, at the Radisson Blu Hotel in downtown Minneapolis at 35 South Seventh Street, Minneapolis, MN 55402. Proof of share ownership is required for admission. Please refer to the Proxy Statement for information concerning admission to the meeting.
General Mills Direct Stock Purchase PlanThis plan provides a convenient and economical way to invest in General Mills stock. You can increase your ownership over time through purchases of common stock and reinvestment of cash dividends, without paying brokerage commissions and other fees on your purchases and reinvestments. For more information and a copy of a plan prospectus, go to the Investors section of GeneralMills.com.
Holiday Gift Boxes
General Mills Gift Boxes are a part of many shareholders’ December holiday traditions. To request an order form, call us toll-free at (888) 496-7809 or write, including your name, street address, city, state, ZIP code and phone number (including area code) to:
2016 General Mills Holiday Gift BoxDepartment 11045P.O. Box 5016Stacy, MN 55078-5016
Or you can place an order online at: GMIHolidayGiftBox.com
Please contact us after October 15, 2016.
Global Responsibility Report
For 150 years, General Mills has been serving the world by making food people love. Our goal is to continue doing so by treating the world, its resources and people with care. We are committed to providing convenient, nutritious food for consumers globally. We promote environmentally and socially responsible practices to protect the resources upon which our business depends. And we work to strengthen communities through philanthropy and volunteerism and by increasing food security worldwide.
For a comprehensive review of our commitment to stand among the most socially responsible food companies in the world, see our Global Responsibility Report available at GeneralMills.com/Responsibility.
This report is printed on recycled paper. © 2016 General MillsDe
sig
n b
y A
dd
iso
n
ww
w.a
dd
iso
n.c
om
P
rin
tin
g b
y G
LS
Co
mp
anie
s
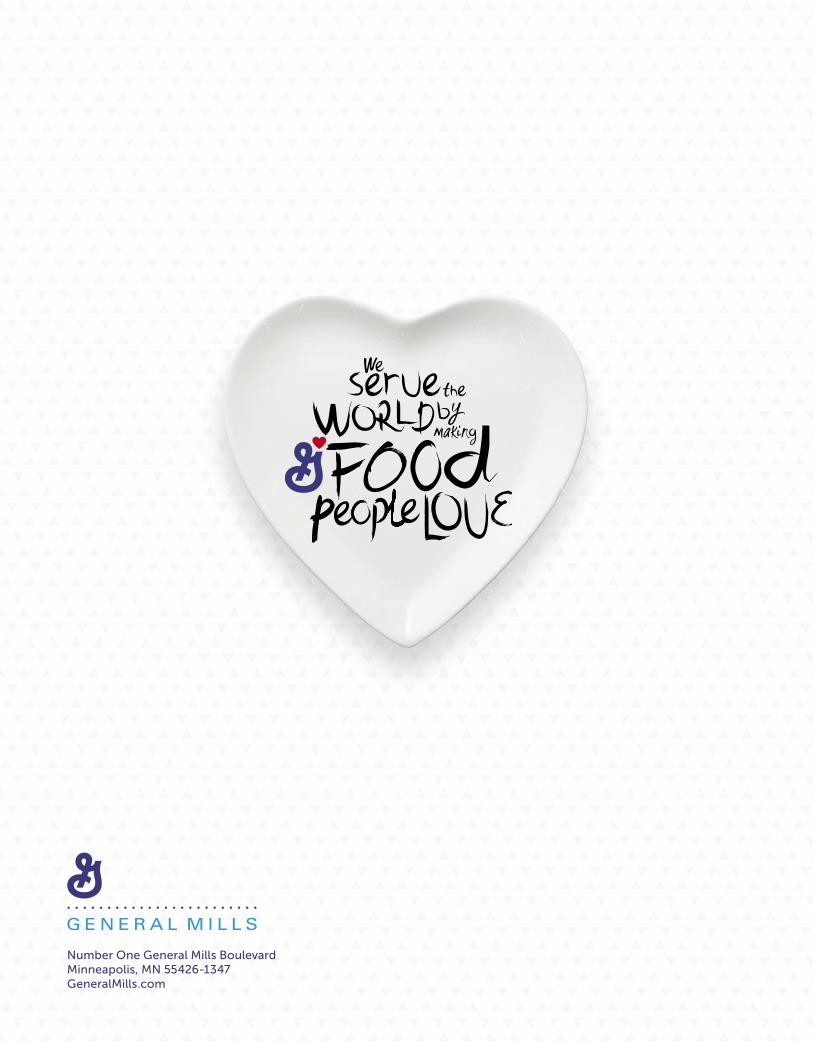
Number One General Mills BoulevardMinneapolis, MN 55426-1347GeneralMills.com