growth rates and the definition of old-growth
TRANSCRIPT

GROWTH RATES AND THE DEFINITION OF OLD-GROWTH
IN FORESTED WETLANDS OF THE PUGET SOUND REGION
by
LUKE PAINTER
A ThesisSubmitted in partial fulfillment
of the requirements for the degreeMaster of Environmental Studies
The Evergreen State CollegeApril 2007


This Thesis for the Master of Environmental Studies Degreeby
Luke Painter
has been approved for
The Evergreen State College
by


ABSTRACT
Growth Rates and the Definition of Old-growthin Forested Wetlands of the Puget Sound Region
Luke Painter
As part of a program to protect rare habitats in Washington State, state agencieshave adopted definitions of mature and old-growth forest, with minimum size andage criteria for the largest trees. State wetland rating and functional assessmentguidelines use these criteria to identify mature and old-growth forested wetlands;however, these forest definitions are based on the characteristics of Douglas-firforests in upland habitats, and are not applicable to forested wetlands. In thisstudy, data from forested wetlands in the Puget Lowlands were analyzed withlinear regression to estimate growth rates for five tree species: western red cedar,Sitka spruce, western hemlock, red alder and coast pine. For these species,estimated diameter is significantly smaller than the mature and old-growth sizecriteria. Estimated average diameter for mature forest is 18 inches (46 cm), andfor old-growth 27 inches (69 cm). Trees in some wetland types averagesignificantly smaller than these mean values. The estimated average diameter formature forest in the Snohomish River estuary is 15 inches (38 cm). Coast pine andother trees in sphagnum bogs are typically smaller than even this low estimate,and require a separate criterion if they are to be identified as mature or old-growthbased on size. Analysis of height data indicates that trees in forested wetlands arein a low to moderate range of productivity and size. Ecological characteristicssuch as plant associations and forest succession are also different in forestedwetlands, compared to upland forests.
Painter, Luke. 2007. Growth Rates and the Definition of Old-growth in ForestedWetlands of the Puget Sound Region. Master of Environmental Studies thesis, TheEvergreen State College, Olympia, Washington.


iii
TABLE OF CONTENTS
1 Introduction................................................................................................................ 12 Forests, Wetlands, and Old-growth Definitions ......................................................... 3
2.1 The Puget Lowlands Region ............................................................................. 32.2 Wetland Types and Plant Associations ............................................................. 42.3 Upland Plants in Wetlands ................................................................................ 82.4 Wetland Forest Succession................................................................................ 92.5 Old-growth and Mature Forest Definitions ..................................................... 10
3 Methods ................................................................................................................... 143.1 Sampling and Data Groups.............................................................................. 143.2 Analysis methods ............................................................................................ 18
3.2.1 Site index................................................................................................ 183.2.2 Dbh Estimates......................................................................................... 203.2.3 Variation and Correlation ....................................................................... 213.2.4 Outliers ................................................................................................... 23
4 Results and Discussion............................................................................................. 264.1 Estimates of Site Index.................................................................................... 264.2 Old-growth and Mature Forest Criteria ........................................................... 27
4.2.1 Old-growth Evaluation ........................................................................... 274.2.2 Mature Forest Evaluation ....................................................................... 29
4.3 Growth Rate Analysis and Expected Values ................................................... 314.3.1 Western Red Cedar (Thuja plicata) ........................................................ 324.3.2 Sitka Spruce (Picea sitchensis), in Organic Soils ................................... 334.3.3 Sitka Spruce (Picea sitchensis), in Mineral Soils (Snohomish Estuary). 344.3.4 Western Hemlock (Tsuga heterophylla) ................................................. 364.3.5 Red Alder (Alnus rubra), in Organic Soils ............................................. 374.3.6 Red Alder (Alnus rubra), in Mineral Soils ............................................. 384.3.7 Coast pine (Pinus contorta var. contorta)............................................... 39
4.4 Other Wetland Tree Species............................................................................ 405 Conclusion ............................................................................................................... 43
5.1 Recommendations ........................................................................................... 45References ........................................................................................................................ 48Acronyms ......................................................................................................................... 51Appendix A: Expected Diameter and Regression Results ................................................ 53Appendix B: Mean Diameter, Age, and Summary Statistics for Wetland Stands ............ 61Appendix C: Stand Height and Site Index ........................................................................ 67
Site Index Equations..................................................................................................... 70Appendix D: Data Tables ................................................................................................. 71Appendix E: Wetland Indicator Categories ...................................................................... 85

iv
TABLES
Table 1. Sample Sites and Counts.................................................................................... 18Table A-1. Linear Regression Results ............................................................................. 53Table B-1. Mean Diameter, Age, and Summary Statistics .............................................. 61Table C-1. Stand Height and Site Index .......................................................................... 67Table C-2. Reference Site Indexes................................................................................... 70Table D-1. Forested Wetland Data .................................................................................. 71Table E-1. Wetland Indicator Categories......................................................................... 85
FIGURES
Figure 1. Washington State Physiographic Regions .......................................................... 3Figure 2. Site Index curves for western hemlock, the S-shaped growth function......................................................................................................................................... 20Figure A-1. Western Red Cedar (Thuja plicata) Regression Results .............................. 54Figure A-2. Sitka Spruce (Picea sitchensis) Regression Results for Organic Soils......................................................................................................................................... 55Figure A-3. Sitka Spruce (Picea Sitchensis) Regression Results for Mineral Soils,Primarily the Snohomish Estuary .................................................................................... 56Figure A-4. Western Hemlock (Tsuga heterophylla) Regression Results ....................... 57Figure A-5. Red Alder (Alnus rubra) Regression Results for Organic Soils ................... 58Figure A-6. Red Alder (Alnus rubra) Regression Results for Mineral Soils ................... 59Figure A-7. Coast pine (Pinus contorta) Regression Results .......................................... 60

v
ACKNOWLEDGEMENTS
Sarah Cooke provided guidance and support, including financial support. Thanksto Paul Butler for encouragement, patience, and help with the statistical analysis.Frederica Bowcutt gave helpful comments and advice. The editing andsuggestions from all three of these reviewers greatly improved the quality of thispaper. Kate McWiggins showed me how to core a tree. Gretchen Herron passedon everything she knew about the project. Gary Smith, Scott Moore, and JacquieGauthier collected data in the Snohomish Estuary. Charlie Newling introduced meto Hylebos Wetland. Thanks to the volunteers who assisted in data collectionduring the 13-year span of this project, especially Rip Pratt, who sampled a lot oftrees and helped start the analysis. Thanks to Wayde Schaible of the WashingtonDepartment of Natural Resources, Eric Beach of Green Diamond ResourceCompany, and the Friends of the Hylebos Wetland for permission to sample somekey wetland sites.


1
Growth Rates and the Definition of Old-growth in Forested Wetlands of the PugetSound Region
1 Introduction
In National Forests of the Pacific Northwest, logging of large old trees came to a halt in
1991, when challenged under the provisions of the Endangered Species Act. The
controversy centered on the habitat needs of northern spotted owls (Strix occidentalis
caurina), which are dependent upon old-growth forests. Researchers with the U.S. Forest
Service (Forest Service) developed definitions of mature and old-growth forest in the
Pacific Northwest, and these definitions were used by the Forest Service and other
agencies to inventory federal land for spotted owl habitat, as part of the Northwest Forest
Plan (FEMAT 1993). Today, the value of old-growth forests as rare and biologically
diverse ecosystems is widely recognized, and regulations at both the federal and state
level have been designed to protect remaining old-growth forest stands.
Wetland old-growth forests are even more rare than upland old-growth. Wetlands
are only a small portion of the landscape, and many wetlands are not forested. In western
Washington, wetlands with mature forest stands are extremely rare, because most
forested areas have been logged at least once in the last century. Washington State
regulations provide a high level of protection for mature forested wetlands, and the
Washington State Department of Ecology (WDOE) provides guidelines for identifying
them in its Washington State wetland rating system for western Washington (Hruby
2004).
Under the WDOE system, wetlands are placed in one of four categories.
Conservation measures are often based on these categories, with Category I wetlands
receiving the highest level of protection. For example, mitigation ratios are higher for
Category I wetlands, and buffer size may be larger (Granger et al. 2005). Since the rating
system assigns mature and old-growth forested wetlands to Category I, these wetlands
may receive more protection than wetlands with younger stands of trees.
Definitions of mature and old-growth forest used by WDOE are based on the List
of Priority Habitats published by the Washington State Department of Fish and Wildlife
(WDFW 1999). The WDFW definitions are based on those published by the Forest
Service for inventories of spotted owl habitat. The WDOE mature and old-growth
definitions for forested wetland ratings in western Washington are as follows:

2
• Old-growth forests: (west of Cascade crest) Stands of at least two tree species,forming a multi-layered canopy with occasional small openings; with at least 8trees/acre (20 trees/hectare) that are at least 200 years of age or have a diameterat breast height (dbh) of 32 inches (81 cm) or more.
• Mature forests: (west of the Cascade Crest) Stands where the largest trees are 80-200 years old or have average diameters (dbh) exceeding 21 inches (53cm);canopy cover may be less than 100%; decay, decadence, numbers of snags, andquantity of large downed material is generally less than that found in old-growth.(Hruby 2004)
The wetland rating system adds a note to these descriptions, explaining that the
size criteria are "based on measurements for upland forests," and that "trees in wetlands
will often have a smaller dbh because their growth rates are often slower." Therefore, age
is important, because the size guidelines may not accurately reflect the characteristics of
wetland trees (Hruby 2004). These size criteria were originally developed to apply
throughout western Washington and Oregon for upland forests dominated by Douglas-fir
(Pseudotsuga menziesii (Mirb.) Franco). When WDOE needed a definition of old-growth
for forested wetlands, data were not available to create more specific criteria based on
wetland trees. Therefore, the standard definition used throughout the region was applied
to wetlands.
This study examines the size and age characteristics of forested wetland trees,
and compares these characteristics to the guidelines for identifying mature and old-
growth forested wetlands in western Washington. The statistical analysis tests the
hypothesis that 80-year-old and 200-year-old trees in forested wetlands in the Puget
Lowlands are significantly smaller on average than the size criteria in the WDOE
definitions of mature and old-growth forested wetlands. Data are from a study of growth
rates in forested wetlands initiated in 1993 by Sarah S. Cooke. Between 1993 and 2006,
Cooke Scientific staff and volunteers collected age, size, and habitat information for trees
in forested wetlands in the Puget Sound region. I collected additional data, and analyzed
the data to estimate growth rates for five wetland tree species – western red cedar (Thuja
plicata Donn ex D. Don), Sitka spruce (Picea sitchensis (Bong.) Carr.), western hemlock
(Tsuga heterophylla (Raf.) Sarg.), red alder (Alnus rubra Bong.), and coast pine (Pinus
contorta Dougl. ex Loud var. contorta). Some other wetland tree species were examined
qualitatively. Results indicate that the accepted size criteria – 21 inches (53 cm) in
diameter for mature forest and 32 inches (81 cm) for old-growth forest – are too large
when applied to wetlands. Results tables and graphs are presented in Appendices A, B
and C, and Data Tables in Appendix D.

3
2 Forests, Wetlands, and Old-growth Definitions
2.1 The Puget Lowlands Region
This study focuses on forested wetlands in a region of western Washington called
the Puget Lowlands. According to the Washington State Department of Natural
Resources (WDNR), "The Puget Lowland physiographic province consists of a broad,
low-lying region situated between the Cascade Range to the east and the Olympic
Mountains and Willapa Hills to the west. In the north, the beautiful San Juan Islands form
the division between the Puget Lowlands and the Strait of Georgia in British Columbia”
(WDNR 2001b). The Puget Lowlands region is the area within these boundaries below
about 2000 feet (600 meters) above sea level in elevation (Figure 1). This region is also
called the Northern Puget Trough Lowlands Ecoregion by the Washington Natural
Heritage Program and The Nature Conservancy (Kunze 1994).
The climate in the Puget Lowlands is temperate, with mild, wet winters, dry
summers, and a long growing season. Trees grow quickly compared to trees at higher
elevations, and can become very large, but not as large as those of the wetter western
slope of the Olympic Mountains. Few large trees remain today because of extensive
logging and development.
According to Franklin and Dyrness (1973), annual precipitation in the Puget
Lowlands is typically 31 to 35 inches (80 to 90 cm). The area is in the rain shadow of the
Olympic Mountains, and so receives less precipitation than some surrounding areas, but
these figures are too low, particularly for the southern part of the region. The National
Climatic Data Center reports averages of 37 inches (94 cm) for Seattle, 36 inches (91 cm)
for Bellingham, 39 inches (99 cm) for Tacoma, 51 inches (130 cm) for Olympia, and 66
Figure 1. WashingtonState PhysiographicRegions(WDNR 2001a)

4
inches (168 cm) for Shelton (NCDC 2002). Precipitation in the region falls mostly in the
winter months.
Most soils in the region were deposited by glaciers, and are usually coarse-
grained and poor in nutrients. Poorly drained sites with swamps or bogs were once
common, but now many have been drained or filled. Soils in these wetlands may be
organic, composed of the remains of plants (Franklin and Dyrness 1973).
The Puget Lowlands region has some plant species rarely found elsewhere in
western Washington or northwestern Oregon, such as quaking aspen (Populus
tremuloides Michx.) and paper birch (Betula papyrifera Marsh.). These tree species are
found mostly in the northern part of the region. The southern part of the region has some
unique prairie and oak woodland plant communities. The plant communities of the Puget
Lowlands have much in common with those of southwestern British Columbia and the
Willamette Valley in northwestern Oregon (Franklin and Dyrness 1973).
2.2 Wetland Types and Plant Associations
Forests are commonly described in terms of their climax vegetation; that is, the
species that will eventually dominate if the forest is undisturbed. In the Puget Lowlands,
the dominant climax forest species is western hemlock; therefore, this region is within the
western hemlock zone, which includes most of western Washington and Oregon,
excluding the Pacific Coast. Western red cedar is a common subdominant species in this
zone. Douglas-fir is considered a subclimax species (Franklin and Dyrness 1973; Topik
et al. 1986).
Douglas-fir currently dominates most of the forests in the western hemlock zone,
because the climax forest has been removed by logging, development, or fire. If
undisturbed, this forest will eventually transition to a mixed-species forest dominated by
western hemlock, a process that can take 400 years or more (Franklin and Dyrness 1973).
Forested wetlands have a different pattern of succession and different plant communities.
Douglas-fir is rare in wetlands. Forested wetlands in the western hemlock zone
commonly have a mixed forest of western hemlock, western red cedar, Sitka spruce, and
red alder. Oregon ash (Fraxinus latifolia Benth.) is also common in wetlands in the
southern part of the region. The understory is typically dominated by salmonberry (Rubus
spectabilis Pursh), vine maple (Acer circinatum Pursh) and other shrubs. Skunk cabbage
(Lysichiton americanus Hultén & St. John) is frequently the dominant herbaceous
species; lady fern (Athyrium filix-femina (L.) Roth.), slough sedge (Carex obnupta

5
Bailey), and false lily-of-the-valley (Maianthemum dilatatum (Wood) Nels. & Macbr.)
are also common in wetlands (Franklin and Dyrness 1973; Topik et al. 1986). Bigleaf
maple (Acer macrophyllum Pursh) and black cottonwood (Populus balsamifera L. ssp.
trichocarpa (Torr. & Gray ex Hook.) Brayshaw) are common in riparian areas, but
bigleaf maple is not normally found in places with prolonged saturation of the rooting
zone.
Franklin and Dyrness (1973) described skunk cabbage as the indicator of the
wettest forested sites. They identified western hemlock/skunk cabbage and western red
cedar/skunk cabbage as typical swamp plant associations. Sites that are moist, but not as
wet as swamps with skunk cabbage, are typified by sword fern (Polystichum munitum
(Kaulf.) Presl) in the understory. Sword fern is not a dominant species in wetlands,
except on elevated hummocks, so this plant association is not indicative of saturated soil
conditions.
The western hemlock/skunk cabbage vegetation association and other wetland
plant associations of western Washington are also described in Preliminary Classification
of Native, Low Elevation, Freshwater Wetland Vegetation in Western Washington, by
Kunze (1994). Kunze classified wetlands according to plant community types (the
equivalent of "plant associations" in Topik et al. (1986) and Henderson et al. (1989)), and
divided wetland plant communities in the Puget Lowlands broadly into two groups:
minerotrophic wetlands and sphagnum bogs.
Sphagnum bogs receive much or all of their water from direct precipitation,
rather than groundwater. Bogs have acidic, nutrient-poor soils, with plants adapted to
these conditions. The cool northern climate and high water table result in slow plant
growth and very slow decomposition, producing an accumulation of dead plant material
called peat.
Minerotrophic wetlands are fed by groundwater containing dissolved minerals,
and are usually less acidic than bogs, resulting in a different plant community. Some
minerotrophic wetlands may still accumulate partially decomposed plant material as peat
or muck in permanently saturated areas (Kunze 1994). The distinction between these two
types of wetlands is not always clear, and some wetlands may have portions in both
categories (Kulzer et al. 2001).
Kunze lumped together two plant communities described separately by Franklin
and Dyrness, Thuja plicata/Lysichiton americanus and Tsuga heterophylla/Lysichiton
americanus. Since Thuja plicata and Tsuga heterophylla frequently occur together in

6
wetlands, it is reasonable to combine these two plant communities into one, called Thuja
plicata-Tsuga heterophylla/Lysichiton americanus. Most of the samples of western red
cedar and western hemlock in the data for this study are from sites with this wetland plant
community type, with Sitka spruce as a subdominant species. Examples are Hylebos
Wetland and Lilliwaup Swamp, discussed in more detail below in this section.
The Alnus rubra communities described by Kunze are similar to the "cedar and
alder swamps" described by Franklin and Dyrness (1973), who comment, "it is in some
of these swamp communities that A. rubra appears to be a climax species." Two of these
are the Alnus rubra/Lysichiton americanus, and Alnus rubra/Rubus spectabilis plant
communities. Kunze adds that these Alnus rubra plant community types are probably
progressing toward the Thuja plicata-Tsuga heterophylla/Lysichiton americanus type.
Most of the sampling sites in this study had one of these three plant communities
as described by Kunze (1994). An exception is the Sitka spruce dominated wetland of the
Snohomish River freshwater estuary. This wetland plant community is similar to Sitka
spruce tidal swamps that were mentioned by Franklin and Dyrness (1973) as part of the
coastal Picea sitchensis or Sitka spruce zone. Kunze also described a Picea sitchensis-
Alnus rubra/Rubus spectabilis/Carex obnupta (Sitka spruce-red alder/salmonberry/slough
sedge) community type, occurring on surge plain terraces and along major river and
slough channels in coastal areas. Like Franklin & Dyrness, Kunze placed this plant
community in the coastal Sitka spruce zone, not the western hemlock zone. Soils
described by Kunze for this wetland type are a mixture of clay, silt, and organic matter,
including large woody debris. This matches the soil description for sites sampled in the
Snohomish estuary, and these wetlands are overall very similar to the Sitka spruce surge
plain wetlands described by Kunze.
The National Wetlands Working Group of Canada (1988) described wetlands in
coastal areas of British Columbia, some of which are similar to forested wetlands in
western Washington. Certain riparian wetlands, or "stream swamps," have a mix of
conifers and red alder in which "western red cedar is usually the dominant species."
These stream swamps are contrasted with floodplain swamps, where "Sitka spruce has
greater dominance and much better growth than in stream swamps." These floodplain
swamps are similar to the wetland plant community of the Snohomish River freshwater
estuary.
Little Egypt wetland in Mason County, one of the sites sampled in this study, can
be described as a mixed conifer Thuja plicata-Tsuga heterophylla/Lysichiton americanus

7
community type. It is better described, however, by Kunze's Picea sitchensis-Alnus
rubra/Lysichiton americanus community type, which occurs primarily in the western
Olympic Peninsula (Kunze 1994). Sitka spruce is frequently a strong component of a
mixed forest in wetlands of the Puget Sound region, and sometimes it is the dominant
species. Such wetlands may be in transition toward a forest dominated by western
hemlock and western red cedar.
Another common forested wetland type found in the Puget Lowlands is
dominated by Oregon ash, with an understory of Douglas spirea (Spiraea douglasii
Hook.) and slough sedge (Kunze 1994). Insufficient data were collected from such sites
to make any conclusions about growth rates of Oregon ash in these wetlands.
The National Wetlands Working Group (1988) also described "Pacific coast
swamps," similar to the Thuja plicata-Tsuga heterophylla/Lysichiton americanus plant
community described by Kunze (1994). Skunk cabbage in these swamps is an indicator
of the nutrient status of the swamp. Vigorous growth of skunk cabbage indicates a rich,
mucky soil; stunted skunk cabbage indicates nutrient-poor conditions.
Tree size is an indicator of nutrient availability, although productivity may also
be restricted by a high water table and poor soil aeration. "The best stands are dominated
by spruce or cedar of moderate size, whereas the nutrient-poor swamps are dominated by
stunted hemlock. Over time, productive cedar-spruce skunk cabbage swamps gradually
fill in with decayed wood and other organic matter until they support poor-quality
hemlock/blueberry/moss associations elevated above the water table." Similarly, in
riparian wetlands, "Tree growth is relatively poor, but red cedar, spruce, and grand fir
tolerate the semi-stagnant conditions and grow much better than hemlock. Hemlock
occurs mostly on raised, organic hummocks" (National Wetlands Working Group 1988).
Different tree species respond differently to both depth and rate of flow of
groundwater. Minore and Smith (1971) found western hemlock to be intolerant of water
tables higher than 15 cm below the soil surface, but both western red cedar and Sitka
spruce grew well in these conditions. Western red cedar and Sitka spruce fared
differently, however, in response to the amount of underground flow. Western red cedar
was more tolerant of stagnant water tables than Sitka spruce, but less common than
spruce where groundwater was flowing; Sitka spruce grew faster with flowing
groundwater.
Wetlands dominated by coast pine (Pinus contorta var. contorta) or western
white pine (Pinus monticola Dougl. ex D. Don) in the Puget Lowlands are usually

8
sphagnum bogs (Kunze 1994). Coast pine are typically smaller at maturity than other
conifers of this region, and may be stunted when growing in a bog. Plants associated with
coast pine sampled in this study indicate that most, if not all, of the sampled sites were
sphagnum bogs.
Much of the literature about forested wetlands in western North America has
focused on sphagnum bogs. Fitzgerald (1977) described the vegetation communities of
Kings Lake Bog, near Seattle; this study is illuminating for its discussion of
microenvironments and bog succession. The National Wetlands Working Group of
Canada (1988) was mostly concerned with the sphagnum bogs that cover much of
arboreal Canada. Kunze (1994) described four forested sphagnum bog plant communities
in the Puget Lowlands, all with stunted trees. For example, western hemlock only13
inches (33 cm) in diameter may be over 300 years old (Kunze 1994).
The foundational work of Franklin and Dyrness (1973), Kunze (1994), and others
who described and classified the forested wetlands of western Washington, is
summarized in The Pacific Northwest Forested Wetland Literature Survey Synthesis
Paper, published by WDNR in 2005 (CSS 2005). This comprehensive review and the
accompanying annotated bibliography provide a wide range of information pertaining to
the climate, ecology, wildlife, and management of forested wetlands in Washington State.
2.3 Upland Plants in Wetlands
Western hemlock is a dominant climax species for many forested wetlands in the
Puget Lowlands. This fact can be confusing when attempting to identify wetlands,
because western hemlock has a facultative wetland rating of FACU-, meaning it is much
more likely to occur in uplands than in wetlands (see Appendix E, Table E-1 for an
explanation of wetland indicator categories). By contrast, other common wetland species
such as red alder, Sitka spruce, and western red cedar have a facultative rating of FAC,
meaning they are as likely to occur in wetlands as in uplands (Reed 1988; Tiner 1999).
The U.S. Army Corps Of Engineers (USACE) discussed these western hemlock
wetlands in a delineation guidance document for Oregon and Washington (USACE
2005). In this guidance, "hemlock swamps" are cited as an example of a situation in
which a FACU plant may be used as a wetland indicator species, on the basis of
observation. In these western hemlock dominated wetlands, salal (Gaultheria shallon
Pursh) may be the dominant shrub (Franklin and Dyrness 1973). Salal is also an upland
plant, with a facultative wetland rating of FACU. Ralph Tiner discussed this and other

9
FACU wetland plant associations in Wetland Indicators (Tiner 1999), and concluded,
"The individuals growing in wetlands are clearly adapted in some way for life in
periodically anaerobic soils and are considered hydrophytes." This agrees with the
guidance from the Army Corps Of Engineers that western hemlock can be considered a
wetland indicator plant, because it is observed as a dominant species in wetlands.
Western hemlock and other tree species have shallow roots when growing in
wetlands, a form of hydrophytic adaptation. Topik et al. (1986) found the rooting depth in
the western hemlock/skunk cabbage plant association to be 37 cm, very shallow; most
upland plant associations had rooting depths in the range of 80 to 100 cm.
Trees in wetlands are often widely spaced, and depend on nurse logs, stumps, and
hummocks formed by other trees to provide elevated rooting opportunities. This is
especially true for western hemlock, a species usually found in upland conditions. A large
old-growth tree can build a large mound of detritus around its roots, providing a place for
other trees, shrubs, and herbs to grow above the water table, including upland species.
The result is a diverse and complex plant community.
2.4 Wetland Forest Succession
Since wetland trees are affected by a high water table, the old-growth succession
model of upland forests may not apply to wetland forests. A recent study in Mount
Rainier National Park concluded that "old-growth forest on the coldest and wettest sites
in the Park had low similarity to the published definition of Douglas-fir old-growth forest
...suggesting that the existing definition may not apply at these environmental extremes"
(Acker et al. 2006; emphasis added). Moist sites in the Park did not have typical old-
growth structure, so "it may be that the typical pattern of development and resulting old-
growth structure are fundamentally different in the cold and wet extremes." The stresses
experienced by trees on a wet site result in a forest structure different from that of typical
old-growth stands.
One important difference is the virtual absence of Douglas-fir in wetlands.
Pioneer species are typically red alder, Sitka spruce, western red cedar, and Oregon ash,
with western hemlock on raised hummocks and nurse logs. The plant community may be
diverse, with both wetland and upland species.
There are also differences in the density and development of a wetland forest
stand. Stress caused by a high water table limits the density of the forest, and causes
dependence on nurse logs and hummocks. As fallen logs and root mounds proliferate,

10
seedlings find more niches in which to grow, and the density of the forest increases. This
is opposite to the typical trend in upland forests, which often start out dense and become
less dense with age, leaving large amounts of dead wood and standing snags.
Because of these differences, wetland stands may take longer than upland stands
to develop some of the classic ecological characteristics normally associated with old-
growth, such as the abundance of large trees and accumulation of dead wood and snags.
Species diversity, however, may be relatively high in a forested wetland. Because of the
stratification of moisture regimes between the soil surface (wet) and raised logs and
hummocks (drier), forested wetlands may have many niche habitats.
Mature forested wetlands are not simply slow-growing forests; they have their
own unique ecology. It is appropriate to use definitions of old-growth and mature forest
to identify older forested wetlands, but the concepts of forest succession and stand
development on which these definitions are based do not accurately reflect the ecology of
wetland forests.
2.5 Old-growth and Mature Forest Definitions
No single old-growth forest definition is adequate, because of differences between
ecosystems (Franklin and Spies 1991; Moeur et al. 2005). The definition used by WDOE
is based on guidelines intended for Douglas-fir dominated forests of western Washington
and Oregon. It is a simplified version of the definition used by the Northwest Forest Plan
to identify habitat for the northern spotted owl. For example, the plan's Forest Ecosystem
Management Team described an old-growth stand as: "A forest stand usually at least 180-
220 years old with moderate to high canopy closure; a multilayered, multispecies canopy
dominated by large overstory trees; high incidence of large trees, some with broken tops
and other indications of old and decaying wood (decadence); numerous large snags; and
heavy accumulations of wood, including large logs on the ground" (FEMAT 1993). Size
criteria were based on the findings of the Old-Growth Definition Task Group (1986).
This definition, with the size criteria, was called the "interim" old-growth
definition (Old-Growth Definition Task Group 1986). The term "interim" reflects the
understanding that more refinement of the definition was needed. It was painted with a
very broad brush, to apply to upland Douglas-fir forests in the Pacific Northwest.
Wetland ecology is different, and growth rates of some tree species are slower in
wetlands than in suitable upland habitats. Two of the authors of the interim definition
wrote in 1991: "Further development of old-growth definitions should probably be

11
directed toward developing more site-specific definitions, such as for specific habitat
types, geographic locales, or both" (Franklin and Spies 1991). One purpose of this study
is to refine the definition of old-growth for the specific habitat type of wetlands, and for
the specific geographic locale of the Puget Lowlands.
Old-growth definitions have generally specified 200 years as the age at which a
stand becomes old-growth, based on a typical range of 180-220 years required to develop
old-growth ecological characteristics; however, old-growth characteristics begin to
appear well before 200 years, as growth slows, and trees are said to be "mature." Mature
stands have some relatively large live and dead trees. In Douglas-fir forests of western
Washington and Oregon, this mature stage begins at about 80 to 120 years of age,
depending on site conditions and history. For this reason, 80 years has been chosen as the
minimum age for mature forest stands (FEMAT 1993; Old-Growth Definition Task
Group 1986). In the Northwest Forest Plan, forests older than 80 years were called "late-
successional," including both mature and old-growth forests in this one category.
Another factor that is usually considered in connection with old-growth forest
definitions is overall stand area. The Old-Growth Definition Task Group recommended a
minimum stand size of 80 acres (32 hectares) or more, reasoning that the ecological
characteristics of old-growth forest are characteristics of the interior of a forest, so a stand
must be large enough to create these interior conditions. Smaller stands are affected by
proximity to the stand edge, resulting in different ecological characteristics.
The WDOE wetland rating system does not include stand area as part of the
definition of old-growth, but in order to receive a Category I rating, a stand of mature or
old-growth trees must be at least one acre (0.4 hectare) in size (Hruby 2004). This small
stand size is a departure from the reasoning of the Old-Growth Definition Task Group,
but it is appropriate for the purpose of identifying the few remaining bits of old-growth
forested wetland in western Washington. This small size threshold may still be too large,
considering the scarcity and ecological value of mature forested wetlands. Even very
small pockets of old forest enhance biological diversity and provide support for rare plant
and animal species. A large, old tree can be a haven for fungi, insects, and other species
that are part of the old-growth forest ecosystem. Such trees preserve some of the species
associated with old-growth, and shorten the time needed for diverse old-growth habitat to
develop (Carey 2003; Franklin et al. 2000). The discrepancy in stand size between
WDOE and the Old-Growth Definition Task Group illustrates the different purposes
served by old-growth definitions, and the need to adapt to fit the intended purpose.

12
In recognition of the fact that wetland trees may be stunted, the WDOE wetland
rating system emphasizes the importance of age, rather than size. The emphasis on age is
consistent with the purpose of the rating system, which is intended to identify rare and
functionally valuable wetlands, and wetlands that are very difficult or impossible to
replace. The age emphasis is also consistent with the intent of the interim old-growth
definition: "The age alternative to size is to accommodate low-quality sites where
Douglas-firs are unable to attain large diameters even in three or four centuries" (Old-
Growth Definition Task Group 1986). In practice, however, it is difficult to determine the
age of a tree, particularly a large tree, so most people will rely on size rather than age
when classifying a forested wetland.
It is important to note that the size guidelines in the interim old-growth definition
were intended as minimum standards, not averages. The intent was to include less
productive old-growth sites (sites where trees grow slowly) by setting a low minimum
size standard that would encompass “nearly all the old-growth stands for which we have
data” (Old-Growth Definition Task Group 1986).
To determine size criteria for the interim old-growth definition, researchers first
identified certain stands of trees as old-growth, based on ecological characteristics. The
size and age characteristics of dominant trees in these stands were measured, and the
mean size and age calculated for each stand. Using these means as a reference, the
minimum size for old-growth was set in the “low to very low range." The Old-growth
Definition Task Group apparently did this by a judgment call: "These criteria for
identifying old-growth forests are based on limited sampling and minimal values; that is,
the lowest values generally encountered" (Old-Growth Definition Task Group 1986).
Later studies published by the Forest Service in 1993 sampled a large number of
stands, and set the minimum size criterion one standard deviation below the mean of the
means of the sampled stands. In these later studies, all trees larger than 5 inches dbh (12.7
cm) were included in the stand statistics. The mean dbh in this case was the quadratic
mean, which is a little larger than the arithmetic mean. The quadratic mean compensates
to some degree for the inclusion of small trees in the sample. This quadratic mean dbh
was plotted against stand age, which was "based on the oldest cohort of trees where there
were at least 10 per acre" (USDA Forest Service 1993).
According to the interim old-growth definition, western red cedar, Sitka spruce,
or western hemlock can be substituted for Douglas-fir when applying the definition to
stands not dominated by Douglas-fir (Franklin and Spies 1991; Old-Growth Definition

13
Task Group 1986). In an effort to be more specific, the later old-growth definitions
published by the Forest Service in 1993 contained a series of criteria for different forest
types and site classes (low or high productivity). The western hemlock series report
(USDA Forest Service 1993) recommended a minimum size criterion of 21 inches (53
cm) for old-growth western hemlock on low-productivity sites, much smaller than the 32
inches (81 cm) of the interim definition. On the most productive sites, such as the west
slope of the Olympic range, the dbh size criterion could be as large as 42 inches (107
cm). With these criteria, older, slow-growing trees on less productive sites are counted as
old-growth, even if their average dbh is relatively small. This is consistent with the intent
of the interim old-growth definition. Unlike the interim definition, however, trees that
attain a large size at a relatively young age are not counted as old-growth.
In 1995, the Northwest Forest Plan monitoring program adopted standards for
vegetation mapping based on a report by a study group called the "The Vegetation Strike
Team" (Hemstrom et al. 1998). This report set thresholds of 20 inches (51 cm) dbh for
mature, and 30 inches (76 cm) dbh for old-growth forest, smaller than the criteria of the
interim definition. These categories have been used to map forest types in forest
inventories, based on the quadratic mean diameter of dominant and codominant trees.
Since the quadratic mean is slightly larger than the arithmetic mean, the resulting criteria
are lower than they would be if the arithmetic mean were used (Hemstrom et al. 1998;
Moeur et al. 2005).
Old-growth definitions have continued to evolve. One approach is to use a more
graduated old-growth index, to define "various degrees of old-growthiness" (Franklin and
Spies 1991). An example is a system for inventories of old-growth forests on Washington
state lands, published by the Washington Department of Natural Resources (Franklin et
al. 2005). This method assigns an old-growth index to a stand based on attributes
measured in forest inventories. It does not substantially change old-growth definition
parameters, and does not address the special case of forested wetlands. Unlike the 1993
definitions from the Forest Service, this method emphasizes tree size rather than age. The
result is that relatively young stands with large size are counted as old-growth. The
emphasis on tree size works against the inclusion of slow-growing trees as old-growth,
with the logic that slower-growing stands take longer to develop old-growth
characteristics. With this method, age matters less than the presence of certain old-growth
characteristics.

14
With some approaches to the definition of old-growth, an argument could be
made to increase the minimum age criterion for sites with slow growth, such as forested
wetlands, because these sites take longer to develop the classic old-growth
characteristics. Wetland forests are different, however, from upland forests, so these old-
growth characteristics are not directly applicable to wetlands. Age criteria in the WDOE
definitions of mature and old-growth forest are based on general patterns of growth for
these tree species, and there is no clear reason to revise them without further study of
wetland forest characteristics. Therefore, in this study, the age criteria for mature and old-
growth forested wetlands are accepted as given, and used as the basis for evaluating the
size criteria.
3 Methods
The methods used to derive these old-growth forest definitions required sampling a
number of old-growth stands, to find the mean age and diameter. The ages of large trees
were measured by cutting them down, or by comparing them to nearby stumps of similar
size. If enough old-growth stands are sampled, a picture of the normal distribution of
stand characteristics emerges. There are not enough old-growth wetland stands available
to use these methods for forested wetlands, because mature and old-growth forested
wetlands in the Puget Lowlands are extremely rare. Instead, in this study, data for
dominant and codominant trees from a number of wetlands are combined using linear
regression, with a natural logarithmic transformation. This growth curve is then used to
estimate the average size of trees 80 years or 200 years old.
Some sampling sites had mature forest stands. Comparing the criteria of the
mature and old-growth definitions to summary statistics for these mature wetland stands
provides an additional assessment of the usefulness of these criteria.
3.1 Sampling and Data Groups
Trees in this analysis were growing in forested wetlands in the Puget Lowlands
ecoregion. Data collected include location, tree species, diameter at breast height (dbh),
height, age at breast height (abh), soil type, soil moisture, and plant associates. Diameter
was measured with a dbh tape, using standard protocols (Daniel et al. 1979; Forest Club
UBC 1971). Height was measured using a clinometer and a measuring tape (or optical
rangefinder). Soil was sampled to a depth of at least 18 inches (45 cm), and classified
broadly as organic or mineral (defined below). All trees sampled were growing in

15
jurisdictional wetland, as determined by standard wetland indicators – wetland
hydrology, hydric soil, and hydrophytic vegetation, as defined by the Washington State
Wetlands Identification and Delineation Manual (WDOE 1997).
Age was determined by extracting a core with an increment borer. The core was
mounted, sanded, and the rings counted under a dissecting microscope. If the center rings
were not present in the core, the number of missing rings was estimated. This was done
only when the rings present in the core provided confidence in estimating the position
and width of missing rings. Most age extrapolations were less than four years. Larger
estimates, up to 11 years, were used for some older trees, but in all cases the estimate was
a small percentage of the total age of the tree. Cores that were not close enough to the
center to allow a reasonable estimate of the total age of the tree were discarded.
The age determined by tree coring is called "age at breast height" (abh) because it
is the number of rings at the height at which the core was taken. This age does not
include the years it took the tree to grow to breast height (defined as 4.5 feet or 1.4 m).
To estimate the total age of a tree, it is necessary to add a correction factor for the years
required to reach breast height. Age correction factors used in this analysis are from
Forestry Handbook for British Columbia (Forest Club UBC 1971), for sites in coastal
British Columbia with medium productivity. These factors are listed under the heading
"Abh adj." in Appendix A, Table A-1. The tree age criteria in old-growth definitions refer
to total age, not age at breast height.
It can be difficult to measure the age of a large tree. The longest increment borer
available for this study was 24 inches long. This allows coring of trees up to about 40
inches (100 cm) in diameter. The largest tree successfully sampled in the study was 34
inches (89 cm) in diameter. Larger trees were attempted, but the core was incomplete, not
reaching the center. Other borers used by volunteers were shorter. Therefore, large trees
may not have been sampled simply because the borer was not long enough.
Even when the borer is long enough, coring a large tree can be extremely
difficult and time-consuming. Simply screwing the borer into the tree is much more
difficult than with a small tree, and it is harder to find the center on a large tree. Many
large trees have heart rot, which makes coring useless. If the center of the tree is soft, the
borer may lose traction and become stuck, requiring extreme effort to remove. It is not
unusual to spend a large amount of time coring a large tree, without extracting a usable
core.

16
For these reasons, large trees are under-represented in the sample, even when
present on the sampling site. Heart rot, which is also present in some smaller trees, has an
additional effect on the data of removing all trees with soft centers from the sample. It is
possible that trees with heart rot grow at a different rate from trees without rot. If trees
with heart rot grow more slowly, then the dataset may be skewed toward faster-growing
trees.
Sampling sites were divided into two groups on the basis of soil composition –
organic or mineral. Organic soils, also called Histosols, are composed of the remains of
plants, and are usually classified as "very poorly drained." Sandy soils with more than 20
percent organic material by weight in the upper 16 inches (41 cm), or clayey soils with
more than 30 percent organic material in the upper 16 inches, are considered organic
soils. All other soils are classed as mineral (Tiner 1999). The identification of a soil as
organic or mineral was done in the field, so exact percentages by weight were not
calculated; however, the distinction was clear in most cases. Many organic soils in
wetlands in western Washington are composed almost entirely of accumulated plant
material. For example, Hylebos Wetland is mapped as Seattle Muck soil, a deep organic
soil with layers of peat and mucky peat formed from sedges and wood (Snyder et al.
1973).
Sphagnum bogs have organic soils, but trees in sphagnum bogs are often severely
stunted, so these bogs are grouped separately from minerotrophic wetlands in the data
analysis. If sphagnum bogs were included in the data with other sites, the range of
variation would be too great to draw useful conclusions. The distinction is in some cases
unclear, but it is useful for the purpose of focusing the analysis on a particular range of
variation.
There is another reason for considering sphagnum bogs separately. Under the
WDOE rating system, forested sphagnum bogs are rated Category I, regardless of the age
of the forest. Wetlands that are not sphagnum bogs must have one acre (0.4 hectare) or
more of mature or old-growth forest to be rated Category I; therefore the mature forest
size criterion is more consequential for minerotrophic forested wetlands than it is for
sphagnum bogs.
It is not always clear whether or not a particular forested wetland should be
classed as a sphagnum bog. In this study, the distinction is made according to the
guidelines in the WDOE wetland rating system (Hruby 2004). Bogs have organic (peat or
muck) soils, but other wetlands also may have organic soils. If a wetland is forested, has

17
organic soil, and has any bog indicator plant species or combination of species (from the
WDOE bog plant list) with greater than 30 percent cover, it qualifies as a bog. On this
basis, if a sampling site had a significant amount of a bog indicator species, and had
organic soil, it was classified as a bog for the data analysis.
For example, one of the sampling sites was a forested wetland called Lilliwaup
Swamp, adjacent to Lilliwaup Creek in Mason County. The dominant trees in this swamp
were western red cedar and Sitka spruce, and the entire wetland had deep mucky peat
soil. One area had significant amounts of Labrador tea (Ledum groenlandicum Oeder), a
plant on the list of bog indicator species. Therefore, data from this section of the wetland
(Lilliwaup areas A and D) are analyzed separately from the rest of the site. Trees in this
area were much smaller than trees in other parts of the site, but relatively old, so the
distinction served the purpose of distinguishing a site with very stunted trees from the rest
of the data.
Another part of Lilliwaup Swamp (designated area F) had some sedges (Carex
spp.) and live sphagnum (Sphagnum spp.), but the cover from these bog indicator species
was less than 30 percent, so the area was not classified as a bog by these rules. Trees
were somewhat stunted, but were generally larger than trees in areas A and D.
Hylebos Wetland, in Federal Way, probably developed as a sphagnum bog, but is
now in a late stage of bog succession. A plant list published by the Friends of the Hylebos
Wetlands (2001) indicates that some bog species were found there, and the soil is a deep
peat with mosses, but an examination of the sampling site and surrounding area found
only one small individual of Labrador tea and no live sphagnum moss. Therefore, even
though this wetland had some characteristics of a bog, it did not meet the criteria for a
bog under the WDOE definition. Hylebos Wetland has significant flow in and through
the wetland, hydrology that is consistent with its minerotrophic classification. This is at
times a fuzzy distinction, and Hylebos Wetland is a good example of the difficulty of
applying strict categories to natural systems.
One grove of western hemlock trees sampled in Hylebos Wetland (designated
area A) formed a slightly elevated mound of interlocking roots. The trees were small for
their age compared to hemlocks in the rest of Hylebos Wetland. Although this grove had
some mossy peat in the soil, no live sphagnum was found. It appeared to be a raised peat
bog, where the peat extends above the surrounding ground level. The vegetation in this
small area was similar to the Tsuga heterophylla/Sphagnum spp. plant community
described by Kunze (1994), except for the virtual absence of sphagnum, Labrador tea, or
18
other bog species. Skunk cabbage grew around the edges of this grove, and overall the
site matched the Tsuga heterophylla-Thuja plicata/Lysichiton americanus plant
community. It may be that this grove was more ombrotrophic and more deficient in
nutrients than the surrounding wetland; however, it had few bog indicator plants and no
live sphagnum, so it did not qualify as a bog by the rules of the rating system.
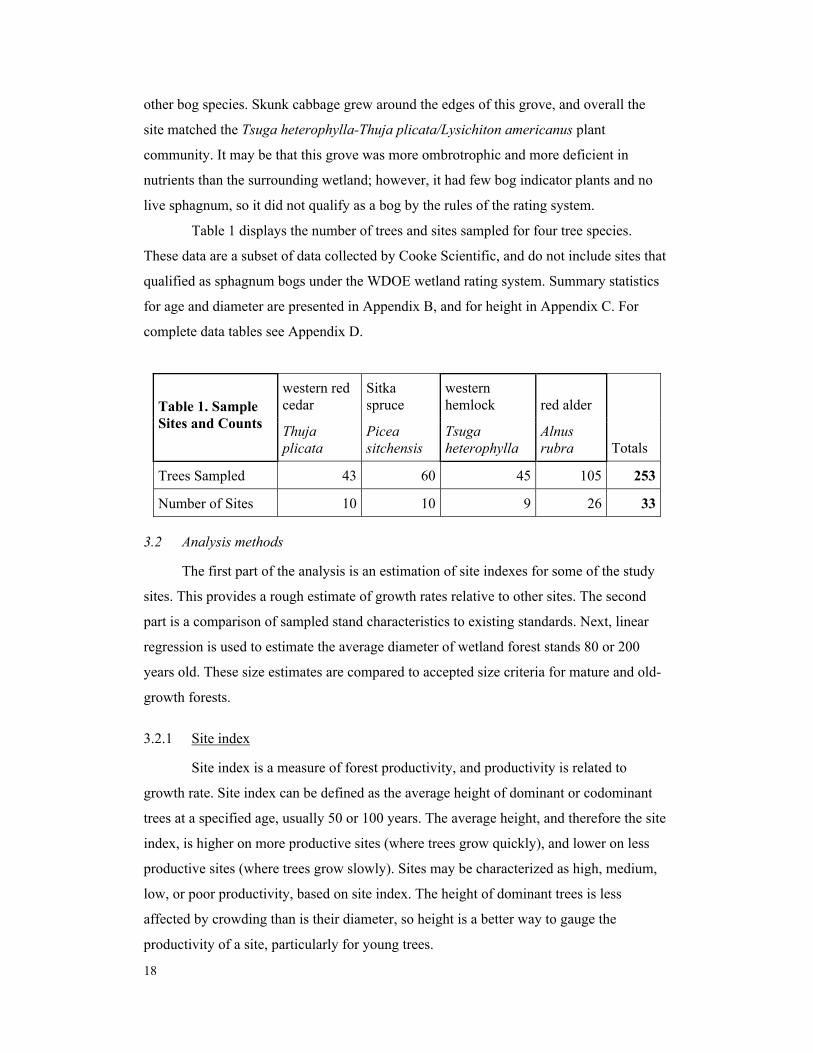
Table 1 displays the number of trees and sites sampled for four tree species.
These data are a subset of data collected by Cooke Scientific, and do not include sites that
qualified as sphagnum bogs under the WDOE wetland rating system. Summary statistics
for age and diameter are presented in Appendix B, and for height in Appendix C. For
complete data tables see Appendix D.
western redcedar
Sitkaspruce
westernhemlock red alderTable 1. Sample
Sites and Counts Thujaplicata
Piceasitchensis
Tsugaheterophylla
Alnusrubra Totals
Trees Sampled 43 60 45 105 253
Number of Sites 10 10 9 26 33
3.2 Analysis methods
The first part of the analysis is an estimation of site indexes for some of the study
sites. This provides a rough estimate of growth rates relative to other sites. The second
part is a comparison of sampled stand characteristics to existing standards. Next, linear
regression is used to estimate the average diameter of wetland forest stands 80 or 200
years old. These size estimates are compared to accepted size criteria for mature and old-
growth forests.
3.2.1 Site index
Site index is a measure of forest productivity, and productivity is related to
growth rate. Site index can be defined as the average height of dominant or codominant
trees at a specified age, usually 50 or 100 years. The average height, and therefore the site
index, is higher on more productive sites (where trees grow quickly), and lower on less
productive sites (where trees grow slowly). Sites may be characterized as high, medium,
low, or poor productivity, based on site index. The height of dominant trees is less
affected by crowding than is their diameter, so height is a better way to gauge the
productivity of a site, particularly for young trees.

19
In this analysis, standard site index equations (Henderson et al. 1989) were used
to calculate site indexes for some of the sites in the dataset, and to estimate an average
index for each species (see Appendix C, following Table C-2, for equations used). The
tree species analyzed in this study are commercially harvested, and much information has
been published on their growth rates in the form of site index tables, graphs, and
equations. Coast pine is the exception; available site indexes for Pinus contorta are for
the inland variety, and do not apply to the coastal variety.
Site index equations are usually intended for single-species stands of uniform age
and density. In forested wetlands, tree distribution is patchy, species are mixed, and there
may be a wide range of ages. Also, the increased importance of small-scale habitat
factors in wetlands makes site index a less useful measure in wetlands than it is in upland
sites, because wetland trees are responding to factors other than the general quality of the
site. Nevertheless, site index can be informative as a rough indication of how the average
growth rate of trees on a site compares to other sites. In this study, this productivity
assessment was made by comparing calculated site indexes to graphs found in Forested
Plant Associations of the Olympic National Forest (Henderson et al. 1989) and the
Forestry Handbook for British Columbia (Forest Club UBC 1971). These reference site
index equations and graphs are for forests in low-elevation coastal areas of the Pacific
Northwest and British Columbia.
In the Snohomish Estuary samples, there is such wide variation in the data that it
seems these samples must include trees with damaged or atypical tops. Since site index
should be based on typical large, dominant, undamaged trees, some of the shortest trees
were excluded from the site index calculations. For other sites as well, some shorter trees
were excluded if they were much shorter or younger than other trees in the group.
After trees mature, at about 80 to 120 years of age for conifers in the Pacific
Northwest, their height increases much more slowly, and many older trees have broken or
damaged tops. Therefore, height is of little use for estimating the ages of mature trees.
Diameter, even though it is highly variable, is a better way to estimate the ages of older
trees, and is the measurement used for size criteria in old-growth definitions.

20
3.2.2 Dbh Estimates
Analysis of the diameter/age relationship in this study has three parts:
1) Evaluate specific wetland stands using the WDOE mature and old-growth forest
criteria.
2) Estimate expected size of wetland trees at 80 and 200 years of age, based on a
linear regression of size and age data.
3) Compare expected values based on linear regression to the size criteria for
mature and old-growth forested wetlands, and to the statistics of sampled stands.
For the linear regression analysis, data from different wetlands were grouped by
species, then by soil type. Most of the trees sampled in the study were growing in organic
soils (peat, muck, or mucky-peat). Red alder and Sitka spruce are well represented with
data from both organic and mineral soils, so these species were analyzed for both soil
types. For western hemlock and western red cedar, only those trees growing in organic
soils were included in the analysis. There are very few samples of these species from
mineral soils. Because of the small sample size, these data were not used, although they
fit in well with the data from organic soils.
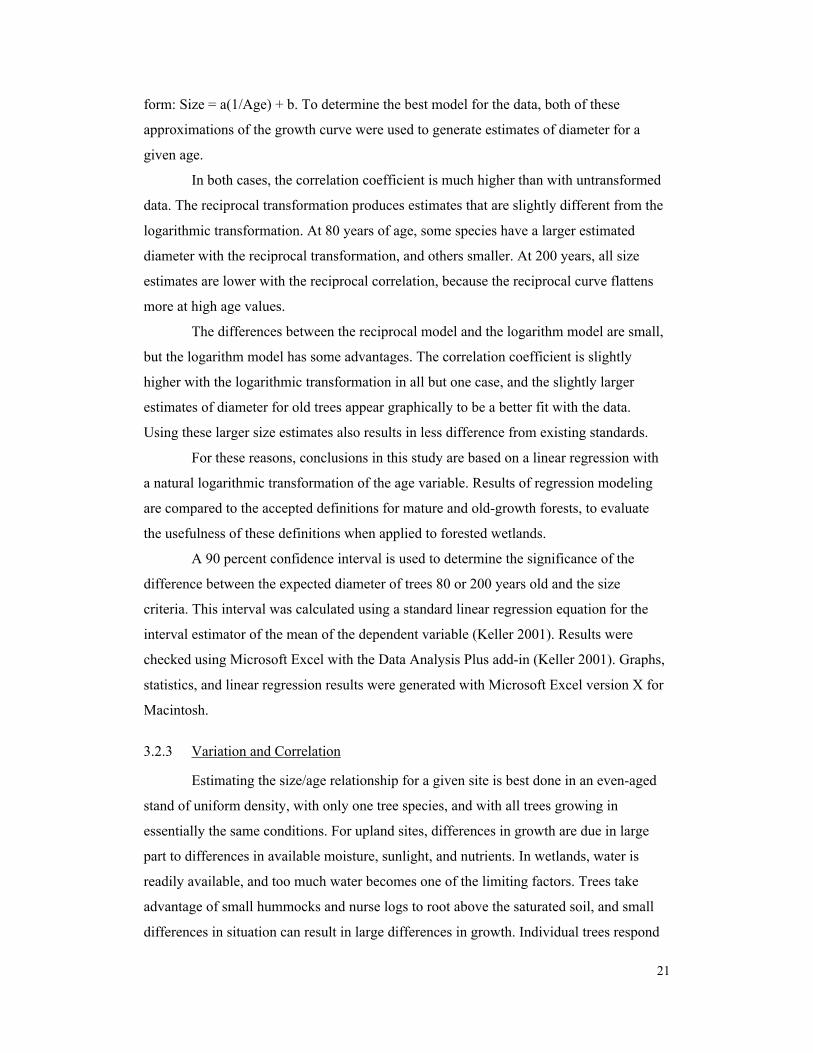
The size/age relationship for trees is an S-shaped, logistic function. The growth
curve begins with a concave portion in which early growth increases exponentially,
followed by a middle portion at first linear and then convex as growth slows, and finally
a linear, nearly horizontal portion as growth becomes very slow in old age (Figure 2).
Exponential functions are used to model growth. The data for this study,
however, are located in the middle portion of the growth curve, and can be modeled with
simpler functions. The convex portion of the curve can be closely approximated with a
logarithmic function of the form: Size = a(Ln(Age)) + b, where a and b are coefficients,
and Ln is the natural logarithm. It can also be modeled with a reciprocal function of the
Figure 2. Site index curvesfor western hemlock,illustrating the S-shapedgrowth function.(Henderson et al. 1989)
21
form: Size = a(1/Age) + b. To determine the best model for the data, both of these
approximations of the growth curve were used to generate estimates of diameter for a
given age.
In both cases, the correlation coefficient is much higher than with untransformed
data. The reciprocal transformation produces estimates that are slightly different from the
logarithmic transformation. At 80 years of age, some species have a larger estimated
diameter with the reciprocal transformation, and others smaller. At 200 years, all size
estimates are lower with the reciprocal correlation, because the reciprocal curve flattens
more at high age values.
The differences between the reciprocal model and the logarithm model are small,
but the logarithm model has some advantages. The correlation coefficient is slightly
higher with the logarithmic transformation in all but one case, and the slightly larger
estimates of diameter for old trees appear graphically to be a better fit with the data.
Using these larger size estimates also results in less difference from existing standards.
For these reasons, conclusions in this study are based on a linear regression with
a natural logarithmic transformation of the age variable. Results of regression modeling
are compared to the accepted definitions for mature and old-growth forests, to evaluate
the usefulness of these definitions when applied to forested wetlands.
A 90 percent confidence interval is used to determine the significance of the
difference between the expected diameter of trees 80 or 200 years old and the size
criteria. This interval was calculated using a standard linear regression equation for the
interval estimator of the mean of the dependent variable (Keller 2001). Results were
checked using Microsoft Excel with the Data Analysis Plus add-in (Keller 2001). Graphs,
statistics, and linear regression results were generated with Microsoft Excel version X for
Macintosh.
3.2.3 Variation and Correlation
Estimating the size/age relationship for a given site is best done in an even-aged
stand of uniform density, with only one tree species, and with all trees growing in
essentially the same conditions. For upland sites, differences in growth are due in large
part to differences in available moisture, sunlight, and nutrients. In wetlands, water is
readily available, and too much water becomes one of the limiting factors. Trees take
advantage of small hummocks and nurse logs to root above the saturated soil, and small
differences in situation can result in large differences in growth. Individual trees respond

22
to these small-scale habitat differences, resulting in wide variation in growth rates of
wetland trees, even within the same site.
The inherent variability in tree growth rates has some consequences for this study
of forested wetlands. First, a large sample size is needed in order to make useful
statistical observations. Second, the coefficient of determination, or R2, for a best-fit
regression curve is likely to be low, even with a large number of samples. No correlation
curve will explain all of the variation in tree size as a function of age, because other
factors are involved. On the other hand, this study is much more focused and limited in
scope than was the original research that created the mature and old-growth forest
criteria. The purpose of this study is to refine these definitions for forested wetlands in
western Washington, and the factors included in the analysis are appropriate for this
purpose.
There are other difficulties with the use of linear regression to analyze tree
growth rates. One of the required conditions for use of linear regression is that y has
constant variability for all x; that is, for all tree ages, diameter should be normally
distributed with the same standard deviation. This condition is violated, because
differences in growth rates will necessarily result in greater divergence in size as trees get
older. Therefore, variability in size is not constant, but increases with stand age. This is a
problem, but the change in variability is not large within the range of the data under
consideration.
Residual plots can be used to analyze variability. Residuals are the differences
between the actual and expected values in a linear regression. If variability is constant,
the residuals will be randomly distributed with no overall pattern. Residuals can also
reveal trends in the data that are not accounted for by the linear regression relationship.
With the exception of the western hemlock analysis, residual plots from the regression
analyses in this study show no clear pattern, supporting the conclusion that variability is
constant enough to satisfy required conditions (see data plots and residual plots,
Appendix A, Figures A-1 through A-7). Data for western hemlock increase in variability
as age increases, so the condition of constant variability may not be satisfied in this case.
See the analysis of western hemlock, section 4.3.4, for further discussion of this issue.
The focus on sampling older, dominant trees, combined with the scarcity of very
old trees, resulted in an accumulation of data around the middle of the age range, 60 to
120 years of age. The low number of older trees in the dataset reduces the statistical
significance of the correlation. The clustering of data gives a good idea of the average

23
size in the middle of the age range, but the slope of the regression line as it extends to
older ages is determined by a small number of points at the old age extreme. Therefore,
estimates of the average diameter of old-growth trees are limited by a lack of data.
In addition to variability between individual trees in a wetland, there are, of
course, differences between wetlands. To limit variability in the data, sphagnum bogs
were analyzed separately, as discussed above. With trees grouped by species, and the
extreme case of bogs grouped separately, the differences between trees in an individual
wetland are generally greater than or similar to the differences between trees in different
wetlands. The data from different sites fit together well, reinforcing rather than obscuring
the central tendencies of the data.
An exception is the data from the Snohomish River freshwater estuary. These
Sitka spruce trees show wide individual variation, but are on average significantly
smaller than Sitka spruce trees from other sampled sites. The division of data into two
groups based on soil type separates the Snohomish estuary from the rest of the sites, but
the difference in growth rate may be due to the estuarine conditions rather than the soil
type. The small number of Sitka spruce sampled in mineral soils from other sites are
more similar to trees sampled in organic soils than they are to trees in the Snohomish
estuary.
It is important to note that the estimates and confidence intervals resulting from
this regression analysis are not estimates of the likely size of individual trees. They are
estimates of the average size of trees of a given age. Variation among individual trees is
so large that it is not possible to reliably estimate the size of an individual tree from its
age, or vice-versa, with a reasonable degree of precision. For example, the regression
model predicts with 90 percent confidence that an individual western hemlock 200 years
old (in a forested wetland that is not a sphagnum bog) will have a diameter at breast
height between 17 and 34 inches (43 to 86 cm), a very wide estimate range.
3.2.4 Outliers
A small number of sampled trees had growth/age characteristics so far from the
norm that they were deemed likely to be errors. If possible, these data points were
checked against the original field records, or by actually revisiting the site. In most cases,
it was not possible to revisit the site or to identify the individual tree to check the data, so
some data points remained questionable and were not used.

24
Some extreme values may be due to violation of the parameters of this study.
These data are part of a more general effort to measure growth characteristics in forested
wetlands, so some data may have been collected with a less restricted understanding of
the sampling criteria. These could include samples from sites that were sphagnum bogs
according to WDOE guidelines, but not clearly identified as such.
All sampled trees were supposed to be dominant or codominant, but it is possible
that not everyone had the same understanding of what this means, or that some smaller
trees were sampled with the idea that they would grow into dominant trees. Small trees
may actually be suppressed, or otherwise stunted, and not representative of the growth
rate of dominant trees on the site. Suppressed or subdominant trees would be unusually
small for their age, but this may not be obvious in the field. A small number of outliers
were removed from the dataset for this reason.
One possible source of error is in the identification of a wetland. All trees
sampled in the study are supposed to be growing in a wetland, according to standard
wetland identification protocols. It is possible that some trees were sampled at the edge of
a wetland, outside the wetland boundary. Large trees at the edge of a wetland may appear
to be rooted in the wetland, but frequently have roots extending to drier soil nearby. In
these conditions there is plenty of moisture, but stress from the high water table is
relieved, and trees may grow very quickly. Within the wetland, saturation of the soil
slows the growth of trees. The distance between stunted trees in the wetland and large
trees at the edge of the wetland may be very small, and the wetland boundary may be
unclear. Because of this ambiguity, some trees that were actually rooted outside a
wetland may have been included in the dataset. These trees could skew the data toward
larger size for a given age.
Even within a wetland, environmental factors cause wide differences in the sizes
of trees. For example, in forested wetlands stand density is often low compared to typical
upland stands, with many canopy gaps. Sampling of forest stands normally would avoid
trees that are at the edge of a stand, or in the open with little competition. In wetlands,
these distinctions are difficult to maintain. Trees may be in scattered, open groves, or in
stands with wide age and size variation.
Disturbance may also be a factor in variability. For example, in Lilliwaup Swamp
there was a gravel roadbed about 50 cm higher than the surrounding wetland. Along this
road were some of the largest Sitka spruce trees in the wetland, some exceeding 30 inches
(76 cm) in diameter, but one that was sampled was only about 70 years old. In this

25
nutrient-poor wetland, these trees may have been fertilized by soil brought in for the road,
and their roots extended into this elevated soil.
Forest sampling ideally focuses on trees that are unaffected by individual
microhabitat differences. The idea is to typify the stand by measuring trees that reflect the
climate and soil conditions. Dominant and codominant trees on good sites have a
relatively constant growth rate, gradually slowing with age, providing an indication of the
growth potential of trees on the site. In wetlands, such "normal" trees are the exception
rather than the rule. Wetland trees are stressed, and many individual trees have wide
fluctuations in growth rate from year to year, reflecting changes in the height of the water
table and other environmental conditions. A wetland tree may be flooded by a small
increase in the height of the water table, suppressing its growth for that year; nearby
upland trees may be unaffected by this small change. In another year, a small drop in the
water table that does not have much affect on the growth of upland trees may allow the
wetland tree to "breathe," resulting in increased growth. This fluctuation in growth rates
can result in higher variability in wetlands than in uplands. Occasionally, a wetland tree
finds the right combination of conditions to grow quickly and unimpeded for its entire
life. These trees may be outliers, very large for their age. The occasional large tree may
be an indication of site potential, but it is not indicative of conditions experienced by
most of the trees on the site.
In summary, it is likely that some low size values represent suppressed or
subdominant trees, and should be removed from the dataset. It is also likely that some
large size values are from trees that were at the wetland edge, but some are simply trees
that grew faster than their peers.
Outliers create two difficulties. If an outlier is a very old tree, but unusually large
or small for its age, it can pull the best-fit line away from the true average value for the
population. Older trees have a big influence on the slope of the line, since there are few
samples in the upper part of the age range.
If the outlier is a middle-aged tree, the range where most of the data are
clustered, the effect is to obscure the linear relationship. Outliers extend the range of
variability of the dependent variable (size). The average or best-fit value may be about
the same with or without the outlier, but the correlation coefficient and significance of the
correlation are improved if the outlier is removed.
Therefore, in most cases the one or two highest and lowest outliers have been
removed from the data analysis. This has little effect on the predicted size values for

26
middle-aged trees. Also, if an old tree had a dramatically large or small size, it was
removed from the analysis, since the value may not be representative, and each individual
point in the higher age range has a strong influence on the slope of the linear regression
model. More specific information on outliers is included in the discussion of results for
each species.
4 Results and Discussion
4.1 Estimates of Site Index
Site indexes can provide a rough idea of the forest productivity of a site, relative to
other sites. A site that produces larger, faster-growing trees has a higher site index than a
site with a slower growth rate. Estimated site indexes are presented in Appendix C, and
site index equations at the end of Appendix C.
In general, estimated site indexes indicate that the stands sampled in this study
are in a low to moderate range of productivity; therefore, trees in forested wetlands are
small on average, compared to trees of the same species on other sites. Site indexes are
below the middle of the range in all cases, indicating they are on the low side of the range
of productivity, but not extremely so (see the end of Appendix C for standard site index
ranges). This finding is consistent with the description in Topik, et al. (1986) of the
western hemlock/skunk cabbage plant association as "low to moderate" in productivity.
Some calculated site indexes are very low – Sitka spruce in Lilliwaup Swamp,
Sitka spruce in the Snohomish estuary, and western red cedar in a more ombrotrophic
portion of Lilliwaup Swamp (areas A and D). Site indexes for western hemlock are a
little lower in two sphagnum bogs than in other sites.
Site indexes calculated for red alder are very close to values cited in the
Snohomish County Soil Survey for wetland soil types (Debose and Klungland 1983). The
estimated values, about 80 feet at 50 years of age, are on the low side of the reference site
index range of 40 to 140 feet.
This rough estimation and comparison of site indexes shows that forested
wetlands in the Puget Lowlands are generally in a low to moderate range of productivity,
and some are very low. The wetlands with the lowest productivity were in the Snohomish
estuary, and or in areas with bog indicator species. The site index equations used in these
calculations were not intended for mixed-species stands, so these results are a rough
approximation.

27
4.2 Old-growth and Mature Forest Criteria
Part of the analysis of diameter is an evaluation of sampled stands according to
accepted criteria for mature and old-growth forests. This evaluation is possible for sites
that were sampled more extensively: Hylebos Wetland, Lilliwaup Swamp, Little Egypt
Swamp, and Snohomish estuary. Summary statistics for these sites may be compared to
the criteria in the definitions. It is also useful to consider some of these sites in smaller
sections. Some large sites had distinct areas that were identified separately in sampling,
and were large enough and distinct enough to be analyzed as separate stands, with
cohorts of trees similar in age.
Ages of trees discussed in this section are total age, unless otherwise indicated.
Total age is an estimation of the actual age of the tree, derived by adding a correction
factor to the age at breast height. Summary statistics in this section use a correction factor
of 8 years. This correction factor is appropriate for these species on sites with medium
productivity. Therefore, it is likely that trees on low-productivity sites were actually a
few years older than estimated in these calculations.
4.2.1 Old-growth Evaluation
The WDOE old-growth criteria require "at least 8 trees/acre (20 trees/hectare)
that are at least 200 years of age or have a diameter at breast height (dbh) of 32 inches
(81 cm) or more" (Hruby 2004). Most sampling sites did not have any trees this old or
this large, because of logging within the last 100 years. Many sites had large stumps, but
few large trees. In some cases, large trees were present, but not sampled. Many large
trees have soft centers (which prevents successful coring), and some are too large to core,
so large trees are under-represented in the data even when they were present on the site.
Little Egypt Swamp area B had some large trees, and qualified as old-growth
based on the number of trees larger than 32 inches (81 cm) in diameter. These included
Sitka spruce and western red cedar too large for coring. One western red cedar was 45
inches (115 cm) in diameter. The core was incomplete, but contained 228 rings, so this
tree was well over 200 years old. Another 202-year-old red cedar was only 22 inches (57
cm) in diameter. The site qualified as old-growth because there were enough large trees,
but some of the large trees were much older than 200 years, and some 200-year-old trees
were smaller than the size threshold. None of the younger trees sampled were large
enough to be counted as old-growth. Some large Sitka spruce trees may have been

28
younger than 200 years old, but these were not sampled (the ones that were attempted had
soft centers).
In Hylebos Wetland, one western red cedar was 206 years old, with a diameter of
32 inches (82 cm), just passing both the age and the size criteria. A Sitka spruce 174
years old had a diameter of 35 inches (89 cm); another Sitka spruce only 121 years old
exceeded the old-growth size threshold, with a diameter of 33 inches (84 cm). Hylebos
Wetland also had a few Douglas-fir trees, some relatively large. One Douglas-fir 33
inches (83 cm) in diameter was only about 95 years old; another 31 inches (78 cm) in
diameter was about 106 years old. At the other end of the size range, a western red cedar
161 years old was only 22 inches (56 cm) in diameter, and a Sitka spruce 184 years old
had a diameter of 25 inches (63 cm), well below the minimum. Hylebos Wetland had one
very large Sitka spruce, 55 inches (139 cm) in diameter, and a large Douglas-fir snag 48
inches (123 cm) in diameter, both too large for coring. These large trees perhaps indicate
the potential for dominant trees on this site. In general, there were not enough old or large
trees for Hylebos Wetland to qualify as old-growth. The older trees were distributed both
above and below the minimum size criterion for old-growth.
Lilliwaup Swamp area F was an old-growth stand, based on the number of large
and old trees. Of seven trees sampled, all were older than 175 years, and three were 200
years or older. Only one of these trees was larger than the minimum size criterion, a 193-
year-old western red cedar with a diameter of 32 inches (82 cm). There were larger trees
with too much rot to sample, but they appeared to be much older. There were also some
very large stumps. It seemed that the dominant trees were removed from this stand when
the area was logged, probably in the 1920s, and the trees that remained were the ones
considered not worth the trouble. Therefore, it is questionable to call these the dominant
trees. Nevertheless, these are the dominant trees on the site now. In general, most of the
old trees in this old-growth stand were not large enough to pass the minimum size
criteria, except for some that were probably much older than 200 years. This area had
some bog indicator species, and the plant community was different from that found in
other portions of Lilliwaup Swamp, with sedges and a small amount of live sphagnum,
but it did not meet the WDOE bog criteria.
Most trees sampled in other parts of Lilliwaup Swamp did not exceed the old-
growth size threshold, but some younger Sitka spruce came close. One large spruce was
only 72 years old, but 32 inches (81 cm) in diameter, meeting the size criteria for old-

29
growth trees. This tree was larger than most in the vicinity, but younger than many of the
other trees.
In summary, Little Egypt and Lilliwaup Swamp each contained an old-growth
stand, when assessed with the existing criteria. This result is appropriate, since they do
contain large, old trees; however, most old trees were below the 32-inch (81 cm)
minimum. The mean age of trees sampled in Lilliwaup area F was about 202 years, but
the mean diameter was only 25 inches (63 cm). In Lilliwaup, Little Egypt and Hylebos,
some trees reached sizes exceeding the old-growth minimum size criterion before 200
years of age, but most did not.
4.2.2 Mature Forest Evaluation
The mature forest criteria are stated in a different way from the old-growth
criteria: "the largest trees are 80-200 years old or have average diameters (dbh)
exceeding 21 inches (53 cm)" (Hruby 2004). Like the old-growth criteria, the mature
forest age criterion is stated in terms of "the largest trees"; however, the size criterion
refers to the average diameter (presumably of the largest trees). The size criterion would
be met more easily if it also referred to "the largest trees," rather than the average size,
since average size is a more specific requirement. Therefore, the criterion for age is more
lenient than the criterion for size, since it is less specific about the composition of the
stand.
Little Egypt Swamp was sampled in two sections that are not contiguous, so they
are examined separately. Area B was identified (above) as an old growth stand because of
the presence of large trees. Area A did not have enough old or large trees to qualify as
old-growth.
The samples from Little Egypt area A include two trees that are substantially
older and larger than the others. Leaving out these two trees provides a relatively even-
aged cohort of dominant trees. The sample of six trees had an average total age of 93
years, and average diameter of 21 inches (54 cm). Even without the older, larger trees,
this stand passed both the age and the size criteria, but at an age 13 years older than the
80-year minimum. Since the trees averaged 21 inches (54 cm) in diameter at 93 years,
the average growth rate was about 0.23 inches (0.58 cm) per year. Mature trees grow
more slowly, so they likely had been growing at a rate somewhat slower than this overall
average; even with a reduced rate of growth, however, it is likely that the trees grew more
than 0.5 inch (1 cm) in 13 years. So, the average diameter of this cohort of trees was

30
smaller than 21 inches (53 cm) when the average age was 80 years, and on this site the
stand of trees has to be older than 80 years to have an average dbh larger than 21 inches.
The size criterion is too large, but not by a large amount.
Hylebos Wetland exceeded the minimum criteria for both age and size for mature
forested wetlands. Total age averaged 107 years, with average diameter of 23 inches (57
cm). As at Little Egypt Swamp, it is likely that the average diameter was smaller than 21
inches dbh (53 cm) when the average age was 80 years, but the difference was probably
small. The stand probably passed the minimum size criterion sometime between 80 and
100 years of age.
One section of Hylebos Wetland, area A, had a cohort of trees similar in age, and
these trees were smaller for their age than the trees in the surrounding area. This stand,
(also discussed in section 3.1) was composed almost entirely of western hemlock, with an
understory of salal. Four trees sampled in this cohort had an average age of 108 years,
and an average diameter of 18 inches (46 cm). This stand of trees did not pass the
minimum size criterion for mature forest, even at an average total age of 108 years.
Lilliwaup Swamp Area F was described above as an old-growth stand. Other
areas of Lilliwaup Swamp did not qualify as old-growth, but they met the mature forest
criterion for age. Grouping the trees from one section of the site – areas B, B2, and C –
provides a relatively even-aged cohort, with 15 trees sampled. Average total age was 76
years, with 18.7 inches (48 cm) average diameter. This stand was close to 80 years of age
on average, and had enough older trees to pass the age standard, but the average diameter
was smaller than the minimum criterion for mature forest by more than 2 inches (5 cm).
Another part of Lilliwaup Swamp – areas A and D – had significant amounts of
Labrador tea (Ledum groenlandicum), a bog indicator species. The areal cover from this
bog species was near 30 percent, enough to qualify this portion of the wetland as a bog,
so these areas are separated from the rest of the site for the analysis. Seven trees sampled
in these areas averaged 131 years total age, with only 15 inches (39 cm) average
diameter. These trees were much older than the minimum age for mature forest, but much
smaller than the minimum size criterion, and more stunted than trees in other parts of the
site.
Forested wetland stands in the Snohomish River freshwater estuary were smaller
on average than stands of similar age in other wetlands. On Otter Island, 17 dominant
Sitka spruce trees averaged 95 years total age, but only 17 inches (42 cm) in diameter.
This stand was 15 years older on average than the minimum age for mature forest, but

31
much smaller than the minimum size. Trees sampled on Spencer Island had a similar
average age, 96 years, but the average size was 19 inches (49 cm). These trees were
larger than those on Otter Island, but still smaller than the mature forest size criterion.
Otter Island is the most pristine, undisturbed site in the estuary. Unlike Spencer
Island, it has not been diked or logged, and so is more representative of natural conditions
in the estuary. Nearby Ebey Island contains some spruce trees larger than those on Otter
Island, which may indicate that diking relieves the trees of flooding stress, allowing them
to grow larger (Brennick 1999; Moore 1999). Perhaps this is the reason that trees on
Spencer Island averaged a little larger than trees on Otter Island.
Otter Island had the oldest tree sampled in the study, but it was not particularly
large – a Sitka spruce about 455 years old, but only 22 inches (57 cm) in diameter. This
tree was left out of the stand average, since it is clearly from a different cohort, and it is
an outlier. It was one of the largest trees on the site, but it took a very long time to grow
to that size.
Silver Lake bog had a mature stand of coast pine and western hemlock. Taking
both together, and averaging the largest trees of both species (N=10), the stand had an
average diameter of 15 inches (37 cm), and average age of about 83 years. The largest
trees were the four hemlocks; averaging them alone results in an average diameter of 19
inches (48 cm), and 81 years average age.
These examples show that even when a forested wetland stand is older on
average than the minimum age criterion for mature or old-growth forest, the trees are
likely to be smaller on average than the minimum size criterion. To obtain a more
specific prediction of the likely average size of trees of a given age, I combined data from
similar sites in a linear regression analysis. These results are presented in the next section.
4.3 Growth Rate Analysis and Expected Values
In this analysis, the middle portion of the growth curve is modeled using linear
regression with a natural logarithm transformation of the age variable. Results and graphs
of the linear regression are presented in Appendix A.
Ages of trees discussed in this section are total age, unless otherwise indicated.
Total age is derived by adding a correction factor to the age at breast height. Correction
factors vary according to species and site quality. These correction factors are for sites
with medium productivity, from the Forestry Handbook for British Columbia (Forest
Club UBC 1971). Since these sites are generally in a low to medium range of

32
productivity, as discussed above in the analysis of site index, it is likely that the total tree
ages used in this analysis of diameter are underestimated by a few years.
4.3.1 Western Red Cedar (Thuja plicata)
Forty western red cedar trees from ten wetland sites were analyzed to derive an
estimate of diameter at breast height for 80 and 200 years of age. All were growing in
organic peat or muck soils (Histosols). These results are summarized in Appendix A,
Table A-1. Scatter plots, best-fit and confidence interval lines, and residual plots are
shown in Appendix A, Figure A-1. Total age of western red cedar trees is estimated by
adding 9 years to the age at breast height.
Predicted average diameter for western red cedar 80 years old is 18.2 inches (46
cm), with a 90 percent confidence interval of 16.7 to 19.7 inches (42 to 50 cm). This
estimate is smaller than the mature forest criterion of 21 inches (53 cm) by almost 3
inches (7 cm), and the upper end of the confidence interval is 1.3 inches (3 cm) smaller.
Data for western red cedar include seven trees older than 160 years, the oldest
261 years old, providing some basis for an estimate of size at 200 years, the minimum
age for old-growth. The confidence interval is wider at older ages, because of the small
number of old trees in the sample. Estimated average diameter for western red cedar 200
years old is 28.0 inches (71 cm), with a 90 percent confidence interval of 25.9 to 30.1
inches (66 to 77 cm). Therefore, the size estimate for 200 years total age is significantly
smaller than the old-growth criterion of 32 inches (81 cm).
The coefficient of determination (R2) for this regression is 0.52, and the p-value
is 0.00, indicating a significant correlation. The inherent variation in tree growth rates,
and the importance of microhabitat factors in wetlands means the coefficient of
determination will always be relatively low. For example, the diameter of individual trees
near 80 years of age varies by a factor of two or more, even in the same wetland site.
Visual inspection of the scatter plot indicates a good fit of the line to the data. The
residual plot shows no overall pattern, indicating that variability is constant in the range
of the data, satisfying a necessary condition for linear regression.
Many western red cedars of various sizes were not sampled because they had soft
centers (heart rot), which precludes measuring age by tree coring. The prevalence of heart
rot may introduce a bias in the data, since only those trees without heart rot were included
in the sample. If the absence of heart rot correlates with faster growth, the resulting size
estimate may be skewed upward, producing a larger size estimate than would be obtained

33
if all dominant trees could be sampled. On the other hand, if some of the trees that were
too large or too soft to sample were relatively young for their size, including them in the
sample could shift the results toward a larger estimate of size at 200 years of age.
As discussed above in the mature forest evaluation, Lilliwaup Swamp areas A
and D had some bog indicator species, and were not included in the regression analysis.
Trees in these areas were severely stunted. For example, the oldest and largest tree (a
western red cedar) was about 250 years old, but only 23 inches (58 cm) in diameter.
Three trees about 100 years old were all less than 15 inches (22 cm) in diameter.
These data show that mature western red cedar trees in forested wetlands in the
Puget Lowlands are, on average, significantly smaller than the size criteria in the
definitions of mature and old-growth forested wetlands in western Washington. These
size estimates are consistent with the results based on stand averages, discussed above in
section 4.2.
4.3.2 Sitka Spruce (Picea sitchensis), in Organic Soils
Sixty Sitka spruce trees were included in the analysis of growth rates, but they
were divided into two groups by soil type. Thirty-five Sitka spruce from six wetland sites
were growing in organic peat or muck soils (Histosols). Twenty-five Sitka spruce were
growing in mineral soils, discussed below in section 4.3.3. Results for Sitka spruce in
organic soils are summarized in Appendix A, Table A-1 and Figure A-2. Total age of
Sitka spruce trees is estimated by adding 8 years to the age at breast height.
For Sitka spruce growing in organic soils, estimated average diameter at 80 years
of age is 18.8 inches (48 cm), with a 90 percent confidence interval of 17.2 to 20.3 inches
(44 to 52 cm). The midpoint of the estimate is smaller than the 21-inch (53 cm) criterion
by 2 inches (5 cm), and the upper end of the confidence interval is smaller by .7 inch (1
cm). This estimate is significantly smaller than the mature forest criterion of 21 inches
(53 cm), and is similar to the size estimate for western red cedar.
The data include four trees older than 160 years, the oldest 198 years old.
Because of the small number of old trees in the sample, the confidence interval for the
size estimate at 200 years is wider than it is for western red cedar. The estimated average
diameter for Sitka spruce 200 years old is 29.7 inches (76 cm), with a 90 percent
confidence interval of 26.7 to 32.8 inches (68 to 83 cm). Therefore, the data suggest that
the estimated size of Sitka spruce at 200 years is 2 inches (5 cm) smaller than required by

34
the old-growth criterion, but upper end of the 90 percent confidence interval includes this
32-inch (81 cm) criterion.
The coefficient of determination (R2) for this regression is 0.42, with a p-value of
0.00, a statistically significant relationship. As with western red cedar, the variation in
size at a given age is very wide, and trees near 80 years of age vary in diameter by a
factor of two or more. Visual inspection of the scatter plot indicates a good fit of the line
to the data. The residual plot shows no overall pattern, indicating constant variability in
the range of the data.
One Sitka spruce 226 years old, but only 23 inches (58 cm) in diameter, was
excluded from the analysis as an outlier. Another at the other end of the size/age range
was 72 years old, and 32 inches (81 cm) in diameter; this tree was also excluded. These
trees are circled on the scatter plot in Appendix A, Figure A-2, but not included in
calculations.
The very wide variation in size for a given age means that a larger sample size
would be helpful, but the data are sufficient to provide a good estimate of average size at
80 years of age. As with most other species in the study, there are not enough old trees in
the data to confidently estimate the average size of 200-year-old trees.
These data show that mature Sitka spruce trees in forested wetlands in the Puget
Lowlands are, on average, significantly smaller than the size criterion for mature forested
wetlands in western Washington. The data suggest that the same holds true for the old-
growth size criterion, but the data are insufficient to determine this with confidence.
4.3.3 Sitka Spruce (Picea sitchensis), in Mineral Soils (Snohomish Estuary)
Analysis of Sitka spruce in mineral soils included twenty-five trees from five
wetland sites. Soils were composed of a mix of silt, sand, and organic material. All were
in the Snohomish River freshwater estuary. Sitka spruce trees growing in organic soils
(Histosols) were grouped and analyzed separately (section 4.3.2). Results and graphs are
presented in Appendix A, Table A-1 and Figure A-3. Total age of Sitka spruce trees is
estimated by adding 8 years to the age at breast height.
For Sitka spruce growing in the Snohomish estuary, estimated average diameter
at 80 years of age is 15.4 inches (39 cm), with a 90 percent confidence interval of 13.6 to
17.1 inches (34 to 44 cm). This estimate is significantly smaller than the mature forest
criterion of 21 inches (53 cm), and also significantly smaller than the estimated size for
Sitka spruce in organic soils. The midpoint of the estimate is smaller than the mature

35
forest size criterion by almost 6 inches (14 cm), a very large difference, and the upper end
of the confidence interval is smaller by almost 4 inches (9 cm).
Data analyzed for the Snohomish estuary include only one tree older than 120
years. This tree was 159 years old, and 19 inches (48 cm) in diameter. Most trees in the
sample were between about 70 and 115 years of age. This lack of data in the older age
range results in a very wide confidence interval at 200 years, and suggests that the
extrapolated estimate is unreliable. The estimated average diameter for Sitka spruce 200
years old is 24.3 inches (62 cm), with a 90 percent confidence interval of 18.8 to 29.8
inches (48 to 76 cm). The estimated size at 200 years is smaller than the old-growth
criterion of 32 inches (81 cm) by a difference of almost 8 inches (19 cm), and the upper
end of the confidence interval is 2 inches (5 cm) smaller. Therefore, the data indicate that
the estimated size is significantly smaller than required by the old-growth criterion, with
90 percent confidence; however, at this age the model is extended beyond the range of
the data, and therefore may be inaccurate.
The oldest tree growing on Otter Island was about 455 years old, and only 22
inches (37 cm) in diameter. This tree was excluded from the analysis because it is an
extreme outlier. There were no other older trees in the dataset, so this unusually slow-
growing tree would have a large effect on the slope of the regression line if it were
included. A second outlier, growing on Spencer Island, was much larger than all the other
trees sampled in the estuary, 30 inches (76 cm) in diameter. This tree was not included in
the growth rate analysis.
The coefficient of determination (R2) for this regression is 0.21, and the p-value
is 0.00, indicating a significant correlation. As in other cases, the wide variation in
growth rates of individual trees precludes a high coefficient of determination. Another
factor is the clustering of the data in a narrow age range. This clustering probably
provides an accurate estimate of the average size at 80 years, since that is near the middle
of the data cluster, but the linear relationship would be stronger if the data were more
spread out in age. The residual plot shows no overall pattern, indicating constant
variability in the range of the data, as required for linear regression.
These results indicate that mature Sitka spruce trees in forested wetlands in the
Snohomish River freshwater estuary are much smaller on average than the size criterion
in the mature forested wetland definition. The same is probably true of the old-growth
size criterion. These size estimates are consistent with results based on stand averages,
discussed above in section 4.2.

36
For other tree species in this study, data from mineral soils do not appear to be
significantly different from data for the same species in organic soils, but the sample
sizes are small, and no statistical test was done to compare the soil groups. There are a
few western hemlocks and western red cedars in the dataset that were growing in mineral
soils, and they fit well with the data from organic soils for the same species, but they
were not used in the analysis. Results for red alder, presented below, are also very similar
for both soil types. This suggests that the difference observed with Sitka spruce may be
due to the influence of the estuary, or some other factor, rather than the difference in soil
type.
4.3.4 Western Hemlock (Tsuga heterophylla)
The western hemlock growth rate analysis included 38 trees, from 9 wetland
sites; all were growing in organic soils (Histosols). Results and graphs are presented in
Appendix A, Table A-1 and Figure A-4. Total age of western hemlock trees is estimated
by adding 9 years to the age at breast height.
Estimated average diameter for western hemlock 80 years old is 19.3 inches (49
cm), with a 90 percent confidence interval of 18.1 to 20.5 inches (46 to 52 cm). The
midpoint of the estimate is smaller than the mature forest criterion by 1.5 inches (3 cm),
but the upper end of the confidence interval is only 0.5 inch (1 cm) smaller. This
estimated value is a little larger than the estimate for western red cedar and Sitka spruce,
but still significantly smaller than the mature forest size criterion.
The oldest tree in the dataset was 180 years old, but this is the only one older
than 131 years. Most were between 50 and 100 years of age. As with other species, the
small number of old trees results in a wide confidence interval at the high end of the age
range. The estimated average diameter for western hemlock 200 years old is 26.7 inches
(68 cm), with a 90 percent confidence interval of 24.0 to 29.4 inches (61 to 75 cm). The
estimated size at 200 years is significantly smaller than the old-growth criterion of 32
inches (81 cm), even with the wide confidence interval. The results suggest that the
estimated size of western hemlock at 200 years is smaller than the old-growth size
criterion, but the estimate extends beyond the range of the data, and therefore may be
inaccurate.
The coefficient of determination (R2) for this regression is 0.48 and the p-value is
0.00, indicating a significant correlation. Variability is high – trees near the middle of the
age range vary in diameter by a factor of two or more. Visual inspection of the scatter

37
plot indicates a good fit of the line to the data, and the R2 value shows a high degree of
correlation.
The slope of the best-fit line is in part determined by a cluster of points in the low
age range, 25 to 30 years old. These trees are similar in size, so the variability is much
smaller at this end of the age range. This change in variability is reflected in the residual
plot. The line is a good fit to the data, but the condition of constant variance across the
range of the data may be violated in this case.
The analysis could be done without these young trees, but they increase the
linearity of the data by extending the age range. Since size varies so much in the middle
of the range, it is difficult to determine the slope of the best-fit line without the full range
of data. Analysis without these young trees results in a very low coefficient of
determination (R2), but the estimated size at 80 years is about the same whether they are
included or not.
Western hemlock trees sampled in sphagnum bogs were not included in the
regression analysis. Most of these were young trees, but three were older than 80 years,
and they were the largest trees sampled at the Silver Lake bog site. Average age for these
three trees was 92 years, and average diameter was 18 inches (46 cm).
These results indicate that mature western hemlocks in forested wetlands in the
Puget Lowlands are, on average, significantly smaller than the size criterion for mature
forested wetlands in western Washington. The results suggest that the same holds true for
the old-growth size criterion, but additional data are needed to make such a projection
with confidence.
4.3.5 Red Alder (Alnus rubra), in Organic Soils
Red alder data were divided into two groups according to soil type. Analysis of
growth rate in organic soils was based on 36 trees, from 12 sites. In most sites only a few
red alder trees were sampled; the largest number sampled on one site was 13. Red alder is
not part of mature or old-growth forest in the standard definitions such as the interim old-
growth definition, except as a member of the understory. It is an early seral species, and
so by definition is not dominant in a mature forest. For example, red alder may dominate
early seral stages in the western hemlock/skunk cabbage plant association, but is usually
much reduced by about 80 years, leaving a mixed stand of conifers with some alders in
the understory (Henderson et al. 1989; Newton and Cole 1994).

38
The WDOE definition of mature forest is not specific about which tree species
may be counted, and red alder can live to be over 100 years old, so it could play a role in
some cases. Red alder trees 80 years old or older could tip the balance in the rating of a
forested wetland. They are generally smaller, however, than the coniferous species with
which they share the forest. Red alder in mature stands on good sites typically have
diameters of 18 to 20 inches (45 to 50 cm). On wetland sites, they would probably be
smaller than this typical size (Newton and Cole 1994).
In this regression analysis, the estimated average size of red alder 80 years old
(using a correction factor of 5 years) is 15.2 inches (39 cm), with a 90 percent confidence
interval of 14.2 to 16.2 inches (36 to 41 cm). This result is smaller than the mature forest
size criterion by almost 6 inches (14 cm), and the upper end of the confidence interval is
almost 5 inches (12 cm) smaller. Results and graphs are presented in Appendix A, Table
A-1 and Figure A-5.
The regression line has a coefficient of determination (R2) of 0.51, and a p-value
of 0.00, indicating a significant correlation. Visual inspection confirms that the regression
line is a good fit, and the residual plot shows no overall pattern.
Red alder rarely live to 200 years of age, and are typically in senescence by about
100 years of age (Newton and Cole 1994). For this reason, red alders would not be part of
an old-growth rating as dominant trees, although they are important as part of the
understory and the species diversity. The data for this analysis include one tree 120 years
old; the rest are all less than 100 years old.
These results show that mature red alder in forested wetlands with organic soils
are on average significantly smaller than the mature forest criteria, and the difference is
relatively large. For red alder 80 to 100 years of age, only two out of eight trees were
larger than 21 inches (53 cm) in diameter, and the best-fit line projected to 120 years of
age does not exceed 18 inches (45 cm) in diameter.
4.3.6 Red Alder (Alnus rubra), in Mineral Soils
Regression analysis of red alder in mineral soils included 68 trees from 14 sites.
Soils included sandy, gravelly, and silty loam soil types. Results are summarized in
Appendix A, Table A-1 and Figure A-6. As with red alder in organic soils, the correction
factor for total age was 5 years added to the age at breast height.
For red alder in mineral soils, the estimated average diameter at 80 years old is
15.1 inches, (38 cm) with a 90 percent confidence interval of 13.9 to 16.2 inches (35 to

39
41 cm). This result is smaller than the minimum size for mature forest by almost 6 inches
(15 cm), and the upper end of the confidence interval is almost 5 inches (12 cm) smaller.
These results are almost exactly the same as the results for red alder in organic soils.
The regression line has a coefficient of determination (R2) of 0.34, and the p-
value is 0.00, indicating a significant correlation. Variability is high, but the large number
of data points allows confidence in the resulting model. The residual plot shows no
overall pattern. Size variability increases near the middle of the age range, but decreases
at the upper end of the age range, so there is no overall trend of variability. As with other
species examined in this study, the variability between different sites is no larger than the
variability within a site.
The data analysis confirms that, as expected, mature red alder are much smaller
on average than the mature forest size criteria. The results for both organic and mineral
soils are nearly the same. Even on good sites, mature red alder are generally smaller than
the mature forest criterion; on these less-productive wetland sites they are much smaller
than the criterion, and it is unlikely they would come into play in support of a mature
forest rating based on size.
4.3.7 Coast pine (Pinus contorta var. contorta)
Coast pine is a coastal variety of the well-known lodgepole pine (Pinus contorta
Dougl. ex Loud. var. latifolia Engelm. ex S. Wats.) of the interior. Coast pine trees are
typically more shrubby and gnarled than the straight and upright inland variety. In the
Puget Lowlands, wetlands dominated by coast pine are usually sphagnum bogs. Trees in
these bogs may be very stunted, and even on productive sites coast pine are generally
smaller than other conifer species of the Pacific Northwest. Mature trees typically range
from 6 to 20 inches (15 to 50 cm) in diameter (Burns and Honkala 1990). Because of this
small size, and because most of the coast pine trees in the dataset were from sphagnum
bogs, this species is considered separately in the assessment of mature and old-growth
criteria.
Fifteen trees were sampled, from 4 wetland sites. Twelve of these trees came
from two sites that were clearly identified as sphagnum bogs. Of the remaining 3 trees,
two were growing in soil identified as silty loam, which means the site was not a
sphagnum bog. These two trees are included in the analysis, because they appear to fit in
well with the rest of the group, and because the overall sample size is small. They are the

40
two oldest trees in the data, so removing them would make the linear regression much
less significant.
The data include six trees older than 80 years (with an age correction factor of 10
years). The two oldest were about 150 years old. These two trees were 14 and 18 inches
(35 and 45 cm) in diameter. The six oldest trees averaged 116 years total age, but only 13
inches (34 cm) in diameter. Trees from Silver Lake averaged a little smaller than trees
from the other sites – six trees averaged 84 years total age, but only 11 inches (27 cm) in
diameter.
Linear regression of the combined data for coast pine yields an estimated
diameter of 12.0 inches (31 cm) at 80 years of age, with a 90 percent confidence interval
of 11.2 to 12.8 inches (29 to 33 cm). Although the correlation is statistically significant
(R2 = .67, and p = 0.00) more data are needed to account for variation between sites.
Results are presented in Appendix A, Table A-1 and Figure A-7.
Coast pine may live to 400 years or more, and may be the climax species in a
coastal forested wetland (Despain 1983; Kunze 1994). Therefore, coast pine trees may be
the dominant trees in an old-growth forest in a sphagnum bog, but will be much smaller
than the old-growth size criterion. It is likely that old-growth (200 year-old) coast pine
would be smaller than even the mature forest criterion of 21 inches (53 cm). This species
and this ecosystem were not part of the original scope of the interim old-growth
definition on which these criteria are based. The Pinus contorta bogs of the Pacific
Northwest cannot be lumped with other coniferous climax forests of the region; they
require a separate definition of the meaning of old-growth. Other conifers also may be
severely stunted when growing in sphagnum bogs, and hence outside the scope of the
old-growth definition.
4.4 Other Wetland Tree Species
Some other tree species that commonly occur in wetlands in the Puget Lowlands include
Oregon ash (Fraxinus latifolia), black cottonwood (Populus balsamifera ssp.
trichocarpa), and Pacific willow (Salix lucida Muhl. ssp. lasiandra (Benth.) E. Murr.).
Douglas-fir are also found in wetlands, but not as a dominant species. All of these species
were sampled in the Cooke Scientific data collection.
Like red alder, all of these species except Douglas-fir are relatively short-lived,
compared to the time-scale of a coniferous old-growth forest. They are early seral
species, and may also be present as part of the species mix in later stages. These tree

41
species were not considered candidates for dominant trees in old-growth forest in the
context of the interim old-growth definition. Since the WDOE old-growth definition is
open to include any tree species, large or old trees of these species could come into play
in the rating of a forested wetland.
Douglas-fir are rare in wetlands, but Hylebos Wetland contains a few scattered
individuals. Even in this relatively low-nutrient environment, Douglas-fir were not
severely stunted. One large tree 33 inches (83 cm) in diameter was only about 95 years
old; another 31 inches (78 cm) in diameter was about 106 years old. A large Douglas-fir
snag 48 inches (123 cm) in diameter was too large to core for age determination.
Therefore, Douglas-fir in some wetlands are not severely stunted, and may exceed the
old-growth criteria at an age younger than 200 years.
Oregon ash and black cottonwood are commonly found in riparian and
seasonally flooded habitats. Soils are usually mineral, or mineral with a thin organic
veneer (Burns and Honkala 1990; Kunze 1994). Field observations suggest that the
largest individuals grow at the edges of wetlands, or in areas of seasonal flooding, not in
areas of prolonged inundation.
Oregon ash may live 250 years, and can become quite large. Mature trees over
100 years old are about 16 to 30 inches (40 to 75 cm) in diameter on good sites, although
some individuals may be twice this size (Burns and Honkala 1990). Therefore, some
individuals could live to be old enough, and become large enough, to be counted as old-
growth trees, but they would be exceptional.
Data for this study include five Oregon ash from the White River in King
County. The age range is small, 61 to 76 years abh, but the diameter range is wide, 9 to
21 inches (23 to 53 cm). Average age was 67 years abh (probably about 72 years total),
and average diameter was 14.9 inches (38 cm). Since growth had begun to slow by this
age, it seems unlikely that these trees would average 21 inches (53 cm) in diameter after
another 8 years of growth. The largest individuals, however, will meet the minimum size
criterion for mature forest, and so could contribute to a mature forest rating based on size.
Black cottonwood is "the largest hardwood tree in western North America... the
most productive sites are the bottom lands of major streams and rivers west of the
Cascade Range in the Pacific Northwest. Pure stands may form on alluvial soils" (Burns
and Honkala 1990). Black cottonwood can grow very quickly, and can live for more than
200 years. It may attain a diameter of 8 inches (20 cm) or more by the age of 10 on good
sites. Exceptional trees may be 72 to 120 inches (180 to 300 cm) in diameter. Black

42
cottonwood trees are very intolerant of shade, but their rapid growth helps them stay
above the competition (Burns and Honkala 1990).
Data for this study include 23 black cottonwood trees from 6 wetlands (plus
some that were removed as outliers or suspect data points). The oldest trees were only 50
years abh, so it is impossible from these data to estimate diameter at 80 years of age.
However, 10 of these trees had a diameter larger than 21 inches (53 cm), some as young
as 22 years abh. Two trees younger than 40 years abh were larger than 34 inches (87 cm)
in diameter. The overall average age at breast height was 28 years, and the average
diameter was 20 inches (52 cm). It seems clear that these trees would average well over
the mature forest size criterion when the average age is 80 years. Some were already
larger than the old-growth size criterion at 40 years of age.
Pacific willow is more often discussed as a shrub rather than a tree, but in the
right conditions it can have the form of a tree, and can become large. Usually, the tree
form occurs in upland conditions, or at the edge of a wetland. In a wetland, it is more
likely to have a shrubby, multi-trunk morphology. The Oregon Register of Big Trees lists
a Pacific willow 27 inches (68 cm) in diameter as the Oregon state champion (Oregon
Department of Forestry 2002).
Data for this study include 35 Pacific willow trees from 16 wetlands; however,
all but 4 were less than 40 years old, and most were less than 14 inches (35 cm) in
diameter. The 4 oldest trees were from a single site, Jenkins Creek in King County. They
formed a cohort 71 to 110 years abh. Average age of these 4 trees was 89 years abh, with
average dbh of 16 inches (41 cm). These were old for willows, and it is unlikely that they
would grow to exceed the mature forest criterion of 21 inches (53 cm). The fact that the
Oregon State Champion is only 27 inches (68 cm) in diameter supports the conclusion
that only a very exceptional Pacific willow would exceed 21 inches in diameter.
In summary, black cottonwood trees frequently attain a size that exceeds the
mature forest criterion, and may exceed even the old-growth criterion well before 80
years of age. Some relatively large Oregon ash trees may exceed the mature forest
criterion by 80 to 100 years of age, and an exceptional individual may live 200 years and
may exceed the old-growth criterion. A Pacific willow tree larger than the mature forest
criteria is rare. These tree species are more likely to attain these large sizes at the edges of
a wetland, or in conditions of seasonal flooding, rather than in a wetland with prolonged
surface saturation. Douglas-fir, although rare in wetlands, is not necessarily severely

43
stunted in wetland conditions, and may exceed the old-growth size criterion at a relatively
young age.
5 Conclusion
Analysis of the diameter/age relationship reveals that the accepted mature and old-growth
size criteria are significantly larger than the average size of trees in forested wetlands at
80 and 200 years of age. Analysis of height data indicates that forested wetland sites in
the Puget Lowland region are in a low to moderate range of productivity for the four
species examined: western hemlock, Sitka spruce, western red cedar, and red alder. The
Puget Lowland is a highly productive region in general, but growth of trees is suppressed
in wetlands, due to the high water table and low availability of nutrients. Sphagnum bogs
are an extreme example of these stressful conditions, and trees in these bogs are
sometimes very stunted.
The concepts behind the standard old-growth definition are not directly
applicable to forested wetlands. Sites where trees grow slowly, such as wetlands, take
longer to develop the ecological characteristics typically associated with old-growth
(Franklin and Spies 1991; USDA Forest Service 1993). Old-growth inventory methods
differ in how they deal with this fact. Some emphasize size, so that slow-growing stands
must be older than fast-growing stands to count as old-growth. Others maintain the same
age criterion, but allow a smaller size for less-productive sites. This is the approach used
by the WDOE old-growth definition; it serves the purpose of protecting old wetland
forests, regardless of how well they match up with standard descriptions of old-growth.
Nevertheless, the size criteria are important, because it is much more difficult to
determine the age of a wetland tree than it is to measure its diameter, and because size
criteria are a feature of accepted old-growth definitions.
Succession and stand development are different in forested wetlands than in
upland stands. One of the basic characteristics of upland forest succession in the Pacific
Northwest lowlands is the early dominance of Douglas-fir, shifting to mixed stands of
more shade-tolerant species (Franklin and Spies 1991). Forested wetlands, by contrast,
have very little Douglas-fir at any stage, and usually have a mixed species composition at
all stages, although western hemlock typically becomes more dominant as the wetland
fills in with dead wood.
Because a wetland is a stressful environment for trees, small changes in
topography and substrate can make big differences in the growth rates of trees. Seedlings

44
grow primarily on nurse logs and root hummocks. As a stand matures, there is an
increase in the number and variety of these habitat niches, resulting in increased plant
diversity, stand density, and canopy layering. Therefore, wetland forest stands may be
less dense, but more diverse, than the surrounding upland forest, and stand density may
increase with age. This is different from the normal succession in upland stands, which
frequently begin very dense, and become less dense with age. Wetland and upland forests
have some characteristics in common, such as an increase in the amount of dead wood
and snags as a stand ages, but specific requirements for canopy closure and forest density
in the standard old-growth definition are not directly applicable to wetlands.
The purpose of the old-growth definition is different for forested wetlands than it
is for upland forests. Definitions such as the one used by WDOE were devised to
distinguish a certain type of forest habitat, important for the recovery of the northern
spotted owl, and encompassing a range of features typical of old Douglas-fir forests. In
the case of forested wetlands, the goal is to identify a different rare habitat type –
wetlands with old forests. These old wetland stands have a different ecology from the
classic Douglas-fir old-growth, which makes them ecologically and scientifically
valuable in their own right.
Age and diameter measurements show that mature western red cedar (Thuja
plicata), Sitka spruce (Picea sitchensis), and western hemlock (Tsuga heterophylla) in
wetlands are significantly smaller on average than the size criterion in the mature forest
definition, with 90 percent confidence. Similarly, the size estimate for 200-year-old
wetland trees is significantly smaller than the size criterion in the old-growth definition,
although in most cases the projection is beyond the range of the data (for Sitka spruce in
organic soils, the difference in size at 200 years does not reach the 90 percent confidence
level of significance). These results indicate that most of the time the average size of trees
in forested wetlands is below the minimum mature or old-growth size criterion, even after
they have passed the age criterion.
Red alder (Alnus rubra) is an early seral species, and old-growth definitions were
not intended to apply to this species. It is frequently present in forested wetlands,
however, and may come into play as one of the dominant species in a mature forest stand.
The WDOE forested wetland ratings do not limit the species that can be used to meet the
criteria, so red alder could be counted when making a mature forest determination.
Results of this study show that some mature forested wetlands contain red alder older

45
than 80 years, but they rarely reach 21 inches (53 cm) in diameter, and so would not
normally be counted as mature based on size.
Other forested wetland trees that could be part of a mature stand include Pacific
willow, Oregon ash, black cottonwood, and Douglas-fir. Pacific willow is unlikely to
exceed 21 inches (53 cm) in diameter. Oregon ash is smaller than the mature and old-
growth size criteria on average, but some individuals could exceed the criteria. Black
cottonwood is a large, fast-growing tree species, and could easily surpass the old-growth
size criterion, even at a relatively young age. Douglas-fir trees are rarely found in
wetlands, but when present they can attain large size, in some cases exceeding the old-
growth criteria well before 200 years of age.
Coast pine is a special case. Even very old coast pine are unlikely to reach 21
inches in size, and wetlands dominated by coast pine are usually sphagnum bogs. Other
tree species in sphagnum bogs frequently do not meet size criteria for mature or old-
growth forest, even when they meet the age criteria, because they are often very stunted.
In the WDOE system, sphagnum bogs are recognized as priority habitats even without
forest, so the size of trees does not affect their rating. From the standpoint of science, a
separate ecological definition of old-growth is necessary if the concept of old-growth is
to be applied to forested sphagnum bogs.
The Puget Lowlands region is a highly productive area, yet even here accepted
mature and old-growth forest size criteria are too large when applied to forested wetlands.
This finding has implications for wetlands in other parts of the Pacific Northwest. At
higher elevations, the shorter growing season results in smaller wetland trees, so the size
criteria would be even less appropriate than in the Puget Lowlands.
5.1 Recommendations
Size criteria in the accepted definitions of mature and old-growth forests do not
reflect the actual characteristics of forested wetlands, and should be revised downward.
Recent upland old-growth inventories have adopted revised criteria of 20 inches (51 cm)
dbh for mature forest, and 30 inches (76 cm) dbh for old-growth (Moeur et al. 2005).
These revised criteria are still larger than the size estimates produced by this analysis, the
results of which are presented in Appendix A, Table A-1.
Creating a minimum size standard for mature and old-growth forest requires a
decision about how inclusive the standard will be. If the predicted averages are used as
criteria, the expectation is that half of the sampled stands that are old enough will be too

46
small; therefore, this may be considered a value that is conservative in terms of what it
includes. Many mature wetland stands would still be smaller on average than this middle
value, and so would not be identified as mature on the basis of average size.
One way to derive an average value is to average the results for the dominant
wetland species. Averaging the size estimates at 80 years for western red cedar, Sitka
spruce, and western hemlock, including both organic and mineral soils, yields a value of
18 inches (46 cm) for the minimum average diameter of mature trees (80 years of age).
The old-growth criterion by this approach would be 27 inches (69 cm). These average
values are very close to the results for western red cedar and Sitka spruce in organic soils.
These estimates are probably a good indication of what to expect in the western
red cedar-western hemlock/skunk cabbage plant association, a common forested wetland
type in the Puget Lowlands. These average values, however, would not identify mature
forest stands in some other less-productive wetlands until they are much older than 80
years. Otter Island in the Snohomish River estuary is an example of a mature forested
wetland that would not pass an 18-inch (46 cm) average size criterion. Also, wetlands
that are slightly more acidic and lower in nutrients may have stands that are on average
smaller than these estimates.
The intent of the original interim old-growth definition was to set a standard low
enough to include “nearly all the old-growth stands for which we have data” (Old-
Growth Definition Task Group 1986). The estimated size at 80 years for trees in the
Snohomish River estuary is about 15 inches (38 cm). Therefore, a minimum average size
of 15 inches for mature forest would be needed to ensure that wetlands such as these are
properly evaluated based on size. This is small enough to include most of the mature
forested wetlands likely to be found in the Puget Lowlands, except those in sphagnum
bogs, or those dominated by red alder or coast pine. If this smaller minimum size
criterion is used, it is more likely that some stands will be counted as mature before 80
years of age, but more mature stands will be identified and protected; if the larger size is
used, more stands that are old enough to be counted as mature will be too small to pass
the size criterion.
A size criterion for trees 200 years old is more difficult to judge, because of the
scarcity of large, old trees. A criterion of 24 inches (61 cm) would include "nearly all the
old-growth stands for which we have data," except for those in sphagnum bogs. This is
the average size estimate for old-growth in the Snohomish River estuary, but there were
no 200-year-old trees in those data, so there is little basis for making such a projection.

47
This value of 24 inches is low for 200-year-old trees, but the Forest Service published a
size criterion of 21 inches (53 cm) for old-growth western hemlock on low-productivity
sites, even lower than this estimate of 24 inches (USDA Forest Service 1993).
The wording of the mature forest age and size criteria is not entirely consistent in
the WDOE definition. A stand would be more likely to pass the size criterion if it, like
the age criterion, required only that "the largest trees" exceed the minimum standard,
rather than requiring that the average exceed the minimum standard. This difference
means the age criterion is easier to pass than the size criterion. Changing "average" to
"the largest," in regard to size, similar to the way it is worded in the old-growth
definition, would have the effect of lowering the bar, making it easier for a stand to
qualify as mature on the basis of size.
The largest trees in a stand are not always the oldest. The oldest tree sampled in
this study was about 455 years old, and only 22 inches (57 cm) in diameter; another Sitka
spruce in the same general area and wetland type (the Snohomish estuary) was 30 inches
(76 cm) in diameter, but only 84 years old. Both trees were unusual, but they serve to
illustrate the point that growth rates are highly variable, even in the same wetland.
As the ecology of forested wetlands becomes better known, more refined
descriptions of growth and succession in these ecosystems will be possible. This is a
scientific endeavor, but it is linked to policy. Society has an interest in identifying and
protecting these sensitive, valuable, and rare ecosystems. One possible way to support
protection of forested wetlands in Washington would be to increase the value given to
coniferous forested wetlands in the WDOE wetland rating system. All forested wetlands
dominated by coniferous trees could be given a Category I rating, the same as mature
forested wetlands. This would remove the question of growth rates for some wetlands
(those most likely to be mature) from the arena of policy, since they would be treated the
same regardless of age. Wetlands with deciduous trees could still be rated based on age or
size, or they too could receive a Category I rating. The growth rates of wetland trees
would still be of scientific interest, but would be less consequential in the protection of
these rare forest environments.

48
References
Acker, S.A., J.F. Franklin, S.E. Greene, T.B. Thomas, R. Van Pelt, and K.J. Bible. 2006.Two decades of stability and change in old-growth forest at Mount RainierNational Park. Northwest Science 80(1): 65-72.
Barnes, G.H. 1962. Yield of even-aged stands of western hemlock. Technical Bulletin1273. USDA Forest Service. 52 p.
Brennick, C. 1999. Snohomish River Estuary Recreation Guide. Snohomish County Parksand Recreation, Everett, Washington. 52 p.
Burns, R.M., and B.H. Honkala, editors. 1990. Silvics of North America. USDA ForestService, Agriculture Handbook 654, Washington, DC. 877 p.
Carey, A.B. 2003. Restoration of landscape function: reserves or active management?Forestry 76(2): 221-230.
CSS. 2005. Pacific Northwest forested wetland literature survey synthesis paper andbibliography. Cooperative Monitoring Evaluation and Research (CMER) #04-406. Prepared by Cooke Scientific Services, Inc., for Washington Department ofNatural Resources, Olympia, Washington.
Daniel, T.W., J.A. Helms, and F.S. Baker. 1979. Principles of Silviculture, 2nd edition.McGraw-Hill, New York. 500 p.
Debose, A., and M.W. Klungland. 1983. Soil survey of Snohomish County Area,Washington. July 1983. USDA, National Soil Conservation Service (SoilConservation Service). 117 p. http://soildatamart.nrcs.usda.gov
Despain, D.G. 1983. Nonpyrogenous climax lodgepole pine communities in YellowstoneNational Park. Ecology 64(2): 231-234.
FEMAT. 1993. Forest ecosystem management: an ecological, economic, and socialassessment. Forest Ecosystem Management Assessment Team, USDA ForestService.
Fitzgerald, B.J. 1977. Kings Lake Bog: A description of its vegetation andmicroenvironments. University of Washington Arboretum Bulletin 40(3): 14-22.
Forest Club UBC. 1971. Forestry Handbook for British Columbia, Third edition. TheForest Club, University of British Columbia, Vancouver, BC, Canada.
Franklin, J.E., D. Lindenmayer, J.A. MacMahon, A. Mckee, J. Magnuson, and D.A.Perry. 2000. Threads of continuity: ecosystem disturbance, recovery, and thetheory of biological legacies. Conservation Biology in Practice 1: 9-16.
Franklin, J.F., and C.T. Dyrness. 1973. Natural vegetation of Oregon and Washington.GTR-PNW-8. USDA Forest Service, Pacific Northwest Region, Portland. 417 p.

49
Franklin, J.F., T. Spies, R.V. Pelt, T. Riepe, S. Hull, and W. Obermeyer. 2005. Definitionand inventory of old-growth forests on DNR-managed state lands. June 2005.Washington State Department of Natural Resources, Olympia, Washington.
Franklin, J.F., and T.A. Spies. 1991. Ecological definitions of old-growth douglas-firforests. Pages 61-69 in Wildlife and Vegetation of Unmanaged Douglas-FirForests PNW-GTR-285. USDA Forest Service, Pacific Northwest ResearchStation, Portland, Oregon.
Friends of the Hylebos Wetlands. 2001. Plant life in the West Hylebos Wetlands.Accessed September 2. http://www.hylebos.org/statepark/flora.htm
Granger, T., T. Hruby, A. McMillan, D. Peters, J. Rubey, D. Sheldon, S. Stanley, and E.Stockdale. 2005. Wetlands in Washington State - Volume 2: Guidance forProtecting and Managing Wetlands. Ecology Publication #05-06-008. April2005. Washington State Department of Ecology, Olympia, Washington.http://www.ecy.wa.gov/programs/sea/wetlands/bas/index.html
Hegyi, F., J.J. Jelinek, J. Viszlai, and D.B. Carpenter. 1979. Site index equations andcurves for the major tree species in British Columbia. Forest Inventory ReportNo. 1. British Columbia Ministry of Forests, Victoria, BC, Canada.
Hemstrom, M., T. Spies, C. Palmer, R. Kiester, J. Teply, P. McDonald, and R.Warbington. 1998. Late-successional and old-growth forest effectivenessmonitoring plan for the Northwest Forest Plan. General Technical Report PNW-GTR-438. United States Department of Agriculture, Forest Service, PacificNorthwest Research Station, Portland, Oregon. 37 p.
Henderson, J.A., D.H. Peter, R.D. Lesher, and D.C. Shaw. 1989. Forested plantassociations of the Olympic National Forest. R6 ECOL Technical Paper 001-88.USDA Forest Service, Pacific Northwest Region. 502 p.
Hruby, T. 2004. Washington State wetland rating system for western Washington -revised. Publication # 04-06-025. Washington State Department of Ecology,Olympia, Washington.
Keller, G. 2001. Applied Statstics with Microsoft Excel. Duxbury, a division of ThomsonLearning, Pacific Grove, California. 670 p.
Kulzer, L., S. Luchessa, S. Cooke, R. Errington, and F. Weinmann. 2001. Characteristicsof the low-elevation Sphagnum-dominated peatlands of western Washington: acommunity profile. U.S. Environmental Protection Agency Grant. King CountyWater and Land Resources Division, Seattle, Washington.http://dnr.metrokc.gov/wlr/dss/sphagnum-bogs.htm
Kunze, L. 1994. Preliminary classification of native, low elevation, freshwater wetlandvegetation in western Washington. Washington State Department of NaturalResources, Natural Heritage Program Olympia, Washington. 120 p.

50
Minore, D., and C.E. Smith. 1971. Occurrence and growth of four Northwestern treespecies over shallow water tables. PNW-160. August 1971. USDA ForestService, Pacific Northwest Research Station.
Moeur, M., T.A. Spies, M. Hemstrom, J.R. Martin, J. Alegria, J. Browning, J. Cissel,W.B. Cohen, T.E. Demeo, S. Healey, and R. Warbington. 2005. NorthwestForest Plan–The first 10 years (1994-2003): status and trend of late-successionaland old-growth forest. PNW-GTR-646. USDA Forest Service, Pacific NorthwestResearch Station, Portland, Oregon. 142 p.
Moore, S. 1999. Feature Plant: Sitka Spruce. Going Native, Quarterly Newsletter ofSnohomish County's Native Plant Salvage Program 4(2): 4.
National Wetlands Working Group. 1988. Wetlands of Canada. Ecological ClassificationSeries Number 24. Environment Canada Sustainable Development Branch,Polyscience Publishing Inc., Montreal, Canada. 452 p.
NCDC. 2002. Monthly Station Normals of Temperature, Precipitation, and Heating andCooling Degrees Days 1971 – 2000. Climatology of the United States No. 81, 45Washington. National Oceanic Atmospheric Administration, National ClimaticData Center, Asheville, North Carolina. 34 p.http://cdo.ncdc.noaa.gov/climatenormals/clim81/WAnorm.pdf
Newton, M., and E.C. Cole. 1994. Stand development and successional implications:pure and mixed stands. Pages 106-115 in D. E. Hibbs, D. S. DeBell, and R. F.Tarrant, editors. The Biology and Management of Red Alder. Oregon StateUniversity Press, Corvallis, Oregon.
Old-Growth Definition Task Group. 1986. Interim definitions for old-growth Douglas-firand mixed-conifer forests in the Pacific Northwest. PNW-RN-447. USDA ForestService, Pacific Northwest Research Station, Portland, Oregon.
Oregon Department of Forestry. 2002. Oregon Register of Big Trees. Oregon Departmentof Forestry, Salem, Oregon. Accessed February 4, 2007.http://159.121.125.11/bigtrees/Champs/pacwillow.html
Reed, P.B., Jr. 1988. National list of plant species that occur in wetlands: Northwest(Region 9). Biological Report 88(26.9). U.S. Fish and Wildlife Service.http://www.fws.gov/nwi/plants.htm
Snyder, D.E., P.S. Gale, and R.F. Pringle. 1973. Soil survey of King County area,Washington. November 1973. USDA, National Soil Conservation Service (SoilConservation Service), Washington Agricultural Experiment Station.
Tiner, R.W. 1999. Wetland Indicators: A Guide to Wetland Identification, Delineation,Classification, and Mapping. CRC Press LLC, Boca Raton, Florida. 392 p.
Topik, C., N.M. Halverson, and D.G. Brockway. 1986. Plant association andmanagement guide for the western hemlock zone. R6-ECOL-230A-1986. USDAForest Service, Pacific Northwest Region, Portland, Oregon.

51
USACE. 2005. Wetland delineation report guidance. January 2005. Oregon Departmentof State Lands, Portland District Corps of Engineers, Portland, Oregon.
USDA Forest Service. 1993. Region 6 Interim Old-growth Definitions: Western HemlockSeries. USDA Forest Service, Pacific Northwest Region, Portland.http://www.reo.gov/ecoshare/publications/searchresults.asp
WDFW. 1999. Priority habitats and species. Washington State Department of Fish andWildlife, Olympia, Washington. http://wdfw.wa.gov/hab/phshabs.htm
WDNR. 2001a. The geology of Washington. Washington State Department of NaturalResources, Division of Geology and Earth Resources. Accessed January 13,2007. http://www.dnr.wa.gov/geology/geolofwa.htm
WDNR. 2001b. The geology of Washington - Puget Lowland. Washington StateDepartment of Natural Resources, Division of Geology and Earth Resources.Accessed January 13, 2007. http://www.dnr.wa.gov/geology/lowland.htm
WDOE. 1997. Washington State wetlands identification and delineation manual.Publication 96-94. March 1997. Washington State Department of Ecology,Olympia, Washington.
Acronyms
FEMAT Forest Ecosystem Management TeamForest Club UBC The Forest Club of the University of British ColumbiaNCDC National Climate Data CenterUSACE United States Army Corps of EngineersUSDA Unites States Department of AgricultureWDFW Washington State Department of Fish and WildlifeWDNR Washington State Department of Natural ResourcesWDOE Washington State Department of Ecology

52

53
Appendix A: Expected Diameter and Regression Results
Table A-1. Linear Regression Results
y=dbh, x=abh; y=a*Ln(x)+b
Expected dbh at 80 yrs total age
Species Soil typeABHadj.
Count Expected 90% CIR2
p-value
western red cedar 18.2 in 16.7-19.7 in 0.52Thuja plicata
organic9 40 46 cm 42-50 cm p=0.00
Sitka spruce 18.8 in 17.2-20.3 in 0.42Picea sitchensis
organic8 36 48 cm 44-52 cm p=0.00
Sitka spruce 15.4 in 13.6-17.1 in 0.21Picea sitchensis
mineral8 25 39 cm 34-44 cm p=0.00
western hemlock 19.3 in 18.1-20.5 in 0.48Tsugaheterophylla
organic9 38 49 cm 46-52 cm p=0.00
red alder 15.2 in 14.2-16.2 in 0.51Alnus rubra
organic5 35 39 cm 36-41 cm p=0.00
red alder 15.1 in 13.9-16.2 in 0.34Alnus rubra
mineral5 68 38 cm 35-41 cm p=0.00
coast pine 12.0 in 11.2-12.8 in 0.67Pinus contorta
organic+mineral 10 15 31 cm 29-33 cm p=0.00
Mature forest definition 21 in (53 cm)
Expected dbh at 200 yrs total age (R2 and p-values as above)
Species Soil typeABHadj.
Count Expected 90% CIMax agein data
western red cedar 28.0 in 25.9-30.1 in Thuja plicata
organic9 40 71 cm 66-77 cm 261
Sitka spruce 29.7 in 26.7-32.8 in Picea sitchensis
organic8 35 76 cm 68-83 cm 198
Sitka spruce 24.3 in 18.8-29.8 in Picea sitchensis
mineral8 25 62 cm 48-76 cm 159
western hemlock 26.7 in 24.0-29.4 in Tsugaheterophylla
organic9 38 68 cm 61-75 cm 180
coast pine 15.7 in 14.0-17.4 in Pinus contorta
organic+mineral 10 15 40 cm 36-44 cm 150
Old-Growth definition 32 in (81 cm)

Appendix A: Expected Diameter and Regression Results
54
Figure A-1. Western Red Cedar (Thuja plicata) Regression Plots
Western Red Cedar DBH vs. ABHy = 25.176Ln(x) - 61.047
R2 = 0.52
10
20
30
40
50
60
70
80
90
20 40 60 80 100 120 140 160 180 200 220 240 260
Age at Breast Height, Years (Total Age=ABH+9)
Dia
mete
r at
Bre
ast
Heig
ht,
cm
Hylebos
Lilliwaup
Lilliwaup F
LittleEgypt
EvansCreek
SnohomishCo
4 others
Log. (Regression)
Lilliwaup A,D not included
Western Red Cedar Ln ABH Line Fit Plot y = 25.176x - 61.047
R2 = 0.52
10
20
30
40
50
60
70
80
90
3 4 4 5 5 6 6Ln ABH
DBH
cm upper 90% CI
lower 90% CI
Linear (DBH cm)
Western Red Cedar Ln ABH Residual Plot
-30
-20
-10
0
10
20
30
3.0 3.5 4.0 4.5 5.0 5.5 6.0
Ln ABH
Resi
duals

Appendix A: Expected Diameter and Regression Results
55
Figure A-2. Sitka Spruce (Picea sitchensis) Regression Plots for Organic Soils
Sitka Spruce ABH vs. DBH - Organic Soilsy = 28.46Ln(x) - 74.089
R2 = 0.42
20
30
40
50
60
70
80
90
100
40 60 80 100 120 140 160 180 200 220 240
Age at Breast Height, years (Total Age=ABH+8)
Dia
met
er a
t Bre
ast
Hei
ght,
cm
Hylebos
Lilliwaup
Lilliwaup F
LittleEgypt
SwampCreek
SnohomishCo
outlier
Log. (Regression)
outli
Sitka Spruce Ln ABH Line Fit Plot - Organic Soils y = 28.46x - 74.089R2 = 0.42
30
40
50
60
70
80
90
100
4.0 4.5 5.0 5.5Ln ABH
DBH
cm Upper 90% CI
Lower 90% CI
Linear (DBH cm)
Sitka Spruce Ln ABH Residual Plot - Organic Soils
-30
-20
-10
0
10
20
30
4.0 4.5 5.0 5.5
Ln ABH
Resid
uals

Appendix A: Expected Diameter and Regression Results
56
Figure A-3. Sitka Spruce (Picea sitchensis) Regression Plots for MineralSoils, Snohomish Estuary
Sitka Spruce ABH vs. DBH - Mineral Soils, Snohomish estuary
76
y = 23.061Ln(x) - 59.538R2 = 0.21
20
30
40
50
60
70
80
40 60 80 100 120 140 160
Age at Breast Height, years (Total Age=ABH+8)
Dia
mete
r at
Bre
ast
Heig
ht,
cm
OtterIsland
SpencerIsland
3 others
outlier
Log. (Regression)
low outlier not shown, 445 yrs abh, 56.7 cm dbh
Sitka Spruce Ln ABH Line Fit Plot - Mineral Soils, Snohomish Estuary
y = 23.061x - 59.538R2 = 0.21
2025303540455055606570
3.7 3.9 4.1 4.3 4.5 4.7 4.9 5.1
Ln ABH
DBH
cm Predicted DBH cm
upper 90% CI
lower 90% CI
Linear (DBH cm)
Sitka Spruce Ln ABH Residual Plot - Mineral Soils, Snohomish Estuary
-30
-20
-10
0
10
20
30
3.7 3.9 4.1 4.3 4.5 4.7 4.9 5.1
Ln ABH
Resi
duals

Appendix A: Expected Diameter and Regression Results
57
Figure A-4. Western Hemlock (Tsuga heterophylla) Regression Plots
Western Hemlock DBH vs. ABHy = 18.957Ln(x) - 31.731
R2 = 0.48
10
20
30
40
50
60
70
80
0 20 40 60 80 100 120 140 160 180Age at Breast Height, years (Total Age = ABH+9)
Dia
met
er a
t Bre
ast
Hei
ght,
cm Hylebos
Lilliwaup
Lilliwaup F
LittleEgypt
Evans
AmesLake
BigBearCr24
LowerCedarRiv
Log. (Regression)
Western Hemlock Ln ABH Line Fit Plot y = 18.957x - 31.731
R2 = 0.48
10
20
30
40
50
60
70
80
2.5 3.0 3.5 4.0 4.5 5.0 5.5
Ln ABH
DBH
cm upper 90% CI
lower 90% CI
Linear (DBH cm)
Western Hemlock Ln ABH Residual Plot
-30
-20
-10
0
10
20
30
2.5 3.0 3.5 4.0 4.5 5.0 5.5
Ln ABH
Resi
duals

Appendix A: Expected Diameter and Regression Results
58
Figure A-5. Red Alder (Alnus rubra) Regression Plots for Organic Soils
Red Alder DBH vs. ABH - Organic Soils y = 11.677Ln(x) - 11.866
R2 = 0.51
10
20
30
40
50
60
0 20 40 60 80 100 120
Age at Breast Height, years (Total Age=ABH+5)
Dia
mete
r at
Bre
ast
Heig
ht,
cm
HylebosLilliwaupLittleEgyptBigBearCrEvansMillerSwampCrE Lk WaAmesLkLowerCedarRivSpanawayPurcellLog. (Regression)
Red Alder Ln ABH Line Fit Plot - Organic Soilsy = 11.677x - 11.866
R2 = 0.51
10
20
30
40
50
60
2.5 3.0 3.5 4.0 4.5 5.0
Ln ABH
DBH
cm upper 90% CI
lower 90% CI
Linear (DBH cm)
Red Alder Ln ABH Residual Plot - Organic Soils
-15
-10
-5
0
5
10
15
20
2.5 3.0 3.5 4.0 4.5 5.0
Ln ABH
Resi
duals

Appendix A: Expected Diameter and Regression Results
59
Figure A-6. Red Alder (Alnus rubra) Regression Plots for Mineral Soils
Red Alder DBH vs. ABH - Mineral Soils y = 10.658Ln(x) - 7.7558
R2 = 0.34
10
20
30
40
50
10 20 30 40 50 60 70
Juanita
LowerGreen
Jenkins
Snoqualmie
Bellevue31
BigBear24
RagingRiv5
May
Others
Log. (Regression)
Dia
mete
r at
Bre
ast
Heig
ht,
cm
Age at Breast Height, years (Total Age=ABH+5)
Red Alder Ln ABH Line Fit Plot - Mineral Soils y = 10.658x - 7.7558
R2 = 0.3427
10
20
30
40
50
2.5 3.0 3.5 4.0 4.5
Ln ABH
DBH
cm
upper 90% CI
lower 90% CI
Linear (DBH cm)
Red Alder Ln ABH Residual Plot - Mineral Soils
-15
-10
-5
0
5
10
15
2.0 2.5 3.0 3.5 4.0 4.5
Ln ABH
Resi
duals

Appendix A: Expected Diameter and Regression Results
60
Figure A-7. Coast pine (Pinus contorta) Regression Plots
Coast Pine DBH vs. ABH y = 9.426Ln(x) - 9.4921
R2 = 0.6709
10
20
30
40
50
0 20 40 60 80 100 120 140 160
Age at Breast Height, years (Total Age=ABH+10)
Dia
mete
r at
Bre
ast
Heig
ht,
cm
Regression
Budd Inlet
Silver Lake
Homeacres
Purcell
Log. (Regression)
Coast Pine Ln ABH Line Fit Plot y = 9.426x - 9.4921
R2 = 0.67
101520253035404550
2.5 3.0 3.5 4.0 4.5 5.0 5.5
Ln ABH
DBH
cm upper 90% CI
lower 90% CI
Linear (DBH cm)
Coast Pine Ln ABH Residual Plot
-10-8-6-4-202468
10
2.5 3.0 3.5 4.0 4.5 5.0 5.5
Ln ABH
Res
idual
s

Appendix B: Mean Diameter, Age, and Summary Statistics for WetlandStands
61
Appendix B: Mean Diameter, Age, and Summary Statistics for WetlandStands
THPL = Thuja plicata; TSHE = Tsuga heterophylla; PISI = Picea sitchensis;ALRU = Alnus rubra; PICO = Pinus contorta; PSME = Psuedotsuga menziesiiABH = age at breast height, years; DBH = diameter at breast heightTotal age = ABH + 8
Table B-1. Mean Diameter, Age, and Summary Statistics
Little Egypt All (without ALRU) -- THPL, TSHE, PISI ABH DBH cm DBH in Total agemean 112.8 59.6 23.5 121median 107 62 24.4 115stdev 40.6 11.3 4.4 min 71 44 17.3 79max 218 85 33.5 226count 15 15 15 15
Little Egypt Area A -- THPL, TSHE, PISI ABH DBH cm DBH in Total agemean 105.8 60.1 23.7 113.75median 90.5 59.3 23.3 98.5stdev 47.7 13.2 5.2 min 71 44 17.3 79max 218 85 33.5 226count 8 8 8 8
Little Egypt Area A without oldest -- THPL, TSHE, PISI ABH DBH cm DBH in Total agemean 84.5 54.3 21.4 93median 89.5 54.3 21.4 97.5stdev 9.0 7.6 3.0 min 71.0 44.0 17.3 79max 91.0 63.0 24.8 99count 6 6 6 6
Little Egypt Area B (without ALRU) -- THPL, TSHE, PISI ABH DBH cm DBH in Total agemean 120.9 59.0 23.2 129median 112.0 63.5 25.0 120stdev 32.4 9.6 3.8 min 96 44 17.3 104max 193 70 27.6 201count 7 7 7 7

Appendix B: Mean Diameter, Age, and Summary Statistics for WetlandStands
62
Table B-1 (cont.)Hylebos All -- THPL, TSHE, PISI, ALRU, PSME ABH DBH cm DBH in mean 98.7 57.0 22.5 107median 92.0 58.5 23.0 100stdev 31.6 15.0 5.9 min 47 34 13.4 55max 197 89 35.0 205count 51 51 51 51
Hylebos All (without PSME) -- THPL, TSHE, PISI, ALRU ABH DBH cm DBH in Total agemean 99.6 56.3 22.2 108median 92.5 57.3 22.5 101stdev 32.2 14.5 5.7 min 47 34 13 55max 197 89 35 205count 48 48 48
Hylebos All (without ALRU or PSME) -- THPL, TSHE, PISI ABH DBH cm DBH in Total agemean 101.8 58.8 23.1 110median 102.0 61.0 24.0 110stdev 34.4 14.0 5.5 min 47.0 34.0 13.4 55max 197.0 89.0 35.0 205count 41 41 41 41
Hylebos All without ALRU -- THPL, TSHE, PISI, PSME ABH DBH cm DBH in mean 100.6 59.4 23.4 109median 99.0 61.3 24.1 107stdev 33.6 14.4 5.7 min 47 34 13.4 55max 197 89 35.0 205count 44 44 44 44
Hylebos middle ages (without ALRU, PSME) -- THPL, TSHE, PISI ABH DBH cm DBH in Total agemean 89.2 56.8 22.4 97median 90.0 58.5 23.0 98stdev 9.3 13.5 5.3 min 78 35 13.8 86max 103 75 29.5 111count 13 13 13 13

Appendix B: Mean Diameter, Age, and Summary Statistics for WetlandStands
63
Table B-1 (cont.)Hylebos Area A,A2,B -- TSHE, PISI ABH DBH cm DBH in Total agemean 78.4 54.3 21.4 86median 70.0 50.5 19.9 78stdev 24.3 14.3 5.6 min 47 36 14.2 55max 122 83.5 32.9 130count 17 17 17 17
Hylebos Area A -- TSHE, PISI ABH DBH cm DBH in Total agemean 93.5 51.2 20.1 102median 92.0 49.8 19.6 100stdev 18.0 8.9 3.5 min 69 40.5 15.9 77max 122 61.5 24.2 130count 6 6 6 6
Hylebos Area A, A2 -- TSHE, PISI ABH DBH cm DBH in Total agemean 76.2 52.1 20.5 84median 67.0 49.0 19.3 75stdev 24.5 13.8 5.4 min 47 36.0 14.2 55max 122 83.5 32.9 130count 14 14 14 14
Hylebos Area A interior -- TSHE ABH DBH cm DBH in mean 100.3 46.1 18.2 108median 98.0 45.3 17.8 106stdev 16.6 5.4 2.1 min 83 40.5 15.9 91max 122 53.5 21.1 130count 4 4 4 4

Appendix B: Mean Diameter, Age, and Summary Statistics for WetlandStands
64
Table B-1 (cont.)Lilliwaup All except D and A -- THPL, TSHE, PISI ABH DBH cm DBH in Total agemean 79.1 45.6 20.6 87median 78.2 50.8 21.8 86stdev 54.2 24.6 11.6 min 6 6 3.0 14max 218 89 51 226count 54 54 54 54
Lilliwaup Area D and A (bog) -- THPL, TSHE ABH DBH cm DBH in Total agemean 78.9 42.4 16.7 87median 92.0 49.8 19.6 100stdev 38.9 20.1 7.9 min 18.0 8.9 3.5 26max 122.0 61.5 24.2 130count 5 5 5 5
Lilliwaup E -- THPL, TSHE, PISI ABH DBH cm DBH in Total agemean 83.1 47.9 22.7 91median 83.6 53.7 22.8 92stdev 57.8 24.5 12.9 min 7 7 5.3 15max 197 89 51 205count 32 32 32 32
Lilliwaup F transitional bog -- THPL, TSHE, PISI ABH DBH cm DBH in Total agemean 59.8 42.6 18.5 68median 58.5 43.3 18.4 67stdev 38.9 26.0 9.0 min 17 14.3 5.6 25max 122 83.5 32.9 130count 6 6 6 6
Lilliwaup B, B2, and C -- TSHE, PISI ABH DBH cm DBH in Total agemean 78.3 42.2 17.1 86median 87.0 49.1 19.3 95stdev 53.0 25.2 9.2 min 6 6 3.0 14max 218 85 33.5 226count 16 16 16 16

Appendix B: Mean Diameter, Age, and Summary Statistics for WetlandStands
65
Table B-1 (cont.)Sno Estuary All -- PISI ABH DBH cm DBH in Total agemean 85.0 43.4 17.1 93median 82.0 41.4 16.3 90stdev 20.4 13.0 5.1 min 44 24 9.4 52max 151 76 29.9 159count 23 23 23 23
Sno Estuary Otter Island -- PISI ABH DBH cm DBH in Total agemean 86.6 41.9 16.5 95median 82.0 41.4 16.3 90stdev 19.9 11.2 4.4 min 66 25 9.8 74max 151 64.1 25.2 159count 17 17 17 17
Sno Estuary Spencer Island South -- PISI ABH DBH cm DBH in Total agemean 87.8 49.1 19.3 96median 95.0 48.0 18.9 103stdev 16.4 19.4 7.6 min 68 24 9.4 76max 106 76 29.9 114count 5 5 5 5
Sno Estuary All above 41 cm -- PISI ABH DBH cm DBH in Total agemean 89.2 49.8 19.6 97median 84.0 48.2 19.0 92stdev 21.5 10.9 4.3 min 66 36 14.2 74max 151 76 29.9 159count 15 15 15 15

Appendix B: Mean Diameter, Age, and Summary Statistics for WetlandStands
66
Table B-1 (cont.)Silver Lake (bog) largest trees, all species – PICO, TSHE, PISI ABH DBH cm DBH in Total agemean 72.6 36.8 14.5 83median 78.5 34.7 13.7 89stdev 21.4 12.2 4.8min 42 26 10 52max 102 63 25 112count 10 10 10 10
Silver Lake (bog) -- PICO ABH DBH cm DBH in (ABH+10)mean 77.6 28.0 11.0 88median 83.0 26.8 10.5 93stdev 21.4 3.1 1.2min 49 26 10 59max 102 33 13 112count 5 5 5 5
Silver Lake (bog) -- TSHE ABH DBH cm DBH in Total agemean 73.0 47.7 18.8 81median 78.5 45.9 18.1 87stdev 22.0 12.0 4.7 min 42 36.2 14.3 50max 93 62.7 24.7 101count 4 4 4 4

67
Appendix C: Stand Height and Site Index
Table C-1. Stand Height and Site Index
ABH=age at breast height, years; Ht=height; SI=Site Index;Base age = 50 or 100 total years
Thuja plicata (THPL) Site Indexes ABH Ht m Ht ft Total age SI 100
THPL Hylebos all areas -- mean 108.3 27.4 89.8 118 86
stdev 36.1 7.2 23.8
count 17 17 17
THPL Little Egypt all areas -- mean 144.0 29.7 97.5 154 89
stdev 62.7 7.3 24.1
count 7 7 7
THPL Hylebos and Little Egypt mean SI 87
Thuja plicata (THPL) Site Indexes -- bog ABH Ht m Ht ft Total age SI 100
THPL Lilliwaup A and D -- mean 131.2 23.0 75.6 141 70
stdev 62.9 0.9 3.0
count 5 5 5
Picea sitchensis (PISI) Site Indexes ABH Ht m Ht ft Total age SI 100
PISI Lilliwaup all areas except A and D -- mean 67.8 21.1 69.2 76 74
stdev 5.2 4.4 14.6
count 9 9 9
Picea sitchensis (PISI) Site Indexes ABH Ht m Ht ft Total age SI 100
PISI Hylebos all areas -- mean 119.7 29.9 97.9 128 95
stdev 34.4 4.2 13.6
count 9 9 9
PISI Little Egypt all -- mean 88.2 29.1 95.4 96 96
stdev 13.4 3.1 10.2
count 6 6 6
PISI Swamp Creek -- mean 103.3 29.3 96.1 111 95
stdev 4.8 4.0 13.1
count 4 4 4
PISI Hylebos, Little Egypt, and Swamp Creek mean SI 95
Picea sitchensis (PISI) Site Indexes ABH Ht m Ht ft Total age SI 100
PISI Snohomish Estuary Otter Island --mean 88.0 22.5 73.8 96 74
stdev 22.9 2.2 7.3
count 12 12 12

Appendix C: Stand Height and Site Index
68
Table C-1 (cont.)
Tsuga heterophylla (TSHE) Site Indexes ABH Ht m Ht ft Total age SI 100
TSHE Hylebos -- mean 81.7 32.1 105.2 91 110
stdev 25.9 4.8 15.9
count 18 18 18
TSHE Lilliwaup without Areas A and D -- mean 82.0 32.3 106.0 91 111
stdev 0.0 3.5 11.5
count 2 2 2
TSHE Little Egypt -- mean 106.0 35.4 116.3 115 111
stdev 21.2 2.4 7.9
count 2 2 2
TSHE Hylebos, Lilliwaup, Little Egypt mean SI 111
Tsuga heterophylla (TSHE) Site Indexes -- bogs ABH Ht m Ht ft Total age SI 100
TSHE Budd Inlet -- mean 35.2 18.2 59.6 44 103
stdev 9.4 2.1 6.9
count 5 5 5
TSHE Silver Lake -- mean 78.5 28.5 93.5 88 100
stdev 4.9 0.6 2.1
count 2 2 2
TSHE Budd Inlet and Silver Lake mean SI 101
Alnus rubra (ALRU) Site Indexes -- histosols ABH Ht m Ht ft Total age SI 100
ALRU Hylebos -- mean 88.0 26.8 88.0 93 79
stdev 2.7 2.6 8.5
count 6 6 6
ALRU Evans Creek -- mean 63.7 27.4 89.9 69 83
stdev 2.5 4.7 15.4
count 3 3 3
ALRU Miller Creek -- mean 58.6 28.1 92.0 64 86
stdev 6.3 2.3 7.6
count 5 5 5
ALRU histosol -- mean SI 82

Appendix C: Stand Height and Site Index
69
Table C-1 (cont.)
Alnus rubra (ALRU) Site Indexes -- nonhistosol ABH Ht m Ht ft Total age SI 100
ALRU Lower Green River -- mean 48.4 22.8 74.7 53 72
stdev 9.6 1.6 5.3
count 5 5 5
ALRU Jenkins Creek -- mean 50.6 24.4 80.0 56 76
stdev 1.8 2.8 9.2
count 4 4 4
ALRU Snohomish River -- mean 31.3 22.1 72.6 36 78
stdev 3.3 4.9 16.0
count 11 11 11
ALRU Juanita Creek -- mean 27.0 21.6 70.9 32 80
stdev 4.1 2.0 6.5
count 4 4 4
ALRU nonhistosol -- mean SI 76
Mixed Coniferous Species Site Indexes ABH Ht m Ht ft Total age SI 1001
Hylebos – mean 100.6 30.8 100.9 109 95
stdev 34 5 16
count 40 40 40
Little Egypt Area A -- mean 105.8 31.4 103.1 114 95
stdev 47.7 4.6 15.0
count 8 8 8
Little Egypt Area B -- mean 107.8 29.0 95.0 116 90
stdev 8.5 3.1 10.2
count 4 4 4
Lilliwaup B, B2, and C – mean 67.1 23.6 77.6 75 90
stdev 7.3 6.1 20.0
count 14 14 14
Mixed Species -- mean SI 93
Lilliwaup Areas A and D (bog) – mean 123.4 22.4 73.4 131 65
stdev 54.4 2.8 9.1
count 7 7 71Based on mixed-species site index in Forest Club (1971)

Appendix C: Stand Height and Site Index
70
Site Index Equations
Site indexes were estimated using the equations listed below, as cited in
Henderson et al. (1989). Age is total age (TAge) in years; height (Ht) is in feet:
Thuja plicata, western red cedar: base age = 100 years total age (Hegyi et al.
1979):
SI = Ht/(1.1243 [1-e(-0.0263TAge)]1.5662)
Picea sitchensis, Sitka spruce: base age = 100 years total age (Hegyi et al. 1979):
SI = Ht/(1.0458 [1-e(-0.0380TAge)]1.9804)
Tsuga heterophylla, western hemlock: base age = 100 years total age, for ages 30-
400 (Barnes 1962):
SI = Ht(07.409 + 12.96258/TAge + 1348.904/TAge2)
Alnus rubra, red alder: base age = 50 years total age (Hegyi et al. 1979):
SI = Ht/(1.1302 [1-e(-0.0421TAge)]0.9422)
Table C-2. Reference Site Indexes
Species SI Range (ft) Midpoint (ft) Source
western red cedar Henderson et al. 1989
Thuja plicata 60-200 130 Heygi et al. 1979
Sitka spruce Henderson et al. 1989
Picea sitchensis 80-220 150 Heygi et al. 1979
western hemlock Henderson et al. 1989
Tsuga heterophylla 60-200 130 Barnes 1962
red alder Henderson et al. 1989
Alnus rubra 40-140 90 Heygi et al. 1979

Appendix D: Data TablesTable D-1: Forested Wetland Data
Wetland Site Name County SpeciesRingsActual
ABHFinal
DBHcm
DBHinch
Heightfeet Soil Type Comment
Ames Lake King ALRU 16 17 17.7 7.0 45 Histosol w/ clay at 20" Ames Lake King ALRU 18 19 20.4 8.0 57 Histosol w/ clay at 20" Ames Lake King ALRU 15 17 17.5 6.9 54 Histosol w/ clay at 20" Ames Lake King ALRU 53 54 31.2 12.3 77 sandy loam Ames Lake King ALRU 49 54 42.0 16.6 90 sandy loam Ames Lake King SALA 17 19 32.7 12.9 63 Histosol w/ clay at 20" Ames Lake King TSHE 18 18 20.1 7.9 54 Histosol w/ clay at 20" Ames Lake King TSHE 16 16 18.3 7.2 32 Histosol w/ clay at 20" Ames Lake King TSHE 19 21 23.1 9.1 38 Histosol w/ clay at 20" Bellevue 3I King ALRU 26 26 25.4 10.0 sandy silt loam Bellevue 3I King ALRU 19 21 24.4 9.6 sandy silt loam Bellevue 3I King ALRU 27 27 23.4 9.2 sandy silt loam Bellevue 3I King ALRU 26 26 21.8 8.6 sandy silt loam Bellevue 3I King POBA 25 28 40.6 16.0 fine silt Bellevue 3I King POBA 30 33 63.5 25.0 fine silt Bellevue 3I King SALA 20 30.5 12.0 Histosol Big Bear Creek 10 King ALRU 16 17 23.4 9.2 68 Histosol Big Bear Creek 10 King ALRU 20 20 22.0 8.7 49 Histosol Big Bear Creek 10 King ALRU 20 20 23.4 9.2 49 Histosol Big Bear Creek 10 King ALRU 15 17 32.2 12.7 55 Histosol Big Bear Creek 10 King ALRU 15 18 25.6 10.1 44 Histosol Big Bear Creek 10 King POBA 24 26 61.8 24.4 104 Histosol Big Bear Creek 10 King POBA 19 21 45.4 17.9 74 Histosol Big Bear Creek 10 King POBA 13 15 38.1 15.0 99 Histosol

Appendix D: Data TablesTable D-1 cont.
Big Bear Creek 10 King POBA 14 15 34.3 13.5 95 Histosol Big Bear Creek 10 King SALA 15 17 33.6 13.2 52 Histosol Big Bear Creek 10 King SALA 15 16 22.5 8.9 59 Histosol Big Bear Creek 10 King SALA 16 17 27.4 10.8 59 Histosol Big Bear Creek 24 King ALRU 22 26 23.4 9.2 silty gravelly loam Big Bear Creek 24 King ALRU 45 48 35.6 14.0 silty gravelly loam Big Bear Creek 24 King ALRU 44 49 35.6 14.0 silty gravelly loam Big Bear Creek 24 King TSHE 52 55 40.6 16.0 Histosol Big Bear Creek 24 King TSHE 43 43 33.0 13.0 Histosol Big Bear Creek 24 King TSHE 41 44 48.3 19.0 Histosol Big Bear Creek 30 King POBA 46 48 66.1 26.0 131 gravelly loam Big Bear Creek 30 King POBA 37 37 52.5 20.7 128 gravelly loam Big Bear Creek 30 King POBA 24 30 22.2 8.8 68 gravelly loam Budd Inlet Thurston PICO 17 17 17.4 6.9 33 Histosol bog1
Budd Inlet Thurston PICO 14 16 16.5 6.5 31 Histosol bog1
Budd Inlet Thurston PICO 45 47 28.3 11.1 54 Histosol bog1
Budd Inlet Thurston PICO 57 58 35.8 14.1 52 Histosol bog1
Budd Inlet Thurston PICO 48 48 29.1 11.4 53 Histosol bog1
Budd Inlet Thurston PICO 43 43 27.4 10.8 54 Histosol bog1
Budd Inlet Thurston TSHE 26 30 22.0 8.7 69 Histosol bog1
Budd Inlet Thurston TSHE 31 34 27.8 11.0 57 Histosol bog1
Budd Inlet Thurston TSHE 38 44 37.7 14.8 62 Histosol bog1
Budd Inlet Thurston TSHE 45 45 29.9 11.8 50 Histosol bog1
Budd Inlet Thurston TSHE 22 23 31.8 12.5 60 Histosol bog1
East lake sammamish 61 King ALRU 23 26 30.5 12.0 silty sandy loam East lake sammamish 61 King ALRU 25 28 33.0 13.0 silty sandy loam East lake sammamish 61 King ALRU 29 29 27.9 11.0 silty sandy loam

Appendix D: Data TablesTable D-1 cont.
East lake sammamish 61 King TSHE 63 65 33.0 13.0 Alderwood nonhistosol1
East Lake Washington 1 King ALRU 35 37 33.0 13.0 Fine Silt East Lake Washington 1 King ALRU 35 35 30.5 12.0 Fine Silt East Lake Washington 1 King SALA 27 35 27.9 11.0 Sandy East Lake Washington 1 King SALA 40 40 40.6 16.0 Sandy East Lake Washington 1 King SALA 17 19 19.3 7.6 Sandy East Lake Washington 2 King ALRU 36 38 33.0 13.0 47 Histosol East Lake Washington 2 King ALRU 27 28 29.1 11.5 57 Histosol East Lake Washington 2 King SALA 22 22 24.2 9.5 37 Histosol Evans Creek King ALRU 66 66 33.3 13.1 86 Histosol Evans Creek King ALRU 61 63 49.6 19.5 Histosol Evans Creek King ALRU 61 64 37.6 14.8 77 Histosol Evans Creek King ALRU 60 61 38.0 15.0 107 Histosol Evans Creek King THPL 52 52 43.0 16.9 71 Histosol Evans Creek King THPL 56 57 43.0 16.9 99 Histosol Evans Creek King TSHE 38 38 39.9 15.7 69 Histosol Homeacres Snohomish PICO 135 139 34.8 13.7 64 silty loam Homeacres Snohomish PICO 127 140 45.2 17.8 69 silty loam Homeacres Snohomish PISI 103 105 66.5 26.2 95 silty loam Homeacres Snohomish THPL 27 31 34.5 13.6 49 Histosol Jenkins Creek King ALRU 28 28 21.8 8.6 sandy loam Jenkins Creek King ALRU 27 32 25.4 10.0 sandy loam Jenkins Creek King ALRU 41 41 30.5 12.0 sandy loam Jenkins Creek King ALRU 36 37 17.3 6.8 44 sandy loam Jenkins Creek King ALRU 49 49 37.5 14.8 72 sandy loam Jenkins Creek King ALRU 48 51 32.2 12.7 80 sandy loam Jenkins Creek King ALRU 51 53 40.1 15.8 93 sandy loam Jenkins Creek King ALRU 46 49.5 33.5 13.2 75 sandy loam

Appendix D: Data TablesTable D-1 cont.
Jenkins Creek King SALA 23 26 13.7 5.4 silty loam Jenkins Creek King SALA 30 30 27.9 11.0 silty loam Jenkins Creek King SALA 71 78 46.2 18.2 77 sandy loam Jenkins Creek King SALA 74 79 34.3 13.5 69 sandy loam Jenkins Creek King SALA 87 87 41.1 16.2 85 sandy loam Jenkins Creek King SALA 110 110 43.6 17.2 72 sandy loam Jenkins Creek King SALA 28 38 24.5 9.7 67 sandy loam Jenkins Creek King THPL 81 83 45.7 18.0 Histosol Juanita Creek King ALRU 25 25 24.8 9.8 73 sandy Juanita Creek King ALRU 22 24 23.1 9.1 62 sandy Juanita Creek King ALRU 24 26 26.6 10.5 71 sandy Juanita Creek King ALRU 33 33 28.4 11.2 77 sandy Juanita Creek King POBA 21 22 60.0 23.6 133 sandy Juanita Creek King POBA 22 27 49.4 19.5 94 sandy loam Juanita Creek King SALA 24 26 28.4 11.2 68 sandy Juanita Creek King SALA 17 18 26.3 10.3 58 sandy loam Lilliwaup Swamp A Mason THPL 75 75 24.8 9.8 48 Histosol bog - Lab. tea1
Lilliwaup Swamp A Mason THPL 129 131 43.0 16.9 75 Histosol bog - Lab. tea1
Lilliwaup Swamp A Mason THPL 94 95 30.0 11.8 75 Histosol bog - Lab. tea1
Lilliwaup Swamp A Mason TSHE 81 83 38.5 15.2 82 Histosol bog - Lab. tea1
Lilliwaup Swamp A Mason TSHE 125 125 30.2 11.9 54 Histosol bog - Lab. tea1
Lilliwaup Swamp B2 Mason PISI 66 68 38.5 15.2 77 Histosol Lilliwaup Swamp B Mason PISI 63 66 32.8 12.9 59 Histosol Lilliwaup Swamp B Mason PISI 63 65 39.5 15.6 63 Histosol Lilliwaup Swamp B Mason PISI 69 70 51.5 20.3 84 Histosol Lilliwaup Swamp B Mason PISI 56 60 49.8 19.6 58 Histosol Lilliwaup Swamp B Mason PISI 76 78 61.5 24.2 98 Histosol Lilliwaup Swamp B2 Mason PISI 61 64 80.5 31.7 102 Histosol outlier1

Appendix D: Data TablesTable D-1 cont.
Lilliwaup Swamp B2 Mason THPL 55 61 51.5 20.3 97 Histosol Lilliwaup Swamp B2 Mason TSHE 79 82 64.5 25.4 114 Histosol Lilliwaup Swamp B2 Mason TSHE 83 85 53.0 20.9 Histosol Lilliwaup Swamp C Mason ALRU 69 70 26.7 10.5 58 Histosol Lilliwaup Swamp C Mason PISI 62 64 44.0 17.3 56 Histosol Lilliwaup Swamp C Mason PISI 65 67 37.0 14.6 57 Histosol Lilliwaup Swamp C Mason PISI 71 72 40.4 15.9 71 Histosol Lilliwaup Swamp C Mason TSHE 50 53 41.4 16.3 92 Histosol Lilliwaup Swamp D Mason THPL 99 99 35.3 13.9 79 Histosol bog - Lab. tea1
Lilliwaup Swamp D Mason THPL 87 91 37.8 14.9 71 Histosol bog - Lab. tea1
Lilliwaup Swamp D Mason THPL 235 240 58.3 23.0 78 Histosol bog - Lab. tea1
Lilliwaup Swamp E Mason PISI 65 68 42.0 16.5 Histosol Lilliwaup Swamp E Mason PISI 173 175 76.0 29.9 Histosol Lilliwaup Swamp E Mason PISI 67 73 57.0 22.4 Histosol Lilliwaup Swamp E Mason PISI 63 68 56.5 22.2 Histosol Lilliwaup Swamp E Mason THPL 142 142 74.0 29.1 110 Histosol Lilliwaup Swamp E Mason THPL 87 87 51.5 20.3 Histosol Lilliwaup Swamp E Mason THPL 84 84 65.0 25.6 110 Histosol Lilliwaup Swamp E Mason TSHE 83 84 59.0 23.2 Histosol Lilliwaup Swamp E Mason TSHE 82 82 48.0 18.9 98 Histosol Lilliwaup Swamp E Mason TSHE 71 75 42.5 16.7 Histosol Lilliwaup Swamp E Mason TSHE 69 73 45.6 18.0 Histosol Lilliwaup Swamp E Mason TSHE 68 68 36.0 14.2 Histosol Lilliwaup Swamp E Mason TSHE 67 67 54.5 21.5 Histosol Lilliwaup Swamp F Mason PISI 185 190 61.0 24.0 Histosol Lilliwaup Swamp F Mason PISI 211 218 58.4 23.0 Histosol outlier1
Lilliwaup Swamp F Mason THPL 175 178 59.0 23.2 Histosol Lilliwaup Swamp F Mason THPL 161 167 69.0 27.2 Histosol

Appendix D: Data TablesTable D-1 cont.
Lilliwaup Swamp F Mason THPL 245 252 60.0 23.6 Histosol Lilliwaup Swamp F Mason THPL 177 183 82.0 32.3 Histosol Lilliwaup Swamp F Mason TSHE 161 171 51.9 20.4 Histosol Lilliwaup Swamp F Mason TSHE 170 175 38.0 15.0 Histosol dbh estimated1
Lilliwaup Swamp C Mason PISI 65 66 80.1 31.5 83 Histosol outlier; by roadbed1
Little Egypt A Mason PISI 88 89 44.0 17.3 88 Histosol Little Egypt A Mason PISI 74 75 52.0 20.5 79 Histosol Little Egypt A Mason PISI 70 71 63.0 24.8 103 Histosol Little Egypt A Mason PISI 91 91 48.0 18.9 95 Histosol Little Egypt A Mason THPL 89 90 56.5 22.2 109 Histosol top split2
Little Egypt A Mason THPL 218 218 85.0 33.5 119 Histosol top split2
Little Egypt A Mason TSHE 121 121 70.5 27.8 122 Histosol Little Egypt A Mason TSHE 91 91 62.0 24.4 111 Histosol Little Egypt A Mason TSHE 63 63 25.0 9.8 51 Histosol suppressed1
Little Egypt B Mason ALRU 115 115 37.5 Histosol Little Egypt B Mason PISI 95 96 70.0 27.6 103 Histosol Little Egypt B Mason PISI 105 107 63.5 25.0 104 Histosol Little Egypt B Mason THPL 112 112 44.0 17.3 67 Histosol top broken2
Little Egypt B Mason THPL 108 110 64.0 25.2 81 Histosol top damage2
Little Egypt B Mason THPL 110 113 66.3 26.1 88 Histosol Little Egypt B Mason THPL 190 193 56.5 22.2 69 Histosol top split2
Little Egypt B Mason THPL 115 115 48.7 19.2 85 HistosolLittle Egypt B Mason THPL 228 270 115.0 45.3 135 Histosol age estimated1
Lower Cedar River King ALRU 34 39 38.1 15.0 silty gravel Lower Cedar River King ALRU 62 66 30.5 12.0 silty gravel Lower Cedar River King ALRU 43 46 28.8 11.4 57 Histosol Lower Cedar River King ALRU 35 36 20.5 8.1 84 Histosol Lower Cedar River King THPL 42 42 21.1 8.3 Histosol

Appendix D: Data TablesTable D-1 cont.
Lower Cedar River King TSHE 17 20 19.6 7.7 48 Histosol Lower Green River King ALRU 47 49 38.6 15.2 79 sandy Lower Green River King ALRU 54 57 30.9 12.2 70 sandy Lower Green River King ALRU 53 53 27.9 11.0 70 sandy Lower Green River King ALRU 50 51 34.0 13.4 74 sandy Lower Green River King ALRU 32 32 26.9 10.6 81 sandy Lower Green River King POBA 48 51 72.5 28.5 150 sandy Lower Puget Sound King ALRU 15 15 13.7 5.4 org. silty loam Lower Puget Sound King ALRU 17 19 19.3 7.6 org. silty loam Lower Puget Sound King ALRU 22 22 16.3 6.4 org. silty loam Lower Puget Sound King ALRU 28 28 20.3 8.0 org. silty loam Lower Puget Sound King ALRU 14 17 27.9 11.0 org. silty loam May Creek King ALRU 16 17 25.1 9.9 53 fine sand loam May Creek King ALRU 49 52 38.5 15.2 64 fine sand loam May Creek King ALRU 41 50 23.6 9.3 66 fine sand loam May Creek King THPL 130 140 44.1 17.4 71 silty loam nonhistosol1
May Creek King THPL 91 91 56.4 22.2 93 silty loam nonhistosol1
McAleer Creek King ALRU 23 24 20.7 8.1 81 sandy McAleer Creek King SALA 19 22 19.3 7.6 70 sandy McAleer Creek King SALA 24 27 32.3 12.7 63 sandy McAleer Creek King SALA 19 20 20.3 8.0 70 sandy Middle Green River King ALRU 12 14 19.3 7.6 org. silty loam Middle Green River King ALRU 15 18 27.9 11.0 org. silty loam Middle Green River King ALRU 10 12 19.3 7.6 org. silty loam Middle Green River King POBA 16 17 33.0 13.0 sandy gravelly loam Middle Green River King POBA 17 18 48.3 19.0 sandy gravelly loam Middle Green River King POBA 11 14 24.4 9.6 sandy gravelly loam Middle Green River King SALA 15 15 15.5 6.1 org. silty loam

Appendix D: Data TablesTable D-1 cont.
Miller Creek King ALRU 51 51 34.2 13.5 84 Histosol Miller Creek King ALRU 55 56 40.3 15.9 86 Histosol Miller Creek King ALRU 65 68 31.5 12.4 94 Histosol Miller Creek King ALRU 60 61 34.3 13.5 103 Histosol Miller Creek King ALRU 56 57 27.8 10.9 94 Histosol Patterson Creek King ALRU 20 22 21.1 8.3 org. silty sandy loam PC12 King ALRU 21 21 27.9 11.0 org. silty sandy loam PC12 King ALRU 38 39 27.9 11.0 org. silty sandy loam PC12 King ALRU 28 31 35.6 14.0 org. silty sandy loam Posell PISI 89 93 47.5 18.7 92 min/organic Purcell Snohomish ALRU 38 38 22.0 67 organic Purcell Snohomish PICO 87 93 36.5 14.4 Histosol Purcell Snohomish THPL 43 46 22.0 8.7 Histosol Raging River King ALRU 34 38 35.6 14.0 silty sandy loam Raging River King ALRU 33 38 21.8 8.6 silty sandy loam Raging River King ALRU 49 57 27.9 11.0 silty sandy loam Raging River King ALRU 57 63 45.7 18.0 silty sandy loam Raging River King TSHE 21 25 22.6 8.9 silty sandy loam nonhistosol1
Raging River King TSHE 37 41 30.5 12.0 silty sandy loam nonhistosol1
Silver Lake King PICO 100 102 33.3 13.1 39 Histosol bog1
Silver Lake King PICO 86 91 25.8 10.1 43 Histosol bog1
Silver Lake King PICO 58 58 23.6 9.3 28 Histosol bog1
Silver Lake King PICO 60 63 28.2 11.1 61 Histosol bog1
Silver Lake King PICO 49 49 26.0 10.2 59 Histosol bog1
Silver Lake King PICO 83 83 26.8 10.5 45 Histosol bog1
Silver Lake King PISI 24 26 26.7 10.5 30 Histosol bog1
Silver Lake King PISI 44 46 37.0 14.6 54 Histosol bog1

Appendix D: Data TablesTable D-1 cont.
Silver Lake King PSME 72 72 57.8 22.8 117 Histosol bog1
Silver Lake King PSME 56 57 47.2 18.6 99 Histosol bog1
Silver Lake King TSHE 33 35 28.5 11.2 48 Histosol bog1
Silver Lake King TSHE 91 93 40.1 15.8 67 Histosol bog1
Silver Lake King TSHE 80 82 36.2 14.3 92 Histosol bog1
Silver Lake King TSHE 71 75 62.7 24.7 95 Histosol bog1
Silver Lake King TSHE 31.0 12.2 67 Histosol bog1
Silver Lake King TSHE 41 42 51.7 20.4 31 Histosol bog1
Sno Estuary-Otter Is. Snohomish PISI 91 94 49.0 19.3 79 silty Sno Estuary-Otter Is. Snohomish PISI 83 86 43.0 16.9 71 silty Sno Estuary-Otter Is. Snohomish PISI 96 99 37.8 14.9 50 silty Sno Estuary-Otter Is. Snohomish PISI 90 91 25.0 9.8 49 silty Sno Estuary-Otter Is. Snohomish PISI 150 151 48.2 19.0 77 silty Sno Estuary-Otter Is. Snohomish PISI 104 107 64.1 25.2 82 silty Sno Estuary-Otter Is. Snohomish PISI 55 55 23.0 9.1 38 silty Sno Estuary-Otter Is. Snohomish PISI 61 66 38.0 15.0 64 silty Sno Estuary-Otter Is. Snohomish PISI 79 82 45.3 17.8 64 silty Sno Estuary-Otter Is. Snohomish PISI 74 77 41.4 16.3 79 silty Sno Estuary-Otter Is. Snohomish PISI 67 72 55.0 21.7 81 silty Sno Estuary-Otter Is. Snohomish PISI 80 84 58.6 23.1 72 silty Sno Estuary-Otter Is. Snohomish PISI 72 77 33.1 13.0 31 silty Sno Estuary-Otter Is. Snohomish PISI 71 76 27.9 11.0 38 silty Sno Estuary-Otter Is. Snohomish PISI 90 91 30.8 12.1 63 silty Sno Estuary-Otter Is. Snohomish PISI 72 73 29.9 11.8 47 silty Sno Estuary-Otter Is. Snohomish PISI 74 76 49.0 19.3 73 silty Sno Estuary-Otter Is. Snohomish PISI 66 70 36.0 14.2 82 silty Sno Estuary-Otter Is. Snohomish PISI 438 445 56.7 22.3 78 silty outlier1
Sno Estuary-Rhodes Snohomish PISI 42 44 41.1 16.2 79 mineral

Appendix D: Data TablesTable D-1 cont.
Sno Est.-Spencer Is. South Snohomish PISI 94 97 40.0 15.7 79 silty Sno Est.-Spencer Is. South Snohomish PISI 91 95 48.0 18.9 87 silty Sno Est.-Spencer Is. South Snohomish PISI 65 68 24.0 9.4 52 silty Sno Est.-Spencer Is. South Snohomish PISI 104 106 57.3 22.6 53 silty Sno Est.-Spencer Is. South Snohomish PISI 71 73 76.0 29.9 72 silty outlier1
Snohomish Co Wet Snohomish PISI 80 85 37.0 14.6 55 Histosol Snohomish Co Wet Snohomish PISI 121 123 51.5 20.3 111 Histosol Snohomish Co Wet Snohomish THPL 112 112 37.9 14.9 51 Histosol Snohomish Co Wet Snohomish THPL 70 70 39.7 15.6 58 Histosol Snohomish Estuary Rhodes Snohomish PSME 36 39 25.2 mineral Snoqualmie River 25 King ALRU 25 26 29.2 11.5 52 fine sandy loam Snoqualmie River 25 King ALRU 37 37 43.5 17.1 80 fine sandy loam Snoqualmie River 25 King ALRU 29 33 42.9 16.9 81 fine sandy loam Snoqualmie River 25 King ALRU 33 34 24.6 9.7 53 fine sandy loam Snoqualmie River 25 King ALRU 30 31 41.9 16.5 73 fine sandy loam Snoqualmie River 25 King POBA 31 31 25.5 10.0 98 fine sandy loam Snoqualmie River 25 King POBA 26 27 33.3 13.1 99 fine sandy loam Snoqualmie River 25 King POBA 35 35 43.5 17.1 118 fine sandy loam Snoqualmie River 25 King SALA 28 29 32.9 13.0 59 loam Snoqualmie River 25 King SALA 36 37 42.7 16.8 68 loam Snoqualmie River 25 King SALA 38 38 41.4 16.3 65 loam Snoqualmie River 25 King SALA 33 34 30.1 11.9 55 loam Snoqualmie River 34 King ALRU 26 27 31.3 12.3 99 sandy loam Snoqualmie River 34 King ALRU 30 31 31.1 12.2 84 sandy loam Snoqualmie River 34 King ALRU 29 31 31.6 12.5 84 sandy loam Snoqualmie River 34 King ALRU 32 33 26.0 10.2 70 sandy loam Snoqualmie River 34 King ALRU 28 28 17.1 6.7 47 sandy loam Snoqualmie River 34 King ALRU 32 33 39.5 15.6 77 sandy loam

Appendix D: Data TablesTable D-1 cont.
Snoqualmie River 34 King SALA 30 31 23.5 9.2 71 sandy loam Snoqualmie River 34 King SALA 26 26 19.4 7.6 73 sandy loam Snoqualmie River 34 King SALA 30 32 29.8 11.8 74 sandy loam Snoqualmie River 34 King SALA 34 35 29.8 11.7 90 sandy loam Snoqualmie River 34 King SALA 23 24 20.5 8.1 86 sandy loam Snoqualmie River 34 King SALA 25 26 25.3 10.0 70 sandy loam Soos Creek King ALRU 10 13 25.4 10.0 organic silty loam Soos Creek King ALRU 19 22 27.9 11.0 organic silty loam Soos Creek King SALA 16 35.6 14.0 organic silty loam Spanaway Park ALRU 34 35 40.3 106 organic Spanaway Park ALRU 28 31 17.6 78 organic Spanaway Park FRLA 34 35 14.6 organic State Reform Farm Snohomish SALA 26 29 40.9 16.1 77 clay loam State Reform Farm Snohomish SALA 23 24 21.0 8.3 50 clay loam Swamp Creek Snohomish ALRU 32 37 35.5 14.0 65 Histosol Swamp Creek Snohomish ALRU 44 46 31.4 12.4 72 Histosol Swamp Creek Snohomish ALRU 84 84 49.2 19.4 85 Histosol Swamp Creek Snohomish ALRU 26 29 36.1 14.2 73 loam Swamp Creek Snohomish ALRU 37 37 28.3 11.2 71 loam Swamp Creek Snohomish PISI 97 98 45.6 18.0 82 Histosol Swamp Creek Snohomish PISI 109 109 40.1 15.8 111 Histosol Swamp Creek Snohomish PISI 94 105 63.2 24.9 103 Histosol Swamp Creek Snohomish PISI 101 101 56.6 22.3 89 Histosol Swamp Creek King POBA 27 27 59.9 23.6 135 sandy loam Swamp Creek King POBA 25 27 63.4 25.0 129 sandy loam Swamp Creek King POBA 28 36 87.7 34.5 127 sandy loam Swamp Creek King POBA 24 33 94.5 37.2 124 sandy loam Swamp Creek King POBA 36 36 65.4 25.7 146 sandy loam

Appendix D: Data TablesTable D-1 cont.
West Hylebos A King PISI 90 91 61.0 24.0 90 Histosol West Hylebos A King PISI 82 83 40.5 15.9 89 Histosol West Hylebos A King TSHE 101 103 44.5 17.5 123 Histosol West Hylebos A King TSHE 67 69 61.5 24.2 106 Histosol West Hylebos A King TSHE 92 93 46.0 18.1 111 Histosol West Hylebos A King TSHE 122 122 53.5 21.1 125 Histosol West Hylebos A King TSHE 110 110 29.5 11.6 95 Histosol intermediate1
West Hylebos A2 King PISI 112 113 83.5 32.9 87 Histosol West Hylebos A2 King THPL 40 40 19.0 7.5 38 Histosol West Hylebos A2 King TSHE 49 50 37.0 14.6 88 Histosol West Hylebos A2 King TSHE 46 47 38.5 15.2 87 Histosol West Hylebos A2 King TSHE 55 58 50.5 19.9 87 Histosol West Hylebos A2 King TSHE 58 58 36.0 14.2 91 Histosol West Hylebos A2 King TSHE 57 57 26.5 10.4 89 Histosol West Hylebos A2 King TSHE 55 55 47.5 18.7 101 Histosol West Hylebos A2 King TSHE 60 60 59.0 23.2 90 Histosol West Hylebos A2 King TSHE 61 65 70.5 27.8 116 Histosol West Hylebos A3 King ALRU 92 92 53.5 21.1 81 Histosol West Hylebos A3 King ALRU 86 89 36.0 14.2 92 Histosol West Hylebos A3 King PISI 118 120 64.5 25.4 103 Histosol West Hylebos A3 King THPL 103 106 59.5 23.4 92 Histosol West Hylebos B King PISI 77 78 49.0 19.3 74 Histosol West Hylebos B King PISI 116 117 77.5 30.5 104 Histosol West Hylebos B King TSHE 70 70 67.5 26.6 101 Histosol top dead2
West Hylebos C King ALRU 89 89 41.0 16.1 88 Histosol West Hylebos C King ALRU 87 88 35.0 13.8 96 Histosol West Hylebos C King ALRU 85 85 34.5 13.6 95 Histosol West Hylebos C King THPL 82 82 50.0 19.7 92 Histosol

Appendix D: Data TablesTable D-1 cont.
West Hylebos C King THPL 79 79 58.5 23.0 92 Histosol West Hylebos C King THPL 94 99 72.5 28.5 104 Histosol West Hylebos C3 King THPL 77 80 72.0 28.3 91 Histosol West Hylebos D King PISI 164 166 89.0 35.0 107 Histosol split top2
West Hylebos D King PISI 133 133 65.5 25.8 118 Histosol West Hylebos D King THPL 149 151 55.5 21.9 71 Histosol split top2
West Hylebos D King THPL 123 131 50.0 19.7 89 Histosol West Hylebos D King THPL 98 105 64.0 25.2 117 Histosol West Hylebos D King THPL 88 90 35.0 13.8 60 Histosol West Hylebos D King TSHE 101 102 64.5 25.4 106 Histosol West Hylebos D2 King ALRU 81 82 39.0 Histosol top broken2
West Hylebos D2 King THPL 139 140 66.8 26.3 128 Histosol West Hylebos D2 King THPL 195 197 81.5 32.1 122 Histosol West Hylebos D2 King TSHE 115 118 42.5 16.7 125 Histosol West Hylebos D2 King TSHE 77 81 70.5 27.8 128 Histosol West Hylebos D2 King TSHE 108 111 64.5 25.4 129 Histosol West Hylebos E King ALRU 84 85 56.0 22.0 75 Histosol West Hylebos E King PSME 87 87 82.5 32.5 Histosol West Hylebos E King PSME 98 98 78.0 30.7 Histosol West Hylebos E King PSME 67 68 43.5 17.1 Histosol West Hylebos F King PISI 174 176 63.0 24.8 104 Histosol West Hylebos F King THPL 121 123 65.0 25.6 82 Histosol West Hylebos F King THPL 122 123 55.5 21.9 81 Histosol West Hylebos F King THPL 123 125 67.0 26.4 110 Histosol West Hylebos F King THPL 68 71 26.5 10.4 59 Histosol West Hylebos F King THPL 94 99 75.0 29.5 100 Histosol West Hylebos F King TSHE 103 104 34.0 13.4 86 Histosol West Hylebos F King TSHE 80 83 32.5 12.8 Histosol suppressed1

Appendix D: Data TablesTable D-1 cont.
White River King FRLA 60 61 45.2 17.8 67 loam White River King FRLA 73 76 53.0 20.9 74 loam White River King FRLA 60 62 23.1 9.1 76 loam White River King FRLA 58 63 35.9 14.2 65 loam White River King FRLA 71 72 32.0 12.6 69 loam Willapa Bay Pacific ALRU 18 20 15.9 6.3 42 Histosol out of area1
Willapa Bay Pacific ALRU 15 16 19.0 7.5 53 Histosol out of area1
Willapa Bay Pacific PISI 37 39 25.9 10.2 50 clay loam out of area1
Willapa Bay Pacific PISI 45 50 57.2 22.5 58 clay loam out of area1
Willapa Bay Pacific PISI 36 37 23.7 9.4 34 clay loam out of area1
Willapa Bay Pacific PISI 37 39 17.1 6.7 44 clay loam out of area1
Willapa Bay Pacific PISI 63 66 47.0 18.5 77 clay loam out of area1
Willapa Bay Pacific TSHE 31 34 33.8 13.3 68 Histosol out of area1
Willapa Bay Pacific TSHE 43 43 28.5 11.2 62 clay loam out of area1
Willapa Bay Pacific TSHE 43 43 24.8 9.8 68 clay loam out of area1
Willapa Bay Pacific TSHE 44 44 17.1 6.7 44 clay loam out of area1
Wetland Site Name County SpeciesRingsActual
ABHFinal
DBHcm
DBHinch
Heightfeet Soil Type Comment
1Rows in italics were not included in dbh growth rate analysis2Trees with damaged or split tops were not included in site index calculations

85
Appendix E: Wetland Indicator Categories
Table E-1. Interpreting Wetland Indicator Categories
WetlandIndicatorCode
WetlandIndicatorCategory
Estimated Probability of OccurrenceUnder Natural Conditions
OBL Obligate wetland Occurs almost always (estimatedprobability 99%) in wetlands
FACW Facultative wetland Usually occurs in wetlands (estimatedprobability 67%-99%), but occasionallyfound in non-wetlands
FAC Facultative Equally likely to occur in wetlands or non-wetlands (estimated probability 34%-66%)
FACU Facultative upland Usually occurs in non-wetlands (estimatedprobability 67%-99%), but occasionallyfound on wetlands (estimated probability1%-33%)
UPL Upland Occurs almost always (estimatedprobability 99%) non-wetlands
A positive (+) or negative (-) sign may be used with the Facultative Indicatorcategories to more specifically define the frequency of occurrence in wetlands. Apositive sign indicates a frequency toward the higher end of the category (morefrequently found in wetlands), and a negative sign indicates a frequency toward thelower end of the category (less frequently found in wetlands).
Source: NRCS (National Resource Conservation Service). (undated). InterpretingWetland Indicator Status. USDA website, accessed February 24, 2007.http://plants.usda.gov/wetinfo.html#categories