growth at a glance - united nations sustainable development
TRANSCRIPT

ECONOMIC AND SOCIAL COMMISSION FOR ASIA AND THE PACIFICUnited Nations
E S C A P
Growthreen
at a GlanceThe Way Forward for Asia and the Pacific

United Nations publicationCopyright© United Nations 2006ST/ESCAP/2407
UNESCAP Green Growth Concept Developer
Rae Kwon Chung, Director, Environment and Sustainable Development Division, ESCAP
Publication Development Team:Publication Developer: Aneta NikolovaEditor: Marisha Wojciechowska-Shibuya Reviewer: Prof. Paul Ekins, PSI, author of the Green Growth Copy-editor: Orestes PlacenciaPhotographer: Ruedee ArunkhajonhsakPrinter: Clung Wicha Press Co., Ltd.
N.B. No document emanating from the secretariat should disclaim the views expressed officially in the resolutions of the main organs of the United Nations and in other legislative texts of the Organization such as the Charter of the United Nations and various declarations and conventions.
The few examples provided in this publication serve to illustrate and inspire and are by no means an exhaustive representation of initiatives present in the region.
Commercial Disclaimer Mention of firm names and commercial products does not imply the endorsement of the United Nations.
Designation of Countries and Areas Standard Disclaimer The designations employed and the presentation of the material in this publication do not imply the expression of any opinion whatsoever on the part of the Secretariat of the United Nations concerning the legal status of any country, territory, city or area or of its authorities, or concerning the delimitation of its frontiers or boundaries.
This paper is produced from 100% eucalyptus plantations without consuming the materials from natural forests and using the elemental chlorine-free blenching process.
ESCAP is the regional development arm of the United Nations and serves as the main economic and social development centre for the United Nations in Asia and the Pacific. Its mandate is to foster cooperation between its 53 members and 9 associate members. ESCAP provides the strategic link between global and country-level programmes and issues. It supports the Governments of the region in consolidating regional positions and advocates regional approaches to meeting the region’s unique socio-economic challenges in a globalizing world. The ESCAP office is located in Bangkok, Thailand. Please visit our website at www.unescap.org for further information.
The green shaded area of the map represents the members and associate members of ESCAP

Contents
Green Growth at a Glance: The Way Forward for Asia and the Pacific 1
Part I: Why Green Growth in Asia and the Pacific? 2
A. Dynamic Region 3
B. Sustainable Development and Green Growth 6
Part II: What is Green Growth? 10
A. From Yesterday to Today 12
B. Why Eco-Efficiency? 14
C. Tomorrow and Our Future 19
Part III: How Do We Foster Green Growth? 26
A. Different Kinds of Growth 27
B. Green Growth Policies 27
C. Policy Strategies and Economic Instruments 30
D. Some Powerful Partners 37
F. Pro-poor Growth 39
G. Green Business Growth Tools 41
Part IV: Closing Thoughts 46
A. The Globalization Factor 47
Annex 49
Table 1: The Environmental Performance Index for Asia and the Pacific 15Table 2: How to Achieve Environmentally Sustainable Economic Growth? 20
List of Tables

Figure 1: Industrial Production Index (General) 1989-1990=100 3Figure 2: Agricultural Production Index (1989-1990=100) 4Figure 3: Energy Consumption 4Figure 4: Commercial Vehicles 5Figure 5: Passenger Cars 5Figure 6: Three Pillars of Sustainable Development 7Figure 7: An Integrated Approach for Sustainable Development 8Figure 8: Potential Eco-Efficiency Indicators 29Figure 9: An Illustration of Green Buildings 42Figure 10: Study of Rooftop Gardens in Singapore and Study of Urban Island Heat Effect 42Figure 11: ISO 14001 Certifications 43Figure 12: ISO 14001 System 43Figure 13: Dow Jones Sustainability Index assets and licences 45
Box 1: The Green Growth Mandate for Asia and the Pacific 9Box 2: Political Commitment to Green Growth 12Box 3: What is Eco-Efficiency? 16Box 4: Some Myths 17Box 5: How to Achieve Eco-effectiveness? 19Box 6: The Hypercar 23Box 7: Eco-Labels in Asia 30Box 8: Green Tax and Budget Reform 31Box 9: Taxes for Conservation 32Box 10: Examples of Green Purchasing in Selected Companies 33Box 11: Public Information Disclosure 35Box 12: Extended Producer Responsibility Laws 36Box 13: Some Civil Society Initiatives 37Box 14: Global Pro-Poor Trends 39Box 15: Examples of Pro-Poor Opportunities 39Box 16: Awards for Sustainability and Environmental Reports 44
List of Boxes
List of Figures
�
Green Growth at a Glance The Way Forward for Asia and the Pacific
In the Asian and Pacific region, facing ever-increasing demands for food, water, shelter, sanitation, energy, health services and economic and human security, how will we cope with all these added pressures? How will we meet the difficult global challenges before us, while simultaneously improving people’s lives and conserving our natural resources?
The Governments in the Asian and Pacific region have unanimously agreed to respond to these challenges through the promising path of environmentally sustainable economic growth, or “Green Growth”.
What is Green Growth?
What tools does it o�er government, private sector, multi-stakeholders, communities and individuals to do things di�erently?
What does the Green Growth paradigm shift actually mean?
What opportunities and incentives does it provide?

Part I:
Why Green Growth in Asia and the Pacific?
© Ruedee Arunkhajohnsak

�
A. Dynamic RegionThe Asian and Pacific region covers 40 per cent of the Earth’s land area, and is home to 61 per cent of the world’s population. Dramatic economic growth has enabled a reduction in poverty and social progress in many parts of the region. However, the rapid increases in industrial and agricultural production, as well as rising levels of consumption are exerting increasing pressure on the environmental carrying capacity of the region.
The Asian and Pacific region is becoming the hub of global production. Its soaring economic growth is causing considerable impacts on the environmental carrying capacity, the sources of which can be traced to the following:
Growth in industrial production (Figure 1), especially manufacture for export. In developing countries of the region, industrial production increased by about 38 per cent (compared with a global increase of 23 per cent) from 1995 to 2002.
Figure �: Industrial Production Index (General) �989-�990=�00
60
70
80
90
100
110
120
130
140
World ESCAP countries Developing ESCAP countries
1992 1993 1994 1995 1996 1997 1998 1999 2000 2001 2002
Sources: UNESCAP, State of the Environment, 2006
•

�
Agricultural expansion and intensification (Figure 2). Agricultural production increased by 62 per cent from 1990 to 2002 (compared with a 27 per cent global increase)1 largely through agro-chemical use intensity that exceeds global averages. Over 60 per cent of water used is for agriculture in at least 30 countries in the region.
Figure 2: Agricultural Production Index (�989-�990=�00)
90
100
110
120
130
140
150
160
170
World ESCAP countries Developing ESCAP countries
1992 1993 1994 1995 1996 1997 1998 1999 2000 2001 2002
Sources: UNESCAP, State of the Environment, 2006
Rising demand for water, energy and raw materials (e.g., timber and minerals (figure 3). Production of electricity, gas and water increased by 50 per cent from 1995 to 2002 (compared with an 18 per cent global increase). Water extraction from various sources is projected to increase by 25 per cent from 1990 to 2010 and energy use by about 40 per cent from 1990 to 2002 (twice the global increase). Mining production increased by about 16 per cent in the ESCAP region (compared with a 7 per cent global increase).
Figure �: Energy Consumption
0
1800
3600
5400
7200
9000
World ESCAP countries Developing ESCAP countries
1992 1993 1994 1995 1996 1997 1998 1999 2000
Sources: UNESCAP, State of the Environment, 2006
•
•
�
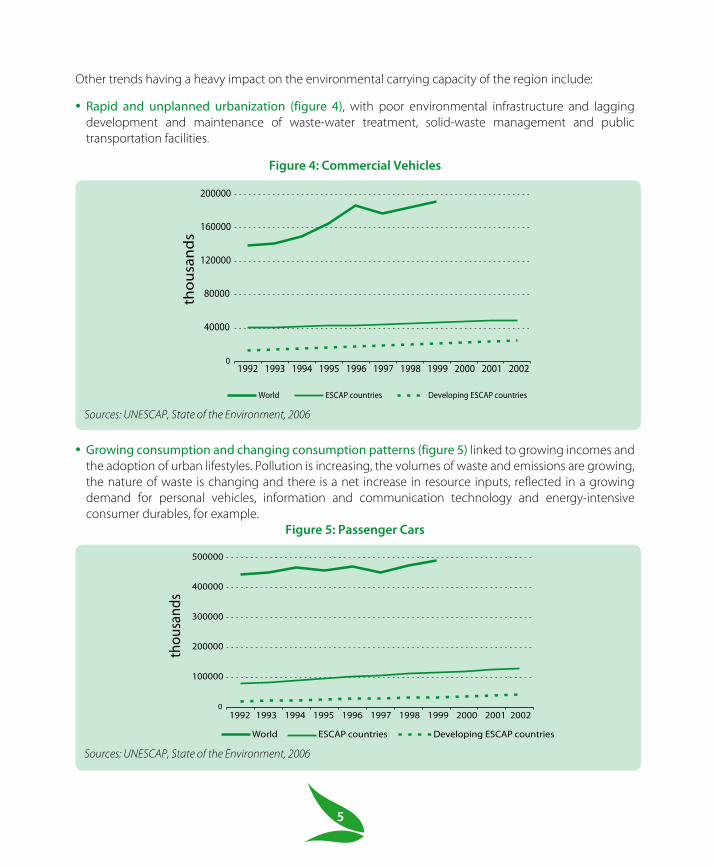
Other trends having a heavy impact on the environmental carrying capacity of the region include:
Rapid and unplanned urbanization (figure 4), with poor environmental infrastructure and lagging development and maintenance of waste-water treatment, solid-waste management and public transportation facilities.
Figure �: Commercial Vehicles
0
40000
80000
120000
160000
200000th
ousa
nds
World ESCAP countries Developing ESCAP countries
1992 1993 1994 1995 1996 1997 1998 1999 2000 2001 2002
Sources: UNESCAP, State of the Environment, 2006
Growing consumption and changing consumption patterns (figure 5) linked to growing incomes and the adoption of urban lifestyles. Pollution is increasing, the volumes of waste and emissions are growing, the nature of waste is changing and there is a net increase in resource inputs, reflected in a growing demand for personal vehicles, information and communication technology and energy-intensive consumer durables, for example.
Figure �: Passenger Cars
0
100000
200000
300000
400000
500000
thou
sand
s
World ESCAP countries Developing ESCAP countries
1992 1993 1994 1995 1996 1997 1998 1999 2000 2001 2002
Sources: UNESCAP, State of the Environment, 2006
•
•

�
This rapid growth in production and population is taking place in a region which has some of the highest proportions of degraded land in the world, high proportions of dryland and the lowest per capita availability of arable land and water. The carrying capacity of the region is therefore quite limited in comparison with other regions.
Signs of stress are apparent. Per capita water availability is reaching “scarcity limits” in many areas which are subject to seasonal shortages. More than 462 million persons were affected by drought (including deaths and homelessness) in South Asia alone during the period 2000-2004. Surface and groundwater resources have been degraded because of over-extraction and pollution, particularly by nitrates and heavy metals. Only about 30 per cent of the total land area of the region is forested and over 28 per cent of the region’s land area is degraded to some degree, with significant degradation in dryland areas used for agriculture. The region has also contributed significantly to the rapid global decline in biodiversity, with several countries having particularly large numbers of species which are threatened and endangered, as compared with other parts of the world. Then there have been dramatic declines in fishery resources and continued degradation of coastal ecosystems. The mangrove forests lost from 1990 to 2000 represent approximately 60 per cent of the global loss, with South-East Asia accounting for the majority of this. Approximately 60 per cent of the region’s coral reefs are at risk. Suspended particulates are of concern in a growing number of cities and in over 50 per cent of reporting cities, average annual concentrations of NO2 have exceeded World Health Organization standard limits.
Despite these signs of stress, the need for further economic growth remains large. In the ESCAP region, about 670 million people were still living on less than $1 a day (PPP adjusted) in 2004, representing about 63 per cent of the global total. China and India account for approximately 80 per cent of the region’s poor. In 2001, more than 1 in every 10 persons in the region was still undernourished. The per capita energy supply of the region is less than 60 per cent of that of the global figure, posing a significant barrier to social development.
Given the region’s limited ecological carrying capacity and the enormous need for further economic growth to reduce poverty and meet the basic needs of its vast and expanding population, the region has to find ways and means to reduce the environmental impact of its economic growth. As such, the Governments of countries in the region have agreed that Green Growth is the foremost strategy to ensure environmental and economic sustainability of the countries in the Asian and Pacific region.
B. Sustainable Development and Green GrowthThe concept of sustainable development first received global attention as a result of the work of the World Commission on Environment and Development and its report, also known as the Brundtland Report on “Our Common Future” published in 1987. It was enriched at the United Nations Conference on Environment and Development held in Rio de Janeiro in 1992, and reaffirmed at the World Summit on Sustainable Development held in Johannesburg in 2002. That Summit urged the global community to complete the formulation and elaboration of national strategies for sustainable development and begin their implementation by 2005, as mapped out in the Johannesburg Plan of Implementation. Sustainable development is now widely accepted as resting on the three pillars of the sustainability of economic growth, social development and environmental protection.

�
It is now over 10 years since the international community embraced the term “sustainable development”. Several international conferences later, it must be asked whether this term has given greater clarity and direction to the urgent and essential task of protecting the health of the planet for the benefit of all life.
There is now a choice to make – the term “sustainable development” can be used as a roadblock – a rhetorical masterpiece and catch-all balancing act used to trade off seemingly competing interests.
Alternatively, “sustainable development” can be given teeth. It can be understood for the concept it truly represents, a nuanced and powerful term that captures our interreliance on each other and the living systems on which we depend.
Understanding sustainable development in this way enables the development of a holistic, but increasingly concrete vision of how to integrate the three pillars of sustainable development – economic development, social development and environmental sustainability–into coherent decision-making, planning and implementation processes at all levels of governance (figure 6).
Figure �: Three Pillars of Sustainable Development
The Biosphere
The Biosphere
Human Society
Human Society
The Economy
Source: Forum for the Future

8
In developing integrative decision-making, planning and implementation–so fundamental to sustainable development–no process can be as important as harnessing for sustainable development the economic systems that to a significant degree underpin the structure and functioning of all countries and their relationship to each other.
As the situation of Asia and the Pacific illustrates, it is now an urgent challenge to find ways to ensure that the old paradigm “grow first, clean up later” is replaced by an integrated approach that enables economic growth to support and reinforce sustainability rather than undermine it (figure 7).
It was out of the necessity, and the opportunity, to make fundamental, concrete and measurable changes that the theme of environmentally sustainable economic growth was born and has hence become the focus for development in the region (box 1)2.
Figure �: An Integrated Approach for Sustainable Development
Economy
ManufacturedCapital
FinancialCapital
Social Capital
Natural Capital
Human Capital
Natural Capital
Society
Ultimate EndsHappiness, harmony, identity, ful�lment, self-respect, wellbeing, transcendence, enlightenment
Theology and Ethics
Political Science
Science and Technology
Intermediate EndsHealth, leisure, mobility, knowledge, community, consumer goods, security, employment
Intermediate MeansFinance, tools, factories, processed raw materials, IT
Ultimate MeansSolar energy, biosphere services, raw materials, biophysical cycles, soil fertility etc.
Source: Forum for the Furture

9
Ultimately, the Asian and Pacific countries face some questions will they mimic the Western world’s historical transition, massively investing in industrialization while ignoring the environmental externalities in pursuit of quick economic growth? Will they leapfrog over certain industrialized countries’ errors, which have resulted in heavy pollution and an unsustainable legacy, and sponsor internalization incentives supported by keen legislative frameworks and innovative entrepreneurship so as to ensure ongoing and expanding development, without the oft-related detrimental environmental impacts? Averting environmental damage at the onset does require committed policy actions in order to ensure that business as usual is diverted and that society as a whole lifts itself towards optimum natural resource use, sustainable production and consumption patterns and relies on values that divert away from the “free rider” temptation towards a sense of collective responsibility.
The key argument to be made here is that the rapid economic growth which several countries in the region are currently enjoying--and which serves as a key driver for poverty reduction--is in essence a reflection of these countries’ deliberate public policy initiatives. Arguably this success can be attributed to national public policies which have sought to position their countries favorably in the global economy, by increasing their manufacturing exports and net inflows of foreign direct investments. This economic openness and its concurrent rapid industrialization have had noticeable impacts on the national environmental assets. Green Growth is therefore a strategy to foster creative sustainability responses for the region. Just as rapid economic growth is not a chance occurrence, so is environmental sustainability achievable only through deliberate integrated policies. Green Growth proposes to harness the power of economic growth while guiding it in a way that will enhance the immense possibilities provided by innovative technologies and industries, so that progress can be registered in more than gross domestic product increases alone.
Box �: The Green Growth Mandate for Asia and the Pacific
In March 2005, at the Fifth Ministerial Conference on Environment and Development in Asia and the Pacific, 2005,3 held at Seoul, Republic of Korea, approximately 340 delegates, including representatives from 52 members and associate members of ESCAP embraced the approach of environmentally sustainable economic growth (Green Growth).
The Conference endorsed Green Growth as a policy focus and a powerful strategy to promote “win-win” approaches to reconciling the conflict between current pathways for the achievement of two important Millennium Development Goals: MDG 1 (on poverty reduction) and MDG 7 (on environmental sustainability). In this sense, the conference were milestones of strategy for regional cooperation for sustainable development for the period 2005-2010, which were reflected in three major documents adopted at the meeting: the Ministerial Declaration on Environment and Development in Asia and the Pacific, 2005, Regional Implementation Plan for Sustainable Development in Asia and the Pacific 2006-2010 and the Seoul Initiative on Environmentally Sustainable Economic Growth (Green Growth).
The members and associate member of ESCAP recently confirmed their commitment to Green Growth during the Commission at its sixty-first session (April 2005) and have requested that the ESCAP secretariat continue acting as the catalyst for a conducive environment for Green Growth through developing the conceptual and analytical framework and by providing capacity-building support to the Governments.

�0
Part II: What is Green Growth?
© Ruedee Arunkhajohnsak

��
Its Evolution
Cradle-to-cradle resource use within environmental limits, bene�ting all, while following nature’s model: recreate, rebirth, renew
Production without pollution and environmental degradation
Monitor production processes and control emissions/e�uents
Produce more with fewer resources
…Yesterday - pollution control:
…Today - eco-e�ciency:
…Tomorrow - eco-e�ectiveness:
….Our future - sustainable economy:

�2
A. From Yesterday to TodayThe efforts of Governments to mitigate environmental degradation have been based largely on conventional environmental management approaches focused on controlling and regulating pollution discharges or on habitat conservation efforts. The efforts of Governments to improve their environmental performance have resulted in some success (box 2). Air quality has been improved in some cities, with respect to some pollutants. The rate of deforestation has also slowed down in some countries and institutional and legislative frameworks for environmental protection have been established or strengthened.
Box 2: Political Commitment to Green Growth
This document presents several cases throughout Asia lending credence to the fact that governments at all levels, businesses and civil society actors are endorsing the search for Green Growth alternatives.
* Countries such as China are developing visionary Green Growth policies, including a new focus on developing a resource-efficient economy and discussions on building a conservation-minded society. There is also growing interest in Green GDP measures.
* The Republic of Korea launched its Volume-based Waste Fee System in 1995 to reduce waste generation at the source while encouraging recycling activities nationwide. The policy mandates the purchase and use of special garbage bags for household wastes and portions of industrial waste, based on the principle of “pay for what you discharge.” On the other hand, recyclable items such as paper, scrap iron, glass and plastic are collected free of charge by local governments on a specific date and place. End-of-life furniture and electric appliances are collected with a charge levied for a sticker that is placed on the discarded pieces.
These economic incentives have resulted in a significant decrease in per capita waste generation, a 22 per cent reduction between 1994 and 2002, from 1.33 to 1.04 kg/day of waste. Moreover, the volume of waste sent to landfills has fallen by 43 per cent in the same period (49,191 to 27,953 tonnes/yr), whereas the volume of recyclable items rose by 146 per cent (8,927 to 21,949 tonnes/yr). Source: Asia-Pacific Forum for Environment and Development, 2005
* Focusing efforts on the upper waste stream, Cebu City in the Philippines has effected waste-minimization activities such as recycling, composting, proper management of medical waste and a good landfill system.
With the help of, among others, its sister city Haarlemmermeer of the Netherlands, Cebu has (a) undertaken institutional capacity-building, (b) increased public information on the matter of municipal solid waste management, (c) improved the working and health conditions of waste pickers and (d) achieved better management of medical waste. Furthermore, the compost/organic fertilizer facility at the city nursery has enabled the city to practise waste segregation and organic farming. Source: APFED, 2005

��
Continued from Box 2
* The Government of Japan, including the Ministry of Economy, Trade and Industry and the Ministry of Environment, is promoting the “3Rs” in order to create a sustainable society : one that has balance between the environment and the economy:
Reduce: Reducing the amount of waste by increasing the efficiency of resource use and extending the useful life of products.
Reuse: Using the “recyclable resources” from used items again, as products or parts, after giving them proper treatment. (“Recyclable resources” are the useful parts or components of waste, used products and by-products.)
Recycle: Using “recyclable resources” as raw materials to make new products.Source: www.meti.go.jp/policy/recycle/main/english/index.html
* Since its establishment in 1992, the Russian – Norwegian Cleaner Production Programme, jointly funded by the Government of the Russian Federation and Norway, has targeted more than 1,700 engineers and specialists from 500 industrial and agricultural production entities, who have been trained to develop and implement projects focused on resource-saving for green development. Projects developed range from waste management to alternative energy resources. The annual economic benefits of the initiation projects alone amount to 5-7 times the value of the donors’ investment.Source: Cleaner Production and Sustainable Development Centre; www.ruscp.ru/maineng.htm
The Green Growth approach is a new policy focus which is aimed at helping Asia-Pacific countries to achieve real progress towards sustainable development and poverty reduction.
The Green Growth approach seeks to harmonize the two imperatives of economic growth and environmental sustainability by promoting “fundamental changes in the way societies produce and consume”, as called for in the Johannesburg Plan of Implementation4. The Green Growth approach requires the introduction of concept and system changes.
The main concept changes to be achieved are as follows:
Environmental protection must no Longer be viewed as a constraint to economic growth, but as a driver of growth and essential for long-term economic sustainability
Production and consumption must no longer be viewed as “linear” processes, but must be thought of and consciously designed using holistic/life cycle/circular concepts.
System changes are also critical to de-link economic growth and environmental degradation; these must:
Improve eco-efficiency of production – not just pollution control; eco-efficient economic planning, application of economic and regulatory instruments, e.g., green tax and budget reform (GTBR), improved environmental governance (needed for improved decision-making), stimulation of markets for environmentally friendly goods and services, reducing material and resource use per unit of output, and application of industrial ecology concepts, all are ways of doing this
•
•
•

��
Improve eco-efficiency of consumption – through demand-side management, application of economic and regulatory instruments (e.g., green levies and charges, and GTBR), education for sustainable development, promoting environmentally friendly goods and services, promotion of the 3Rs (recycle, reduce, reuse - Japan) and the resource-saving society (China)
Promote more effective decision-making - reflecting the value of environmental goods and services, appropriate measures of growth (Green GDP and green accounting, and GTBR) and investment in natural capital
The driving force of the economy and economic decision-making is the market and monetary flows. Decisions which lead to loss of natural capital are often the result of market failure; markets do not reflect or otherwise take into account the true value of environmental goods and services, as well as the externalities related to production and consumption activity. A critical aspect of green growth is therefore a focus on demand-side management and promoting environmentally sustainable decisions through the market, economic and fiscal systems. Eco-tax reform and the deployment of other economic instruments remain proven means of influencing decision-making for greater environmental sustainability at the individual, firm, community and government administration levels.
It is undeniable that economic growth is a key factor in poverty reduction. The encouraging news is that it is now also theoretically asserted that increasing incomes and increasing real consumer expenditures could be associated with significantly reduced environmental impacts if consumer preferences were to shift towards goods and services which do not entail environmental destruction in their production and consumption5. Consequently, one of the key overarching objectives of the Green Growth concept such as it is being advanced here, is to ensure that the benefits of economic growth will be enhanced through sound and coherent policies for overall improvement in the quality of life of the peoples of Asia and the Pacific.
B. Why Eco-Efficiency?On average, more than 90 per cent of the resources harvested from nature are wasted in the process of producing food, machines, vehicles and infrastructure.6 Hence, if we are to reduce the environmental impacts of our consumption patterns, numerous analysts have endorsed the concept of a Factor 10 efficiency in the use of resources, whereby current economies must find ways of producing equivalent outputs with about 10 per cent of the current consumption rates of resources. Otherwise scarcity of resources — a likely scenario at the current rates of extraction — would eventually lead to increases in costs of production resulting from higher commodity prices.
In recent years, some experts have supported and promoted the “Kuznets environmental curve hypothesis”, which suggests that “as the development process picks up, when a certain level of income per capita is reached, economic growth appears to be a powerful way for improving environmental quality.” Empirical evidence suggests that pollution control might improve as economies grow; however, there is no empirical evidence that eco-efficiency improves with economic growth. In fact, a recent ESCAP study focusing on the relationship between economic growth and environmental sustainability has revealed that while national incomes appear to have a beneficial effect on pollution measures for the member countries of our region, it has a detrimental effect on most ecological efficiency measures of environmental sustainability, other things
•
•

��
being equal. This suggests that while conventional policies focus more on pollution control, they need to be combined with policy options focusing on ecological efficiency aspects of environmental sustainability in the process of economic development. Otherwise, economic growth will continue to degrade environmental sustainability in most countries.
In addition, the experiences of already developed and middle-income developing countries present us with different development pathways, whereby the environmental sustainability indexes of such countries show a wide range of divergence rather than convergence (Table 1).
Table �: The Environmental Performance Index for Asia and the Pacific*
Country** EPI Kyrgyzstan 60.5New Zealand 88.0 Nepal 60.2Malaysia 83.3 Myanmar 57.0Japan 81.9 China 56.2Australia 80.1 Azerbaijan 55.7Russian Federation 77.5 Papua New Guinea 55.5Korea (the Republic of) 75.2 Viet Nam 54.3Turkey 72.8 Lao (People’s Democratic Republic) 52.9Iran (Islamic Republic of) 70.0 Turkmenistan 52.3Philippines 69.4 Uzbekistan 52.3Thailand 66.8 Cambodia 49.8Sri Lanka 64.6 Mongolia 48.8Armenia 63.8 Tajikistan 48.2Kazakhstan 63.6 India 47.7Georgia 61.4 Bangladesh 43.5Indonesia 60.7 Pakistan 41.1
Source: Esty, Daniel C., Marc Levy, Tanja Srebotnjak, Alexander de Sherbinin, Christine Kim, and Bridget Anderson (2006). Pilot 2006 Environmental Performance Index. New Haven: Yale Center for Environmental Law and Policy. Available at http://www.yale.edu/epi/
* The EPI centers on two broad environmental protection objectives: 1) reducing environmental stresses on human health and 2) protecting ecosystem vitality.
** Only those ESCAP countries with available EPIs are reported here.
Technical solutions alone are not sufficient in tackling the challenge. In fact, the environmental progress achieved due to technical solutions is most often offset by stark increases in consumption. As such, the increases required in eco-efficiency to curtail the environmental impacts of our economies are unprecedented. Despite progress achieved, however, pollution control alone does not provide for lessening the pressure increase from the pattern of economic growth and for “development that meets the needs of the present generation without compromising the ability of future generations to meet their own needs 7”. To “ensure the environmental sustainability” of the society it is also imperative to improve the efficiency in the way natural resources are being used. Eco-efficiency in Asia and the Pacific can be achieved by applying a mix of various environmentally related taxes, charges and levies combined with environmental policy instruments

��
that will stimulate innovation and green business growth and will create better social choices (box 3).
The path forward for the developing countries in the region is to adopt and apply development strategies where the eco-efficiency of their production and consumption cycles improves as their economies grow, thus leapfrogging the development model of the industrialized countries. Leapfrogging is clearly possible since it has occurred in several instances. To name one: the adoption of the mobile telephone. Remote villages in Asia are connected through mobile telephone technology, having leapfrogged over the need for regular landlines.
Box �: What is Eco-Efficiency?
Eco-efficiency concepts promote the minimization of environmental impact of production processes, and have received significant attention in the sustainable development literature since 1990. The origins of the term “eco-efficiency” are in the private sector. The World Business Council for Sustainable Development states that:
“Eco-efficiency is achieved by the delivery of competitively priced goods and services that satisfy human needs and bring quality of life, while progressively reducing ecological impacts and resource intensity throughout the life cycle, to a level at least in line with the Earth’s estimated carrying capacity.”
Source: World Business Council on Sustainable Development, 2000, p. 4
The concept is usually understood as a basis for monitoring the environmental impact of the production activity or service delivery of a firm. However, its use is also proposed to describe and assess the environmental impact of a wider scale of economic activity, i.e., of entire economic sectors, economies and societies. Scaling up from the firm level to the community, national, regional or global levels, however, requires consideration of the eco-efficiency not only of production activity (as at the firm level), but also of the environmental impact of consumption levels and patterns. In the absence of a consensus on a definition of eco-efficiency as applied in this wider context, “eco-efficiency” is used here as a measure of the efficiency of the use of natural resources to meet the needs of human populations. As in the private sector the term “use” does not cover only the direct use of natural resources as inputs for the production process; it also encompasses the indirect use of natural resources as waste-sinks. Broadening the concept to apply to the national context requires its application not only to production activity, but also the environmental impacts of consumption levels and patterns.
As many developing countries in the region are now undergoing a process of designing their infrastructure and laying the foundation for their consumption and production patterns, it is the optimum moment for these countries to apply and integrate the concept of eco-efficiency into their infrastructure development and consumption and production patterns (box 4).

��
Box �: Some Myths
Green Growth is Too ExpensiveThere are numerous cases where companies have made relatively minor changes in manufacturing processes to reduce waste and resource use, such as energy, water and other material input. The emphasis on improving eco-efficiency as promoted by the Green Growth policy focus has resulted in substantial reductions in resource use and pollution, as well as economic benefit.
As an example, the Samut Prakarn Cleaner Production for Industrial Efficiency (CPIE) Project implemented in Thailand involved more than 423 manufacturing industry members. By the time the project ended in April 2003, the UNEP Production and Consumption Branch reported that CPIE had achieved impressive results8; the total estimated after-tax savings to project participants from water, wastewater and electricity reductions to be achieved over only the period 2003-2007 were estimated at a net present value of 390 million baht (about US$ 9.3 million), as compared with an investment through the project budget of US$ 6 million. The following aggregate cleaner production achievements were reported, representing only a portion of the overall benefits:
1,243,000 cubic metres in reduced water/wastewater per year9,382,000 kWh in reduced electricity usage per year7,000,000 litres reduced diesel oil use per yearCost savings to participants of more than 133 million baht (US$ 3 million per year.
The project is also reported to have generated significant benefits to the Government of Thailand and Thai society. The reported estimated value of these benefits are as follows:
44 million baht (US$ 1,050,000) per year in increased tax revenue8 million baht (US$ 198,000) per year in industrial productivity gains2 million baht (US$ 67,000) per year in savings from reduced greenhouse gas emissions8 million baht (US$ 190,500) per year in savings from reduced land subsidence
Not focusing on Green Growth is more expensive in the long run – losses from natural disasters and human-induced disasters, decreased land productivity and loss of ecosystem services, all have a negative impact on economic growth, equivalent to several percentage points of GDP in India and China.
Green Growth is not Relevant to Developing Countries The above example shows that Green Growth approaches are most relevant to those developing countries where there is significant unmet need and lower levels of infrastructure development. While renewable energy markets are currently limited and fossil fuels remain the most practical application for some energy needs, opportunities for economic growth and income-generation, based on distributed electrical generation systems and renewable energy technologies, for example, are larger in less developed countries than others with more developed electrical grid systems.
Resource Saving Society in ChinaEfficient use of resources is identified as a key approach to reducing the conflict between a shortage of resources and the demands of economic growth. The National Development and Reform Commission
••••
••••

�8
Continued from Box 4
of China has announced that efficiency of resources use will be adopted as a basic principle in all economic sectors, and will be written into the eleventh Five-Year Plan. Building a circular economy and a conservation-minded society are seen as important elements. China’s cabinet issued a notice in July 2005 that called on government agencies to coordinate their work on resources conservation*. The next five years will be a crucial period for Chinese economic development, but also a period with emergence of outstanding problems, during which various kinds of contradictions, including those concerning resource and environment, will be most prominent. China will also develop a recycling-economy, protect natural environment, and speed up the construction of a resource-saving and environmental-friendly society.* Oriental Morning, Post, 15 March 2005; Xinhua News Service, 26 June 2005; China Daily, 25 July 2005.
Less-often discussed, and a critical issue for the developing countries of the region, given the under-developed or in a few cases, decaying, energy and water infrastructure, is infrastructure development and its impact on future consumption patterns. In addition to incurring hidden costs to the economy, infrastructure development plays an important role in determining environmental sustainability since it locks in consumption patterns for decades to come. Investment in grid-based energy systems based on centralized power generation from fossil fuels, for example, reduces incentives to utilize new renewables, for example. Developing highways in preference to mass transit systems imply heavy future fossil fuel demand for personal modes of transport and continued growth in greenhouse gas emissions. Driving investment to support greener infrastructure development is an urgent need in the region. Less-often discussed, and a critical issue for the developing countries of the region, given the under-developed or in a few cases, decaying, energy and water infrastructure, is infrastructure development and its impact on future consumption patterns. In addition to incurring hidden costs to the economy, infrastructure development plays an important role in determining environmental sustainability since it locks in consumption patterns for decades to come. Investment in grid-based energy systems based on centralized power generation from fossil fuels, for example, reduces incentives to utilize new renewables, for example.
Developing highways in preference to mass transit systems imply heavy future fossil fuel demand for personal modes of transport and continued growth in greenhouse gas emissions. Driving investment to support greener infrastructure development is an urgent need in the region. Less-often discussed, and a critical issue for the developing countries of the region, given the under-developed or in a few cases, decaying, energy and water infrastructure, is infrastructure development and its impact on future consumption patterns. In addition to incurring hidden costs to the economy, infrastructure development plays an important role in determining environmental sustainability since it locks in consumption patterns for decades to come. Investment in grid-based energy systems based on centralized power generation from fossil fuels, for example, reduces incentives to utilize new renewables, for example. Developing highways in preference to mass transit systems imply heavy future fossil fuel demand for personal modes of transport and continued growth in greenhouse gas emissions. Driving investment to support greener infrastructure development is an urgent need in the region. Energy, water, urban housing and buildings represent infrastructure development for which the long-term implications for environmental sustainability needs much more attention.

�9
C. Tomorrow and Our Future As its name suggests, eco-efficiency seeks to promote economic activity that makes more efficient use of natural resources and produces less, and less damaging, wastes. Beyond this, a new paradigm is being articulated whereby eco-efficiency is pushed further towards what has been called eco-effectiveness (box 5). If the eco-efficiency concept may be summarized as “doing more with less” (and producing less waste in the process), eco-effectiveness is focused on designing processes that produce no waste at all (i.e., all material outputs from one process are useful inputs into another wealth-creating process). As such, economic activity and human behaviour more generally not only strive to have no detrimental environmental impact, but also positively seek to protect and enhance both the environment and natural systems. The proponents of this paradigm emphasize that, building on the positive experience with eco-efficiency, eco-effectiveness derives from economic, social and technological innovation that produces more, not less, bestowing positive social, environmental and economic benefits on society. Such innovation requires an economic system that encourages the production of these multiple benefits with incentives and values them appropriately.
Box �: How to Achieve Eco-effectiveness?
RADICAL RESOURCE PRODUCTIVITY. Radically increased resource productivity is the cornerstone of natural capitalism because using resources more effectively has three significant benefits: It slows resource depletion at one end of the value chain, lowers pollution at the other end, and provides a basis to increase worldwide employment with meaningful jobs. Increasing the costs associated with resource depletion and pollution and placing them on the list of those activities which are responsible for such negative effects will reduce them in quantity, thus benefiting the wider society. Such steps will make more competitive those economic activities which do not deplete resources or cause pollution. The result can be lower overall costs for business and society, which no longer must pay for ecosystem degradation and social disruption. Because much environmental and social harm is a result of the wasteful use of human and natural resources, radical resource productivity strategies can halt the degradation of the biosphere and make more profitable the employment of people, thereby safeguarding vital living systems and social cohesion.
BIOMIMICRY. Reducing the wasteful throughput of materials—indeed, eliminating the very idea of waste—can be accomplished by redesigning industrial systems on biological lines that change the nature of industrial processes and materials, enabling the constant reuse of materials in continuous closed cycles and often the elimination of toxicity.
SERVICE AND FLOW ECONOMY. This calls for a fundamental change in the relationship between producer and consumer, a shift from an economy of goods and purchases to one of service and flow. In essence, an economy that is based on a flow of economic services can better protect the ecosystem services upon which it depends. This will entail a new perception of value, a shift from the acquisition of goods as a measure of affluence to an economy where the continuous receipt of quality, utility and performance promotes well-being. This concept offers incentives to put into practice the first two innovations of natural capitalism by restructuring the economy to focus on relationships that better meet customers’ changing value-needs and to reward automatically both resource productivity and closed-loop cycles of materials use.
1.
2.
3.

20
Continued form Box 5
INVESTING IN NATURAL CAPITAL. This works towards reversing worldwide planetary destruction through reinvestments in sustaining, restoring and expanding stocks of natural capital, so that the biosphere can produce more abundant ecosystem services and natural resources.
All four changes are interrelated and interdependent; all four generate numerous benefits and opportunities in markets, finance, materials, distribution and employment. Together, they can reduce environmental harm, create economic growth and increase meaningful employment.
Adapted from: Paul Hawken, Amory Lovins and L. Hunter Lovins, Natural Capitalism: Creating the Next Industrial Revolution (New York, Little, Brown and Company, 2000), pp. 10-11.
4.
Table 2 seeks to summarize some key characteristics of:
The industrial economy of the last century
The “eco-efficient” economy, the promotion of which is the subject of much environmental and other policy today
The “sustainable” economy, which embodies the aspiration at the heart of sustainable development for a human economy that satisfies the needs of all people while maintaining and enhancing the natural world, which is ultimately the source of all resources for human activity, and of life itself.
Table 2: How to Achieve Environmentally Sustainable Economic Growth?
Industrial Economy (20th Century practice)
Eco-Efficient Economy (Today’s objective)
Sustainable Economy (Today’s aspiration)
Yesterday Today TomorrowEnvironment (Pollution) Environment (Pollution) Environment (Pollution)
Puts billions of kilograms of toxic material into the air, water and soil every year
Produces some materials so dangerous they will require constant vigilance by future generations
Results in very large amounts of solid waste, which is used predominantly as landfill.
Requires thousands of complex regulations, mainly oriented towards the end-of-pipe control of pollution rather than avoiding the creation of pollutants
•
•
•
•
Releases fewer kilograms of toxic wastes
Seeks to substitute less for more hazardous substances and emissions
Innovates to produce more effective end-of-pipe controls and new processes that produce fewer pollutants
Innovates to use energy and materials more efficiently, producing fewer emissions and less waste
Where appropriate, substitutes economic incentives (e.g., environmental taxes, trading schemes) for regulations
Through separate collection and investment in waste management infrastructure, increases re-use and recycling of materials and reduces landfilling
••
•
•
•
•
High material and waste costs drive systematic energy efficiency, material efficiency (dematerialization) and waste minimization
Systematic substitution of renewable for non-renewable resources, and benign for hazardous substances and emissions
“Design for environment” greatly facilitates re-use and recycling
Industrial ecology and industrial symbiosis (life cycle thinking and use of wastes as raw materials for another process) become standard concepts and practices
•
•
•
•
••
•

2�
Industrial Economy (20th Century practice)
Eco-Efficient Economy (Today’s objective)
Sustainable Economy (Today’s aspiration)
Yesterday Today TomorrowEnvironment (Resources) Environment (Resources) Environment (Resources)
Fails adequately to account for either the depletion of non-renewable resources or the non-renewal of renewable resources
Fails adequately to account for ecosystem functions and services
Results in widespread destruction of renewable resources, habitats and ecosystems and threatens millions of species with extinction
•
•
•
Values appropriately the depletion of renewable and non-renewable resources, promoting their more efficient use, re-use and recycling
Recognizes the value of ecosystems and gives them appropriate protection
Builds a global network of conservation areas to conserve habitats and species and the basic integrity of the biosphere
•
•
•
Use of primary non-renewable resources (including energy) diminishes as a result of substitution by renewables
Output of material renewables is increased through better management and stringent observance of sustainable yields
The full range of marine, fresh water and terrestrial species, habitats and ecosystems is maintained by an internationally enforced mixture of conservation and sustainable use
•
•
•
Economic wealth-creation Economic wealth-creation Economic wealth-creationMeasures wealth largely by economic output and human welfare by consumption
Regards labour productivity as the key production indicator, to the exclusion of resource productivity
Ignores many important aspects of human welfare, including environmental quality and the quality of work and working conditions, and, in the social realm, family, social relationships, cultural integrity and ethical and spiritual issues.
Tends to distribute economic wealth very unequally
•
•
•
•
Adopts a broader framework of measures of wealth creation and welfare than economic output and consumption.
Pays as much attention to resource productivity as labour productivity.
Has little in general to say about social aspects of wealth creation
•
•
•
Humans value the ecosystems and habitats that comprise the biosphere both for their functions that benefit humans and for themselves
Human economies recognize that economic output and consumption are important contributors to welfare, but also both that the biosphere is important to sustain these and that welfare has other important components
The social dimension of development, in terms of both the distribution of wealth and cultural and spiritual values, is given weight
•
•
•
Table developed by Paul Ekins, 17 January 2006.

22
Despite having a biomass that exceeds that of humans, ants have a very positive impact on the global environment. People, in contrast, seek comfort, convenience, pleasure, excitement and experience by, for example:
Travelling fast and far
Eating a wide variety of different foods
Owning a wide variety of things, with high status often being attached to resource-intensive things
Wanting to keep warm in cold climates while wearing few clothes
Possessing a wide range of gadgets and appliances to heat things up, cool things down, make things clean, entertain, inform and educate themselves
With current technologies the realization of these desires and aspirations creates enormous environmental damage. Partly this is often because the people who create the environmental damage do not experience it; partly it is because individual actions often create very small, seemingly negligible, additions to environmental damage which, in aggregate, becomes very significant; partly it is because people do not know or care about the environmental damage; partly it is because, even when they do know and care about it, institutions do not exist to prevent such damage (through regulations) or internalize it (e.g., through environmental taxes) into market transactions; partly it is because influential people can get financially richer through environmentally damaging economic activities, more so than through the environmentally sustainable alternatives.
Achieving Green Growth, or the “sustainable economy” as outlined in the table 1 above, will require that all these issues are addressed, from public awareness to environmentally sound governance, and the development and deployment of new environmentally improved technologies such as the “hypercar” (box 6).
Did you know?
The total biomass of all the ants on Earth is greater than the total biomass of all people on Earth? Yet they
Handle their own and other wastes safelyGrow and harvest their own food, while nurturing the environmentConstruct houses and other living and storage facilities that can be truly recycledCreate disinfectants and medicines that are healthy, safe and biodegradableMaintain soil health for the entire planet
Source: William McDonough and Michael Braungart. Cradle to Cradle: Remaking the Way We Make Things (New York, North Point Press, 2002), p. 79.
•••••
•••••
2�
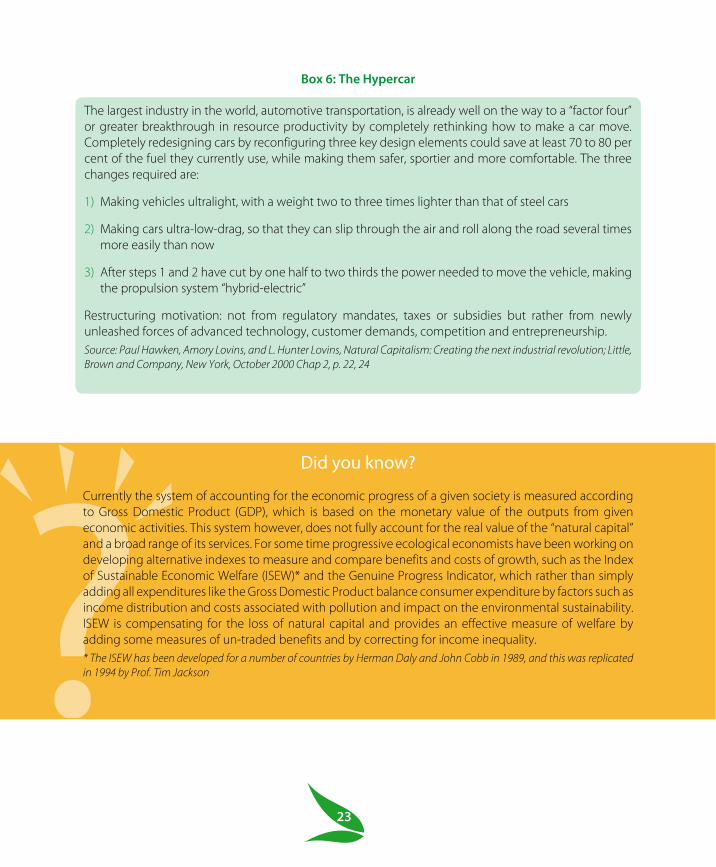
Box �: The Hypercar
The largest industry in the world, automotive transportation, is already well on the way to a “factor four” or greater breakthrough in resource productivity by completely rethinking how to make a car move. Completely redesigning cars by reconfiguring three key design elements could save at least 70 to 80 per cent of the fuel they currently use, while making them safer, sportier and more comfortable. The three changes required are:
Making vehicles ultralight, with a weight two to three times lighter than that of steel cars
Making cars ultra-low-drag, so that they can slip through the air and roll along the road several times more easily than now
After steps 1 and 2 have cut by one half to two thirds the power needed to move the vehicle, making the propulsion system “hybrid-electric”
Restructuring motivation: not from regulatory mandates, taxes or subsidies but rather from newly unleashed forces of advanced technology, customer demands, competition and entrepreneurship.Source: Paul Hawken, Amory Lovins, and L. Hunter Lovins, Natural Capitalism: Creating the next industrial revolution; Little, Brown and Company, New York, October 2000 Chap 2, p. 22, 24
1)
2)
3)
Did you know?
Currently the system of accounting for the economic progress of a given society is measured according to Gross Domestic Product (GDP), which is based on the monetary value of the outputs from given economic activities. This system however, does not fully account for the real value of the “natural capital” and a broad range of its services. For some time progressive ecological economists have been working on developing alternative indexes to measure and compare benefits and costs of growth, such as the Index of Sustainable Economic Welfare (ISEW)* and the Genuine Progress Indicator, which rather than simply adding all expenditures like the Gross Domestic Product balance consumer expenditure by factors such as income distribution and costs associated with pollution and impact on the environmental sustainability. ISEW is compensating for the loss of natural capital and provides an effective measure of welfare by adding some measures of un-traded benefits and by correcting for income inequality.* The ISEW has been developed for a number of countries by Herman Daly and John Cobb in 1989, and this was replicated in 1994 by Prof. Tim Jackson

2�
Continued form Did you know?
Gross National Happiness
Some countries in Asia and the Pacific have recognized the importance of such an approach of accounting for the progress in achieving welfare of the society. For the last two decades the Kingdom of Bhutan has followed the guiding principle enunciated by His Majesty King Jigme Siongye Wangchuck who stated that “Gross National Happiness is more important than Gross National Product”. The principle describes development as a continuous process towards a balance between material and non-material needs of individuals and society. The country’s philosophy of development while recognizing the importance of economic growth as essential to support and nurture the spiritual and social needs of the community, is not an end in itself, but one among many means of achieving holistic development.
Sufficiency Economy
The “Sufficiency Economy” is a philosophy bestowed by His Majesty the King of Thailand and stresses the middle path as the way for recovery and strengthening of the economy of Thailand and sets it as the overriding principle for appropriate conduct by the people at all levels, individual, family and community. It underlines the importance of the choice of a balanced development strategy for the nation as a whole to be able to modernize in line with the forces of globalization while shielding the country against inevitable shocks and excesses that may rise from extensive and rapid socioeconomic, environmental and cultural changes.* * Prepared on the basis of Chapter 2: Development Philosophy of the National development Progamme of Bhutan


Part III: How Do We Foster Green Growth?
© Ruedee Arunkhajohnsak

2�
A. Different Kinds of Growth9
Growth of an economy’s biophysical throughput. The growth in population has boosted demand for such basic necessities as water, food and firewood. In addition to the consumption of fossil fuels has increased nearly four fold with its corresponding increase in carbon emissions; consumption of seafood has quadrupled and the consumption of paper has increased six fold. Such increases in demand and consumption manifest themselves in increases in the planet’s entropy, that is, wastes and pollution.
Growth of production. This is growth as measured essentially in terms of gross domestic product and national products, in terms of monetary or non-monetary production by markets, governments or households.
Growth of economic welfare. The issue here is whether increases in GNP in fact contribute to net economic welfare.
Environmental growth. This happens through natural growth and regeneration, leading to increased resources for production and consumption and for environmental services. Ecological capital is the only form of capital to experience such spontaneous growth, whereby other forms of capital are maintained through continual use or investment.
The rapid emergence of interdependent economies, modernized technologies and transactions are common concerns in all regions of the world, but even more so in developing countries. How can these changes be embraced and growth managed in sustainable ways, that is, how to develop? Economic transformations are outpacing the fundamental and unresolved issues of social development and environmental sustainability in many regions of the world, and certainly in most of Asia and the Pacific.
At the same time, globalization, with its international flows of capital, labour and technology, has increased the opportunities for a shift towards environmentally sustainable economic growth or Green Growth. For example, through easier sharing and transfer of knowledge and technologies, there are now potential new win-win alternatives to the traditional trade-offs between growth and environmental sustainability. More efficient and less materials-intensive production is cost-effective, reduces emissions and creates new job opportunities.
B. Green Growth PoliciesPublic policy is a key driver of social and environmental progress, especially in developing countries. Progress towards environmentally sustainable economic growth can be measured via reference to two criteria – environmental performance and environmental sustainability.
Environmental sustainability
Environmental sustainability is a powerful indicator to measure the impact of a country’s economic development with regard to the pressure on resources deriving from consumption and production processes and to determine whether it remains within the carrying capacity of the natural environment.
1.
2.
3.
4.

28
Tools for supporting environmentally sustainable economic growth include:
Internalizing environmental costs into market prices to maximise eco-efficiency and to use, wherever appropriate, economic instruments such as green accounting and eco-tax reform, bearing in mind the interaction between various market strategies and ensuring equity concerns are simultaneously considered;
Enhancing cleaner production by promoting eco-efficiency, especially reducing the energy and materials used per unit of production of goods and services and minimizing the waste and pollution from production processes;
Promoting a recycling society and the environmental sustainability of consumption patterns;
Encouraging the development of markets for environmentally preferable goods and services and encouraging innovation for the development of sustainable technologies;
Ensuring that international trade obligations and multilateral environmental agreements are implemented in a manner supportive of environmentally sustainable economic growth.
Environmental performance
Environmental performance relates to action by governments and other actors, including implementation of processes that support environmentally sustainable economic growth. Essentially, environmental performance is a measure of the gap between the actual state of what is being measured and targeted policy goals.
Tools for supporting improved environmental performance towards environmentally sustainable economic growth include:
Promoting effective enforcement of laws, regulations and standards relating to sustainable development;
Providing support for compliance;
Strengthening institutional structures and the functions of agencies and institutions relevant to sustainable development, including the national sustainable development commissions, for:
Policy integration of the three pillars of sustainable development; andPromoting effective multi-stakeholder partnership for the full participation of all groups in efforts to achieve sustainable development;
Promoting the use of environmental sustainability and environmental performance indices and frameworks such as a pressure, state, response analysis (PSR) for the assessment of conditions and trends as tools in the development of sustainable development policy.
A list of potential eco-efficiency indicators is presented in figure 8.
•
•
••
•
•
••
--
•

29
Thus, to pursue the current pattern of economic growth there is a need to reduce the resources intensities of our consumption—at least for those impacts that are at the threshold of sustainability. This can be achieved by reducing the material/resource intensity of the growth through the application of eco-efficiency standards, which will delink the economic growth from materials, land and energy use, whereby the rate of their use needs to be less than the growth of the GDP achieved. The result of delinking, also known as decoupling is a more efficient use of resources, however this is not sufficient to achieve environmental sustainability. This requires absolute reductions in the use of energy and materials regardless of their levels of production and consumption on a wider national level, which also referred to as dematerialized growth. Thus if material consumption can be brought to within sustainable limits, economic growth can be sustainable.
Figure 8: Potential Eco-Efficiency Indicators
Oth
erEn
viro
nmen
tal i
mpa
ctRe
sour
ce u
se
ResourcesUse intensity
Resourcesproductivity
Rate of ResourcesSavings of bene�t
accumulation
EnvironmentalImpact intensity
Pressure onenvironmental
“absorptive”capacity
Units of resource use
Units of anthropogenicactivity
Units of value creation
Units of resource sue
Units of environmentalbene�t
Units of anthropogenicactivity
Units of environmentalimpact
Units of anthropogenic
Units of environmentalimpact
Units of environmentalresource absorbing
environmental impact
Water used by industryper unit
of GDP from industry
Passenger kilometersper unit of energy used
by the passengertransport sector
Electricity generated bysolar energy per kWh of
electricity produced
CO 2 from electricityproduction per kWh of
electricity produced
2CO per unit forest area;
Fertilizer used per unitarea of arable land
Lower isbetter
Lower isbetter
Lower isbetter
Higher isbetter
Higher isbetter
Total emissions of organic pollutant per volume
receiving freshwater body
POTE
NTI
AL
ECO
-EFF
ICIE
NCY
IND
ICA
TORS
Source: UNESCAP
�0
C. Policy Strategies and Economic Instruments
“There are many and substantial opportunities to reduce environmental impact with positive, zero or small negative impacts on economic growth in the short and medium term10.”
“Public policy is essential to guiding and stimulating societal changes, since the market alone cannot deliver such changes.” (Ibid)
The conventional environmental management approach has been focused more on improving environmental performance by controlling and regulating pollution and effluents from production processes. Despite the progress achieved, however, pollution control alone does not provide for lessening the pressure increase from the pattern of economic growth or for “development that meets the needs of the present generation without compromising the ability of future generations to meet their own needs11”. In order to “ensure the environmental sustainability” of the society, it is also imperative to improve the efficiency of the way natural resources are being used.
Regulation is necessary to ensure some improvement in eco-efficiency, essentially with regard to pollution-prevention and control, namely, through extended producer responsibility, recycling targets, landfill and other waste directives, and voluntary agreements.
However, improving the eco-efficiency of consumption patterns could be achieved through policies providing for individual consumers to make environmentally friendly choices. In order to improve the environmental sustainability of the consumption and production patterns of the society, both aspects of the consumption-production cycle must be addressed. Technological changes, coupled with supporting policy measures and sensitizing the end-users about the social benefits of these changes, would be needed.
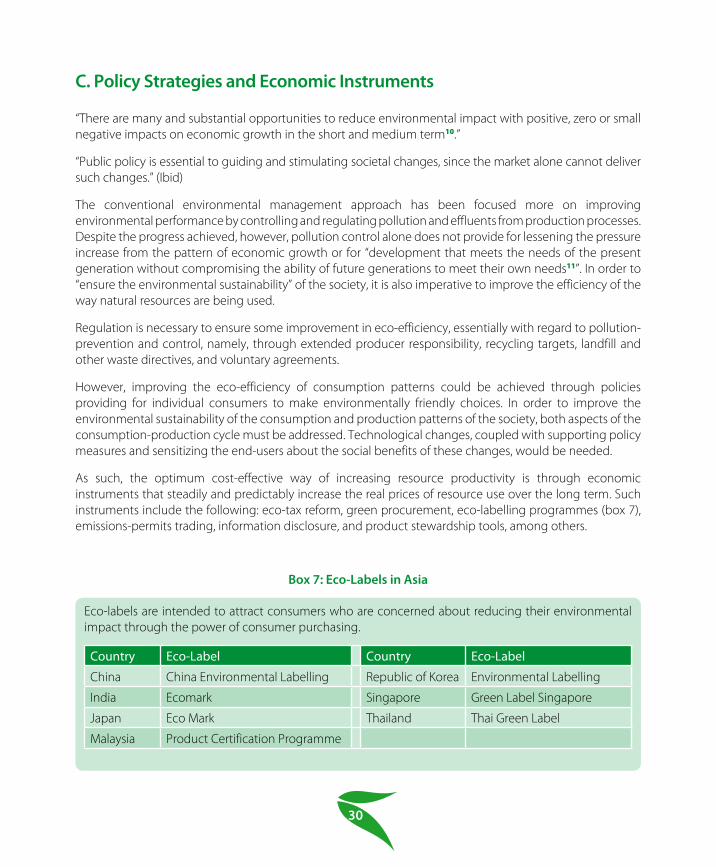
As such, the optimum cost-effective way of increasing resource productivity is through economic instruments that steadily and predictably increase the real prices of resource use over the long term. Such instruments include the following: eco-tax reform, green procurement, eco-labelling programmes (box 7), emissions-permits trading, information disclosure, and product stewardship tools, among others.
Box �: Eco-Labels in Asia
Eco-labels are intended to attract consumers who are concerned about reducing their environmental impact through the power of consumer purchasing.
Country Eco-Label Country Eco-Label
China China Environmental Labelling Republic of Korea Environmental Labelling
India Ecomark Singapore Green Label Singapore
Japan Eco Mark Thailand Thai Green Label
Malaysia Product Certification Programme

��
1. Eco-Tax Reform
Taxation is critical in internalizing environmental costs into price mechanisms and correcting market failure (box 8). Budget allocation for environmental infrastructure is instrumental in integrating eco-efficiency concepts into economic development planning.
Box 8: Green Tax and Budget Reform
In market economies any kind of reform is nearly impossible if it is working against market signals green tax and budget reform (GTBR) not only works with market signals, but it also achieves environmental improvement, at least abatement cost, and provides the greatest chance of economic benefit. GTBR is an environmental policy that has the best chance to achieve Green Growth.
Green taxes are levied on resource use or polluting environmental emissions
For maximum effectiveness, they should be levied as close to the resource use/emissions as possible (e.g. SO2/CO2 not energy)
Revenues from green taxes enable the reduction of other taxes – revenue neutrality
Economic and environmental effects of GTBR:
Green taxes reduce environmental resource useGreen taxes achieve environmental improvement at least cost by promoting:
Static efficiency (equal abatement cost)Dynamic efficiency (incentives for innovation)Awareness of inefficient resource use
Abatement technologies can lead to new industries
Reduction of other distorting taxes leads to increased output
If innovation, awareness, industrial effects and reduced distortions are greater than abatement costs, then environmental improvement can be achieved at net gains to the economy—green economic growth
Source: Paul Ekins. “Resource productivity, eco-efficiency, Green Growth: a new path for human welfare and environmental sustainability”, a presentation at the First Regional Policy Dialogue: “Towards Green Growth in Asia and the Pacific: Eco-efficiency through Green Tax and Budget Reform” held at Seoul, Republic of Korea in November 2005.
••
••
››
---
›••
In reviewing green tax reform, the First Regional Policy Dialogue, held in the Republic of Korea in November 2005, decided that revenue neutrality would be emphasized. Green tax does not need to cause an increase in additional tax revenue to be earmarked for environmental purposes. It is proposed to slowly reduce income taxes in exchange of the gradual introduction of a green tax on pollution, namely, replacing a tax on “income” (taxing the “good”) with a tax on “pollution” (taxing the “bad”) (box 9). Green GDP and green accounting could also become potential policy tools.

�2
Box 9: Taxes for Conservation
In 1993, the Toyota City Council in Aichi Prefecture, Japan decided to add a charge of 1 yen/m3 to water charges for the purpose of conserving water resources. The Fund for Conservation of Water Resources for Water Works was established in 1995 to pool the money collected. The Fund is used for forest conservation activities in the upper stream of the Yahagi River, the main source of water for the City. Based on agreements between Toyota City and six towns and villages in the upper Yahagi River Basin, forest conservation activities, in particular the thinning of man-made forests on behalf of forest owners, are implemented by local governments in the upper stream area, using the funds.
The Okayama and Kochi prefectural governments in 2004 introduced a local tax for the conservation of forests, recognizing their essential ecological functions for flood control and as natural reservoirs of freshwater resources. In both Okayama and Kochi, 500 yen per capita/year is added to the prefectural tax. The rate of tax was decided, taking into full account the comments that citizens made in questionnaires and at meetings. Special funds were established for the appropriate use of the tax collected for, among other things, forest conservation activities such as forest-thinning and public awareness projects. Currently, more than 20 other local governments in Japan consider that they could introduce such tax systems for forest conservation.
In introducing charge/tax systems of this type, fair burden sharing and minimization of transaction costs should be considered well. The charge system per fixed amount of water use in Toyota City has been functioning well, and has achieved good understanding among citizens. On the other hand, in Okayama and Kochi, they choose to add a fixed amount to the prefectural tax based on the idea that tax should be paid for all water beneficiaries including those who do not use public water-supply systems (e.g., groundwater users). The governments reported that the introduction and maintenance costs are less than the charges added to the water bill. However, proper taxation systems differ according to local, social and economic situations. It is also important to maintain transparency and ensure the participation of local people in the planning and the use of the tax.Source: Asia-Pacific Forum for Environment and Development (APFED). Final Report: Paradigm Shift towards Sustainability for Asia and the Pacific – Turning Challenges into Opportunities (Tokyo, APFED, 2004), p. 133.
Did you know?
Charging more to use roads, tunnels, bridges, or parking areas when they are most crowded:
Singapore’s prosperity could have turned it into another bumper-to-bumper Bangkok, where congestion - gridlocking the average driver the equivalent of 44 full days a year - is estimated to reduce Thailand’s entire GDP by about one sixth. Yet Singapore is rarely congested, because it taxes cars heavily, auctions the right to buy them, imposes a US$ 3 to 6 daily user fee on anyone driving in the downtown area, and channels the proceeds into an excellent transit system. Just the morning-rush-hour $3 entry fee cut the number of cars entering the city by 44 per cent and solo trips by 60 per cent, helping traffic to move up to 20 per cent faster.Source: Hawken, Lovins and Lovins, Amory, op. cit., pp. 42-43.

��
2. Green Procurement
Large public and private institutions can influence the implementation of eco-efficiency through their procurement mechanisms, inducing suppliers to develop environmentally sound goods and services (box 10).
Box �0: Examples of Green Purchasing in Selected Companies
Boeing By 1999, Boeing had retrofitted more than half of its floor space with efficient lighting, thereby cutting energy costs by $12 million annually and saving energy that could power approximately 16,000 homes.
Canon Canon gives priority in its global purchasing to nearly 4,600 company-approved green office supplies and is now working to “green” its procurement for plants in Asia and North America. Outreach to suppliers has led to high rates of compliance with existing policies.
Federal Express In 2002, Federal Express pledged to replace all 44,000 fleet vehicles with diesel-electric trucks that would increase fuel efficiency by half and cut smog- and soot-causing emissions by 90 per cent.
Hewlett-Packard In 1999, Hewlett-Packard committed to buying paper only from sustainable forest sources. It gives preference to suppliers that provide green products and have green business practices, and it restricts or prohibits the use of certain chemicals in manufacturing and packaging.
Migros In 2002, the Swiss supermarket became the first European retailer to stop buying palm oil supplies from ecologically unsound sources in Malaysia and Indonesia. Migros audits its suppliers for compliance with environmental criteria and labels products that “protect tropical forests”.
Toyota In 2001, Toyota switched to about 1,400 office supply items and 300 computers and other equipment to green alternatives. It achieved 100 per cent green purchasing in these areas in 2002. In fiscal year 2001, it bought 500,000 kilowatt-hours of wind power and aims to boost this to 2 million kWh per year.

��
Did you know?
The Japanese Ministry of the Environment announced on 31 March, 2005, that green purchasing by the national Government and related entities accounted for 95 per cent or more of the products and services procured by the national Government and related entities in both fiscal 2002 and 2003. This high level of green purchasing was calculated to cut CO2 emissions by an estimated 45,000 tons, equivalent to the household CO2 emissions of about 22,000 persons.Source: www.japanfs.org/db/database.cgi?cmd=dp&num=1030&dp=data_e.html
3. Public Information Disclosure
Corporate rating disclosure programmes, also referred to as public information disclosure programmes, were developed by Vietnamese and Indonesian environmental agencies in the 1990s as a low-cost response to rising pollution loads. Viet Nam published Black and Green Books listing the worst-performing and best-performing companies, while the Indonesian national pollution control agency staff (BAPEDAL) is credited with conceiving a corporate ratings and disclosure model that has been successfully replicated, with slight modifications, in China, India, the Philippines and Viet Nam as well as other countries outside the region (box 11).
The Indonesian PROPER programme “is an alternative instrument to control pollution based on sustainable development principle through environmental compliance and performance of companies’ improvement in environmental management through the introducing disincentive and incentive reputation by disclosing environmental performance of industries to public and stakeholders12”. The PROPER rating system consists of five colours designed to represent the entire spectrum of environmental performance13 (figure 2). The rankings are regularly reported in the media, and the results have been significant. Results show that the programme has indeed influenced polluters’ behaviour, PROPER reduced the number of facilities with the worst rating from 40% of the companies assessed, 4%, in two years.

��
Box ��: Public Information Disclosure
Rising public complaints and increasing industrial pollution moved Ho Chi Minh City, Viet Nam to launch a survey of 600 enterprises in 1993. A “Black Book” listing the 43 worst polluters was published in 1994. 13 firms subsequently installed waste treatment plants, 21 firms prepared Environmental Impact Assessment reports and one firm moved to the outskirts of the city. Eight of the 43 firms did not take any action. The exercise was repeated in 1997. A follow-up survey indicated that the Black Books induced investment in pollution control in 98 per cent of polluting companies.
Under the Indonesia public disclosure programme (PROPER) launched in 1995, five plants rated as “very good” (out of 187 assessed) were publicly congratulated. Other lower-rated firms were privately notified of their ratings and given six months to clean up before full disclosure. One year later, the numbers of compliant plants had expanded from one third to over half. Five of the six plants in the worst category, graduated to higher categories. COD emissions are estimated to have been reduced by 30 per cent by the programme.
The Philippines EcoWatch programme’s initial assessment in 1997 showed that 48 plants (92 per cent of the total number of companies assessed) were ranked in the “non-compliant” and “very poor” categories. One and a half years later, the number of companies rated as “compliant” jumped from eight per cent to 58 per cent.
In Zhenjiang, Jiangsu Province of China, a pilot ratings scheme beginning in June 1999 was applied to 91 firms. One year after public disclosure of the ratings, the numbers of firms rated as “superior performers” doubled from 31 per cent to 62 per cent. The province then took the decision to promote province-wide implementation of the programme. In Hohhot, Inner Mongolia, China, the scheme was applied to 107 enterprises. Enterprises rated “Good” or better, increased from 24 per cent to 62 per cent. Enterprises in the worst category decreased from 11 per cent to 5 per cent.
A 2001 Vietnamese programme assessed 50 food and textile plants in Hanoi. Five were rated as compliant, 29 were rated as “non-compliant”, and 16 “very poor”. After public recognition of the five compliant companies and the threat of public disclosure of all ratings four months later, the number of compliant companies doubled. The number of non-compliant companies reduced to 23 and the “very poor” companies reduced to 15.
A voluntary pilot ratings and disclosure programme in Uttar Pradesh initiated in May 2001 used self-reported company data for 34 companies representing a mix of sizes and activities and a ratings scheme in which companies participated in developing. After a grace period, the numbers of companies in the worst-performing segments decreased from 17 to 11, while the number of companies which were basically compliant increased from 12 to 16. The numbers in the highest performing categories increased from four to six.
Sources: World Bank, Greening of Industry; World Bank New Ideas in Pollution Control website at www.worldbank.org/nipr/greeningindustry.htm; Confederation of Indian Industry Media Report on the Pilot Program for Environmental Performance Rating and Public Disclosure (2004), available at www.worldbank.org/nipr/greeningindustry.htm
•
•
•
•
•
•
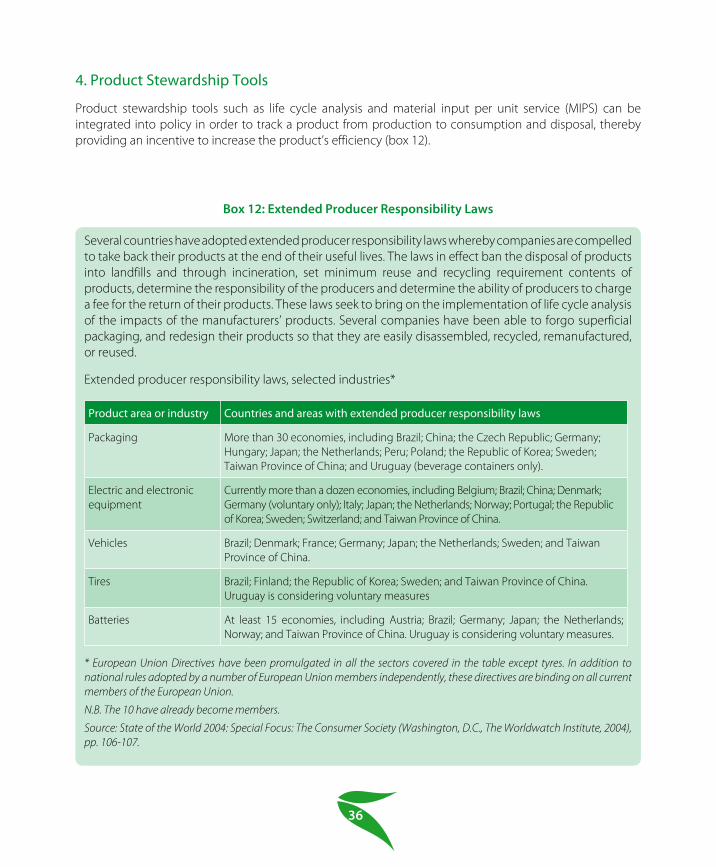
��
4. Product Stewardship Tools
Product stewardship tools such as life cycle analysis and material input per unit service (MIPS) can be integrated into policy in order to track a product from production to consumption and disposal, thereby providing an incentive to increase the product’s efficiency (box 12).
Box �2: Extended Producer Responsibility Laws
Several countries have adopted extended producer responsibility laws whereby companies are compelled to take back their products at the end of their useful lives. The laws in effect ban the disposal of products into landfills and through incineration, set minimum reuse and recycling requirement contents of products, determine the responsibility of the producers and determine the ability of producers to charge a fee for the return of their products. These laws seek to bring on the implementation of life cycle analysis of the impacts of the manufacturers’ products. Several companies have been able to forgo superficial packaging, and redesign their products so that they are easily disassembled, recycled, remanufactured, or reused.
Extended producer responsibility laws, selected industries*
Product area or industry Countries and areas with extended producer responsibility laws
Packaging More than 30 economies, including Brazil; China; the Czech Republic; Germany; Hungary; Japan; the Netherlands; Peru; Poland; the Republic of Korea; Sweden; Taiwan Province of China; and Uruguay (beverage containers only).
Electric and electronic equipment
Currently more than a dozen economies, including Belgium; Brazil; China; Denmark; Germany (voluntary only); Italy; Japan; the Netherlands; Norway; Portugal; the Republic of Korea; Sweden; Switzerland; and Taiwan Province of China.
Vehicles Brazil; Denmark; France; Germany; Japan; the Netherlands; Sweden; and Taiwan Province of China.
Tires Brazil; Finland; the Republic of Korea; Sweden; and Taiwan Province of China. Uruguay is considering voluntary measures
Batteries At least 15 economies, including Austria; Brazil; Germany; Japan; the Netherlands; Norway; and Taiwan Province of China. Uruguay is considering voluntary measures.
* European Union Directives have been promulgated in all the sectors covered in the table except tyres. In addition to national rules adopted by a number of European Union members independently, these directives are binding on all current members of the European Union.
N.B. The 10 have already become members.
Source: State of the World 2004: Special Focus: The Consumer Society (Washington, D.C., The Worldwatch Institute, 2004), pp. 106-107.

��
D. Some Powerful PartnersThe increased influence of civil society has certainly been one of the single most significant changes in the 1990s. In particular, non-governmental organizations (NGOs) have evolved to become very effective advocates in the public debate and play a determining role in launching Green Growth initiatives, promotion and monitoring (box 13). In effect, NGOs influence the public debate by:
Setting agendas: inducing leaders and policymakers through public opinion blitzes, aided by the power of communications
Negotiating outcomes: providing scientific knowledge, sitting at the negotiating table, convening parties, etc.
Conferring legitimacy: through their credibility by lending support and bringing along with it public support or, on the contrary, withdrawing support
Implementing solutions: some NGOs have earned a reputation for neutrality and experience which make them often better equipped for implementation in the field
Box ��: Some Civil Society Initiatives
The Business Environment Council in Hong Kong, China is a non-profit environmental organization that aims “to advocate the business case for sustainable development and encourage the uptake of practices which reduce waste, conserve resources, prevent pollution and improve corporate environmental and social responsibility”.
By joining the Council’ members benefit by: (a) enhancing the network of business leaders not only in Hong Kong, China, but also elsewhere; (b) delivering business perspectives to Governments; (c) accessing environmental information through news bulletins and news updates; (d) participating in training courses; (e) receiving management consultancy and research services; and (f) renting exhibition areas.Source: www.bec.org.hk/general/e_home.php
The Energy Research Institute has been actively working on energy provisioning by commercializing the solar photovoltaic technologies in the desert region of Rajasthan, western India. The project has created a local delivery mechanism comprising a centre for customization and assembly of the technologies according to local needs and the paying capacity of the local people. The systems are marketed through rural entrepreneurs identified and “incubated” under the project.
The spiritual community of Auroville has the biggest concentration of alternative and appropriate energy systems in India, including solar, wind and biogas-generating systems. Of particular interest is the massive15-metre diameter solar collector installed on the roof of the solar kitchen, designed to generate enough steam to cook up to 1,000 meals a day.Source: www.auroville.org/faq_nutshell.htm
•
•
•
-
-
-
-

�8
Did you know?
Mitsubishi Electric worked with 160 non-governmental environmental organizations to forge a new vision for the company.Source: Hawken, Paul and Lovins, Amory, and L. Hunter Lovins (2000), Natural Capitalism: Creating the next industrial revolution; Little, Brown and Company, New York, Chap 15: p. 317
E. How Does a Business Grow Green?Across the world, corporations and small and medium-sized enterprises are becoming agents of change for sustainability - they acknowledge the importance of these issues and their relevance to business. Eco-efficiency can be good for business and it is becoming a widely held view in the business community that solving environmental and social problems is essential for a company’s future sustainable growth.
How can businesses improve their eco-efficiency?Reduce material intensityReduce energy intensityReduce the dispersion of toxic substancesEnhance recyclabilityMaximize the use of renewablesExtend product durabilityIncrease service intensity
Many actions of this kind can reduce business costs and enhance business performance. The challenge for Governments is to push back the cost-effectiveness frontier for these activities and innovations, so that more of them become profitable and the businesses that engage in them increase their competitiveness.
Aside from making efficiency improvements in existing practices and habits, eco-efficiency also provides the opportunity to stimulate creativity and innovation. Innovation creates new products and new skills, which in turn can open the way towards higher competitiveness, thus to increased market shares, more jobs, economic prosperity and enhanced social well-being. Finding new ways of doing things involves14:
Re-engineering industrial processes to reduce the consumption of resources, reduce pollution and avoid risks, while at the same time saving costs
Cooperating with other companies to find creative ways to “revalorize”, or restore to their original value, industrial by-products; waste from one industrial process can become a valuable input to another company
Redesigning the products
Finding alternative supply and product-value chains
Finding new ways of meeting customer needs (leasing of products)
Finding new partners (NGOs, academic institutions, government agencies etc.)
•••••••
•
•
••••

�9
F. Pro-poor GrowthIt is increasingly being recognized that, by addressing the needs of the poor, a business concept largely known as the “wealth at the base of the pyramid” (lowest income stratum), businesses can tap into vast new markets, while simultaneously benefiting the poor. While most companies currently serve one third of the world’s people in relatively mature markets, business managers are increasingly realizing that the nearly two thirds of the planet’s poor people can become a crucial long-term asset to their success and growth (box 14). This major shift requires considering the poor as business partners and customers.
Box ��: Global Pro-Poor Trends
Global trends are creating a favourable environment for companies to start engaging with the poor:Many companies see a need to break out of mature market sectorsFramework conditions in many developing countries are improvingCommunications are faster and cheaper, making the world a smaller place Public expectations of corporations are changingNew and better partners are availableAid and investment are beginning to reinforce one another
Source: Doing Business with the Poor – A Field Guide (Geneva, World Business Council for Sustainable Development, 2004).
••••••
Achieving environmentally sustainable development requires the implementation of “Pro-Poor” policies, that is, social development considerations must be equally integrated into coherent policy-making alongside environmental concerns. As well as being of value in its own right, pro-poor development can reinforce environmental sustainability by alleviating immediate unsustainable uses of natural resources by increasing the choices available to the poor and empowering them to develop small-scale green business development opportunities (box 15).
Box ��: Examples of Pro-Poor Opportunities
Green Business Growth to Help Change the Lives of the PoorApproximately 2 billion people, one third of humanity, still have no access to electricity, and thus rely on fuel-based lighting, a dangerous alternative of last resort that is unhealthy, expensive and offers very poor levels of illumination. This lack of light makes it difficult to perform most evening activities, including studying by children and adults alike and therefore represents a significant barrier to human development.
White light-emitting diodes combined with solar photovoltaic (and other sustainable sources of energy) technology has been recognized as an exciting solution to providing clean, sustainable and affordable light to thousands of non-electrified homes around the world while contributing to poverty reduction. Solid state lighting (SSL) technologies are environmentally friendly, economically viable, socially appropriate and have significant advantages over conventional lighting sources.

�0
Continued from Box 13
The recent emergence of new technologies, such as the above-mentioned systems, offers an economically viable solution for rural electrification and represents a business opportunity. With enabling policies, profit-seeking private firms can participate in rural electrification by applying innovative light-emitting diode systems. Source: www.lutw.org/index.html
Biofuel in ThailandThe introduction of local resources into fuel production such as biofuel has the potential to contribute to the reduction of CO2 emissions and decrease fuel costs in agricultural production and transportation as well.
In 2001, Bang Chak Petroleum Co. and PTT Public Co. started a pilot project on gasohol, using ethanol produced by three pilot distilling plants. In December 2003, Bang Chak Petroleum Co. put “Gasohol 95” on the market through its 99 fuel stations in Bangkok. “Gasohol 95” received a good response from car drivers as it costs 0.5 baht/litre less than 95 octane petrol, which is regularly used in most cars.
Local communities in Thailand also contribute to the development of biofuel. Biodiesel (diesel fuel + vegetable oil) is produced in the countryside as a “rural intelligence” product with a different formula and different materials being utilized from area to area. Its main purpose is to help the local community to use low-cost fuel in farm engines, farm tractors and diesel engine trucks.Source: Asia-Pacific Forum for Environment and Development (APFED). Final Report: Paradigm Shift towards Sustainability for Asia and the Pacific – Turning Challenges into Opportunities (Tokyo, APFED, 2004), p. 100.
Lekhani Paper and Power ProjectHome Employment and Lighting Package (HELP™) Program’s “Paper & Power” Project in Lekhani, Nepal is targeted to uplift the grass root rural poor through Income Generating options in the village level. The HELP™/ “Paper & Power” project provides the villagers with Solar Home Systems as a means of Energy for lighting their homes while removing socio-economic barriers, reducing implementation costs and at the same time improving their livelihoods. The project also helps them with their cash economy and encourages them to use their skills to produce paper and paper products using Daphne bholua (lokta) and other locally available resources such as, Straw (Paral), Agave Americana (Ketuke), Hemp (Gaza), Sabai Grass (Babiyo), Khanyu, and bamboo, in order to pay the system cost, which they get installed at their houses during the project period. The program not only provides a means to pay for the system cost but also becomes a new source of revenue in the family, which they can use to strengthen and uplift their lives. The project is being co-funded by the UNDP Global Environment Facility Small Grants Progamme and private business. Source: Based on the description of the project on www.hlf.org.np/lekhani.htm
Integrating social development into environmentally sustainable economic growth can entail a diverse range of actions and processes that include, for example, supporting positive rather than perverse incentives, focussing on community-level concerns and improving opportunities for the poor to create and access developing environmental markets.

��
G. Green Business Growth ToolsThere are now a variety of business tools that can help a company to protect the environment and acquire good social standing. In general, the economic benefits are also substantial since they can help to generate a competitive advantage; facilitate new market access; and develop and improve a company’s public image and worker satisfaction. Some such tools are briefly described below.
1. Green Buildings Rating Systems
“The rising concentration of humanity in cities and towns means the world will not achieve the Millennium Development Goals unless environmental planning is incorporated into all aspects of urban management. Creating environmentally friendly cities is an admittedly big challenge, but the technologies and expertise we need already exist. Clean transport, energy-efficient buildings, safe sanitation and economical water use are possible now, not just in the future, often in a manner that is affordable for all.”
Kofi Annan. World Environment Day 2005. http://hq.unep.org/wed/2005/pdfs/BOOKlet.pdf
With nearly half of humanity now living in cities, buildings are increasingly significant players for Green Growth strategies. High-rise buildings are soaring up all over Asia, yet they are a major source of energy and material resource consumption. They also add pressures to the environment through discharge of heat and pollution emitted through their heating and cooling systems.
Several countries in the region have already established green building rating systems, which assess and rate buildings according to their environmental impact and performance, to provide incentives for architects and engineers to build eco-efficient buildings15 (figures 9 and 10):
Green Star Environmental Rating Method in Australia
Green Building Rating System in the Republic of Korea
Japan Comprehensive Assessment System for Building Environment Efficiency (Casbee)
Energy Smart Office scheme in Singapore
Did you know?
The National Library Building in Singapore, designed by the Malaysian architect Dr. Kenneth Yeang, is a flagship of green-building design in Asia, and was recently awarded the Green Platinum Award, the highest distinction in green and sustainable building by the Government of Singapore.
••••

�2
Figure 9: An Illustration of Green Buildings
Source: Singapore Government presentation, slide 21, 2005, from www.nea.gov.sg/cms/sei/PSS13slides.pdf
Figure �0: Study of Rooftop Gardens in Singapore and Study of Urban Island Heat Effect
Study of rooftop gardens in Singapore
Source: Singapore Government presentation, slide 41, 2005, from www.nea.gov.sg/cms/sei/PSS13slides.pdf
Study of urban island heat
Source: Singapore Government presentation, slide 42, 2005, from www.nea.gov.sg/cms/sei/PSS13slides.pdf

��
2. Environmental Certification Schemes
ISO 14001, the international standard that defines the criteria for environmental management systems and offers certification, has gained much ground, particularly in Japan which registered over 13,000 certifications in 2003 alone (figures 11 and 12).
Figure ��: ISO ��00� Certifications
0
5,000
10,000
15,000
20,000
Num
ber o
f ISO
Cer
ti�ca
tions
ESCAP Region
East and North-East AsiaCentral Asia
South-East Asia
South Asia
Paci�c
1995 1996 1997 1998 1999 2000 2001 2002
Source: UNESCAP, State of the Environment, 2006
Figure �2: ISO ��00� System
Policy
ManagementReview
Planning
Checking Operations
Aspects/ImpactsObjectives/TargetsMgment Prog
Environmental Control ProceduresInspections
Performance MeasurementAudits
Corrective & Preventive Action
ContinualImprovement
Corporate Policy
Source: Singapore Government presentation, slide 30, 2005, from www.new.gov.sg/cms/sei/PSS13slides.pdf
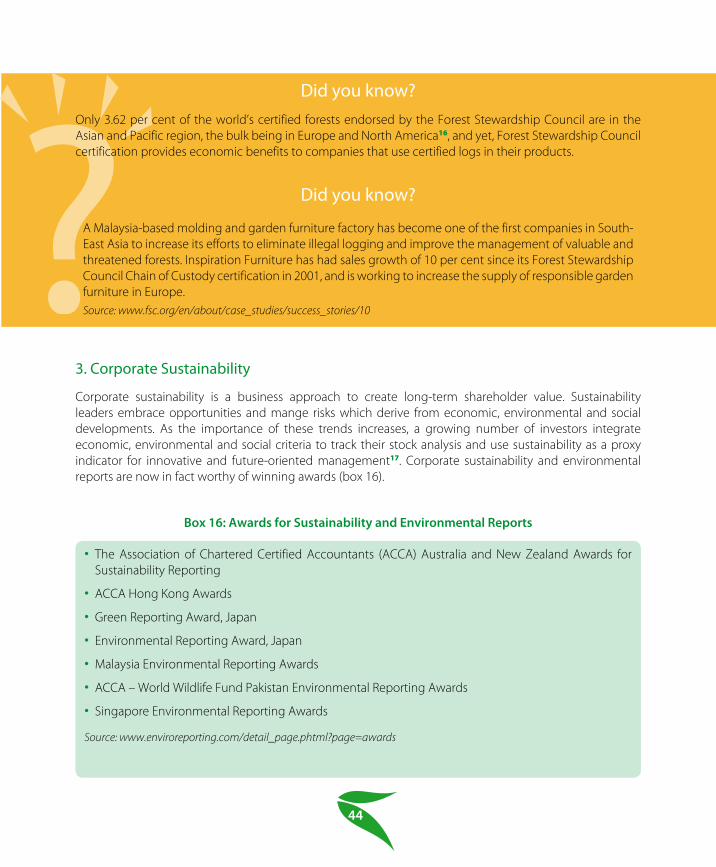
��
Did you know?Only 3.62 per cent of the world’s certified forests endorsed by the Forest Stewardship Council are in the Asian and Pacific region, the bulk being in Europe and North America16, and yet, Forest Stewardship Council certification provides economic benefits to companies that use certified logs in their products.
Did you know?
A Malaysia-based molding and garden furniture factory has become one of the first companies in South-East Asia to increase its efforts to eliminate illegal logging and improve the management of valuable and threatened forests. Inspiration Furniture has had sales growth of 10 per cent since its Forest Stewardship Council Chain of Custody certification in 2001, and is working to increase the supply of responsible garden furniture in Europe. Source: www.fsc.org/en/about/case_studies/success_stories/10
3. Corporate Sustainability
Corporate sustainability is a business approach to create long-term shareholder value. Sustainability leaders embrace opportunities and mange risks which derive from economic, environmental and social developments. As the importance of these trends increases, a growing number of investors integrate economic, environmental and social criteria to track their stock analysis and use sustainability as a proxy indicator for innovative and future-oriented management17. Corporate sustainability and environmental reports are now in fact worthy of winning awards (box 16).
Box ��: Awards for Sustainability and Environmental Reports
The Association of Chartered Certified Accountants (ACCA) Australia and New Zealand Awards for Sustainability Reporting
ACCA Hong Kong Awards
Green Reporting Award, Japan
Environmental Reporting Award, Japan
Malaysia Environmental Reporting Awards
ACCA – World Wildlife Fund Pakistan Environmental Reporting Awards
Singapore Environmental Reporting Awards
Source: www.enviroreporting.com/detail_page.phtml?page=awards
•
••••••

��
4. Dow Jones Sustainability Index18
Launched in 1999, the Dow Jones Sustainability Indexes track the financial performance of the leading sustainability-driven companies worldwide. In cooperation with Dow Jones Indexes, STOXX Limited and the SAM Group, the indexes provide asset managers with reliable and objective benchmarks to manage sustainability portfolios. The Dow Jones Sustainability World Indexes cover the top 10 per cent of the largest 2,500 companies in the Dow Jones World Index in terms of economic, environmental and social criteria (figure 13).
Figure ��: Dow Jones Sustainability Index assets and licences
55
Num
ber o
f DJS
I lic
ence
s so
ld
3000
2500
2000
1500
1000
500
0
50454035302520151050
1999
Number of DJSI licences sold Assets based on DJSI (€m)
Ass
ets
base
d on
DJS
I (€m
)
2000 2001 2002 2003 2004Sep
DecMar
JunSep
DecMar
JunSep
DecMar
JunSep
DecMar
JunSep
DecMar
Jun
Source: DJSI (2003)

��
Part IV: Closing Thoughts
© Ruedee Arunkhajohnsak

��
A. The Globalization FactorGrowth and environmental sustainability can work hand in hand through import and export processes that increase market access for developing country exporters to external markets while simultaneously improving domestic sustainability.
In recent years, the fast economic growth experienced by the region has been driven primarily by exports. The growing production needed to fuel a mounting flow of exports has significantly increased the pressure on the environmental carrying capacity of countries in the region. Therefore, while there is a need to promote trade and enhance export competitiveness in order to maintain economic growth, a shift to more environmentally sustainable production patterns has to take place in order to make this growth sustainable.
At the same time, globalization, with its international flows of capital, labour and technology, has increased the opportunities for a shift towards environmentally sustainable economic growth or “green growth”. For example, through easier sharing and transfer of knowledge and technologies, there are now potential new win-win alternatives to the traditional trade-offs between growth and environmental sustainability.
The trade and environment issues of concern to developing countries can be divided into two categories. The first concerns issues associated with trade flows out of developing countries through the production of goods for export. The second concerns issues associated with trade flows into developing countries through importation.
Frequently, goods produced in developing countries do not adhere to the product standards and process and production methods imposed by developed countries. This creates two costs to developing countries. These costs are:
The potential economic gains of greater market access to developed country markets are lost
Developing countries absorb the environmental cost of environmentally unsustainable and hazardous process and production methods
The import of products into developing countries has the following distinct environmental impacts:
The import into developing countries of products that would not be accepted in developed countries such as second hand waste, hazardous materials and low-quality products that have a negative impact on the environment and human health
The import of certain types of products can have a negative impact on environmental sustainability in developing countries, including through their impact on consumption patterns.
The Green Growth approach seeks to create an economic framework which opens up increased opportunities for maximizing the benefits of globalization, such as sharing and transferring knowledge and technologies for eco-efficient production processes, for renewable resource use and for integrated natural resources management as well as for creating new job opportunities. It also advocates eco-efficient and resource-saving economic and production activities based on the full life cycle analysis of production and consumption processes, in which more efficient and less materials-intensive production is cost-effective,
••
•
•

�8
reduces emissions and creates new job opportunities. By this means the Green Growth approach attempts to enhance the competitive edge and advantages of the countries in the region on the world trade market, which currently dominates their export-driven economic development.
Despite the social, environmental and economic problems looming around the corner, inspiration for sustainability must be sought in the fact that humanity has, over the course of its history, made phenomenal progress in many respects. For instance in the past 50 years, India has enjoyed a green revolution and is now self-sufficient in food, the HIV infection rate in Uganda is decreasing, smallpox has been eradicated worldwide, wind and solar power are among the fastest growing industries in the world, the quantity of ozone-depleting substances pumped into the atmosphere has significantly fallen as a result of the Montreal Protocol on Substances that Deplete the Ozone Layer as an enforcement mechanism to the Vienna Convention for the Protection of the Ozone Layer, some pioneering cities have overcome severe pollution problems, and so much more progress is taking place in unexpected places. This progress is not a chance occurrence but the fruit of hard work, commitment, entrepreneurial innovation, human potential and, above all, is translated into public policy and grass-roots action. If evolution is all about finding the best strategies for survival, then we are at a unique point in history, where we are able to make so much more possible for the planet and ourselves. We are richer, more knowledgeable and have more technologies than any other generation in history. More than ever, we can right the wrongs of the past.
No doubt, globalization has brought us closer together. We are now connected in ways that only a few generations back would have seemed to be similar to witchcraft, the impacts of which we can barely grasp nowadays. The impacts of global climate change are already noticeable and providing serious challenges for food production, health and human security. In the Asiab and Pacific region, facing ever-increasing demands for food, water, shelter, sanitation, energy, health services and economic and human security, how then will we cope with all these added pressures? How will we meet the difficult global challenges before us, while simultaneously improving people’s lives and conserving our natural resources?
“We have the capacity and ability to create a remarkably different economy, one that can restore ecosystems and protect the environment while bringing forth innovation, prosperity, meaningful work, and true security. The restorative economy unites ecology and commerce into one sustainable act of production and distribution that mimics and enhances natural processes”. Paul Hawken
Certainly environmentally sustainable economic growth strategies will be crucial to implementing sustainable development and to fostering sustained economic growth for this region. Were the ESCAP members and associate members to seize the Green Growth opportunity, it could be most rewarding for our people and provide our economies with vast opportunities for growth. The key question is: Do we have the collective will to take on the challenge?
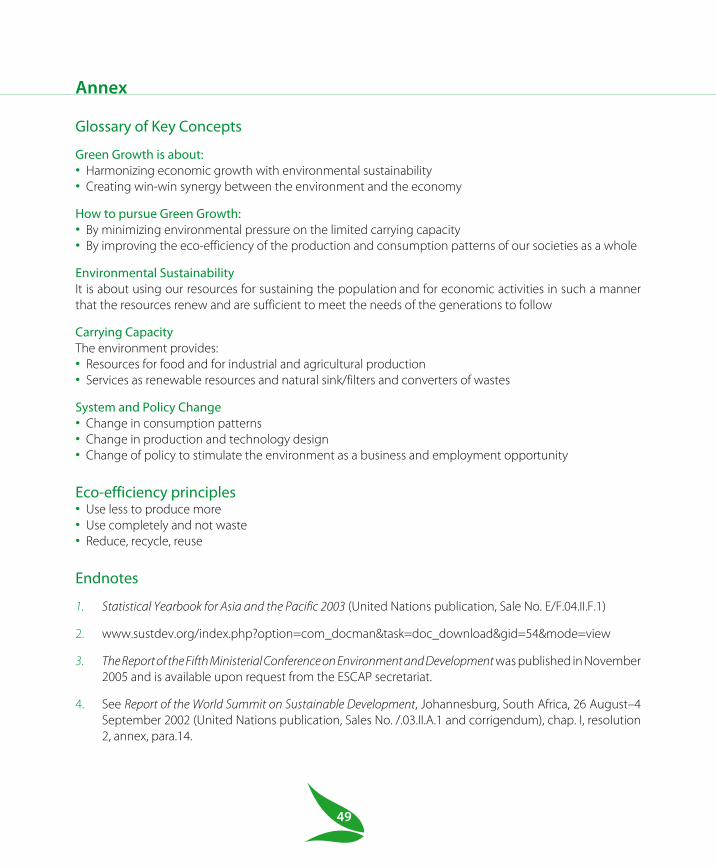
�9
Annex
Glossary of Key Concepts
Green Growth is about:Harmonizing economic growth with environmental sustainabilityCreating win-win synergy between the environment and the economy
How to pursue Green Growth:By minimizing environmental pressure on the limited carrying capacityBy improving the eco-efficiency of the production and consumption patterns of our societies as a whole
Environmental SustainabilityIt is about using our resources for sustaining the population and for economic activities in such a manner that the resources renew and are sufficient to meet the needs of the generations to follow
Carrying CapacityThe environment provides:
Resources for food and for industrial and agricultural productionServices as renewable resources and natural sink/filters and converters of wastes
System and Policy ChangeChange in consumption patternsChange in production and technology designChange of policy to stimulate the environment as a business and employment opportunity
Eco-efficiency principlesUse less to produce moreUse completely and not wasteReduce, recycle, reuse
Endnotes
Statistical Yearbook for Asia and the Pacific 2003 (United Nations publication, Sale No. E/F.04.II.F.1)
www.sustdev.org/index.php?option=com_docman&task=doc_download&gid=54&mode=view
The Report of the Fifth Ministerial Conference on Environment and Development was published in November 2005 and is available upon request from the ESCAP secretariat.
See Report of the World Summit on Sustainable Development, Johannesburg, South Africa, 26 August–4 September 2002 (United Nations publication, Sales No. /.03.II.A.1 and corrigendum), chap. I, resolution 2, annex, para.14.
••
••
••
•••
•••
1.
2.
3.
4.

�0
Paul Ekins, Economic Growth and Environmental Sustainability: The Prospects for Green Growth (New York, Routledge, 2000), p. 317.
Friedrich Schmidt-Bleek, Factor 10 Manifesto, January 2000
World Commission on Environment and Development (Brundtland Commission), Our Common Future, Oxford, Oxford University Press, 1987.
See www.uneptie.org/pc/cp/library/catalogue/regional_reports.htm
Adapted from Paul Ekins. (2000). Economic Growth and Environmental Sustainability (London, Routledge 2000), pp. 56-58.
Paul Ekins “Resource Productivity, Eco-efficiency, Green Growth Part II: Green Tax and Budget Reform”, A Presentation to the UNESCAP Regional Policy Dialogue ‘Towards Green Growth in Asia and the Pacific: Eco-efficiency Through Green Tax and Budget Reform’ Held in Seoul, Republic of Korea, 8-9 November 2005.
World Commission on Environment and Development, op. cit.
Hermien Roosita “Public Disclosure System as an Effective Tool for Pollution Control: The Implementation of PROPER in Indonesia” , Available at http://66.102.7.104/search?q=cache:DkqfFNGjwXEJ:www.oecd.org/dataoecd/18/62/34079500.ppt+proper+indonesia&hl=en
Magda Lovei “Green Growth Through Green Accounting and Policy Reform, World Bank”, A Presentation at the First Regional Policy Dialogue: Towards Green Growth in Asia and the Pacific: Eco-efficiency Through Green Tax and Budget Reform, Held at Seoul, Republic of Korea, 8-9 November 2005.
Adapted from: Eco-Efficiency: Creating More Value with Less Impact (Geneva, World Business Council for Sustainable Development, 2000).
www.nea.gov.sg/cms/sei/PSS13slides.pdf
www.certified-forests.org/pp_slides/1
www.sustainability-indexes.com/htmle/other/faq.html
Results of the Dow Jones Sustainability Index Review; Press Release, Zurich 2 September 2004, www.sustainability-indexes.com
5.
6.
7.
8.
9.
10.
11.
12.
13.
14.
15.
16.
17.
18.

© Ruedee Arunkhajohnsak
Printed in Bangkok
March 2006
United Nations publication
Sale No. E.06.II.F.16
Copyright©United Nations 2006
ISBN: 92-1-120469-0