growth and uncertainty - assets.kpmg · change, uncertainty, and disruption are rife across the...
TRANSCRIPT

Growth and uncertaintyHighs and lows in the Aerospace and Defense sectors
kpmg.com

Change, uncertainty, and disruption are rife across the aerospace and defense (A&D) sectors in the United States and around the world. A massive and fundamental transformation is underway and—when the dust starts to settle in the next 5 to 10 years—it seems clear that the A&D sectors will be significantly different than they are today.Navigating through this complexity will not be easy for most A&D players and suppliers. For some, the outcome may be an exit from the market. But for others—particularly those able to identify the important trends and then respond with agility and boldness—this era of change and disruption will create massive opportunities. That is why we have created this report. By sharing our experience, key data points, and emerging trends, we hope to raise awareness of the new opportunities and risks at play in today’s marketplace. And we hope to help A&D participants think differently about their organization’s future. What is clear from this report is that the world is rapidly and fundamentally changing. Take, for example, the notable shift by both aerospace and defense organizations towards the East where rising air traffic demand and the globalization of business is capturing the attention of the aerospace sector, while unstable U.S. defense budgets and growing uncertainty in the South China Sea are drawing the eyes of the major defense players and their suppliers. Look deeper, however, and it quickly becomes apparent that the shift in Western original equipment manufacturers (OEMs) and suppliers towards the East may only be a short-term phenomenon—at least if the
governments in the East get their way. India is working to develop a national capability in space, ship building, aerospace component manufacturing and cyber. Japan is on the cusp of launching their own indigenous aerospace capability beginning with the recent launch of the Mitsubishi Regional Jet (MRJ) and HondaJet and, eventually, leading to large commercial planes and fighter jets. Additionally, China is working hard to create their own capabilities across a variety of A&D segments, most notably to enter the single aisle commercial jet market with the ARJ21 and C919.1 Similar disruption and counter-disruption is also being catalyzed by technology and innovation with new start-ups and technology players rapidly taking the competitive advantage away from traditional A&D stalwarts. At the same time, however, many of these organizations are also quickly integrating—or being acquired—into more traditional A&D organizations as players vie to offer new capabilities to their government clients. Some consolidation is underway but—for the most part—spin-offs, acquisitions and mergers have tended to be little more than a shifting of the deck chairs.What is clear is that the changes now underway across both the aerospace and the defense sectors are not short-term or cyclical trends. Indeed, they are rapidly changing the very dynamics and fundamentals of the global A&D sector. On behalf of KPMG’s network of A&D professionals, we hope that this report helps executives, investors, and government decision makers take a different view of this new environment and create new opportunities to help the sectors grow.
Foreword
1 http://www.theengineer.co.uk/china-enters-single-aisle-aircraft-market-with-rollout-of-c919/
Doug Gates Global Head of Aerospace and Defense KPMG LLP
© 2016 KPMG International Cooperation (“KPMG International”). KPMG International provides no client services and is a Swiss entity with which the independent member firms of KPMG network are affiliated. NDPPS 529117

Table of contents
A&D industry overview 3
Clear skies and smooth landings The aerospace sector enjoys strong tailwinds 4
Facing a new threat environment The defense sector responds to market disruption 6
Focus on the aerospace sector 9
A closer look Segment analysis 12
Focus on the defense sector 23
A closer look U.S. domestic segment analysis 26
Spotlight on select markets 34
About KPMG’s A&D practice 39
Current industrial manufacturing thought leadership 40
© 2016 KPMG International Cooperation (“KPMG International”). KPMG International provides no client services and is a Swiss entity with which the independent member firms of KPMG network are affiliated. NDPPS 529117

© 2
016
KP
MG
LLP
, a D
elaw
are
limite
d lia
bilit
y pa
rtne
rshi
p an
d th
e U
.S. m
embe
r firm
of t
he K
PM
G n
etw
ork
of in
depe
nden
t m
embe
r firm
s af
filia
ted
with
KP
MG
Inte
rnat
iona
l Coo
pera
tive
(“K
PM
G In
tern
atio
nal”
), a
Swis
s en
tity.
ND
PP
S 5
2911
7©
201
6 K
PM
G L
LP, a
Del
awar
e lim
ited
liabi
lity
part
ners
hip
and
the
U.S
. mem
ber f
irm o
f the
KP
MG
net
wor
k of
inde
pend
ent
mem
ber f
irms
affil
iate
d w
ith K
PM
G In
tern
atio
nal C
oope
rativ
e (“
KP
MG
Inte
rnat
iona
l”),
a Sw
iss
entit
y. N
DP
PS
529
117

A&D industry overview
© 2
016
KP
MG
LLP
, a D
elaw
are
limite
d lia
bilit
y pa
rtne
rshi
p an
d th
e U
.S. m
embe
r firm
of t
he K
PM
G n
etw
ork
of in
depe
nden
t m
embe
r firm
s af
filia
ted
with
KP
MG
Inte
rnat
iona
l Coo
pera
tive
(“K
PM
G In
tern
atio
nal”
), a
Swis
s en
tity.
ND
PP
S 5
2911
7
Growth and uncertainty 3

Clear skies and smooth landings
Few industry sectors are as sensitive to the macroeconomic environment as the aerospace sector. When the economy sniffles, the aerospace sector is often the first to catch the cold. And when the recovery is underway, it is often the aerospace sector that is the first to leap out ahead. Indeed, many economic analysts see the aerospace sector as a reliable bellwether for the wider global economy.
Demand in the aerospace industry has increased sharply since the recession ended. New orders for the 5 years ended in 2015 are up 64 percent compared to the pre-recession period of 2003-2007. These tailwinds are driving steady demand and higher sales and profits. This, in turn, is attracting investment from outside the industry and contributing to higher valuations.
The fact that both U.S. and global GDP are experiencing growth is clearly a positive sign. In the United States, GDP growth has been positive for nearly 6 years and, while global growth has slowed somewhat on the back of slower growth in key markets such as China and Brazil, global GDP is expected to expand at a modest pace over the near-term.2 Recent signs of a world economic slowdown can be seen in the global purchasing managers indexes, compiled by JPMorgan. The February 2016 readings showed global manufacturing in a slight contraction. But the larger service sector index was still expanding, if only slowly, and that uptrend will keep total global GDP growth positive.
While the fall in commodity prices has triggered a so-called manufacturing recession felt the world over, aerospace and automobiles are two sectors that continue to do well. In the United States, 72 consecutive months
of job growth buttresses consumer spending in goods and services. When coupled with moderate inflation and low interest rates, this has given a solid underpinning to the housing market as well. KPMG forecasts that the U.S. is likely to continue to see modest yet steady expansion in GDP of 2.0-2.5 percent for the next couple of years.3
Most readers will already recognize the importance of GDP growth on the aerospace industry. On average, each percentage point increase in real GDP roughly translates into a 2 percentage point increase in growth of passenger air travel. Growth in air travel drives new commercial aircraft orders which, in turn, drive growth across the sector.3
Fig1
Forecast
-6.00
-4.00
-2.00
0.00
2.00
4.00
6.00
8.00
10.00
2000
2001
2002
2003
2004
2005
2006
2007
2008
2009
2010
2011
2012
2013
2014
2015
2016
2017
2018
2019
2020
Global GDP (Annual % Change)
Emerging Economies World Advanced Economies
Source: KPMG Economics / IMF / Haver Analytics
The aerospace sector enjoys strong tailwindsWhile the long-term outlook for airlines remains robust, recent record growth is likely to slow as the aerospace industry weathers a soft patch driven by a cyclical slowdown in Asia and other key emerging markets. Data from the February 2016 Singapore Air Show indicate softer orders and a slight increase in delivery deferrals. Nevertheless, general macroeconomic drivers are stable in the United States. Meanwhile, structural growth in the emerging markets is on a positive long-term trajectory as a growing middle class increases demand for air travel.
AEROSPACE: OVERVIEW
2 http://www.imf.org/external/pubs/ft/weo/2016/update/01/pdf/0116.pdf 3 Haver Analytics, Markit, U.S. Bureau of Labor Statistics, KPMG Economics
© 2
016
KP
MG
Inte
rnat
iona
l Coo
pera
tion
(“K
PM
G In
tern
atio
nal”
). K
PM
G In
tern
atio
nal p
rovi
des
no c
lient
ser
vice
s an
d is
a S
wis
s en
tity
with
whi
ch th
e in
depe
nden
t mem
ber f
irms
of K
PM
G n
etw
ork
are
affil
iate
d. N
DP
PS
529
117

Growth and uncertainty 5
Strong international demand signals
Within many developing economies, demand for aircraft has grown much faster than the slow and steady developed economies. Many emerging markets have been growing at rates of between 5-10 percent over the past 5 years. As we show in Figure 3, as GDP per capita grows, fleet size per capita rises. Today, it is estimated that just one-fifth of the emerging market population takes at least one flight per year; by 2034, that number is expected to more than triple as per capita GDP rises, bringing total passenger traffic up to around 6.7 billion passengers per year.
Source: EIU Global Forecasting Service
Fig2
Avg. 2.0x
2.9% 4.
1%
3.7% 4.1%
3.9%
1.3%
-2.3
%
4.0%
2.6%
2.2%
2.2% 2.8%
2.6%
-2.6
%
14.9
%
8.9%
6.9% 8.
0%
2.4%
-1.2
%
8.0%
6.3%
5.3% 5.7%
6.0% 6.5%
(0.9)
3.7
2.4
1.7
2.0 1.8
0.5
2.0 2.4 2.4
2.6
2.1
2.5
03 04 05 06 07 08 09 10 11 12 13 14 15
Real GDP growth % RPM Growth %
Multiple (RPM / Real GDP)
Global Real GDP and RPM Growth Comparison
Actual
Global demand for air travel (generally measured as “Revenue Passenger Mile” or RPM) grew by 6.5 percent between 2014 and 2015, driven by above-average growth rates due to lower fares (from declines in fuel prices) and higher growth in the Middle East (with expectations for 10.5 percent growth) and Asia Pacific (with 8.2 percent growth).4 This global growth trend seems set to continue. In fact, over the next 20 years, global RPM is expected to grow by 4.6 percent per annum. With above-average growth of 5.5 percent over 20 years expected in the emerging markets (led by the Middle East with 6.2 percent, Asia Pacific with 6.1 percent and Latin America with 6 percent), these regions should jointly secure more than half of the world’s total air traffic demand by 2034, up from 40 percent today.5
One look at relative fleet density across the BRIC countries (Brazil, Russia, India and China) illustrates the growth potential pent up within the emerging markets; relative to a mature market like the United States, many of the fastest growing emerging markets (by GDP) boast very low commercial aircraft fleet density (aircraft per capita).6 As such, these markets are forecast to drive a larger share of the expected growth in air travel driven by the globalization of businesses and higher proportions of personal discretionary income from the expanding middle class.
Fig3
Emerging Markets Have Room to Grow Fleets Per Capita
Australia
Brazil ChileChina
IndiaIndonesia
Malaysia
Mexico
Philippines
Qatar
Russia
South AfricaTurkey
United Arab EmiratesUnited Kingdom
United States
Euozone
y = 1E+06x + 11980R² = 0.6788
$0
$20,000
$40,000
$60,000
$80,000
$100,000
0.00000 0.01000 0.02000 0.03000 0.04000 0.05000 0.06000 0.07000
Per
Cap
ita G
DP
(Cur
rent
US
D$)
Airplanes in service per 1000 population
Singapore
Source: Ascend data 2016
Continued—yet uneven—growthSupported by strong fundamentals and favorable underlying economic drivers, the aerospace industry has enjoyed a period of overall profit growth. The profit pool jumped 20 percent between 2013 and 2014 (from USD31.9 billion to USD38.4 billion), largely driven by the renewed focus on production ramp-up (to meet the existing record backlog) and product portfolio reengineering by major players (often through incremental development and M&A).7
Since the recession ended in 2009, overall margins have also improved by almost 3 percentage points. Margins surpassed their pre-recession levels in 2010 and—given the continued boom in commercial aviation, higher delivery rates for new aircraft, larger fleet sizes, and better cost controls—margins look set to remain above the pre-recession levels for the next few years.
However, not all aerospace market segments are enjoying the same levels of growth and profitability. Rising GDP and airline traffic have driven up demand for new aircraft which, in turn, is driving growth across the supply base. But demand for business jets and freighters continues to be slow, creating challenges and increased competition within those sectors. Our experience and data suggests that the aftermarket and MRO (maintenance and repair outsourcing) segment, on the other hand, will face short-term challenges but can look forward to modest levels of long-term growth.
Global Aerospace Industry Sales and EBIT MarginsFig4
Actual
Source: Alix Partners, Bloomberg, Aerospace Industries Association and CSI Market, 2015
214 222 219 219 244 276 298 319
10.0% 10.1%
8.2%
10.6% 10.6% 10.4% 10.7%12.0%
0%
2%
4%
6%
8%
10%
12%
14%
2007 2008 2009 2010 2011 2012 2013 2014
‘09 – ’14 CAGR – Sales 7.8%; EBIT: 16.5%
AEROSPACE: OVERVIEW
4 IATA Press Release, February 05, 20155 Airbus Global Market Forecast 2015-20346 Boeing Current Market Outlook 2015
7 Alix Partners, Bloomberg, Aerospace Industries Association and CSI Market
© 2
016
KP
MG
Inte
rnat
iona
l Coo
pera
tion
(“K
PM
G In
tern
atio
nal”
). K
PM
G In
tern
atio
nal p
rovi
des
no c
lient
ser
vice
s an
d is
a S
wis
s en
tity
with
whi
ch th
e in
depe
nden
t mem
ber f
irms
of K
PM
G n
etw
ork
are
affil
iate
d. N
DP
PS
529
117

It would not be hyperbole to suggest that the fortunes of the global defense sector largely hang on the level of U.S. defense spending. The United States spent almost USD600 billion on defense in 2014; 34% of the global defense spending, around three times more than the next biggest spender (China) and more than twice as much as the four biggest foreign markets (China, Saudi Arabia, Russia, and the United Kingdom) combined.8
However, the U.S. defense budget has been under significant pressure for some time now. The reality is that—where aerospace tends to grow ahead of the economy—defense budgets tend to lag shifts in the economy. It takes time for economic growth to translate into tax receipts and ultimately into spendable public expenditure. So while the U.S. economy may be growing, overall government budgets (and therefore defense allocations) continue to be depressed.9
At the same time, the government is struggling to balance defense spending against the need to fund and sustain ballooning costs for mandatory program “entitlement” spending in areas such as Social Security, Medicare/Medicaid, and federal debt repayments. Similar scenarios are playing out in most Western nations around the world.
Growth shifts EastIn the United States, the result has been a series of ongoing budget cuts for defense. Starting in 2009/2010 and catalyzed by the drawdown of military activities in the Middle East and the sequestration impact of the Budget Control Act (BCA) of 2011, the U.S. defense sector has seen steady and continuous declines in defense spending as a proportion of GDP. From its peak of 4.7 percent of GDP in 2010, U.S. defense spending declined to 3.5 percent of GDP in 2014; by 2020, it is forecast to be spending just over 2.5 percent. However, despite this continued decline, the United States continues to spend more per year than the next seven biggest defense spenders combined.10
In part due to the changing nature of U.S. commitments around the world and in part due to the ongoing tension and conflict in key regions, the past few years have seen defense budget growth in a number of key international markets such as the Gulf States, Brazil, India, and Russia. And, as a result, most defense contractors and suppliers are now putting significant focus on expanding their footprint and sales into these new and expanding markets.11
Facing a new threat environmentThe defense sector responds to market disruptionAgainst a backdrop of continued budget pressures, significant troop drawdowns, and rapid changes in the way warfare is now conducted, the global defense sector is experiencing significant disruption. And with U.S. Department of Defense (DoD) budget priorities now shifting, the strength of the sector will largely depend on how quickly Western defense contractors respond to the new environment.
DEFENSE: OVERVIEW
8 Trends in World Military Expenditure, 20149 US DoD, and USB Estimates10 CBO – The Budget and Economic Outlook: 2015 to 202511 SIPRI News Release, 15 April, 2015 ©
201
6 K
PM
G In
tern
atio
nal C
oope
ratio
n (“
KP
MG
Inte
rnat
iona
l”).
KP
MG
Inte
rnat
iona
l pro
vide
s no
clie
nt s
ervi
ces
and
is a
Sw
iss
entit
y w
ith w
hich
the
inde
pend
ent m
embe
r firm
s of
KP
MG
net
wor
k ar
e af
filia
ted.
ND
PP
S 5
2911
7

Growth and uncertainty 7
DEFENSE: OVERVIEW
Yet while these markets will certainly provide pockets of growth for defense contractors seeking to offset declining U.S. defense spending, our experience suggests that building foreign revenues will also require participants to spend more time customizing their products to the specific market.
“Each country has different budget constraints, local capabilities, regulations, safety requirements and—often—direct or indirect ‘offset’ requirements with local suppliers and subcontractors,” notes Adil Khan, Principal in the Deal Advisory Practice at KPMG in the U.S. “Many markets are keen to develop their own national defense capabilities and so we are seeing overseas markets become fiercely contested, not just by the established Western defense contractors looking to explore new pockets of growth given their challenging domestic markets, but also increasingly by new market entrants from places like Brazil, Turkey, South Korea, and now Japan who we see leveraging the rapid diffusion of technology and cheap labor to offer affordable ‘good enough’ systems and defense capabilities.”
Fig5
2014 Global Defense Spending: USD1.7tr
trillion U.S.34%
China11%Russia
5%
Middle East ex. Israel & KSA
5%
Saudi Arabia4%
Japan 3%
India 3%
Africa 3%
S. Korea 2%
Rest of world 4%
Brazil 2%
East Asia ex. China, Japan and S. Korea
3%
South America ex. Brazil 2%
W. Europe 16%
Source: S&P Capital IQ “Industry Surveys: Aerospace & Defense” 2013
New priorities emergeAt the same time, the way warfare is conducted is also rapidly shifting, led by new priorities within the DoD. The Cold War-style arms buildups and big-ticket defense platforms that characterized the last half of the 20th century are all but gone; today’s warfare is increasingly being conducted by specialized technology, computer systems, and unmanned vehicles. Big “next-generation” programs like the strategic long-range bomber aside, what the Pentagon really wants today is not more guns
and tanks; what they want is unmanned systems, radar-evading surveillance and advanced fighter planes, highly-sophisticated information technology capabilities, precision missiles, and agile compact combat vehicles.
“We are seeing overseas markets become fiercely contested by new market entrants, who we see leveraging the rapid diffusion of technology and cheap labor to offer affordable systems and defense capabilities.”
Adil Khan, KPMG in the U.S.
Similarly, the drawdown of troop levels in some of the major conflict areas has shifted the DoD’s emphasis away from defense and towards security which, in turn, has focused the priorities towards intelligence services, government services, and surveillance. In this environment, it will be those that are able to display the strongest cybersecurity, IT capabilities, and R&D prowess that will ultimately win.12
Looking to the horizonWhat is clear is that the sector will look very different in 10 years’ time. We expect at least one of the major primes to disappear, likely as part of an offensive move to capture market share but possibly through failure. Significant parts of the supply chain will have consolidated, particularly in those areas related to past defense priorities. And a multitude of new players will be competing, not only in the form of commodity players from the emerging markets but also new nontraditional technology companies and service suppliers.
“There’s going to be a massive change in the defense sector over the next 10 years with regulatory changes, shifts in global capital, new business models, and the rise of new growth markets,” notes Bernard Brown, A&D Leader for KPMG in the U.K. “The shift towards intelligence and IT systems will require significant changes in the supply chain, the business model, and the R&D investment strategy.”
How the current defense contractors and suppliers will respond is the big question. Some are already recognizing these shifts and are taking steps to defend or grow their market position. Others, however, seem happy to ignore the changes in the market. There will be winners and losers.
12 S&P Capital IQ “Industry Surveys: Aerospace & Defense” 2013
© 2
016
KP
MG
Inte
rnat
iona
l Coo
pera
tion
(“K
PM
G In
tern
atio
nal”
). K
PM
G In
tern
atio
nal p
rovi
des
no c
lient
ser
vice
s an
d is
a S
wis
s en
tity
with
whi
ch th
e in
depe
nden
t mem
ber f
irms
of K
PM
G n
etw
ork
are
affil
iate
d. N
DP
PS
529
117

© 2
016
KP
MG
Inte
rnat
iona
l Coo
pera
tion
(“K
PM
G In
tern
atio
nal”
). K
PM
G In
tern
atio
nal p
rovi
des
no c
lient
ser
vice
s an
d is
a S
wis
s en
tity
with
whi
ch th
e in
depe
nden
t mem
ber f
irms
of K
PM
G n
etw
ork
are
affil
iate
d. N
DP
PS
529
117

Focus on the aerospace sector
© 2
016
KP
MG
Inte
rnat
iona
l Coo
pera
tion
(“K
PM
G In
tern
atio
nal”
). K
PM
G In
tern
atio
nal p
rovi
des
no c
lient
ser
vice
s an
d is
a S
wis
s en
tity
with
whi
ch th
e in
depe
nden
t mem
ber f
irms
of K
PM
G n
etw
ork
are
affil
iate
d. N
DP
PS
529
117
Growth and uncertainty 9

Key trends to watchWith OEM order books driving growth in most aerospace segments—from aircraft suppliers and the OEMs themselves, through to lessors and MRO and aviation service providers – the future outlook seems positive for the overall sector. However, we see a number of emerging and evolving trends that will continue to influence growth over the near term.
1. Continued technological advancementRadical improvements in operating efficiency, advanced avionics, and impressive interior cabin designs and noise reduction capabilities are all contributing to increased customer demand. But the wider use of composites, advanced manufacturing technology requirements, and conversion to new electrical systems are also rapidly changing the way aircraft are manufactured and creating challenges across the supply chain as the supply base struggles to make the changes necessary to keep up with OEM demands. New, more advanced platforms are already in production—Airbus’ A320 neo and Boeing’s 787, for example—and more are expected in the near future including the 737 MAX, the 777x, the A330 neo, and Bombardier’s C-Series.7
2. Strong replacement demand bolsters booksWith rapidly aging fleets in the mature markets and growing demand from airlines and fleet operators for next-generation, more fuel-efficient, technologically advanced aircraft, many customers are now focused on replacing their older fleets. In fact, over the next 20 years, it is estimated that around 40 percent of all new aircraft deliveries will be for replacement purposes.7 However, extended periods of depressed fuel prices may encourage aircraft operators to defer replacement of fuel-guzzling aircraft without incurring higher operations costs.
3. Supply and demand balance may be tiltingSome have voiced concerns that the OEMs may be oversupplying the market (deliveries increased by 30 percent between 2009 and 2014), yet evidence suggests that supply and demand may actually be balanced currently. However, with forecasts predicting an increase in build-rates of another 40 percent by 2020, seat deliveries are expected to out-pace demand for airtravel. While the OEMs are expected to deliver seats at a rate of around 8 to 9 percent of the active fleet, airlines are expected to replace about 2½ to 3 percent of their installed capacity while new growth is expected to stay at around 5 percent of capacity (slightly lower than the 5 to 6 percent expected growth
in RPMs, due to efficiency improvements), thereby creating an oversupply of 1-2 percent of active fleet (approximately 300 aircraft or 40-50 thousand seats).13
Global Passenger Aircraft Fleet, 2014 – 2034 (estimate) (Market value: USD5.57 trillion)
Fig6
Source: Boeing 2015 Current Market Outlook, 2015.
Per Boeing, commercial Jet deliveries, including large commercial, regional jets and freighter aircraft, areestimated at 38,050 aircraft with an estimated value of USD 5.6 trillion from 2015-2034,with Asia pacific representing – approximately 38% of the total deliveries1Source: The International Air Transport Association (IATA)
Older, less efficient airplanes will be replaced with moreefficient, newer generation airplanes
1
2014 2034
21,960Growth
58%
16,090 Replacement
42%
5,510Retained fleet
21,6
00
43,560
38,050
We expect Boeing and Airbus to scale back announced build-rates, in particular in the wide-body sector, especially with continued weakness in global economies, low oil prices and a deceleration in global air traffic as the transport market matures.
4. Lower oil prices influencing both demand and growthNot surprisingly, the sustained level of lower oil prices since their collapse in late 2014 has spurred airline profitability but has industry analysts wondering whether continued depressed levels will temper short term replacement demand for next-generation aircraft. However, this has had little impact on the OEM order books, in part because the business case for such investment decisions typically covers a 20- to 30-year horizon and is therefore much more influenced by the long-run expectations for oil. Interestingly, while long-run expectations have fallen dramatically, there have been few signs of its impact on the active fleet. That being said, there have been some signs of airlines engaging in higher utilization of older generation aircraft (primarily in Europe), based on latest airline fleet schedules, as well as some reduction in aircraft retirements/scraps and increases in the number of parked aircraft reentering the active fleet.14 At the same time, it is widely believed that lower oil prices will contribute to higher growth in air traffic as fuel savings translate into lower fares and individuals shift the savings they receive from lower energy costs towards discretionary spend such as leisure travel.
Growing demand for air travel, massive backlogs of new aircraft orders, and a slowly resurging business jet sector are all contributing to a strong outlook for the aerospace sector overall. But underneath the headline data are signs that the industry is undergoing a shift that will see significant consolidation within areas of the supply base as well as downward pressure on profits as the Original Equipment Manufacturers (OEMs) ramp up production of increasingly advanced platforms.
AEROSPACE: KEY TRENDS
13 Ascend, company reports, and J.P. Morgan estimates14 USB: Aerospace, January 6, 2016 ©
201
6 K
PM
G In
tern
atio
nal C
oope
ratio
n (“
KP
MG
Inte
rnat
iona
l”).
KP
MG
Inte
rnat
iona
l pro
vide
s no
clie
nt s
ervi
ces
and
is a
Sw
iss
entit
y w
ith w
hich
the
inde
pend
ent m
embe
r firm
s of
KP
MG
net
wor
k ar
e af
filia
ted.
ND
PP
S 5
2911
7

Fig7 Nominal Broad Trade-Weighted Exchange Value of the US$
Source: KPMG Economics, Federal Reserve Board, Haver Analytics
1514131211100908070605
127.5
120.0
112.5
105.0
97.5
90.0
127.5
120.0
112.5
105.0
97.5
90.0
5. Continued appreciation of the USD and higher borrowing ratesThe U.S. dollar’s strength is a major consideration for the aerospace outlook. Since June 2014, the dollar has increased 20 percent against the currencies of the U.S.’s major trading partners and has risen more than 50 percent against emerging-market currencies such as Brazil and Russia. In 2016, we expect the Federal Reserve will increase its policy rates by no more than two moves, keeping interest rates still historically low. The gradual pace of Fed hiking should limit further appreciation of the U.S. dollar—although geopolitical events and foreign monetary policy could offset that expectation. Nevertheless, the recent strength of the U.S. dollar will continue to create challenges for non-U.S. players and even small changes in short term rates may dampen demand. The currency challenge may be particularly sharp for developed market carriers who generate sales in local currencies but purchase new aircraft in U.S. dollars, as any appreciation in the U.S. currency will directly impact the affordability of U.S. dollar denominated new aircraft purchases. Given that approximately 34 percent of the combined backlog held by Boeing (26 percent) and Airbus (41 percent) relates to the emerging markets, continued appreciation of the U.S. dollar may impact the strength of the OEMs’ order books.15
The strengthening U.S. dollar is also creating challenges and opportunities for the OEMs. On the one hand, a stronger U.S. dollar could influence airlines’ ability to pay for new aircraft which, in turn, could lead to delays and cancellations. But, as Philippe Balducchi, Head of Airbus Finance Operations noted in an recent interview for this publication, the stronger dollar can also deliver benefits. “We sell our aircraft in U.S. dollars while some of internal costs are in Euros, so the strengthening of the U.S. dollar actually has a strong and positive influence on our financial results,” he noted.
6. Emerging market risk evolvingA note of caution is warranted, especially for regions that have seen growth forecasts downgraded over the past year. Asia, the source of the largest backlog, is a concern.
Changes in China’s growth pattern impacts the region significantly, and the three nations with the largest order books—India (739), Indonesia (568), and Malaysia (398)—are experiencing weaker growth as a result of China’s slowdown. This, combined with excess capacity, is reason for caution. Airbus’ larger market share (71 percent of Asia’s narrow-bodies and 57 percent of Asia’s wide-bodies) makes it the most vulnerable airframer should Asian growth slow further; however, Boeing is not immune as it too has significant exposure to Asia. So while—to date—continued demand for passenger air travel has limited the number of deferrals and cancellations, the region continues to represent a potential risk for the OEMs and their suppliers.16
INSIGHTThe welcome return of the ExIm
bank
By Adil Khan, Principal, Deal Advisory, KPMG in the U.S.
The reauthorization of the Export/Import (ExIm) bank through the U.S. Federal Highway Bill was certainly welcome news to end the year in 2015.
The ExIm bank’s loan guarantees and other financial tools help U.S. aerospace companies generate overseas sales across a range of product areas including commercial aircraft, general aviation, helicopters, space and satellites, and aerospace engines and components. But in June 2015, authorization for the bank was allowed to lapse, creating concern and potential risk for U.S.-based exporters.
With other countries such as Brazil, China, France, Germany, and India offering significant incentives to their countries aerospace and manufacturing industries to support export sales, most U.S. aerospace industry executives view the ExIm bank as critical to delivering a competitive playing field for their products in a global market.
With its reauthorization, the U.S. government has signaled its recognition that the ExIm bank is critical to the viability of an industry that produced a USD63 billion trade surplus for civilian aircraft, engines and parts in 2015 and an estimated USD190 billion in military and civilian total exports.17
AEROSPACE: KEY TRENDS
15 KPMG Economics, Federal Reserve Board, Haver Analytics 16 International Monetary Fund
17 KPMG Economics, U.S. Bureau of Economic Analysis, Haver Analytics
© 2
016
KP
MG
Inte
rnat
iona
l Coo
pera
tion
(“K
PM
G In
tern
atio
nal”
). K
PM
G In
tern
atio
nal p
rovi
des
no c
lient
ser
vice
s an
d is
a S
wis
s en
tity
with
whi
ch th
e in
depe
nden
t mem
ber f
irms
of K
PM
G n
etw
ork
are
affil
iate
d. N
DP
PS
529
117
Growth and uncertainty 11

A closer look
The airline sectorWith global passenger travel increasing and fleet utilization rising quickly, the overall outlook for the airline industry seems strong. Many commercial airlines have benefited from the global recovery since the 2009 recession, and most airlines in North America have emerged from the recession with larger economies of scale, leaner operating structures, and a renewed sense of discipline for capacity growth. In fact, with continued weakness in fuel prices, airline profits were expected to have reached USD50 billion in 2015, an almost 50 percent increase over the previous year.18
Yet while the overall market has grown, competition between carriers has intensified sharply, particularly among European airlines who have struggled to restructure and still face an uphill battle against high regional labor costs. In addition, the continued introduction and expansion of low-cost carriers, not only in Europe but increasingly in the emerging economies along with concern over lower oil prices, if sustained, could drive key players to initiate price wars and relax their capacity discipline which, in turn, could degrade overall industry profitability. However, with
traditional lines between players now blurring (many traditional players now operate their own low-cost carriers while others have adopted their thrifty practices) competition has started to shift away from pricing and towards differentiated service offerings.
At the same time, European and Asian airlines are continuing to feel pressure on their long-haul routes from the growing dominance of the three major carriers based in the Persian Gulf—Etihad Airways, Emirates, and Qatar Airways—who are rapidly expanding their scale and scope.19 This is driving competition not only for passenger traffic but also for new orders from the commercial OEMs; the three Gulf carriers combined account for more than half of the current Airbus A380 order book.20
However, with load factor levels starting to approach their practical ceiling in both the mature and the developing markets, new deliveries and fleet optimization has become a priority. Interestingly, the past few years have brought a shift in purchasing philosophy among airlines that prioritizes route optimization over fleet simplification. So whereas in the past, airlines tended to
Segment analysis
Actual Forecast
2007 2008 2009 2010
510
570
476
564
642706 717 733 727
2011 2012 2013 2014 2015E
Global Commercial Airline Industry – Revenues (USD billions) and Net income (%)
Source: IATA Economics, Industry Financial Forecast, 2015
Fig8
3.9%
0.2%0.6%
4.9%
3.1%2.6%
3.5%
4.6%
6.9%
Global Air Traffic (Demand) vs. Available Seat (Supply)
Source: Jet Information Services and International Air Transport Association, 2015
Fig9
Actual Forecast
17E
0%
10%
20%
30%
40%
50%
60%
70%
80%
90%
-
1,000
2,000
3,000
4,000
5,000
6,000
7,000
8,000
78 80 82 84 86 88 90 92 94 96 98 00 02 04 06 08 10 12 14 16E
Air Traffic, RPK (bn) ASK (bn) Load Factor (%)
RPK
and
ASK
(bn
)
Load Factor %)
AEROSPACE: SEGMENT ANALYSIS
18 IATA Economics, Industry Financial Forecast19 “The Middle East’s 3 best airlines have infuriated their US
competitors”, Business Insider, July 28, 2015
20 J.P. Morgan “All About Aerospace and Defense” Report, January 8, 2015, page 115
© 2
016
KP
MG
Inte
rnat
iona
l Coo
pera
tion
(“K
PM
G In
tern
atio
nal”
). K
PM
G In
tern
atio
nal p
rovi
des
no c
lient
ser
vice
s an
d is
a S
wis
s en
tity
with
whi
ch th
e in
depe
nden
t mem
ber f
irms
of K
PM
G n
etw
ork
are
affil
iate
d. N
DP
PS
529
117
focus on reducing maintenance and operational complexity by locking into just a handful of models (sometimes just one), the industry is increasingly focusing on selecting the right airframe and model to meet their specific route segmentation and fuel efficiency requirements.
For commercial OEMs and the supply base, these trends will have significant implications over the long term. For one, OEMs and their suppliers will need to continue to innovate in their models and designs in order to allow their customers to compete on differentiated service offerings.
Maintaining and funding this pace of innovation, while at the same time managing the steep ramp-up in aircraft build-rates, may well prove to be too much over the long term, particularly for the more fragmented parts of the supply base and those in the highly capital-intensive aerostructure segment. As a result, we expect to see significant consolidation and new partnerships emerge in the supply base as smaller suppliers come together to achieve the scale required to meet the capital, innovation, and production levels required to compete.
The shift towards the developing and emerging markets is also creating some challenges and opportunities for the OEMs and their suppliers. With order books heavily weighted towards these markets, OEMs will need to closely monitor exchange rates and regional GDP growth trends to validate the strength of their order books.
The bigger challenge for manufacturers resulting from these trends is around price competition. Indeed, with airlines diversifying their fleet composition, OEMs are increasingly starting to compete on pricing which, in turn, is putting pressure on prices and margins across the supply base.
The past few years have brought a shift in purchasing philosophy among airlines that prioritizes route optimization over fleet simplification.
The commercial aircraft sectorBolstered by an eight-year backlog of orders and steady macroeconomic indicators, the commercial aircraft sector is continuing to ramp up production. However, there are some signs that the existing Book-to-Bill ratio—a key indicator of the OEMs’ long-term outlook—may have started to decline in 2015, suggesting an impending end to the decade-long upcycle.
In part, this moderation in the ratio reflects somewhat of a normalization after a period of frenzied activity. Over the past decade or so, the Book-to-Bill ratio had stabilized at around 1.4 times.21 But over the past 4 years, it rose dramatically to around 2.0 times (simply put, OEMs were booking twice as many orders as they were able to produce) driven largely by new model introductions, rising air
INSIGHTInfrastructure holding back airline
growth
By Doug Gates, KPMG Global Aerospace and Defense Leader
While the recent economic slowdown somewhat dampened growth, overall air traffic has continued to grow on an annual basis in most market (Brazil being a notable exception). Projections by both Boeing and Airbus suggest that more than 30,000 new aircraft sales will be needed to meet demand over the next 20 years. And much of this growth has been driven by the emerging markets—Asia and the Gulf States in particular. Indeed, by 2034 it is projected that Asia will make up more than 40 percent of the world’s air traffic.
However, to support this continued growth in air traffic, governments will need to place particular focus on ensuring that the required infrastructure in place. China, in its 13th five-year plan, has recognized this and laid out plans to construct more than 58 new airports between now and 2020, bringing its total number of airports to 260.
The other mounting barrier to growth in air travel relates to airspace restrictions that persist in many emerging markets. At the 2015 Dubai Airshow in November, the UAE’s General Civil Aviation Authority (GCAA) released a report that concluded that “The current Middle East airspace structure will be unable to handle the sustained forecasted traffic growth within the UAE.”22 Military restrictions make up much of the problem; estimates suggest that between 40 to 60 percent of Gulf area airspace is reserved for military use.
So while economic growth rates in the emerging markets may suggest a strong growth trajectory for air traffic, much will clearly depend on whether the infrastructure and the airspace will be available to support it.
22 http://www.bbc.com/news/business-34727226
AEROSPACE: SEGMENT ANALYSIS
21 Ascend, company reports, and J.P. Morgan estimates
Growth and uncertainty 13
© 2
016
KP
MG
Inte
rnat
iona
l Coo
pera
tion
(“K
PM
G In
tern
atio
nal”
). K
PM
G In
tern
atio
nal p
rovi
des
no c
lient
ser
vice
s an
d is
a S
wis
s en
tity
with
whi
ch th
e in
depe
nden
t mem
ber f
irms
of K
PM
G n
etw
ork
are
affil
iate
d. N
DP
PS
529
117

travel demand, and access to cheap financing. Now that most airlines and aircraft operators have placed their orders for the foreseeable future, the pace of ordering will likely slow, which will drive down the ratio.
At the same time, the drop in the Book-to-Bill ratio also reflects the increased capacity that is coming on stream as OEMs increase their build rates. In fact, aircraft deliveries have trended higher for more than a decade (bucking the historically cyclical trend of peaks and troughs) and analysts expect this trend to continue as the OEMs further increase their build capacity.23
To a lesser degree, lower oil prices are also influencing the existing Book-to-Bill ratio as expectations for a prolonged period of depressed oil prices leads airlines to rethink the pace and value of their replacement programs. However, as noted earlier, lower oil prices should also lead to increased passenger air traffic which should easily offset any softness created as airlines delay delivery or scale back prospective orders geared towards replacement of their existing fleets.
Much of the expansion in the current order book has been fueled by airlines taking advantage of the historically low cost of credit. Low interest rates have been positive to aircraft financing and lease rates. JPMorgan has estimated that lease rates have declined more than 30 percent thanks to a drop in Libor from mid-5 percent in 2007 to below 1 percent since 2009.24
Given the Federal Reserve increased its policy rate once in December, the big question is whether rising interest rates will negatively impact new and existing orders. We think not, because we expect any rise in U.S. rates will be small and gradual. In addition, it is important to remember aircraft financing is a global market. Any rate-hike move by the Fed will be offset in part by easing actions underway in Europe and Japan.
Borrowing costs are not the only consideration for future demand. Past economic research show that when it comes to making decisions about ordering aircraft, airlines are sensitive to expectations about changes in fuel costs, demand outlook and operating costs.25 To that end, the outlook for economic growth, especially among emerging markets, will be a key determinant. “There are a number of medium-term challenges on the horizon—another recession, slower GDP growth in the emerging markets, lower oil prices and so on—but all evidence suggests that the long-term 30-year view remains extremely positive for the sector,” says Tom Mayor, Principal in the Strategy practice in KPMG in the U.S.
Commodity prices a double-edged swordOn the production side, the aerospace industry has benefitted from the reduction in the cost of raw materials. Although aluminum no longer accounts for the majority of the material used to construct an aircraft, it still accounts for about 20 percent (by weight)26 and airframers have benefitted from the 42 percent drop in aluminum prices since 2011.27 The aerospace industry is also benefiting from the price drop in steel and titanium and composite materials that contain these metals. These cost reductions, along with cheaper energy, have lifted margins.
Cheaper commodities, however, could be a constraining factor on the demand side. Low oil prices in particular might limit orders because airliners may not be in a rush to replace older, less fuel efficient planes when fuel is expected to remain cheap. The outlook is that airlines will replace about 3 percent of their passenger seats each year for the next few years. But analysis by JPMorgan shows the replacement rate slipped to the mid 1-percent range in 1986-1987 when
Large Commercial Aircraft Deliveries by Type, 2000 – 2019 (estimate)
Source: Ascend, company reports, and J.P. Morgan estimates, 2015.
Fig10
ForecastActual
600
651
508
432
465
528 68
9
775
768
856
842
878
951
995
1,00
4
997
1,03
5
1,14
6
1,18
9
1,20
8
194
200
176
154
140 15
2 186 19
7
182 20
5
195
218 31
9
341
377
412
392 39
9
400
410
794 851
684
586
605 68
0
875 97
2
950 1,
061
1,03
7
1,09
6 1,27
0
1,33
6
1,38
1
1,40
9
1,42
7
1,54
5
1,58
9
1,61
8
00 01 02 03 04 05 06 07 08 09 10 11 12 13 14 15 16E
17E
18E
19E
Narrow-body Wide-body
Average Age of the World vs. North America Aircraft Fleet
Source: Flightglobal Ascend Fleets database, 2015.
Fig11
Actual
6
7
8
9
10
11
12
13
14
75 80 85 90 95 00 01 02 03 04 05 06 07 08 09 10 11 12 13 14
Ave
rage
Age
of
Flee
t in
Yea
rs
World Fleet ex- N.A. North American Fleet
Average Age of in-service Fleet
Avg. Yrs. 1975 1985 1995 2005 2010 2012 2013 2014
North America 7.3 11.1 12.5 11.2 12.6 12.8 13.0 13.1
World ex. N.A 6.9 9.8 10.1 10.3 9.5 8.8 8.5 8.5
AEROSPACE: SEGMENT ANALYSIS
25 Gernot Klepper, “Industrial Policy in the Transport Aircraft Industry,” January 1994
26 AlixPartner analysis27 Haver Analytics
23 Ascend, company reports, and J.P. Morgan estimates24 J.P. Morgan, “All about Aerospace/Defense – 2015”
© 2
016
KP
MG
Inte
rnat
iona
l Coo
pera
tion
(“K
PM
G In
tern
atio
nal”
). K
PM
G In
tern
atio
nal p
rovi
des
no c
lient
ser
vice
s an
d is
a S
wis
s en
tity
with
whi
ch th
e in
depe
nden
t mem
ber f
irms
of K
PM
G n
etw
ork
are
affil
iate
d. N
DP
PS
529
117

oil prices dropped sharply. In addition, low oil prices are stressing the finances of oil-producing nations and many of their consumers. Those strains could lead their domestic airlines to delay deliveries.
Overall, most analysts believe that with order backlogs providing visibility to revenue streams for the next 8 years, it is unlikely that valuations of aerospace companies will fall as the Book-to-Bill ratio decreases (as has historically been the case). As Airbus’ Mr. Balducchi notes, the significant OEM backlog allows the manufacturers significant flexibility to respond to shifting demand or unexpected risks. “We purposefully have a level of ‘overbooking’ in our order-book,” he noted. “ ‘Overbooking’ and backlog diversity mitigate risk related to unpredictable events or softness in customer demand; it provides us with the flexibility to properly manage that risk.”
In part, confidence in the OEM order book is due to expectations for continued long-term growth in demand for air travel, which will drive up load factors and force further increases in fleet sizes around the world. It is also supported by the fact that much of North America’s existing installed airline capacity is nearing the end of its economic life cycle and—regardless of fuel prices—will need to be retired. In the current OEM cycle, it is estimated that airlines will retire more than 2 percent of the existing in-service fleet globally, representing between 500 to 600 aircraft or approximately 40 percent of future aircraft deliveries.
Continued technological advancement is also playing a role in driving the order books. And the introduction of revolutionary new airframes and fuel-efficient engine technologies is expected to continue to drive orders from airlines as they sharpen their focus on operational efficiency and lower operating costs.28
While the data seems to indicate fairly clear skies for the sector, no industry is immune to the business cycle. Rising pressure on the supply base—in terms of prices, capabilities, and capacity—combined with the increased dependency and complexity of supply chains could contribute to the risk of program delays. And any further contractions in the global economy (or a prolonged period of lower oil prices) could have a limiting influence on further growth for the sector.
Large Commercial Aircraft Orders by Type, 1984 – 2015Fig12
Source: Ascend, company reports, and J.P. Morgan estimates, 2015.
Actual
427 66
571
459
11,
132
1,73
21,
081
422
462
355
298
634
1,09
61,
029
1,21
286
7 1,13
871
055
153
2 647
2,14
01,
874
2,88
11,
569
573
1,26
92,
529
2,25
23,
150
3,34
62,
068
84 85 86 87 88 89 90 91 92 93 94 95 96 97 98 99 00 01 02 03 04 05 06 07 08 09 10 11 12 13 14 15
Narrowbody Widebody
INSIGHTIs China about to take off?
By David Frey, Partner, KPMG China
The Chinese government is clearly determined to
become more self-sufficient within the aerospace sector. The well-publicized efforts to develop a Chinese domestically manufactured commercial aircraft continue to move ahead. History suggests that when China’s government sets out to achieve a goal, it usually does so (albeit, as in this case, not always on the initial time lines).
What is not yet produced by China’s own production lines, however, will soon be produced in greater volumes by Airbus’ and Boeing’s expanding facilities in China. Announcements of Airbus’ extension of the JV supporting final assembly for the A320 as well as Boeing’s September 2015 announcement of its final assembly plant in China will deepen the companies’—and their suppliers’—presence in the industry’s fastest growing market.
With the deepening of foreign players’ positions in China and the massive projected growth in air travel, China seems set to become a leading manufacturer and purchaser of commercial aircraft over the next few decades.
Given the advantages afforded by the scale of the market, China will likely overtake some of its foreign peers in the development and manufacturing of new aircraft technology. In recent years, the government in China has invested significant resources in the Mass Innovation Campaign, spurring a progressive drive toward advanced manufacturing through integration with increasingly sophisticated information technology platforms. The combination of these efforts—plus production techniques being imported by foreign players—will ultimately provide China with the capabilities and know-how to become a credible competitor on the global aviation stage. The question now seems not to be “if,” but “when”.
AEROSPACE: SEGMENT ANALYSIS
28 IATA Technology Roadmap – June 2013
© 2
016
KP
MG
Inte
rnat
iona
l Coo
pera
tion
(“K
PM
G In
tern
atio
nal”
). K
PM
G In
tern
atio
nal p
rovi
des
no c
lient
ser
vice
s an
d is
a S
wis
s en
tity
with
whi
ch th
e in
depe
nden
t mem
ber f
irms
of K
PM
G n
etw
ork
are
affil
iate
d. N
DP
PS
529
117
Growth and uncertainty 15

Demand growth has also been uneven between the wide-bodied and the narrow-bodied categories, resulting in a state of potential oversupply for some wide-bodied aircraft models even while the narrow-bodied market remains underserved. With the exception of Boeing’s 787 and Airbus’ A350 (both of which have an eight-year backlog of orders) most wide-bodied programs seem to be at risk. With some major programs already being cut (such as Airbus’ A330 program and Boeing’s 777 program) and others facing rising pressure amid softening demand (such as Airbus’ A380), many now expect to see significant consolidation within the supply base serving wide-bodied programs.
However, according to Airbus’ Philippe Balducchi, “We have been very careful to anticipate demand and have been managing our operations accordingly, reducing output and production of the A330 during the transition to the A330neo.”
Regional aircraft sectorWith deliveries up almost 60 percent since the trough of 2012 and a range of new regional aircraft and jet engine technologies now entering the market, it is fairly clear that the regional aircraft sector is in the midst of a new upcycle, albeit a very gradual one. But while this may be true, all signs indicate that going forward, deliveries are likely to either flatten or modestly decline.29
The long-term fundamentals of the sector seem strong and stable. Rising rates of urbanization, expanding globalization of economies and the emergence of hundreds of new “middle-weight” cities in the developing world will almost certainly provide some stability to the regional aircraft sector over the long term. The introduction of new models (such as the E175-E2 and the Sukhoi Superjet), the rise of new competitors (including Mitsubishi (MRJ) and China’s Comac (ARJ21)), and the development of revolutionary new technologies (particularly in engines and aerostructures) should also keep the market buoyant.
Regional Aircraft Deliveries by ManufacturerFig13
Source: Ascend, company reports, and J.P. Morgan estimates, 2015.Note: Excludes E190/195 and CSeries, considered to be Narrow body aircraft, so are excluded
Actual Forecast
77 64 62 56 6041 33
14 2659 54 60 44 54 44 44
106
55 52 7140
2312
2128
63 86 8888
8888 88
58
15
26
3035
3536 65
85
43
69116
109
115
10799 100
103
108101
9994
9090
90226
188
230 236215
171
149 143
172
256271
282261 268
287307
05 06 07 08 09 10 11 12 13 14 15 16E 17E 18E 19E 20E
Bombardier Embraer Other Turboprops
In an interview for this publication, José Antonio Filippo, Executive Vice-President, CFO & Investor Relations at Embraer noted the importance of new model introductions. “We have three new models in development that offer completely new equipment, new engines, new wings, new avionics and new interiors; we’re very much focused on the customer experience and delivery, the effective cost per seat and offering the right size of airplanes to the market,” he noted. “There are, of course, other new entrants in this market and we are living in a very competitive environment, but I am confident that we have the capacity to keep competing and winning campaigns in the market.”
However, despite current backlog levels representing about 6 years of production, the reality is that the regional aircraft sector is widely considered to be nearing its inflection point. The recent growth spurt—fueled almost entirely by U.S. replacement orders booked in 2012—is coming to an end. Build and delivery rates seem set to flatten at around 220 to 250 aircraft (120 to 150 regional jets and around 100 turbo props) per year—significantly below pre-recession levels. In particular, the 20-to-50 seat segment, serving short range low-density routes, continues to be negatively impacted by low fuel prices and airlines shifting towards larger regional jets in an effort to maximize operational efficiency.
“Many of the more profitable regional airlines have tended to stick to a single model fleet and that often means a Boeing 737 or an Airbus A320 family which both offer significant flexibility and capacity for regional airlines,” noted Doug Gates, KPMG’s Global Aerospace and Defense Leader. “So while some regional airlines will certainly be growing, there is doubt as to whether these orders will be for regional aircraft under 125 seats.”
AEROSPACE: SEGMENT ANALYSIS
29 Ascend, Company Reports, and J.P.Morgan estimates
© 2
016
KP
MG
Inte
rnat
iona
l Coo
pera
tion
(“K
PM
G In
tern
atio
nal”
). K
PM
G In
tern
atio
nal p
rovi
des
no c
lient
ser
vice
s an
d is
a S
wis
s en
tity
with
whi
ch th
e in
depe
nden
t mem
ber f
irms
of K
PM
G n
etw
ork
are
affil
iate
d. N
DP
PS
529
117

“Many of the more profitable regional airlines have tended to stick to a single model fleet, which offers significant flexibility and capacity for regional airlines.”
– Doug Gates, Global Aerospace & Defense Leader, KPMG in the U.S.
With oil prices in the USD30 to USD40 range, some airlines have begun slowing down their planned removal of their “up to 50 seat” regional jet fleet. Indeed, some analysts now believe that an extended period of depressed oil prices may actually shift the fleet mix back towards favoring smaller, less economical regional jets or at least defer their retirement.30
In the United States, pilot labor contract restrictions at major airlines (widely known as “scope clauses”) limit regional airlines to an aircraft maximum takeoff weight (MTOW) of no more than 86,000 pounds and 76 seats. With the introduction of new models such as the MRJ90s (designed to have 70 to 90 seats and a starting MTOW of 87,000 pounds) and the E175-E2 (which will be more than 80 seats and a MTOW of 97,700 pounds), OEMs are relying on major U.S. regional operators to successfully negotiate scope cause relief from pilot unions to allow these aircraft to be operated in the United States.31
“We have already seen indications of some relaxation on scope clause restrictions and we expect that to continue and, as it does, open up new opportunities in that market,” noted Mr. Filippo at Embraer.
In contrast, the turboprop segment has experienced fairly steady production rates, partially benefiting from the decline in 50-seat regional jets. In fact, due largely to their higher fuel efficiency on short routes, turboprop production has held steady at above 100 units per year since 2007. Looking ahead, most analysts expect production to remain at around 100 aircraft through 2016, at which point it will likely settle modestly below that level.
What has changed significantly, however, is the division between the market leaders in the turboprop segment—Bombardier’s Q400 and the ATR 72. According to Ascend, ATR’s orders over the 2010–2014 period were almost four times that of Bombardier; ATR is also producing almost five times as many aircraft per year as Bombardier.32
The business jet sectorHaving suffered significantly from both the economic and social impacts of the recent recession, the business jet sector is recovering, albeit gradually. New platforms including Embraer’s Legacy 450/500, Cessna’s Citation Latitude, Dassault’s Falcon 8X, and the HondaJet are catalyzing growth while ongoing demand from the emerging markets and wealthy individuals continues to support the recovery. Total deliveries are expected to rise by more than 40 percent between 2013 and 2017; Bombardier believes the market will be worth some USD650 billion over the next 20 years, with almost 9,500 deliveries.33
Recent data certainly suggests a gradual upturn is underway. The U.S. market—which accounts for around 60 percent of the global fleet—is performing strongly which is driving demand for light and medium jets. The global used inventory, in particular of aircraft 0 to 5 years old, is also
INSIGHTThe sharing economy and business jets
By Tom Mayor, Principal, Strategy, KPMG in the U.S.
As new business models like Uber start to undermine car
ownership models, a similar shift has also been going on in the business jet segment. Largely dominated by fractional ownership clubs and pay-per-use models, the shift towards a “sharing economy” is creating both risks and benefits to business jet manufacturers.
On the one hand, fractional ownership models are making business jets affordable to a wider demographic which, in turn, is increasing the volume of air traffic. It also enables business jet manufacturers to consolidate their customer base; rather than selling single aircrafts to individuals, manufacturers can sell dozens of aircraft to pools of customers.
The down side is that the maturation of the fractional ownership model for business jets has essentially also dampened orders as wealthy individuals and companies opt to lease their business jets by the hour rather than pay the up-front costs and ongoing maintenance and hanger costs that are often associated with business jet ownership.
According to Embraer’s CFO, Mr. Filippo, fractional ownership will be more of a benefit than a risk. “We absolutely see the growing participation of fractional ownership models in the executive business jet segment but it has not catalyzed a massive change in behaviors. It’s actually created more opportunities in that market.”
AEROSPACE: SEGMENT ANALYSIS
30 Aviation Week, February 20, 2015 http://aviationweek.com/commercial-aviation/drop-oil-prices-means-airline-profitability-boost-now
31 Will scope clause issue muddle Mitsubishi Regional Jet’s service entry?, ATW Online, March 12, 201532 Regional Turboprop Market Outlook 2014-203333 Company Reports, GAMA, and J.P. Morgan estimates ©
201
6 K
PM
G In
tern
atio
nal C
oope
ratio
n (“
KP
MG
Inte
rnat
iona
l”).
KP
MG
Inte
rnat
iona
l pro
vide
s no
clie
nt s
ervi
ces
and
is a
Sw
iss
entit
y w
ith w
hich
the
inde
pend
ent m
embe
r firm
s of
KP
MG
net
wor
k ar
e af
filia
ted.
ND
PP
S 5
2911
7
Growth and uncertainty 17

starting to decline which indicates growing demand for potential future orders. However, used jet pricing remains weak, which has been a persistent impediment to recovery.
Business Jet Deliveries by Aircraft SizeFig14
Source: Company reports, GAMA, and J.P. Morgan estimates, 2015.
Actual Forecast
63
86
141
220
287
266 16
4
171
217
278
363
423
376 301
268
257
235
242
272
283
294
303109
137
147
174
161 129
110
138
222
268
296
360
183
140 141
138 115
127
159
194
206
234
126
134
202
199
204 173
142
180
189
223
265
287
260
275 265
280
310
313
317
320
329
34
6
593 652
568
416 489
628
769
924
1,070
819
716 674 675 660 682
748 797 829
883
97 98
99
00
01 02 03 04
05 06
07 08
09
10 11 12 13 14 15E
16E
17E
18E
LIGHT MEDIUM HEAVY
“We expect to start to see some reaction and growth in the executive jet segment; mid-sized and entry-level models probably suffered the worst during the recession but we think those will be the segments that start to benefit first from the recovery,” noted Embraer’s Mr. Filippo. “Our Phenom 300 has been the most delivered entry-level aircraft over the past 3 years and we expect to see good growth from our new Legacy 500 and the recently launched Legacy 450, both of which are mid-sized jets.”
Over the mid to long term, continued demand for heavy jets is expected to sustain the sector’s growth, driven mostly by growth in corporate profits, nonresidential investment spending and an increasing number of billionaires, all of which are key drivers of large cabin demand. However, weak oil prices (a significant portion of large cabin fleet is funded by oil generated wealth),
the slowdown in key emerging markets such as China and Brazil, and commodity-price-driven headwinds on corporate profits will provide near-term challenges.
All evidence suggests that the sector will not return to the highs of the pre-recession period. Inventory levels (both of new and used) light and medium jets was driven up by over production leading up to the 2009 recession, and high current inventory levels will slow growth in those segments over the medium term while the introduction of new models in those segments will add additional competitive pressure.
At the same time, the segment continues to be impacted by social forces far removed from the traditional manufacturing equation of supply and demand. The reality is that there is a growing social stigma around the use of private jets and many U.S. and European executives have now grown accustomed to flying on commercial routes to conduct their business. And in the emerging markets (most notably China), drives to stamp out corruption and the misuse of government funds, coupled with government “austerity” imagery, is influencing orders from businesses, many of which are state-owned.
“In today’s anti-graft environment, State Owned Enterprises in China certainly aren’t being encouraged to purchase corporate jets,” notes David Frey, Partner with KPMG in China. “Flying commercial seems perfectly normal to most executives, both at State Owned and private enterprises and that is slowing the expected growth of the business jet sector in China.”
The freighter sector
While global trade has certainly picked up since the lows of the recent global recession, the freighter segment continues to struggle. In part, this is due to the growth and increasing efficiency of other competing (and generally lower-cost)
AEROSPACE: SEGMENT ANALYSIS
© 2
016
KP
MG
Inte
rnat
iona
l Coo
pera
tion
(“K
PM
G In
tern
atio
nal”
). K
PM
G In
tern
atio
nal p
rovi
des
no c
lient
ser
vice
s an
d is
a S
wis
s en
tity
with
whi
ch th
e in
depe
nden
t mem
ber f
irms
of K
PM
G n
etw
ork
are
affil
iate
d. N
DP
PS
529
117

Growth and uncertainty 19
modes of transport such as ships and trains. But it is also because passenger aircraft (and, in particular, wide-bodies) are increasingly being used to ship some types of freight in the luggage compartments of passenger routes; some estimates show that around 40 percent of all air freight traffic is carried by commercial passenger aircraft rather than dedicated freighters.34
Global Freight Ton-Miles (in billions) and Growth rate (%)
Fig15
Source: Bureau of Transportation Statistics T100 Segment data, 2015
Actual Forecast
57.8 56.463.5 66.0 67.6 68.5
62.854.8
65.0 64.7 62.5 62.0 65.2 66.2
-2.3%
12.5%
3.8%
2.5%1.3%
-8.2%
-12.8%
18.7%
-0.6%-3.4%
-0.8%
5.2%
1.6%
2002
2003
2004
2005
2006
2007
2008
2009
2010
2011
2012
2013
2014
2015
E
Growth prospects are also hampered by the current low utilization levels within the existing fleet; current load factors (a measure of utilization) sits at around 45 percent globally, meaning there is still much capacity to be soaked up before new orders will materialize.35 At the same time, the conversion of older passenger aircraft or the retrofitting of models is also slowing demand for new purpose-built freighters.
That being said, global air freight traffic is increasing (demand grew by around 4 percent in 2014) and over the next 20 years more than 1,100 existing freighters are expected to reach the end of their operational life which should drive replacement demand. Asian demand will also be driven by the Asian cargo carriers who already represent around 40 percent of the global market.
For the OEMs and their suppliers, lower demand is creating significant questions about the production rates of certain platforms, particularly the B777 (as production shifts to the introduction of the B777x in 2020) and the B747-B (which has already experienced some production rate cuts).
“The OEMs are looking at the lines where they have overcapacity—such as the B747—and trying to decide if there is enough demand to allow them to convert their ‘white tails’ into freighters,” noted Doug Gates. “But between newer, more efficient models and the availability of retro-fitted used passenger aircraft, our experience suggests that OEMs are struggling to properly assess demand.”
The aftermarket sectorWith the growth of the aftermarket sector closely tied to the expansion of airline capacity and utilization levels, it seems clear that the aftermarket sector is set for long-term growth. Yet while this is certainly true, the sector will need to navigate some strong headwinds in the near term.
One of the bigger near-term challenges is that the average age of the global fleet is falling quickly as airlines start to take delivery of their replacement aircraft. And with generally five-year warranty periods, it will take some time before these new aircraft come into scope for the aftermarket sector. The high replacement level of commercial aircraft is also creating some headwinds in the parts subsector as older aircraft are retired and promptly harvested for spare parts, which is contributing to a glut of used serviceable materials (USM) inventories in certain markets.36
At the same time, the introduction of newer aircraft models will also change the dynamics and demands on the aftermarket sector. In part, this is because airframes made from composites tend to require fewer inspections and maintenance. But it is also because models are becoming increasingly technical with newer electronics, avionics and next generation engines which, in turn, require more sophisticated maintenance capabilities.
The sector has also seen significant structural change over the past few years. Airlines (who used to maintain their own maintenance and repair operations) have moved towards outsourcing this service, allowing them to diversify their aircraft fleet based on the specific route requirements rather than the desire to streamline maintenance costs.
Airlines have moved towards outsourcing maintenance and repair operations, allowing them to diversify their aircraft fleet based on specific route requirements rather than the desire to streamline maintenance costs.
Aircraft manufacturer OEMs as well as airlines (such as Delta’s DMS) have recognized the high margins and growth potential in aftermarket and have made acquisitions and investments to grow their aftermarket capacity (including establishing dedicated groups to part-out aircraft, maintaining an extensive pool of USMs and internal engineering capabilities for DER repairs). The engine and component manufacturers are also expanding their capabilities into the maintenance and repair outsourcing (MRO) service area.
AEROSPACE: SEGMENT ANALYSIS
34 J.P. Morgan “All About Aerospace and Defense” Report, January 8, 2015, page 66
35 IATA Release – February 03, 2016
36 TeamSAI; Global MRO spending Industry Survey Aerospace & Defense
© 2
016
KP
MG
Inte
rnat
iona
l Coo
pera
tion
(“K
PM
G In
tern
atio
nal”
). K
PM
G In
tern
atio
nal p
rovi
des
no c
lient
ser
vice
s an
d is
a S
wis
s en
tity
with
whi
ch th
e in
depe
nden
t mem
ber f
irms
of K
PM
G n
etw
ork
are
affil
iate
d. N
DP
PS
529
117
“We’ve seen some fairly significant acquisitions of MRO providers by the OEMs and it’s pretty clear that Airbus and Boeing are both looking to secure some of the ‘long-term annuity’ that can be achieved through the MRO sector,” notes Grant McDonald, National Sector Leader of Aerospace and Defense at KPMG in Canada. “I think we’re likely to see some further consolidation in the market as the bigger players start to sniff out deals that could help improve their footprint and create greater economies of scale.”
With high barriers to entry in this sector (such as high capital costs for inventory, the need for FAA certifications and the need to be close to the customer) it is unlikely that any new competitors will enter the market any time soon.
However, we believe that the sector is ripe for consolidation as major players look to grow their footprint through acquisition. The sector may also see considerable interest from Private Equity investors who may be attracted to the high margin potential, high levels of inventory, and fragmented nature of the sector.
The jet engine sectorAs the battle between the two next-generation engines heats up, competition is rising in the jet engine sector. Indeed, with both new engine “families” (Pratt & Whitney’s Geared Turbofan or GTF models and CFM’s LEAP models) offering fuel efficiency of around 15 percent above previous engines, the top engine manufacturers have had to—once again—resort to tight price competition to drive orders.
“I think the industry really needs to see how these new engines operate in various scenarios and understand the maintenance requirements before we start to see OEMs and airlines coalesce around one of the two competing engine technologies,” notes Tom Mayor.
Over the past few years there has also been a shift in the relationship between engine manufacturers and aircraft OEMs. Whereas in the past, OEMs would largely leave the selection of engine to the customer (i.e., the airline) the major OEMs are now increasingly requiring engine manufacturers to contribute towards the development of the overall aircraft in exchange for guaranteed exclusivity on the program. By shouldering some of the development costs and risks, GE has locked in an exclusive contract for the B777x, Rolls-Royce has secured exclusivity on the A350, and CFM has locked in the B737Max. Understandably, competition for these contracts and partnerships has also been fierce.
It must be noted, however, that the willingness to compromise on new engine prices is largely influenced by the desire to lock in the highly-lucrative long-term replacement parts and MRO business and, as a result, margins on new engines are being sacrificed in order to secure the less volatile, longer-term and higher-margin aftermarket business (which, between 2012 and 2031 is estimated to be worth more than USD700 billion).37
The big challenge for engine manufacturers going forward may be in keeping up with demand. Commercial aircraft production is set to rise significantly and estimates suggest that—between 2014 and 2033—almost 150,000 new engines will be required to meet demand. Engine manufacturers will need to quickly increase production if they hope to avoid program delays and late delivery penalties.
A deeper look at the impact on the aerospace supply baseOverall, the anticipated growth in aircraft production, the growing requirements for aftermarket services, and the introduction of new technologies should keep the aerospace supply chain busy for some time to come.
However, there are growing concerns that some suppliers may not have the capacity nor the capability to meet the dual pressure of increasing production rates while at the same time investing into new innovation. Particularly in the more fragmented sectors of the supply chain, we expect to see significant consolidation, joint ventures, and collaborations as smaller players work together to share the costs, risks, and development requirements demanded by the OEMs.
There is also growing evidence that profit margins are beginning to shift away from the supply base and towards the OEMs. Indeed, as programs such as Boeing’s Partnership for Success initiative continue, we expect to see further narrowing of the historic profitability gap (of around 4 percent) that existed between the OEMs and their suppliers.
We expect to see signification consolidation, joint ventures, and collaborations as smaller players work together to share the costs, risks, and development requirements demanded by the OEMs.While most sectors of the supply base are likely to enjoy substantial growth and steady profitability over the medium to long term, the aerostructure sector seems most at risk. Profitability fell from around 8 percent in 2007 to around 2 percent in 2013 and costs are rising for aerostructure suppliers due to higher composite manufacturing costs and significant capital investment requirements (not least of all the higher spending requirements in new R&D and technology).38
However, with the recognition that demand is rising, the subsector has also enjoyed significant investment activity recently and has witnessed a number of mergers and acquisitions aimed at pooling resources to fund highly capital-intensive requirements and consolidating costs and production.
38 Alix Partners Press Release – July 07, 201437 Rolls-Royce Market Outlook 2012-2031
AEROSPACE: SEGMENT ANALYSIS
© 2
016
KP
MG
Inte
rnat
iona
l Coo
pera
tion
(“K
PM
G In
tern
atio
nal”
). K
PM
G In
tern
atio
nal p
rovi
des
no c
lient
ser
vice
s an
d is
a S
wis
s en
tity
with
whi
ch th
e in
depe
nden
t mem
ber f
irms
of K
PM
G n
etw
ork
are
affil
iate
d. N
DP
PS
529
117

Key takeaways for aerospace1. The rise of new markets and competitors:
As many manufacturers and suppliers shift towards the East – and new opportunities and new competitors emerge – executives will need to start thinking beyond the next 5 to 10 years to understand how changing market dynamics will influence their business model.
2. Oil prices create volatility and flexibility: Low oil prices may allow some airlines to defer the replacement of current aircraft with more fuel efficient equipment, but those airline executives able to view low oil prices as an opportunity to reinvest their higher-than-expected profits into improving their infrastructure and asset portfolio should find themselves in a stronger position once oil prices rise.
3. Growth potential influenced by infrastructure: While there is clearly demand for increased air traffic across emerging market countries like China and India, the sector may be hampered in the medium term by a lack of sufficient infrastructure (or available airspace). Governments will need to play a strong role in addressing these issues in order to allow the airline and aerospace industries to realize the full potential for air traffic growth between now and 2030.
4. MRO continues to evolve: With most major commercial airlines having now disposed of their “in-house” MRO capabilities, the market has largely consolidated into geographic centers such as Singapore. However, with China and India rapidly making inroads into the MRO market, OEMs and others involved in the MRO space will need to carefully monitor (and, likely, invest into) these lower-cost centers in order to remain relevant in not only the commercial, but also the general aviation sector.
Over the long term, the supply base will also need to come to terms with the shift in geographical focus from the United States and Europe to Asia with the recent extension of Airbus’ joint venture related to final assembly of A320 aircraft and the planned opening of Boeing’s B737 line in China. Developing the right footprint to meet demand requirements while reducing supply chain inefficiencies will be key to success going forward.
“China may not be a big market for the Aerospace supply base today, but you’d be naïve to think that these production shifts to China and Asia won’t impact your future business model,” noted Doug Gates. “Now is the time to start exploring the Asian markets, looking at the different incentives in each country and starting to establish a base of operations; it may seem premature based on the current OEM footprint but it won’t be long before Asia becomes a massive market and establishing a presence can often take time.”
AEROSPACE: SEGMENT ANALYSIS
© 2
016
KP
MG
Inte
rnat
iona
l Coo
pera
tion
(“K
PM
G In
tern
atio
nal”
). K
PM
G In
tern
atio
nal p
rovi
des
no c
lient
ser
vice
s an
d is
a S
wis
s en
tity
with
whi
ch th
e in
depe
nden
t mem
ber f
irms
of K
PM
G n
etw
ork
are
affil
iate
d. N
DP
PS
529
117
Growth and uncertainty 21

© 2
016
KP
MG
Inte
rnat
iona
l Coo
pera
tion
(“K
PM
G In
tern
atio
nal”
). K
PM
G In
tern
atio
nal p
rovi
des
no c
lient
ser
vice
s an
d is
a S
wis
s en
tity
with
whi
ch th
e in
depe
nden
t mem
ber f
irms
of K
PM
G n
etw
ork
are
affil
iate
d. N
DP
PS
529
117

Growth and uncertainty 23
Focus on the defense sector
© 2
016
KP
MG
Inte
rnat
iona
l Coo
pera
tion
(“K
PM
G In
tern
atio
nal”
). K
PM
G In
tern
atio
nal p
rovi
des
no c
lient
ser
vice
s an
d is
a S
wis
s en
tity
with
whi
ch th
e in
depe
nden
t mem
ber f
irms
of K
PM
G n
etw
ork
are
affil
iate
d. N
DP
PS
529
117

Key trends to watch The defense sector has weathered down-cycles before. But this down-cycle is different. It is not simply a short-term “pause” of the status quo where—in time–everything will reset to normal. Rather it is a time of fundamental transformation for the sector, catalyzed by key global and U.S. trends.
1. Deep defense budget uncertaintyWhile the heat of the so-called ‘sequestration caps’ has abated for the time being with the two-year Bipartisan Budget Act of 2015 (BBA15), which was approved in October 2015, there remains a level of mid-to longer-term uncertainty surrounding the U.S. defense budget flowing from the BCA 2011 budget cuts, which still need to be achieved by 2021. Should the sequestration caps go ahead in future years, the U.S. DoD will be expected to shave a significant percentage of its total budget. While most analysts expect that the shelter provided by the BBA15 will be extended in future years, the reality is that this measure only maintains the status quo and effectively punts the fundamental decisions that must be made down the field. Budget uncertainty is also a key challenge in Europe (where slow growth is shifting Defense Ministries’ priorities and forecasts) and in the Middle East (where extended periods of lower oil prices may stunt defense budget growth).39
2. Rising costs, lower marginsMost U.S. defense contractors have been very successful in cutting costs over the past few years; margins rose to 11.2 percent in 2014 (versus 10.1 percent in 2011), even while revenues declined.40
However, there are growing signs that costs are increasingly starting to return to the defense sector balance sheet. In part, this is because some defense contractors scaled back their operations in anticipation of sequestration and (assuming these continue to be staved off) will need to reinvest in order to meet continued demands for innovative products and new technologies. In larger part, the increase in costs has more to do with expenses (such as R&D investments
and—potentially—employee pension costs) shifting from the DoD’s balance sheet onto the private sector’s balance sheet which, in turn, is putting downward pressure on margins. Margins are also under pressure in the United States due to tougher DoD contracting terms, limited opportunities for further cost cutting, and an end to some short-term favorable Estimate at Completion (EAC) adjustments which benefited defense contractors over the past 2 to 3 years.
3. The shift to new business models and marketsWith shrinking budgets, defense contractors had already begun to focus on their most profitable offerings. But recognizing that their current revenue decline is not sustainable, many are seeking to transform themselves to drive fresh growth. For some, this has meant expanding their reach into new geographies either through DoD-led foreign military sales or, increasingly, through direct commercial sales. For others, it has meant adapting their current products and capabilities for use in civilian and commercial settings in order to capture adjacent vertical markets. The more forward-looking organizations, however, are now taking steps to fully rethink their portfolio of products and services and, in doing so, are developing and/or acquiring new capabilities in key growth areas such as cybersecurity, data management, mission software development, and underperforming assets.
4. No world peace this yearWhile there have certainly been significant draw-downs of U.S. troops in the Middle East, the action is certainly not indicative of a lower global threat. Instability continues in the Middle East—this time fomented by Islamic State (ISIS); Russia continues to posture both in Europe and in the Middle East; China has ramped up its rhetoric and its military presence in the South China Sea; and state-sponsored cyber warfare continues to rage.41 Indeed, the threat level currently facing the United States is likely the highest it has been at any time since the Cold War ended in 1989 with the downing
This is a time of deep uncertainty for many defense sector executives. It is also a time of great opportunity. Significant shifts are underway as players vie to adapt to the new reality of U.S. defense priorities and budgets. For those willing to make the necessary changes, the trends blowing through the sector will open up massive growth opportunities; for others, the future will be rather bleak.
DEFENSE: KEY TRENDS
39 Analysis of the Bipartisan Budget Act of 201540 SIPRI, Morgan Stanley Research
© 2
016
KP
MG
Inte
rnat
iona
l Coo
pera
tion
(“K
PM
G In
tern
atio
nal”
). K
PM
G In
tern
atio
nal p
rovi
des
no c
lient
ser
vice
s an
d is
a S
wis
s en
tity
with
whi
ch th
e in
depe
nden
t mem
ber f
irms
of K
PM
G n
etw
ork
are
affil
iate
d. N
DP
PS
529
117

of the Berlin Wall. While there likely will not be any large-scale U.S. troop deployments any time soon (the current approach to executing U.S. policies largely prefers “drones in the air” to “boots on the ground”) continued upheaval will drive sales in key markets and may—depending on the level of participation by the United States—lead to the removal of the BCA-mandated budget caps.
5. Competition becomes life and death One of the big impacts of the DoD’s shrinking budget and narrower focus is that it has generally led to the tendering of fewer—yet larger-value—contracts. What this means is that defense contractors are
increasingly starting to get into “all or nothing” situations where the loss of one significant contract or tender could lead to the failure of a key division or even the entire enterprise. Take, for example, the current competition surrounding the Long Range Strike Bomber; at USD80 billion, it is clearly the largest single franchise to be awarded recently. In November 2015, the contract was awarded to Northrup Grumman (pending appeals by Lockheed and Boeing, the other two U.S. primes competing for the contract) which will have deep implications down the entire supply chain for those suppliers that had supported the unsuccessful bids by Lockheed and Boeing.42
DEFENSE: KEY TRENDS
41 Business Insider Press Release42 Dailymail.co.uk Press Release
© 2
016
KP
MG
Inte
rnat
iona
l Coo
pera
tion
(“K
PM
G In
tern
atio
nal”
). K
PM
G In
tern
atio
nal p
rovi
des
no c
lient
ser
vice
s an
d is
a S
wis
s en
tity
with
whi
ch th
e in
depe
nden
t mem
ber f
irms
of K
PM
G n
etw
ork
are
affil
iate
d. N
DP
PS
529
117
Growth and uncertainty 25
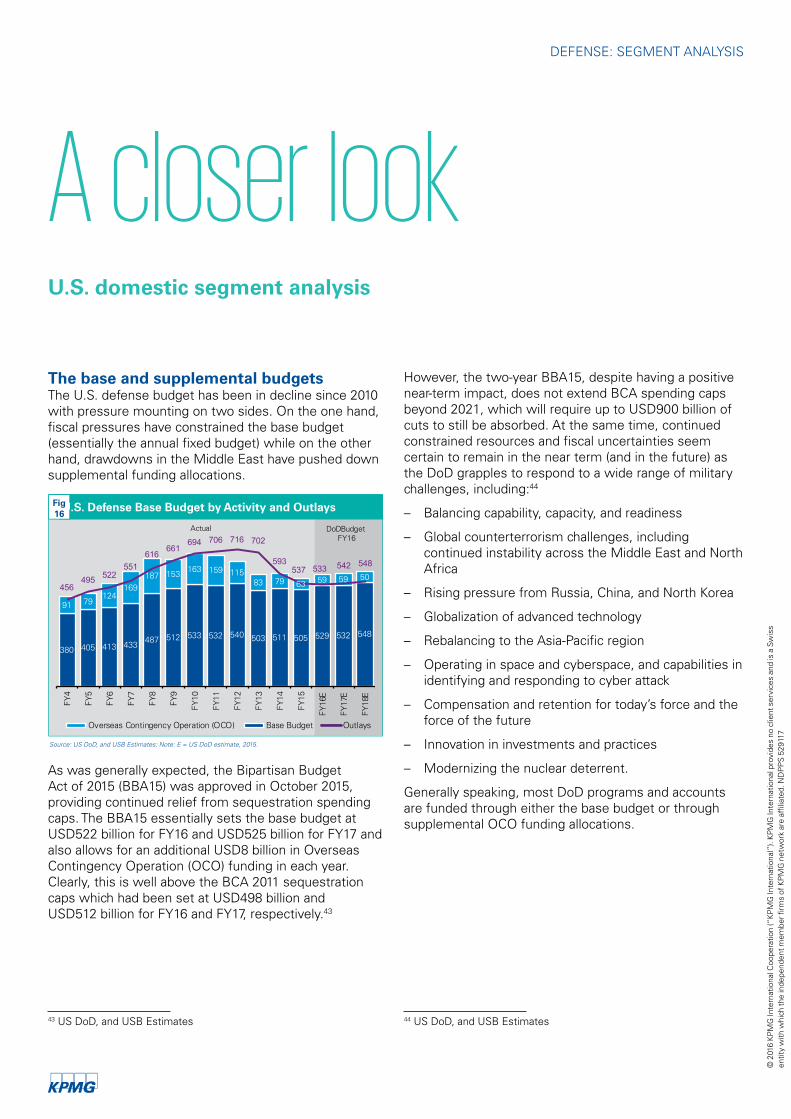
A closer look
The base and supplemental budgetsThe U.S. defense budget has been in decline since 2010 with pressure mounting on two sides. On the one hand, fiscal pressures have constrained the base budget (essentially the annual fixed budget) while on the other hand, drawdowns in the Middle East have pushed down supplemental funding allocations.
As was generally expected, the Bipartisan Budget Act of 2015 (BBA15) was approved in October 2015, providing continued relief from sequestration spending caps. The BBA15 essentially sets the base budget at USD522 billion for FY16 and USD525 billion for FY17 and also allows for an additional USD8 billion in Overseas Contingency Operation (OCO) funding in each year. Clearly, this is well above the BCA 2011 sequestration caps which had been set at USD498 billion and USD512 billion for FY16 and FY17, respectively.43
However, the two-year BBA15, despite having a positive near-term impact, does not extend BCA spending caps beyond 2021, which will require up to USD900 billion of cuts to still be absorbed. At the same time, continued constrained resources and fiscal uncertainties seem certain to remain in the near term (and in the future) as the DoD grapples to respond to a wide range of military challenges, including:44
– Balancing capability, capacity, and readiness
– Global counterterrorism challenges, including continued instability across the Middle East and North Africa
– Rising pressure from Russia, China, and North Korea
– Globalization of advanced technology
– Rebalancing to the Asia-Pacific region
– Operating in space and cyberspace, and capabilities in identifying and responding to cyber attack
– Compensation and retention for today’s force and the force of the future
– Innovation in investments and practices
– Modernizing the nuclear deterrent.
Generally speaking, most DoD programs and accounts are funded through either the base budget or through supplemental OCO funding allocations.
U.S. domestic segment analysis
U.S. Defense Base Budget by Activity and OutlaysFig16
Source: US DoD, and USB Estimates; Note: E = US DoD estimate, 2015.
DoDBudget FY16
Actual
380 405 413 433487 512 533 532 540 503 511 505 529 532 548
91 79124
169187 153 163 159 115
83 79 63 59 59 50456
495 522551
616661
694 706 716 702
593537 533 542 548
FY4
FY5
FY6
FY7
FY8
FY9
FY10
FY11
FY12
FY13
FY14
FY15
FY16
E
FY17
E
FY18
E
Overseas Contingency Operation (OCO) Base Budget Outlays
DEFENSE: SEGMENT ANALYSIS
43 US DoD, and USB Estimates 44 US DoD, and USB Estimates
© 2
016
KP
MG
Inte
rnat
iona
l Coo
pera
tion
(“K
PM
G In
tern
atio
nal”
). K
PM
G In
tern
atio
nal p
rovi
des
no c
lient
ser
vice
s an
d is
a S
wis
s en
tity
with
whi
ch th
e in
depe
nden
t mem
ber f
irms
of K
PM
G n
etw
ork
are
affil
iate
d. N
DP
PS
529
117

INSIGHTPortfolio shaping in the defense sector
By Adil Khan, Principal, Deal Advisory, KPMG in the U.S.
Having hit rock bottom, military spending now appears to be on the upturn. But the reality is that defense contractors are not going to see an increase in business
any time soon. With the outlook now improving, it seems that the defense sector is slowly emerging from a period of M&A hibernation over the past few years. And given the shifting DoD priorities, we expect companies focused on cybersecurity, intelligence, surveillance, electronics and unmanned systems to become highly sought after.
Different to the scale and synergy-focused M&A activity in the past, there are a number of factors that suggest the recent uptick in M&A activity is actually the beginning of a new, more sophisticated wave of M&A driven by a focus on portfolio reshaping.
In part, this shift has been driven by years of pent-up demand for acquisitions by both strategic and financial buyers amid economic uncertainty and lack of acceptable investment opportunities. Defense players and investors are also (on the whole) enjoying significant financial firepower in terms of available capital and large cash balances that could be invested into new acquisitions that help drive long-term growth in shareholder value. M&A activity in the defense sector is also being catalyzed by recovering valuations which, in turn, are prompting divestitures as companies restructure around new priority spending areas and divest non-core assets.
In defense and in the wider market, M&A activity is being further driven by favorable credit markets. This is creating incentives for financial buyers as evidenced by the recent uptick in sponsor deals such as Carlyle’s acquisition of General Dynamic’s Axletech business, Onex’s acquisition of Survitech Group, and Warburg Pincus & Blue Wolf Capital’s acquisition of North American Rescue.45
While the U.S. DoD clearly does not support mergers between the top prime contractors, it does seem to be open to vertical and horizontal integration down the defense supply chain, as evidenced by Lockheed Martin’s recent acquisition of Sikorsky. In some areas where there is perceived overcapacity (such as in land systems and services), the DoD could go further by encouraging consolidation aimed at strengthen the remaining players.
Certain sectors also seem ripe for M&A activity. The combat aircraft sector, for example, is being reshaped by the current environment of major contract awards (such as the recent U.S. Air force’s award of the LRS-B to Northrop Grumman). More momentum is also expected in the government services sector, including niche technology specialties and prime portfolio shaping.
DEFENSE: SEGMENT ANALYSIS
45 Aerospace/Defense and Government Technology Solutions Marketview – Spring 2015
© 2
016
KP
MG
Inte
rnat
iona
l Coo
pera
tion
(“K
PM
G In
tern
atio
nal”
). K
PM
G In
tern
atio
nal p
rovi
des
no c
lient
ser
vice
s an
d is
a S
wis
s en
tity
with
whi
ch th
e in
depe
nden
t mem
ber f
irms
of K
PM
G n
etw
ork
are
affil
iate
d. N
DP
PS
529
117
Growth and uncertainty 27

The “modernization” accountIn the United States, the bulk of defense spending consists of procurement, research development, test and evaluation, together known as the “modernization account”. Assuming that some relief is given from the caps, defense players can expect to see modest, single-digit year-over-year growth in the modernization account (which typically funds defense contractors involved in the development and production of weapons systems) but overall spending will remain far below the heights of 2011.47
That being said, there have been some significant changes in the priorities that the DoD has chosen to fund through the modernization account with priority shifting towards programs designed to enhance U.S. military mobility, intelligence, communications, and power projection.47 The Air Fuel Tanker program, for example, is designed to improve the military’s ability to quickly move forces and support remote deployments. The Surveillance Drone program is expected to improve intelligence gathering and communication.48
U.S. Defense Weapons Base Budget Spending – Modernization1
Fig17
Source: US DoD, and USB Estimates; Note: E = US DoD estimate, 2015.1Represents Procurement and Research, Development, Testing, & Evaluation (RDT&E)
Actual DoD BudgetFY16
76 79 80 84 99 101 103 102 102 90 93 95 110 111 118 126
64 68 72 76 78 79 79 75 72
63 63 65 70 71 72
74 137
148 158
173
193 199 191
203 195
182172 165
176184 187 190
FY4
FY5
FY6
FY7
FY8
FY9
FY10
FY11
FY12
FY13
FY14
FY15
FY16
E
FY17
E
FY18
E
FY19
E
Procurement RDT&E Outlays
Other, more traditional, programs will continue to progress. To improve the military’s ‘power projection’, the DoD will add two new guided-missile destroyers and two new subs each year until 2019. Airborne power projection will be maintained through the F-35 Joint Strike Fighter program (albeit somewhat curtailed in light of budget uncertainty).
At the same time, however, the Pentagon has also started to reexamine some of their existing procurement programs. In some cases, the Generals are concerned that the programs may be ill-suited to the new reality of nonpermissive environments. The decision to reduce the number of littoral combat ships (LCSs), a program that
INSIGHTThe F-35: An innovative model for collaboration?
By Doug Gates, KPMG Global Aerospace and Defense Leader
The F-35 Lightening II is more than just another new piece of hardware; it is a new model for
innovation and development.
There is no doubt that the innovative fifth-generation fighter, jump-jet, and land/sea attack airplane is a technological beauty. But the F-35 also represents an innovative new model for the sharing of development costs and risks. Nine original partner countries were involved in the development of the F-35 (Australia, Britain, Canada, Denmark, Italy, The Netherlands, Norway, Turkey, and the United States) and others—including Israel, Japan, and South Korea—have also committed to purchasing aircraft. Clearly, the F-35 program represents the dawn of a new era of collaborative development of major weapon systems for Western militaries.46
The program has also provided an important long-term boost to the industry. Indeed, the program has done more than simply help the U.S. government offset development, production, future sustainment, and follow-on modernization costs. It has also created a new contracting approach across the participating governments and their respective aerospace suppliers that should provide a trillion-dollar stimulus to the western military industrial base over the more than 40 to 50 years of the F-35 aircraft’s operational life.
DEFENSE: SEGMENT ANALYSIS
46 Lockheed Martin website47 US DoD, and USB Estimates48 A User’s Guide to the Fiscal Year 2015 Defense Budget
© 2
016
KP
MG
Inte
rnat
iona
l Coo
pera
tion
(“K
PM
G In
tern
atio
nal”
). K
PM
G In
tern
atio
nal p
rovi
des
no c
lient
ser
vice
s an
d is
a S
wis
s en
tity
with
whi
ch th
e in
depe
nden
t mem
ber f
irms
of K
PM
G n
etw
ork
are
affil
iate
d. N
DP
PS
529
117

had received investments of upwards of USD10 billion over the past 10 years, was made in part due to questions about its capability and survivability in combat.49
In other cases, questions have been raised about the affordability of planned or current programs with concerns about whether they are “squeezing out” more important investments. The termination of the Army Ground Combat Vehicle (GCV) was as much about the production challenges as it was about the expected cost (which was initially estimated at around USD36 billion over the life of the program).50
While procurement has dropped off precariously since the highs of 2008, RDT&E—the allocations put towards the development of new technologies and weapons systems—has seen somewhat slower declines51 in part because investment into innovation is typically a longer-term commitment and does not scale as easily to budget restrictions as procurement. But the DoD has cancelled a number of major programs such as the Future Combat Systems and the Transformational Satellite Communications programs which has effectively reduced the funding levels of RDT&E in general.
The Operations and Maintenance (O&M) accountThe O&M account essentially funds ongoing costs such as civilian personnel, training personnel, logistics support, equipment maintenance, and troop support. Service contractors that perform such support services are also typically funded from O&M accounts. O&M spending accounts for around 40 percent of the DoD’s annual budget and, despite the decline in the overall base budget, has remained stable.52 In fact, our research shows that most analysts expect single digit growth (again, assuming relief from sequestration) over the next few years.
U.S. Defense Operations & Maintenance SpendingFig18
Source: CSBA Analysis-of-the-FY-2014-Defense-Budget; Note: E = US DoD estimate, 2015.
1
Actual DoD Budget Authority
147 163 181 185 195 200 197 193 197 198 200 204 208
94 93
91 109 110 87
62 70 41 16 19 19 18
217
245 259
276 291 282 260
273
228 216 218 220 223
FY7
FY8
FY9
FY10
FY11
FY12
FY13
FY14
FY15
FY16
E
FY17
E
FY18
E
FY19
E
Overseas Contingency Operation (OCO) Base Budget Outlays
INSIGHTThe impact of home-grown terrorism
By Matt Richards, Managing Director, Advisory, KPMG in the U.S.
The horrors of terrorism have returned to Europe and North America. Reports of
incidents and plots are emerging almost weekly. But, as illustrated by the November 2015 attack in Paris in which 130 people were killed and more than 350 injured, the threat can easily come from inside the state as much as from outside.
The attack, which was claimed by the Islamic State of Iraq and the Levant (ISIL), resulted in a significant change in domestic security policy—not only in France but across much of Europe—while France itself launched retaliatory airstrikes on ISIL-held territory in Syria.
Interestingly, many global defense organizations saw their stock valuations rise in the wake of the Paris attack. Many investors were clearly expecting that the event would launch a massive increase in anti-terrorism spending. The problem is that—while spending has certainly seemed to increase—it is those that are focused on communications, security services, and information warfare that will see the greatest proportion of this spend. The reality is that combating “home-grown” terrorism requires cybersecurity and IT know-how, not fighter jets and tanks.
The United States has also been the victim of home-grown terrorism that has drawn public attention away from defense and towards national security. And with scant support at home for deploying American troops to the Middle East, many of the drivers of growth in the traditional areas of defense are falling away. However, with an election cycle underway, it seems likely that the United States will see increased support for defense and national security spending which, in turn, should create some tailwinds for defense companies.
DEFENSE: SEGMENT ANALYSIS
49 US Government Accountability Office; issued Dec 18, 2015 50 U.S. Army Official Defends GCV Against Attacks, Defense News,
February 25, 201451 US DoD, National Defense Budget Estimates for FY 2014 (Green Book)52 CSBA Analysis-of-the-FY-2014-Defense-Budget
© 2
016
KP
MG
Inte
rnat
iona
l Coo
pera
tion
(“K
PM
G In
tern
atio
nal”
). K
PM
G In
tern
atio
nal p
rovi
des
no c
lient
ser
vice
s an
d is
a S
wis
s en
tity
with
whi
ch th
e in
depe
nden
t mem
ber f
irms
of K
PM
G n
etw
ork
are
affil
iate
d. N
DP
PS
529
117
Growth and uncertainty 29

DEFENSE: SEGMENT ANALYSIS
However, the O&M budget is somewhat reliant on the overall OCO supplemental funding allocations. Around 70 percent of all OCO funds are invested into O&M and OCO funding makes up about 30 percent of the total O&M budget. Clearly, decreases in the OCO budgets could have a significant long-term impact on the growth of the overall O&M budget.53
While the DoD is already taking some tentative measures to reduce their O&M costs (such as the de facto civilian hiring freeze that has been in place since early 2013), more will clearly need to be done. It is estimated that the DoD would need to reduce its civilian workforce by
around 100,000 in order to bring the O&M budget back into balance with the 10-year budget cap requirements and that will not be achieved through hiring freezes alone.54
Not surprisingly, perhaps, any attempts to close down military bases or to dramatically cull the civilian workforce have been deeply resisted by Congress.55 However, with O&M spending per active-day service member up 19 percent in 2012 alone, it seems clear that something will need to be done to meet the DoD’s O&M requirements in the long term.
53 CSBA Analysis-of-the-FY-2014-Defense-Budget54 Pay, benefits, O&M will swallow entire DoD budget by 2024,
Federal News Radio, April 8, 2013
© 2
016
KP
MG
Inte
rnat
iona
l Coo
pera
tion
(“K
PM
G In
tern
atio
nal”
). K
PM
G In
tern
atio
nal p
rovi
des
no c
lient
ser
vice
s an
d is
a S
wis
s en
tity
with
whi
ch th
e in
depe
nden
t mem
ber f
irms
of K
PM
G n
etw
ork
are
affil
iate
d. N
DP
PS
529
117

Growth and uncertainty 31
DEFENSE: SEGMENT ANALYSIS
UAVs and unmanned systems
While many defense priorities have shifted and budgets across the board are down, the Unmanned Aerial Vehicle (UAV) segment has remained fairly intact. Given their ability to linger for long durations over a battle field and their capabilities for gathering and disseminating real-time information, it is not surprising that most defense organizations see UAVs as key to sustained military advantage.
So while the budget forecasts for both fixed-wing and rotary military aircraft are expected to decline over the next 10 years, the military UAV market is expected to grow at a rate of 12 percent (CAGR) to reach USD18.7 billion by 2018, and from then onwards is expected to expand by 9 percent per year over the next decade, presenting a top-line growth opportunity for defense companies.55
In part, this growth will be driven by the DoD as the Pentagon looks for smaller, more effective, and less risky military solutions. Indeed, UAVs have already widely replaced manned aircraft for defense missions such as intelligence, surveillance, and reconnaissance. In particular, the Pentagon is looking for new ways to use UAVs to coordinate missions in GPS-denied airspace (in other words, in conditions where electronic warfare could be used against the devices) as well as expanding their use to include attack strikes, resupply, and refueling. Early research is exploring their use for air combat, as well as combat search and rescue, but such capabilities are several years away.
Growth in the sales of military UAVs will also be boosted by the recent decision by the Obama administration to allow sales of armed UAVs to allied nations for the first time (intelligence drones had been sold for years but not armed UAVs). While sales will be reviewed by the DoD on a case-by-case basis, this announcement will clearly drive growth over the coming years.56
UAVs are also proving to have growing commercial value and, as a result, demand is rising. The FAA has already provided exemptions for the use of UAVs in precision agriculture and is currently considering a proposal to allow “route use” of certain small UAVs within the current aviation environment. Amazon’s plans to conduct deliveries via small commercial UAVs demonstrates the potential of the commercial market.57
As a result, we have seen significant activity in the UAV segment and subsegments, both from commercial upstarts (the so-called “garage manufacturers”) and the large traditional defense players. And while it is unlikely that the garage guys will compete with the Northrups of the world for defense contracts any time soon (there are significant barriers to entry when building highly-sophisticated USD300 million unmanned combat machines), they are creating stiff competition for those looking to acquire new and valuable capabilities.
Future spotlight areas for the defense sectorAs noted, many of the larger government purchasers have begun to shift their focus away from investing into arms and ammunition to instead focus on new priority areas such as unmanned systems, cybersecurity, and government IT services.
While they may not currently command massive budget allocations, we believe that these priority areas will provide some of the most valuable growth opportunities for those organizations able to deliver the right combination of products, capabilities, and services to meet the defense sector’s evolving needs.
55 U.S. Military Unmanned Aerial Vehicles (UAV) Market Forecast 2013-201856 Obama administration to allow sales of armed drones to allies, February, 17, 201557 2015 Aerospace & Defense Outlook: Mergers and Acquisitions Update
© 2
016
KP
MG
Inte
rnat
iona
l Coo
pera
tion
(“K
PM
G In
tern
atio
nal”
). K
PM
G In
tern
atio
nal p
rovi
des
no c
lient
ser
vice
s an
d is
a S
wis
s en
tity
with
whi
ch th
e in
depe
nden
t mem
ber f
irms
of K
PM
G n
etw
ork
are
affil
iate
d. N
DP
PS
529
117

Cybersecurity
If you are not thinking about cybersecurity, you should be. Cyber is quickly becoming the number one topic for the defense community.
There are three main reasons that cyber is critical to today’s defense contractors and suppliers. The first is the need to provide a secure product or service. Cyber capabilities are now a top measure when companies compete for defense contracts. The second reason is cyber is increasingly becoming a highly significant market with strong growth potential in a wide variety of adjacent markets from financial services to transportation and logistics.
Probably the most important reason to focus on cyber, however, is that the DoD has clearly shifted its priorities towards cyber, and the sector is one of the few areas that is enjoying budget increases. In fact, while it must be noted that actual DoD cyber investments are classified, most analysts put the current spend by the DoD on cyber at around USD10 billion per year with expectations of a 100 to 200 percent increase within the next 10 years.
However, competition in the cyber sector is already fierce. Already, the dominance of the traditional defense contractors is coming under pressure from
both large systems integrators (like AT&T, IBM Internet Security, and Tata Communications) and from classic security vendors with security service offerings (such as Dell SecureWorks, Symantec, and Verizon Cybertrust).57
In much the same way, our research suggests that the traditional players are also facing stiff competition for more sophisticated cyber warfare and cybersecurity products and services. Commercial cybersecurity providers such as RSA Security, McAfee, and Fortinet are leveraging their capabilities into this space, as are other major cybersecurity vendors with existing government contracts such as KEYW Holdings Corp., ManTech International, and SAIC Inc.
For some, the shift into a new and research-intensive service area already tight with competition seems like a losing proposition. But for others, the shift in the market has created an opportunity to virtually reinvent themselves. Acquisitions have been fast and furious in this sector as defense players battle against systems integrators and security providers to secure the best capabilities and portfolio to meet the needs of this growing market.
Government IT services
Having suffered several years of declining budgets, the government IT services segment bottomed out in 2014 and forecasts suggest that spending has stabilized across both defense and civilian agencies. With the information content of major weapons systems rising and the growing need for specialized intelligence services, the DoD is increasingly recognizing the value and importance of fully scaled, high-end intelligence and IT services.
As a result, executives at government IT services organizations have become highly focused on building the right portfolio of capabilities and capacity to meet the demands of the next generation of government and defense contracts.
Three defense-related subsectors in particular seem set to experience significant consolidation: – Cyber – Companies involved in both defensive and
offensive cyber operations are being snapped up by larger players eager to build or consolidate their capabilities
– Intelligence contractors – Those with unique intelligence analytics, IT or distributed computing capabilities are in particularly high demand
– Intelligence technology and platforms – Current military operations have highlighted the need for the rapid development of customized intelligence, surveillance, and reconnaissance (ISR) capabilities and applications.58
With the spinoff of Leidos from SAIC, the proposed spinoff of IS&GS out of Lockheed Martin, the acquisition of QintiQ’s North American operations by Vencore and the acquisition of SRA by CSC, it is clear that the competitive landscape for government IT services is already changing and speculation is high that further strategic shifts will continue in the sector.57
DEFENSE: SEGMENT ANALYSIS
58 AlixPartners, Cybersecurity: A compelling growth area for defense companies
© 2
016
KP
MG
Inte
rnat
iona
l Coo
pera
tion
(“K
PM
G In
tern
atio
nal”
). K
PM
G In
tern
atio
nal p
rovi
des
no c
lient
ser
vice
s an
d is
a S
wis
s en
tity
with
whi
ch th
e in
depe
nden
t mem
ber f
irms
of K
PM
G n
etw
ork
are
affil
iate
d. N
DP
PS
529
117
Growth and uncertainty 33
DEFENSE: SEGMENT ANALYSIS
Space and satellites
Houston; we have disruption. New innovations in the satellite and launcher markets have legacy players scrambling to stay relevant. Once an industry monopolized by government programs, the space segment is now brimming with competition. In fact, some consolidation may be needed.59
In the satellite market, innovation is largely being driven by demand on both the commercial and the military sides. New propulsion technologies, remotely configurable capabilities, smaller satellites, and the return of satellite “constellations” that can replace larger geostationary satellites are all changing the dynamics of the sector. And, as a result, satellite players will need to seriously reconsider their existing business and operating models. OEMs active in this segment will need to adopt more stringent industrialization practices to meet production demand on time and on budget. And they will need to develop closer partnerships with operators to develop the types of services now in demand. Expect to see more strategic partnerships and M&A activity as high costs, competitive pressures, and massive investment requirements drive players to achieve scale.59
In the launcher market, the rapid success of SpaceX’s model in the commercial market has added unprecedented competitive pressure. Indeed, in 2014, SpaceX claimed about half of the commercial launch market, largely due to its 30 percent price advantage over its main competitor, the Ariane 5. And with the U.S. Air Force certification for SpaceX’s Falcon 9 launcher, it seems that the upstart is about to bring competition to the U.S. military launch market which is currently dominated by a single player (United Launch Alliance) and estimated to be worth almost USD70 billion over the next 15 years.59
Interestingly, new competition is also coming from nation states that want to develop an indigenous launcher capability but also want to leverage the commercial market in order to amortize their investments. As a result, there has been a proliferation of new players in the market (though none of the size or scope to threaten United Launch Alliance or SpaceX yet) which, supported by government subsidies, is creating a market distortion and delaying rationalization. However, consolidation is coming: there are now about 10 announced launcher programs globally and only about 20 commercial launches per year, most of which will go to the established players.59
With so much flux in both the satellite and the launcher market, many established players are now considering how they can consolidate and vertically integrate parts of the market to improve their cost structures and lead times. France’s Airbus teamed up with Safran in a joint venture to develop a new Ariane 6 that should cut costs and lead times in half. In the United States, Orbital Sciences Corporation merged with parts of Alliant Techsystems to drive better savings in key products and to drive development of new and enhanced products.59
Many are clearly focused on emulating some of the success of SpaceX’s integrated model which combines specialty propulsion capabilities with a launcher OEM. However, it is clear that SpaceX is continuing to push the innovation envelope by trying to develop a fully reusable launcher with low refurbishment costs. Those that hope to compete in this environment, therefore, will need to find new ways to free up cash in order to invest in R&D.58
For legacy players, the key will be in improving functionality to move away from massive design margins and over-specification and instead focus on creating a platform that can take a given weight to a given orbit for a given cost.59
59 IATA Economics, Industry Financial Forecast
© 2
016
KP
MG
Inte
rnat
iona
l Coo
pera
tion
(“K
PM
G In
tern
atio
nal”
). K
PM
G In
tern
atio
nal p
rovi
des
no c
lient
ser
vice
s an
d is
a S
wis
s en
tity
with
whi
ch th
e in
depe
nden
t mem
ber f
irms
of K
PM
G n
etw
ork
are
affil
iate
d. N
DP
PS
529
117

Spotlight on select markets
DEFENSE: MARKET SPOTLIGHTS
CanadaBy Grant McDonald, National Sector Leader, Aerospace and Defense, KPMG in Canada
While Canada’s defense budget is dropping as a percentage of GDP (estimated at just under 1 percent currently60), the country remains a strong investment market for those seeking to win some of Canada’s current and upcoming projects or to gain a footprint in North America.
Canada’s budgets may be small at approximately CAD20 billion per year61 (approximately USD14 billion at today’s conversion rates), but the military’s needs are significant. The new government intends to review Canada’s existing defense capabilities. This includes the country’s CAD33 billion (approximately USD24 billion) shipbuilding project. The navy is a top priority of the new government; however, the next-generation fighter jet project is currently under review. If it proceeds, it may create up to USD25 billion in contracts. An additional USD14 billion will need to be invested in the anticipated fixed-wing search and rescue aircraft project.
Technology is also a high priority for Canada’s Department of Defense, reflected in its focus on the Integrated Soldier System Project. More than just advanced kit and weapons, the project aims to dramatically improve battlefield communications and intelligence-gathering capabilities for Canada’s soldiers on the ground.
Yet while the national defense budget may be shrinking relative to GDP growth, Canada continues to attract foreign investment and partnerships. In part, this is because Canada has become a significant export market (50 percent of what is produced is exported62); Canadian-based companies or subsidiaries of U.S. primes have sold billions of dollars’ worth of products to the Middle East and Asia.
It is also because Canada continues to prove itself to be a hub of R&D, innovation, and talent. Particularly in the middle market, Canadian companies and start-ups continue to design, develop, and commercialize new ideas and technologies with applications to the defense sector. Many are being keenly watched as acquisition targets by foreign players.
Canada’s proximity to the U.S. market also cannot be underplayed, irrespective of that country’s slowing defense budget growth rate. Companies from across the globe see Canada as an effective way to build a footprint in the North American market. Canada is emerging as an attractive location for organizations to base operations, close to the U.S. market but with relatively lower operating costs.
60 Centre for International Policy Studies, CIPSBLOG, September 24, 201561 National Post, March 8, 201662 Statistics Canada
© 2
016
KP
MG
Inte
rnat
iona
l Coo
pera
tion
(“K
PM
G In
tern
atio
nal”
). K
PM
G In
tern
atio
nal p
rovi
des
no c
lient
ser
vice
s an
d is
a S
wis
s en
tity
with
whi
ch th
e in
depe
nden
t mem
ber f
irms
of K
PM
G n
etw
ork
are
affil
iate
d. N
DP
PS
529
117
Growth and uncertainty 35
DEFENSE: MARKET SPOTLIGHTS
United KingdomBy Bernard Brown, Defense Sector Leader, KPMG in the UK
With defense spending in the United Kingdom expected to stay steady at around 2 percent of GDP63 and a number of major projects now underway (such as the delivery of two new carriers and a fleet of F-35s), the United Kingdom continues to be a strong market for defense contractors and suppliers.
Skills and capabilities are high and sophisticated in the United Kingdom and R&D spending remains steady, suggesting that the United Kingdom is well-positioned to capture new foreign investment and manufacturing capabilities. The country could, for example, leverage its capabilities and experience to become a center for avionic refurbs and refits in Europe, servicing the growing fleets of F-35s.
The government published its second Strategic Defense and Security Review at the end of 2015, outlining the strategic priorities and budget requirements for the defense sector going forward. Investments are already being channeled towards intelligence and security systems designed to improve national security and it is expected that this focus will intensify over the next few years.
Government procurement and sourcing has undergone some change over the past year that may impact the defense sector. In particular, the introduction of Single Source Pricing regulations aimed at increasing transparency of information across the supply chain and down into Tier 3 suppliers may require foreign primes to open their books to the scrutiny of the U.K. government. The shift will be a dramatic departure from the traditional cost-plus approach.
While the United Kingdom is unarguably a fairly small market in comparison to the United States, defense spending topped USD60 billion in 2014 and the market is growing63. For foreign primes, suppliers, and services organizations, the United Kingdom is shaping up to be a strong foothold into the European market.
63 SIPRI Military Expenditure Database
© 2
016
KP
MG
Inte
rnat
iona
l Coo
pera
tion
(“K
PM
G In
tern
atio
nal”
). K
PM
G In
tern
atio
nal p
rovi
des
no c
lient
ser
vice
s an
d is
a S
wis
s en
tity
with
whi
ch th
e in
depe
nden
t mem
ber f
irms
of K
PM
G n
etw
ork
are
affil
iate
d. N
DP
PS
529
117

AustraliaBy Mike Kalms, Partner, Advisory, KPMG in AustraliaA&D organizations hunting for stable
growth markets are looking at Australia. And rightfully so: while most other mature markets are reducing their defense budget allocations, Australia’s government is committed to increasing defense spending to 2 percent of GDP (raising the total budget to upwards of AUD40 billion).
International defense contractors will be particularly interested in the three main Australian defense mega projects for submarines, frigates, and armored vehicles that are planned for the next 10 to 15 years. Together, the projects are estimated to be worth more than AUD100 billion and—with no indigenous prime contractor capable of leading the projects—the opportunity for foreign defense contractors is significant.
However, those seeking to secure a piece of these projects (or any of the hundreds of other smaller yet significant projects also on the books) will need to start by carefully considering their market entry and business development strategy. The reality is that Australia’s government is looking not just to purchase foreign
parts and technology, officials are also hoping to leverage their budget to build national capability, drive economic growth, and enhance innovation.
To support these efforts, Australia’s government has been working across a number of areas to encourage foreign investment, most notably by simplifying the acquisition process for defense organizations.
One area that will require renewed focus, however, is R&D. Both in the defense sector and outside of it, Australia has continuously faced challenges encouraging collaboration between academics, business, and government. And while this is a fundamental challenge for the national economy, it also creates significant opportunity for defense players able to bring a new R&D proposition to the market.
Looking ahead, we expect to see continued growth and stability in the Australian defense market, driven in part by regional uncertainty around the South China Sea, but also by a growing national capability combined with Australia’s historic export-focused culture.
The Middle EastBy Mohammed Aloyaidi, Director, Advisory, KPMG in Saudi ArabiaWith growth prospects diminishing
in the mature markets, the Middle East is quickly emerging as the growth engine of the global defense sector. The Kingdom of Saudi Arabia alone will spend USD60 billion on defense this year64; the UAE will spend around half of that amount. And over the next 5 years, Saudi Arabia will become one of the world’s three largest defense spenders overall.
In part, growth in defense budgets is being driven by continued instability in the region. Five countries are either currently at war or are in a state of extreme instability. Some wars—such as the one ongoing in Yemen—have brought in other Middle East states which, in turn, further drives demand. And all governments in the region are keenly aware of the ongoing regional and domestic risks related to terrorism.
While defense budgets across the region seem set for growth, many in the sector worry that the petro-driven growth in defense budgets seen over the
decade may be in jeopardy should oil prices remain at historic lows. Over the long term (20 to 30 years), this may certainly create budget challenges for defense but, in the short to medium term, it seems clear that all governments in the region are fully committed to improving their defense posture. Simply put, oil prices would need to remain low for decades in order to make any real dent in Middle East defense spending.
That being said, it is also clear that defense spending priorities and preferences are starting to shift across the region. In the past, Middle East defense customers were happy making bulk purchases from the United States and the United Kingdom with little to no local technical support. But today, many governments across the region are looking for products—and increasingly services—that require deep technical skills and after-market support. Those able to deliver a “whole of life” bundle to governments will likely do well in these markets.
64 Bloomberg Business, December 28, 2015
DEFENSE: MARKET SPOTLIGHTS
© 2
016
KP
MG
Inte
rnat
iona
l Coo
pera
tion
(“K
PM
G In
tern
atio
nal”
). K
PM
G In
tern
atio
nal p
rovi
des
no c
lient
ser
vice
s an
d is
a S
wis
s en
tity
with
whi
ch th
e in
depe
nden
t mem
ber f
irms
of K
PM
G n
etw
ork
are
affil
iate
d. N
DP
PS
529
117

IndiaBy Amber Dubey, Partner and Head of Aerospace and Defense, KPMG in IndiaIndia is clearly a major player in the
world defense market. The government reportedly spent around USD50 billion on defense in 201465, ranking it as the 7th largest spender ahead of Germany and Japan. And the sector is clearly important to the government; one of Prime Minister Modi’s first moves when he was elected was to increase the FDI limits on defense to 49 percent.
However, many believe that India is still not living up to its potential as a manufacturer and developer of defense products. The government’s “Make in India” initiative may work well in consumer products like electronics and automobiles but manufacturing weapons of war is a totally different ballgame. It is a government to government (G2G) or business to government (B2G) industry with just one buyer—the Ministry of Defence (MoD). And in India, it is highly regulated, slow, and not so transparent (although it must be noted that the much-maligned Defence Procurement Procedure (DPP) is expected to undergo some significant changes under defense minister Parrikar).
While Modi’s intent in raising the FDI limits was certainly good, it is widely considered to have been too meek. Very little FDI has transpired in the defense sector over the past 2 years and few global OEMs have
put any real investment into the market. This is not surprising; no global organization is keen to transfer the latest cutting-edge defense technology to India. Global OEMs have sunk billions of dollars over decades into perfect their technology and they will not simply hand it over to support the growth of a new competitor from India. At KPMG, we believe that FDI limits should be set at 74 percent, though getting there may take some time.
For the “Make in India” initiative to be a success in defense, the government will need to take a number of fundamental steps such as junking the current DPP, redesigning the defense offsets program, enhancing the FDI limit and ease of doing business, reducing the role and importance of the Defense Research and Development Organization (DRDO) and Defense Public Sector Undertakings (DPSUs), and enhancing safeguards for intellectual property rights and promoting the India private sector.
While India’s investment climate may not yet be optimal, I believe that with openness, collaboration, and innovation, India could become a world leader in defense design and manufacturing over the next two decades. But much work remains to be accomplished.
65 SIPRI
DEFENSE: MARKET SPOTLIGHTS
Growth and uncertainty 37
© 2
016
KP
MG
Inte
rnat
iona
l Coo
pera
tion
(“K
PM
G In
tern
atio
nal”
). K
PM
G In
tern
atio
nal p
rovi
des
no c
lient
ser
vice
s an
d is
a S
wis
s en
tity
with
whi
ch th
e in
depe
nden
t mem
ber f
irms
of K
PM
G n
etw
ork
are
affil
iate
d. N
DP
PS
529
117

Key takeaways for Defense1. The decline of “traditional” defense:
Government defense spending in many major markets is shifting away from ammunition and large platforms to instead prioritize newer and more sophisticated areas such as cyber capabilities, unmanned vehicles, and increasingly smart weapons. Defense players and their suppliers will need to sharply increase their development and acquisition of new products and services in order to remain relevant.
2. New competitors and new opportunities are emerging: New upstarts and technology players are changing the dynamics of the market with leaner development cycles, lower costs, and faster speed-to-market. In this environment, traditional defense players will need to pay close attention – and possibly partner with – new entrants with credentials in aligned industries (consider how Elon Musk has used his advances in automotive to build capabilities in space and ground transportation concepts like SpaceX and the Hyperloop).
3. Convergence is rising: From adapting products to adjacent markets and building new partnerships with nontraditional players such as technology providers, the defense sector is undergoing an era of convergence. Executives will need to recognize that in this environment, very little is sacred in a company’s portfolio; many will uncover rich new opportunities as a result.
4. Capabilities shifting East: Not only are traditional defense players seeking to enter into new growth markets in Asia, new players in Asia are also looking to create their own capabilities to meet local and regional market demand. Executives should expect a surge in capabilities in the emerging markets that will challenge the Western supply chain’s market dominance over the next decade.
© 2
016
KP
MG
LLP
, a D
elaw
are
limite
d lia
bilit
y pa
rtne
rshi
p an
d th
e U
.S. m
embe
r firm
of t
he K
PM
G n
etw
ork
of in
depe
nden
t m
embe
r firm
s af
filia
ted
with
KP
MG
Inte
rnat
iona
l Coo
pera
tive
(“K
PM
G In
tern
atio
nal”
), a
Swis
s en
tity.
ND
PP
S 5
2911
7
Growth and uncertainty 39
About KPMG’s A&D practiceHow KPMG Aerospace & Defense can helpKPMG’s dedicated Global Aerospace and Defense network of professionals, based in member firms around the world, work with some of the largest and most successful aerospace and defense companies.
Our global reach of over 1,800 professionals with Aerospace and Defense functional experience and process capabilities bring together KPMG’s Audit, Tax and Advisory practices to deliver broad-ranging approaches to clients’ activities within the industry.
With our global industry knowledge and involvement in key industry events, we believe we are among the advisors of choice to the aerospace and defense industry.
KPMG’s Global Aerospace and Defense teams offer proactive, forward-thinking services to member firm clients, helping them take advantage of the sector’s growth potential and overcome the main issues and challenges within the sector.
© 2
016
KP
MG
Inte
rnat
iona
l Coo
pera
tion
(“K
PM
G In
tern
atio
nal”
). K
PM
G In
tern
atio
nal p
rovi
des
no c
lient
ser
vice
s an
d is
a S
wis
s en
tity
with
whi
ch th
e in
depe
nden
t mem
ber f
irms
of K
PM
G n
etw
ork
are
affil
iate
d. N
DP
PS
529
117

Current industrial manufacturing thought leadershipGlobal Industrial Manufacturing Thought LeadershipGlobal Aerospace and Defense Outlook (July 2015)Results from the latest KPMG Global Aerospace and Defense Outlook show that A&D companies are looking for opportunities to sustainably reduce costs and secure new growth – through more efficient research and development (R&D), through more responsive supply chains and through targeted divestments and portfolio adjustments. The new Global Aerospace and Defense Outlook will launch in July 2016.
Profitable Growth in Aerospace and Defense (April 2015)The dynamics of the U.S. A&D marketplace have fundamentally changed. With few buyers, and facing massive cost pressures, most A&D organizations are now looking for new opportunities for revenue growth by looking outside their traditional markets.
Global Manufacturing Outlook (June 2015)KPMG’s Global Manufacturing Outlook report explores the steps that manufacturers around the world are taking to prepare their organizations for upcoming innovation and technology-driven transformation. The new Global Manufacturing Outlook will launch in May 2016.
Global Metals Outlook (September 2015)The Global Metals Outlook annual report provides a comprehensive overview of the global metals and manufacturing sector, along with observations and insights from KPMG partners and industry experts and leaders based on 50 industry-wide executive survey interviews. The new Global Metals and Mining Outlook will launch in June 2016.
© 2
016
KP
MG
Inte
rnat
iona
l Coo
pera
tion
(“K
PM
G In
tern
atio
nal”
). K
PM
G In
tern
atio
nal p
rovi
des
no c
lient
ser
vice
s an
d is
a S
wis
s en
tity
with
whi
ch th
e in
depe
nden
t mem
ber f
irms
of K
PM
G n
etw
ork
are
affil
iate
d. N
DP
PS
529
117

Growth and uncertainty 41
© 2
016
KP
MG
Inte
rnat
iona
l Coo
pera
tion
(“K
PM
G In
tern
atio
nal”
). K
PM
G In
tern
atio
nal p
rovi
des
no c
lient
ser
vice
s an
d is
a S
wis
s en
tity
with
whi
ch th
e in
depe
nden
t mem
ber f
irms
of K
PM
G n
etw
ork
are
affil
iate
d. N
DP
PS
529
117

The views and opinions expressed herein are those of the interviewees and do not necessarily represent the views and opinions of KPMG LLP.
This article represents the views of the author(s) only, and does not necessarily represent the views or professional advice of KPMG LLP.
The information contained herein is of a general nature and is not intended to address the circumstances of any particular individual or entity. Although we endeavor to provide accurate and timely information, there can be no guarantee that such information is accurate as of the date it is received or that it will continue to be accurate in the future. No one should act on such information without appropriate professional advice after a thorough examination of the particular situation.
© 2016 KPMG International Cooperative (“KPMG International”), a Swiss entity. Member firms of the KPMG network of independent firms are affiliated with KPMG International. KPMG International provides no client services. No member firm has any authority to obligate or bind KPMG International or any other member firm vis-à-vis third parties, nor does KPMG International have any such authority to obligate or bind any member firm. All rights reserved. NDPPS 529117
The KPMG name and logo are registered trademarks or trademarks of KPMG International.
Contacts
kpmg.com/socialmedia
KPMG’s Global and U.S. Aerospace & Defense Leadership
Doug GatesGlobal Head ofAerospace and DefenseT: +1 404 222 3609 E: [email protected]
Adil KhanPrincipal, Deal AdvisoryKPMG in the U.S.T: +1 312 665 2525 E: [email protected]
Additional KPMG contributors and country leaders
Mohammed AloyaidiDirector, AdvisoryKPMG in Saudi ArabiaT: +966118748500 E: [email protected]
Bernard BrownPartner Sector Lead for Defense and Business ServicesKPMG in the UKT: +44 20 7311 6605 E: [email protected]
Amber DubeyPartner and Head ofAerospace and DefenseKPMG in IndiaT: +91 987 1933711 E: [email protected]
David FreyPartnerKPMG in ChinaT: +862122122810 E: [email protected]
Constance HunterChief EconomistKPMG in the U.S.T: +1 212 954 3396 E: [email protected]
Mike KalmsPartner, AdvisoryKPMG in AustraliaT: +61 3 9288 6426 E: [email protected]
Kathleen MadiganAssociate Director & Economic WriterKPMG in the U.S.T: +1 267 256 7263 E: [email protected]
Tom MayorPrincipal Strategy Industrial ManufacturingKPMG in the U.S.T: +1 216 875 8061 E: [email protected]
Grant McDonaldNational Sector Leader,Aerospace and DefenseKPMG in CanadaT: +1 613 212 3613 E: [email protected]
Matt RichardsManaging Director, AdvisoryKPMG in the U.S.T: +1 817 437 5474 E: [email protected]