growth and pattern of expenditure of the central...
TRANSCRIPT
85
CHAPTER 4
Growth and Pattern of Expenditure of the Central Government
Public expenditure is an important instrument of the
fiscal system of a federal nation. The size and pattern of the
public spending has great relevance in the growth process
and in the reduction of economic disparities.
The study of public expenditure was neglected till
1920s because of the belief that all public expenditure was
waste. Infact, this belief was strengthened by the writings of
the classical economists and especially that of Adam Smith
(1776) who advocated that the government should restrict
its activities to “justice, police and arms” (Zahir, 1972).
To J. B. Say, public spending was usually for useless
gratification of the wasteful whims of rulers; also it usually
interfered with the process of the private capital formation
necessary to the development of trade and industry by
draining of funds that otherwise might have been
accumulated by thrifty savers (Newman, 1968). Ricardo, too,
viewed public spending as wasteful because of its possible
effects on private capital formation. On the question of
government’s role, Malthus was also of the view that
public expenditure could be excessive, leading to
“injudicious taxation” or too large a national debt (Newman,
1968).
86
Less extreme but having much in common with
classical views is the position of John Stuart Mill who was
in favour of laissez-faire held that “the business of life is
better performed when those who have an immediate
interest in it are left to take their own course, uncontrolled
either by the mandate of law or the meddling of any public
functioning” (Groves, 1964). Contrary to it, in 1936, Lutz
favoured public expenditure as it directly adds to the
community wealth. He said, “Well run government
commercial enterprises, reforestation and reclamation
projects, and other forms of state business are the most
obvious illustrations. Even the expenditure on ordinary
services may result in the accumulation of certain assets,
such as public buildings, which are a useful addition to the
aggregate of community wealth”.
Keynes, a revolutionary economist, regarded public
expenditure as an exogenous factor which can be utilized as
a policy instrument to stimulate economic growth. Taylor
(1953) favoured public expenditure by saying, “Government
funds may not only help to fill in the troughs of deficiencies
in national income, but under proper circumstances may
generate increase in private spending which constitute
recovery and prosperity” (Taylor, 1953).
R. A. Musgrave, a twentieth century economist,
advocated public expenditure since a government is forced
to do many activities such as: (i) redistributive activities; (ii)
activities to secure a re- allocation of resources; (iii)

87
commercial activities, and stabilizing activities (Chand,
2008).
Governments today incur expenditure in order to fulfill
the following roles in the economy: (a) to correct distortions
of market failures; (b) regulate private activity that might
harm society; (c) provide public goods and services (i.e.,
economic and social infrastructure) and (d) often engage in
production activity (Sattar, 2006). The increased
participation of the government in economic activities has
brought public spending to the forefront among the fiscal
instruments.
Through public expenditure, the government
influences directly or indirectly production, consumption
and distribution of the nation. It thus helps towards the
economic and social development of the society. “It can be
used for stabilization, business cycle inversion, and growth
purposes. It gives rise to positive externalities to economy
and society, the more so through its capital component”
(Piana, 2001).
It is worth noting here that public expenditure has
played significant role in developed as well as
underdeveloped countries. “In the developed economies, the
role of public expenditure consists in preventing cyclical
fluctuations, counteracting a secular tendency towards
stagnation and improving income distribution. Public
expenditure can also be used as a lever to raise the level of
income and employment. However, public expenditure has
88
played threefold role in an underdeveloped economy in: (a)
promoting economic development; (b) redistribution of
income; and (c) balanced regional development” (Zahir,
1972). Public expenditure is also playing an important role
in the development of Indian economy.
Classification of Public Expenditure in India
Classification of Public Expenditure in India is
important because different categories of expenditure (a)
explain the interrelationship between the government sector
and the rest of the economy and (b) reveal the relative size of
different governmental activities in the economy. However,
the Constitution requires revenue and capital expenditures
to be shown separately in the budget. Article 112(2) states:
“The estimates of expenditure embodied in the annual
financial statement shall show separately – (a) the sums
required to meet expenditure charged upon the
Consolidated Fund of India; and (b) the sums required to
meet other expenditure proposed to be made from the
Consolidated Fund of India, and shall distinguish
expenditure on revenue account from other expenditure”.
The same provision is repeated under Article 202
under the State Section. The distinction between revenue
and capital expenditures not only is a constitutional
requirement but also an essential ingredient for policy
formulation and efficient resource allocation (Economic
Survey, 2006-07). Thus it is useful to analyse the various

89
components of public expenditure of central government of
India
Total expenditure of the central government comprises
of revenue and capital expenditure. Revenue expenditure is
expenditure incurred for purposes other than creation of
assets of the central government. In many countries, it is
known as current expenditure (Economic Survey, 2006-07).
On the other hand, those expenditures of the Government
which lead to the reduction in recurring financial liabilities
fall under the category of capital expenditure. Such
expenditures pertain to payments on acquisition of assets
and loans and advances given.
Trends of total expenditure, revenue expenditure and
capital expenditure have been calculated by using semi-
logarithmic trend (Y=abx). Total expenditure of the central
government since 1975-76 has been continuously growing
and revenue expenditure has grown at higher rate as
compared to capital expenditure (as shown in Graph 4.1).
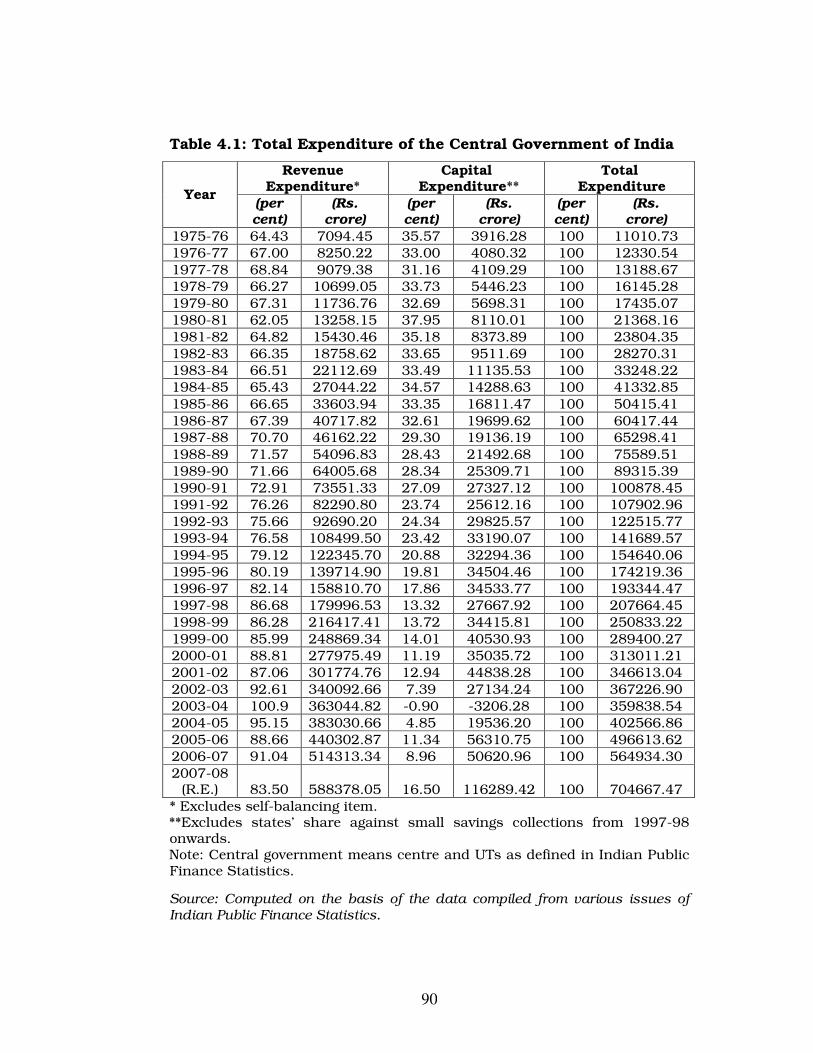
Table 4.1 presents the amount of revenue expenditure,
capital expenditure and total expenditure and the share of
revenue expenditure and capital expenditure in total
expenditure of the central government. Since mid-1970’s,
the main objective of the central government was to give a
concrete shape to the new design of development by
revamping public expenditure policy in the direction of more
employment programmes, rural development and also to
maintain price stability. To achieve this objective, the
90
Table 4.1: Total Expenditure of the Central Government of India
Revenue Expenditure*
Capital Expenditure**
Total Expenditure
Year (per cent)
(Rs. crore)
(per cent)
(Rs. crore)
(per cent)
(Rs. crore)
1975-76 64.43 7094.45 35.57 3916.28 100 11010.73 1976-77 67.00 8250.22 33.00 4080.32 100 12330.54 1977-78 68.84 9079.38 31.16 4109.29 100 13188.67 1978-79 66.27 10699.05 33.73 5446.23 100 16145.28 1979-80 67.31 11736.76 32.69 5698.31 100 17435.07 1980-81 62.05 13258.15 37.95 8110.01 100 21368.16 1981-82 64.82 15430.46 35.18 8373.89 100 23804.35 1982-83 66.35 18758.62 33.65 9511.69 100 28270.31 1983-84 66.51 22112.69 33.49 11135.53 100 33248.22 1984-85 65.43 27044.22 34.57 14288.63 100 41332.85 1985-86 66.65 33603.94 33.35 16811.47 100 50415.41 1986-87 67.39 40717.82 32.61 19699.62 100 60417.44 1987-88 70.70 46162.22 29.30 19136.19 100 65298.41 1988-89 71.57 54096.83 28.43 21492.68 100 75589.51 1989-90 71.66 64005.68 28.34 25309.71 100 89315.39 1990-91 72.91 73551.33 27.09 27327.12 100 100878.45 1991-92 76.26 82290.80 23.74 25612.16 100 107902.96 1992-93 75.66 92690.20 24.34 29825.57 100 122515.77 1993-94 76.58 108499.50 23.42 33190.07 100 141689.57 1994-95 79.12 122345.70 20.88 32294.36 100 154640.06 1995-96 80.19 139714.90 19.81 34504.46 100 174219.36 1996-97 82.14 158810.70 17.86 34533.77 100 193344.47 1997-98 86.68 179996.53 13.32 27667.92 100 207664.45 1998-99 86.28 216417.41 13.72 34415.81 100 250833.22 1999-00 85.99 248869.34 14.01 40530.93 100 289400.27 2000-01 88.81 277975.49 11.19 35035.72 100 313011.21 2001-02 87.06 301774.76 12.94 44838.28 100 346613.04 2002-03 92.61 340092.66 7.39 27134.24 100 367226.90 2003-04 100.9 363044.82 -0.90 -3206.28 100 359838.54 2004-05 95.15 383030.66 4.85 19536.20 100 402566.86 2005-06 88.66 440302.87 11.34 56310.75 100 496613.62 2006-07 91.04 514313.34 8.96 50620.96 100 564934.30 2007-08
(R.E.) 83.50 588378.05 16.50 116289.42 100 704667.47 * Excludes self-balancing item. **Excludes states’ share against small savings collections from 1997-98 onwards. Note: Central government means centre and UTs as defined in Indian Public Finance Statistics.
Source: Computed on the basis of the data compiled from various issues of Indian Public Finance Statistics.
91
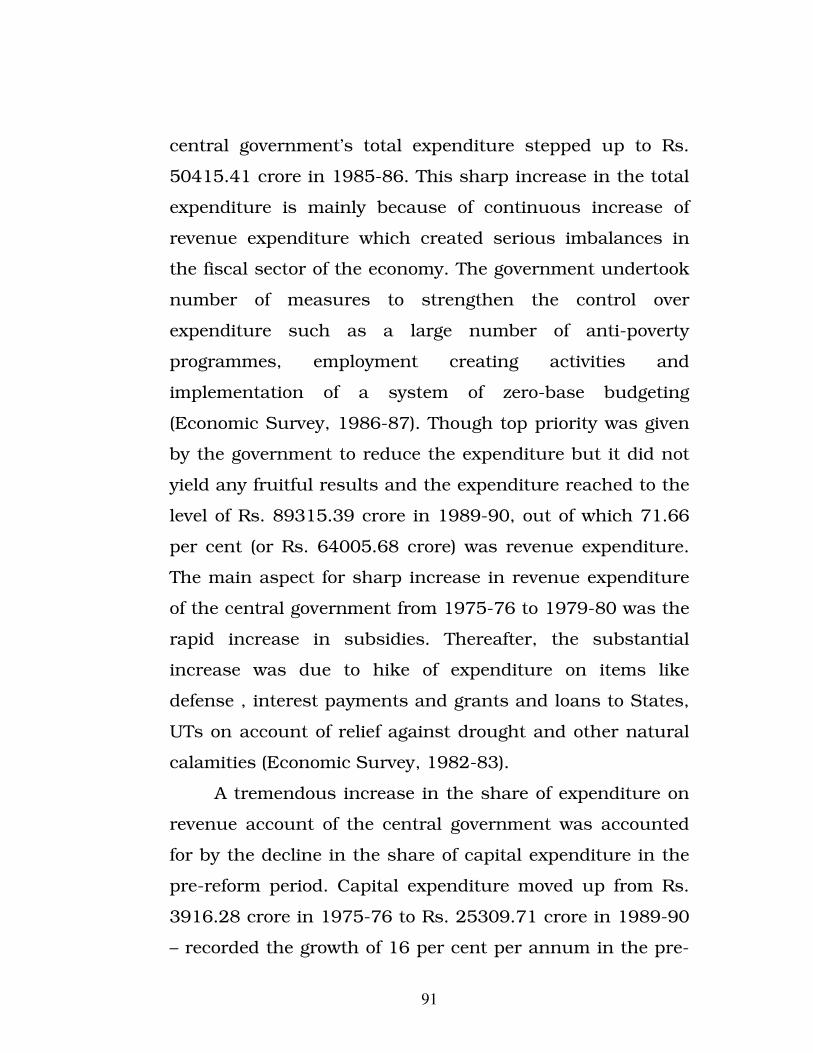
central government’s total expenditure stepped up to Rs.
50415.41 crore in 1985-86. This sharp increase in the total
expenditure is mainly because of continuous increase of
revenue expenditure which created serious imbalances in
the fiscal sector of the economy. The government undertook
number of measures to strengthen the control over
expenditure such as a large number of anti-poverty
programmes, employment creating activities and
implementation of a system of zero-base budgeting
(Economic Survey, 1986-87). Though top priority was given
by the government to reduce the expenditure but it did not
yield any fruitful results and the expenditure reached to the
level of Rs. 89315.39 crore in 1989-90, out of which 71.66
per cent (or Rs. 64005.68 crore) was revenue expenditure.
The main aspect for sharp increase in revenue expenditure
of the central government from 1975-76 to 1979-80 was the
rapid increase in subsidies. Thereafter, the substantial
increase was due to hike of expenditure on items like
defense , interest payments and grants and loans to States,
UTs on account of relief against drought and other natural
calamities (Economic Survey, 1982-83).
A tremendous increase in the share of expenditure on
revenue account of the central government was accounted
for by the decline in the share of capital expenditure in the
pre-reform period. Capital expenditure moved up from Rs.
3916.28 crore in 1975-76 to Rs. 25309.71 crore in 1989-90
– recorded the growth of 16 per cent per annum in the pre-

92
reform period of fifteen years (Table 4.2). It constituted
Graph 4.1: Trends in Revenue, Capital and Total Expenditure of the
Central Government of India
0
100000
200000
300000
400000
500000
600000
700000
800000
1975-7
6
1977-7
8
1979-8
0
1981-8
2
1983-8
4
1985-8
6
1987-8
8
1989-9
0
1991-9
2
1993-9
4
1995-9
6
1997-9
8
1999-0
0
2001-0
2
2003-0
4
2005-0
6
2007-0
8
Pre-reform period Post-reform period
Rs. cro
re
Revenue Expenditure Capital Expenditure Total Expenditure
Source: Computed on the basis of data compiled from the various issues of Indian Public Finance Statistics. 35.57 per cent of the total expenditure of the central
government in the year 1975-76. This percentage decreased
to 34.57 per cent in 1984-85 and further declined to 28.34
per cent in 1989-90. The share of capital account
expenditure in total expenditure declined by 7 percentage
points in the pre-reform period.
The central government has also taken number of
steps since 1990s to curtail built-in-growth in expenditure
and to bring about structural changes in the composition of
expenditure which include reduction of posts at various
levels, introduction of Expenditure Reforms Commission,
subjecting all existing schemes to zero-base budgeting and
review of all subsidies. Despite these numerous measures
93
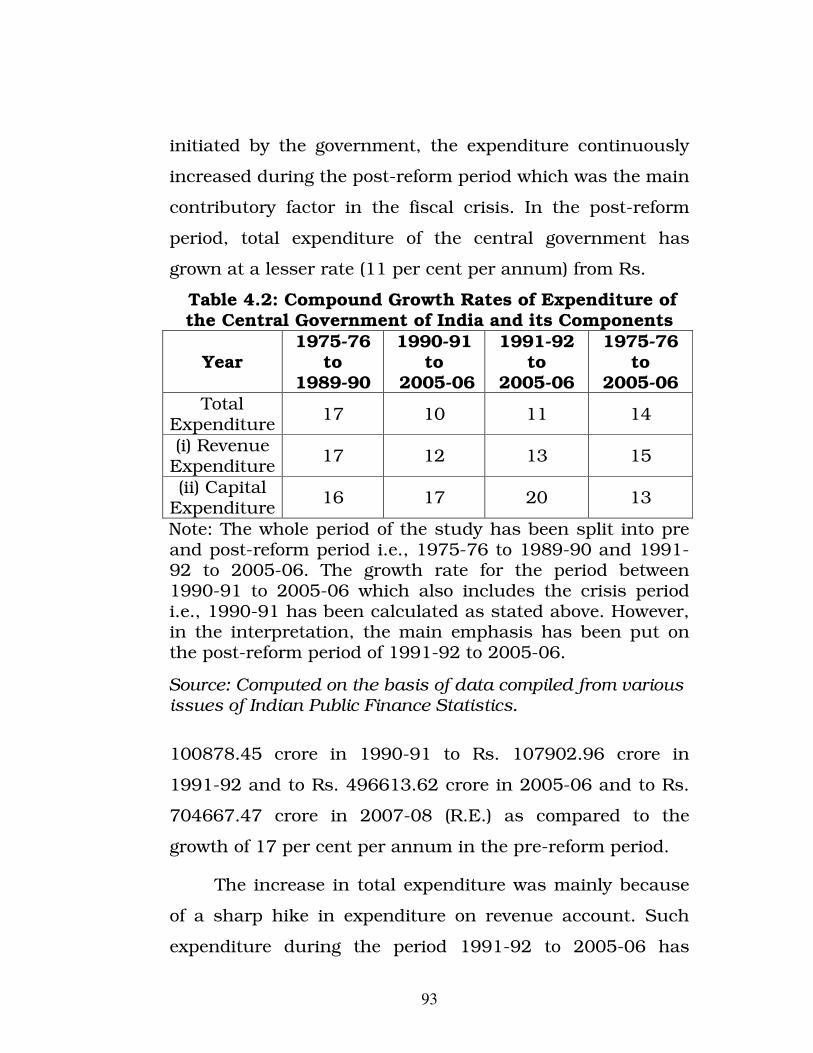
initiated by the government, the expenditure continuously
increased during the post-reform period which was the main
contributory factor in the fiscal crisis. In the post-reform
period, total expenditure of the central government has
grown at a lesser rate (11 per cent per annum) from Rs.
Table 4.2: Compound Growth Rates of Expenditure of the Central Government of India and its Components
Year 1975-76
to 1989-90
1990-91 to
2005-06
1991-92 to
2005-06
1975-76 to
2005-06 Total
Expenditure 17 10 11 14
(i) Revenue Expenditure
17 12 13 15
(ii) Capital Expenditure
16 17 20 13
Note: The whole period of the study has been split into pre and post-reform period i.e., 1975-76 to 1989-90 and 1991-92 to 2005-06. The growth rate for the period between 1990-91 to 2005-06 which also includes the crisis period i.e., 1990-91 has been calculated as stated above. However, in the interpretation, the main emphasis has been put on the post-reform period of 1991-92 to 2005-06.
Source: Computed on the basis of data compiled from various issues of Indian Public Finance Statistics.
100878.45 crore in 1990-91 to Rs. 107902.96 crore in
1991-92 and to Rs. 496613.62 crore in 2005-06 and to Rs.
704667.47 crore in 2007-08 (R.E.) as compared to the
growth of 17 per cent per annum in the pre-reform period.
The increase in total expenditure was mainly because
of a sharp hike in expenditure on revenue account. Such
expenditure during the period 1991-92 to 2005-06 has

94
registered the growth of 13 per cent per annum (from Rs.
82290.8 crore to Rs. 440302.87 crore). It constituted 76.26
per cent in 1991-92 and was as much as 88.81 per cent and
reached to the level of 91.04 per cent of total expenditure in
2000-01 and 2006-07, respectively. This increasing trend
was because of the rise in interest payments and the sharp
escalation in its salary bill (pay and allowances) and pension
payments. Another reason behind this growing share of
public expenditure on revenue account was the measures
designed by the government for the welfare of poor,
especially for those in rural areas. To benefit agricultural
64.43
35.57
68.84
31.16
67.31
32.69
64.82
35.18
66.51
33.49
66.65
33.35
70.70
29.30
71.66
28.34
76.26
23.74
76.58
23.42
80.19
19.81
86.68
13.32
85.99
14.01
87.06
12.94
100.90
-0.90
88.66
11.34
83.50
16.50
-20
0
20
40
60
80
100
120
As p
er cent of Tota
l
19
75-
76
19
77-
78
19
79-
80
19
81-
82
19
83-
84
19
85-
86
19
87-
88
19
89-
90
19
91-
92
19
93-
94
19
95-
96
19
97-
98
19
99-
00
20
01-
02
20
03-
04
20
05-
06
20
07-
08
Pre-reform period Post-reform period
Graph 4.2: Share of Revenue and Capital Expenditure in Total Capital
Expenditure of the Central Government of India
Revenue Expenditure Capital Expenditure
Source: Computed on the basis of data compiled from various issues of Indian Public Finance Statistics. sector like debt relief for agricultural loans up to Rs. 10,000,
introduction of an employment guarantee scheme in
drought prone areas with acute problems of rural

95
unemployment were the measures especially designed by
the government.
It is clearly observed from the Graph 4.2 that revenue
expenditure not only constitutes a significant share of total
expenditure of the central government, but has also
observed an increasing trend. As a result, there is a secular
fall in the share of capital expenditure, which is mirrored in
the rise in the share of revenue expenditure in the post-
reform period too. Capital expenditure of the central
government went up from Rs. 25612.16 crore in 1991-92 to
Rs. 56310.75 crore in 2005-06 - recorded the growth of 20
per cent per annum during the post-reform period. It rose to
Rs. 116289.42 crore in 2007-08 (R.E.). Looking at capital
expenditure as a proportion of total expenditure of the
central government, the share of capital expenditure has
been on the decline in the post-reform period and reached
to 8.96 per cent in 2006-07. This was due to the fact that
expenditure compression was brought about mainly
through cut in capital expenditure. During post-reform
period, the share stepped down by 11 percentage points.
This happened partly because of the cessation of loans from
the central government to states, which were classified as
capital expenditures (Reserve Bank of India Bulletin,
December 2008). So, in spite of all these reforms, the
decline in the share of capital account expenditure is
greater than the decline in this share in pre-reform period.
96
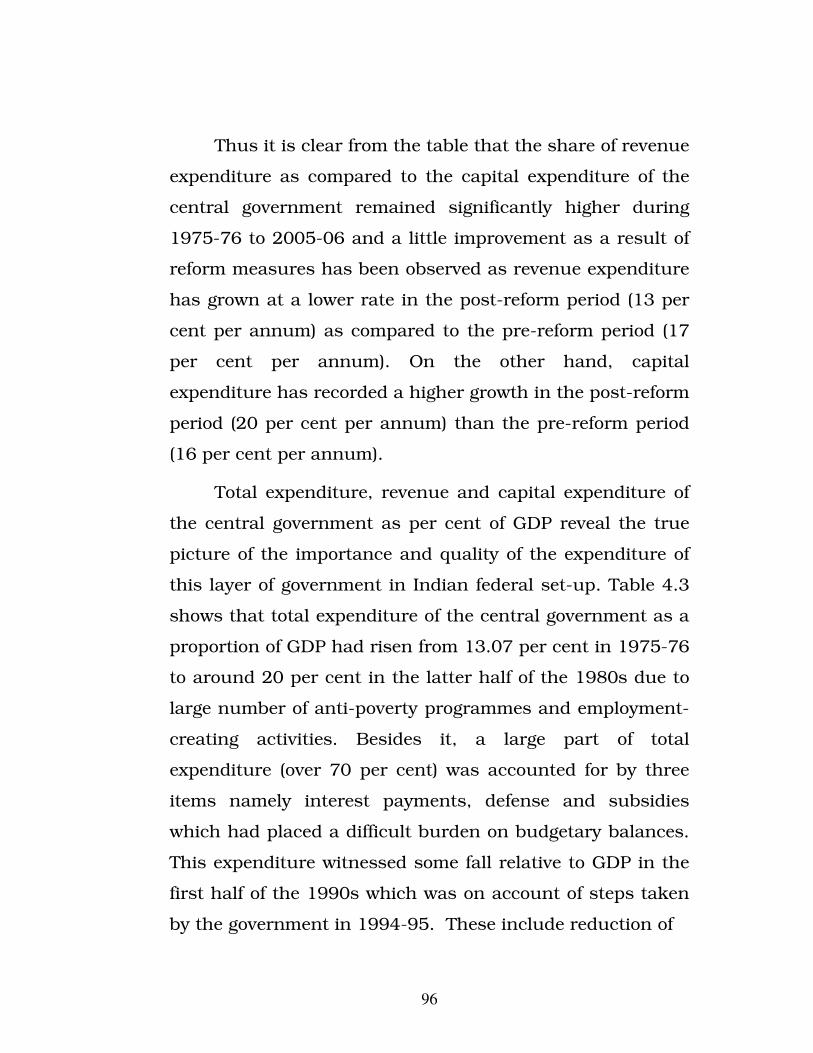
Thus it is clear from the table that the share of revenue
expenditure as compared to the capital expenditure of the
central government remained significantly higher during
1975-76 to 2005-06 and a little improvement as a result of
reform measures has been observed as revenue expenditure
has grown at a lower rate in the post-reform period (13 per
cent per annum) as compared to the pre-reform period (17
per cent per annum). On the other hand, capital
expenditure has recorded a higher growth in the post-reform
period (20 per cent per annum) than the pre-reform period
(16 per cent per annum).
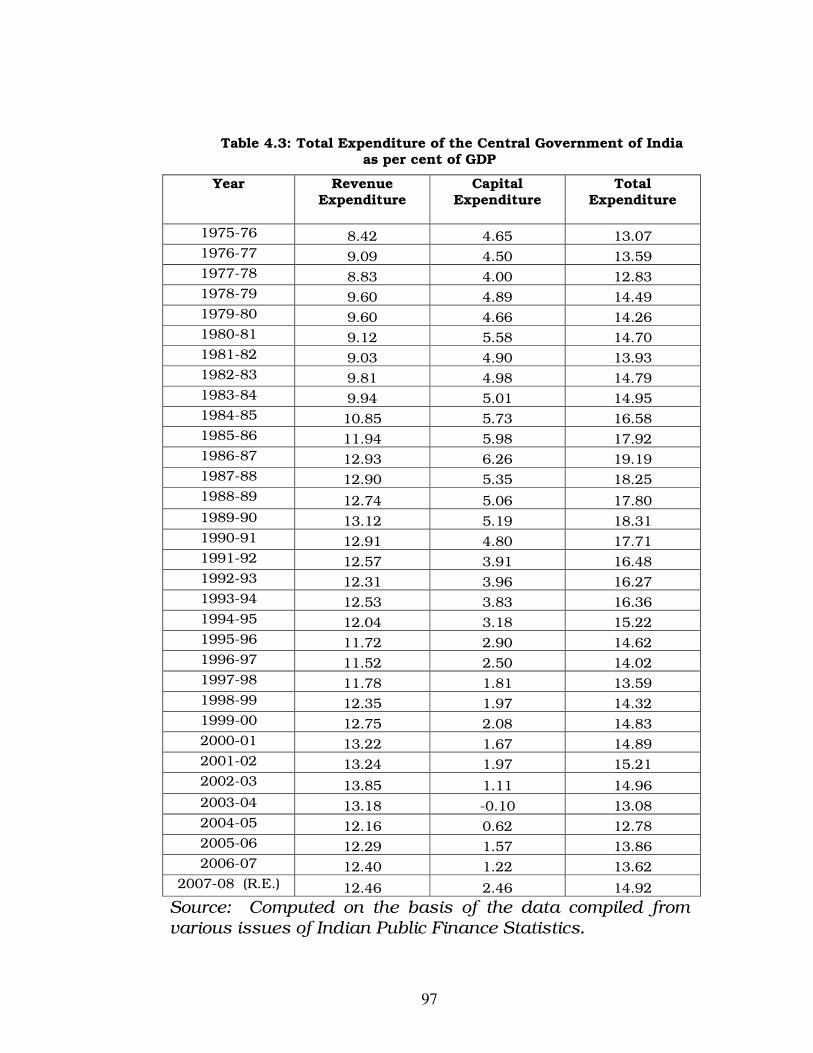
Total expenditure, revenue and capital expenditure of
the central government as per cent of GDP reveal the true
picture of the importance and quality of the expenditure of
this layer of government in Indian federal set-up. Table 4.3
shows that total expenditure of the central government as a
proportion of GDP had risen from 13.07 per cent in 1975-76
to around 20 per cent in the latter half of the 1980s due to
large number of anti-poverty programmes and employment-
creating activities. Besides it, a large part of total
expenditure (over 70 per cent) was accounted for by three
items namely interest payments, defense and subsidies
which had placed a difficult burden on budgetary balances.
This expenditure witnessed some fall relative to GDP in the
first half of the 1990s which was on account of steps taken
by the government in 1994-95. These include reduction of
97
Table 4.3: Total Expenditure of the Central Government of India as per cent of GDP
Year Revenue Expenditure
Capital Expenditure
Total Expenditure
1975-76 8.42 4.65 13.07 1976-77 9.09 4.50 13.59 1977-78 8.83 4.00 12.83 1978-79 9.60 4.89 14.49 1979-80 9.60 4.66 14.26 1980-81 9.12 5.58 14.70 1981-82 9.03 4.90 13.93 1982-83 9.81 4.98 14.79 1983-84 9.94 5.01 14.95 1984-85 10.85 5.73 16.58 1985-86 11.94 5.98 17.92 1986-87 12.93 6.26 19.19 1987-88 12.90 5.35 18.25 1988-89 12.74 5.06 17.80 1989-90 13.12 5.19 18.31 1990-91 12.91 4.80 17.71 1991-92 12.57 3.91 16.48 1992-93 12.31 3.96 16.27 1993-94 12.53 3.83 16.36 1994-95 12.04 3.18 15.22 1995-96 11.72 2.90 14.62 1996-97 11.52 2.50 14.02 1997-98 11.78 1.81 13.59 1998-99 12.35 1.97 14.32 1999-00 12.75 2.08 14.83 2000-01 13.22 1.67 14.89 2001-02 13.24 1.97 15.21 2002-03 13.85 1.11 14.96 2003-04 13.18 -0.10 13.08 2004-05 12.16 0.62 12.78 2005-06 12.29 1.57 13.86 2006-07 12.40 1.22 13.62
2007-08 (R.E.) 12.46 2.46 14.92
Source: Computed on the basis of the data compiled from various issues of Indian Public Finance Statistics.

98
posts at various levels, overall cut on consumption of
petrol/diesel, reduction in expenditure on telephone and
restrictions on purchases of additional vehicles (Economic
Survey, 1994-95). Total expenditure-GDP ratio declined
from 17.71 per cent in 1990-91 to 16.48 per cent in 1991-
92 and further to 13.59 per cent in 1997-98. Consequently,
there was decline in the central government fiscal deficit.
The situation changed with growth in total expenditure
picking up from 1998-99. The compression in total
expenditure witnessed in the first half of the 1990s was
mainly on account of the fall in the capital expenditure-GDP
ratio. In 2001-02, total expenditure was 15.21 per cent of
GDP (13.24 per cent of GDP of revenue expenditure and
1.97 per cent of GDP of capital expenditure) which was
marginally higher than the level in the previous year. While
the level of expenditure is not very high by international
comparison, the main problem in public expenditure
management has been the poor quality outcomes of such
expenditure (Economic Survey, 2004-05). In 2004-05, the
government tried to “check the deterioration in the
composition of expenditure” and also “carried the process of
improving revenue expenditure and increasing capital
expenditure” (Singh, 2008). At the same time, the
compression entirely on non-plan account of revenue
expenditure became the target (Economic Survey, 2004-05).
As such, an important reform undertaken was the
enactment of the FRBM Act in 2003 which became effective
from July 5, 2004. It provides an institutional framework
and binds the government to prudent fiscal policies which

99
facilitated the process of fiscal consolidation. As a result,
the total expenditure fell to 12.78 per cent in 2004-05. But
it began to rise thereafter and reached to 14.92 per cent of
GDP in 2007-08 (R.E.).
Looking at revenue expenditure as per cent of GDP, a
secular rise was noticed. Revenue expenditure rose from
8.42 per cent of GDP in 1975-76 to 13.12 per cent of GDP in
1989-90. Due to continuous attempts since 1991-92,
revenue expenditure-GDP ratio of the central government
could be brought down from 12.57 per cent in 1991-92 to
only by 1.39 per cent points and reached to 11.52 per cent
in 1996-97. This was despite the fact that interest payments
continue to increase (Economic Survey, 1995-96).
Thereafter, fiscal discipline became loose on the expenditure
side of the central government. Revenue expenditure-GDP
ratio increased to 13.85 per cent in 2002-03. Due to the
enactment of the FRBMA in 2003, revenue expenditure of
the central government fell to 12.16 per cent of GDP in
2004-05 from 13.18 per cent of GDP in 2003-04. It again
increased to the level of 12.46 per cent of GDP in 2007-08
(R.E.). It has serious implications for economic growth as
well as for fiscal discipline.
Capital expenditure, on the other hand, hovered
around 4 to 6 per cent of GDP during pre-reform period.
However, the fiscal crisis of 1990-91 had its impact on the
total expenditure of the central government in the 1990s.
Infact, the expenditure cut of the nineties could be affected
at the cost of capital expenditure. It declined from 4.8 per
100
cent of GDP in 1990-91 to 3.91 per cent of GDP in 1991-92
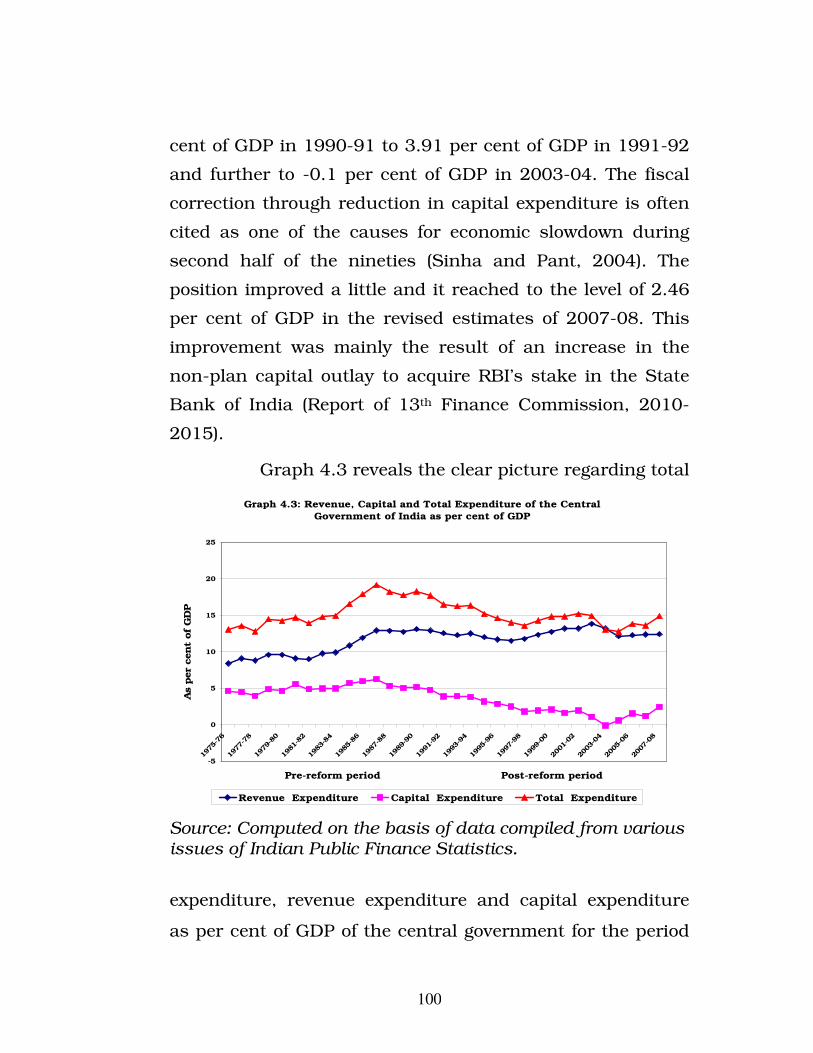
and further to -0.1 per cent of GDP in 2003-04. The fiscal
correction through reduction in capital expenditure is often
cited as one of the causes for economic slowdown during
second half of the nineties (Sinha and Pant, 2004). The
position improved a little and it reached to the level of 2.46
per cent of GDP in the revised estimates of 2007-08. This
improvement was mainly the result of an increase in the
non-plan capital outlay to acquire RBI’s stake in the State
Bank of India (Report of 13th Finance Commission, 2010-
2015).
Graph 4.3 reveals the clear picture regarding total
Graph 4.3: Revenue, Capital and Total Expenditure of the Central
Government of India as per cent of GDP
-5
0
5
10
15
20
25
1975
-76
1977
-78
1979
-80
1981
-82
1983
-84
1985
-86
1987
-88
1989
-90
1991
-92
1993
-94
1995
-96
1997
-98
1999
-00
2001
-02
2003
-04
2005
-06
2007
-08
Pre-reform period Post-reform period
As p
er
cent
of G
DP
Revenue Expenditure Capital Expenditure Total Expenditure
Source: Computed on the basis of data compiled from various issues of Indian Public Finance Statistics.
expenditure, revenue expenditure and capital expenditure
as per cent of GDP of the central government for the period
101
1975-76 to 2007-08. Revenue expenditure as per cent of
GDP was not only high and continuously growing in the pre-
reform period but the gap between revenue expenditure and
capital expenditure started widening in the mid-eighties.
During the post-reform period, no doubt, it has followed a
stable path but has not only much higher than capital
expenditure and the gap between these two widened
extremely up to mid-2000s.
Composition of Revenue Expenditure
Revenue expenditure is classified into non-
developmental expenditure, developmental expenditure and
statutory grants to states. Non-developmental expenditure
consists of expenditure on administration and defense and
also payment of interests. Developmental expenditure
consists of expenditure on social and community services
such as education and health and on economic services
such as agriculture, industry, power, transportation and
communication.
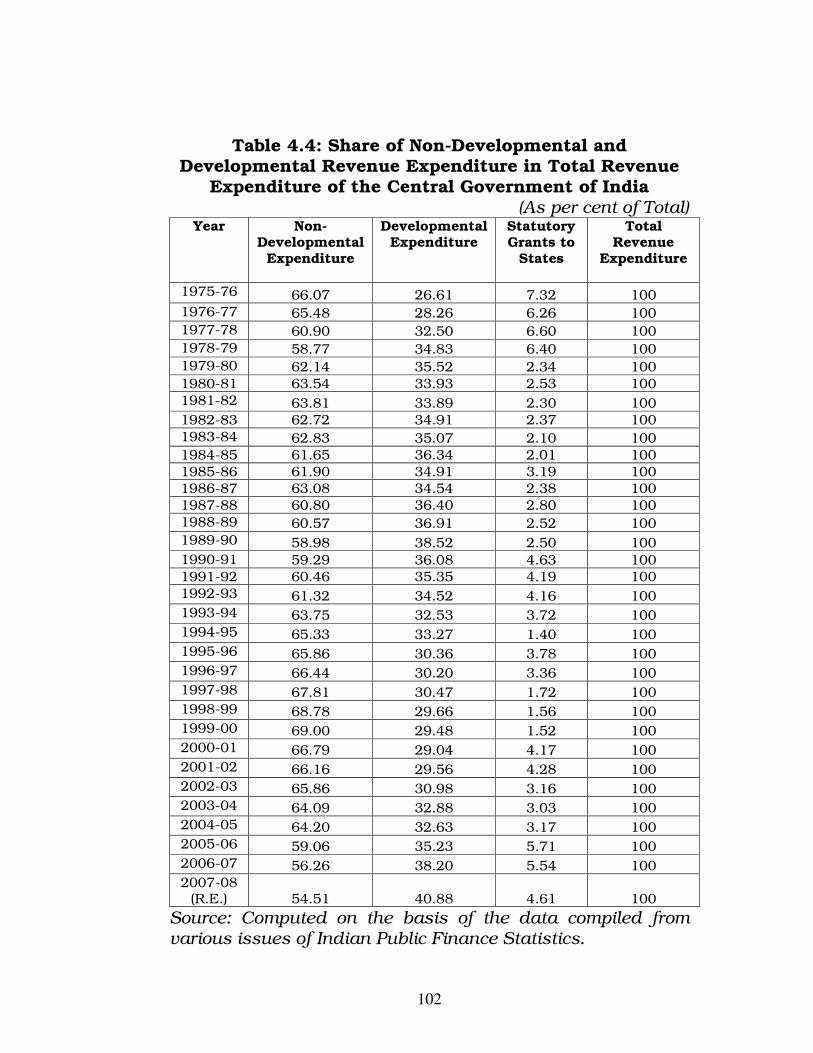
When we categorize revenue expenditure into
developmental and non-developmental categories, it has
been observed that expenditure in both of these categories
has increased during the period under study (Table 4.4).
From the share of non-developmental and developmental
revenue expenditure in total revenue expenditure of the
central government, it can be observed that non-
developmental revenue expenditure contributes a significant
102
Table 4.4: Share of Non-Developmental and Developmental Revenue Expenditure in Total Revenue
Expenditure of the Central Government of India (As per cent of Total)
Year Non-Developmental
Expenditure
Developmental Expenditure
Statutory Grants to
States
Total Revenue
Expenditure
1975-76 66.07 26.61 7.32 100 1976-77 65.48 28.26 6.26 100 1977-78 60.90 32.50 6.60 100 1978-79 58.77 34.83 6.40 100 1979-80 62.14 35.52 2.34 100 1980-81 63.54 33.93 2.53 100 1981-82 63.81 33.89 2.30 100 1982-83 62.72 34.91 2.37 100 1983-84 62.83 35.07 2.10 100 1984-85 61.65 36.34 2.01 100 1985-86 61.90 34.91 3.19 100 1986-87 63.08 34.54 2.38 100 1987-88 60.80 36.40 2.80 100 1988-89 60.57 36.91 2.52 100 1989-90 58.98 38.52 2.50 100 1990-91 59.29 36.08 4.63 100 1991-92 60.46 35.35 4.19 100 1992-93 61.32 34.52 4.16 100 1993-94 63.75 32.53 3.72 100 1994-95 65.33 33.27 1.40 100 1995-96 65.86 30.36 3.78 100 1996-97 66.44 30.20 3.36 100 1997-98 67.81 30.47 1.72 100 1998-99 68.78 29.66 1.56 100 1999-00 69.00 29.48 1.52 100 2000-01 66.79 29.04 4.17 100 2001-02 66.16 29.56 4.28 100 2002-03 65.86 30.98 3.16 100 2003-04 64.09 32.88 3.03 100 2004-05 64.20 32.63 3.17 100 2005-06 59.06 35.23 5.71 100 2006-07 56.26 38.20 5.54 100 2007-08
(R.E.) 54.51 40.88 4.61 100
Source: Computed on the basis of the data compiled from various issues of Indian Public Finance Statistics.

103
proportion of the total revenue expenditure of the central
government (as shown in Graph 4.4). Throughout the period
covered by the study, the share of non-developmental
revenue expenditure was more than developmental revenue
expenditure of the centre and has remained 60 to 70 per
cent. The share for most of the years of non-developmental
revenue expenditure of the central government fell down to
58.77 per cent in 1978-79 from 66.07 per cent in 1975-76.
The share of non-developmental revenue expenditure rose to
62.14 per cent in 1979-80. An important factor responsible
for this was the increasing interest burden on the budget
(Economic Survey, 1980-81). Thereafter, this expenditure
category indicates roughly a stable and a high share in the
pre-reform period. During post-reform period, non-
developmental revenue expenditure of the central
government raised from Rs. 43614.83 crore in 1990-91 to
Rs. 49754.40 crore in 1991-92 and further to Rs.
320739.25 crore in 2007-08 (R.E.). The share of non-
developmental revenue expenditure in total revenue
expenditure increased from 59.29 per cent in 1990-91 to
60.46 per cent in 1991-92 and to 69 per cent in 1999-00. It
was only in the twenty first century that the non-
developmental revenue expenditure’s share in total revenue
expenditure began to fall. In 2001-02, it fell to 66.16 per
cent of total revenue expenditure, to 64.2 per cent in 2004-
05 and 54.51 per cent in 2007-08 (R.E.). The reason behind
this fall was the significant measures introduced by the

104
government. One among them was regarding pension
reforms. A new pension programme based on defined
contributions was envisaged for those entering central
government services after October 1, 2001 (Economic
Survey, 2001-02).
Further, developmental revenue expenditure increased
from Rs. 1888.1 crore in 1975-76 (26.61 per cent) to Rs.
4168.96 crore in 1979-80 (35.52 per cent) and it was due to
66.07
26.61
7.32
60.90
32.50
6.60
62.14
35.52
2.34
63.81
33.89
2.30
62.83
35.07
2.10
61.90
34.91
3.19
60.80
36.40
2.80
58.98
38.52
2.50
60.46
35.35
4.19
63.75
32.53
3.72
65.86
30.36
3.78
67.81
30.47
1.72
69.00
29.48
1.52
66.16
29.56
4.28
64.09
32.88
3.03
59.06
35.23
5.71
54.51
40.88
4.61
0
10
20
30
40
50
60
70
80
90
100
As p
er
cen
t o
f T
ota
l
19
75-
76
19
77-
78
19
79-
80
19
81-
82
19
83-
84
19
85-
86
19
87-
88
19
89-
90
19
91-
92
19
93-
94
19
95-
96
19
97-
98
19
99-
00
20
01-
02
20
03-
04
20
05-
06
20
07-
08
Pre-reform period Post-reform period
Graph 4.4: Share of Non-developmental and Developmental Revenue
Expenditure in Total Revenue Expenditure of the Central Government
of India
Non-Developmental Revenue Expenditure Developmental Revenue Expenditure Statutory Grants to States
Source: Computed on the basis of data compiled from various issues of Indian Public Finance Statistics.
the sharp increase in subsidies. Thereafter, there was
reduction in the share of developmental revenue
105
expenditure in total revenue expenditure to 33.93 per cent
in 1980-81. This was achieved due to reduction in the
subsidies of fertilizers. Its share further rose to 38.52 per
cent in 1989-90. The major components which contributed
to this increase were defense and interest payments. On the
other hand, developmental revenue expenditure, as a
proportion of total revenue expenditure, has observed a
declining trend till 2000-01 but thereafter it has been
showing a positive trend around 34-35 per cent during post-
reform period.
Looking at the statutory grants to states, such
expenditure fell to Rs. 274.16 crore in 1979-80 from Rs.
519.37 crore in 1975-76. This decline in statutory grants to
states was due to the implementation of the
recommendations of the Seventh Finance Commission
(Economic Survey, 1979-80). It increased from Rs. 335.21
crore to Rs. 1593.6 crore in 1989-90. During post-reform
period, these grants increased to Rs. 28454.17 crore in
2006-07. The relative share of these grants continuously
declined and reached to the lowest level of 1.52 per cent
during 2001-02. It is only after this period that the relative
share has increased to 3 to 4 per cent reflecting the impact
of implementation of the Twelfth Finance Commission
award.
Thus it can be concluded that non-developmental
revenue expenditure as well as developmental revenue
106
expenditure of the central government has been growing.
But the share of non-developmental revenue expenditure
has remained greater than developmental revenue
expenditure. Even during the post-reform period, the share
of developmental revenue expenditure declined till 2000-01.
It is only recently that no doubt the share of non-
developmental revenue expenditure is greater but is
declining and the share of developmental expenditure is
increasing.
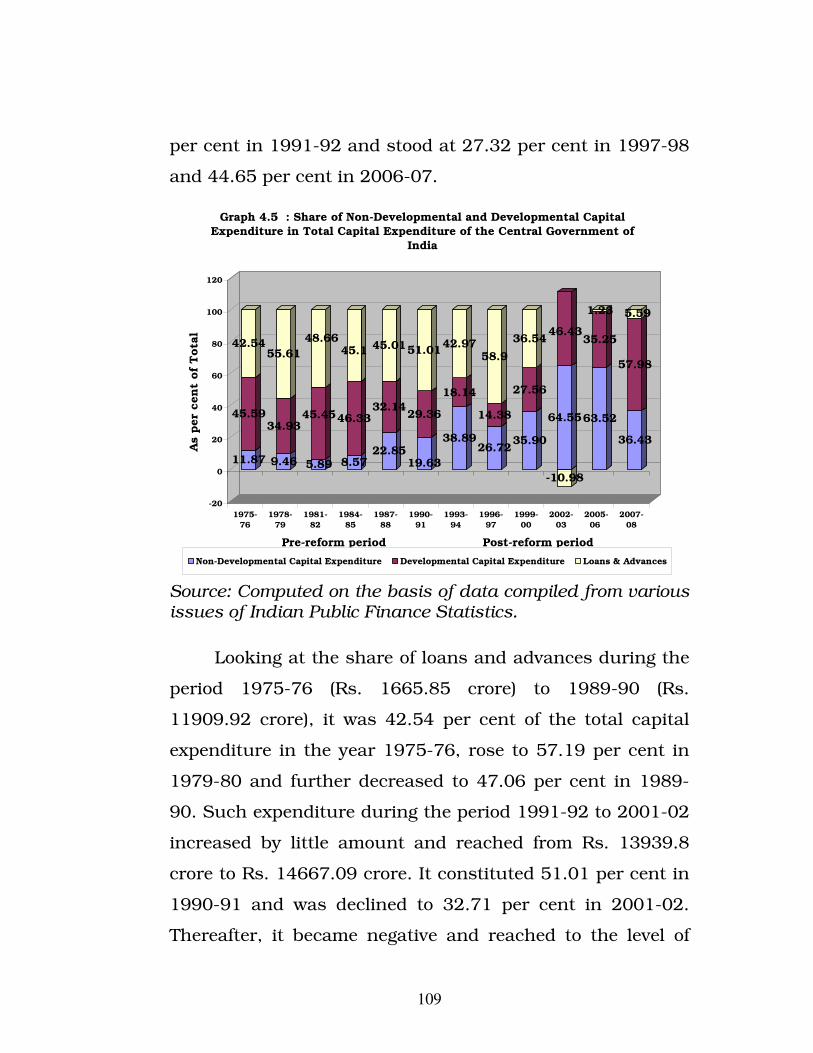
Composition of Capital Expenditure
Capital expenditure is incurred on capital projects
both of a non-development and development nature. It also
includes loans and advances to states and other bodies.
Table 4.5 displays the components of capital
expenditure of the central government. Except the year
2003-04, there has been significant rise in the total capital
expenditure during the study period. The share of
developmental capital expenditure has remained more than
non-developmental capital expenditure out of total capital
expenditure of the central government in the pre-reform
period, but the situation reversed in the post-reform period
(as shown in Graph 4.5). Non-developmental capital
expenditure of the centre increased from Rs. 464.95 crore in
1975-76 to Rs. 5241.38 crore in 1989-90. Its share
as a proportion of total capital expenditure has shown a

107
Table 4.5: Share of Non-Developmental and Developmental Capital Expenditure in Total Capital Expenditure of the Central
Government of India (As per cent of Total)
Year
Non-Developmental
Expenditure
Developmental Expenditure
Loans and Advances
Total Capital
Expenditure
1975-76 11.87 45.59 42.54 100 1976-77 7.43 37.91 54.66 100 1977-78 6.37 48.20 45.43 100 1978-79 9.46 34.93 55.61 100 1979-80 5.08 37.73 57.19 100 1980-81 11.38 37.73 50.89 100 1981-82 5.89 45.45 48.66 100 1982-83 7.62 43.46 48.92 100 1983-84 12.31 44.05 43.64 100 1984-85 8.57 46.33 45.10 100 1985-86 9.64 40.90 49.46 100 1986-87 13.07 39.70 47.23 100 1987-88 22.85 32.14 45.01 100 1988-89 22.30 30.46 47.24 100 1989-90 20.71 32.23 47.06 100 1990-91 19.63 29.36 51.01 100 1991-92 27.15 27.17 45.68 100 1992-93 42.61 24.06 33.33 100 1993-94 38.89 18.14 42.97 100 1994-95 21.87 24.28 53.85 100 1995-96 32.88 15.51 51.61 100 1996-97 26.72 14.38 58.90 100 1997-98 36.02 27.32 36.66 100 1998-99 48.92 23.14 27.94 100 1999-00 35.90 27.56 36.54 100 2000-01 40.58 31.84 27.58 100 2001-02 39.82 27.47 32.71 100 2002-03 64.55 46.43 -10.98 100 2003-04 -629.00 -472.00 1201.00 100 2004-05 179.20 92.21 -171.41 100 2005-06 63.52 35.25 1.23 100 2006-07 72.48 44.65 -17.13 100 2007-08
(R.E.) 36.43 57.98 5.59 100
Source: Computed on the basis of the data compiled from various issues of Indian Public Finance Statistics.
108
fluctuating trend. It was 11.87 per cent in 1975-76 and
reached to 8.57 per cent in 1984-85 and climbed to 20.71
per cent in 1989-90. During the post-reform period, it rose
from Rs. 5364.08 crore in 1991-92 to Rs. 42370.83 crore in
2007-08 (R.E.). To curtail this high growth rate of non-
developmental capital expenditure, the government
undertook various reforms on this front very late with the
beginning of the process of downsizing government. These
included abolishing of four-secretary level posts in April 1,
1999, introduction of Expenditure Reforms Commission in
February 29, 2000 and ban on creation of new posts for one
year in 2000-01 but even then the share of non-
developmental expenditure remained very high. As a
proportion of total capital expenditure, the share of non-
developmental capital expenditure went up to 72.48 per
cent in 2006-07.
Further, developmental capital expenditure increased
from Rs. 1785.48 crore in 1975-76 to Rs. 8158.41 crore in
1989-90. The share of developmental capital expenditure in
total capital expenditure increased continuously till 1984-85
which was 46.33 per cent. Thereafter, the share of
developmental capital expenditure decreased to 30.46 per
cent in 1988-89. During post-reform period, developmental
capital expenditure which stood at Rs. 6958.08 crore in
1991-92 galloped to Rs. 22602.49 crore in 2006-07. As a
proportion of total capital expenditure, its share was 27.17
109
per cent in 1991-92 and stood at 27.32 per cent in 1997-98
and 44.65 per cent in 2006-07.
11.87
45.59
42.54
9.46
34.93
55.61
5.89
45.45
48.66
8.57
46.33
45.1
22.85
32.14
45.01
19.63
29.36
51.01
38.89
18.14
42.97
26.72
14.38
58.9
35.90
27.56
36.54
64.55
46.43
-10.98
63.52
35.25
1.23
36.43
57.98
5.59
-20
0
20
40
60
80
100
120
As p
er
cen
t of
Tota
l
1975-
76
1978-
79
1981-
82
1984-
85
1987-
88
1990-
91
1993-
94
1996-
97
1999-
00
2002-
03
2005-
06
2007-
08
Pre-reform period Post-reform period
Graph 4.5 : Share of Non-Developmental and Developmental Capital Expenditure in Total Capital Expenditure of the Central Government of
India
Non-Developmental Capital Expenditure Developmental Capital Expenditure Loans & Advances
Source: Computed on the basis of data compiled from various issues of Indian Public Finance Statistics.
Looking at the share of loans and advances during the
period 1975-76 (Rs. 1665.85 crore) to 1989-90 (Rs.
11909.92 crore), it was 42.54 per cent of the total capital
expenditure in the year 1975-76, rose to 57.19 per cent in
1979-80 and further decreased to 47.06 per cent in 1989-
90. Such expenditure during the period 1991-92 to 2001-02
increased by little amount and reached from Rs. 13939.8
crore to Rs. 14667.09 crore. It constituted 51.01 per cent in
1990-91 and was declined to 32.71 per cent in 2001-02.
Thereafter, it became negative and reached to the level of
110
17.13 per cent in 2006-07 because of Debt Consolidation
and Debt Waiver Schemes for the state governments started
by the central government.
After a look at the trends in expenditure at the central
level in the end, it is concluded that total expenditure of the
central government has been rapidly growing and it
increased at the rate of 14 per cent per annum throughout
the study period. This sharp increase has been mainly on
account of continuous increase in the share of revenue
expenditure which created serious fiscal imbalance in the
fiscal sector of the economy. What is more disturbing is that
revenue expenditure shot up at the cost of capital
expenditure. Besides it, as a result of reform measures,
revenue expenditure has grown at a lower rate in the post-
reform period than the pre-reform period. On the other
hand, capital expenditure has recorded a higher growth in
the post-reform period than the pre-reform period. As a
proportion of GDP, total expenditure of the central
government increased from 12 to 18 per cent in the pre-
reform period but again declined to 12 per cent by mid-2000
in the post-reform period. Revenue expenditure as per cent
of GDP was not only high and continuously growing in the
pre-reform period but the gap between revenue expenditure
and capital expenditure started widening in the mid-
eighties. During the post-reform period, no doubt, it has
followed a stable path but has not only much higher than

111
capital expenditure and the gap between these two widened
extremely up to mid-2000s.
While analyzing the components of revenue
expenditure, it can be observed that non-developmental
revenue expenditure contributes a significant proportion
(more than 60 per cent) of total revenue expenditure of the
central government. With the significant measures
introduced by the government, only during 2000s, the share
of growth of non-developmental revenue expenditure has
started declining in the post-reform. Looking at the share of
non-developmental and developmental capital expenditure
in total capital expenditure of the central government, it is
observed that the share of developmental capital
expenditure has remained more than non-developmental
capital expenditure in the pre-reform period, but this
situation has been reversed in the post-reform period. It
may thus be concluded that there is a need to give more
emphasis in the reform process on improvement in the
composition of revenue expenditure as well as of capital
expenditure.