growth and maturation - university of minnesota...
TRANSCRIPT

© 2007 McGraw-Hill Higher Education. All rights reserved.
Growth and Maturation
Chapter 6

Growth and Maturation
Parents, childcare givers, and clients want to know if they are growing normally?
Effects of maturation on motor development.
© 2007 McGraw-Hill Higher Education. All rights reserved.

© 2007 McGraw-Hill Higher Education. All rights reserved.
Concept 6.0: Measuring Growth in Length and Stature
• Recumbent length is measured from birth until a child is able to stand – Measured from the vertex (highest point on skull) to
the soles of the feet

© 2007 McGraw-Hill Higher Education. All rights reserved.
Measuring Growth in Length and Stature
• Stature or standing height is measured between the vertex and the floor
• Preferred measurement of body length

© 2007 McGraw-Hill Higher Education. All rights reserved.
Measuring Growth in Length and Stature • Stature can be
estimated in the elderly and/or disabled populations from recumbent knee height

© 2007 McGraw-Hill Higher Education. All rights reserved.
Calculation of Stature from Knee Height
Stature Men 65.19 – (0.04 x age) + (2.02 x knee height)
Stature Women 84.88 – (0.24 x age) + (1.83 x knee height)

© 2007 McGraw-Hill Higher Education. All rights reserved.
Growth in Length and Stature
At Birth – Boys ~ 20 in – Girls ~ 19.75 in
At one Year 1 – Boys ~ 30 in – Girls ~ 29.25 in

© 2007 McGraw-Hill Higher Education. All rights reserved.
Growth in Length and Stature • Adolescence
– 20% of adult stature is attained during this 2 ½ to 3 year period
• Median age in females (17-18 years old) and in males (21-22 years old) when growth in stature ceases
• Stature is stable between ages of 30-45
• Above 45 years of age stature decreases

© 2007 McGraw-Hill Higher Education. All rights reserved.
Growth in Length and Stature
• Plots accumulative growth over time
Typical distance curve for stature
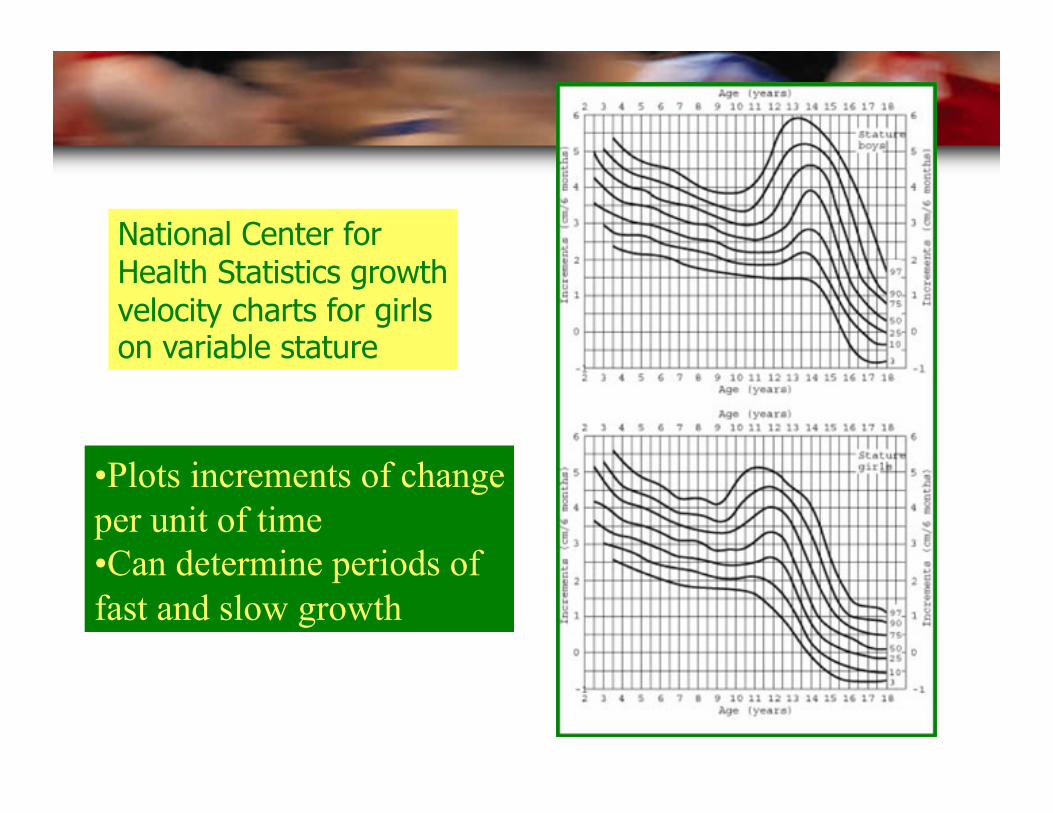
National Center for Health Statistics growth velocity charts for girls on variable stature
• Plots increments of change per unit of time • Can determine periods of fast and slow growth

http://www.cdc.gov/nccdphp/dnpa/growthcharts/training/modules/module3/text/page3d.htm
Stature-for-Age

Stature-for-Age Percentiles
Use these charts to determine if an individual is growing normally

© 2007 McGraw-Hill Higher Education. All rights reserved.
Measuring Body Weight
• Electronic digital scales, calibrated in metric units are recommended • Chair scales are available for those who are not capable of standing

© 2007 McGraw-Hill Higher Education. All rights reserved.
Growth in Body Weight
• Median Birth Weight – Boys ~ 7.5 lb – Girls ~ 7.0 lb – Day 1-3 postnatal, infant may lose up to 10%
of body weight • Year 1
– Boys ~ 22.5 lb – Girls ~ 21 lb

© 2007 McGraw-Hill Higher Education. All rights reserved.
Growth in Body Weight
• Year 2 ~ gain of 5.5 lb • Years 3-5 ~ gain of 4.5 lb • Year 6 – Adolescence
– Slight increase in rate of weight gain of 6.5/year
• Adolescence – Males add about 45 lb of body weight – Females add about 35 lb of body weight

© 2007 McGraw-Hill Higher Education. All rights reserved.
Growth in Body Weight
• Peak weight velocity = maximum rate of growth in body weight – Occurs after peak height velocity
• Mature body weight is approximately 20x that of birth weight

© 2007 McGraw-Hill Higher Education. All rights reserved.
Growth in Body Weight
• Above 19 years – Weight is a matter of nutritional and exercise
status • Pregnancy
– Some weight gain during pregnancy is permanent
– Women who have children weigh more than childless women

© 2007 McGraw-Hill Higher Education. All rights reserved.
Growth in Body Weight
Typical distance curve for body weight

Body weight across one’s lifespan
Bodyweight peaks at the age of 45 Age 45-60, body weight declines or remain
stable. 64% of US adults are either overweight. Over the last 20 year, the number of
overweight children between 6-11years has doubled; 12-19 years of age has tripled.

National Center for Health Statistics growth velocity charts for boys and girls on variable body weight


© 2007 McGraw-Hill Higher Education. All rights reserved.
Concept 6.1: Body Mass Index (BMI)
• Calculating BMI • Healthy adult = 18.5-24.9 • Underweight = <18.5 • Overweight = 25-29.9 • Obese = >30

BMI BMI (body mass index) is used to determine overweight.
Ideal BMI ranges between 18.5-24.9 kg/m2
Overweight is 25-29.9 kg/m2
Any individual over 30 kg/m2 is obese

© 2007 McGraw-Hill Higher Education. All rights reserved.
Mary is a 46-year-old woman who weighs 132 pounds and is 65 in. tall. Calculate Mary’s BMI. Is Mary overweight?

© 2007 McGraw-Hill Higher Education. All rights reserved.
Solution

© 2007 McGraw-Hill Higher Education. All rights reserved.
BMI Chart
• Is Mary overweight?
• NO, her BMI is normal
• <18.5 = underweight
• 18.5-24.9 = normal weight
• 25-29.9 = overweight
• >30 = obese
© 2007 McGraw-Hill Higher Education. All rights reserved.
BMI-for-Age
• Adiposity rebound: upward trend occurring after the low point on the BMI percentile curve – The earlier the adiposity rebound occurs in a
child, the more likely BMI will be high in adulthood

© 2007 McGraw-Hill Higher Education. All rights reserved.
BMI-for-Age
• In children and adolescents, BMI-for-age is best used as a guide to determine individual nutritional status
• BMI-for-age between 85th percentile and 95th percentile is classified as risk for becoming overweight
• BMI-for-age greater than 95th percentile, overweight is a concern


© 2007 McGraw-Hill Higher Education. All rights reserved.
BMI-for-Age
• NHANES, between 1960 and 2000 – Children and adults are fatter
• In adults – Mean height has increased 1 in – Mean body weight has increased 24 lb!
• In children – 6-11 yr, both boys and girls are 9 lb heavier – 12-17 yr, boys are 15 lb heavier and girls are 12 lb
heavier
© 2007 McGraw-Hill Higher Education. All rights reserved.
Concept 6.2: Relationship between stature and weight to Motor Performance • On average
– Thin, muscular, and small-boned babies walk earlier
– Infants who are long for their weight walk earlier
• Motor performance may be delayed in obese infants but catch up to peers within a year

© 2007 McGraw-Hill Higher Education. All rights reserved.
Adolescent Awkwardness • This refers to a period during the growth
spurt where motor performance is disrupted – Peak height velocity – Estimated age for boys = 13.7 yr – Estimated age for girls = 11.8 yr – The phenomenon is not universal

© 2007 McGraw-Hill Higher Education. All rights reserved.
Concept 6.3: Body proportions
• Ratio of head size to overall body length – Head contributes 25% to body length – Head circumference increase is a indication
of brain development • 55-60% of stature increase due to leg
growth • Ratio between biacromial (shoulder) and
bicristal (hip)breadths

© 2007 McGraw-Hill Higher Education. All rights reserved.
Changes in Shoulder and Hip Width % • Bicristal/biacromial
breadth x 100

© 2007 McGraw-Hill Higher Education. All rights reserved.
Changes in the Center of Gravity • A child’s center of gravity varies greatly
because the head, trunk, and legs do not grow proportionally
• The center of gravity is high in children because a large proportion of their weight is in the upper body – Affects stability

© 2007 McGraw-Hill Higher Education. All rights reserved.
Changes in the Center of Gravity
• For the adult, the center of gravity to total height is 53-59% – Males have a higher center of gravity than
females do – Center of gravity is associated with the
center of mass • Men – chest • Women – hips

© 2007 McGraw-Hill Higher Education. All rights reserved.
Concept 6.4: Body Proportion and Motor Performance
• Stability (balance) is a problem for young children due to their higher center of gravity and small base of support
• Balance is superior in women and girls due to their shorter legs and wider pelvis – Lowers center of gravity
© 2007 McGraw-Hill Higher Education. All rights reserved.
Concept 6.5: Measuring Skeletal Health
• Dual-energy X-ray (DEXA) – Can measure differences among lean soft
tissue, fat soft tissue, and bone tissue – Determines BMD – bone mineral density
• US is an aging society – More concern for bone diseases like
osteoporosis

© 2007 McGraw-Hill Higher Education. All rights reserved.
DEXA ~ Dual-Energy X-ray Apsorptiometry

© 2007 McGraw-Hill Higher Education. All rights reserved.
DEXA ~ Bone Mineral Density Results

© 2007 McGraw-Hill Higher Education. All rights reserved.
• (a) Normal Bone
• (b) Osteoporotic Bone

© 2007 McGraw-Hill Higher Education. All rights reserved.
Skeletal Development
• Bone growth (length and size)
• Bone maturity (amount of ossification)

© 2007 McGraw-Hill Higher Education. All rights reserved.
Skeletal Development
• Bone remodeling – Occurs throughout the lifespan – Osteoblasts (building) – Osteoclasts (chewing)

© 2007 McGraw-Hill Higher Education. All rights reserved.
Skeletal Development
• From birth to 35 yr – osteoblast activity > osteoclast activity – Gaining bone
• After 35 yr, osteoclast activity > osteoblast activity – Exercise and stress on the bones becomes
important


Skeletal System
1. Women begin to lose bone minerals at about 30 and men at about 50.
2. Bone lose is called osteoporosis, results in bone with less density and tensile strength.
3. Calcium insufficiency during pre- and post-pubertal years in girls seem related to developing osteoporosis.
4. Estrogen deficiency in post menopausal women is major factor related to bone loss.
5. Chronic amenorrhea is related to decreased bone density.

Exercise & Bone Mineral Loss
1. Exercise is important to prevention and treatment of osteoporosis.
2. Elderly male athletes have greater mineral densities than aged non-athletes.
3. Females active at an early age tend to have higher bone mineral contents.
4. Excessive training in people is associated with less bone density in both men and women.

© 2007 McGraw-Hill Higher Education. All rights reserved.
Concept 6.6: Maturation & Developmental Age
• Chronological age – Often used to denote maturity, but is a poor
indicator • Developmental age
– Much better indicator of maturity – e.g., adolescence – Addresses variations in rate of maturation
Measures of Maturity
• Skeletal maturity (x-rays) • Dental maturity (# of teeth & X-rays) • Age of menarche (onset and frequency) • Genitalia Maturity
© 2007 McGraw-Hill Higher Education. All rights reserved.

© 2007 McGraw-Hill Higher Education. All rights reserved.
Skeletal Maturity 3-
year
-old
5-
year
-old
14-year-old

© 2007 McGraw-Hill Higher Education. All rights reserved.
Maturation and Motor Performance
• The level of maturation can affect motor performance
• Early maturing boys initially outperform late maturing boys (perceived advantage)
• Early maturing boys reach their motor and sport skill potential earlier.
• Once the late-maturing boys reach adolescence, the advantage is no longer evident & reach their full potential later.

© 2007 McGraw-Hill Higher Education. All rights reserved.
Maturation and Motor Performance
• Early maturation in not associated with superior motor performance in girls, except in swimming
• Late-maturing girls have superior motor performance – Longer arms and legs – Narrower hips

© 2007 McGraw-Hill Higher Education. All rights reserved.