growing green - gis, furman university
TRANSCRIPT
• To get a better feel for the typical CSA shareholder, a survey would be an ideal method to gain more insight. Specifically, a survey can gain a better scope of household income, household size, age, and adult education levels in the home could be important indicators for Greenbrier to hone in on marketing.
• Another study of interest could be mapping the distances people are willing to travel for food in order to determine just how far Greenbrier’s range for shareholder convenience. This could be done using buffers or the near tool in ArcMap.
• Studying population density of the surrounding area could pin-point the effectiveness of marketing at several identified organic markets . For example, marketing at Earth Fare will probably gain more business than marketing in Easley, because Earth Fare is in a more populated area.
Community Supported Agriculture (CSA) programs allow interested citizens to become shareholders of local agriculture systems by purchasing shares of produce and meat during a farm’s growing season. CSA, a movement that came to the United States in 1984, is believed to have spread to over 6,500 farms and over 270,000 households across the country (Adam 2006, USDA). The CSA movement is especially popular amongst distinct populations; generally, the farmers and shareholders are young and have received at least a Bachelor’s degree. For this case study, a local farm, Greenbrier Farms, Easley, SC provided their shareholders’ addresses for demographic research based on their locations in the greater Greenville area. Greenbrier’s CSA has 93 participants for the 2012 spring and summer growing season. Using Census tract data and geocoding, we are able to analyze the demographic breakdown of who is participating in CSAs and also provide the farm with additional information regarding further opportunities to better target marketing efforts in the Greenville community.
Growing Green An Analysis of the South Carolina Upstate’s Community Supported Agriculture Movement
Claire Campbell EES201 – Introduction to Geographic Information Systems – Spring2012, Furman University, Greenville, SC
The first CSAs were established in Europe during the 1960s, when community members first approached farmers about developing a direct relationship between producers and consumers (Adam 2006). A 2008 study found that educated consumers were willing to pay over twice as much for produce that was grown locally. Since 2000, the local farmers’ market movement has increased by 53%, illustrating the growing demand for locally grown produce (Brown et al 2008). Furthermore, partaking in locally grown food has positive benefits beyond the farmer’s pocket. CSA participants claimed positive effects including increased produce variety, shopping less, and healthy eating habits (Brown et al 2008). In a risk management assessment of organic farming, focus groups of farmers were asked about CSA benefits—respondents raved about the importance of shared risk between shareholders and farmers because upfront payments assist in farm operations throughout the growing season (Hanson et al 2004). In the Greenville area, there are 52 registered organic farms, growing vegetables, livestock, poultry, and dairy products (GOFO statistics 2012 http://www.greenvilleorganicfoods.org/).
IV. Results
Special thanks to Chad and Amy Bishop of Greenbrier Farms for graciously allowing me to use their CSA shareholder data. Thanks to Mr. Mike Winiski for his supervision and support. Adam, K. National Center for Appropriate Technology, National Sustainable Agriculture Information Service. (2006). Community supported agriculture. Retrieved from website http://ruralinnovationinstitute.yolasite.com/resources/CSA_ATTRA1.pdf Brown, C., & Miller, S. (2008). The impacts of local markets: A review of research on farmers markets and community supported agriculture (csa). American Journal of Agricultural Economics, 90, 1296-1302. Retrieved from http://web.ebscohost.com.libproxy.furman.edu/ehost/pdfviewer/pdfviewer?sid=48352ff2-edf1-4b75-afe0-419028539afb@sessionmgr10&vid=2&hid=7 Hanson, J., Dismukes, R., Chambers, W., Green, C., & Kremen, A. (2004). Risk and risk management in organic agriculture: Views of organic farmers. Renewable Agriculture and Food Systems, 19(4), 218-227. Retrieved from http://ddr.nal.usda.gov/bitstream/10113/38313/1/IND43693099.pdf Figure 1 Data Sources: 1) kernel density data created by the author using 2012 CSA shareholder addresses from Greenbrier Farm Inc. 2) Greenville, Pickens, Anderson, and Laurens County shapefiles from U.S. Census Bureau 3) map inset developed using data from Environmental Systems Research Institute (ESRI) Data & Maps Online (2012). Figure 2 Data Sources: 1) neighborhood boundaries created by the author using 2010 census tract shapefiles from http://www.census.gov/geo/www/tiger/ 2) Median Income data from U.S. Census Bureau American Community Survey (ACS) 5 year estimated (2006-2010) 3) CSA shareholder and pick-up location information from Greenbrier Farms Inc. 2012 4) map inset developed using data from ESRI Data and Maps Online (2012). Figure 3 Data Sources: 1) neighborhood boundaries created by the author using 2010 census tract shapefiles from http://www.census.gov/geo/www/tiger/ 2) Education attainment data from U.S. Census Bureau American Community Survey (ACS) 5 year estimateds (2006-2010) 3) CSA shareholder and pick-up location information from Greenbrier Farms Inc. 2012 4) map inset developed using data from ESRI Data and Maps Online (2012). All maps created with ESRI ArcDesktop 10 (2012).
Greenbrier Farms has a strong grasp on their target interest group. Through their participation in the Greenville Farmer’s Market, they have maximized their CSA shares in the downtown Greenville area. The correlations between income and education show that with focused marketing, specifically at Earth Fare Grocery Store, there is potential for expansion into the Mauldin, Woodruff, and Simpsonville area. Conclusively, Greenbrier has already maximized their interest in the downtown community, which has a thriving organic-interest community. The shareholder profile was a weak match to the profile that was expected based on the literature review. Another factor that could add to this evaluation in the future would be shareholder age, which may have a significant correlation with Greenbrier’s CSA. In order to overcome income discrepancy, I would suggest that Greenbrier offer half and quarter shares, which will bring in greater business, especially from the younger populations.
I. Introduction
II. Literature Review
III. Methodology
VII. Acknowledgements and References
V.I. Future Research
V. Discussion and Conclusion
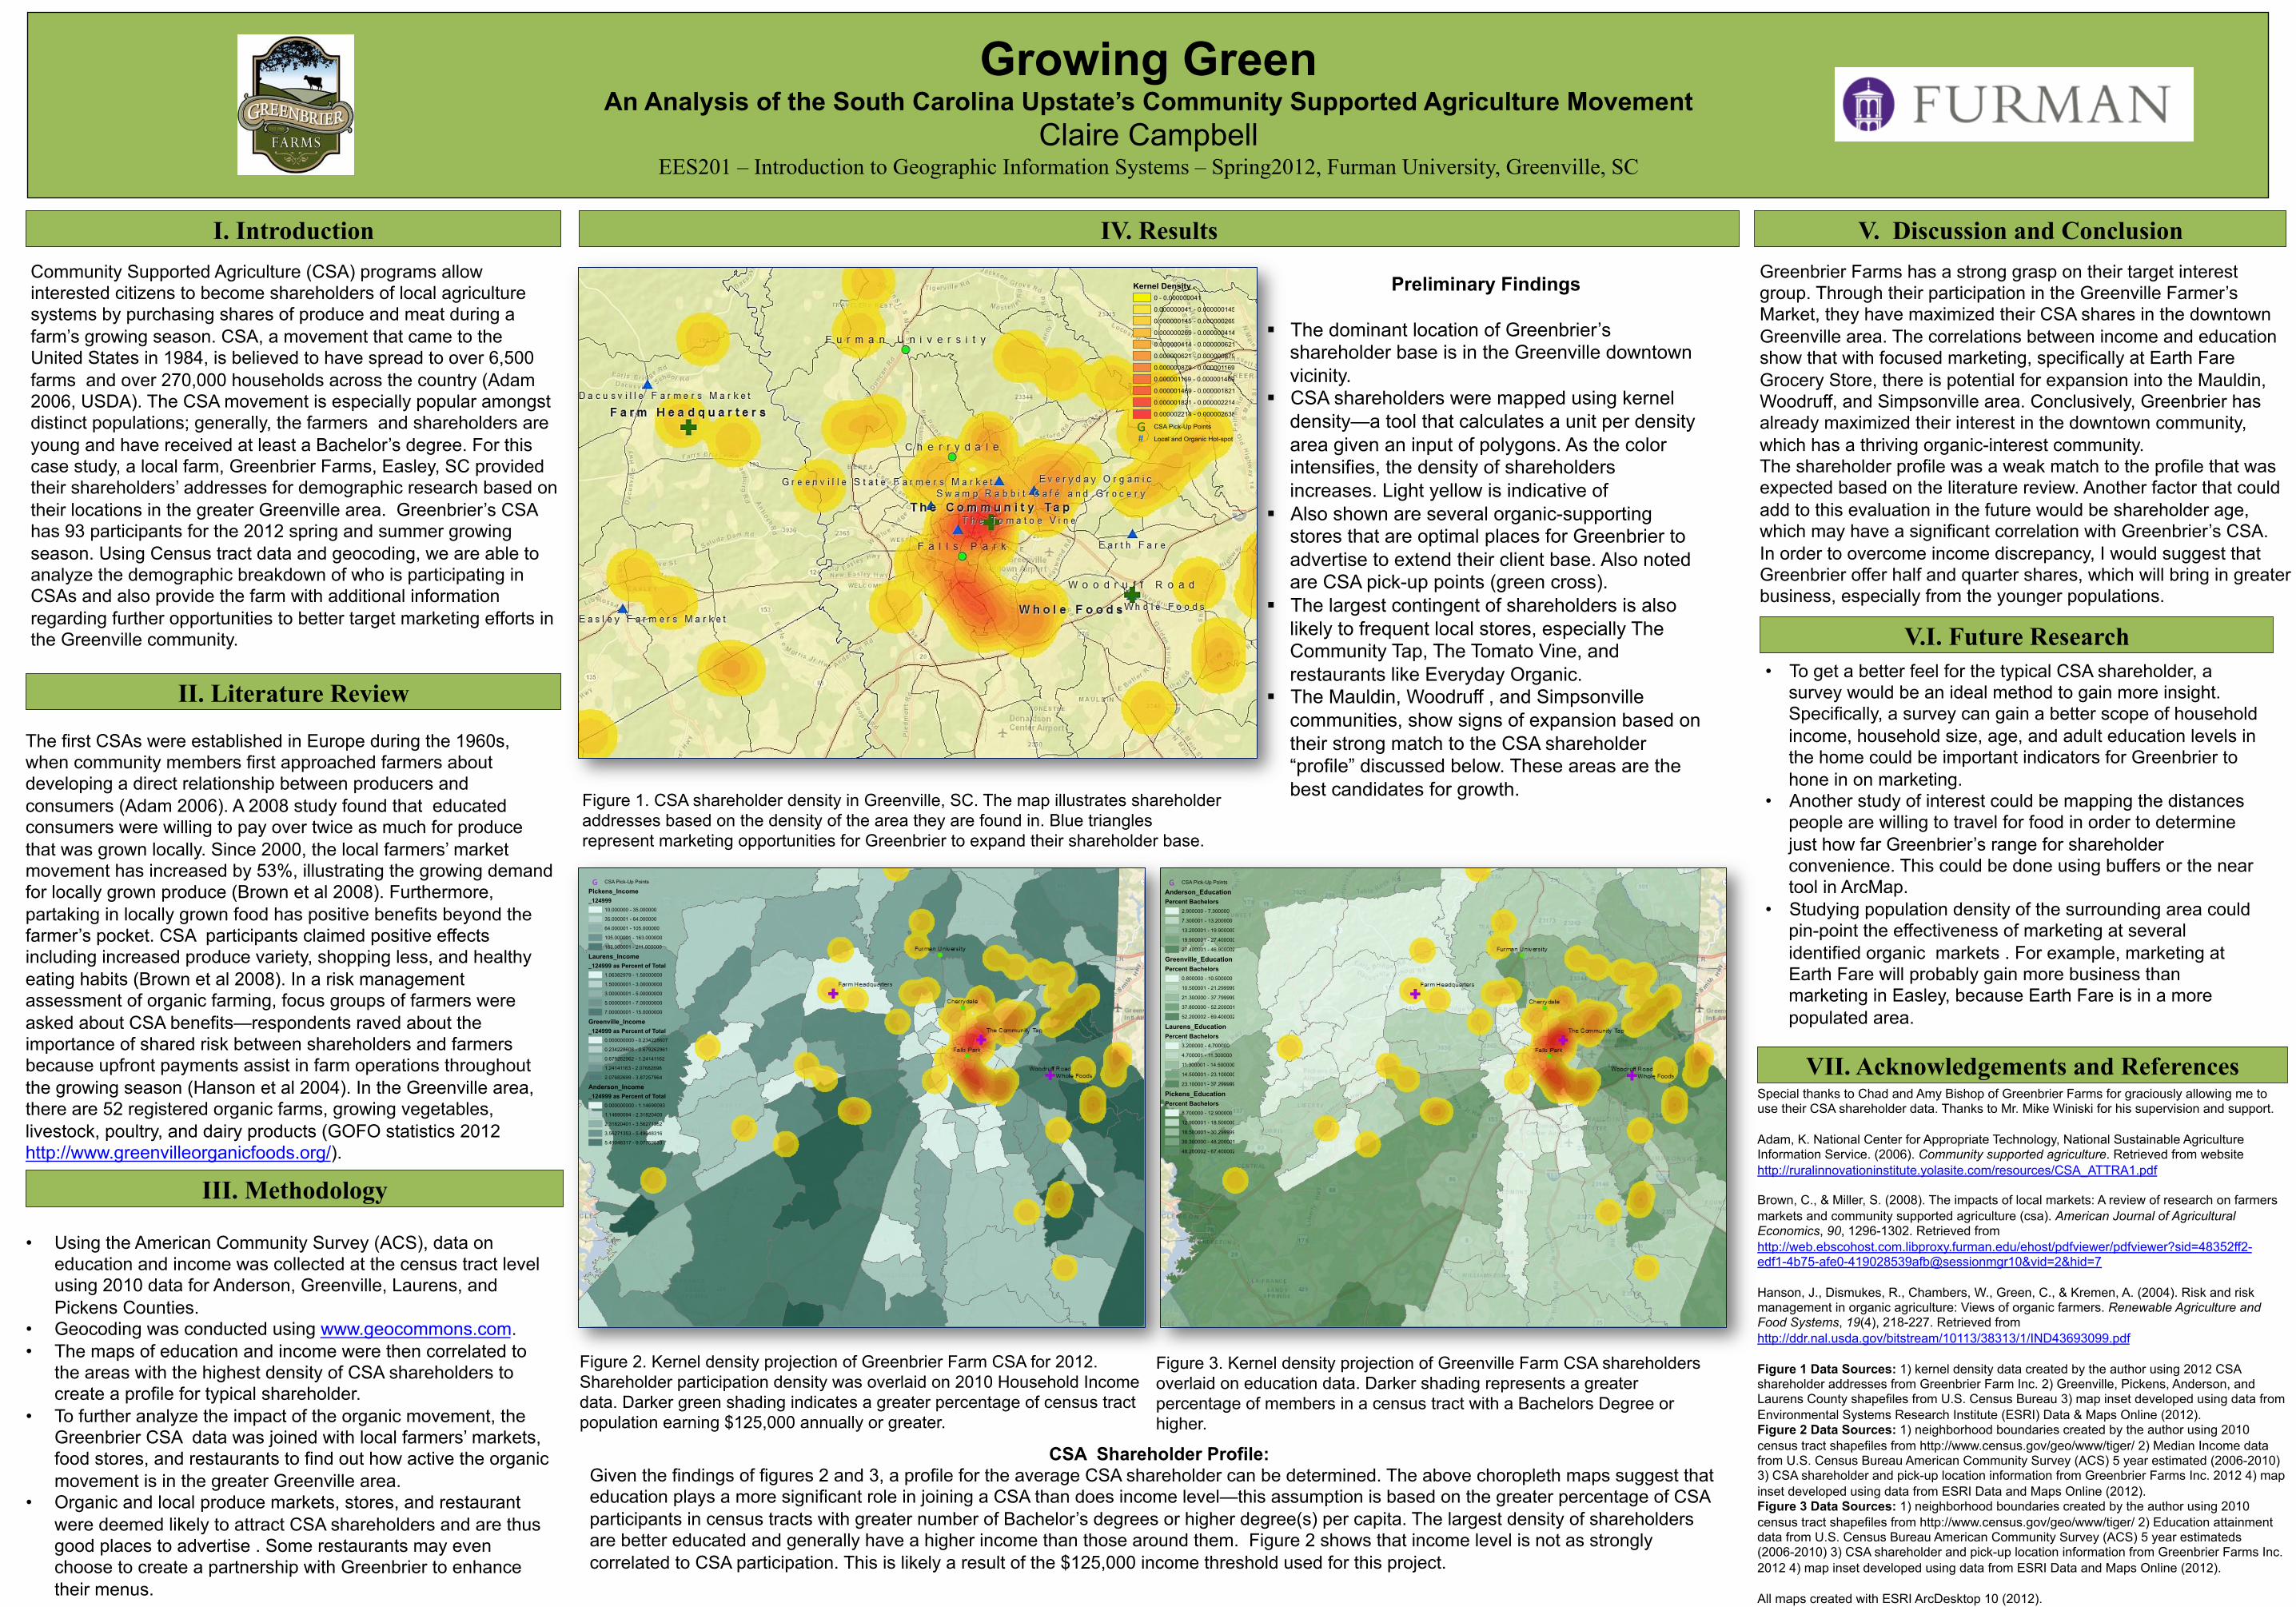
Figure 2. Kernel density projection of Greenbrier Farm CSA for 2012. Shareholder participation density was overlaid on 2010 Household Income data. Darker green shading indicates a greater percentage of census tract population earning $125,000 annually or greater.
• Using the American Community Survey (ACS), data on education and income was collected at the census tract level using 2010 data for Anderson, Greenville, Laurens, and Pickens Counties.
• Geocoding was conducted using www.geocommons.com. • The maps of education and income were then correlated to
the areas with the highest density of CSA shareholders to create a profile for typical shareholder.
• To further analyze the impact of the organic movement, the Greenbrier CSA data was joined with local farmers’ markets, food stores, and restaurants to find out how active the organic movement is in the greater Greenville area.
• Organic and local produce markets, stores, and restaurant were deemed likely to attract CSA shareholders and are thus good places to advertise . Some restaurants may even choose to create a partnership with Greenbrier to enhance their menus.
Figure 3. Kernel density projection of Greenville Farm CSA shareholders overlaid on education data. Darker shading represents a greater percentage of members in a census tract with a Bachelors Degree or higher.
Preliminary Findings
§ The dominant location of Greenbrier’s shareholder base is in the Greenville downtown vicinity.
§ CSA shareholders were mapped using kernel density—a tool that calculates a unit per density area given an input of polygons. As the color intensifies, the density of shareholders increases. Light yellow is indicative of
§ Also shown are several organic-supporting stores that are optimal places for Greenbrier to advertise to extend their client base. Also noted are CSA pick-up points (green cross).
§ The largest contingent of shareholders is also likely to frequent local stores, especially The Community Tap, The Tomato Vine, and restaurants like Everyday Organic.
§ The Mauldin, Woodruff , and Simpsonville communities, show signs of expansion based on their strong match to the CSA shareholder “profile” discussed below. These areas are the best candidates for growth. Figure 1. CSA shareholder density in Greenville, SC. The map illustrates shareholder
addresses based on the density of the area they are found in. Blue triangles represent marketing opportunities for Greenbrier to expand their shareholder base.
CSA Shareholder Profile: Given the findings of figures 2 and 3, a profile for the average CSA shareholder can be determined. The above choropleth maps suggest that education plays a more significant role in joining a CSA than does income level—this assumption is based on the greater percentage of CSA participants in census tracts with greater number of Bachelor’s degrees or higher degree(s) per capita. The largest density of shareholders are better educated and generally have a higher income than those around them. Figure 2 shows that income level is not as strongly correlated to CSA participation. This is likely a result of the $125,000 income threshold used for this project.
Kernel Density0 - 0.000000041
0.000000041 - 0.000000145
0.000000145 - 0.000000269
0.000000269 - 0.000000414
0.000000414 - 0.000000621
0.000000621 - 0.000000879
0.000000879 - 0.000001169
0.000001169 - 0.000001469
0.000001469 - 0.000001821
0.000001821 - 0.000002214
0.000002214 - 0.000002638
G CSA Pick-Up Points
# Local and Organic Hot-spot
G CSA Pick-Up Points
Pickens_Income_124999
10.000000 - 35.000000
35.000001 - 64.000000
64.000001 - 105.000000
105.000001 - 163.000000
163.000001 - 211.000000
Laurens_Income_124999 as Percent of Total
1.06382979 - 1.50000000
1.50000001 - 3.00000000
3.00000001 - 5.00000000
5.00000001 - 7.00000000
7.00000001 - 15.0000000
Greenville_Income_124999 as Percent of Total
0.000000000 - 0.234228607
0.234228608 - 0.679262961
0.679262962 - 1.24141162
1.24141163 - 2.07682698
2.07682699 - 3.87257964
Anderson_Income_124999 as Percent of Total
0.000000000 - 1.14690093
1.14690094 - 2.31820400
2.31820401 - 3.56271352
3.56271353 - 5.49048316
5.49048317 - 9.07759883
G CSA Pick-Up Points
Anderson_EducationPercent Bachelors
2.900000 - 7.300000
7.300001 - 13.200000
13.200001 - 19.900000
19.900001 - 27.400000
27.400001 - 46.900002
Greenville_EducationPercent Bachelors
0.800000 - 10.500000
10.500001 - 21.299999
21.300000 - 37.799999
37.800000 - 52.200001
52.200002 - 69.400002
Laurens_EducationPercent Bachelors
3.200000 - 4.700000
4.700001 - 11.300000
11.300001 - 14.500000
14.500001 - 23.100000
23.100001 - 37.299999
Pickens_EducationPercent Bachelors
8.700000 - 12.900000
12.900001 - 18.500000
18.500001 - 30.299999
30.300000 - 48.200001
48.200002 - 67.400002