group requirements: jamie: power point presentation
TRANSCRIPT

Statistics Term
Project……
Purpose of Study
To determine relationship between fat content (in grams) and sugar content (in grams) in various brands of vanilla ice cream.
Specifically, to determine whether a decrease in fat content has a statistically significant relationship to an increase in sugar content in ½ cup servings of vanilla ice cream.
Study Design
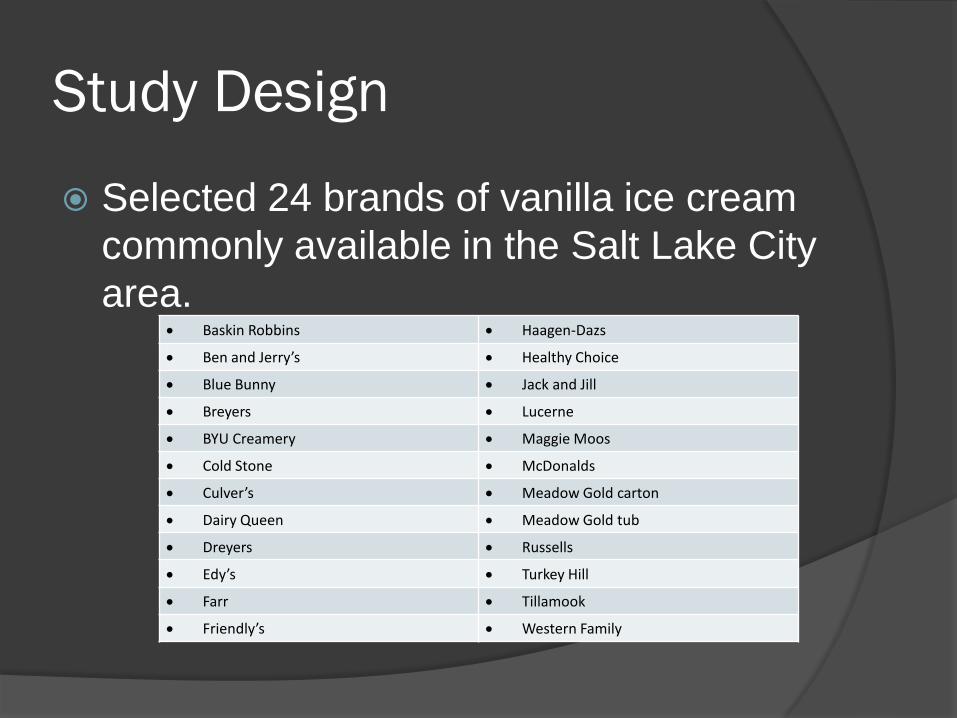
Selected 24 brands of vanilla ice cream
commonly available in the Salt Lake City
area.
Baskin Robbins Haagen-Dazs
Ben and Jerry’s Healthy Choice
Blue Bunny Jack and Jill
Breyers Lucerne
BYU Creamery Maggie Moos
Cold Stone McDonalds
Culver’s Meadow Gold carton
Dairy Queen Meadow Gold tub
Dreyers Russells
Edy’s Turkey Hill
Farr Tillamook
Friendly’s Western Family
Study Design, cont.
Simple random sampling method.
Randomly drew 10 brand names out of
a hat.
Obtained relevant nutritional data
through visits to local grocery stores
Data then compiled into a table for
statistical analysis (see next slide).
Study Sample
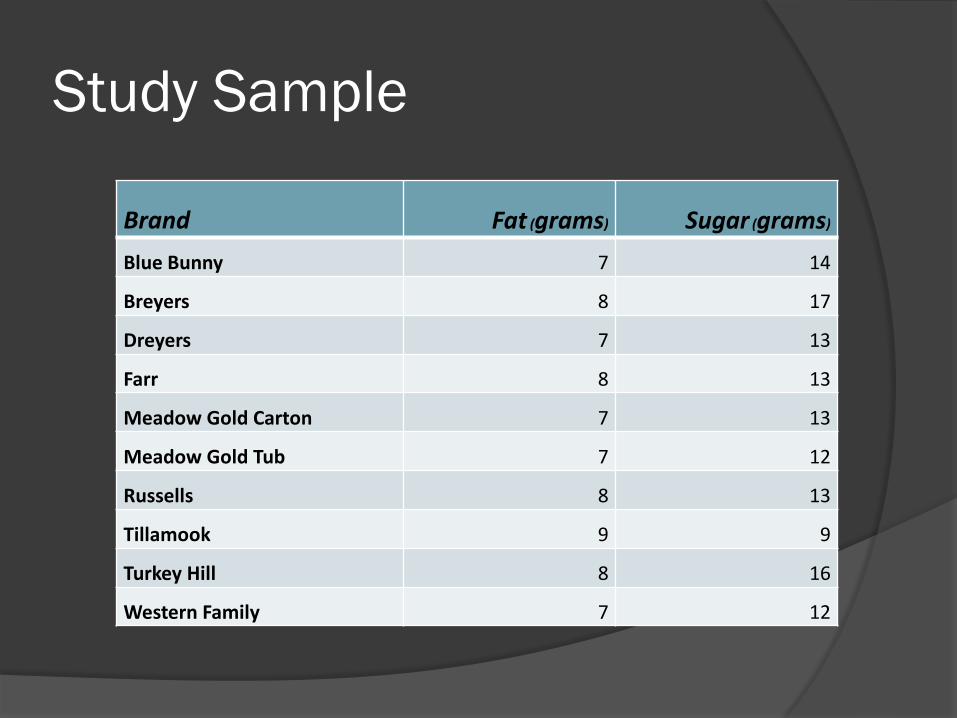
Brand Fat (grams) Sugar (grams)
Blue Bunny 7 14
Breyers 8 17
Dreyers 7 13
Farr 8 13
Meadow Gold Carton 7 13
Meadow Gold Tub 7 12
Russells 8 13
Tillamook 9 9
Turkey Hill 8 16
Western Family 7 12

Purpose of Study
To determine relationship between fat content (in grams) and sugar content (in grams) in various brands of vanilla ice cream.
Specifically, to determine whether a decrease in fat content has a statistically significant relationship to an increase in sugar content in ½ cup servings of vanilla ice cream.
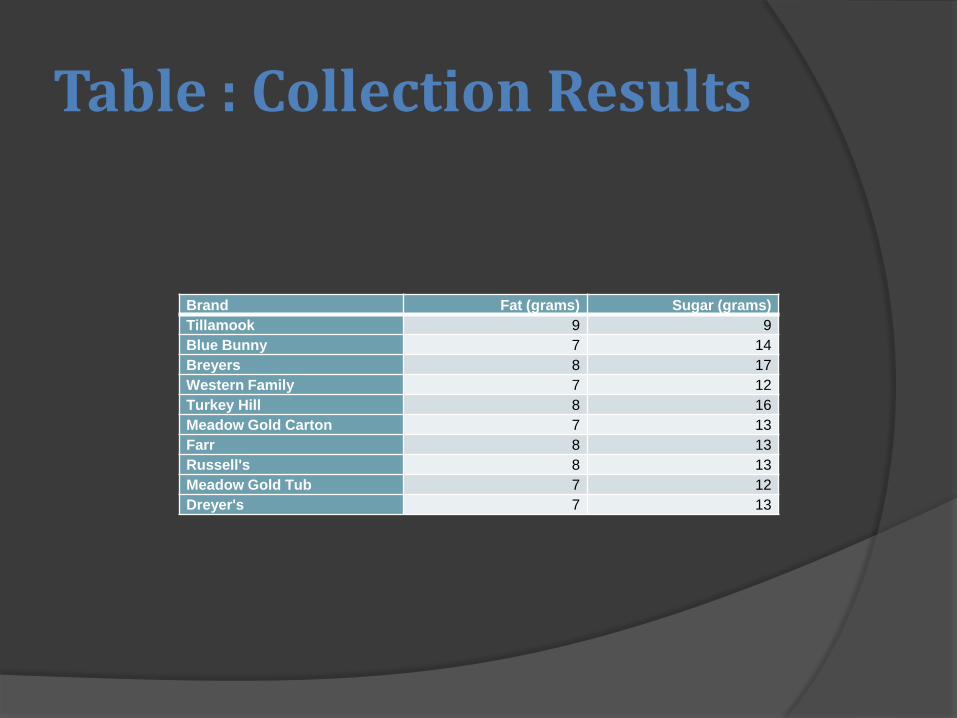
Table : Collection Results
Brand Fat (grams) Sugar (grams)
Tillamook 9 9
Blue Bunny 7 14
Breyers 8 17
Western Family 7 12
Turkey Hill 8 16
Meadow Gold Carton 7 13
Farr 8 13
Russell's 8 13
Meadow Gold Tub 7 12
Dreyer's 7 13
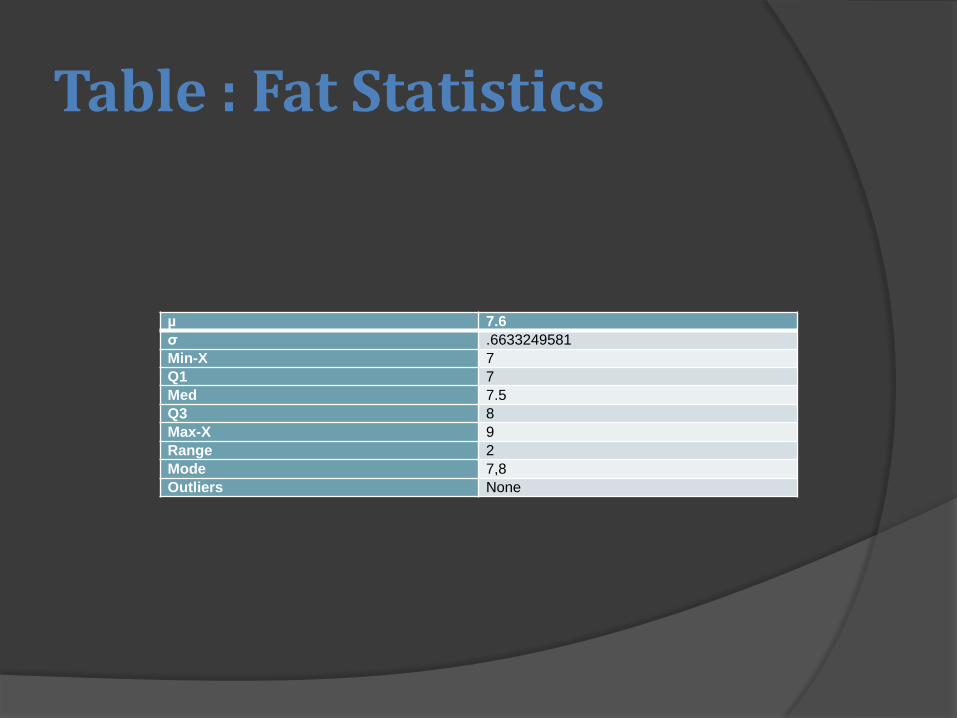
Table : Fat Statistics
µ 7.6
σ .6633249581
Min-X 7
Q1 7
Med 7.5
Q3 8
Max-X 9
Range 2
Mode 7,8
Outliers None
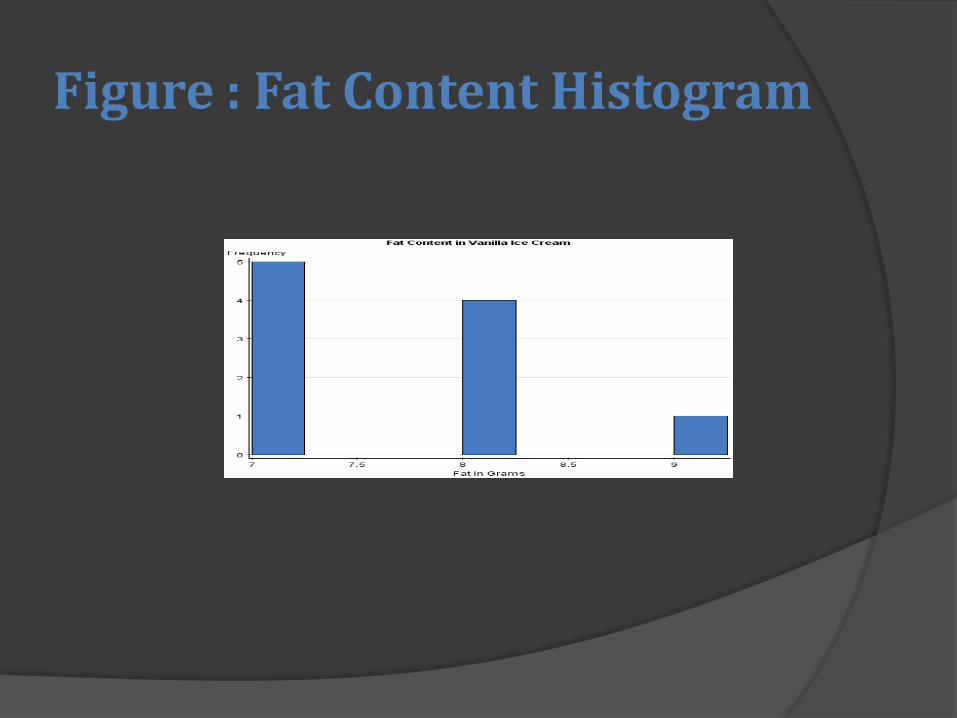
Figure : Fat Content Histogram
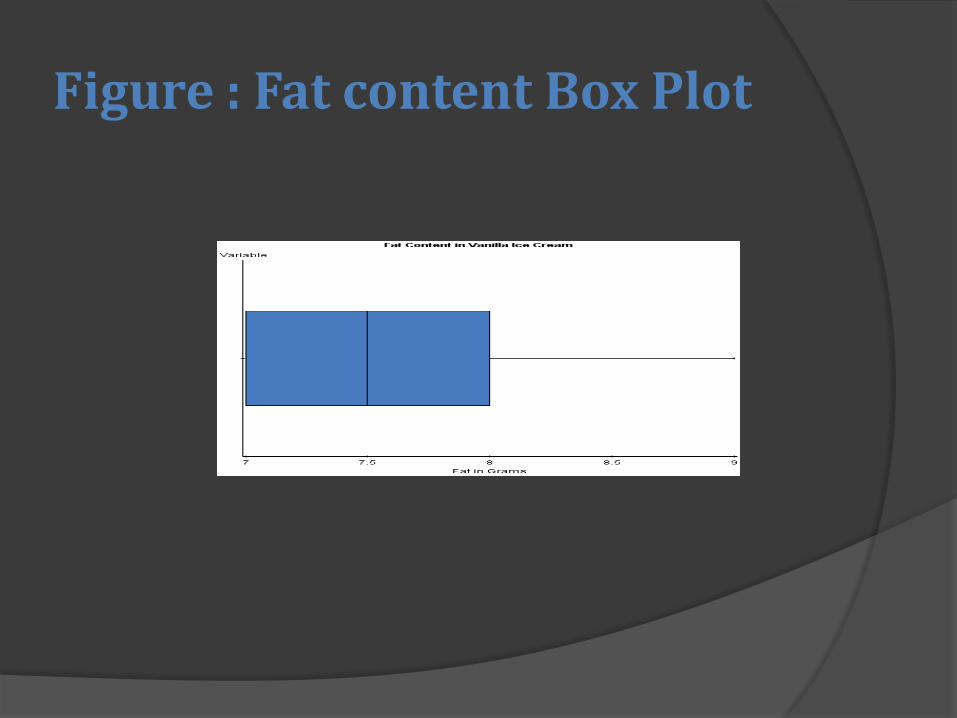
Figure : Fat content Box Plot
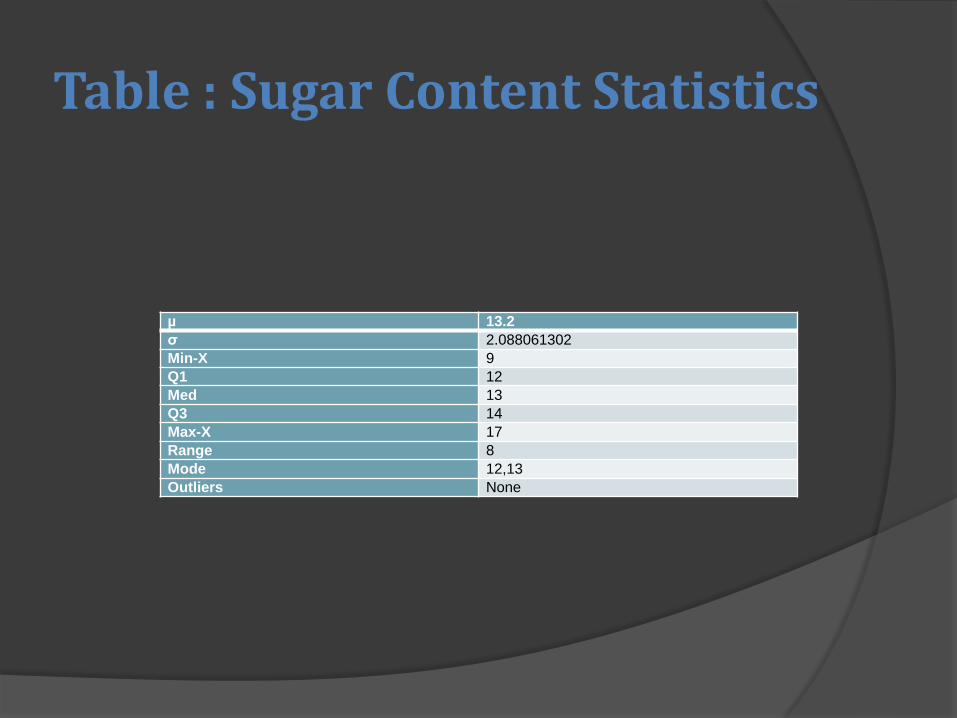
Table : Sugar Content Statistics
µ 13.2
σ 2.088061302
Min-X 9
Q1 12
Med 13
Q3 14
Max-X 17
Range 8
Mode 12,13
Outliers None
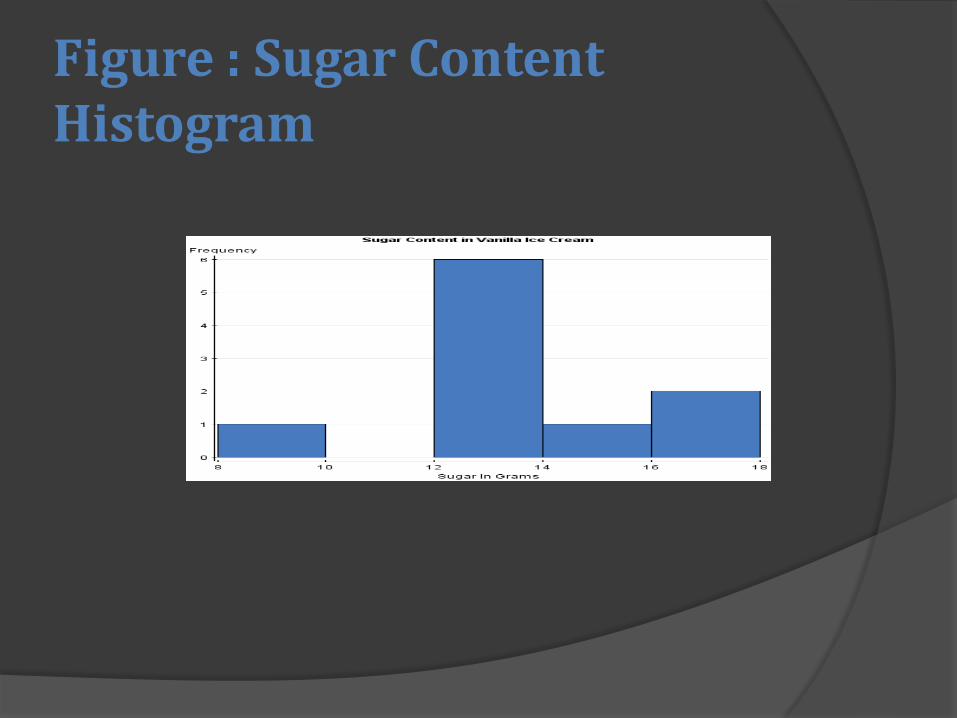
Figure : Sugar Content Histogram
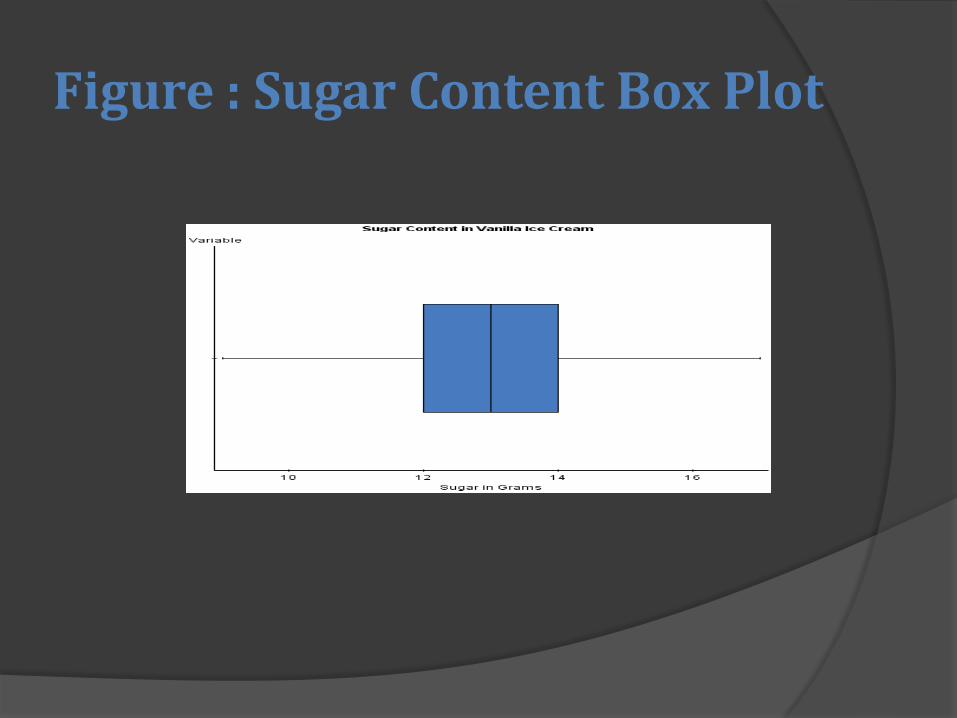
Figure : Sugar Content Box Plot
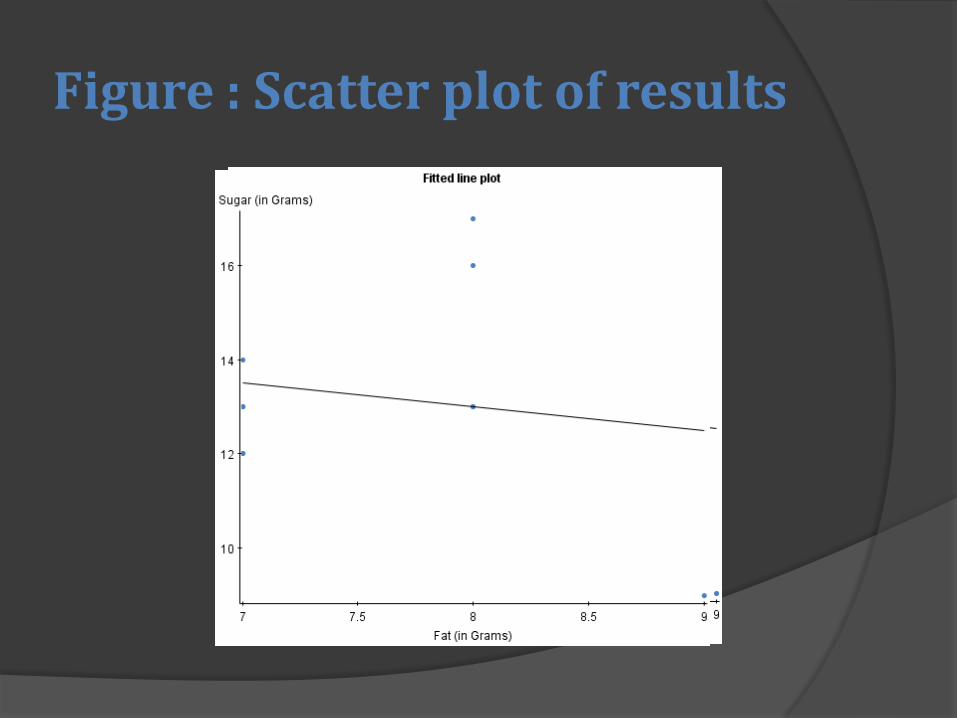
Figure : Scatter plot of results
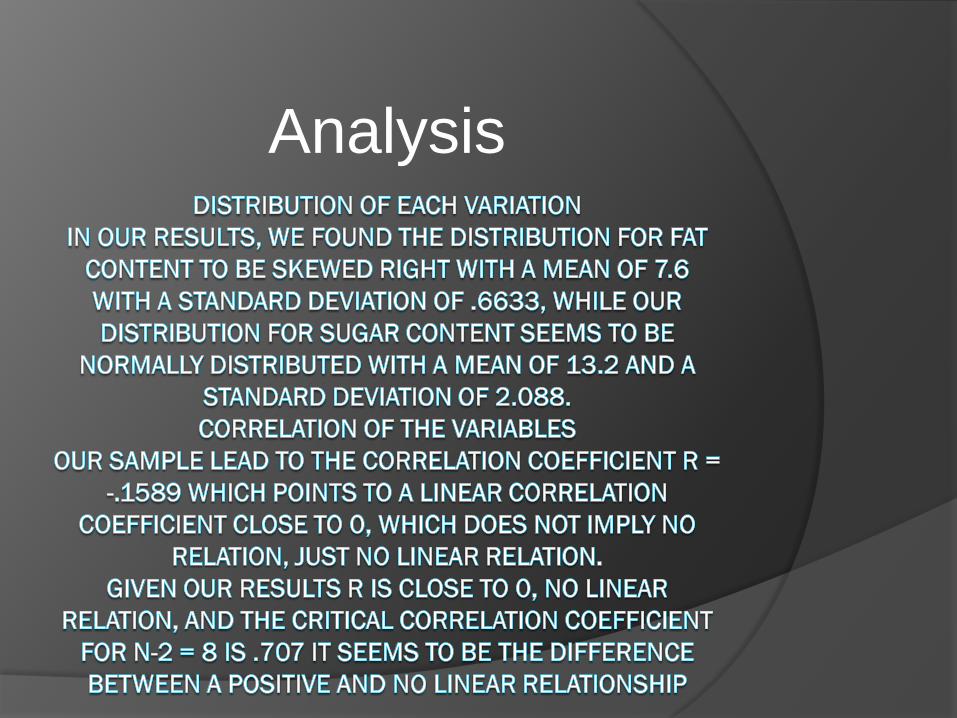
Analysis
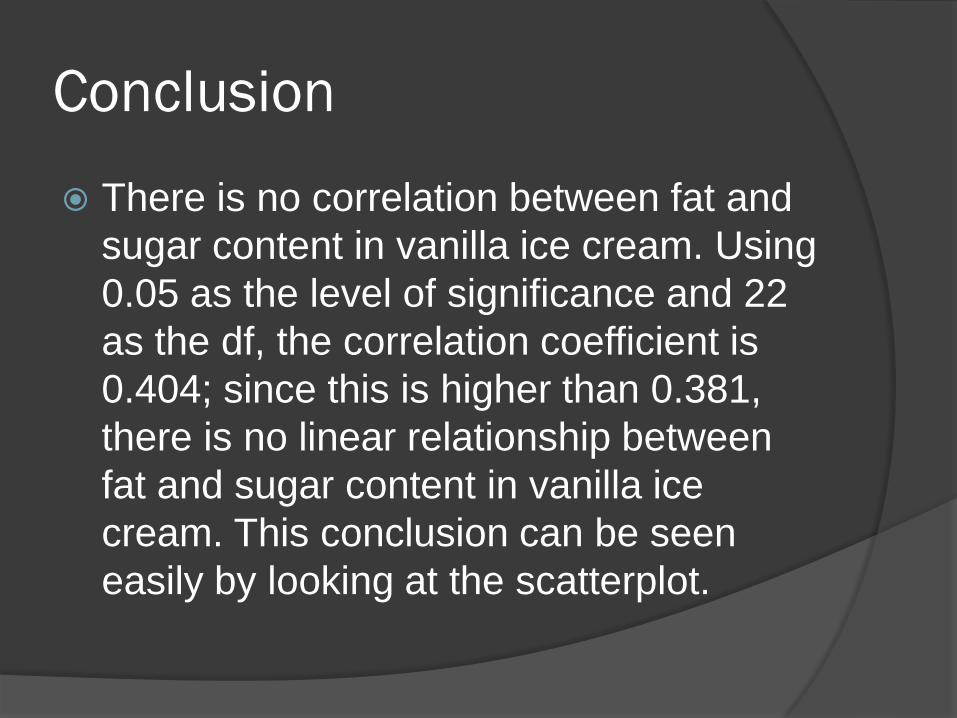
Conclusion
There is no correlation between fat and
sugar content in vanilla ice cream. Using
0.05 as the level of significance and 22
as the df, the correlation coefficient is
0.404; since this is higher than 0.381,
there is no linear relationship between
fat and sugar content in vanilla ice
cream. This conclusion can be seen
easily by looking at the scatterplot.