group a streptococcal m protein activates the nlrp3...
TRANSCRIPT
ARTICLESDOI: 10.1038/s41564-017-0005-6
© 2017 Macmillan Publishers Limited, part of Springer Nature. All rights reserved.
Group A streptococcal M protein activates the NLRP3 inflammasomeJ. Andrés Valderrama1,2, Angelica M. Riestra1, Nina J. Gao1, Christopher N. LaRock! !1, Naveen Gupta3, Syed Raza Ali1, Hal M. Hoffman1,3, Partho Ghosh2* and Victor Nizet! !1,4*
1 Department of Pediatrics, University of California, San Diego, La Jolla, CA 92093, USA. 2 Department of Chemistry and Biochemistry, University of California, San Diego, La Jolla, CA 92093, USA. 3 Department of Medicine, University of California, San Diego, La Jolla, CA 92093, USA. 4 Skaggs School of Pharmacy and Pharmaceutical Sciences, University of California, San Diego, La Jolla, CA 92093, USA. *e-mail: [email protected]; [email protected]
SUPPLEMENTARY INFORMATION
In the format provided by the authors and unedited.
NATURE MICROBIOLOGY | www.nature.com/naturemicrobiology

1
Supplementary Information
Group A Streptococcal M Protein Activates the NLRP3 Inflammasome
J. Andrés Valderrama1,2, Angelica M. Riestra1, Nina J. Gao1, Christopher N. LaRock1,
Naveen Gupta3, Syed Raza Ali1, Hal M. Hoffman1,3, Partho Ghosh2* and Victor Nizet1,4 *
1Department of Pediatrics, University of California, San Diego, La Jolla, CA 92093, USA.
2Department of Chemistry and Biochemistry, University of California, San Diego, La
Jolla, CA 92093, USA. 3Department of Medicine, University of California, San Diego,
La Jolla, CA 92093, USA. 4Skaggs School of Pharmacy and Pharmaceutical Sciences,
University of California, San Diego, La Jolla, CA 92093, USA.
Contents: Supplementary Figures 1-10 and corresponding legends.
2
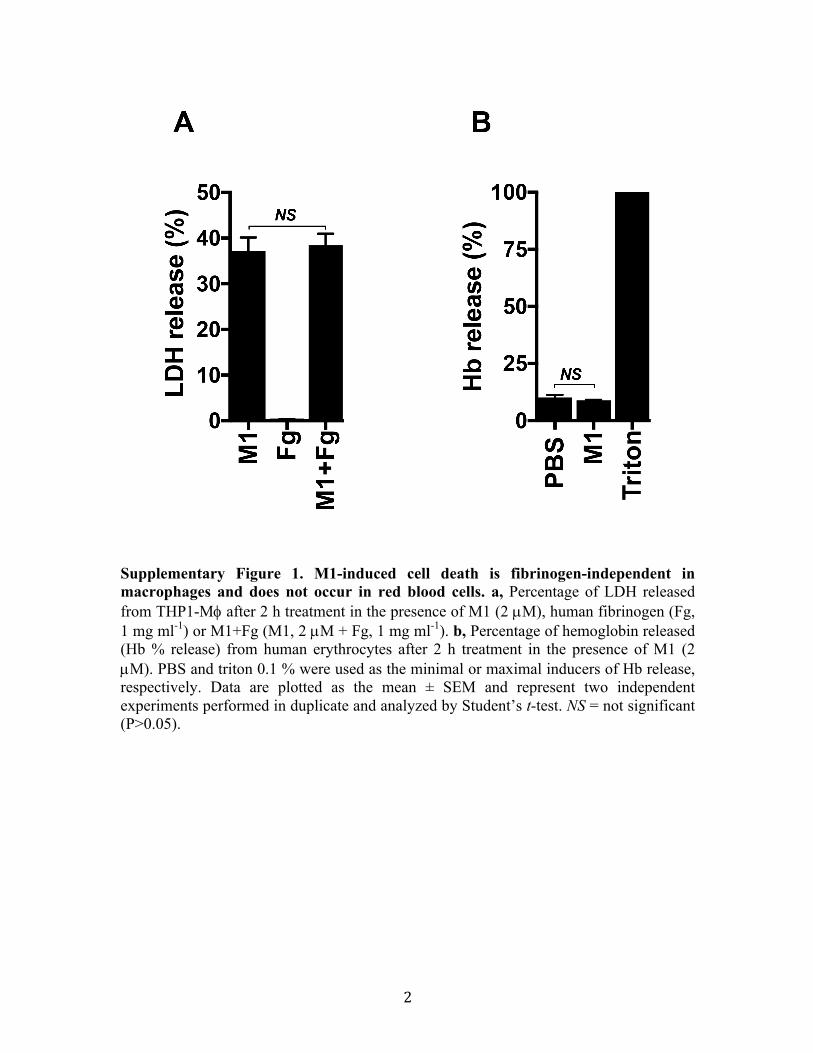
Supplementary Figure 1. M1-induced cell death is fibrinogen-independent in macrophages and does not occur in red blood cells. a, Percentage of LDH released from THP1-Mf after 2 h treatment in the presence of M1 (2 µM), human fibrinogen (Fg, 1 mg ml-1) or M1+Fg (M1, 2 µM + Fg, 1 mg ml-1). b, Percentage of hemoglobin released (Hb % release) from human erythrocytes after 2 h treatment in the presence of M1 (2 µM). PBS and triton 0.1 % were used as the minimal or maximal inducers of Hb release, respectively. Data are plotted as the mean ± SEM and represent two independent experiments performed in duplicate and analyzed by Student’s t-test. NS = not significant (P>0.05).
3
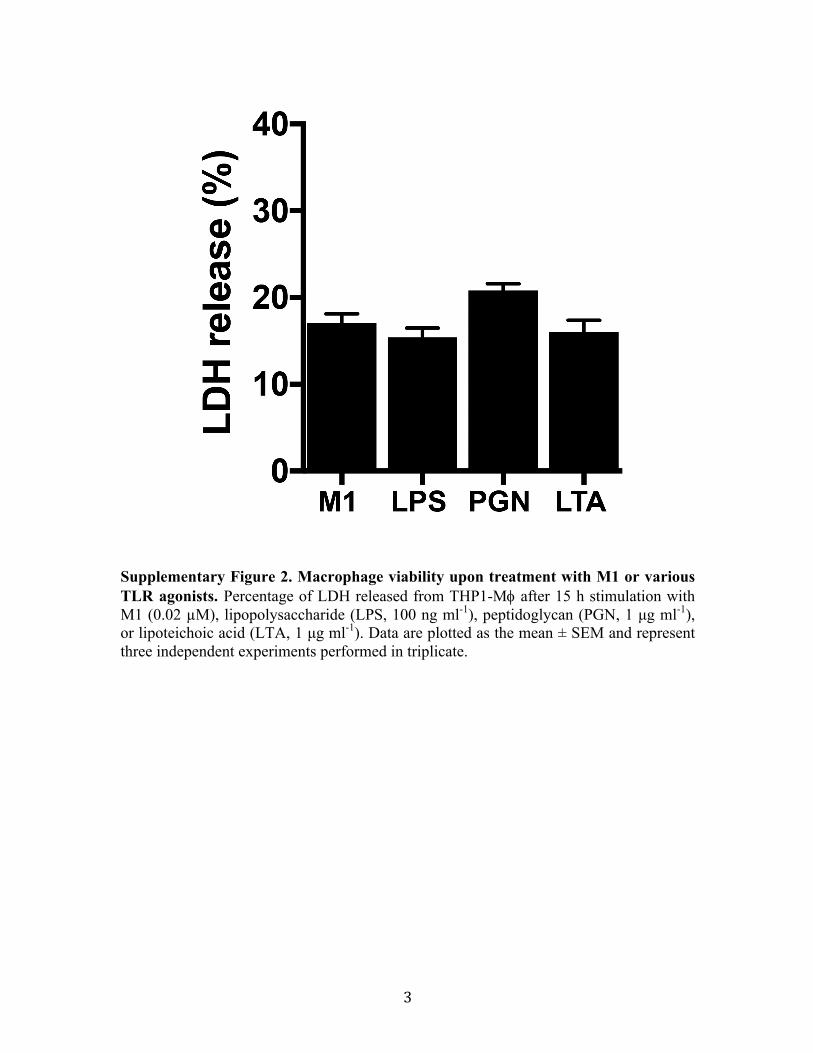
Supplementary Figure 2. Macrophage viability upon treatment with M1 or various TLR agonists. Percentage of LDH released from THP1-Mf after 15 h stimulation with M1 (0.02 µM), lipopolysaccharide (LPS, 100 ng ml-1), peptidoglycan (PGN, 1 µg ml-1), or lipoteichoic acid (LTA, 1 µg ml-1). Data are plotted as the mean ± SEM and represent three independent experiments performed in triplicate.

4
Supplementary Figure 3. PMA triggers signal 1 in THP-1 differentiated macrophages. qPCR analysis of IL-1b gene expression from undifferentiated THP-1 cells (THP1 Mo, - PMA) or THP-1 differentiated to macrophages (THP1-Mf, + PMA). The qPCR results were calculated by Delta-Delta CT method with the gadph gene as internal control (housekeeping gene). Data are plotted as the mean ± SEM and represent three independent experiments performed in triplicate and analyzed by Student’s t-test. NS = not significant (P>0.05), ***P<0.001).
5
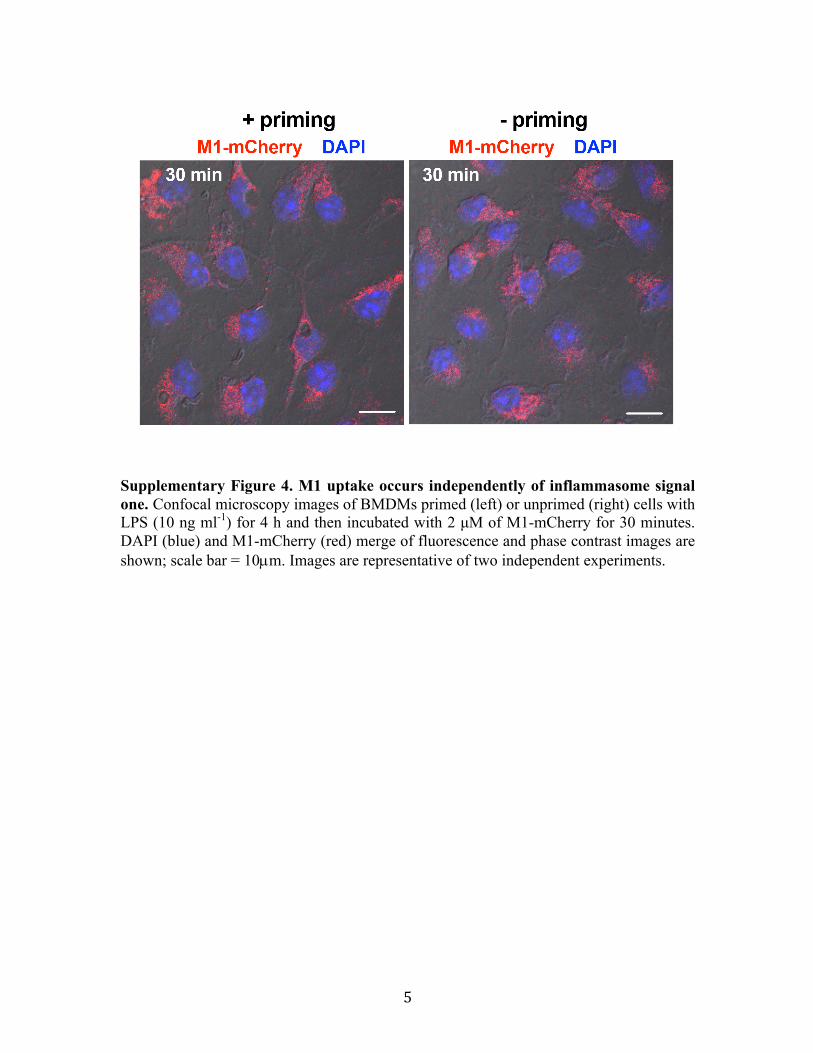
Supplementary Figure 4. M1 uptake occurs independently of inflammasome signal one. Confocal microscopy images of BMDMs primed (left) or unprimed (right) cells with LPS (10 ng ml-1) for 4 h and then incubated with 2 µM of M1-mCherry for 30 minutes. DAPI (blue) and M1-mCherry (red) merge of fluorescence and phase contrast images are shown; scale bar = 10µm. Images are representative of two independent experiments.
6
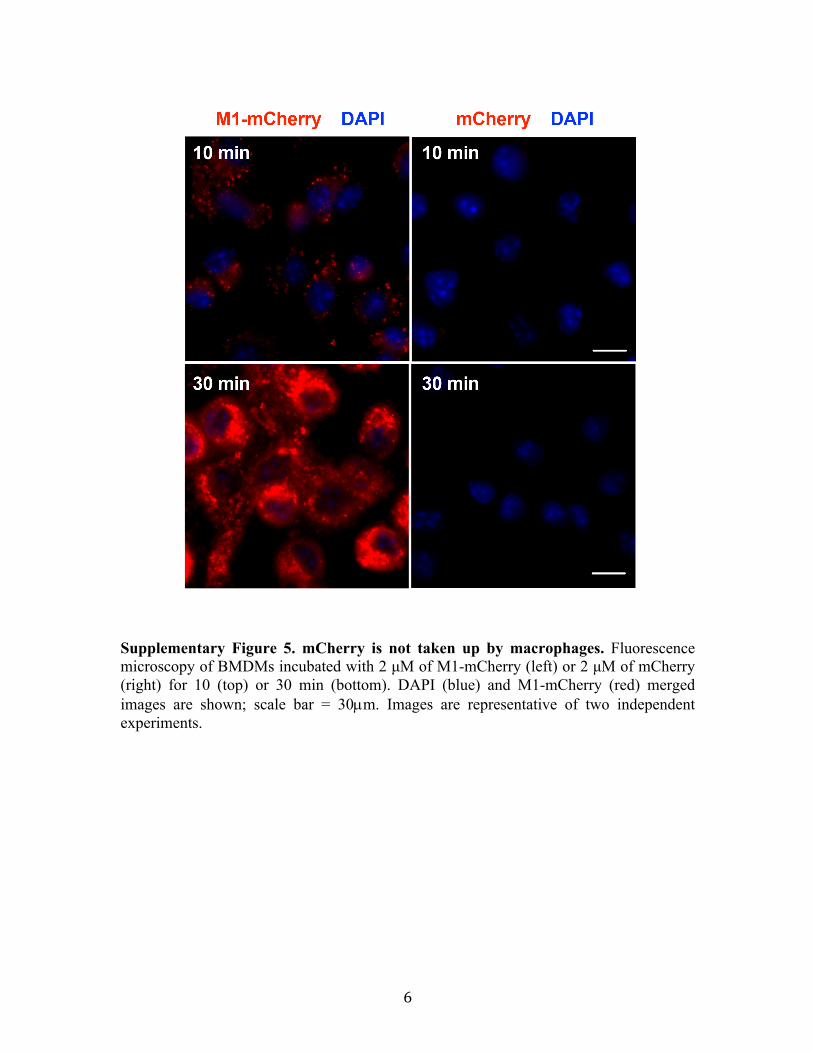
Supplementary Figure 5. mCherry is not taken up by macrophages. Fluorescence microscopy of BMDMs incubated with 2 µM of M1-mCherry (left) or 2 µM of mCherry (right) for 10 (top) or 30 min (bottom). DAPI (blue) and M1-mCherry (red) merged images are shown; scale bar = 30µm. Images are representative of two independent experiments.

7
Supplementary Figure 6. M1 B repeats are not required for M1 uptake. Confocal microscopy images of BMDMs incubated with 2 µM of M1-mCherry (left) or 2 µM of M1ΔB1ΔB2-mCherry (right) for 10 min. DAPI (blue) and M1-mCherry (red) merged images are shown. Insets are magnifications of the dashed boxed regions in the merged images; scale bar = 30µm. Images are representative of two independent experiments.
8
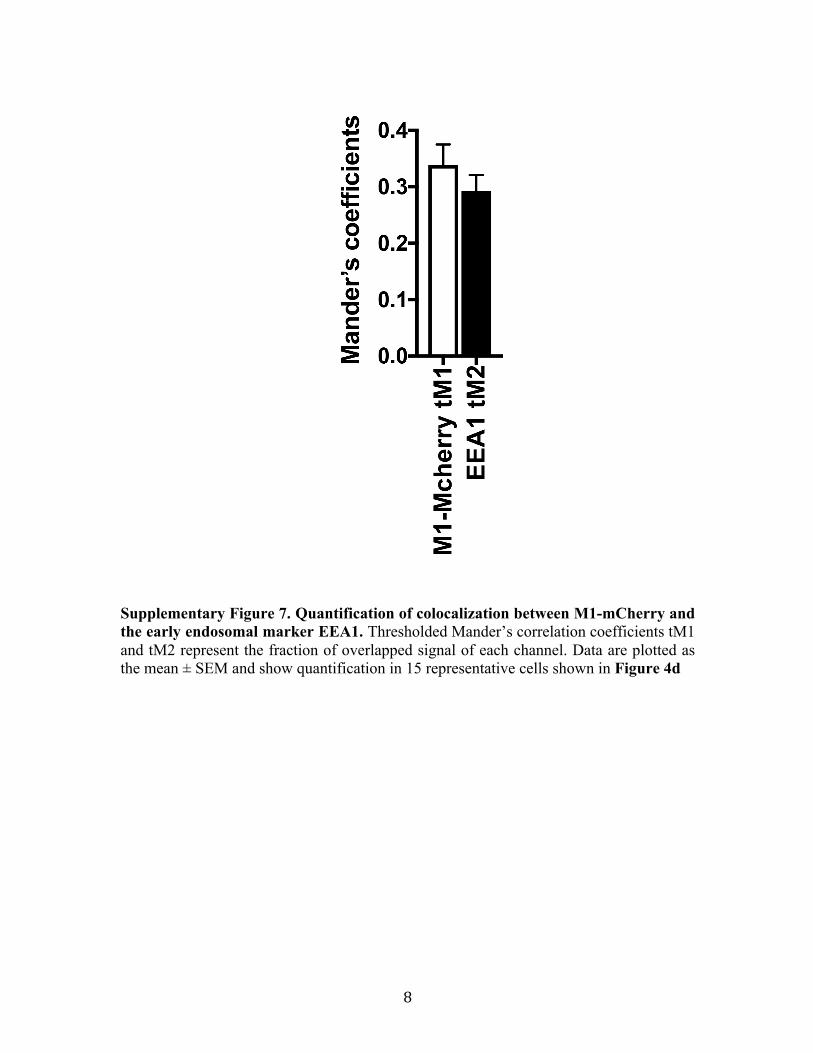
Supplementary Figure 7. Quantification of colocalization between M1-mCherry and the early endosomal marker EEA1. Thresholded Mander’s correlation coefficients tM1 and tM2 represent the fraction of overlapped signal of each channel. Data are plotted as the mean ± SEM and show quantification in 15 representative cells shown in Figure 4d

9
Supplementary Figure 8. Binding of GAS to macrophages is not strongly affected by M1. THP1-Mf infected with FITC-labeled GAS or GASΔM1 bacteria at MOI 10. Macrophage-bacteria interactions were examined 2 h post-infection by flow cytometry. Events were gated in the population of macrophages. Uninfected THP1-Mf served as a negative control. A representative histogram of FITC fluorescence is shown in panel a and panel b shows the geometric mean of fluorescence intensity ± SEM and represent three independent experiments performed in triplicate and analyzed by Student’s t-test. NS = not significant (P>0.05), *P<0.05, ***P<0.001.
10
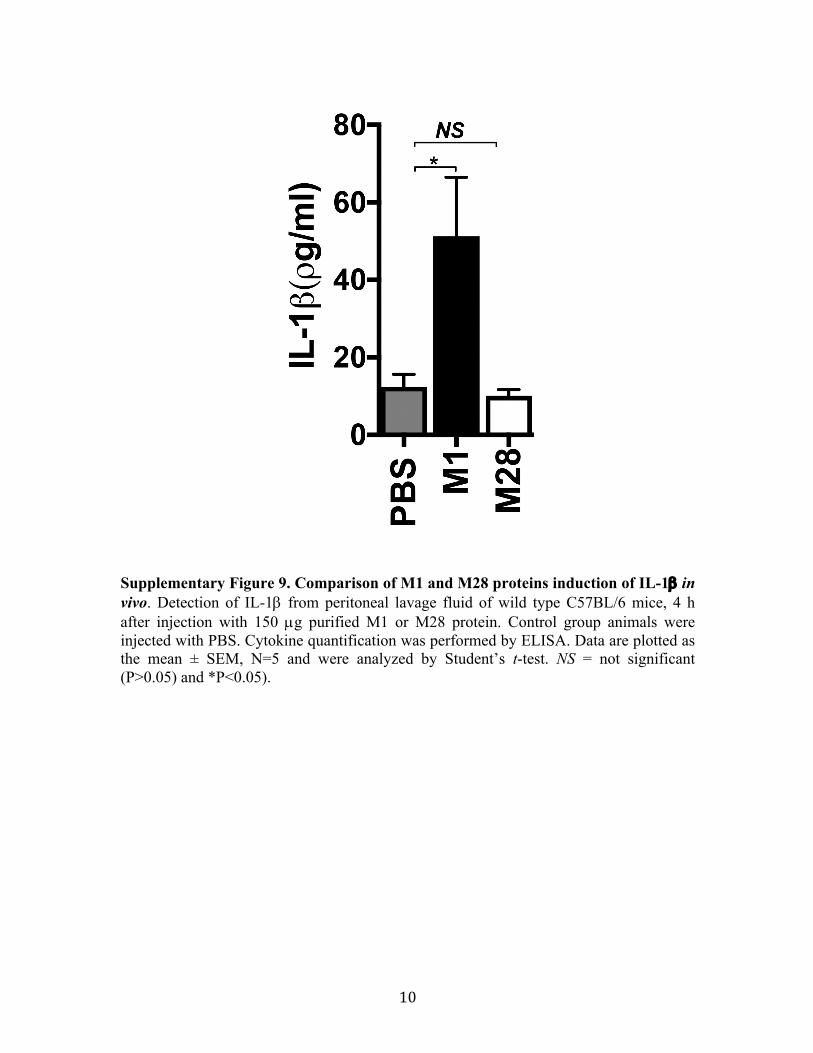
Supplementary Figure 9. Comparison of M1 and M28 proteins induction of IL-1b in vivo. Detection of IL-1b from peritoneal lavage fluid of wild type C57BL/6 mice, 4 h after injection with 150 µg purified M1 or M28 protein. Control group animals were injected with PBS. Cytokine quantification was performed by ELISA. Data are plotted as the mean ± SEM, N=5 and were analyzed by Student’s t-test. NS = not significant (P>0.05) and *P<0.05).

11
Supplementary Figure 10. Detection of IL-6 in vivo. Detection of IL-6 from peritoneal lavage fluid of wild type C57BL/6 mice, 4 h after injection with 10 mg/kg LPS. Control group animals were injected with PBS. Cytokine quantification was performed by ELISA. Data are plotted as the mean ± SEM, N=4 and were analyzed by Student’s t-test (***P<0.001).