groundwater protection - brookhaven national … 1999 site environmental report chapter 7:...
TRANSCRIPT

7-1 1999 SITE ENVIRONMENTAL REPORT
CHAPTER 7: GROUNDWATER PROTECTION
The Brookhaven National Laboratory Groundwater Protection Management Program
is made up of four elements: prevention, monitoring, restoration, and communication.
In addition to implementing aggressive pollution prevention measures to protect
groundwater resources, BNL has established an extensive groundwater monitoring
well network to verify that prevention and restoration activities are effective. In 1999,
BNL collected groundwater samples from 589 monitoring wells during 2,122 individual
sampling events. Six significant volatile organic compound plumes and eight radionuclide
plumes were tracked and evaluated. During 1999, five onsite and one offsite groundwater
remediation systems removed approximately 634 pounds of volatile organic compounds
and returned approximately 757 million gallons of treated water to the Upper Glacial
aquifer.
GroundwaterProtection
7CHAPTER1999 SITE ENVIRONMENTAL REPORT
B R O O K H A V E N N A T I O N A L L A B O R A T O R Y

7-21999 SITE ENVIRONMENTAL REPORT
CHAPTER 7: GROUNDWATER PROTECTION
7.1 THE BNL GROUNDWATER PROTECTIONMANAGEMENT PROGRAM
DOE Order 5400.1 (1988), General Environ-mental Protection Program, requires developmentand implementation of a groundwater protectionprogram. The primary goal of the BNL Ground-water Protection Management Program is toensure that plans for groundwater protection,management, monitoring and restoration arefully defined, integrated and managed in a cost-effective manner that is consistent with federal,state and local regulations. The BNL Groundwa-ter Protection Program includes policy, strategy,requirements and regulations applicable togroundwater protection (Paquette et al. 1998). Asshown in Figure 7-1, the BNL GroundwaterProtection Programconsists of fourinterconnectingelements: (1) prevent-ing pollution of thegroundwater, (2)monitoring theeffectiveness ofengineered/adminis-trative controls atoperating facilitiesand groundwatertreatment systems,(3) restoration of theenvironment bycleaning up contami-nated soil and ground-water, and(4) communicating with interested parties ongroundwater protection issues.
PreventionBNL has initiated a three-phased project to:
(1) identify past or current activities with thepotential to affect environmental quality, (2)conduct a Laboratory-wide review of all experi-ments and industrial-type operations to deter-mine the potential impacts of those activities onthe environment and to integrate pollutionprevention/waste minimization, resourceconservation, and compliance into planning,decision-making and implementation, and (3)develop and implement an EnvironmentalManagement System. These activities are de-signed to prevent further pollution of the solesource aquifer underlying the BNL site, and aredescribed in Chapter 2. In addition, as describedin Chapter 3, efforts are being made to achieve
or maintain compliance with regulatory require-ments and to implement best managementpractices designed to protect groundwater.Examples include upgrading undergroundstorage tanks, closing cesspools, adding engi-neered controls (e.g., barriers to prevent rainwa-ter infiltration that could move contaminants outof the soil and into groundwater), and adminis-trative controls (i.e., reducing the toxicity andvolume of chemicals in use or storage).
MonitoringBNL has an extensive groundwater-monitor-
ing network designed to evaluate groundwatercontamination from historical and currentoperations. Groundwater monitoring is a means
of verifying thatprotection andrestoration efforts areworking. Groundwa-ter monitoring isbeing conductedunder two programs -the EnvironmentalMonitoring Programdesigned to satisfyDOE and New YorkState monitoringrequirements foractive research andsupport facilities, andthe EnvironmentalRestoration (ER)program for monitor-ing related to BNL’s
obligations under the Comprehensive Environ-mental Response, Compensation, and LiabilityAct (CERCLA). These programs are coordi-nated to ensure completeness and to preventany duplication of effort in the installation andabandonment of wells, and the sampling andanalysis of groundwater. Furthermore, dataquality objectives; plans and procedures; sam-pling and analysis; quality assurance; datamanagement; and well installation; maintenanceand abandonment programs are being inte-grated to optimize the groundwater monitoringsystem and to ensure that water quality data areavailable for review and interpretation in atimely manner. In 1999, there were no majorchanges to BNL’s groundwater monitoringprogram in terms of number of wells sampled,frequency of sampling or specific analytestested.
Figure 7-1. BNL’s Groundwater Protection Program.
7-3 1999 SITE ENVIRONMENTAL REPORT
CHAPTER 7: GROUNDWATER PROTECTION
RestorationBNL was added to the National Priorities
List in 1989 (see Chapter 2 for a discussion ofthe BNL’s ER program). Twenty-nine Areas ofConcern (AOC) have been grouped into sixOperable Units (OU). Remedial Investigation/Feasibility Studies have been conducted for eachOU. A primary goal of the ER program isremediating soil and groundwater contamina-tion, and preventing additional groundwatercontamination from migrating offsite. To thatend, contaminant sources (e.g., contaminatedsoil, underground tanks) are being removed orremediated to prevent further contamination ofgroundwater. All remediation work is carriedout under the Interagency Agreement (IAG)between the U.S. Environmental ProtectionAgency (EPA), New York State Department ofEnvironmental Conservation (NYSDEC) andDOE.
CommunicationBNL has a community involvement, govern-
ment and public affairs program to ensure thatBNL communicates with the community in aconsistent, timely and accurate manner. Themajority of communications regarding ground-water protection have been associated with theER program. A number of communicationmechanisms are in place, such as web pages,mailings, public meetings, briefings, androundtable discussions.
7.2 GROUNDWATER MONITORING
Groundwater monitoring program elementsinclude: installing monitoring wells; planningand scheduling; quality assurance; samplecollection; sample analysis; data verification,validation and interpretation; and reporting.Monitoring wells are generally used to monitorspecific facilities where degradation of thegroundwater is known or suspected to haveoccurred, to fulfill regulatory permit require-ments, to assess the quality of groundwaterentering or leaving the BNL site, and to ensurethat corrective measures designed to protectand restore groundwater are, in fact, working.
The groundwater beneath the BNL site isconsidered by New York State as Class GAgroundwater. Class GA groundwater is definedas a source of potable water supply and suitablefor drinking. As such, federal drinking waterstandards, New York State Drinking WaterStandards (NYS DWS), and NYS Ambient Water
Quality Standards (NYS AWQS) for Class GAgroundwater have been used as groundwaterprotection and remediation goals. The BNLgroundwater surveillance program uses moni-toring wells (which are not utilized for drinkingwater supply) to monitor research and supportfacilities where there is a potential for environ-mental impact, and areas where past wastehandling practices or accidental spills havealready degraded groundwater quality. BNLevaluates the potential impact of radiologicaland non-radiological levels of contamination bycomparing analytical results to New York Stateand DOE reference levels and backgroundwater quality levels. Non-radiological analyticalresults from groundwater samples collectedfrom surveillance wells are usually compared toNYSDEC AWQS. Radiological data are com-pared to NYS DWS (for tritium, gross beta, andSr-90), NYS AWQS (for gross alpha and radium-226/228), and Safe Drinking Water Act(SDWA)/DOE Derived Concentration Guides(for determining the 4 mrem dose for otherbeta/gamma-emitting radionuclides). Contami-nant concentrations that are below thesestandards are also compared to backgroundvalues to evaluate the potential effects of facilityoperations. The detection of low concentrationsof facility-specific volatile organic compounds(VOCs) or radionuclides may provide importantearly indications of a contaminant release andallow for the timely investigation into theidentification and remediation of the source.
Groundwater quality at BNL is routinelymonitored through a network of approximately460 onsite and 115 offsite surveillance wells (seeFigures 7-2 and 7-3). In addition to groundwaterquality assessments, water levels are routinelymeasured in over 650 onsite and offsite wells toassess variations in directions and velocities ofgroundwater flow. Groundwater flow directionsin the vicinity of BNL are shown on Figure 7-4.
Active and inactive facilities that havegroundwater monitoring programs include thefollowing: the Sewage Treatment Plant/PeconicRiver area, Biology Agricultural Fields, FormerHazardous Waste Management Facility (HWMF),new Waste Management Facility (WMF), twoformer landfill areas, Central Steam Facility/Major Petroleum Facility (CSF/MPF), AlternatingGradient Synchrotron (AGS), Waste Concentra-tion Facility (WCF), Supply and Material, andseveral other smaller facilities. As the result ofdetailed groundwater investigations conducted

7-41999 SITE ENVIRONMENTAL REPORT
CHAPTER 7: GROUNDWATER PROTECTION
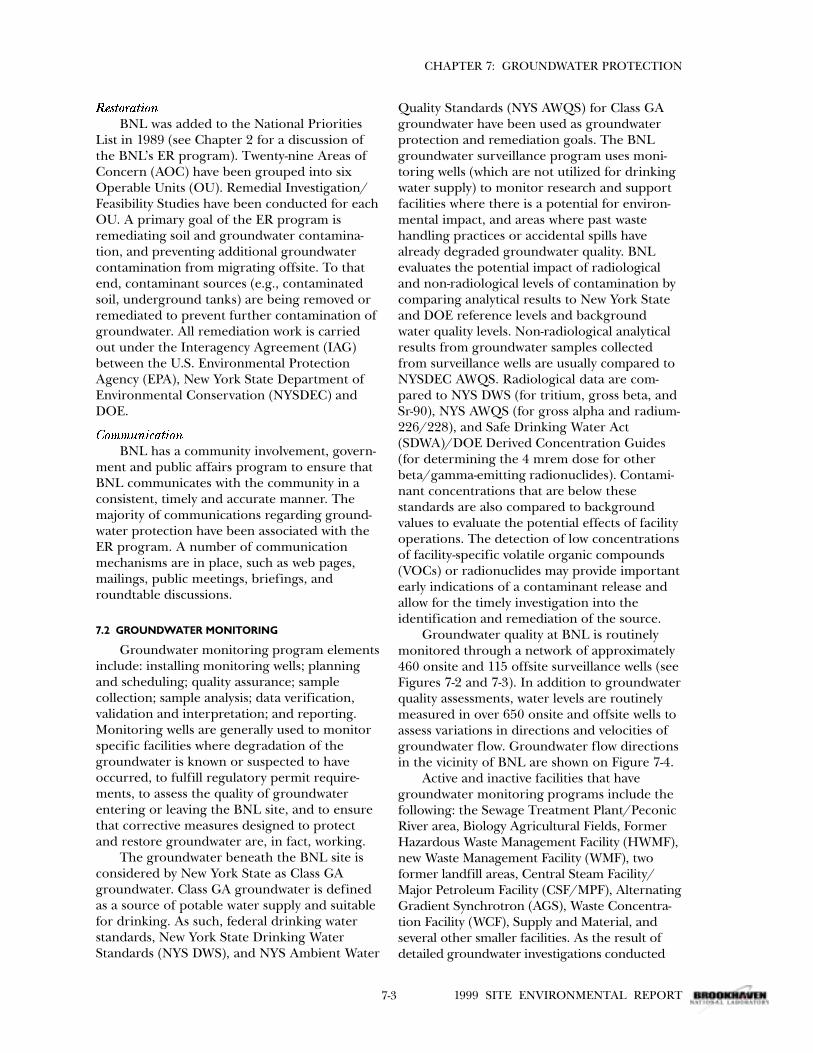
over the past fifteen years, six significant VOCplumes and six radionuclide plumes have beenidentified (Figures 7-5 and 7-6).
7.3 SUPPLEMENTAL MONITORING PROGRAM FORPOTABLE AND PROCESS SUPPLY WELLS
Groundwater quality is also routinelymonitored at all active potable supply wells andprocess supply wells. Because of the proximityof BNL’s potable supply wells to known orsuspected groundwater contamination plumesand source areas, BNL conducts a supplementalpotable supply well monitoring program thatexceeds the monitoring required by the SDWA(see Chapter 3 for more details). This programalso evaluates the quality of water obtainedfrom process supply wells that is used to providewater for non-potable uses (secondary coolingwater and biological experiments). In 1999samples were collected and analyzed for radio-nuclides (e.g., gross alpha, gross beta, gamma,Sr-90, and tritium), and VOCs (consisting of thevolatile halogenated aliphatic hydrocarbons andaromatic hydrocarbons). These samples serveboth as a quality control on contractor labora-tory analyses of compliance samples and as anadditional source of data used in evaluatinggroundwater quality.
The BNL supply well network consists of sixpotable supply wells (Wells 4, 6, 7, 10, 11, and12) and five secondary cooling/process water
supply wells (Wells 9, 101, 102, 103, and 105).All supply wells are screened entirely within theUpper Glacial aquifer (Figure 7-7). In 1999,process wells 101, 102, and 103 were not usedsince the AGS used domestic water for coolingpurposes. Well 9 supplied process water to afacility where biological research on fish isconducted. Secondary cooling water for theBrookhaven Medical Research Reactor wassupplied exclusively from Well 105.
In 1999, with the exception of a singledetection of 1,1,1-trichloroethane in Well 9, allVOC analytes were less than the ambient waterquality standards. Well 9 has historically exhib-ited concentrations above this standard and islocated within a known plume of 1,1,1-trichloroethane. This plume is monitored aspart of the Environmental Restoration program— Operable Unit III. All radiological analyteswere well within drinking water standards.
7.3.1 NONRADIOLOGICAL RESULTS
Samples collected from supply Wells 9, 10, 12and 105 were analyzed for VOCs followed EPAStandard Method 624. This method analyzes for37 organic compounds, including halogenatedand aromatic hydrocarbons. The only parametersdetected above minimum detection limits (MDL)were chloroform, 1,1,1-trichloroethane, anddichloroethylene. The chemical 1,1,1-trichloroethane was detected in Well 9 at 7.2
Figure 7-2. Sampling a Groundwater Monitoring Well.
Purge Water
Flow Through Cell
Water Quality Meter
Pump Controller
Monitoring Well

7-5 1999 SITE ENVIRONMENTAL REPORT
CHAPTER 7: GROUNDWATER PROTECTION
Brookhaven AvePrinceton Ave
East Fifth Ave
North St
South St
Carleton
Dr
Weave r Dr
M o riches MiddleI s land Rd
Stratler Dr
Flower Hill Dr
LongIsland Expressway
Peco
n ic Riv er
Monitoring Wellsand Piezometers
0 1
0 1000 2000 3000
Kilometers
Feet
Figure 7-3. Locations of BNL Groundwater Monitoring Wells.
N

7-61999 SITE ENVIRONMENTAL REPORT
CHAPTER 7: GROUNDWATER PROTECTION
Brookhaven AvePrinceton Ave
East Fifth Ave
North St
South St
Carleton
Dr
M ori ches Middle Island Rd
Stratler Dr
Flower Hill Dr
Long Island Expressway
Pe c onicRiver
40
41
424344454647
48
39
38
27
2829
30
31
32
33
18
1920212223
2425
26
37
36
35
34
17
0 1
0 1000 2000 3000
Kilometers
Feet
LEGENDGroundwater ElevationContour (ft AMSL)
Groundwater Elevation(ft AMSL)
Groundwater FlowDirection
30
Figure 7-4. Groundwater Flow and Elevation (December 1999).
N

7-7 1999 SITE ENVIRONMENTAL REPORT
CHAPTER 7: GROUNDWATER PROTECTION
Willi
am F
loyd
Par
kway
BNL Site Boundary
Car m ansRiver
Brookhaven Ave
East Fifth Ave North
St
South St
Carleton
Dr
M ori ches MiddleIsland Rd
Flower Hill Dr
Long Island Expressway
Pec
onicRiver
OU III
(VOCs)
OU IV
(VOCs)
FLF, Animal/Chemical Pits
and Glass Holes (OUI)(VOCs)
CLF/Former HWMF
(RA V)(VOCs)
Biology Fields(OU VI)
(EDB)
STP (OU V)(VOCs)
0 1
0 1000 2000 3000
Kilometers
Feet
NOTES:Extents defined by 5 µg/L TVOCs (for VOC Plumes) 0.05 µg/L (for EDB Plume)
OU - Operable UnitFLF - Former LandfillCLF - Current LandfillSTP - Sewage Treatment Plant
Figure 7-5. Extent of VOC Plumes at BNL.
N
7-81999 SITE ENVIRONMENTAL REPORT
CHAPTER 7: GROUNDWATER PROTECTION
Carleton
Dr
Long Island Expressway
WCF/ BGRR/ PFS(Sr-90)
0 100 200 300
0 1000
Meters
Feet
NOTES:Extents defined by 1000 pCi/L (for Tritium Plume) 8 pCi/L (for Strontium 90 Plumes)
OU - Operable UnitWCF - Waste Concentration FacilityCLF - Current LandfillPFS - Pile Fan SumpBGRR - Brookhaven Graphite Research Reactor
Brookhaven Ave
East Fifth Ave
g-2 (Tritium)
E-20 (Tritium)
HFBR(Tritium)
OU IV AOC 6(Sr-90)
Chem Holes/ FLF(Sr-90)
Figure 7-6. Extent of Radionuclide Plumes at BNL.
N

7-9 1999 SITE ENVIRONMENTAL REPORT
CHAPTER 7: GROUNDWATER PROTECTION
10
1112
6
7
4
103 102
101
0 100 300 500
0 1000
Meters
Feet
River
Peconic
Potable Supply Well
Process Supply Well
LEGEND
105
9
Figure 7-7. Locations of BNL Potable and Process Supply Wells.
N

7-101999 SITE ENVIRONMENTAL REPORT
CHAPTER 7: GROUNDWATER PROTECTION
micrograms per liter (�g/L), which exceeds theambient water quality standard of 5 �g/L. Well 9is located within a known area of contaminationand is included in the Operable Unit III studyarea. This concentration of 1,1,1-trichloroethanedoes not interfere with the fish experimentationfor which the water is used.
Chloroform was found in most wells, withconcentrations ranging from trace levels (i.e.,< 2 µg/L) to a maximum of 4 µg/L. All chloro-form concentrations were equal to or below theambient water quality standard of 7 µg/L and wellbelow the drinking water standard of 100 µg/L.
Dichloroethylene was detected in Well 9 at amaximum concentration of 2.9 µg/L, which isless than the drinking water standard of 5 µg/L.
7.3.2 RADIOLOGICAL RESULTS
Potable and process well water was sampledand analyzed for gross alpha and gross betaactivity, tritium, and Sr-90; the results are listedin Table 7-1. Nuclide-specific gamma spectros-copy was also performed, supplementing therequirements of the SDWA, which does notstrictly require this analysis unless gross betaactivity exceeds 50 pCi/L. In response toemployee concerns regarding the radiologicalcontent of the BNL potable water system, thetotal number of samples collected in 1999 wasincreased from previous years, to a maximum often times for Well 12. This well was in operationfor the entire year and provided the majority ofthe drinking water for the site. Wells 4, 6, 7, 10,and 11 are less frequently used; consequently,they were sampled less frequently.
Average gross activity and tritium levels inthe potable water wells were consistent withthose of typical background water samples.Neither Sr-90 nor any man-made gamma-emitting radionuclides were observed above theminimum detection limit in any of the potablewells sampled. Throughout the year, processWells 9 and 105 also showed radiological resultsthat were consistent with background environ-mental values.
Compliance with the SDWA is based on theanalytical results obtained from an annualcomposite of four quarterly samples or theaverage of the analyses of four quarterlysamples. Compliance is demonstrated if� the annual average gross alpha activity is less
than 15 pCi/L,� gross beta activity is less than 50 pCi/L,� strontium concentrations are less than 8 pCi/L,
� tritium concentrations are less than 20,000 pCi/L, and
� the total effective dose equivalent for all de-tected radionuclides combined is less than 4mrem in a year.
During 1999, all of these criteria weresatisfied, and therefore, the BNL potable watersystem was in full compliance with the radiologi-cal requirements of 40 CFR 141.
7.4 ENVIRONMENTAL RESTORATION (ER)GROUNDWATER MONITORING PROGRAM
The mission of the ER groundwater moni-toring program is to monitor the variouscontaminant plumes located onsite and offsite,as well as to monitor the progress that thegroundwater treatment systems are making onplume remediation. The long-term groundwatermonitoring projects coordinated under the ERmonitoring program are designed to addressthe following issues:1. Pre-Record of Decision (pre-ROD) Monitor-ing: Addresses the short-term monitoring ofplumes to track their movement following theRemedial Investigation characterization andprior to remediation;2. Post-Record of Decision (post-ROD) Monitor-ing: Addresses the long-term monitoring ofplumes to track their movement following theinitiation of remediation systems. This monitor-ing includes� Source Removal Effectiveness: The monitoring
of wells installed to verify that remediationprojects, such as the capping of previously usedlandfills, are performing to specifications,
� Treatment System Performance: The monitor-ing of active pump-and-treat systems to verifythat they are effectively capturing and remov-ing contaminants, as well as the monitoring ofplumes undergoing passive remediation (i.e.,natural attenuation) to verify that naturalprocesses are effective in reducing contami-nant concentrations, and
� Outpost (Sentinel Well) Detection Monitoring:The monitoring of wells located between theleading edge of contaminant plumes and apotential receptor, to give early warning of thearrival of the leading edge of the plume andtrigger contingency remedial actions.
The groundwater monitoring informationdescribed below provides an overview of ERgroundwater monitoring and remediationactivities for 1999. During this period, a total of505 groundwater surveillance wells were moni-

7-11 1999 SITE ENVIRONMENTAL REPORT
CHAPTER 7: GROUNDWATER PROTECTION
Table 7-1. Potable and Process Well Radiological Analytical Results for 1999.
Well ID* Gross Alpha Gross Beta Tritium Sr-90(pCi/L) (pCi/L) (pCi/L) (pCi/L)
Potable Wells4 (FD) N 6 6 7 2
Max. 1.8 ± 0.6 7.9 ± 1.6 < 339 < 0.41Avg. 0.4 ± 0.7 2.3 ± 2.1 54 ± 116 0.14 ± 0.34
6 (FF) N 7 7 8 2Max. 1.5 ± 0.6 7.9 ± 1.5 348 ± 210 2.74 ± 0.49Avg. 0.4 ± 0.5 2.3 ± 2.0 53 ± 108 1.42 ± 1.83
7 (FG) N 6 6 6 2Max. < 0.8 52.9 ± 2.6 < 339 < 0.411Avg. 0.1 ± 0.3 9.7 ± 15.5 20 ± 124 -0.006 ± 0.005
10 (FO) N 8 8 9 2Max. 2.3 ± 0.7 6.2 ± 1.5 < 316 < 0.37Avg. 0.5 ± 0.6 2.3 ± 1.2 88 ± 97 0.07 ± 0.06
11 (FP) N 9 9 11 3Max. 2.1 ± 0.7 6.3 ± 1.5 < 331 < 0.38Avg. 0.2 ± 0.6 2.6 ± 1.6 20 ± 71 0.11 ± 0.31
12 (FQ) N 10 10 12 2Max. 1.2 ± 0.6 7.8 ± 1.6 < 316 < 0.51Avg. -0.1 ± 0.4 1.8 ± 1.6 41 ± 75 0.14 ± 0.16
Tap Water N 243 243 243 NSBldg. 490 (FN) Max. 11.7 ± 3.5 11.4 ± 5.7 451 ± 197
Avg. 1.9 ± 0.2 3.7 ± 0.3 -20 ± 16
Process Wells105 (FL) N 1 1 2 NS
Max. 6.0 -0.8 < 316Avg. 6.0 -0.8 29 ± 154
9 (FM) N 1 1 2 NSMax. -1.0 -1.1 < 316Avg. -1.0 -1.1 0 ± 87
SDWA Limit 15(a) 50(b) 20,000 8
Notes:All values shown with 95% confidence interval.No anthropogenic gamma-emitting radionuclides were detected in samples collected from these wells in 1999.N=Number of samples collected.NS=Not sampled for this analyte.SDWA=Safe Drinking Water Act* Historic ID shown in parentheses.(a) Excluding radon and uranium.(b) Screening level above which analysis for individual radionuclides is required.
groundwater contaminant distribution maps areprovided. These maps depict the areal extent ofcontamination, and were created by selectingthe highest contaminant concentration ob-served for a given set of wells during a selectedsampling period. Associated cross sectionsshowing the vertical distribution/extent ofcontamination, as well as the hydrogeology aredescribed in the 1999 BNL Groundwater Monitor-ing Report. Because significant changes incontaminant concentrations are typically notobserved during the course of the year, a singlerepresentative monitoring period (i.e., onequarterly sampling period) was chosen for eachplume.
tored during approximately 1,800 individualsampling events. All wells sampled during 1999are listed in Appendix E. Detailed analyticalresults for each sample obtained under the ERprogram are provided in the 1999 BNL Ground-water Monitoring Report (Dorsch et al. 2000).Detailed information about the performance ofthe remediation systems and recommendationsfor potential adjustments to the systems arepresented in the Operational Reports for theindividual systems briefly described below.
Maps showing the main VOC and radionu-clide plumes are provided as Figures 7-5 and7-6. For each significant contaminant sourcearea and plume described below, specific

7-121999 SITE ENVIRONMENTAL REPORT
CHAPTER 7: GROUNDWATER PROTECTION
7.4.1 BACKGROUND MONITORING
Ambient (or background) groundwaterquality for the BNL site is monitored through anetwork of 13 wells located in the northernportion of the site and in offsite areas to thenorth. The site background wells provideinformation on the chemical and radiologicalcomposition of groundwater that has not beenaffected by activities at BNL. These backgrounddata are a valuable reference for comparisonwith groundwater quality data from areas thathave been affected. This well network can alsoprovide warning of any contaminants originat-ing from potential sources of contaminationthat may be located upgradient of the BNL site.
There were no significant detections ofVOCs in background wells. The highest concen-tration detected was chloroform at 2.1 µg/L inWell 000-120, which is a shallow Upper Glacialaquifer well, located immediately north of thenorthwest corner of the site. The ambient waterquality standard for chloroform is 7 µg/L.Historically, low concentrations of VOCs havebeen detected in background Wells 017-03, 017-04, 018-03 and 018-04. All radionuclide concen-trations were consistent with ambient (natural)levels.
7.4.2 OPERABLE UNIT (OU) I
7.4.2.1 FORMER LANDFILL, ANIMAL/CHEMICAL PITS ANDGLASS HOLES
The Former Landfill area was initially usedby the U.S. Army during World Wars I and II.Then BNL used the southeast corner of thelandfill from 1947 through 1966 for disposal ofconstruction and demolition debris, sewagesludge, chemical and low-level radioactive waste,used equipment, and animal carcasses. From1960 through 1966, BNL waste, glasswarecontaining chemical and radioactive waste, andanimal carcasses containing radioactive tracerswere disposed of in shallow pits in an areadirectly east of the Former Landfill. From 1966through 1981, BNL disposed of used glasswarein shallow pits located directly north of thesechemical/animal pits.
A network of eight monitoring wells is usedto monitor the Former Landfill area. Themonitoring program for the Former Landfill isdesigned in accordance with post-closureoperation and maintenance requirementsspecified in 6 NYCRR Part 360, “Solid Waste
Management Facilities.” These requirementsspecify that the well network be monitoredquarterly for a minimum of five years, afterwhich time BNL may petition NYSDEC tomodify the frequency and types of analysesbased on supporting data. The objective of thisprogram is to monitor radiological andnonradiological contamination in the shallowUpper Glacial aquifer immediatelydowngradient of the landfill. The program wasinitiated following the capping of the FormerLandfill in November 1996, to verify whetherthe cap effectively prevents the continuedleaching of contaminants from the landfill anddocument anticipated long-term improvementsto groundwater quality. In addition to thesewells, BNL established a separate network of 24wells to monitor the Animal/Chemical Pits andGlass Holes areas, and the downgradientportions of the Former Landfill plume. Thedowngradient portions of these plumes arecurrently being monitored as part of the OU I/IV Pre-ROD Monitoring Program.
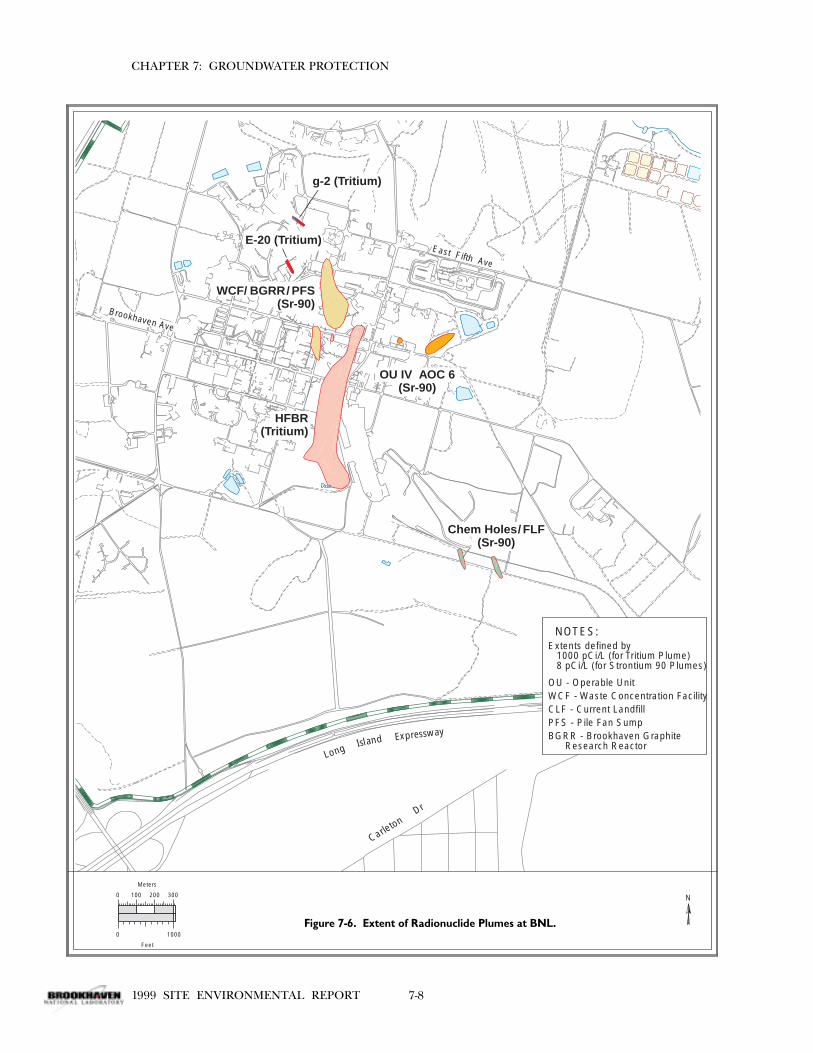
Volatile Organic CompoundsThe areal extent of VOC contamination
from the Former Landfill - Animal/ChemicalPits and Glass Holes area is shown on Figure7-8. The primary chemical contaminantsobserved in the Former Landfill - Animal/Chemical Pits and Glass Holes plume arecarbon tetrachloride (CT), 1,1,1-trichlorethane(TCA), 1,1-dichlroethylene (DCE), trichlorethyl-ene (TCE), tetrachloroethylene (PCE) andchloroform. These individual constituents wereobserved in wells extending from the FormerLandfill source areas to the southern siteboundary at concentrations generally less than50 µg/L. (Note: the NYS AWQS for most ofthese VOCs is 5 µg/L; the standard for chloro-form is 7 µg/L.) The same constituents alsoappear in the segment of the plume locatedsouth of the southern site boundary. The plumeis approximately 9,700 feet in length from theFormer Landfill source areas to just south ofCrestwood Drive, and approximately 1,600 feetat its maximum width, as defined by areashaving Total Volatile Organic Compound(TVOC) concentrations greater than 5 µg/L.(Note: A TVOC concentration is the sum of allindividual VOC concentrations detected in agiven sample.) The segment of the plume with>50 µg/L concentrations is approximately 700feet wide. The area of the plume showing the

7-13 1999 SITE ENVIRONMENTAL REPORT
CHAPTER 7: GROUNDWATER PROTECTION
highest TVOC concentration is located offsitenear Sleepy Hollow Drive. This segment of theplume is comprised primarily of CT, with amaximum TVOC concentration of 397 µg/Ldetected in Well 000-154 in November 1999. Ingeneral, VOCs are found in the shallow Glacialaquifer in the vicinity of the Former Landfill,Animal/Chemical Pits and Glass Holes area, inthe middle Upper Glacial aquifer at the south-ern site boundary, and in the deep Upper Glacialaquifer south of BNL. For a more detaileddiscussion on the vertical distribution of VOCcontamination, see the 1999 BNL GroundwaterMonitoring Report (Dorsch et al. 2000).
Wells 106-25 (located onsite in the MiddleRoad area) and 115-32 (located at the siteboundary) displayed declining TVOC concentra-tions in 1999, following increasing trends during1998 (see Figure 7-8). In both wells, the declinein VOC concentrations is probably due to themigration of high concentration “slugs” of PCEpast these wells. Offsite Well 000-154 (located inthe high concentration segment of the plume)displayed fluctuating TVOC concentrations in1999 after showing a steady decline in 1998. Asimilar trend has been observed for offsite Well000-108.
A comparison of the TVOC plume distribu-tion from 1997 through 1999 is shown onFigure 7-9. Comparison of the groundwaterdata indicates that the capping of the FormerLandfill in November 1996 and the excavationof the Chemical/Animal Pits and Glass Holes inSeptember 1997 have contributed to the declineof TVOC concentrations to below 5 µg/L inshallow wells located near the source areas.Since 1997, TVOC concentrations greater than500 µg/L that were observed in the vicinity ofStratler Drive, Shirley, have declined. Althoughpart of this decline is due to natural degrada-tion and dispersion of the plume with time, thehigh TVOC concentration portion of the plumehas probably migrated south of Well 000-154.Monitoring Wells 000-153 and 800-63 have beenpositioned to detect this high contaminationzone as it continues to move south.
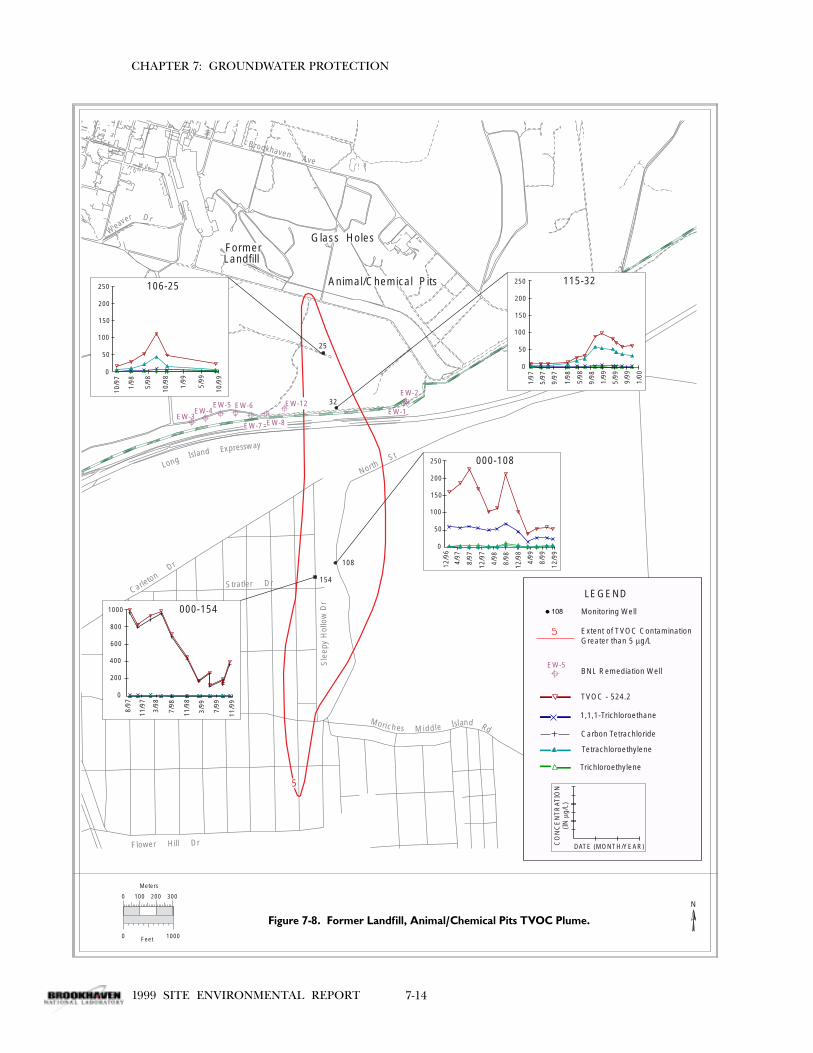
RadionuclidesStrontium-90 (Sr-90) has been routinely detectedin groundwater in the Former Landfill, Ani-mal/Chemical Pits and Glass Holes areas atconcentrations above the drinking waterstandard of 8 pCi/L (specifically in Wells 106-16, 106-13, 097-03 and 097-64). There are two
Sr-90 plumes (as defined by the 8 pCi/L stan-dard) that are located close to the source areas.One plume originates from the Former Landfilland the second originates from the Animal/Chemical Pits area (Figure 7-10). Well 106-16,located immediately downgradient of theAnimal/Chemical pits area, showed a maximumconcentration of 2,540 pCi/L in November1999. Historical trends in Sr-90 concentrationfor wells 097-64, 106-16, and 106-50 are pre-sented in Figure 7-10. The leading edge of theAnimal/Chemical Pits Sr-90 plume has migratedtowards Well 106-50 (located approximately 450feet downgradient) as evidenced by increasingSr-90 concentrations in this well through 1999.
7.4.2.2 CURRENT LANDFILL
The Current Landfill operated from 1967through 1990. It was used for disposal ofputrescible waste, sludge containing precipitatediron from the Water Treatment Plant, andanaerobic digester sludge from the SewageTreatment Plant. The latter contained lowconcentrations of radionuclides, and possiblymetals and organic compounds. BNL alsodisposed of limited quantities of laboratorywastes containing radioactive and chemicalmaterial at the landfill. As a result, the CurrentLandfill is a source of groundwater contamina-tion. Permanent closure (capping) of thislandfill was completed in November 1995 aspart of the ER program.
The Current Landfill post-closure ground-water monitoring program consists of a networkof 11 monitoring wells situated adjacent to thelandfill, in both upgradient and downgradientlocations. These wells are monitored quarterlyto determine the cap’s effectiveness in prevent-ing the continued leaching of contaminantsfrom the landfill, and to document the antici-pated long-term improvements to groundwaterquality. The monitoring well network wasdesigned in accordance with New York Statespecified landfill post-closure O&M require-ments.
Volatile Organic CompoundsAlthough VOCs continue to be routinely
detected in wells located immediatelydowngradient of the landfill, their concentra-tions continued to decrease in response to thecapping of the landfill. The highest TVOCconcentration observed during 1999 was 65µg/L, detected in Well 087-23. Well 087-23 is a
7-141999 SITE ENVIRONMENTAL REPORT
CHAPTER 7: GROUNDWATER PROTECTION
Brookhaven Ave
North St
Carleton
Dr
Wea
ver Dr
Moriches Middle Island Rd
Stratler Dr
Flower Hill Dr
LongIsland Expressway
Glass Holes
Animal/Chemical Pits
FormerLandfill
32
108
154
25
EW-1
EW-2
EW-5EW-4
EW-3
EW-6
5
EW-8EW-7
EW-12
106-25250
200
150
100
50
0
10/9
7
1/98
5/98
10/9
8
1/99
5/99
10/9
9
000-108250
200
150
100
50
0
12/9
6
4/97
8/97
12/9
7
4/98
8/98
12/9
8
4/99
8/99
12/9
9
000-1541000
800
600
400
200
0
8/97
11/9
7
3/98
7/98
11/9
8
3/99
7/99
11/9
9
115-32250
200
150
100
50
0
1/97
5/97
9/97
1/98
5/98
9/98
1/99
5/99
9/99
1/00
108
LEGEND
CO
NC
EN
TR
ATIO
N(I
N µ
g/L)
DATE (MONTH/YEAR)
EW-5
Monitoring Well
Extent of TVOC ContaminationGreater than 5 µg/L
BNL Remediation Well
TVOC - 524.2
1,1,1-Trichloroethane
Carbon Tetrachloride
Tetrachloroethylene
Trichloroethylene
0 100 200 300
0 1000
Meters
Feet
Sle
epy
Hol
low
Dr
Figure 7-8. Former Landfill, Animal/Chemical Pits TVOC Plume.
N

7-15 1999 SITE ENVIRONMENTAL REPORT
CHAPTER 7: GROUNDWATER PROTECTION
Prin
ceto
n
Ave Mid
dle
Rd
Nor
th
St
Car
leto
n
Dr
Mor
iche
sM
i dd
leIs
land
Rd
Str
atle
r
Dr
Long
Isla
ndEx
pres
sway
Sleepy Hollow Dr
Prin
ceto
n
Ave Mid
dle
Rd
Nor
th
St
Car
leto
n
Dr
Mor
iche
sM
i dd
leIs
land
Rd
Str
atle
r
Dr
Long
Isla
ndEx
pres
sway
Sleepy Hollow Dr
Prin
ceto
n
Ave Mid
dle
Rd
Nor
th
St
Car
leto
n
Dr
Mor
iche
sM
i dd
leIs
land
Rd
Str
atle
r
Dr
Long
Isla
ndEx
pres
sway
Sleepy Hollow Dr
1997
TV
OC
PLU
ME
DIS
TR
IBU
TIO
N19
98 T
VO
C P
LUM
E D
IST
RIB
UT
ION
1999
TV
OC
PLU
ME
DIS
TR
IBU
TIO
N
LEG
EN
D5-
49 p
pb T
VO
C
50-9
9 pp
b T
VO
C
100-
499
ppb
TV
OC
> 5
00 p
pb T
VO
C
Kilo
met
ers
01
010
0020
0030
00
Fee
t
Figu
re 7
-9.
Form
er L
andf
ill, A
nim
al/C
hem
ical
Pit
s T
VO
C P
lum
e C
ompa
riso
n –
1997
, 199
8 an
d 19
99.
N
7-161999 SITE ENVIRONMENTAL REPORT
CHAPTER 7: GROUNDWATER PROTECTION
GlassHoles
Princeton Avenue
Middle Road
Brookhaven Ave
8
8
16
64
50
0 100 200
0 100 200 300 400 500 600
Meters
Feet
108LEGEND
Con
cent
ratio
n(in
pC
i/L)
Date (month/year)
Monitoring WellExtent of SR-90 ContaminationGreater than 8 pCi/LStronium-90 (pCi/L)
8
3000
2500
2000
1500
1000
0
1/97
7/97
1/98
7/98
1/99
7/99
1/00
500
106-16
15
12
9
6
3
0
10/9
8
1/99
4/99
7/99
10/9
9
1/00
106-50
15
12
9
6
3
0
097-64
FormerLandfill
Animal/Chemical Pits
64
60
5040
30
20
100
9/98
11/9
8
3/99
6/99
9/99
12/9
9
106-64
Uni
tsU
nits
Uni
ts
Uni
ts
Figure 7-10. Former Landfill, Animal/Chemical Pits Sr-90 Plume Map.
N

7-17 1999 SITE ENVIRONMENTAL REPORT
CHAPTER 7: GROUNDWATER PROTECTION
shallow water table well located just south of thesouthwest corner of the landfill. Concentrationsin downgradient Wells 088-22 and 088-109,which exhibited TVOC concentrations ofgreater then 500 µg/L during 1998, were non-detect and 35 µg/L respectively during 1999.
A detailed discussion of the groundwatermonitoring results for the Current Landfill areaare included in the 1999 Environmental Monitor-ing Report - Current and Former Landfill Areas(BNL 2000a).
RadionuclidesAs in previous years, low levels of tritium
and Sr-90 were detected in Current Landfillmonitoring wells during 1999, but at concentra-tions well below their applicable drinking waterstandards. The highest tritium value was 2,325pCi/L in Well 088-110, whereas the highest Sr-90 value was 2.2 pCi/L detected in Well 088-21.
7.4.2.3 FORMER HAZARDOUS WASTE MANAGEMENTFACILITY (HWMF) AND DOWNGRADIENT SECTION OFCURRENT LANDFILL PLUME
Groundwater contamination originatingfrom the former HWMF and the downgradientsection of the Current Landfill plume is beingmonitored under the Removal Action V (RA V)program. Until 1997, the former HWMF wasBNL’s central Resource Conservation andRecovery Act receiving facility for processing,neutralizing, and storing hazardous and radioac-tive wastes before offsite disposal. As the result ofpast waste handling and storage practices,groundwater at the former HWMF are contami-nated with both chemicals and radionuclides atconcentrations that exceed NYS AWQS or DWS.
The Current Landfill and former HWMFplumes become commingled south of theHWMF due, at least partially, to historicalpumping and recharge effects of the formerSpray Aeration System, which operated from1985 to 1990. The Spray Aeration System wasdesigned to treat VOC-contaminated groundwa-ter originating from the HWMF. The CurrentLandfill/HWMF plume is currently beingremediated using a groundwater extraction andtreatment system consisting of two wellsscreened in the deep portion of the UpperGlacial aquifer at the site boundary (the RA VTreatment System is described in Section 7.4.7).This system provides hydraulic containment ofthose onsite portions of the plume that haveTVOC concentrations greater than 50 µg/L.
The RA V monitoring program uses anetwork of 54 monitoring wells located in areasdowngradient of the Current Landfill andHWMF. This monitoring program is specificallydesigned to� Monitor the VOC and radiological contamina-
tion of groundwater in the shallow zone ofthe Upper Glacial aquifer at, and immediatelyadjacent to, the HWMF,
� Monitor the VOC and radiological contami-nant plumes located south of the CurrentLandfill and HWMF that have been com-mingled south of the HWMF, and
� Evaluate the effectiveness of the RA Vgroundwater pump-and-treat system that wasinitiated in December 1996 at the southernsite boundary (extraction wells EW-1 and EW-2). The monitoring program provides infor-mation necessary to characterize the effects ofthis treatment system on the contaminantplume, and provide the data necessary tomake decisions on the future operations ofthe system.
For a detailed description of theremediation system and its effects on the VOCplume, readers are referred to the RA V Ground-water Treatment Annual Operations Report 1999(BNL 2000b). A detailed discussion of thegroundwater monitoring results for the CurrentLandfill/HWMF area is included in the 1999BNL Groundwater Monitoring Report (Dorsch etal. 2000).
Volatile Organic CompoundsTVOC concentration distributions for the
Current Landfill/HWMF plume are shown inFigure 7-11. The primary VOCs found onsiteinclude chloroethane, TCA , and DCA; whereasTCA, DCE, TCE, and chloroform are found inthe offsite portion of the plume. The CurrentLandfill/HWMF plume, as defined by TVOCconcentrations greater than 5 µg/L, extendsfrom the Current Landfill south to an area southof North Street, a distance of approximately7,150 feet. The plume is approximately 1,100 feetwide at its maximum (as defined by concentra-tions >5 µg/L). The higher concentration portionof the plume (i.e., where concentrations are >50µg/L) is approximately 800 feet wide.Chloroethane, TCA, and DCA are detected inthe shallow Upper Glacial aquifer near the sourceareas, and in the deep Upper Glacial aquifer atthe site boundary and offsite. TCA, DCE, TCE,and chloroform are found in the middle to deep

7-181999 SITE ENVIRONMENTAL REPORT
CHAPTER 7: GROUNDWATER PROTECTION
Brookhaven Ave
North St
Carleton
Dr
Moriches Middle Island Rd
Stratler Dr
LongIsland Expressway
Current Landfill
Hazardous WasteManagement Facility
59
14
109
36
124
138
42
EW-1EW-2
0 100 200 300
0 1000
Meters
Feet
5108
LEGEND
CO
NC
EN
TR
ATIO
N(I
N µ
g/L)
DATE (MONTH/YEAR)
EW-5
Monitoring Well
Extent of TVOC ContaminationGreater than 5 µg/L
BNL Remediation Well
TVOC - 524.2
1,1,1-Trichloroethane
1,1-Dichloroethylene
1,1-Dichloroethane
Chloroethane
22
Figure 7-11. Former Waste Management Facility/Current Landfill TVOC Plume Map.
N

7-19 1999 SITE ENVIRONMENTAL REPORT
CHAPTER 7: GROUNDWATER PROTECTION
Upper Glacial aquifer offsite south of NorthStreet. Cross sectional views of the plume arepresented in the 1999 BNL Groundwater Monitor-ing Report (Dorsch et al. 2000).
Time-vs.-VOC concentration trend plots forkey wells within the Current Landfill/HWMFplume are provided on Figure 7-11. TVOCconcentrations in Current Landfill Wells 088-109 and 088-22 continued to display decreasinglevels. Wells 098-59 and 115-36 (located betweenthe source areas and the site boundary) dis-played slightly decreasing TVOC concentrationsduring 1999. Well 115-14, located close to theextraction system has maintained a low, andsteady TVOC concentration. TVOC concentra-tions trended downward in 1999 for offsite wells115-42, 000-124, and 000-138.
There have been several distinct changes inthe distribution of the plume from 1997through 1999 as shown on Figure 7-12. Ingeneral, the width of the plume has significantlydecreased. The onsite reduction in plume widthcan be attributed to the effects of the pump-and-treat system located at the site boundary(for additional details on this system, refer tothe RA V Groundwater Treatment Annual Opera-tions Report (2000b). The apparent reduction ofplume width in offsite areas is the result ofimproved definition of the plume using tempo-rary wells installed during 1998. Hydrauliccontrol of the plume at the site boundary hasbeen achieved as evidenced by the groundwaterflow patterns in this area, and the decrease incontaminant concentrations in Well 000-138located downgradient of the extraction wells.The decrease in high concentrations immedi-ately south of the former HWMF and offsitesouth of North Street may be a function ofthose portions of the plume having migrated toa position in between monitoring locations. Thedowngradient extent of the Current Landfill/HWMF plume is estimated based on temporarywell data obtained during the 1998 groundwatercharacterization effort in conjunction withknowledge of the groundwater flow systemthrough groundwater modeling and mappingefforts.
RadionuclidesDuring 1999, tritium was detected in several
wells, but at concentrations below the drinkingwater standard of 20,000 pCi/L. The maximumobserved tritium concentration was 4,331 pCi/Lin a sample from Well 115-29 located near the
south boundary extraction system. With theexception of Well 115-29, most of the CurrentLandfill/HWMF wells displayed decreasingtritium concentration trends during 1999.Although tritium concentrations in Well 088-26(located inside the HWMF) have historicallyexceeded the 20,000 pCi/L drinking waterstandard, the maximum observed concentrationduring 1999 was only 2,183 pCi/L.
Although Sr-90 was detected in a number ofwells located within or immediately downgradientof the HWMF, all concentrations were belowthe drinking water standard of 8 pCi/L. Thehighest Sr-90 concentration (6.3 pCi/L) wasdetected in Well 088-26 (located within theHWMF area). Additional groundwater charac-terization work is planned for CY 2000 toconfirm the extent of Sr-90 contamination inthe HWMF area. There were no gross alpha/beta results or gamma-emitting radionuclidesdetected above standards and/or screeninglevels during 1999.
7.4.3 OPERABLE UNIT (OU) III
The monitoring well network established tomonitor the OU III VOC and radionuclide sourceareas and resulting contaminant plumes iscomposed of approximately 180 monitoring wellspositioned from the north-central portion of thesite to the southern site boundary and offsite. TheOU III groundwater-monitoring program isspecifically designed to address the followinggroundwater contamination and plumeremediation issues:� Monitor VOC plumes with identified or sus-
pected sources in the AGS Complex, PaintShop, former Carbon Tetrachloride (CT)Underground Storage Tank area, formerBuilding 96 area, and the Supply and Materielarea.
� Monitor the tritium plume associated with theHigh Flux Beam Reactor (HFBR) and Sr-90plumes associated with the Waste ConcentrationFacility and the formerly operated BrookhavenGraphite Research Reactor (BGRR).
� Evaluate the effectiveness of the OU III southboundary groundwater pump-and-treat systeminitiated in June 1997 (extraction wells EW-3through EW-8). This monitoring programcharacterizes the effects of the pumping onthe contaminant plume, and provides the datanecessary for making decisions on the futureoperations of the extraction wells.

7-201999 SITE ENVIRONMENTAL REPORT
CHAPTER 7: GROUNDWATER PROTECTION
Prin
ceto
n
Ave Nor
th
St
Sleepy Hollow Dr
Brook
have
n Ave
Long
Isla
nd E
xpre
ssw
ay
Prin
ceto
n
Ave Nor
th
St
Sleepy Hollow Dr
Brook
have
n Ave
Long
Isla
nd E
xpre
ssw
ay
Prin
ceto
n
Ave Nor
th
St
Sleepy Hollow Dr
Brook
have
n Ave
Long
Isla
nd E
xpre
ssw
ay
1997
TV
OC
PLU
ME
DIS
TR
IBU
TIO
N19
98 T
VO
C P
LUM
E D
IST
RIB
UT
ION
1999
TV
OC
PLU
ME
DIS
TR
IBU
TIO
N
RA
V G
roun
dwat
erR
emed
iatio
n S
yste
m
LEG
EN
D
5-49
µg/
L T
VO
C
50-9
9 µg
/L T
VO
C
100-
499
µg/L
TV
OC
> 5
00 µ
g/L
TV
OC
Met
ers
Fee
t
010
020
030
040
050
060
0
010
0020
00
RA
V G
roun
dwat
erR
emed
iatio
n S
yste
mR
A V
Gro
undw
ater
Rem
edia
tion
Sys
tem
Figu
re 7
-12.
For
mer
Was
te M
anag
emen
t Fa
cilit
y/C
urre
nt L
andf
ill T
VO
C P
lum
e C
ompa
riso
n –
1997
, 199
8 an
d 19
99.
N

7-21 1999 SITE ENVIRONMENTAL REPORT
CHAPTER 7: GROUNDWATER PROTECTION
� Monitor the offsite segment of the plume and“outpost” wells located to the south(downgradient) of the defined extent of theoffsite VOC plume to provide data on futuredowngradient migration of the plume.Outpost wells are also situated in the south-western portion of BNL, directly upgradientof the Suffolk County Water Authority’s ParrVillage Well Field located near the WilliamFloyd Parkway. These wells are used to verifygroundwater quality south of the BNLapartment areas, and they would also providean early warning if contaminants from BNLwere to migrate toward the Suffolk CountyWater Authority wells.
Volatile Organic CompoundsFigure 7-13 shows the areal extent of the
OU III VOC plume and the OU IV VOC plume.The two plumes are so close to each other thatit is difficult to represent them as distinct,separate plumes. The OU III VOC plumeextends from the AGS Complex area in thecentral part of the site south to the vicinity ofFlower Hill Drive in North Shirley, a distance ofapproximately 17,600 feet (Figure 7-13). Theplume is approximately 5,000 feet at its maxi-mum width, as defined by TVOC concentra-tions >5 µg/L. The higher concentrationportion of the plume (i.e., containing concen-trations >50 µg/L) is approximately 1,900 feetwide near the BNL southern boundary.
The OU III VOC plume is actually com-prised of multiple commingled plumes originat-ing from several sources. To determine theextent of VOC contamination, monitoring welldata from 11 separate ER and EnvironmentalSurveillance (ES) monitoring programs wereevaluated. These monitoring programs includethe OU III Central area, Southern Boundaryarea, Carbon Tetrachloride Plume, formerBuilding 96 area, AS-Industrial Park area,Offsite Program, select downgradient wells fromthe HFBR Tritium Monitoring Program,Alternating Gradient Synchrotron Complexarea, and the Motor Pool and Service Stationareas. The primary VOCs detected in onsitemonitoring wells include CT, TCA, and PCE;whereas CT and PCE are the primary VOCsdetected in offsite groundwater. In general,PCE, TCA, and CT are observed in the shallowportions of the Upper Glacial aquifer in thecentral portion of BNL and in the deep UpperGlacial aquifer at the southern boundary and
offsite areas. Samples from deep wells locatednear the offsite Industrial Park indicate thatthere is CT contamination in the UpperMagothy aquifer.
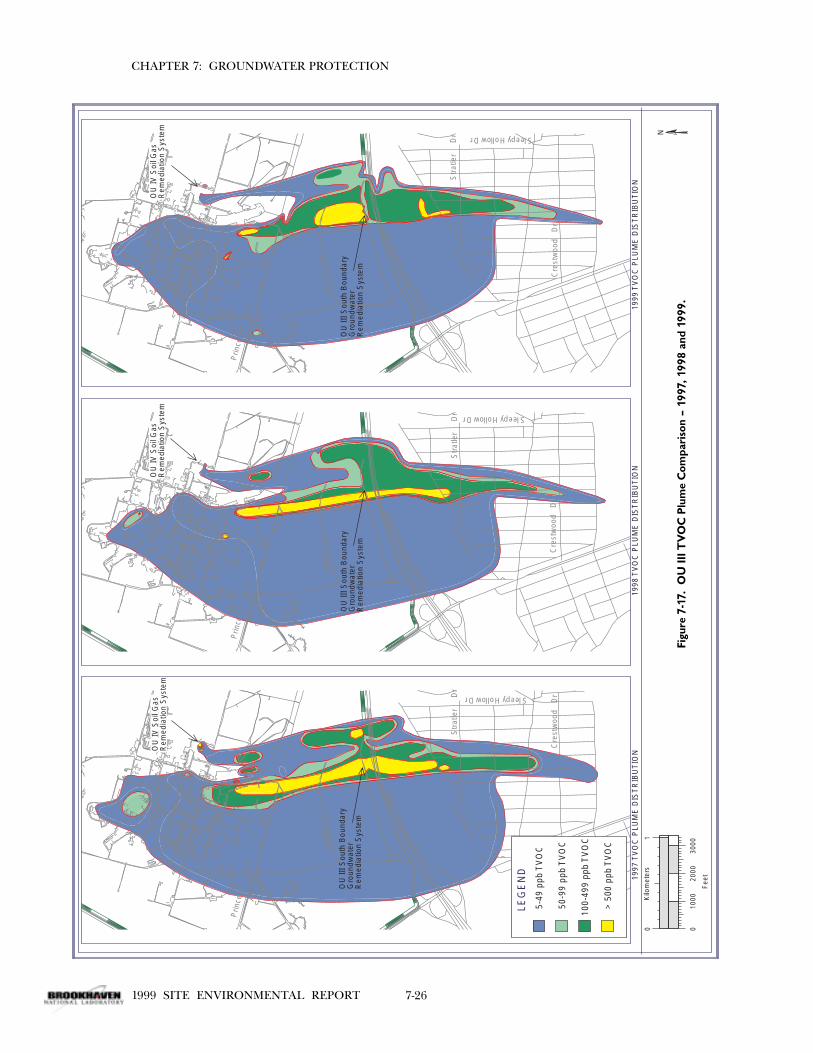
During 1999, wells displaying the highestVOC concentrations (i.e., greater than 1,000µg/L) include the former Building 96 area, theformer CT underground storage tank area(Figure 7-14), areas near the South BoundaryTreatment System, and the offsite IndustrialPark Treatment System area. Trend plotsshowing changes in VOC concentrations for keyOU III monitoring wells are presented onFigures 7-15 and 7-16. A comparison of the OUIII plume distribution from 1997 through 1999is provided on Figure 7-17.
The VOC plume in the former Building 96area consists primarily of PCE, and lowerconcentrations of TCA, with TVOC concentra-tions up to 4,390 µg/L. During 1999, designwork was initiated for an in-well air spargingsystem to remediate the Building 96 sourcearea. This groundwater treatment system isexpected to be operational in CY 2000.
In April 1998, an inactive undergroundstorage tank used for the storage of CT wasexcavated and removed. Although groundwatersamples collected from a nearby well had shownlow-level concentrations of CT since 1995,samples collected in June 1998 revealed levelsapproaching 100,000 µg/L. The ambient waterquality standard for CT is 5 µg/L. It is nowapparent that the increase in contaminantconcentration was probably due to the spillageof residual CT during removal of the under-ground storage tank. Since 1998, the leadingedge of the CT plume has migrated approxi-mately 300 feet downgradient from the formerunderground storage tank area (see Figure 7-14). The highest CT concentrations (up to 7,290µg/L) were detected in Well 085-161 locatedapproximately 100 feet downgradient of theformer underground storage tank area. Concen-trations drop to 375 µg/L in Well 085-17. Figure7-14 provides time-vs.-carbon tetrachloride trendplots for the wells in this area. The effects of thepump-and-treat system on the source area areapparent in the sharp decline in VOC concen-trations at Well 085-98 (see Section 7.4.7 for adescription of the treatment system). Additionalmonitoring wells will be installed in CY 2000 toaddress the leading edge of this plume.
TVOC concentrations greater than 1,000µg/L extend from the Middle Road to the

7-221999 SITE ENVIRONMENTAL REPORT
CHAPTER 7: GROUNDWATER PROTECTION
Brookhaven AvePrinceton Ave
East Fifth Ave
North St
Carleton
Dr
Moriches M iddle IslandRd
Stratler Dr
Flower Hill Dr
Long Island Expressw
ay
EW-1
EW-11EW-10
EW-9
EW-2EW-5
EW-4EW-3
EW-8
EW-7
EW-6
EW-13
EW-14
RW-1
RW-3
RW-4
RW-5RW-6
RW-7
EW-12
10
50
100
500
1000
100
50
5
1010,0005,0001,000 500
100 50
510
105
510
50
100
1000
1000
50
50
10 500100
0 1
0 1000 2000 3000
Kilometers
Feet
RW-2
100500
LEGEND
Isoconcentration ContourRepresenting Line of EqualTVOC Concentration in µg/L(Dashed Where Inferred)
5
EW-5BNL Remediation Well
105
5
Figure 7-13. OU III TVOC Plume Map.N

7-23 1999 SITE ENVIRONMENTAL REPORT
CHAPTER 7: GROUNDWATER PROTECTION
Rowland StR
oche
ster
S
t
Former USTLocation
Ser
vice
Sta
tion
16 17
98
161
5
EW-13
EW-14
0 10 20 30
0 100
Meters
Feet
108
LEGEND
CO
NC
EN
TR
ATIO
N(I
N µ
g/L)
DATE (MONTH/YEAR)
Monitoring Well
Extent of TVOC ContaminationGreater than 5 µg/L(Dashed Where Inferred)
Carbon Tetrachloride
5
Figure 7-14. OU III Carbon Tetrachloride Plume Map.N

7-241999 SITE ENVIRONMENTAL REPORT
CHAPTER 7: GROUNDWATER PROTECTION
Figu
re 7
-15.
Tim
e-vs
.-VO
C c
once
ntra
tion
tre
nd p
lots
for
key
wel
ls in
the
OU
III p
lum
e (c
entr
al a
rea)
: W
ell 0
65-0
6 lo
cate
d do
wng
radi
ent
of t
he A
GS
area
; Wel
l 085
-98
loca
ted
dow
ngra
dien
t of
the
car
bon
tetr
achl
orid
e sp
ill a
rea;
Wel
l 095
-84
loca
ted
in t
he fo
rmer
Bui
ldin
g 96
are
a; a
nd W
ell 0
96-0
7 lo
cate
d do
wng
radi
ent
of t
he S
uppl
y an
dM
ater
iel B
uild
ing
208.
Concentration(in µg/L)
Dat
e (m
onth
/yea
r)
LEG
EN
D
TV
OC
1,1,
1-Tr
ichl
oroe
than
e
Car
bon
Tetr
achl
orid
e
Tetr
achl
oroe
thyl
ene
Tric
holo
roet
hyle
ne

7-25 1999 SITE ENVIRONMENTAL REPORT
CHAPTER 7: GROUNDWATER PROTECTION
Figu
re 7
-16.
Tim
e-vs
.-VO
C c
once
ntra
tion
tre
nd p
lots
for
key
wel
ls in
the
OU
III p
lum
e (s
outh
ern
boun
dary
and
off
site
are
as):
Wel
l 121
-10
loca
ted
at t
he B
NL
sout
hern
boun
dary
; Wel
l 000
-112
loca
ted
offs
ite
near
the
Bro
okha
ven
Indu
stri
al P
ark;
Wel
l 000
-131
loca
ted
on W
aldo
rf D
rive
; and
Wel
l 800
-43
loca
ted
near
Flo
wer
Hill
Dri
ve n
ear
lead
ing
edge
of t
he O
U II
I plu
me.
Concentration(in µg/L)
Dat
e (m
onth
/yea
r)
LEG
EN
D
TV
OC
1,1,
1-Tr
ichl
oroe
than
e
Car
bon
Tetr
achl
orid
e
Tetr
achl
oroe
thyl
ene
Tric
holo
roet
hyle
ne
7-261999 SITE ENVIRONMENTAL REPORT
CHAPTER 7: GROUNDWATER PROTECTION
Prin
ceto
n
Ave
Mid
dle
Rd
Cre
stw
ood
Dr
Str
atle
r
Dr
Car
leto
n D
r
Sleepy Hollow Dr
Long
Islan
dEx
pres
sway
Prin
ceto
n
Ave
Mid
dle
Rd
Cre
stw
ood
Dr
Str
atle
r
Dr
Car
leto
n D
r
Sleepy Hollow Dr
Long
Islan
dEx
pres
sway
Prin
ceto
n
Ave
Mid
dle
Rd
Cre
stw
ood
Dr
Str
atle
r
Dr
Car
leto
n D
r
Sleepy Hollow Dr
Long
Islan
dEx
pres
sway
1997
TV
OC
PLU
ME
DIS
TR
IBU
TIO
N19
98 T
VO
C P
LUM
E D
IST
RIB
UT
ION
1999
TV
OC
PLU
ME
DIS
TR
IBU
TIO
N
OU
III S
outh
Bou
ndar
yG
roun
dwat
erR
emed
iatio
n S
yste
m
OU
IV S
oil G
asR
emed
iatio
n S
yste
m
LEG
EN
D
5-49
ppb
TV
OC
50-9
9 pp
b T
VO
C
100-
499
ppb
TV
OC
> 5
00 p
pb T
VO
C
Kilo
met
ers
01
010
0020
0030
00
Fee
t
OU
IV S
oil G
asR
emed
iatio
n S
yste
mO
U IV
Soi
l Gas
Rem
edia
tion
Sys
tem
OU
III S
outh
Bou
ndar
yG
roun
dwat
erR
emed
iatio
n S
yste
m
OU
III S
outh
Bou
ndar
yG
roun
dwat
erR
emed
iatio
n S
yste
m
Figu
re 7
-17.
OU
III T
VO
C P
lum
e C
ompa
riso
n –
1997
, 199
8 an
d 19
99.
N

7-27 1999 SITE ENVIRONMENTAL REPORT
CHAPTER 7: GROUNDWATER PROTECTION
South Boundary Treatment System area.Concentrations ranged from 1,044 µg/L in wellslocated near the Middle Road (i.e., Wells 113-08and 113-11) to 1,213 µg/L in Well 121-13, whichis located immediately upgradient of thesouthern boundary extraction system. Wellslocated south of the southern boundary extrac-tion system have continued to display eitherreductions in concentrations or are maintainingalready low concentrations (<200 µg/L). Theselow concentrations can be attributed to thepositive effects of the extraction system. Aseventh extraction well (EW-12) was installedduring 1999 to provide better hydraulic controlof the eastern portion of the plume, whichconsists of contaminants originating from theOU IV source area (See Figure 7-26). The CY1999 OU III Pump-and-Treat System Annual Report(BNL 2000c) contains detailed information onsystem operations and progress on theremediation effort.
A TVOC plume with concentrationsgreater than 1,000 µg/L extends from theoffsite Industrial Park area to Carleton Drive inNorth Shirley. This plume, which consistsprimarily of CT, is located in the upper portionof the Magothy aquifer. The highest CT concen-trations were found in samples from Wells 000-249 and 000-130, with maximum concentrationsof 1,011 µg/L and 5,485 µg/L, respectively. Agroundwater treatment system, consisting ofseven in-well air stripping treatment wells, wasinstalled in the industrial park located south ofBNL in 1999. The purpose of the in-well airstripping wells is to treat VOC contaminationlocated in the deep Upper Glacial aquifer.Thirty-six monitoring wells were also installed inthis area to monitor the effects of the system(i.e., hydraulic control and changes in VOCconcentrations). The OU III Off Site RemovalAction groundwater treatment system went intooperation on September 29, 1999. Details onthe system start-up and technology can be foundin the report OU III Off site Removal ActionSystem Start-Up Report (BNL 2000d). Additionalcharacterization to define the extent of CTcontamination in the Magothy aquifer isplanned in CY 2000.
Compared to previous years, VOC concen-trations increased in HFBR Tritium Plumeextraction well EW-9 (located on PrincetonAvenue), with annual average TVOC concentra-tions increasing from 79 µg/L in 1998 to 298µg/L in 1999. This increase can be attributed to
slight changes in groundwater flow directionscaused by site-wide pumping and rechargeeffects, and the continued operation of theextraction wells. These combined effects haveapparently shifted higher concentration por-tions of the OU III plume (originating from theformer Building 96 area) to the east. Details onthe treatment of VOC contamination can befound in the Tritium Pump and Recharge SystemAnnual Evaluation Report (BNL 2000e).
7.4.3.1 HFBR TRITIUM PLUME
Following the January 1997 discovery oftritium in wells south of the HFBR, it wasdetermined that the HFBR’s spent fuel pool wasleaking tritiated water at a rate of approximatelysix to nine gallons per day. To prevent addi-tional release of tritiated water, the HFBR’sspent-fuel pool was completely emptied inDecember 1997. An extensive groundwaterinvestigation has demonstrated that the tritiumplume remains completely onsite, and aninterim remediation system was designed tocontrol the leading edge of the plume.
During 1999, additional groundwatercharacterization work was conducted to providean updated picture of the high concentrationportion of the plume located immediatelydowngradient of the HFBR, and to enhance thedowngradient monitoring well network. Figure7-18 shows the HFBR tritium plume. The plume(defined by tritium concentrations greater than1,000 pCi/L) extends from the HFBR to alocation immediately north of Weaver Drive, adistance of approximately 3,000 feet. (Note: Thedrinking water standard for tritium is 20,000pCi/L.) The plume is approximately 600 feetwide at its maximum. Tritium is detected in theshallow Upper Glacial aquifer near the HFBRsource area, and in the deep Upper Glacialaquifer just to the north of Weaver Drive.
There are two areas of the tritium plumewith concentrations greater than 20,000 pCi/L.One segment extends from the HFBR toBrookhaven Avenue, and the second smallerarea is located between Weaver Drive andRowland Street. The area of the plume contain-ing the highest concentrations continues to belocated in a narrow band extending from theHFBR south to the vicinity of BrookhavenAvenue (see Figure 7-18). Concentrationsgreater than 500,000 pCi/L were found fromthe HFBR south to a point just north of TemplePlace. The highest tritium concentration was

7-281999 SITE ENVIRONMENTAL REPORT
CHAPTER 7: GROUNDWATER PROTECTION
66
75
76
85
86
8
95
96
97104
105
106112
Brookhaven Ave
EW-11
EW-10EW-9
1000
20,0
00
0 100 200
0 100 200 300 400 500 600
Meters
Feet
1000
2000
050
0000
LEGEND
Isoconcentration ContourRepresenting Line of EqualTritium Concentration in pCi/L(Dashed Where Inferred)
5
EW-5BNL Remediation Well
Monitoring Well
Geoprobe
1000
HFBR
Figure 7-18. HFBR Tritium Plume Map.
N

7-29 1999 SITE ENVIRONMENTAL REPORT
CHAPTER 7: GROUNDWATER PROTECTION
5,034,561 pCi/L, detected in a temporary wellinstalled approximately 150 feet south of theHFBR (north of Cornell Avenue). The secondarea where tritium concentrations exceeded20,000 pCi/L is located south of Rowland Streetand centered on Wells 085-78 (maximumconcentration of 63,261 pCi/L) and Well 095-48(maximum concentration of 51,898 pCi/L). Itappears that the remediation system has had apositive effect on further reducing the low leveltritium concentrations previously detected inthe area south of Weaver Drive. There has beenno significant downgradient migration oftritium between 1997 and 1999; and Well 105-44, which is located immediately downgradientof the tritium pump and treat system, showed asignificant decline in tritium concentrationduring 1999.
Historical tritium trends are presented inFigure 7-19. Data collected during 1999 indicatethat the tritium plume has shifted to the east inresponse to artificial influences on the ground-water flow field (i.e., influence caused by supplywell pumping and water recharge). This east-ward shift is discernable when comparingtritium concentration trends from 1997 through1999. Wells that were initially located within theplume either showed continual concentrationdeclines or remained at or just above detectionlimits (Wells 075-11, 075-12, 075-43, 075-45, 075-44, 075-85, 085-71, 085-72, and 095-44). How-ever, tritium concentrations have increased inwells that were located to the east of the highconcentration portions of the plume in 1997(Wells 085-67, 085-78, and 095-48). Figure 7-20shows a comparison of the 1997 and 1999plume distribution. A detailed analysis of theflow conditions in this area of the site wasperformed as part of the Monitored NaturalAttenuation (MNA) Work Plan for the HFBRTritium Plume (BNL 1999a).
7.4.3.2 WASTE CONCENTRATION FACILITY (WCF) ANDBROOKHAVEN GRAPHITE RESEARCH REACTOR (BGRR)/PILE FAN SUMP AREAS
Historical waste handling operations at theWCF, and operations at the former BGRR andits associated Pile Fan Sump, resulted in therelease of Sr-90 to the groundwater below thesefacilities. Following an extensive characterizationeffort in 1997 utilizing temporary wells, apermanent monitoring-well network was in-stalled in the spring of 1999. The newly installedwells supplemented available existing wells
monitored under the OU III (AOC 29 HFBR)program and wells previously installed underthe OU III Remedial Investigation. The distribu-tion of Sr-90 contamination in these sourceareas is shown on Figure 7-21.
Two separate and distinct areas of Sr-90contamination are recognized. The moresignificant of the two areas can be traced fromthe WCF area south to the area just north ofCornell Avenue, a distance of approximately1,300 feet. The width of this plume, as definedby Sr-90 concentrations that exceed the 8 pCi/Ldrinking water standard, is approximately 400feet. The vertical extent of contamination isconfined to the shallow and middle portion ofthe Upper Glacial aquifer. The highest concen-tration associated with the WCF plume is inshallow Well 065-175, at a concentration of 361pCi/L. It is noted that a portion of this plume iscomposed of Sr-90 that was released in theBuilding 801 and nearby Pile Fan Sump area.This contamination is detected in shallow UpperGlacial aquifer wells located directlydowngradient of the Building 801/Pile FanSump area. The highest concentration associ-ated with the Building 801/Pile Fan Sumpportion of the plume is in shallow Well 065-172,at a concentration of 49 pCi/L.
The second area of Sr-90 contamination islocated approximately 400 feet south of theBGRR near Cornell Avenue. This plume, definedby Sr-90 concentrations greater than 8 pCi/L,extends approximately 550 feet to an area justnorth of Brookhaven Avenue and is less than 200feet wide. The highest concentration associatedwith the BGRR plume was detected in Well 075-202, at a concentration of 42.9 pCi/L.
7.4.4 OPERABLE UNIT (OU) IV
The Operable Unit IV area contains twosignificant source areas: the 1977 fuel oil/solvent spill site (AOC 5) and the Building 650Sump and Sump Outfall area (AOC 6).
7.4.4.1 1977 OIL-SOLVENT SPILL SITE (AOC5)
In 1977, approximately 25,000 gallons of amixture of Number 6 fuel oil and mineralspirits was released from a ruptured pipe usedto transfer the contents from an undergroundstorage tank to aboveground storage tanks atthe Central Steam Facility (CSF). In addition,several small spills of Number 6 fuel oil fromthe CSF fuel unloading area were documentedbetween 1988 and 1993; and it is suspected that

7-301999 SITE ENVIRONMENTAL REPORT
CHAPTER 7: GROUNDWATER PROTECTION
Brookhaven Ave
1143
44
40
85
67
7872 74
44
44
48
EW-11
EW-10EW-9
1000
0 100 200
0 100 200 300 400 500 600
Meters
Feet
HFBR
LEGEND
Con
cent
ratio
n(in
µg/
L)
Date (month/year)
Monitoring Well
1999 Tritium Plume Distribution
Tritium
BNL Remediation Well
108
1,000
EW-5
Figure 7-19. HFBR Tritium Plume Trend Plots.
N

7-31 1999 SITE ENVIRONMENTAL REPORT
CHAPTER 7: GROUNDWATER PROTECTION
Princeton Ave
Roc
hest
er
St
Brookhaven Ave
Middle Rd
Princeton Ave
Middle Rd
LEGEND1,000-4,999 pCi/L Tritium
5,000-19,999 pCi/L Tritium
20,000-199,999 pCi/L Tritium
> 200,000 pCi/L Tritium
0 100 200
0 200 400 600
Meters
Feet
1997 TRITIUM PLUME DISTRIBUTION 1999 TRITIUM PLUME DISTRIBUTION
Brookhaven Ave
Roc
hest
er
St
Figure 7-20. HFBR Tritium Plume Comparison – 1997 and 1999.
N

7-321999 SITE ENVIRONMENTAL REPORT
CHAPTER 7: GROUNDWATER PROTECTION
Figure 7-21. BGRR/WCF Sr-90 Plume Map.N
65
Cornell Ave
Rutherford Dr
WasteConcentrationFacility
BGRR
HFBR
8 pCi/L
8 p
Ci/L
50 pCi/L
0 100
0 100 200 300
Meters
Feet
LEGENDIsoconcentration ContourRepresenting Line of EqualSr-90 Concentration in pCi/L(Dashed Where Inferred)
8
50 pCi/L
75

7-33 1999 SITE ENVIRONMENTAL REPORT
CHAPTER 7: GROUNDWATER PROTECTION
small volumes of solvents, such as PCE, havebeen released to the ground in the vicinity ofthe CSF. Eighteen wells are used to monitor thisarea. VOC contamination originating from theCSF area is currently monitored under twoprograms: the OU IV 1977 spill area cleanupprogram (AOC 5) and the OU I/IV programwhich monitors the downgradient (south ofBrookhaven Avenue) component of the OU IVplume.
The areal extent of OU IV VOC contamina-tion is shown in Figure 7-13. The OU IV plume,as defined by TVOC concentrations greaterthan 5 µg/L, extends from the 1977 Waste OilSolvent Spill area in the north to an off site areabetween the southern site boundary andCarleton Drive, a distance of approximately6,200 feet. The plume is approximately 1,000feet wide. The width of the higher concentra-tion segments of the plume (i.e., having TVOCconcentrations >50 µg/L) is approximately 700feet. In general, VOCs are present in theShallow Glacial aquifer near the 1977 spill areaand in the Deep Glacial aquifer at the southernsite boundary and offsite areas.
The OU IV plume is composed of thesolvents TCA, PCE, DCE, and TCE, and oilproducts (consisting of toluene, ethylbenzene,and xylene). Although the main source areaappears to be in the vicinity of the 1977 spill,the detection of low levels of TCA and PCE inseveral upgradient wells indicates that some ofthe contamination originates from historicalspills that occurred in the nearby CSF andBuilding 650 areas. Whereas TCA, PCE, DEC,and TCE have migrated considerable distances,the presence of toluene, ethylbenzene andxylene is highly localized to the source area. Anair sparging/soil vapor extraction system(AS/SVE) has been in operation since Novem-ber 1997 to remediate VOC and semi-VOCcontamination of soils and groundwater nearthe spill site (see section 7.4.7). Compared topre-November 1997 VOC concentration data(when TVOC concentrations were typically>1,000 µg/L), the highest TVOC concentrationduring 1999 was 13 µg/L detected in well 076-08. Therefore, the AS/SVE remediation systemhas been highly effective in reducing VOCconcentrations within the source area.
In the downgradient portion of the OU IVplume, the highest VOC concentrations during1999 were found in the area between PrincetonAvenue and the southern site boundary. The
plume in this area is composed primarily ofTCA, DCE, and TCE, with TVOC concentra-tions up to 298 µg/L. In addition, during thefourth quarter of 1999, VOCs were detected inthe upper Magothy aquifer in Wells 122-05 and122-24 at 99 µg/L and 87 µg/L, respectively.Additional characterization of contaminationwithin the upper Magothy aquifer will beconducted during CY 2000.
Figure 7-22 contains time-vs.-VOC concen-tration trend plots for select wells in the OU IVplume. The reduction in VOC concentrations inthe 1977 spill area since November 1997 startup of the AS/SVE system can be clearly seen insource area Well 076-04. Well 096-07 (Supplyand Materiel area) and Well 105-06 (PrincetonAvenue) have also shown marked VOC concen-tration reductions since 1997. These concentra-tion reductions can be attributed to either themigration of contaminant “slugs” downgradientand beyond these wells or the change in thegroundwater flow field in the area and theresulting eastward shift of the plume. Operationof the OU III Southern Boundary treatmentsystem has resulted in a significant lowering ofTVOC concentrations. A seventh extractionwell, EW-12 was installed during 1999 to en-hance the existing pump-and-treat system andprovides hydraulic control for the OU IV plume(see Figure 7-28). Pumping of EW-12 started inlate December 1999. The CY 1999 OU III Pump-and-Treat System Annual Report (BNL 2000c)contains detailed information on system opera-tions and remediation progress.
The changes in the OU IV plume distribu-tion from 1997 through 1999 are shown onFigure 7-17, which depicts the combined OU IIIand OU IV plumes. The higher concentrationsegments of the plume have undergone reduc-tions as a result of remediation both at thesource area and the site boundary.
7.4.4.2 BUILDING 650 AND 650 SUMP OUTFALL AREAS(AOC 6)
In the Building 650 area, Sr-90 concentra-tions in Well 076-28 showed an increase to levelsabove the 8 pCi/L drinking water standard forthe first time in its monitoring history (Figure 7-23), with a maximum Sr-90 concentration of14.9 pCi/L. Previous Sr-90 concentrationsdetected in this well had ranged up to 5 pCi/L.Well 76-28 is located adjacent to the Building650 sump/decontamination pad anddowngradient of a former underground storage

7-341999 SITE ENVIRONMENTAL REPORT
CHAPTER 7: GROUNDWATER PROTECTION
Figu
re 7
-22.
Tim
e-vs
.-VO
C C
once
ntra
tion
Tre
nd P
lots
for
Key
Wel
ls in
the
OU
IV V
OC
Plu
me.
Wel
l 076
-04
loca
ted
near
the
197
7 oi
l/so
lven
t sp
ill a
rea;
Wel
l 105
-06
loca
ted
on e
aste
rn P
rinc
eton
Ave
nue;
Wel
l, 11
4-07
and
122
-22
loca
ted
alon
g th
e B
NL
sout
hern
bou
ndar
y.
Concentration(in µg/L)
Dat
e (m
onth
/yea
r)
LEG
EN
D
TV
OC
1,1,
1-Tr
ichl
oroe
than
e
Car
bon
Tetr
achl
orid
e
Tetr
achl
oroe
thyl
ene
Tric
holo
roet
hyle
ne
Ben
zene
, 1,2
,4-T
rim
ethy
l
(W
ell 0
76-0
4)
Eth
ylbe
nzen
e (W
ell 0
76-0
4)
m-X
ylen
e (W
ell 0
76-0
4)
0-X
ylen
e (W
ell-0
4)
Tole
ne (
Wel
l-076
-04)

7-35 1999 SITE ENVIRONMENTAL REPORT
CHAPTER 7: GROUNDWATER PROTECTION
tank area. The Sr-90 detected in Well 076-28probably originates from contaminated soilsassociated with decontamination pad andstorage tank operations. Strontium-90 was notdetectable in samples from three wells locateddowngradient of Building 650 (Wells 076-25,076-317, and 076-373), nor in upgradient Well076-314.
Soil and groundwater contamination at theBuilding 650 Sump Outfall is due to the histori-cal discharge of radionuclides to the Building650 sump. Historically, Sr-90 has been detectedat concentrations above the 8 pCi/L drinkingwater standard in a number of the wells locateddowngradient of the outfall. Figure 7-23 showsthe areal extent of the Sr-90 plume, as well astime-vs.-Sr-90 concentration trend plots for keywells in this area. Compared to its 1998 posi-tion, little movement of the Sr-90 plume wasevident in 1999. During 1999, Sr-90 concentra-tions exceeded the drinking water standard inthree wells located within 500 feet of theOutfall, with the highest concentration ob-served in Well 076-13 at a concentration of 60pCi/L. Wells 076-28, 076-13 and 076-263 showeddeclining Sr-90 trends during 1999. In late 1999,additional wells were installed downgradient ofthe previously defined extent of contaminationto allow for future evaluation of Sr-90 plumemigration. (Note: Although the new wells werenot sampled until February 2000, the resultinganalytical data were utilized for purposes ofconstructing the plume distribution map pre-sented on Figure 7-23.)
7.4.5 OPERABLE UNIT (OU) V, EASTERN PLUME
The OU V monitoring program uses 34monitoring wells located downgradient of theSewage Treatment Plant (STP). These wellsmonitor VOC and tritium contaminationresulting from historical releases at the STP.Surveillance of present groundwater quality atthe STP is performed as part of the BNLEnvironmental Surveillance (ES) program (seesection 7.5).
Volatile Organic Compounds, Metals andPesticides
The areal extent of VOC contamination isshown on Figure 7-24. It is noted that historicaltemporary well data were used to supplementthe definition of the extent of VOC contamina-tion. The primary chemical contaminants foundin the OU V Eastern VOC plume are TCE andTCA. The ambient water quality standard for
these both of these compounds is 5 µg/L. TheEastern VOC plume, defined by TVOC concen-trations greater than 5 µg/L, extends from alocation southeast of the STP to the LongIsland Expressway offsite, a distance of approxi-mately 5,300 feet. The plume is approximately1,100 feet wide. During 1999, the highestTVOC concentration was 22 µg/L, detected inWell 061-05 located at the site boundary nearNorth Street. The plume degrades to less than13 µg/L (TVOC) near the Long Island Express-way. Vertically, the VOCs are restricted to thedeep portions of the Upper Glacial aquifer.
Samples from key OU V wells were ana-lyzed for Target Analyte List (TAL) Metals, andsamples from offsite wells were analyzed forpesticides/PCBs. All of the inorganic contami-nants of concern initially identified during theOU V Remedial Investigation/Feasibility Study,including mercury and hexavalent chromium,were not detected during 1999. Although traceamounts of the pesticides 4,4’’-DDD and 4,4’’-DDT were detected in several offsite wellsduring 1998, all samples collected during 1999were non-detect for these compounds.
Time-vs.-VOC concentration trend plots forkey OU V wells are also provided on Figure 7-24. Monitoring Wells 049-06, 050-01, and 061-05 all showed decreasing trends in VOCconcentrations during 1999. Well 000-122(located near the leading edge of the plume)showed a very slight increase in VOC concen-trations. VOC concentrations in Well 049-06,located near the interpreted trailing edge ofthe plume during 1998, dropped to below the 5µg/L in 1999. The changes in plume distribu-tion from 1997 through 1999 are presented onFigure 7-25. The higher concentration middleportion of the plume (i.e., with TVOC concen-trations >20 µg/L) during 1998 has probablymigrated south of well 061-05 and is presentlysituated in between available monitoringpoints.
RadionuclidesDetectable levels of tritium were found in a
number of wells located near the BNL’s south-eastern site boundary and several offsite wells.However, the concentrations were well belowthe drinking water standard of 20,000 pCi/L.In wells located near the southeastern siteboundary, the maximum tritium concentrationwas detected in Well 50-02, at a concentrationof 2,175 pCi/L. In offsite wells monitored

7-361999 SITE ENVIRONMENTAL REPORT
CHAPTER 7: GROUNDWATER PROTECTION
Brookhaven Ave
Temple Place
Nor
th
Six
th
St
RA V
HO
13
24
28
263
8
0 100
0 100 200 300
Meters
Feet
108
LEGEND
Con
cent
ratio
n(in
PC
I/L)
Date (month/year)
Monitoring Well
Extent of SR-90 ContaminationGreater than 8 pCi/L
Stronium-90 (pCi/L)
8
SUMPOUTFALL
AREA
Bldg 650
Figure 7-23. OU IV AOC-6 Sr-90 Plume Map.N

7-37 1999 SITE ENVIRONMENTAL REPORT
CHAPTER 7: GROUNDWATER PROTECTION
East Fifth Ave
North St
BNL SITE B
OUNDARY
Long Island
Expressway
Peconic
R i ver
SewageTreatmentPlant
06
05
01
122
5
0 100 200 300
0 1000
Meters
Feet
108
LEGEND
CO
NC
EN
TR
ATIO
N(I
N µ
g/L)
DATE (MONTH/YEAR)
Monitoring Well
Extent of TVOC ContaminationGreater than 5 µg/L
TVOC
Trichloroethylene
Trichloroethane
South St
Figure 7-24. OU V TVOC Plume Map.N

7-381999 SITE ENVIRONMENTAL REPORT
CHAPTER 7: GROUNDWATER PROTECTION
Nor
th S
t
Wading River Rd
Long
Isla
nd E
xpre
ssw
ay
Nor
th S
t
Wading River Rd
Long
Isla
nd E
xpre
ssw
ay
Nor
th S
t
Wading River Rd
Long
Isla
nd E
xpre
ssw
ay
1997
TV
OC
PLU
ME
DIS
TR
IBU
TIO
N19
98 T
VO
C P
LUM
E D
IST
RIB
UT
ION
1999
TV
OC
PLU
ME
DIS
TR
IBU
TIO
N
LEG
EN
D5-
9 µ
g/L
TV
OC
10-1
9 µ
g/L
TV
OC
> 2
0 µ
g/L
TV
OC
Kilo
met
ers
01
010
0020
0030
00
Fee
t
Figu
re 7
-25.
OU
V T
VO
C P
lum
e C
ompa
riso
n –
1997
, 199
8 an
d 19
99.
N

7-39 1999 SITE ENVIRONMENTAL REPORT
CHAPTER 7: GROUNDWATER PROTECTION
during 1999, tritium was either non-detectableor just slightly above detection limits. (Note: thetypical detection limit for tritium is 400 pCi/L.)The maximum offsite tritium concentration was979 pCi/L, detected in Well 000-122 locatednear the Long Island Expressway. A detaileddiscussion on the distribution of tritium withinthe OU V plume is provided in the 1999Groundwater Monitoring Report (Dorsch et al.2000).
7.4.6 OPERABLE UNIT (OU) VI, BIOLOGY FIELDS
Ethylene dibromide (EDB) was used as afumigant in the BNL Biology Department’sagricultural fields located in the southeastportion of the site. Available records indicatethat the application of EDB in this area tookplace in the 1970s. As the result of thesehistorical releases of EDB, a contaminant plume(as defined by concentrations greater than the0.05 µg/L drinking water standard for EDB)extends approximately 3,500 feet, from nearBNL’s southeastern site boundary to an areasouth of the Long Island Expressway (see Figure7-26). EDB is the only contaminant of concernfor the Biology Fields plume. The width of theplume is approximately 1,100 feet. During 1999,the off site portion of the EDB plume wasfurther defined by using temporary verticalprofile wells and new permanent monitoringwells.
During 1999, the highest EDB concentra-tion was found in offsite Well 000-175 (locatedsouth of North Street) at 4.2 µg/L. Vertically,EDB is found in the deep Upper Glacial aquiferat the southern site boundary and in offsiteareas. EDB concentration trends for representa-tive wells are also shown on Figure 7-26. OffsiteWells 000-110, 000-175, and 000-209 all showedincreasing EDB concentration trends throughSeptember and a return to lower concentrationsby December. Figure 7-27 shows a comparisonof the EDB plume from 1997 through 1999. Theimportant changes in the plume are thedowngradient migration of both the trailingedge of the plume and the area of highest EDBconcentrations. The 1998 and 1999 plumeboundaries depicted on Figure 7-27 are basedon a significantly greater coverage of offsitewells that were installed in 1998 and 1999.
7.4.7 GROUNDWATER TREATMENT SYSTEMS
The primary mission of BNL’s ER Programis remediating soil and groundwater contamina-
tion, and preventing additional contaminationfrom migrating off the BNL site. To that end,six groundwater treatment systems are presentlyoperating at BNL, and a seventh system will beoperational in 2000. Figure 7-28 shows thelocations of these treatment systems. Thefollowing is a brief description of the groundwa-ter treatment systems that were operationalduring 1999 along with a summary of theirperformance. Table 7-2 provides a summary ofpounds of VOCs removed and gallons of watertreated since the first treatment system becameoperational in 1997.
OU III South Boundary Remediation SystemConstruction of the OU III pump-and-treat
system was completed in June 1997. The systemuses six wells to extract VOC-contaminatedgroundwater that originated from a number ofsources located in the developed central portionof the BNL site. The water is pumped approxi-mately one mile north to an air-stripping towerlocated near the Medical Department complex,where air from a powerful blower separates theVOCs from the water. The removal efficiency isclose to 100 percent. No VOCs were detectedabove the minimum detection limit (typically 0.5�g/L) in treated water samples. The clean wateris discharged to a nearby recharge basin, andthe VOCs stripped from the water are releasedinto the air at concentrations below state andfederal emissions standards. The system pro-cesses approximately 600 gallons of water perminute. During 1999, approximately 327pounds of VOCs were removed from thegroundwater, and 336,300,000 gallons of treatedgroundwater were returned to the aquifer.
OU III Offsite Groundwater Treatment SystemThe OU III Offsite groundwater
remediation system became operational in thesummer of 1999. The system was constructedsouth of the BNL site to remove VOC contami-nation that has migrated to an industrial arealocated between the Long Island Expresswayand the residential areas of North Shirley. Thisremediation system consists of a series ofinnovative “in-well stripping” wells that use thesame air stripping treatment concept as the OUIII South Boundary Remediation System, but alltreatment and recharge occurs within the well.Within each well, contaminated water ispumped from a deep well screen to a treatmentsystem located near the top of the well, whereVOCs are stripped from the water. The treated

7-401999 SITE ENVIRONMENTAL REPORT
CHAPTER 7: GROUNDWATER PROTECTION
Brookhaven Ave
East Fifth Ave
North St
North St
Moriches M iddle IslandRd
Stratler Dr
ong Island Expressway
Biology FieldsMeadow Marsh
14
110
209
175
0.05
0 100 200 300 400 500 600
0 1000 2000
Meters
Feet
L
South St
108
LEGEND
Con
cent
ratio
n(in
µg/
L)
Date (month/year)
Monitoring Well
Limits of EDB GroundwaterImpacts Defined as > 0.05 µg/L
EDB (µg/L)
0.05
Wee
ks A
ve.
Figure 7-26. OU VI Ethylene Dibromide Plume Map.
N

7-41 1999 SITE ENVIRONMENTAL REPORT
CHAPTER 7: GROUNDWATER PROTECTION
Brook
have
n
Ave
Nor
th
St
Weeks Ave
Long
Isla
ndEx
pres
sway
Brook
have
n
Ave
Nor
th
St
Weeks Ave
Long
Isla
ndEx
pres
sway
Brook
have
n
Ave
Nor
th
St
Weeks Ave
Long
Isla
ndEx
pres
sway
1997
ED
B P
LU
ME
DIS
TR
IBU
TIO
N19
98 E
DB
PL
UM
E D
IST
RIB
UT
ION
1999
ED
B P
LU
ME
DIS
TR
IBU
TIO
N
LEG
EN
D0.
05-0
.99
µg/L
ED
B
> 1
.00
µg/
L E
DB
Kilo
met
ers
01
010
0020
0030
00
Fee
t
Figu
re 7
-27.
OU
VI E
DB
Plu
me
Com
pari
son
– 19
97, 1
998,
and
199
9.N

7-421999 SITE ENVIRONMENTAL REPORT
CHAPTER 7: GROUNDWATER PROTECTION
Brookhaven Ave
East Fifth Ave
Long Island Expressway
31
32
4640
42
RA VTreatment System
Treatment SystemHFBR Tritium PlumeExtraction Wells
RA VExtraction Wells
OU IIISouth BoundaryExtraction Wells
OU IVAS/SVESystem
Industrial ParkTreatment System
Peconic River
0 100 200 300 400
0 1000
Meters
Feet
OU III
Extraction Well
Supply/Pumping Well
Recharge Basin
Water Table (ft AMSL)December, 1999
LEGEND
33
34
35
36
37
38
39
4142434445
Carbon TetrachlorideTreatment System
Figure 7-28. Locations of BNL Groundwater Remediation Systems.N

7-43 1999 SITE ENVIRONMENTAL REPORT
CHAPTER 7: GROUNDWATER PROTECTION
Table 7-2. BNL Groundwater Remediation Systems Treatment Summary for 1997 through 1999.
1997 1998 1999
Remediation System Water Treated VOCs Removed Water Treated VOCs Removed Water Treated VOCs Removed(gals.) (lbs.) (gals.) (lbs.) (gals.) (lbs.)
OU III South Boundary 166,000,000 340 335,000,000 405 336,300,400 354OU III Off-site (a) — (a) — 35,300,000 63Carbon Tetrachloride (a) — (a) — 6,900,000 112RA V 340,000,000 120 342,000,000 46 314,000,000 29HFBR Tritium Plume 63,000,000 16 63,000,000 20 64,000,000 68OU IV AS/SVE (b) 12 (b) 19 (b) 8
Total 569,000,000 488 740,000,000 490 756,500,000 634
Notes:(a) Treatment system not installed/operational during this time.(b) Air Sparging/Soil Vapor Extraction system performance measured by pounds of VOC removed per cubic foot of air treated.
water is then routed to a shallower screenedsection of the same well where it re-enters theaquifer. The VOC vapors are captured by agranular carbon filter. During 1999, approxi-mately 63 pounds of VOCs were removed from35,300,000 gallons of groundwater.
OU I (RA V) South Boundary Remediation SystemThis pump-and-treat system was completed
in December 1996. The system uses two extrac-tion wells to remove contaminated groundwaterthat originated from the Current Landfill (nowclosed and capped) and the former HWMF. Thewater is pumped approximately one mile northto an air stripper. This system processes morethan 700 gallons of water per minute. Like theOU III South Boundary Remediation System,the RA V system removes close to 100 percentof the chemical contamination. No VOCs weredetected above the MDL in treated watersamples. The clean water is discharged to anearby recharge basin, and the VOCs strippedfrom the water are released into the air atconcentrations below state and federal emis-sions standards. During 1999, approximately 29pounds of VOCs were removed from thegroundwater, and 314,000,000 gallons of treatedgroundwater were returned to the aquifer.
OU III Carbon Tetrachloride Treatment SystemA groundwater remediation system consist-
ing of two extraction wells screened in theshallow Upper Glacial Aquifer began operationson October 6, 1999 to address the carbontetrachloride released during the removal of anunderground storage tank in early 1998.Groundwater extracted from this area is treatedwith carbon filtration and recharged back intothe aquifer through an unlined drainage swale
to Recharge Basin HS located south ofPrinceton Avenue. Details on this groundwatertreatment system can be found in the OU IIICarbon Tetrachloride Pump and Treat System Start-Up Report (BNL 2000c). During 1999, approxi-mately 112 pounds of VOCs were removed, and6,900,000 gallons of treated water were re-charged to the Upper Glacial aquifer.
OU III HFBR Tritium Plume Remediation SystemThis groundwater pump and recharge
system was constructed as an interim remedialaction after the HFBR tritium plume wasdiscovered, and has operated since May 1997.Three groundwater extraction wells wereinstalled approximately 3,500 feet south of theHFBR. Groundwater is pumped from theaquifer at a rate of about 50 gallons per minuteand piped north to a treatment facility adjacentto the RA V treatment system. Because thewater also contains VOCs that originate fromanother sources (possibly the former Building96 area), the water is treated by passing itthrough a granular carbon filter to remove theVOCs before discharging the water to the RA Vrecharge basin. No VOCs were detected abovethe minimum detection limit in treated watersamples; and tritium was not detected insamples collected at the influent to the treat-ment system (i.e., concentrations <500 pCi/L).This interim remediation system is designed toprevent the further southward migration of theHFBR tritium plume while long-termremediation options are evaluated and imple-mented. During 1999, the granular activatedcarbon filters removed approximately 68pounds of VOCs, and 64,000,000 gallons oftreated water were recharged to the aquifersystem.

7-441999 SITE ENVIRONMENTAL REPORT
CHAPTER 7: GROUNDWATER PROTECTION
OU IV Air Sparging/Soil Vapor Extraction SystemThis remediation system, which has oper-
ated since November 1997, combines twotechnologies to remove VOC and semi-VOCcontaminants from soil and groundwaterlocated near the BNL Central Steam Facility.The system uses air sparging and soil vaporextraction that forces pressurized air into thegroundwater to “bubble” or strip the volatilecompounds out of the water and soil and into avapor phase. Powerful vacuum pumps thenrecover the resulting vapors and pipe them to anearby treatment facility where the VOC vaporsare removed by a granular carbon filter systembefore the air is released into the atmosphere.During 1999, approximately eight pounds ofcontaminants were removed from the soil andgroundwater.
7.5 ENVIRONMENTAL SURVEILLANCE (ES) PROGRAM(NON-CERCLA)
BNL’s Environmental Surveillance (ES)Program includes groundwater monitoring atactive research facilities (i.e., research reactorareas, accelerator beam stop and target areas,greenhouse areas) and support facilities (i.e.,fuel storage facilities and water treatmentfacilities). In September 1998, BNL finalized aGroundwater Monitoring Improvements Plan(Paquette 1998) that identified active researchand support facilities requiring improvedgroundwater monitoring programs. As a resultof this evaluation, 84 new, permanent ground-water monitoring wells were installed on aprioritized basis during 1999 and early 2000.During 1999, 93 groundwater surveillance wellswere monitored during 318 individual samplingevents. All wells sampled during 1999 are listedin Appendix E. Results for these programs aresummarized below. For detailed descriptionsand maps related to the ES monitoring pro-grams, refer to the 1999 BNL GroundwaterMonitoring Report (Dorsch et al. 2000).
7.5.1 RESEARCH FACILITIES
7.5.1.1 ALTERNATING GRADIENT SYNCHROTRON (AGS)COMPLEX
Activated soils have been created near anumber of AGS experimental areas as the resultof secondary particles (primarily neutrons)produced at beam targets and beam stops.Radionuclides, such as tritium and sodium-22,have been produced by the interaction of these
secondary particles with the soils that surroundthese experimental areas. Furthermore, histori-cal surface spills and discharges of solvents tocesspools and recharge basins near the AGShave contaminated soils and groundwater withVOCs. VOC contamination is monitored underthe ER program’s OU III Central Areas Project(see section 7.4.3).
During 1999, 32 groundwater monitoringwells were used to evaluate groundwater qualitynear potential soil activation areas locatedwithin the AGS Complex (e.g., Building 912,AGS Booster Beam Stop, 914 Transfer Tunnel,g-2 experimental area, E-20 Catcher, former U-Line Target, and the new J-10 Beam Stop).Twenty-four of these wells were installed as partof the Groundwater Monitoring Improvementsproject. The enhanced groundwater monitoringprogram detected two tritium plumes thatoriginated from the g-2 experimental area andthe former E-20 Catcher region of the AGSRing.
New monitoring wells installed approxi-mately 250 feet downgradient of the g-2 experi-mental area detected the presence of a tritiumand sodium-22 plume originating from activatedsoil shielding. A sample from the new g-2 areaWell 054-067 collected in October 1999 had atritium concentration of 41,700 pCi/L (approxi-mately twice the drinking water standard of20,000 pCi/L). Sodium-22 was not detected inthe sample. In November 1999, BNL installed18 temporary wells to determine the extent ofthe contamination and verify the location of thesource (Figure 7-29). A sample from temporaryWell 054-116, located approximately 70 feetdowngradient of an area where the soil-shieldwas activated, had a tritium concentration of1,800,000 pCi/L. Tritium concentrations intemporary Well 054-111 located approximately120 feet downgradient of the soil activationarea, were approximately 1,500,000 pCi/L.Results from samples collected from temporarywells installed near permanent Well 054-67showed tritium concentrations up to 33,000pCi/L. Tritium was not detected in threetemporary wells installed directly upgradient ofthe g-2 soil-shield activation area. The highestlevel of sodium-22 was detected in Well 054-116,at a concentration of 60 pCi/L (or 15% of the400 pCi/L drinking water standard). In Decem-ber 1999, an impermeable cap was installed overthe g-2 soil activation area to prevent rainwaterinfiltration and the continued leaching the

7-45 1999 SITE ENVIRONMENTAL REPORT
CHAPTER 7: GROUNDWATER PROTECTION
921
913B
940 91
2
J-10
Sto
p
010
2030
010
0
Met
ers
Fee
t
45
45
Gen
eral
dire
ctio
n of
Gro
undw
ater
Flo
w
Act
ivat
ed Soi
lA
rea
g-2
Bea
m S
top
1.79
m p
Ci/L
27,1
00 p
Ci/L
6690
pC
i/L
054-
125
054-
126
1.49
m p
Ci/L
054-
124
912A
LEG
EN
D
Geo
prob
e W
ell L
ocat
ions
Mon
itorin
g W
ell L
ocat
ions
Gro
undw
ater
Ele
vatio
n(f
t AM
SL,
Sep
t. 19
99)
AG
S B
eam
Lin
eP
ropo
sed
Mon
itorin
g W
ells
> 2
0,00
0 pC
i/L T
ritiu
m (
>N
YS
DW
S)
> 1
,000
,000
pC
i/L T
ritiu
m
Figu
re 7
-29.
g-2
Tri
tium
Plu
me.
N

7-461999 SITE ENVIRONMENTAL REPORT
CHAPTER 7: GROUNDWATER PROTECTION
radionuclides out of the soils and into ground-water.
A new well (064-65) installed approximately100 feet downgradient of the former E-20Catcher area of the AGS detected a narrowplume of tritium and sodium-22 originatingfrom activated soil used as shielding near theformer beam catcher. During 1999, tritium andsodium-22 were detected in Well 064-56 atmaximum concentrations of 5,800 pCi/L and219 pCi/L, respectively. To further evaluate theextent of contamination, four Geoprobe wellswere installed in January 2000. The highestlevels of tritium and sodium-22 were found inGeoprobe Well 064-065 with concentrations of40,400 pCi/L and 704 pCi/L, respectively. Thiswell was installed approximately 12 feet south-west of permanent Well 064-56. These dataindicate that at a distance of approximately 100feet downgradient of the E-20 Catcher, the zoneof elevated tritium and sodium-22 is estimatedto be approximately 20 to 30 feet wide andsituated within 10 feet of the water table (ap-proximately 30 to 40 feet below land surface).During CY 2000, BNL will install an imperme-able cap over the E-20 Catcher soil activationarea to prevent rainwater infiltration and thecontinued leaching the radionuclides out of thesoils and into groundwater.
Low levels of tritium and sodium-22 werealso detected in new shallow wells installeddowngradient of Building 912 (the AGS’s mainexperimental hall) and the former U-LineTarget area. In wells located downgradient ofBuilding 912, tritium concentrations ranged fromnon-detectable to 2,120 pCi/L and sodium-22concentrations ranged from non-detectable to32.6 pCi/L. In Well 054-69, located approxi-mately 500 feet downgradient of the former U-Line Target area, tritium and sodium-22 weredetected at maximum concentrations of 1,130pCi/L and 38.3 pCi/L, respectively.
7.5.1.2 BROOKHAVEN LINAC ISOTOPE PRODUCER (BLIP)
The BLIP facility is located at the southernend of the Linear Accelerator (LINAC). Whenthe BLIP is operating, the LINAC delivers abeam of protons that impinges on a series ofeight targets located within the BLIP targetvessel. During irradiation, activation of the soilsimmediately outside of the vessel occurs due tothe creation of secondary particles produced atthe target. In February 1998, elevated levels oftritium and sodium-22 were detected in wells
located downgradient of BLIP. Maximumtritium and sodium-22 concentrations (52,000pCi/L and 151 pCi/L, respectively) weredetected in temporary wells installed approxi-mately 20 feet downgradient of BLIP. Toprevent rainwater from infiltrating the activatedsoils below the building, the BLIP building’sroof drains were redirected away from thebuilding, paved areas were resealed, and anextensive gunnite (cement) cap was installed onthree sides of the building.
Results from six new groundwater monitor-ing wells installed in 1999 indicate that thecorrective actions noted above have been highlyeffective in preventing rainwater infiltrationthrough the contaminated soils. Maximumtritium and sodium-22 concentrations in newpermanent wells located 20 feet downgradientof the BLIP facility were only 2,450 pCi/L and14 pCi/L, respectively. Remnants of the higherconcentration plume initially observed in 1998were detected in Well 064-50, which is locatedapproximately 100 feet downgradient of BLIP. Asample collected from Well 064-50 in March1999 had tritium and sodium-22 concentrationsof 18,700 pCi/L and 72 pCi/L, respectively.However, subsequent samples from Well 064-50had tritium and sodium-22 concentrations ofless than 1,000 pCi/L and 40 pCi/L, respec-tively. These results indicate that the correctiveactions taken in 1998 (e.g., connecting roofdrains, sealing paved areas, and construction ofa cement cap) have been effective in preventingrainwater from infiltrating the activated soils,and washing out the tritium and sodium-22from the soils and into the groundwater.
7.5.1.3 RELATIVISTIC HEAVY ION COLLIDER (RHIC)
Within the RHIC facility, there are twoareas where radionuclides may be produced inthe soils outside of the collider tunnel. The firstarea contains two beam stops that are located atthe 10 o’clock position of the ring, and thesecond contains two collimators that are locatedat the 8 o’clock region. When RHIC becomesoperational, secondary particles created at theinternal beam stop and collimator areas willhave the potential to activate the soils immedi-ately surrounding those areas.
Metals and Water Quality ParametersDuring 1999, quarterly groundwater
samples were collected from twelve new RHICmonitoring wells to evaluate pre-operationalmetals and water quality parameter concentra-

7-47 1999 SITE ENVIRONMENTAL REPORT
CHAPTER 7: GROUNDWATER PROTECTION
tions. Metals analyses of the groundwatersamples indicate the presence of naturallyoccurring aluminum, iron and manganese atconcentrations that exceed New York Stateambient water quality standards. Most of theseelevated concentrations were observed insamples collected from RHIC beam stop areawells (Wells 025-03, 025-05, 025-06, and 025-08).These metals originate from naturally occurringclay minerals that are prevalent in the near-surface soils located near the Peconic River.Analysis of samples for water quality parameters(e.g., chlorides, sulfates and nitrates) indicatethat all concentrations are below ambient waterquality standards.
RadionuclidesDuring 1999, groundwater samples were
collected to evaluate pre-operational radionuclideconcentrations. Analytical results indicate that allradionuclide concentrations are below applicabledrinking water standards and are consistent withbackground levels. Slightly elevated gross betaconcentrations (up to 26.5 pCi/L) were detectedin samples from Well 025-05, which is locateddowngradient of RHIC’s southern beam stop.The elevated gross beta values are probably dueto potassium-40, which was also detected atconcentrations up to 26.7 pCi/L. The potassium-40 found in the water samples is likely to haveoriginated from naturally occurring clay mineralsthat are prevalent in the near-surface soilsadjacent to the Peconic River.
7.5.1.4 BROOKHAVEN MEDICAL RESEARCH REACTOR(BMRR)
During a 1997 investigation to evaluategroundwater quality near the BMRR, a tritiumplume with a maximum concentration ofapproximately one-half the 20,000-pCi/Ldrinking water standard was identified. Themaximum tritium concentration during 1997was 11,800 pCi/L in wells installed directlydowngradient (within 30 feet) of the facility.The tritium is believed to have originated fromthe historical discharge of small amounts ofBMRR primary cooling water to a basementfloor drain and sump system that may haveleaked. Although the last discharge of primarycooling water to the floor drain system oc-curred in 1987, the floor drains continued to beused for secondary (non-radioactive) coolingwater until 1997. The infiltration of this watermay have promoted the movement of residual
tritium from the soils surrounding the floordrain piping system to the groundwater. Thefloor drains were permanently sealed in 1998 toprevent any accidental future releases to theunderlying soils.
During 1999, groundwater samples werecollected from one upgradient and threedowngradient wells on a quarterly basis. As inprevious years, tritium concentrations contin-ued to be below the drinking water standard of20,000 pCi/L. Detectable levels of tritium wereobserved in all three downgradient wells, withthe maximum value of 17,100 pCi/L in Well084-27. A slightly elevated gross beta concentra-tion of 26.3 pCi/L was detected in the Decem-ber 1999 sample from downgradient Well 084-27. The elevated gross beta values are probablydue to potassium-40, which was also detected ata concentration of 25.4 pCi/L. The potassium-40 that was detected in the water sample islikely to have originated from naturally occur-ring clay minerals.
7.5.2 SUPPORT FACILITIES
7.5.2.1 SEWAGE TREATMENT PLANT (STP) AREA
As described in Chapters 1 and 3, the STPprocesses sanitary sewage for BNL facilities.Approximately 15 percent of the water releasedto the STP’s filter beds is lost either to evapora-tion or to direct groundwater recharge; theremaining water is discharged to the PeconicRiver. Past radiological and chemical releases tothe sanitary system contaminated soils, sedi-ments, and groundwater in the STP andPeconic River areas. During 1999, the STPgroundwater monitoring program used 12shallow Upper Glacial aquifer wells to evaluategroundwater quality near the plant’s filter bedsand along the Peconic River from the STPdischarge point to the site boundary.
Volatile Organic Compounds, Metals and WaterQuality Parameters
As noted earlier, groundwater qualityimpacts resulting from historical STP dischargesare currently being monitored as part of theOU V monitoring program using wells that arelocated at the site boundary and offsite areas(see Section 7.4.5). The STP facility monitoringprogram on the other hand, is designed toevaluate whether current operations are impact-ing groundwater quality. The 12 wells usedunder this program are situated close to the

7-481999 SITE ENVIRONMENTAL REPORT
CHAPTER 7: GROUNDWATER PROTECTION
STP’s sand filter beds and along the PeconicRiver. During 1999, groundwater samples wereanalyzed for water quality, VOCs, and metals. Inall groundwater samples, water quality param-eters (i.e., chlorides, sulfates and nitrate) werewithin the applicable New York State ambientwater quality standards. Iron levels exceededambient water quality standard of 0.3 mg/L inthree wells (038-01, 038-03, and 039-06), withmaximum concentrations ranging from 0.32mg/L to 1.8 mg/L. Three wells (039-06, 039-07,and 039-08) had sodium concentrations abovethe NYS AWQS of 20 mg/L, with maximumconcentrations ranging from 20.1 mg/L to 33.1mg/L. A sample from one well (038-03) had azinc value of 0.54 mg/L, which exceeded theambient water quality standard of 0.3 mg/L.Whereas the elevated iron and zinc concentra-tions may be due to naturally occurring sedi-ments surrounding the wells, the sodium levelsare likely due to road salting operations. NoVOCs were detected above NYS AWQS in anyof the STP area wells.
RadionuclidesFor groundwater in the area surrounding
the STP, gross alpha and gross beta activityvalues were below drinking water standards, andwere typical of background values. However,gross beta activities were slightly elevated inWell 038-03 (located near the filter beds) with amaximum recorded value of 41.7 pCi/L.Because these wells are screened near shallowclay deposits, the slightly elevated gross betavalues are likely due to naturally occurringpotassium-40 from clay minerals introduced intothe samples during collection. Monitoringresults indicated a tritium concentration of 356pCi/L in one sampled from filter bed area Well039-08. However, this value is extremely close tothe minimum detection limit (for that analysis)of 327 pCi/L. When the 95 percent confidenceintervals are considered, these two values arenot statistically different from the MDL and donot, therefore, represent a clear detection oftritium. No other man-made radionuclides weredetected in groundwater in this area.
7.5.2.2 WATER TREATMENT PLANT (WTP)
At the direction of the NYSDEC, fiveshallow Upper Glacial aquifer surveillance wellswere installed at the WTP in 1993 to assesspotential leaching of iron from the plant’srecharge basins into the groundwater. Naturally
high levels of iron in the groundwater pumpedfor potable and process supply are removed atthe WTP, and the precipitated iron is dis-charged to the recharge basins.
Metals and Water Quality ParametersDuring 1999, one set of groundwater
samples was collected from the five WTP areawells, and analyzed for water quality and metals.As in previous years, all water quality param-eters (i.e., chlorides, sulfates, and nitrate) andmost metals concentrations, including iron,were below the applicable NYS AWQS. Sodiumwas detected at a concentration of 26.9 mg/L inthe sample collected from Well 063-01 (the NYSAWQS for sodium is 20 mg/L).
7.5.2.3 BUILDING 423 (MOTOR POOL)
Building 423 serves as the site motor pool,where BNL’s fleet vehicles are repaired andrefueled. Gasoline is stored in two, 8,000-galloncapacity underground storage tanks, and wasteoil is stored in one, 500-gallon capacity under-ground storage tank. Although the under-ground storage tanks and associated distribu-tion lines meet Suffolk County Article 12requirements for secondary containment, leakdetection, and high level alarms, BNL initiated agroundwater monitoring program in 1996 toensure that potential leakage would be detectedif a tank alarm system failed. Following thediscovery of a hydraulic oil spill in Building 423and a historical oil spill immediately south ofthe nearby Site Maintenance Facility Building326, BNL entered into a spill response (stipula-tion) agreement with NYSDEC. As part of thisagreement, BNL installed six new groundwatersurveillance wells in early 1999.
During 1999, groundwater samples wereanalyzed for VOCs and semi-VOCs on a quar-terly basis, and the wells were checked monthlyfor floating petroleum product. None of thetarget compounds associated with gasoline oroil spills were detected in the samples, and nofloating product was observed. However, thesolvent TCA was detected at concentrationsabove New York State ambient water qualitystandard of 5 �g/L in all four wells locateddowngradient of Building 326 (see Figure 7-30).The maximum TCA concentration was detectedin Well 102-10 at 50 �g/L. TCA was not de-tected in the upgradient well. The presence ofTCA in these samples is the result of historicalsolvent spillage in the Motor Pool and Site

7-49 1999 SITE ENVIRONMENTAL REPORT
CHAPTER 7: GROUNDWATER PROTECTION
102
412
326
326321
649
406339
Oil Spill
42
0506
LEGEND
Monitoring well
Buildings, Facilities
Sept. 1999 GroundwaterElevation (ft AMSL)
0 10 20
0 10 20 30 40 50 60
Meters
Feet
HydraulicOil Leak
Pump Island
102-08 TCA ND DCA ND 102-09
TCA NDDCA ND
102-11TCA 6 ug/L DCA ND
102-13TCA 25 ug/L DCA ND
102-10TCA 50 ug/LDCA 2 ug/L
102-12TCA 30 ug/LDCA 3 ug/L
Gasoline USTs
Figure 7-30. Motor Pool Area VOC Distribution Map.N
7-501999 SITE ENVIRONMENTAL REPORT
CHAPTER 7: GROUNDWATER PROTECTION
Maintenance area, and is not associated withcurrent operations.
7.5.2.4 ONSITE SERVICE STATION
Building 630 is a commercial automobilerepair and gasoline station for the BNL site.Gasoline is stored in two, 8,000-gallon capacityand one 6,000-gallon capacity undergroundstorage tanks, and waste oil is stored in one 500-gallon capacity underground storage tank.Although the storage tanks and associateddistribution lines meet Suffolk County Article12 requirements for secondary containment,leak detection, and high level alarms, BNLinitiated a groundwater monitoring program in1996 to ensure that potential leakage would bedetected if a tank alarm system failed.
During 1999, groundwater samples werecollected from the two shallow Upper Glacialaquifer surveillance wells (085-16 and 085-17)and analyzed for VOCs. The wells were alsochecked for floating petroleum product. Carbontetrachloride was detected at concentrationsexceeding NYS AWQS in both wells, with amaximum concentration of 503 µg/L detectedin Well 085-17. PCE was also detected in Well085-17, at a maximum concentration of 5.1µg/L. The fuel additive MTBE was not detectedin either of the wells, and no floating productwas observed. Whereas the PCE is likely associ-ated with historical degreasing operations at theservice station, the substantial increase incarbon tetrachloride concentrations comparedto previous years (with levels <10 µg/L), is dueto the advancement of a carbon tetrachlorideplume originating from an underground storagetank that was located approximately 280 feetupgradient of Well 085-17 (see section 7.4.3).
7.5.2.5 MAJOR PETROLEUM FACILITY (MPF)
The Central Steam Facility supplies steamfor heating to all major facilities of the Labora-tory through an underground distributionsystem. The MPF is the holding area for mostfuels used at the Central Steam Facility. Fiveshallow Upper Glacial aquifer wells monitoringthe MPF were installed as part of the licensingrequirements for this facility, and are screenedacross the water table so that free product (i.e.,oil floating on top of the groundwater) could bedetected. The surveillance wells at the CSF wereinstalled primarily to monitor groundwater
contamination resulting from a 1977 leak ofapproximately 23,000 gallons of AlternativeLiquid Fuel (a fuel oil/spent solvent mixture).The CSF/MPF area has been the subject of anRemedial Investigation/Feasibility Study, andhas been undergoing active soil and groundwa-ter remediation since the winter of 1997 (seeSection 7.4.4.1).
In accordance with the NYSDEC operatinglicense, the five MPF wells were sampledmonthly in 1999 for floating petroleum prod-ucts, and semiannually for polynuclear aromat-ics and base-neutral extractable compounds(EPA Method 625). As in previous years, no fueloil-related compounds were detected, and nofloating petroleum products were observed.
7.5.2.6 NEW WASTE MANAGEMENT FACILITY (WMF)
In 1997, BNL began operating a new WMF.The new WMF is designed and operated in amanner that meets all applicable federal, stateand local environmental protection require-ments. Nevertheless, BNL established a ground-water monitoring program as a secondarymeans of verifying the effectiveness of thefacility’s administrative and engineered controls.The new WMF is monitored by eight shallowUpper Glacial aquifer wells. During 1999,groundwater samples were collected quarterlyand analyzed for VOCs, radioactivity, metals,and water quality.
Volatile Organic Compounds, Metals and WaterQuality Parameters
In 1999, all water quality and most metalsconcentrations were below the applicable NYSAWQS. Sodium was detected at concentrationsabove the NYS AWQS of 20 mg/L inupgradient Wells 055-10 and 066-07 (26.9 mg/Land 21.6 mg/L, respectively). Silver was de-tected above the NYS AWQS of 0.01 mg/L inone sample from downgradient Well 056-23,with a concentration of 0.1 mg/L. Although lowlevels of chloroform and TCA (up to 2.3 µg/Land 3.8 µg/L, respectively) were detected in anumber of the WMF wells, all VOC concentra-tions were below applicable NYS AWQS. It isbelieved that the trace amounts of TCA are dueto historical releases in upgradient areas,whereas the chloroform is likely to be related tothe use of water treatment chemicals in thepotable and process water that is routinelydischarged to nearby Recharge Basin HO.
7-51 1999 SITE ENVIRONMENTAL REPORT
CHAPTER 7: GROUNDWATER PROTECTION
RadionuclidesWith one exception, in 1999 gross activity
levels in these samples were typical of ambient(background) levels. Slightly elevated gross betaconcentrations were observed in upgradientWell 066-07 and downgradient Well 056-21, atmaximum concentrations of 21.3 pCi/L and19.2 pCi/L, respectively. Low levels of cobalt-60were detected in samples collected from Well066-07, with a maximum concentration of 8.8pCi/L (the drinking water standard for cobalt-60 is 200 pCi/L). The source of the cobalt-60 isan underground storage tank leak that occurredat Building 830 in 1988. Monitoring resultsindicated a tritium concentration of 334 pCi/Lin one sampled from upgradient Well 066-07.However, this value is extremely close to theminimum detection limit of 306 pCi/L. Whenthe 95 percent confidence intervals are consid-ered, this value is not statistically different fromthe minimum detection limit and does not,therefore, represent a clear detection of tritium.
REFERENCES
BNL. 1999a. Monitored Natural Attenuation (MNA) Work Plan forthe HFBR Tritium Plume. Brookhaven National Laboratory,Upton, New York. March 1999
BNL. 1999b. Summary Report for the Carbon TetrachlorideInvestigation. Brookhaven National Laboratory, Upton,New York.
BNL. 1999c. Final Draft RA V Groundwater Treatment AnnualOperations Report 1998. Brookhaven National Laboratory,Upton, New York.
BNL. 2000a. 1999 Environmental Monitoring Report, Current andFormer Landfill Areas. Brookhaven National Laboratory, Upton,New York.
BNL. 2000b. RA V Groundwater Treatment Annual OperationsReport, 1999. Brookhaven National Laboratory, Upton, NewYork.
BNL. 2000c. CY 1999 OU III Pump and Treat System Annual Report.Brookhaven National Laboratory, Upton, New York. May 2000.
BNL. 2000d. OU III Offsite Removal Action System Start-Up Report.Brookhaven National Laboratory, Upton, New York. April2000.
BNL. 2000e. Tritium Pump and Recharge System Annual EvaluationReport. Brookhaven National Laboratory, Upton, New York.May 2000.
DOE Order 5400.1. 1988. General Environmental ProtectionProgram. U.S. Department of Energy, Washington, D.C. Change1: June 29, 1990.
Dorsch, W., K. Klaus, D. Paquette, and A. Zalak. 2000. 1999BNL Groundwater Monitoring Report. Brookhaven NationalLaboratory, Upton, New York. June 2000.
Paquette, D.E. 1998. Groundwater Monitoring Improvements Planfor FY 1998 and 1999. Brookhaven National Laboratory, Upton,New York.
Paquette, D.E., T.G. Naymik, and E.A. Flores. 1998. GroundwaterProtection Management Program Description. BNL-52555.Brookhaven National Laboratory, Upton, New York.

7-521999 SITE ENVIRONMENTAL REPORT
CHAPTER 7: GROUNDWATER PROTECTION