groundwater in namibia
TRANSCRIPT

Groundwater in Namibiaan explanation to the Hydrogeological Map
Gro
undw
ater
in
Nam
ibia
· a
n ex
plan
atio
n to
the
Hyd
roge
olog
ical
Map

Groundwater in Namibiaan explanation to the Hydrogeological Map
Greg Christelis and Wilhelm Struckmeier (editors)
and Roland Bäumle, Arnold Bittner, Frank Bockmühl, Pierre Botha, Katharina Dierkes,
Piet Heyns, Jürgen Kirchner, Roy McG Miller, Sandra Müller, Sindila Mwiya, Louis du Pisani, Dieter Plöthner, Kevin Roberts, Gabi Schneider, Martin Schneider, Alan Simmonds,
Hartmut Strub, Abram van Wyk
under the supervision of the Steering Committee of the Hydrogeological Map of Namibia Project
(Piet Heyns, Marina Coetzee, Karl-Heinz Hoffmann, John Mendelsohn, Gabi Schneider, Wynand Seimons)
reviewed by Shirley Bethune
This publication complements the Hydrogeological Map of Namibia at scale 1:1000000 prepared as a Namibian – German technical cooperation project
of the Department of Water Affairs, Ministry of Agriculture, Water and Rural Development; the Geological Survey of Namibia, Ministry of Mines and Energy;
the Namibia Water Corporation and the Federal Institute for Geoscience and Natural Resources
on behalf of the German Ministry of Economic Cooperation and Development.
First edition December 2001 unrevised second edition January 2011
Claudia du Plessis

2
Namibia Water CorporationPrivate Bag 13389
Windhoek Namibia
Ministry of Agriculture, Waterand Rural Development
Department of Water AffairsDivision GeohydrologyPrivate Bag 13193Windhoek · Namibia
Federal Institute for Geosciences and Natural ResourcesPostfach 510153
D-30631 Hannover · Germany
Geological Survey of NamibiaP.O. Box 2168WindhoekNamibia
3
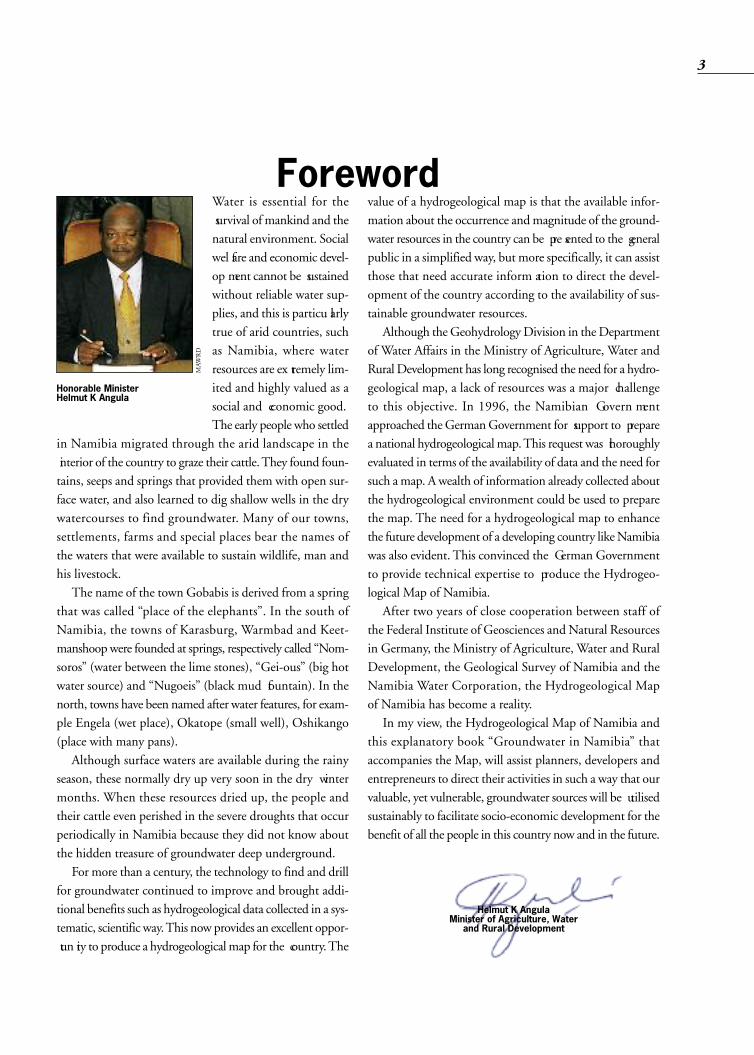
Water is essential for the survival of mankind and thenatural environment. Socialwel fare and economic devel -op ment cannot be sustainedwithout reliable water sup-plies, and this is particu larlytrue of arid countries, suchas Namibia, where waterresources are ex tremely lim-ited and highly valued as asocial and economic good.The early people who settled
in Namibia migrated through the arid landscape in the interior of the country to graze their cattle. They found foun-tains, seeps and springs that provided them with open sur-face water, and also learned to dig shallow wells in the drywatercourses to find groundwater. Many of our towns,settlements, farms and special places bear the names ofthe waters that were available to sustain wildlife, man andhis livestock. The name of the town Gobabis is derived from a spring
that was called “place of the elephants”. In the south ofNamibia, the towns of Karasburg, Warmbad and Keet-manshoop were founded at springs, respectively called “Nom-soros” (water between the lime stones), “Gei-ous” (big hotwater source) and “Nugoeis” (black mud fountain). In thenorth, towns have been named after water features, for exam-ple Engela (wet place), Okatope (small well), Oshikango(place with many pans).Although surface waters are available during the rainy
season, these normally dry up very soon in the dry wintermonths. When these resources dried up, the people andtheir cattle even perished in the severe droughts that occurperiodically in Namibia because they did not know aboutthe hidden treasure of groundwater deep underground.For more than a century, the technology to find and drill
for groundwater continued to improve and brought addi-tional benefits such as hydrogeological data collected in a sys -tematic, scientific way. This now provides an excellent oppor - tun ity to produce a hydrogeological map for the country.The
Foreword
Honorable MinisterHelmut K Angula
MAW
RD
value of a hydrogeological map is that the available infor-mation about the occurrence and magnitude of the ground-water resources in the country can be pre sented to the generalpublic in a simplified way, but more specifically, it can assistthose that need accurate inform ation to direct the devel-opment of the country according to the availability of sus-tainable groundwater resources. Although the Geohydrology Division in the Department
of Water Affairs in the Ministry of Agriculture, Water andRural Development has long recognised the need for a hydro-geological map, a lack of resources was a major challengeto this objective. In 1996, the Namibian Govern mentapproached the German Government for support to preparea national hydrogeological map. This request was thoroughlyevaluated in terms of the availability of data and the need forsuch a map. A wealth of information already collected aboutthe hydrogeological environment could be used to preparethe map. The need for a hydrogeological map to enhancethe future development of a developing country like Namibiawas also evident. This convinced the German Governmentto provide technical expertise to produce the Hydrogeo-logical Map of Namibia.After two years of close cooperation between staff of
the Federal Institute of Geosciences and Natural Resourcesin Germany, the Ministry of Agriculture, Water and RuralDevelopment, the Geological Survey of Namibia and theNamibia Water Corporation, the Hydrogeological Mapof Namibia has become a reality. In my view, the Hydrogeological Map of Namibia and
this explanatory book “Groundwater in Namibia” thataccompanies the Map, will assist planners, developers andentrepreneurs to direct their activities in such a way that ourvaluable, yet vulnerable, groundwater sources will be utilisedsustainably to facilitate socio-economic development for thebenefit of all the people in this country now and in the future.
Helmut K AngulaMinister of Agri culture, Water and Rural Develop ment
4
AcknowledgementsThe publication of this book would not have been possible without the enthusiastic assistance and cooperation ofnumerous people. We would like to thank the following – should anyone have been omitted inadvertently we apologise for the oversight.
The following authors helped compile the book with their contributions:HK Angula, MAWRD; R Bäumle, A Bittner, F Bockmühl, P Botha, K Dierkes, P Heyns, J Kirchner, R McG Miller, SMüller, S Mwiya, AL du Pisani, D Plöthner, K Roberts, GIC Schneider, MB Schneider, A Simmonds, H Strub, A van Wyk.
The work was carried out under the leadership of the HYMNAM Steering Committee. We gratefully acknowledge theadvice of its members: P Heyns (Chairman), DWA; M Coetzee, MAWRD; KH Hoffmann, GSN; J Mendelsohn,Directorate of Environmental Affairs; GIC Schneider, GSN; W Seimons, NamWater.Useful suggestions have been received from a large number of colleagues and friends, e.g. S Baumgartner, Namcor; I Demasius, Namibia Scientific Society; F-R Haut, BGR; J Kirchner, Hydrogeological Association of Namibia/HAN;P Klintenberg, Desert Research Foundation of Namibia/DRFN; U Knorr, BGR; C Roberts and T Robertson, Atlas of Namibia Project; M Schmidt-Thomé, BGR; U Schreiber, GSN; T Schubert, BGR; M Seely, DRFN; R Wackerle, GSN.
The editors are thankful to the following for the following services and contributions:Proof-reading: S Bethune and E ChivellFigures and drawings: I Bardenhagen, R Bäumle, A Calitz, M Coetzee, U Gersdorf, R McG Miller, S Müller, A Nguno, U Schneider, G Schmidt, A Simmonds, H Strub, M Strub, S Tompson, C Wessels, A Wolff, A van Wyk.
Photographs: S Bethune, A Bittner, F Bockmühl, C&W du Plessis, C Loftie-Eaton, J Kirchner, G Madec, S Mwiya, DPlöthner, K Roberts, GIC Schneider, W Struckmeier.
Copyrights© 2001, 2011 Text, tables and graphs: Department of Water Affairs, Division Geohydrology © 2001, 2011 Photography as credited
All rights reserved. No part of this publication may be reproduced, stored in any retrieval system or transmitted inany form or by any means, electronic, mechanical, photocopying, recording or otherwise, without the written per -mission of the copyright owner(s).
First edition December 2001, unrevised second edition January 2011Layout & production: DesignBüro Claudia Habenicht, Somerset West, RSAPrinting: Formset (PTY) Ltd, PO Box 225, Eppingdust, 7475 Cape Town, RSAISBN No. 0-86976-571-X
Inside and outside cover photography:Claudia & Wynand du Plessis, Wildlife Photographers, PO Box 1339, Swakopmund, E-mail: [email protected] . www.claudiawynandduplessis.com
75
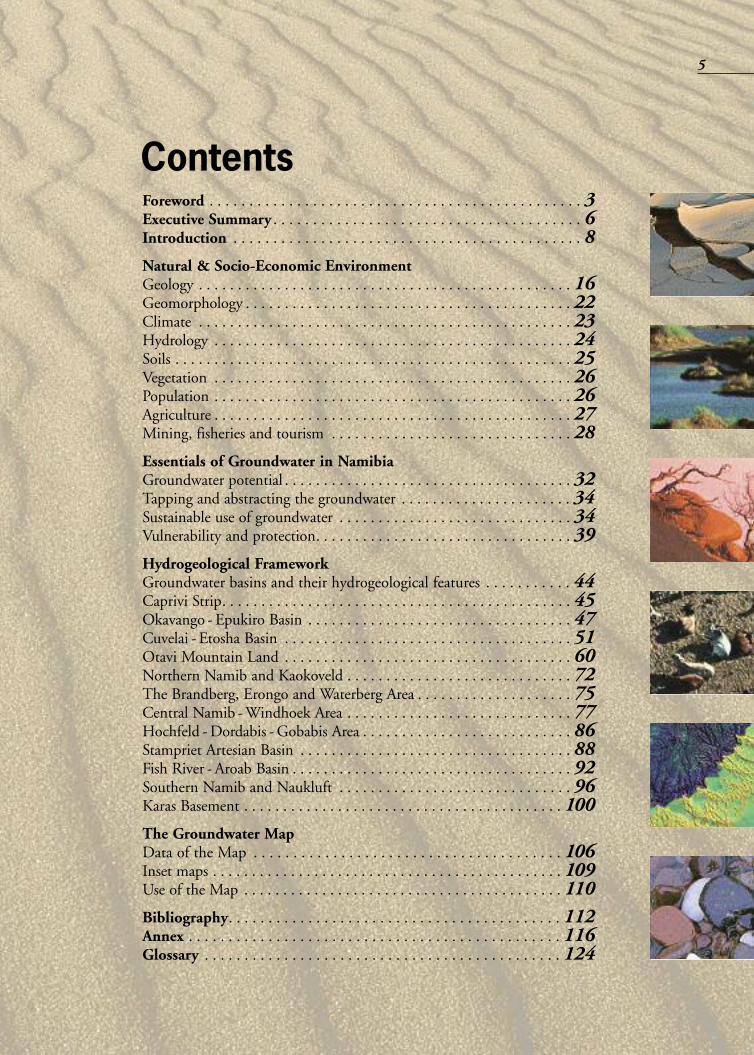
Foreword . . . . . . . . . . . . . . . . . . . . . . . . . . . . . . . . . . . . . . . . . . . . . . . 3Executive Summary . . . . . . . . . . . . . . . . . . . . . . . . . . . . . . . . . . . . . . . 6Introduction . . . . . . . . . . . . . . . . . . . . . . . . . . . . . . . . . . . . . . . . . . . . 8Natural & Socio-Economic EnvironmentGeology . . . . . . . . . . . . . . . . . . . . . . . . . . . . . . . . . . . . . . . . . . . . . . . . 16Geomorphology . . . . . . . . . . . . . . . . . . . . . . . . . . . . . . . . . . . . . . . . . . 22Climate . . . . . . . . . . . . . . . . . . . . . . . . . . . . . . . . . . . . . . . . . . . . . . . . 23Hydrology . . . . . . . . . . . . . . . . . . . . . . . . . . . . . . . . . . . . . . . . . . . . . . 24Soils . . . . . . . . . . . . . . . . . . . . . . . . . . . . . . . . . . . . . . . . . . . . . . . . . . . 25Vegetation . . . . . . . . . . . . . . . . . . . . . . . . . . . . . . . . . . . . . . . . . . . . . . 26Population . . . . . . . . . . . . . . . . . . . . . . . . . . . . . . . . . . . . . . . . . . . . . . 26Agriculture . . . . . . . . . . . . . . . . . . . . . . . . . . . . . . . . . . . . . . . . . . . . . . 27Mining, fisheries and tourism . . . . . . . . . . . . . . . . . . . . . . . . . . . . . . . 28Essentials of Groundwater in NamibiaGroundwater potential . . . . . . . . . . . . . . . . . . . . . . . . . . . . . . . . . . . . . 32Tapping and abstracting the groundwater . . . . . . . . . . . . . . . . . . . . . . 34 Sustainable use of groundwater . . . . . . . . . . . . . . . . . . . . . . . . . . . . . . 34Vulnerability and protection. . . . . . . . . . . . . . . . . . . . . . . . . . . . . . . . . 39Hydrogeological FrameworkGroundwater basins and their hydrogeological features . . . . . . . . . . . 44Caprivi Strip. . . . . . . . . . . . . . . . . . . . . . . . . . . . . . . . . . . . . . . . . . . . . 45Okavango - Epukiro Basin . . . . . . . . . . . . . . . . . . . . . . . . . . . . . . . . . . 47Cuvelai - Etosha Basin . . . . . . . . . . . . . . . . . . . . . . . . . . . . . . . . . . . . . 51Otavi Mountain Land . . . . . . . . . . . . . . . . . . . . . . . . . . . . . . . . . . . . . 60Northern Namib and Kaokoveld . . . . . . . . . . . . . . . . . . . . . . . . . . . . . 72The Brandberg, Erongo and Waterberg Area . . . . . . . . . . . . . . . . . . . . 75Central Namib -Windhoek Area . . . . . . . . . . . . . . . . . . . . . . . . . . . . . 77Hochfeld -Dordabis - Gobabis Area . . . . . . . . . . . . . . . . . . . . . . . . . . . 86Stampriet Artesian Basin . . . . . . . . . . . . . . . . . . . . . . . . . . . . . . . . . . . 88Fish River - Aroab Basin . . . . . . . . . . . . . . . . . . . . . . . . . . . . . . . . . . . . 92Southern Namib and Naukluft . . . . . . . . . . . . . . . . . . . . . . . . . . . . . . 96Karas Basement . . . . . . . . . . . . . . . . . . . . . . . . . . . . . . . . . . . . . . . . . 100The Groundwater MapData of the Map . . . . . . . . . . . . . . . . . . . . . . . . . . . . . . . . . . . . . . . 106Inset maps . . . . . . . . . . . . . . . . . . . . . . . . . . . . . . . . . . . . . . . . . . . . . 109Use of the Map . . . . . . . . . . . . . . . . . . . . . . . . . . . . . . . . . . . . . . . . . 110Bibliography. . . . . . . . . . . . . . . . . . . . . . . . . . . . . . . . . . . . . . . . . . 112Annex . . . . . . . . . . . . . . . . . . . . . . . . . . . . . . . . . . . . . . . . . . . . . . . 116Glossary . . . . . . . . . . . . . . . . . . . . . . . . . . . . . . . . . . . . . . . . . . . . . 124
Contents

6
Water is life, but in a countryas dry as Namibia, water resources are oftenscarce and unreliable. Surface water avail-ability is closely linked to a rainfall patternthat is extremely inconsistent in both timeand space. Too much rain can cause floodsthat are difficult to master and duringdroughts surface waters evaporate quickly.Groundwater resources, a “hidden treasure”underground, are more reliable, widespreadand naturally protected against evaporation. The groundwaterstored in the pore spaces between sand grains and in voids of rockshas a regulating function: it can be abstracted during dry peri-ods and filled up again by recharge during good rains.Namibia, the driest country in Africa south of the Sahara,
depends largely on groundwater. Over the past century, morethan 100 000 boreholes have been drilled. Half of these are stillin operation and produce groundwater for industrial, munic-ipal and rural water supply. They provide drinking water toman, livestock and game, irrigation water for crop productionand supply distant mines. The advantage of using ground-water sources is that even isolated communities and those eco-nomic activities located far from good surface water sourceslike mining, agriculture and tourism, can be supplied fromgroundwater over nearly 80 % of the country. Despite considerable investment in drilling, borehole design
and construction as well as pumping and maintenance, ground-water is usually the most economical way of supplying water.However, groundwater resources, being closely associated withunderground rock types that vary with the geological situation,are unevenly distributed across the country. There are only afew favourable places where high volumes of groundwater can besustainably abstracted, but fortunately there are also few placeswhere no groundwater is found at all. But even if there is enoughgroundwater in a region, it might be unfit for human use becauseof its poor quality. The north-western part of the Cuvelai-EtoshaBasin and the south-eastern part of the Stamp riet Basin, the so-called salt block, are prominent examples.This book “Groundwater in Namibia” and the attached
“Hydrogeological Map of Namibia” at a 1:1000 000 scale,
are the result of a two years’ technicalcooperation project of the Republic ofNamibia and the Federal Republic of Germany. The Map and Book synthesisethe groundwater related data, informa-tion and knowledge available in Namibia.The project enjoyed the cooperation ofexperts from the Department of WaterAffairs (DWA) in the Ministry of Agri-culture, Water and Rural Development;from the Geological Survey of Namibia
(GSN) in the Ministry of Mines and Energy; from the NamibiaWater Corporation Ltd. (NamWater); from the Federal Institutefor Geosciences and Natural Resources (BGR) on behalf of theGerman Ministry for Economic Cooperation and Development(BMZ), and many other hydrogeological and geological expertsin the country.The groundwater situation in Namibia is outlined in detail
in the chapter “Hydrogeological Framework”. Compilers ofthe Map identified twelve main hydrogeological units basedon their coherent geological and hydrogeological conditions.The chapter presents the status of the groundwater resourcesin these groundwater basins or units, their quantitative andqualitative aspects, and their present-day use. Good data were usually available for the Groundwater Supply
Schemes (109 sites) run by NamWater and certain Munici-palities listed in Annex 1. In other areas, boreholes representativeof the hydrogeological situation in their vicinity were added(see Annex 2). The rest of the country was classified into aquifers,aquitards and aquicludes using the data available in the data-bases of DWA, GSN and NamWater, records and documen-tation as well as the local expertise of numerous groundwaterexperts, most of whom contributed voluntarily to the Map andthe Book. Despite this wealth of information, knowledge aboutgroundwater is still sparse or insufficient for some areas. Herethe Map and the Book can help focus future investigations andprogrammes.Whether or not groundwater can be stored and the way it
flows is largely determined by the types of rocks underground.About half (48%) of the country is covered by unconsolidateddeposits that are potential porous aquifers and the rest is made
Executive Summary

mination. Other areas are favourable,sitting on high-yielding, very pro-ductive aquifers that contain morewater than farmers and communi-ties presently need. Numer ous smallsprings, fountains and seeps through-out the country sustain wildlife, man
and livestock in an other wise arid environment. Groundwater resources should be preserved and protected
as an underground treasure, as a strategic reserve for drink-ing water supply in prolonged periods of drought and for futuregenerations. It must not be spoiled by over-exploitation now,just because the water “is there”, and care should be takennot to contaminate them with pollutants. The Hydrogeological Map and this Book summarise the
information on groundwater in Namibia, and pinpoint wheregroundwater is sparse or abundant. This information, judiciouslyused, can provide the backbone for the equitable distribu-tion, sound development and long-term sustain able manage-ment of Namibia’s groundwater resources, and the protectionof groundwater resources from degradation in quantity andquality. As such, these results of the Hydro geo logical Map ofNamibia Project are a milestone in ground water-related workin Namibia and a cornerstone for a sustain able, environmen-tally-sound water development strategy for Namibia.
G CHRISTELIS, W STRUCKMEIER
7
up of hard rocks, more or less fractured. Fractured hard rocks andporous unconsolidated rocks are re -garded as aquifers, only if they storeextractable groundwater in an appre-ciable quantity. Only groundwater-producing rock bodies, in whichborehole yields generally exceed 3 m3/h, are classified as aquifersand are shown in blue or green on the Map. Those with bore-hole yields between 3 and 0.5 m3/h are aquitards, and are shownin light brown, while rocks in which very little groundwateris found (borehole yields less than 0.5 m3/h) are shown as darkbrown aquicludes. Only 42% of the country overlies aquifers,of which 26% of the area contains porous aquifers and 16%fractured aquifers. Within these aquifers, the borehole yieldsexceed 15 m3/h only over some 14 000 km2 or 3 % of thetotal territory, making these highly productive aquifers andstrategic targets for groundwater supply. Not surprisingly, mostof these areas are already declared groundwater control areas.Wherever known, quantitative information about aquifer
parameters, groundwater volumes and water balance figureshave been provided in the text. However, detailed figuresexist only in a few places where groundwater models have beenestablished, e.g. in the Grootfontein and Tsumeb areas andin the Stampriet Artesian Basin. Although Namibia is an arid country, its finite water re -
sources are sufficient to sustain continuous growth and steadydevelopment of the Nation. There are however great variationsin the availability of water. At the southern, northern and north-eastern borders where surface water is available throughout theyear from perennial rivers, there is an excess rather than a short-age of water, although this is shared with neighbouring countries.The rest of the country either relies on dams constructed inephemeral rivers that have low safe yields in comparison to theirtotal volume, because of drought and high evaporation losses,or on groundwater. The total, overall groundwater resourcesare sufficient to assure long-term water supply if used sus-tainably, yet there are great regional variations. In many areas,groundwater conditions are unfavourable due to limited wateravailability, little and unreliable recharge, low borehole yields,great depths, poor groundwater quality and high risks of conta - Water is life – but it can be dangerous and destructive
Cronje Loftie-Eaton
Windpump and borehole installation
DWA Archive

3.0
8
Introduction

9
Water in Namibia and rationale for a Hydrogeological Map Project
Claudia du Plessis

In arid areas, where rainfall is lim-ited and surface runoff is only avail-able during the rainy season, man haslearnt through experience that there iswater underground that can be usedduring the dry season. Thus, ground-water has played an important rolein the development of Namibia. Groundwater resources have been recognised and used
for drinking purposes since humans settled in Namibia. Thepreferential areas of settlement were near springs or foun-tains from which groundwater naturally seeped into pondsor even formed the beginning of small perennial water-courses. Hauchabfontein, Sesfontein and Kowarib are wellknown examples. Even the capital city, Windhoek, owes itsorigin to the availability of safe ground water from flowingsprings. Later, springs and ponds were deepened by handto reach more water. Wells were also dug into the dry water-courses where no springs existed, but where the ground-water was shallow. Today, groundwater resources lying hun-dreds of metres below the surface, are tapped by deeplydrilled boreholes.When Namibia became a Protectorate of the German
Empire in 1884, momentum was given to the developmentof agriculture, mining and infrastructure such as railways,roads and water supplies. As the population grew, perma-nent towns and farms were established and it soon becameapparent that more reliable, assured water supplies wererequired to support future economic activities in Namibia.
In October 1896, Dr Rehbock wascommissioned by the German Govern -ment to investigate the occurrence,availability and utilisation of the waterresources in the country. In 1897, hedistributed the first rain gauges to farm-ers to better understand the hydrologyof the country by obtaining informa-
tion about rainfall and runoff. The advice in the report tohis Government gave more direction to water resource devel-opment in Namibia.In 1903, the first drilling machine arrived in the country
and by 1906 there were two drilling units, one for the southand one for the north. They operated under the control andsupervision of a geologist, Dr Lotz, who conducted thesearch for groundwater in an organised manner. Thisimproved technology and expertise brought into the country,made it possible to drill boreholes for groundwater at greaterdepths and in water bearing geological formations that hadpreviously been inaccessible. In 1906, Dr Range, a hydro-geological expert, was sent to Namibia to assist with thegroundwater development programme and he takes creditfor recognising the artesian conditions of the Stamp rietbasin. By 1913, a geographer, Prof Jaeger, used the availableinformation on surface runoff and groundwater to compilethe first water register for the country.After the First World War, a new Administration for the
Territory of South West Africa was established and an Irri -g ation Department with a Boring Division, directed by adrilling engineer, was created. The duty of this Departmentwas to find groundwater sources suitable for stock farm-ing and irrigation. The activities of the Boring Division,as well as the work of many geologists, hydrogeologists, waterdiviners and private drilling contractors since then, made itpossible to extend the availability of groundwater sourcesto many places in the country where there had previouslybeen no water available for stock drinking and human con-sumption. This increased availability of groundwater securedthe development of stock farming on the grasslands in themore remote areas of Namibia, and the development ofstronger boreholes made it possible to sustain the largertowns and settlements, as well as other important economic
10
Old drilling machine for groundwater boreholes
Wilhelm Struckm
eier

11
activities such as mining, industry and small-scale irri-gated agriculture. Whenever there is a scarcity of water, it is mainly due
to low rainfall. The distribution of rainfall across the SouthernAfrican subcontinent is the lowest along the south-west-ern Atlantic coast, an area largely covered by the territoryof Namibia (refer to the “Rainfall and Watershed” inset mapon the Hydrogeological Map). In addition to the generalpaucity of precipitation, rainfall events are extremely un -reliable, variable and unevenly distributed in space and timeover the landscape. Furthermore, the prevailing high temperature in the rainy season and huge evaporation lossesmake Namibia not only the driest country in southern Africa,but most probably in the whole of the Southern Hemi sphere. In order to utilise surface runoff, dams have been built
to capture and store water from the floods during the rainyseason. However, the assured sustainable safe yield of suchdams is dependent on unreliable and unfavourable hydro-climatic conditions. The availability of surface water resourcescan therefore not be guaranteed, even with creation of themost appropriate facilities. The construction of storage reser-voirs or dams is also limited by the topography of the land -scape and there are large areas in Namibia where the terrainis too flat to build viable dams to harness surface runoff. It may be reasoned that in areas where surface water
use is limited, one rather expensive option is to importthe water required over long distances from other surface orgroundwater sources, however, the use of local groundwa-ter sources is still the most appropriate and cost- effective
way to provide water in most of these areas. The weather systems, rainfall, surface runoff and open
water bodies are the visible components of the water cycle.However, the surface water that infiltrates into the groundfills up the voids and pore spaces of the rock formationsmaking up the crust of the earth, and this accumulationof water in the aquifers below the surface is not only in -visible, but an integral part of the hydrological cycle. Theavailability of water resources in Namibia is reflected in thetable below.Like surface water sources, groundwater can also be regen-
erated and replenished by rainwater filtering into the ground.The magnitude and sustainable yield of the groundwatersources are therefore determined by the size and extent ofthe aquifers, the conditions that facilitate the rate of rechargeto the aquifers and the potential of the hydro climate to pro-duce rainfall and runoff. However, there are also fossil groundwaters that have
accumulated tens of thousands of years ago in water- bearingaquifers when the climate in the southern African regionwas much wetter and a large lake covered areas in northernNamibia and southern Angola where the Cuvelai Basin islocated today. In order to find groundwater, more than 100 000 bore-
holes have been drilled, and of these a large number haveeither come up dry or dried up over time. It is estimatedthat there are more than 50 000 production boreholes inuse in the country. Groundwater is pumped from theseinstallations for domestic, livestock and wildlife con-sumption, as well as for mining, industrial operations andirrigation. The only assured water supply from surface water is lim -Omatako Dam, a dam site vulnerable to high evaporation
Water availability
ecruoSemuloV
mM( 3 )a/krameR
retawdnuorG
retaWecafruSlaremehpE
retaWecafruSlainnereP
lanoitnevnocnU
003
002
051
01
elbaniatsusmret-gnoldetamitsEdleiyefas
%59tatnempolevedlluFylppusfoecnarussa
noitcartsbadellatsniyltneserPyticapac
gnilcycer,esu-er,noitamalceR
secruoseRelbaliavA 066
Wilhelm Struckm
eier

ited to the perennial riverson the northern and south-ern and borders of Namibia,but this water must also beshared with the countriesneighbouring Namibia. Thecountry is thus highlydependent on groundwaterbecause the surface watersources in the in terior ofNamibia are unreliable. The dependence on groundwateris accentuated during prolonged periods of drought, whensurface water sources tend to dry up.The advantage of using groundwater sources in Nami bia
is that it is possible to supply water to isolated communi-ties, and for economic activities like mining, industry andagriculture over nearly 80% of the country. Without ground-water, development in many of these cases would have beenimpossible due to the need to import prohibit ively expen-sive water over long distances via canals or pipelines. About45% of the water supplied to towns, villages and farms inNamibia comes from boreholes or springs. It is also inter-esting to note that 45% of the water used in agriculturecomes from groundwater sources. The table below showsthe use of the water resources in Namibia by each majorconsumer group.Thus it is obvious that Namibia could not survive with-
out using its precious groundwater resources. However,although groundwater had been sought and used for morethan a century, the occurrence, magnitude and po ten tial of
groundwater resources arestill not fully known. This isparticularly true in remoteareas where the demand forwater is small and littleground water investigationhad been done. Even in areasof intensive groundwaterabstraction, the knowledgeabout the water balance or
recharge versus abstraction, is often insufficient due to theshort period of monitoring of these aquifers (in many casesless than 50 years). This makes it difficult to predict thelong-term assured, sustainable, safe yield of an aquifer. Eachmajor aquifer is operated according to an aquifer manage-ment plan. The behaviour of the aquifer is closely moni-tored, and an appropriate management strategy adopted toensure the sustainable utilisation of the aquifer. It is also clear that Namibia has a “hidden treasure” of
groundwaters, and these resources have to be identified andmapped for the whole country to provide a comprehen-sive basis for the utilisation of groundwater in developmentplanning. All natural resources and how they function mustbe well known and fully understood, and this knowledgetaken into account in any national development strategyif planners want to make optimum use of the assets pro-vided by nature. Equitable and sustainable development, asspelled out in the Constitution of Namibia, includes theproper and wise use of all natural resources including ground -water, to supply the water needed without harming the environ ment. Information about the occurrence of groundwater and
the magnitude of groundwater resources have been gatheredin Namibia for more than a century, but all this know -ledge had never been collated and presented in a way thatthe general public and scholars can access, appreciate andunderstand.The Hydrogeological Map of Namibia at scale 1:1000000,
provides an overview of the groundwater situation in thewhole country. It shows the aerial extent of the rock bodiescontaining groundwater and their potential. Moreover, itdepicts the hydrodynamic features such as the groundwa-
12
* The unconventional water sources are included in the ephemeral andgroundwater sources
** Industrial and tourism use is included in domestic use because it is onlyabout 4 % of the total water consumption in Namibia
Orange River at the Noordoewer Bridge
remusnoCpuorG
dnameDmM( 3)
*ylppuSfoecruoS
lainnerePsreviR
laremehpEsreviR
retawdnuorG
mM( 3) )%( mM( 3) )%( mM( 3) )%(
**citsemoDkcotS
gniniMnoitagirrI
377741631
8141806
52817544
023114
724703
5306553
84876362
latoT 003 001 33 56 22 531 54
Wilhelm Struckm
eier
Use of water resources per consumer group in 2000

ter flow direction, depth to groundwater, art esian areas, andmajor groundwater quality restrictions. Inform ation oninstallations for the abstraction of water (water supplyschemes, irrigation schemes), as well as the distribution andtransfer of water (canals and pipelines) are port rayed, too.The Map integrates all this complex and interdependentinformation in an easily readable form. There are many important reasons why a Hydrogeo-
logical Map for Namibia and this explanatory book “Ground-water in Namibia” were prepared. The Map and this bookwill greatly improve the knowledge and understanding ofthe groundwater situation in Namibia. It will create an aware-ness of a natural resource that is vulnerable, but vital forwater supply in the country. The Map will also serve as aguide to national development strategies aimed at the soundand sustainable development of the Nation’s natural resources.However, a Hydrogeological Map is never complete and theinset map on the “density of boreholes” clearly shows thatthere is a lack of information in certain areas. This willcertainly encourage further investigations into those ground-water resources that are not yet well known. The same applies
to the inset map on the “Vulner ability of the groundwaterresources” in Namibia. More studies in this field are alsovital as there is no hope of recovery if an aquifer in an aridarea is polluted. The work that has been done on the Mapand this book provides inform ation, creates awareness, givesguidelines for development, and illustrates some of the majorchallenges that face water resource managers now and infuture.
P HEYNS, W STRUCKMEIER
13
Drilling is required to know more about groundwater resources
FURTHER READING
• Heyns P, S Montgomery, J Pallett, M Seely (Eds).1998. Namibia’s Water, A Decision Makers’Guide. Desert Research Foundation of Namibiaand DWA, Windhoek, Namibia.
• Lau B & C Stern. 1990. Namibian WaterResources and their Management – A preliminaryHistory. Archeia, No.15, Windhoek.
• Pallett J (Ed). 1997. Sharing Water in SouthernAfrica. DRFN. Windhoek.
Wilhelm Struckm
eier

14
Natural& Socio-Economic Environment
15
Wynand du Plessis

GeologyNamibia’s varied geology encom-
passes rocks of Archaean to Cenozoicage, thus covering more than 2600million years (Ma) of Earth history.Nearly half of the country’s surface areais bedrock exposure, while the remain-der is covered by young surficial deposits of the Kalahariand Namib Deserts.Metamorphic inliers consisting of highly deformed
gneisses, amphibolites, meta-sediments and associated intru-sive rocks occur in the central and northern parts of the coun-try, and represent some of the oldest rocks of Palaeopro-terozoic age (ca. 2200 to 1800 Ma) in Namibia. The Kuneneand Grootfontein Igneous Complexes in the north, the vol-canic Orange River Group and the Vioolsdrif Suite in thesouth, as well as the volcano-sedimentary KhoabendusGroup
16
arE noitamroF noitacifissalCnaibimaN
ciozoneCaM56<
otsuoecaterCyranretrauQ
aM531<
aM531<stnemideSciozoneC
sexelpmoCooraK-tsoPciozoseMaM052-56
otnaimrePcissaruJ
aM003-531
aM003-531 ecneuqeSooraK
ciozoelaP045-052
aM aM005-003 noisorE
nairbmaCaM045-005
otnaibimaNnairbmaCylrae
aM0001-005
puorGamaN
ecneuqeSaramaD
xelpmoCpeiraGnairbmacerP
aM045>
ciozoretorpoeNaM0001-045
ciozoretorposeMaM0061-0001
etalotelddiMnailokoM
aM0081-0001
etinarGgrebsmaGetiuSnietnofsnarF
ecneuqeSrialcniSxelpmoCdnalauqamaN
ecneuqeShtoboheR
ciozoretorpoelaPnaeahcrAdna
aM0061>otnailaaV
nailokoMylraeaM0081>
noitamroFmilEpuorGsudnebaohK
etiuSfirdslooiVpuorGreviRegnarOxelpmoCreiviriooM
noitamroFfohueNxelpmoCetrawehoH
xelpmoCsibabbAxelpmoCnietnoftoorG
xelpmoCbauHxelpmoCenenuK
xelpmoCapupE
Stratigraphical units in Namibia
and Rehoboth Sequence also belong tothis group. The Mesoproterozoic (1800 to 1000Ma) is represented by the Namaqua-land Metamorphic Complex, whichcomprises granitic gneisses, meta-sedimen tary rocks and magmatic in -trusions, and by the volcano-sedimen -
tary Sinclair Sequence of central Namibia, with associ atedgranites (e.g. Gamsberg Granite Suite).The coastal and intra-continental arms of the Neopro-
terozoic Damara Orogen (800 to 500 Ma) underlie largeparts of north-western and central Namibia, with platformcarbonates in the north and a variety of meta-sedimentaryrocks pointing to more variable depositional conditions fur-ther south. Along the south-western coast, the volcano-sed-imentary Gariep Complex is interpreted as the southernextension of the Damara Orogen. During the later stages oforogenic evolution, the shallow-marine clastic sediments ofthe Nama Group, which covers much of central southernNamibia, were derived from the uplifted Damara and GariepBelts.Sedimentary and volcanic rocks of the Permian to
Jurassic Karoo Sequence occur in the Aranos, Huab andWaterberg Basins, in the south-eastern and north- westernparts of the country. They are extensively intruded by doleritesills and dyke swarms, which in association with predom-inantly basaltic volcanism and a number of alkaline sub-vol-canic intrusions, mark the break up of Gondwana landand the formation of the South Atlantic ocean during theCretaceous.The currently last chapter of Namibia’s geological history
is represented by the widespread Tertiary to recent (< 50 Ma)sediments of the Kalahari Sequence.
The main rock typesBased on their hydrogeological characteristics, the
extremely varied lithologies occurring in Namibia weregrouped into 12 main units for the Hydrogeological Map.While stratigraphic positions and spatial distribution weretaken into consideration, the main focus was placed onthe groundwater potential of the rocks. The resulting sub -

division is therefore quite different from the lithologicalunits shown on the Geological Map of Namibia.The following units were established:(1) Sand and gravel, valley deposits (alluvium)(2) Unconsolidated to semi-consolidated sand and gravel,
locally calcrete(3) Unconsolidated to semi-consolidated sand and gravel,
locally calcrete; with scattered bedrock outcrops(4) Calcrete(5) Sandstone(6) Shale, mudstone, siltstone(7) Limestone, dolomite, marble(8) Non-porous sandstone, conglomerate, quartzite(9) Volcanic rocks (Karoo and younger)
(10) Metamorphic rocks, including quartzite and marblebands
(11) Metamorphic rocks, including quartzite and marblebands; with granitic intrusions
(12) Granite, gneiss, old volcanic rocks
Unit 1, “Sand and gravel, valley deposits (alluvium)”comprises the young infill in valleys and some courses ofephemeral rivers where they are extensive.Unit 2, “Unconsolidated to semi-consolidated sand and
gravel, locally calcrete” occurs abundantly in the Namib Desertbetween Walvis Bay and Oranjemund, and contains the Ceno-zoic sediments of the Namib Desert. Further north, this unitoccurs east of Terrace Bay and south of the Kunene River
17
Simplified lithological map of Namibia
Source: HYMNAM Project
© GSN, DWA

mouth, where dunes arelocally de vel oped. Infill ofthe Kalahari Basin, whichcovers the entire KalahariSand veld, the OwamboBasin, as well as the Kavangoand Caprivi re gions, alsobelong to this unit. In the south, between Tses
and Keetmanshoop, sand-stones of the Auob and Nossob Members of the Prince Albert Formation, KarooSequence, that occur along the Weissrand Escarpment havealso been included in this unit, because they frequently forma joint groundwater system together with the overlying Kalahariof the Stampriet Basin.In the Namib south of Lüderitz, as well as in the area east
of the main Namib sand sea close to the Great Escarpment,the unconsolidated to semi-consolidated sediments showscattered bedrock outcrops, which range from small hills toprominent inselbergs composed of mainly Proterozoiclithologies. These areas fall into unit 3, “Unconsolidated tosemi-consolidated sand and gravel, locally calcrete, withscattered bedrock outcrops”.Unit 4, “Calcrete” comprises a white, flat-lying surface
limestone which is commonly developed in warm, arid andsemi-arid regions, where it forms by solution and re- deposition of calcium carbonate by meteoric waters. Thelime forms a hard cement to sand and gravel beds, andcan even replace pre-existing material. Such calcretes havea large distribution in the area of Grootfontein and alongthe southern margin of the Etosha Pan. They also exten-sively cover some valley infills. Most of the calcretes havebeen mapped by remote sensing methods from satelliteimages, since they form very important hydrogeologicalunits (see Box on “Calcrete”). Unit 5, “Sandstone” occurs in the Otjiwarongo area south
of the Waterberg Fault, where they belong to the flat-lying aeolian Etjo Formation of the Karoo Sequence. Unit 6, “Shale, mudstone and siltstone” forms part of
the flat-lying Permian to Jurassic Karoo Sequence in theStampriet, Huab, Waterberg and Owambo Basins in the
south-eastern and north-western parts of Namibia.As part of Gondwanaland,southern Africa initially occu-pied a position close to thesouth pole, and a huge icesheet covered the region.Basal glacial rocks of thelower Permian Dwyka For-mation were de po sited beforethe Dwyka glaciation ended
approximately 280 million years ago, when plate tectonic movements brought southern Africa to a more moderate cli-matic realm. The melting ice sheet provided ample water to create an environ ment with huge lakes and rivers, and theDwyka Formation is overlain by lacustrine grey to green shales, mudstones, limestones, sandstones and coal-bearing shalesof the Prince Albert Formation. Mid- Permian rocks in theStampriet Basin consist of 600 metres of shales with thin lime-stone layers overlain by shale and sandstone. In the HuabBasin, mid-Permian rocks are re presented by purple shalesand sandstones. Mudstones also occur within the OmingondeFormation of the Waterberg which in addition comprises redconglomerates, sandstones and grits up to 600 metres thick.In addition, shales of the Fish River Subgroup, Nama Group,a southern molasse, and the Mulden Group, a northernmolasse, both to the Damara Orogen, belong to this unit (6),termed “Shale, mudstone, siltstone”. Unit 7, “Limestone, dolomite, marble” comprises rocks
of the Neoproterozoic Damara Orogen which were depositedin an ocean formed during successive phases of intra- continental rifting, spreading and the formation of pas-sive continental margins. The marbles of the Karibib For-mation accumulated in a shelf area in north-western centralNamibia, while the thick succession of dolomites and lime-stones of the Otavi Group was deposited on a north ern plat-form and today crop out in fold structures between Grootfontein and Opuwo. The Naukluft Nappe Com-plex contains appreciable quantities of flat-lying limestones,and therefore also belongs to this unit, as well as limestonesof the Nama Group which were deposited in a shallow syn-tectonic foreland basin of the Damara Orogen.
18
View from the Gamsberg looking north-west to the Namib
Jürgen Kirchner

Unit 8, “Non-porous sandstone, conglomerate, quartzite”forms a unit which was mainly deposited during Damarantimes. It comprises the basal Nosib Group of the DamaraSequence which was laid down in, or marginal to, intra - continental rifts, and consists of quartzite, arkose, conglo -merate, phyllite, calc-silicate and subordinate limestone,as well as the deep water sediments of the Auas Formationdeposited on the edge of a narrow developing ocean. Thisunit further contains the flat-lying basal and upper sand-stones of the Nama Group of southern Namibia.A sequence of the 180 million year old basalts of the
Kalkrand Formation, that are about 360 metres thick, occurin the Mariental area. Volcanic rocks of the Etendeka Formation in north-western Namibia have ages of about135 million years. Both formations are flat-lying. Extensivedolerite sills and dyke swarms are related to the volcanicrocks which have formed in connection with the continentalbreak up of Gondwanaland and form unit 9 “Volcanic rocks(Karoo and younger)”.Many different, highly folded rock types of Mokolian
and Namibian ages are included in unit 10 “Metamor-phic rocks, including quartzite and marble bands”. Theseextend from the Gobabis area to the Gamsberg region andthen southwards to Helmeringhausen. The 1800 million year old Reho both Sequence is thought
to have formed in the back-arc basin of a magmatic arcand comprises schist, phyllite, amphibolite and quartzite.Rocks of the Sinclair Sequence accumulated within an intra -con ti nental rift. Deposi tionof quartzites took place in narrow fault-boundedtroughs in today’s Helme -ringhausen-Solitaire areaafter a cycle of magmaticactivity. Damaran rocks pre-sent in this unit includeschists of the basal NosibGroup, marbles of the Ugaband Kudis Subgroups, schist, phyllite and amphibolite ofthe Chuos Formation andmarble, schists and amphi-
bolites of the Karibib and Kuiseb Formations, including theMatchless Amphibolite Belt.Damaran meta-sediments have been intruded by granites
in a broad zone between Otjiwarongo and Okahandja andthe coast. The intrusion accompanied the mountain build-ing process between 650 and 450 million years ago. Whereindividual granite bodies are too small to be shown onthe Map, they were included in unit 11, “Metamorphicrocks, including quartzite and marble bands; with graniticintrusions”. Unit 12, “Granite, gneiss, old volcanic rocks” finally
includes a multitude of lithologies almost covering the entiregeological history of Namibia. Vaalian rocks comprise thegneisses of the Epupa Complex and the intrusives of theKunene Complex. Early Mokolian rocks include gneissesand meta-volcanics of the old metamorphic complexes, meta-volcanics of the Orange River Group, granites of the Viools-drif Suite, gneisses of the Elim Formation and meta-volcanicsand gneisses of the Khoabendus Group. Middle to late Moko-lian rocks of this unit are the meta-volcanics of the RehobothSequence, the gneisses of the Namaqualand MetamorphicComplex, the meta-volcanics of the Sinclair Sequence, thegranites of the Fransfontein Suite, as well as the younger gran-ites, for example the Gamsberg Granite. The unit also com -prises a range of syn- to post- tectonic granites which intrudedDamaran sediments during the course of the DamaranOrogeny. Complex intrusions with ages of about 135 mil-lion years occur in a zone extending from the coast north
of Swakopmund in a north-easterly direction. Some ofthem are extremely complexlayered intrusions and con-tain rhyolite, grano phyre, granite, syenite, foyaite, gab-bro, dunite, pyroxenite andcarbonatite. They are notrelated to any orogeny andinterpretated as a result ofa hot mantle plume, andhave also been included inthis unit.
19
Etendeka Formation at Grootberg
Kevin Roberts
Calcrete The deposition of calcrete is
affected primarily by climate anddrainage. Other important and inter-acting factors are soil composition andthickness, topography, amount of dissolved Calcium and Magnesiumcarbonates in the water, time, stabil-ity of terrain surfaces, vegetation, and,in areas of thin soil cover, bedrockcomposition, structure and perme-ability. There are essentially two typesof calcrete, pedogenic and non-pedo-genic (groundwater) calcretes. In general, calcretes form in areas receiv-ing a mean annual rainfall of less than800mm. Above 800 mm, all calcare-ous material is leached from the soil.In areas receiving between 550 and800 mm, only calcrete nodules and calcareous soils form. Hardpan andboulder calcretes form where rainfallis less than 550mm. Calcificationdevelops readily in clayey, low- permeability soils, and less readily insandy, permeable soils. Owing to theclimatic conditions, calcretes can occurthroughout Namibia.
The main components of calcretesare cryptocrystalline calcite and dolo -mite. Calcretes often cement fluvialgravels. Most exposed calcretes are fossil calcretes, but it is difficult to distinguish present-day calcretes fromfossil calcretes formed under previousclimatic conditions. Many calcretesare complex, may be of both pedo-genic and non-pedogenic origin andformed by more than one phase of cal-cification.
Pedogenic calcreteFormation of pedogenic calcrete is
part of the soil-forming process. Whereshallow bedrock is present, the pedo-genic calcrete forms at the contactbetween the bedrock and the over lyingsoil cover. In thick soil profiles or allu-vial fans it generally forms at the lowerlimit of rain penetration. It is usu-ally less than 1 m thick, but may reachup to 3 m in places, e.g. capping theTsondab aeolian sandstone. Many pedogenic calcretes are well
structured consisting of individual cal-crete nodules at the base, becomingmore abundant and larger in size until
coa lescing toform a zone ofhoneycomb cal-crete. The upper-most zone is asolid hardpancal crete that is sel dom morethan 45cm thick.Where a pedo-genic calcrete isvery thin, thisthree-unit struc-
ture is commonly absent and the cal-crete may be almost entirely hardpan.The depth to the top of a pedogeniccalcrete is generally about 20 cm inareas with less than 125mm rainfallin creasing to about 50cm in areas with750mm of rainfall and more.Critical to the development of
pedogenic calcrete is the presence ofgroundwater or moisture with dis-solved calcium carbonate within thezone of evaporation in surface soils orsands. Evaporation of this moistureprecipitates the dissolved calcium carbonate as secondary limestone-pedogenic calcrete. Commonly insouthern Namibia, the soil cover isonly 5 to 30 cm thick. Although theunderlying calcrete may be extensive,it is often only seen in incised streamprofiles where the soil cover has beenremoved. Pedogenic calcretes formslowly and only below low-angleslopes. Each hardpan layer representsa period of stability of the land surfaceunder which the hardpan formed.
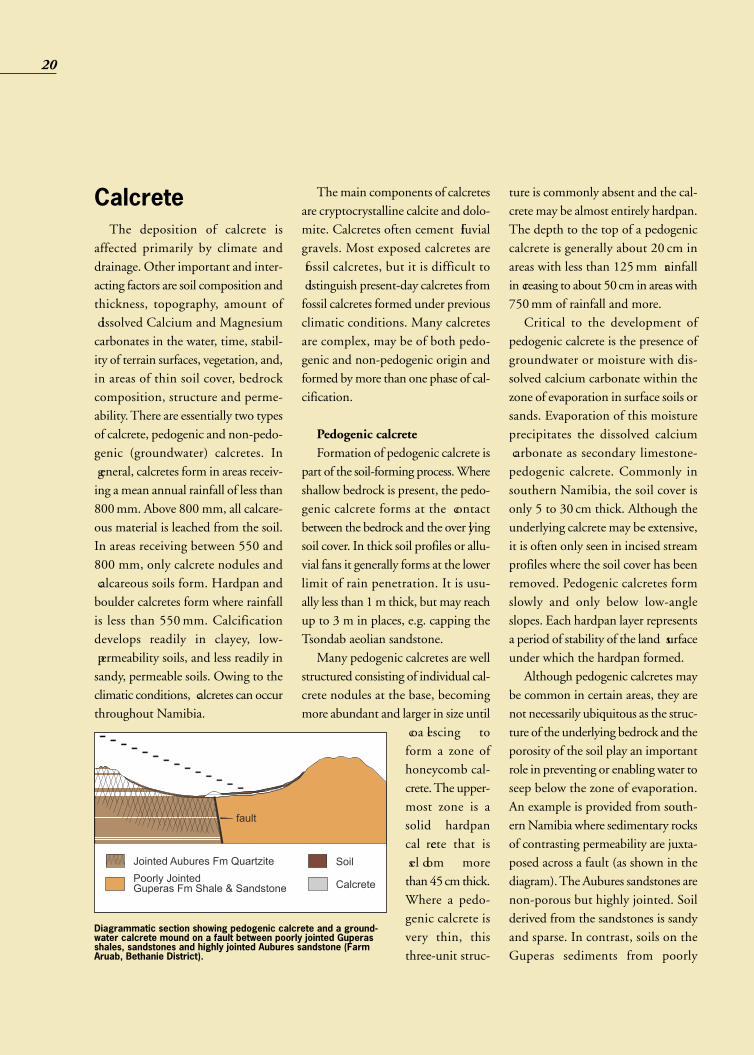
Although pedogenic calcretes maybe common in certain areas, they arenot necessarily ubiquitous as the struc-ture of the underlying bedrock and theporosity of the soil play an importantrole in preventing or enabling water toseep below the zone of evaporation.An example is provided from south-ern Namibia where sedimentary rocksof contrasting permeability are juxta -posed across a fault (as shown in thediagram). The Aubures sandstones arenon-porous but highly jointed. Soilderived from the sandstones is sandyand sparse. In contrast, soils on theGuperas sediments from poorly
20
Diagrammatic section showing pedogenic calcrete and a ground -water calcrete mound on a fault between poorly jointed Guperasshales, sandstones and highly jointed Aubures sandstone (FarmAruab, Bethanie District).
21
jointed shales and sand-stones produce a finergrained soil, which is gen-erally less than 20 cm thick.There are no pedogenic calcretes on the AuburesFormation, yet they arecommon at the soil/bedrockcontact on the Guperas Formation. This differenceis ascribed to the contrast-ing joint density and hencepermeability of the twounderlying bedrock types.Pedogenic calcretes are notan indicator of groundwater at depth.Where they occur at the soil/bedrockinterface they are rather an indicatorof impervious bedrock.
Non-pedogenic or “groundwater”calcretesSuch calcretes are formed by fluvial
action or by groundwater. They aredeposited in the unsaturated zone abovea shallow water table or below the watertable where surface evaporation isextreme. On a small scale, seepages andevaporation at springs and along faultscan form mounds of calcrete of limitedlateral extent. However, calcretesformed by fluvial action or extensivenear-surface flow of ground water canexceed 100m in thickness. In the fluvialprocess, the fluvial channel fill canbecome totally cemented by calcrete,e.g. the 100 m thick terraces on thenorth bank of the Ugab River west ofOutjo or the gravels of the palaeo-Kuiseb River resting on top of theTsondab aeolian sandstone.However, far more spectacular, yet
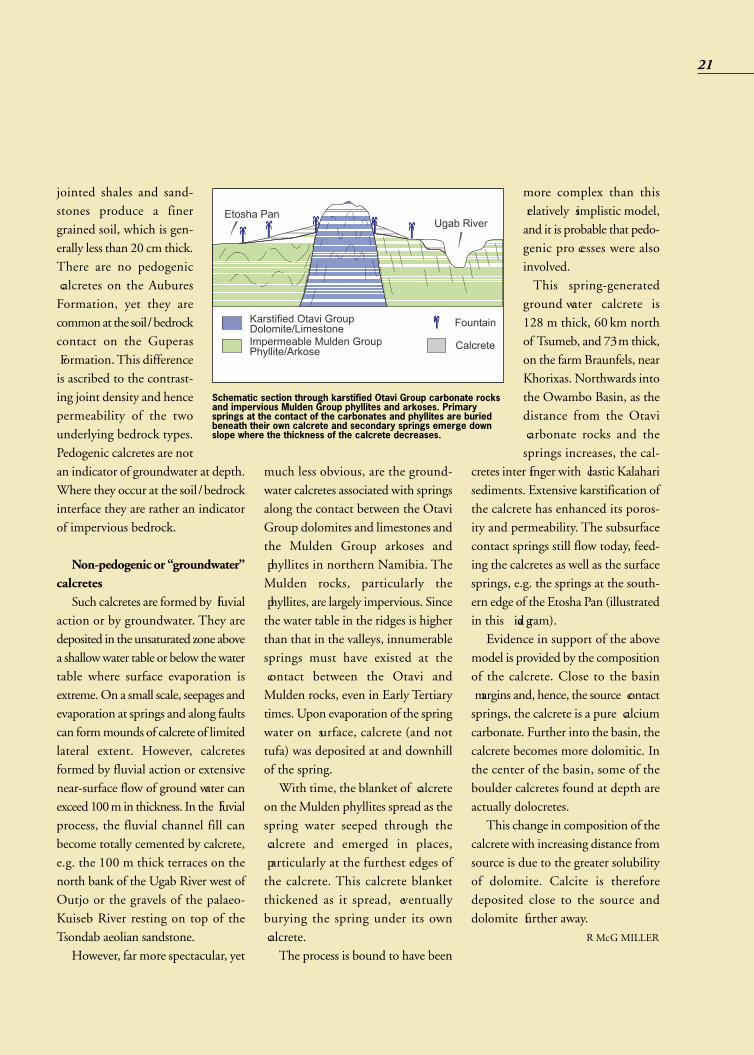
much less obvious, are the ground-water calcretes associated with springsalong the contact between the OtaviGroup dolomites and limestones andthe Mulden Group arkoses and phyllites in northern Namibia. TheMulden rocks, particularly the phyllites, are largely impervious. Sincethe water table in the ridges is higherthan that in the valleys, innumerablesprings must have existed at the contact between the Otavi andMulden rocks, even in Early Tertiarytimes. Upon evaporation of the springwater on surface, calcrete (and nottufa) was deposited at and downhillof the spring. With time, the blanket of calcrete
on the Mulden phyllites spread as thespring water seeped through the calcrete and emerged in places, particularly at the furthest edges ofthe calcrete. This calcrete blanketthickened as it spread, eventuallyburying the spring under its own calcrete. The process is bound to have been
more complex than this relatively simplistic model,and it is probable that pedo-genic pro cesses were alsoinvolved. This spring-generated
ground water calcrete is128 m thick, 60 km northof Tsumeb, and 73m thick,on the farm Braunfels, nearKhorixas. Northwards intothe Owambo Basin, as thedistance from the Otavi carbonate rocks and thesprings increases, the cal-
cretes inter finger with clastic Kalaharisediments. Extensive karstification ofthe calcrete has enhanced its poros-ity and permeability. The subsurfacecontact springs still flow today, feed-ing the calcretes as well as the surfacesprings, e.g. the springs at the south-ern edge of the Etosha Pan (illustratedin this dia gram).Evidence in support of the above
model is provided by the composition
of the calcrete. Close to the basin margins and, hence, the source contactsprings, the calcrete is a pure calciumcarbonate. Further into the basin, thecalcrete becomes more dolomitic. Inthe center of the basin, some of theboulder calcretes found at depth areactually dolocretes. This change in composition of the
calcrete with increasing distance fromsource is due to the greater solubilityof dolomite. Calcite is thereforedeposited close to the source anddolomite further away.
R McG MILLER
Schematic section through karstified Otavi Group carbonate rocksand impervious Mulden Group phyllites and arkoses. Primarysprings at the contact of the carbonates and phyllites are buriedbeneath their own calcrete and secondary springs emerge downslope where the thickness of the calcrete decreases.

GeomorphologyThe subdivision of Namibia into geomorphological units
is based on its position on the edge of the African continentand under the influence of the cold Benguela Current. During the Cretaceous and the Tertiary, southern Africacompleted its separation from the neighbouring parts ofGondwanaland. As a result of isostatic movements, the whole subcontinent underwent various stages of upliftment andthe present interior was subjected to erosion. Such isostaticupliftment is most prominent along the edges of a conti-nent, where erosion is most intense, and consequently,the Great Escarpment developed. Some of the highest peaksin Namibia occur along the Great Escarpment (see alsothe inset map “Altitude of ground surface” on the Map). The coastal zone west of the Great Escarpment forms a
100 km-wide, low-lying strip characterised by extreme arid-ity and occupied by the Namib Desert. This desert, whichis the world’s most arid region, is underlain by sands of aproto-Namib phase which started to develop 35 million yearsago. It stretches along the entire Atlantic coast and rises toa level of approximately 800 m at the foot of the Great Escarp-ment in the east. The Namib landscapes are quite diverse.They range from mountainous red dunes in the south-east-ern part of the interior plains and flat-topped, steep sided
inselbergs in the centralregion. Rocky desert as wellas sand seas with varioustypes of shifting and stablesand dunes occur. TheNamib sand sea is cutsharply by the Kuiseb Rivereast of Walvis Bay. Thenorthern part of the Namib,known as the SkeletonCoast, displays bare dunes aswell as stony and rockyplains. The Namib Desert isdissected by a number ofrivers that rise in the CentralPlateau but only carry waterafter good rains in their
catchment areas. They form linear oases in the desert.With differences in altitude of more than 1000 m, the
Great Escarpment marks the transition to the CentralPlateau east of the desert. It is formed by mountain rangesor single mountains that are much higher than the CentralPlateau. Between the northern and the southern parts thereis an area that has been deeply eroded and where the groundrises gradually to the height of the Central Plateau. Plainsand hills, as well as outstanding mountains such as Brand-berg, Erongo and Spitzkoppe, characterise this area. Thelandscapes of the Central Plateau vary between very flatand mountainous areas at altitudes between 1000 and2 000m. This mountainous plateau covers almost half of the
country and is bordered in the east and north-east by thesemi-arid Kalahari Basin. Two different main landscapescan be distinguished. The north-western highlands are characterised by broad valleys and inselbergs, while thesouth is a flat plateau dissected by deep valleys.The Kalahari Sandveld stretches east of the Central
Plateau and is formed by deep red or pale sands overlayingbedrock. This region is very flat and interrupted only byfossil valleys and dunes. A typical phenomenon in the Kalahari Sandveld are pans that are often covered by claylayers. The north- eastern Kavango and Caprivi Regions are
22
The landscape of Namibia

characterised by a densely wooded bushland and com-prise extensive wetland areas dominated by the Okavango, Zambezi and Kwando-Linyanti-Chobe river systems.
Climate Namibia is an arid country that has a semi-desert on
its eastern edge (Kalahari) and a desert on its western edge(Namib). The Namib Desert has a mean annual rainfall ofless than 20 mm in places and mostly below 50 mm. TheKalahari stretches over three southern African countries,i.e. Namibia, Botswana and South Africa, and is largely asemi-desert with mean annual rainfall in the 150 -350 mmrange. According to the Köppen classification, Namibia asa whole is characterised as a dry climate. Three major typesclearly emerge viz. cool deserts along the coast and south-western interior; warm deserts in the south-east and north-west; semi-desert steppe in the north and north-east. The
mean annual rainfall for Namibia is about 270 mm andranges from less than 20 mm in the Namib Desert to morethan 700mm at Katima Mulilo in the Caprivi Strip (seeinset map “Rainfall and main catchments in SouthernAfrica” on the Hydrogeological Map). The distributionof land area receiving different categories of rainfall is asfollows:
Rainfall Percentage of land surfaceless than 100mm/a 22 %100-300mm/a 33 %300-500mm/a 37 %more than 500mm/a 8 %
However, the average figures may be misleading, sincethe annual rainfall is extremely variable in time and space,and variability generally increases towards the west and thesouth. Therefore, the variation of rainfall in time needsto be considered in addition to the long-term average aerial
values. This variation is illus-trated by the graph ofannual rainfall for severalclimatic stations that havelong-term records.Namibia has a pastoral agriculture with crop pro-duction only being practisedin the northern areas of thecountry where rainfall usually exceeds 500mm. Climate variations likedroughts and to a lesserdegree floods, have a majorimpact on the agriculture,and since a large proportionof the population still livesin rural areas, drought usu-ally has devastating effectson commercial agriculturalproductivity and the ruralpoor. The interior plateau of thecountry is characterised by
23
Time series of annual rainfall at certain climatic stations in Namibia
Source: Ministry of Agriculture, Water
and Rural Development; Directorate of
Agriculture, Research and Training
© MAWRD

an extremely high evaporation rate that far exceeds the aver-age rainfall. Evaporation ranges between 2 400 mm/a alongthe coast and in the Caprivi, and more than 3 600 mm/ain the south-east (Aroab area of eastern Karas Region).Distinct warm and cool seasons are distinguishable. The
presence of a cold stable air mass along the coast and the alti-tude of the interior plateau result in temperatures lower thanthose expected for these latitudes. Temperature conditionsalong the coast can be described as moderately cool (15-20°C)while those of the interior as moderately warm (20-25°C).The temperature variation between summer and winter ismore accentuated in the interior than the coast and these sea-sonal contrasts decrease northward. The warmest month dif-fers from region to region with October being the hottestmonth in the north, in the central region it is December, andJanuary in the south. The hottest temperatures occur in thesouth especially in the Orange River Basin (36 to > 40°Caverage daily maximum for the hottest month). Similarly, thecoldest month varies from August along the coast to July inthe rest of the country. The lowest temperatures occur inthe eastern half of the central interior plateau (with night tem-peratures dropping below zero °C).Along the coast the southerly and south-westerly winds
dominate both in frequency (30-45 %) and strength (6to more than 9 m/s), whereas the variable winds of the interior do not present a clear pattern. The warm, dry anddusty easterly winds that blow during late autumn and early winter, cause much discomfort along the coast as it is usuallyhot as well.The cool air mass above the cold Atlantic sea water is
overlain by a warmer, dry air mass, resulting in an almostpermanent temperature inversion. Relative humidity is usually higher than 80%. These conditions are ideal for theformation of fog and low stratus clouds. On average approx-imately 100 days are foggy, while there is a somewhat higheroccurrence during winter along the central coast. This fogblanket is an important, and sometimes the sole source ofmoisture for the fauna and flora of the Namib Desert. Inthe desert research site of Gobabeb, new technologies arebeing tested to harvest the fog with large nets for water sup-ply.
HydrologyThe hydrology of Namibia is characterised by the semi-
arid to arid climate, and the very limited occurrence of surfacewaters. In fact, Namibia has no permanent rivers except forthe border rivers Kunene, Okavango, Zambezi and Kwando -Linyanti - Chobe in the north and the Orange River inthe south, all of which have their sources outside Namibia,and are shared with other countries (see inset map “Rain-fall and main catchments in Southern Africa” and the tablebelow). Some 23% of the water used in Namibia is derivedfrom these rivers, however, most of the country does nothave access to this water due to the distances involved. Con-sequently, only 0.1% of the total annual flow of these riversis abstracted, in Namibia.
The rivers within Namibia are ephemeral rivers, flowingonly for a short period after good rains in their catchmentareas. Most of them flow towards the Atlantic Ocean, andform linear oases in the Namib Desert. Some limited drainageoccurs towards the Kalahari Basin. Some large surface waterstorage dams have been built on these rivers to supply themajor centres with water.The percentage of the land area within the catchments
of the large river systems within Namibia is given in thetable above.
24
nisaBtnemhctaC metsySeganiarD )%(aerA
egnarOreviRhsiF
reviRegnarOehtfoseiratubirT7.41
enenuK reviRenenuKehtfoseiratubirT 8.1
,tsaoccitnaltAfostnemhctacdenibmoc
gniwolfdrawtsewsrevirlaremehpe
tsaocnrehtroNbimaNnrehtuoS
1.222.01
izebmaZizebmaZ
ebohC-itnayniL-odnawK2.09.1
ognavakO atleDdnareviRognavakO 9.32
ahsotE/ialevuC naPahsotE/ialevuC 6.21
irahalaKnrehtuoS srevirstnafilO,bossoN,bouA 6.21
Percentage of Namibia’s land surface belonging to variouscatchment basins
SoilsExtensive physical weathering, as well as erosion under
arid and semi-arid conditions are the dominant soil formingprocesses throughout Namibia. Fluvial transportation is aprominent feature in the central highland areas associatedwith widespread sheet erosion. Over 70% of Namibia’s sur-face area can be classified as highly susceptible to erosionactivities, making soil development very difficult in general.Aeolian sedimentation processes are active in the Kalahari
and Namib Deserts, where dunes and Hamada type landscapes prevail. Chemical weathering is hampered, mostlydue to the lack of moisture. In the western Namib Desert,
however, the breakdown of bedrock material is caused bysalt contained in the coastal fog and derived from the marineenvironment. Tertiary and Quarternary deposits, such asdunes and flat sand plains, are morphological features dom-inant in the Kalahari and Namib Desert. Due to the lowrelief in these areas, calcareous deposits can be found inweakly eroded valleys (see Box on “Calcrete”). Soil forming processes, which are commonly found in
the central highlands of Namibia, are mostly associated withsaprolite weathering. Morphologically, such soil profiles aredivided into a lower part with a more or less well pre servedpetrographic substructure of the bedrock material, and intoan upper part, dominated mainly by disintegrated rock mate-
25
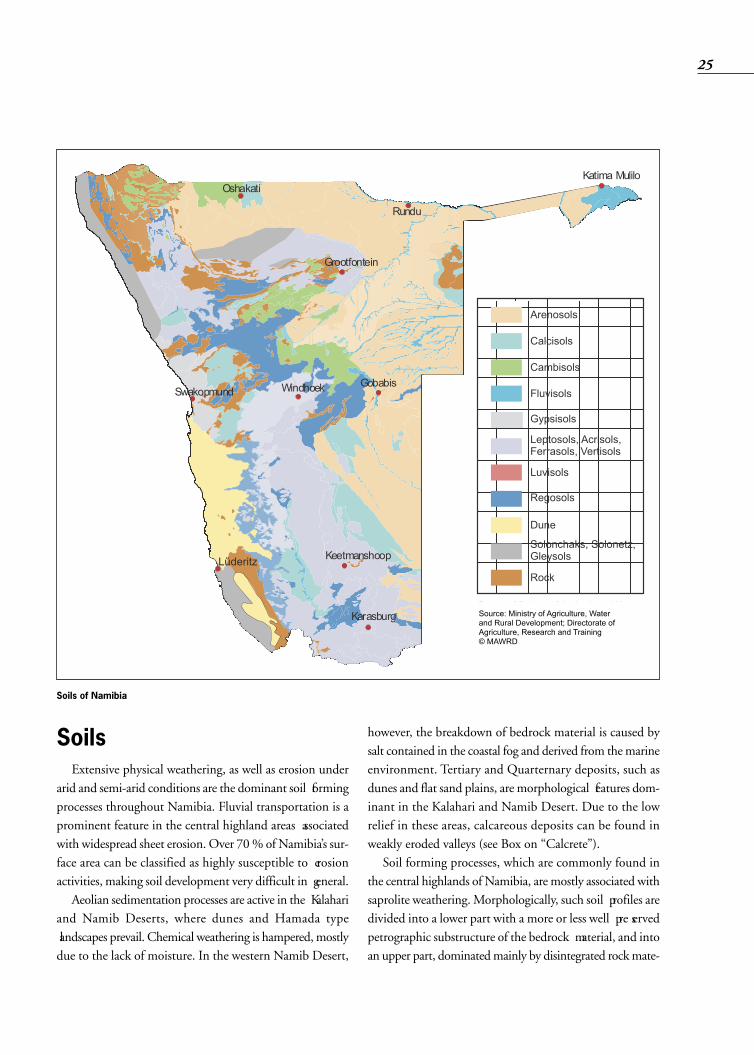
Soils of Namibia
Source: Ministry of Agriculture, Water
and Rural Development; Directorate of
Agriculture, Research and Training
© MAWRD
rial. The saprolite materialcan reach up to several tensof metres in thickness and isdependent on the accom-panying relief position,dominated by its erosiongradient and the geologicalsubstratum. According to the FAO
soil classification system, outof the 30 major reference soilgroups the following dooccur throug hout Namibia:Acrisols, Arenosols, Calcisols, Cambisols, Ferralsols, Flu-visols, Gleysols, Gypsisols, Leptosols, Luvisols, Phaeozems,Regosols, Solonetz, Solonchaks and Vertisols. By far themost common soils are Regosols, Arenosols and Luvisols.Their main characteristic features include: high sand stra-tum, low nutrient content, low organic content, alkalinepH-conditions, typical for arid climate conditions with highevaporation rates, as well as high salinity. These soil groupsin Namibia almost follow the major geomorphological andgeological boundaries. The largest variety of different soilgroups such as Cambisols, Luvisols, Acrisols, Regosols,Gleysols, Solonchaks and Solonetz, occurs within the coastalzone, the Namib and the Kalahari areas, whereas the cen-tral mountainous plateau, between the Namib and the Kalahari Basin, is dominated mainly by Acrisols, Cambisolsand Luvisols. Along Namibia’s permanent rivers, i.e. the Okavango,
Zambezi, Kunene, Kwando-Linyanti -Chobe and theOrange rivers, Acrisols, Arenosols, Fluvisols, Regosols, Luvisols and Cambisols are common at various levels adjacentto the rivers on terraces and floodplains.
VegetationThree major vegetation zones, namely: deserts, savannas
and woodlands, are dominant in Namibia. They are furtherclassified into 14 subdivisons, which are determined accord-ing to major physiographical characteristics such as geology,topography and climate, and do follow their respective
boundaries (after Giess,1971, in Barnard, 1998).Woodlands and forestsavanna make up the majortypes of woodland and coverthe more humid north-east-ern regions of Namibia.They also occur along allperennial rivers and themore common dry riverbeds, due to more favour -able moisture conditions allyear round. A variety of
savanna type vegetation covers most of the country, of whichhighland, thornbush and mountain savannas are the mostdominant ones to occur in the central highlands, and shruband mopane savannas are to be found more frequently inthe central southern parts, the Kalahari Sandveld and in thenorth-western parts of the country. The desert as the remaining vegetation zone is divided
into the northern, central and southern Namib Desert,which includes the succulent steppe vegetation zone influ-enced by winter rainfall. A more prominent semi-desertand savanna transition zone divides the Namib Desertfrom the savanna vegetation type along the Namib Escarp -ment.
PopulationNamibia’s current (2001) total population is estimated
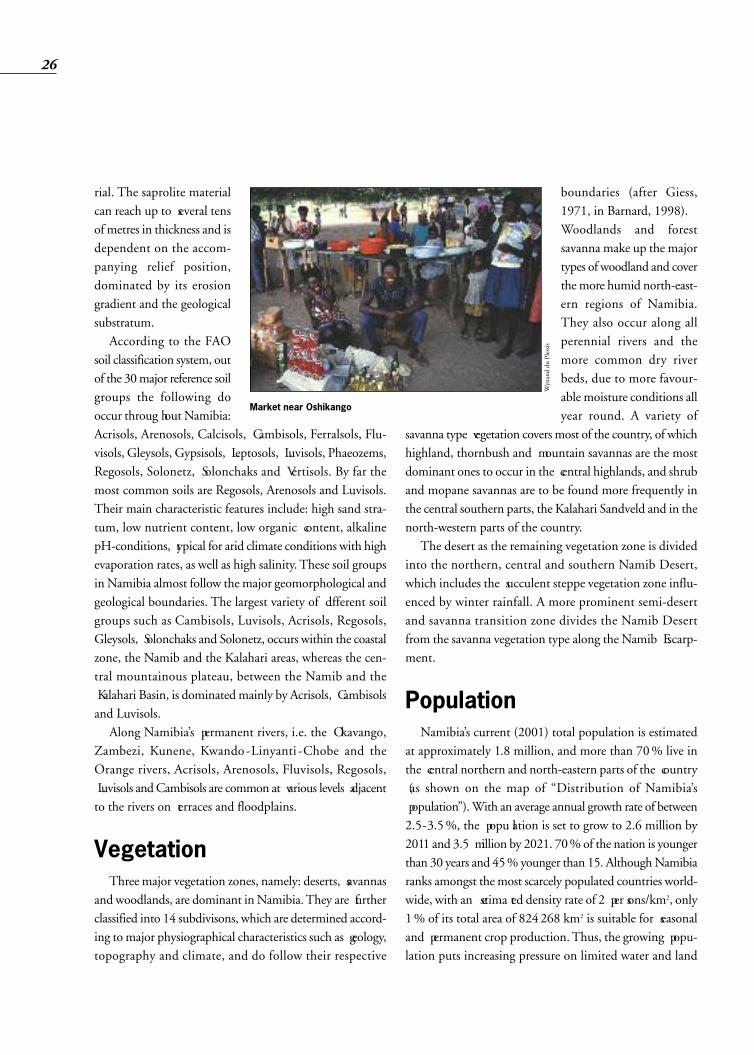
at approximately 1.8 million, and more than 70% live inthe central northern and north-eastern parts of the country (as shown on the map of “Distribution of Namibia’s population”). With an average annual growth rate of between2.5-3.5%, the popu lation is set to grow to 2.6 million by2011 and 3.5 million by 2021. 70% of the nation is youngerthan 30 years and 45% younger than 15. Although Namibiaranks amongst the most scarcely populated countries world-wide, with an estima ted density rate of 2 per sons/km2, only1% of its total area of 824268 km2 is suitable for seasonaland permanent crop production. Thus, the growing popu -lation puts increasing pressure on limited water and land
26
Market near Oshikango
Wynand du Plessis

resources, health and education services, on the environmentand on the adult working population. Rapid urbanisationand an ever increasing number of young people movingfrom rural areas to the few large settlements, towns and cities,will require well developed water management strate gies tosecure even basic living standards for Namibia’s growingpopulation.
AgricultureNamibia’s agriculture is dominated by livestock farming.
Limited productive soils are common and these togetherwith the low average rainfall of between 200-400 mm, as
well as the extreme arid to semi-arid climatic and physio-graphic conditions, place severe limitations upon the country’s agriculture. Cattle farming and crop productionare mainly practised in the north of the country, wherethe rainfall exceeds 500 mm. Central Namibia, where meanrainfall figures vary between 200 and 400 mm, is suitablefor livestock farming in general (cattle, sheep and goats),whereas the arid south-central and southern parts of thecountry, with a mean annual rainfall of between 50 and 300mm, are only suitable for small stock farming. Major com-mercial irrigation farming takes place along the OrangeRiver, at the Naute and Hardap Dams, and in the Stampriet,Tsumeb and Grootfontein districts.
27
Distribution of Namibia’s population

To a lesser extent, cash crops are irrigated within the -so-called maize triangle between Grootfontein, Otavi andTsumeb; along the Okavango and Zambezi rivers as well asclose to many dry river beds throughout the country. Small-scale irrigation is also practised by various communities,mission stations and farm holdings, using fountain and borehole water to cultivate a variety of crops for own con-sumption. In 2000, irrigation from groundwater amountedto 30Mm3/a (see irrigation symbols on the Map), and thereare plans to develop further irrigation from groundwater.However, this must be considered uneconomical and unsus-tainable for the scarce groundwater resources. Namibia stillimports more than 80 % of its fruit and vegetable fromSouth Africa, although the potential for increased irrigationfrom surface water resources exists. Prohibitive factors how-ever, are the lack of management capacity and funding forthe comparatively expensive investment of adequate, water-saving irrigation equipment and technology.The important physical conditions of soils being utilised
for irrigation include permeability, infiltration rate, fieldcapacity, texture and water-holding capacity. Generally, soilsused for crop irrigation in Namibia do have high sand andlow fertility rates and low organic content, all of whichrequires proper soil management. Salinity, high evaporationrates and extreme erosion pose additional dangers. Although water resources are well managed, severe
droughts in the past have unfavourably influenced productionfigures for agricultural commodities. Agriculture’s total contribution to Namibia’s Gross Domestic Product (GDP)is between 9-10 % on average, of which 75- 80 % can beattributed to extensive cattle farming activities, thus makinglivestock the major commodity within agriculture’s totalGDP contribution.
Mining, fisheries andtourismNamibia’s economy rests on three important pillars,
namely mining, fisheries, and agriculture. Only limited ben-eficiation of raw materials is taking place, and Namibiadepends heavily on imports of manufactured goods and
technology, while it exports minerals, fish and beef. Mining has long been the backbone of the Namibian
economy and still today is the major contributor to GDP(12%) and export revenues (40%), as well as taxes paid intothe Government coffers. Mining is also an importantemployer in Namibia. By far the most important mineralcommodity is the diamond, mined in the south-westernpart of the country, as well as in unique offshore operations.So far, more than 70 million carats of diamonds have beenproduced in Namibia, the vast majority of which are of gem-stone quality, placing the Namibian deposits amongst thebest in the world. Namibia is also one of the world’s principal uranium pro-
ducers, and the Rössing Uranium Mine operates the world’ssecond largest open pit uranium mine near Swakopmund.Base metal mining has a long tradition in Namibia, withcopper being the most important metal followed by leadand zinc. A gold mine operates near Karibib. The Namib-ian industrial minerals production comprises a range of com-modities, including fluorite, salt and wollastonite. Namibiaproduces a range of dimension stones, including marble,granite and sodalite.Commercial marine fisheries is an important sector of
the Namibian economy. The Benguela Current off theNamibian coast is one of the most productive marine systems,second only to the Humbold current off South America.However, over-exploitation of pelagic fish between 1960and 1980, when Namibia had no control of her marineareas, led to a collapse in the populations of several species.Stringent management after Independence has accountedfor some recovery, and the contribution of fisheries to GDPhas risen to 10 %. Like mining, fisheries is an importantemployer. Tourism is an important growth sector in the Namibian
economy. The country boasts a variety of unique landscapesand splendid wildlife. The vast open spaces in Namibia’ssparsely populated areas allow the experience of solitude anddirect contact with nature, especially appreciated by trav-ellers from the overcrowded centres of Europe and elsewherein the world. Coupled with the well developed infrastruc-ture and abundant accommodation, from camp sites to 5star hotels, this makes the country a prime tourist desti-
28

nation. Namibia is linked to Europe by regular flights,and via Johannesburg, South Africa, to all major centresin the world. In this context, eco-tourism plays an ever increasing role.
This gives the country a good opportunity to develop itscommunity-based tourism ventures, which already bringsa lot of benefit for the local people in remote areas, who otherwise have little access to economic activities other thansubsistence agriculture. In turn, it gives the tourist the oppor-tunity to become acquainted with the Namibian way of life.Tourism currently directly contributes 3% to GDP, how-
ever indirect contributions also occur. This figure representsa growth of 100% in the last decade, and is certainly set toincrease even further, as tourism develops in Namibia.
GIC SCHNEIDER, MB SCHNEIDER, AL DU PISANI
29
Etendeka Mountain Camp in a scenic area dependent on very limited groundwater supplies
FURTHER READING
• Statistical Abstract 1999. National PlanningCommission. Central Bureau of Statistics, No. 6,Windhoek.
• Atlas of Namibia (in print). Ministry ofEnvironment and Tourism. Directorate ofEnvironmental Affairs. Windhoek.
• Giess W. 1971. A preliminary vegetation map ofSouth West Africa. Dinteria, 4.
• Schneider G IC (in print). The Road-SideGeology of Namibia. Sammlung Geol. Führer.Schweizerbarth, Stuttgart.
• The Mineral Resources of Namibia (1992).Ministry of Mines and Energy, Geological Survey.Windhoek.
Kevin Roberts

5.0
30
Essentials of Groundwater

31
Wynand du Plessis

This chapter describes someof the general features of the hydro -geological environments in whichground water occurs. This shouldhelp the reader to understand thechapters that provide a more detailedaccount of the geology related towater bearing formations, the occurrence of ground-water, and the water supply potential of the aquifers. The occurrence of groundwater is closely associated with
the rock formations making up the crust of the earth. Whenthese three-dimensional bodies of rock contain undergroundwater, they are called “aquifers”. These aquifers have uniqueproperties dependent on internal and external factors con-trolling their size, capacity, the groundwater flow regime,the quality of the groundwater and their long-term sustainable safe yield potential.
Groundwater potentialThe potential of an aquifer to yield a certain quantity
of water with a certain chemical quality at a certain ratedepends on its size, the volume of water that can be stored,(called the storage capacity) the chemical composition ofthe rocks that the water comes into contact with, the vol-ume of water moving through the aquifer system per time
unit (called the flux), the water avail-able to replenish or recharge the aquiferand the water flowing out of the s ystem(called the discharge). The rechargeis normally from rainfall and runoffseeping into the aquifer while the dis-charge can be natural or man-made.Natural discharge takes place at springs
or seeps. Man-made discharge is caused by collecting waterfrom wells that have been dug by hand or by pumping thewater out through boreholes drilled deep into an aquifer. The nature of the rocks underground determines if they
are water bearing, the quality of the accumulated water, andhow much groundwater there is. The storage capacity of anaquifer in a rock formation is determined by the percentageof open spaces in the rock that can collect water in com-parison to the total volume of the solid rock. This is calledthe porosity of the aquifer.In sand, the porosity may be as high as 20% because the
number of spaces between the sand grains are high. Theunconsolidated or poorly consolidated sand and gravel layersin sedimentary rocks generally form excellent aquifers,but the stored volume of groundwater depends on the thick-ness of the rock saturated with water. The quantity of ground-water stored in fractured aquifers is usually much less, becausethe space is confined to cracks, fissures and fractures in anotherwise solid mass of rock. An important variation in fractured hard rock aquifers
are the carbonaceous rocks in which the fractures have beenenlarged by the chemical solution of the rock in the waterpercolating through the aquifer system. These aquifers arecalled karstified aquifers and the aquifers in the Grootfontein-Tsumeb-Otavi Mountain Land are typical examples. The rate at which water can flow through an aquifer is
called the permeability of the aquifer. In some deposits suchas clay, silt and fine sand the porosity may be high, butthe permeability is low because the capillary forces hold thewater confined in the rock mass. Aquifers with low perm -eability are called aquitards or aquicludes. In such cases it isdifficult or impossible to abstract the groundwater economically because a large number of large dia meter boreholes must be drilled and installed to obtain enough
32
A groundwater flow system with its input (recharge) and output(discharge)
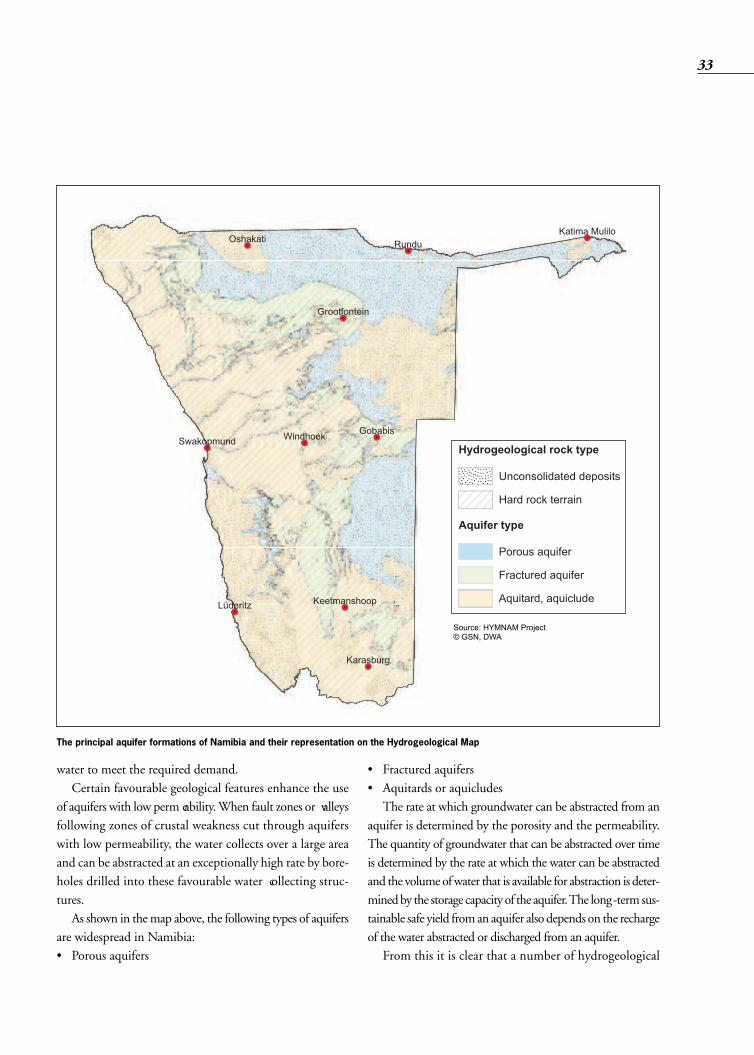
water to meet the required demand.Certain favourable geological features enhance the use
of aquifers with low perm eability. When fault zones or valleysfollowing zones of crustal weakness cut through aquiferswith low permeability, the water collects over a large areaand can be abstracted at an exceptionally high rate by bore-holes drilled into these favourable water collecting struc-tures. As shown in the map above, the following types of aquifers
are widespread in Namibia:• Porous aquifers
• Fractured aquifers• Aquitards or aquicludes The rate at which groundwater can be abstracted from an
aquifer is determined by the porosity and the permeability.The quantity of groundwater that can be abstracted over timeis determined by the rate at which the water can be abstractedand the volume of water that is available for abstraction is deter-mined by the storage capacity of the aquifer. The long-term sus-tainable safe yield from an aquifer also depends on the rechargeof the water abstracted or discharged from an aquifer.From this it is clear that a number of hydrogeological
33
The principal aquifer formations of Namibia and their representation on the Hydrogeological Map
Source: HYMNAM Project
© GSN, DWA

factors must be considered when looking at the ground-water potential and good structural geological knowledgeis imperative to site successful boreholes, especially in hardrock aquifers (see Box on “Borehole design”).Technical and economical aspects are also important.
These are, for example, the depth that a borehole must bedrilled into the aquifer, the type of pumping installationrequired, the depth at which the pumpset must be installed,the rate of abstraction possible from the aquifer, the pump-ing head to elevate the water to the surface and how muchwater can be abstracted on a sustainable basis.
Tapping and abstractingthe groundwaterTo use groundwater usually requires investments to drill
a borehole and to install a pumpset to abstract the water.Springs are certainly the lowest cost option. Where ground-water naturally appears on the surface, it can be harnessedalmost for free, as a gift of nature. However, to meet growingdemand and to provide clean spring water, investments arerequired to fence the springs, or deepen the pond and capturethe discharge in a reservoir. The potential value of springs asa source of low cost water supply has given rise to a new data-base in which information on spring locations, dischargeyield and flow regime (perennial or seasonal), water qual-ity, technical installations and water use are kept. This data-base must be continuously updated and expanded, sincesprings are ecologically and hydrogeolo gically very impor-tant sensitive points, that can provide integrated informa-tion about the groundwater systems that feed them. Whena spring ceases to flow, the consequences can be dramatic.People and animals lose a reliable source of drinking watersupply and an important aquatic habitat is lost. For thescientist, this is a clear indication of alarm that somethinghas happened to the groundwater flow system feeding thespring, e.g. the balance between recharge and spring dis-charge has been disturbed by drought, climate change, or byhigh groundwater abstraction in the vicinity of the spring(see Box on “Groundwater-fed wetlands”). Where groundwater levels are close to the surface, shallow
wells can be dug by hand. The isoline of 20 metres depthto the groundwater table is shown on the Map, indicatingwhere groundwater levels are regionally shallow. The isolineof 100 m is also shown, to delineate areas where the ground-water is very deep. Everywhere else, the depth of the watertable varies widely, depending on the topography and geol-ogy, but good site-specific predictions can be obtained fromprofessional hydrogeologists. Groundwater resources lyingdeeper underground are tapped by boreholes or wells. Bore-holes have a designed installation and are built to use ground-water on a long-term basis (see Box on “Borehole design”). Since the groundwater table generally follows the surface
topography, it is clear that groundwater is found at moreshallow depths in valleys while higher up in the hills andmountains the groundwater is much deeper. However, undercertain favourable conditions (in a confined aquifer) ground-water at depth, might be under pressure and come up closeto the surface, even in a deep well. This is often encounteredin a multi-layered sedimentary basin where the aquifer issealed at the top by low permeable beds, and its pressurerelates to the higher lying recharge areas at the margin ofthe basin or in hard rock areas where confined groundwa-ter from a deep fracture zone is struck. In some areas ofNamibia, e.g. in the Stampriet Basin, the Malta höhe- or theOshivelo area, groundwater tapped in deep wells need notbe pumped because the water flows out freely from the bore-hole due to the high pressure head, thus forming an arte-sian well. Artesian and sub-artesian zones are delimitedon the Hydrogeological Map.
Sustainable use of ground-waterIt is a clear objective of water resource management in
Namibia to use the groundwater resources on a long-termsustainable basis, without causing environmental damage.This implies that the full storage potential of a ground watersystem is not utilised, but merely the long-term annualrecharge determined from water balance calculations.
According to the overall water balance of Namibia, it isestimated that on average only 2 % of the annual rainfall
34

35
Importance and vulnera -bility of groundwater-fedwetlandsGroundwater supports many of Namibia’s wetlands.
Perennial rivers only occur along the northern and south-ern borders of the country and other surface water is seasonal or restricted to impoundments. The riparian zones of ephemeral rivercourses, sinkhole
lakes, springs, seeps and waterholes are all examples of wetlands fed by groundwater. Such wetlands provideresources to wildlife, livestock and people throughoutNamibia and have a significance far greater than their waterproduction alone. They are oases of resources, providing ahabitat, shelter and food in otherwise dry surroundingsfor a variety of plants and animals. Many of these are spe-cially adapted organisms not found anywhere else, such asthe Otjikoto tilapia, Tilapia guinasana, that occurs onlyin sinkhole lakes and the blind cave catfish, Clarias cavernicola, found only in Aigamas Cave in the Karst area,both endemic to Namibia. Springs are often ancient in human terms and all those in
Namibia are sites of archaeological interest and early settlement.
Threats to groundwater-fed wetlandsSprings and ri pa rian zones are often threatened by human
use. As natural focal points in the arid landscape, promis-ing water, shade and food, they attract human activity. Becausethey are small, spring-fed wetlands are vulnerable to activi-ties that can reduce their natural re source value and decreasebio di versity. Some activities can destroy a wetland or causethe extinction of endemic species.Lowering of groundwater levels through over-
abstraction Permanent springs can become temporary and riparian
trees and floodplain vegetation die. The size of wetlands canbe reduced and biodiversity lost. Pollution Diesel pump leaks, faeces and insecticides easily pol-
lute springs and pools because of the small total volume andflow. Grazing and trampling by livestock can quickly destroythe habitat of small wetlands and riparian zones.Alterations to springs Dams, capping, blasting and drains are often attempted
to “improve” springs. These activities can reduce the wet-land area, stop the water flow, kill aquatic life and cut offaccess for dependent wildlife.DevelopmentsTourist lodges, houses, dams or mines near springs scare
wildlife away. Pesticides to control water-borne disease vectorsand even lights can eliminate local populations of usefulaquatic invertebrates. ImpoundmentsBuilding dams on ephemeral rivers can cut off natural
floods and reduce groundwater recharge to downstreamaquifers and floodplains on which riparian vegetation, people,livestock and wildlife depend, e.g. Oanob Dam and thedownstream Rehoboth camelthorn woodland. Tourism People often camp at spring pools in remote areas. This
may reduce access for wildlife and cause pollution and dis-turbance. Tourists may unwittingly bath, and even washtheir vehicles, in springs causing pollution. Although onegroup may only spend a single night at a spring, it is likelythat other groups will soon follow.
K ROBERTSGemsbokbron, Skeleton Coast Park
Shirley Bethune
Borehole designA borehole is a hydraulic structure that permits
the abstraction of water from an undergroundwater bearing formation. Since boreholes are drilledinto the ground and some of the equipment toabstract the groundwater is located underground,the capital investment in the installation is onlypartially visible. As boreholes are rather expensiveinfrastructures, they must be properly designed,constructed and installed to ensure a long ser-vice life and the most economic operation. Ifthis is not done properly it will result in an inef-ficient water yield and high pumping costs. In thelong run this will be a very expensive mistake. Thedevelopment of a successful borehole is achievedthrough the joint efforts of hydrogeologists, drillersand engineers. The hydrogeologist sites the bore-hole, supervises the drilling and designs the bore-hole once it has been drilled. The driller uses themost appropriate drilling technique and materi-als for a particular hydrogeo log ical environment.The engineer takes advantage of the hydraulic con-ditions of the borehole to design the equipmentto abstract the water in the most economical wayand to distribute the water to the users. Various drilling methods have been developed
to cope with different geological conditions rang-ing from hard rock environments such as graniteor dolomite, to unconsolidated sediments suchas alluvial sands or gravels. Borehole constructionusually comprises several activities of which thedrilling of the borehole is the most basic. Thisis followed by the installation of casing, wellscreens and the placing of filter packs as necessary.Then the borehole is developed to ensure that thewater is free of sand and that the sustainable max-imum yield is obtained. Grouting can also bedone to provide a sanitary seal to protect the waterin the borehole from contamination. Private bore-holes are usually drilled only until enough waterhas been struck and further cost is avoided. How-
creates surface runoff, and only 1% contributes to ground-water recharge. However, this does not take regional surfacedifferences into consideration. Certain rock types exposed atsurface are impermeable and no water can infiltrate, but oth-ers are capable of absorbing and storing virtually all excessrainfall which is not lost to direct evaporation or evapo- transpiration. In these areas almost no surface water drainagesystem develops. Predominant examples are the Otavi Mountain Land with its karstic aquifers and the area coveredby calcrete or dune-sand in the Stampriet Artesian Basin.Recharge to groundwater systems is difficult to measure.
It depends on a complex variety of factors, such as rainfallintensity, soil conditions and soil moisture, the slope or gra-dient of the surface topography, vegetation cover and landuse, depth of the water table and, of course, the charac -teristics of the underlying aquifer. This implies that the samerainfall event can produce different amounts of recharge,not only for different hydrogeological environments (sandcover, sandstone, granite, calcrete or dolomite terrains), butalso whether it falls on a plain or in the mountains. Lesswater infiltrates during the growing season when vegetationcover is denser and plants take up water for growth and tran-spiration.Stable and radioactive isotopes in atmospheric water, soils
and groundwater are often used to determine the age ofgroundwater and its recharge. The safest way to computethe recharge, however, is by hydrogeological model ling ofthe water budget of a groundwater flow system, providedits size and aquifer parameters as well as the cumulative dis-charge abstracted from the system are suffi ciently known.The aquifer parameters, such as permeabil ity, transmis sivityand storage coefficient can be analysed from pumping testsof boreholes. The abstraction from boreholes must be con -tinuously monitored. The correct design, construction andinstallation of boreholes is crucial to successful ground waterabstraction (see Box on “Borehole design”).In general, there is a strong correlation between rainfall and
recharge. This is evident in comparisons of rainfall records andthe groundwater levels, monitored in many places in Namibia,by the DWA, NamWater and private land owners.In a semi-arid to arid country like Namibia, it is of crucial
importance that groundwater abstraction volumes are known
36
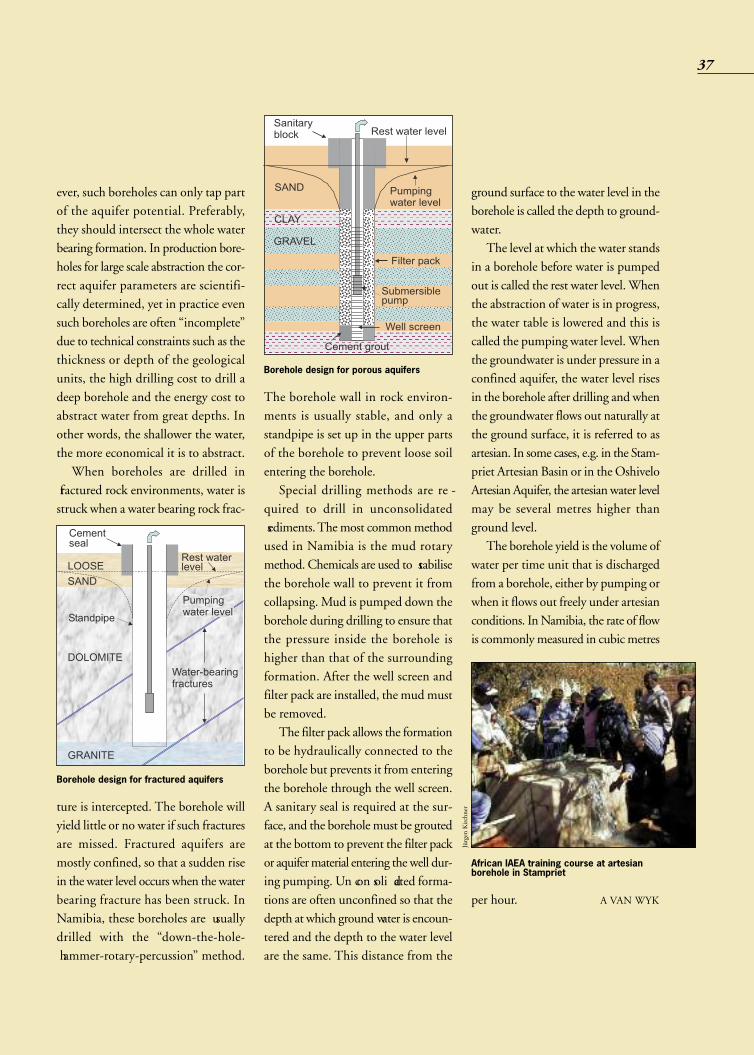
The borehole wall in rock environ-ments is usually stable, and only astandpipe is set up in the upper partsof the borehole to prevent loose soilentering the borehole. Special drilling methods are re -
quired to drill in unconsolidated sediments. The most common methodused in Namibia is the mud rotarymethod. Chemicals are used to stabilisethe borehole wall to prevent it fromcollapsing. Mud is pumped down theborehole during drilling to ensure thatthe pressure inside the borehole ishigher than that of the surroundingformation. After the well screen andfilter pack are installed, the mud mustbe removed. The filter pack allows the formation
to be hydraulically connected to theborehole but prevents it from enteringthe borehole through the well screen.A sanitary seal is required at the sur-face, and the borehole must be groutedat the bottom to prevent the filter packor aquifer material entering the well dur-ing pumping. Un con soli dated forma-tions are often unconfined so that thedepth at which ground water is encoun-tered and the depth to the water levelare the same. This distance from the
ever, such boreholes can only tap partof the aquifer potential. Preferably,they should intersect the whole waterbearing formation. In production bore-holes for large scale abstraction the cor-rect aquifer parameters are scientifi-cally determined, yet in practice evensuch boreholes are often “incomplete”due to technical constraints such as thethickness or depth of the geologicalunits, the high drilling cost to drill adeep borehole and the energy cost toabstract water from great depths. Inother words, the shallower the water,the more economical it is to abstract. When boreholes are drilled in
fractured rock environments, water isstruck when a water bearing rock frac-
ture is intercepted. The borehole willyield little or no water if such fracturesare missed. Fractured aquifers aremostly confined, so that a sudden risein the water level occurs when the waterbearing fracture has been struck. InNamibia, these boreholes are usuallydrilled with the “down-the-hole- hammer-rotary-percussion” method.
37
Borehole design for fractured aquifers
Borehole design for porous aquifers
ground surface to the water level in theborehole is called the depth to ground-water. The level at which the water stands
in a borehole before water is pumpedout is called the rest water level. Whenthe abstraction of water is in progress,the water table is lowered and this iscalled the pumping water level. Whenthe groundwater is under pressure in aconfined aquifer, the water level risesin the borehole after drilling and whenthe groundwater flows out naturally atthe ground surface, it is referred to asartesian. In some cases, e.g. in the Stam-priet Artesian Basin or in the OshiveloArtesian Aquifer, the artesian water levelmay be several metres higher thanground level. The borehole yield is the volume of
water per time unit that is dischargedfrom a borehole, either by pumping orwhen it flows out freely under artesianconditions. In Namibia, the rate of flowis commonly measured in cubic metres
per hour. A VAN WYK
African IAEA training course at artesianborehole in Stampriet
Jürgen Kirchner

water over-abstraction, but can be a warning sign. In prop-erly managed groundwater systems, abstraction from stor-age and declining water levels may be permis sible to sustainthe water demand during drier periods, provided it causesno lasting environmental damage (see Box on “Vulnerabilityof groundwater-fed wetlands”). The system can then berecharged in future wetter periods and the water levelscan recover completely.
38
and measured, to avoid over-abstraction and environmentaldamage. This requires that groundwater users are listed,receive a license to use the groundwater and that they areobliged to measure their abstraction and report it. This,together with independent records from a groundwater mon-itoring programme, ensures that aquifers are used in a bal-anced and sustainable manner. Lowering of water levels alone is not clear proof of ground-
Correlation between rainfall and water level, in different groundwater regions in Namibia
Source: C Wessels, NamWater
39
“hidden groundwater treasure”. There are numerous exam -ples world-wide, where precious groundwater resources thatare invaluable assets for the water supply to both the environ -ment and future generations, have been damaged or madeuseless by pollution resulting from inappropriate agri culturaland industrial land-use activities above or upstream of impor-tant groundwater systems.Despite a good environmental policy protecting bio -
diversity and ecosystem functioning in Namibia and successful environmental assessment programmes, a deficitremains regarding the protection of known and potentialgroundwater resources. The potential hazard for contami-nation of groundwater systems from private, municipal andindustrial activities, particularly the discharge of waste watereffluents, the use of landfills and refuse dumps, must beassessed (see Box on “Groundwater and waste disposal”).
The same applies for more diffuse contamination fromintensive agricultural activities. Similarly the threats to ground-water-fed wetlands must be assessed and taken into consideration in any future development of these as a potentiallow-cost water supply alternative (see Box on “Importanceand vulnerabiliy of groundwater-fed wet lands”).
G CHRISTELIS, P HEYNS, W STRUCKMEIER
Another clever option to manage water resources inNamibia is to transform surface water into groundwater.Open water surfaces, e.g. lakes or dams, are extremely proneto evaporation and this loss of water may be as high as 70%.Therefore, techniques to store water underground to pro-tect it from evaporation and to enhance recharge have beendeveloped and used in Namibia since the beginning of thecentury. Simple options are the construction of sand storagedams and ground weirs in river beds. All these traditionaltechniques of harvesting surface water and groundwaterwere to ensure wise water use. This is thoroughly reviewedby Lau & Stern (1990).A larger, more sophisticated artificial groundwater
recharge scheme has been built in the lower reaches ofthe Omaruru River. Here, the Omaruru Delta (Omdel)ground water scheme is recharged from an impoundmentwith a storage volume of 41.3 million m3 when full. Surfacerunoff collects in the dam upstream from the aquifer, whereonce the silt has settled out, the water is then slowly releasedinto infiltration basins downstream of the dam. Bore -holes are used to abstract this enhanced, recharged ground-water from the Omaruru Delta Aquifer. This innovativescheme forms part of the water supply to the central coastalarea.
Vulnerability and protectionNamibia is the most arid country in southern Africa,
making the surface and groundwater resources all the moreimportant and vulnerable to pollution and over-utilisation.To guard against this, a vulnerability assessment must becarried out before any development of the resources. Thefindings and mitigating measures must be applied in themanagement strategy to ensure the protection of theresources. Although groundwater resources are, to a certainextent, naturally protected underground, they too arevulnerable to certain pollutants and hazards. The quantita -tive aspect of vulnerability, e.g. over-abstraction, miningand drying up groundwater systems, is covered on the previous page. The quality of a groundwater system might be endan -
gered or destroyed by inappropriate or no protection of the
FURTHER READING
• Lau B & C Stern. 1990. Namibian WaterResources and their Management – A preliminaryHistory. Archeia, No.15. Windhoek.
• Jacobson P J, K M Jacobson and M K Seely.1995. Ephemeral Rivers and their catchments:Sustaining people and development in westernNamibia. DRFN, Windhoek.
• Bentley S P (Ed). 1996. Engineering geology ofwaste disposal. Geological Society EngineeringGeology Special Publication, No. 11. London.
• Tarr J. 2002. Water pollution. A resource bookfor Senior Secondary learners in Namibia.National Water Awareness Campaign. MAWRD,Windhoek.

40
Groundwater andwaste disposal
Waste disposal by landfill is the mostcommon means of disposing of munic-ipal refuse, ash, garbage, building rub-ble as well as sludge from municipaland industrial wastewater treatmentfacilities. Radioactive, toxic and haz-ardous waste has also been buried.Water that runs over un covered wasteor infiltrates into buried waste can causecompounds to leach from the solidwaste. The resultant liquid is called theleachate. Leachate from waste disposalcan contain very high concentrationsof both organic and inorganic com-pounds. It can move as surface runoffduring the rainy season into drinkingwater supplies such as dams, lakes andrivers, or downward from a waste dis-posal site into underlying groundwa-ter systems and cause contamination. When leachate mixes with water, it
forms a plume that spreads in the direc-tion of the groundwater flow. With dis-tance from the source of the plume, theconcentration decreases due to dilu-tion, dispersion and retard a tionprocesses. The volume of leachate pro-duced is a function of the amount ofwater that percolates through the refuse.Waste disposal management must bedesigned to minimise the formation ofleachate and to control the leakage froma waste disposal site. Waste disposal in Namibia has been,
and still is, a neighbourhood dump onthe edge of a town, village or miningsettlement. All types of waste have been,and still are, being dumped in any read-
ily available hole or depression such asvalleys, sand and gravel quarries, andmarginal lowlands. Many of the siteshave been located near residential areasand water supply zones, resulting inhigh pollution and health risks. Dur-ing the planning of most of the wastedisposal sites still in use, no groundinvestigations were conducted and nei-ther were pollution risks and environ-mental protection taken adequatelyinto consideration. However, current state of the art
practices for selecting a suitable wastedisposal site, call for careful evaluationof climatic, environmental and geo -logical data. A desk study is undertakento gather pertinent data sets, and theseare used in the detailed site investiga-tions, data evaluation and risk assess-ment, taking into consideration social,economic and political interactions.Field studies are then undertaken forindividual sites and detailed data collected on the environmental andground models, the amount and typeof waste, and major industrial activi-ties. Potential contaminants from thewaste generatedare evaluatedwith respect totheir impact onfauna and flora aswell as theirpotential for sur-face and ground-water contamina-tion. Environmen-
tal geologicalmapping isundertaken to
obtain detailed qualitative ground datarequired for a safe, sound and economicsite design. The pathways of poten-tial contaminants such as faults, frac-tures, gullies and ephemeral rivers aredelineated to determine risks to sur-face and ground water. This de lineationof possible pathways is done throughfield geomorphological mapping,hydrological and geo technical evalu-ations. Laboratory studies on the min-eral composition of individual litholo-gies and geotechnical analyses of thesoil and rock samples are also carriedout.
Tsumeb municipal waste disposal sites Tsumeb has three municipal solid
waste disposal sites all situated to thesouth-west of the town. All are locatedon top of heavily fractured and par-tially karstified dolomite rock outcropsforming a major aquifer throughoutthe Otavi Mountain Land. Tsumeb receives a variable rainfall averaging 550to 600 mm/a and given the high infiltration rates typical for this Karst
Tsumeb open dumping sites
fractured dolomite
uncovered waste
Sindila Mwiya

41
area, groundwater recharge is relativelyhigh, too. Thus, all three municipalsolid waste disposal sites in Tsumeb areat risk of large-scale groundwater con-tamination.
Windhoek municipal solid waste disposal sites The Windhoek municipal solid
waste disposal sites are located in andaround the city. There are seven sites,of which six are for garden and buil -ding rubble (class three sites) and
Kupfer berg is theonly class one sitecapable of hand -ling hazardouswaste. The rain-fall for the Wind-hoek area ishighly variablebut averagesaround 400 mm
a year. The geo logy of the area consistsof mainly schist with quartzite. Noneof these sites are located on thequartzite with a good ground waterpotential. Never theless, at most of thesites there is a high risk of contami-nating surface water resources. Themain risk pathways are river valleysand gullies through which conta -minated runoff from the open dump-ing sites can reach drinking watersources such as dams.Gobabis municipal waste
disposal sitesThe Gobabis waste disposal site is
located to the south-west of the town.The area receives around 300-400mmof rain per annum. The geology con-sists of variable schists with quartzite.The open dumping area can influencewater quality, because the wind cantransport con taminants from the opendumping area to where these can thenbe transported further by surface run -
off to open water supplies such as dams.Municipal waste disposal and other
potential sources of water contamina-tion such as septic tanks, fuel storagetanks at service stations and mines willalways be of great concern. Under-standing the interactions of climate, envi-ronment and geology is vital for select-ing suitable waste disposal sites thatminimise the risk of contamination. Theresearch and development of know ledge-based systems in waste disposal tech-nology is an important tool that willensure the protection of ground- andsurface waters and limit the risks andimpacts of pollution. S MWIYA
Tsumeb open dumping sites: burning waste in a heavily fracturedold quarry
Windhoek’s waste disposal sites
Gobabis open dumping site
Landsat Thematic Mapper Image
Landsat Thematic Mapper (TM) band 1, 2 and 4 (false colour com
posite)
Sindila Mwiya

42
Hydrogeological Framework

43
Landsat Thematic Mapper Image

information provided in this chaptersummarises the state of know ledge onthe groundwater situation and com-plements the Hydrogeolo gical Map,which, to remain legible, portrays onlythe most pertinent hydrogeological fea-tures and detail. To know more, thereader is referred to the groundwater
and environment related literature, reports and data kept inthe files of the main co-operating partners for this Hydrogeological Map Project, i.e. the Department of WaterAffairs (DWA); the Geological Survey of Namibia (GSN);and the Namibia Water Corporation Ltd. (NamWater).The technical and professional terms used are explained
in the attached glossary. According to the Namibian classifi -ca tion system, groundwater quality ranges from Group Ato D. This classification system based on the concentrationof total dissolved solids (TDS) is explained in Annex 4. Areasin which poor quality groundwater occurs are shown byorange hatching on the Map.
44
Groundwater basins and their hydrogeological features
The country has been divided intotwelve hydrogeological regions basedmainly on geological structure andgroundwater flow. To avoid confusionwith political regions, these units arecalled “groundwater basins”. Theirboundaries were chosen to encompass areas of similar geologyand hydrogeology. This chapter describes the geologicalstructures, the lithological bodies and their hydrogeologi-cal properties, the groundwater quality as well as the useof the groundwater resources. For the well-known ground-water supply schemes run by NamWater, numbers referredto in Annex 1 are added in brackets.The sub-chapters have been written by groundwater
experts familiar with the various regions. They integrate theinformation on geology, drilling, geophysical investigationsand hydrogeology in the broader sense taking into con-sideration aspects of ground water quantity and quality. The
Groundwater basins and hydrogeological regions in Namibia
Source: HYMNAM Project
© DWA, GSN
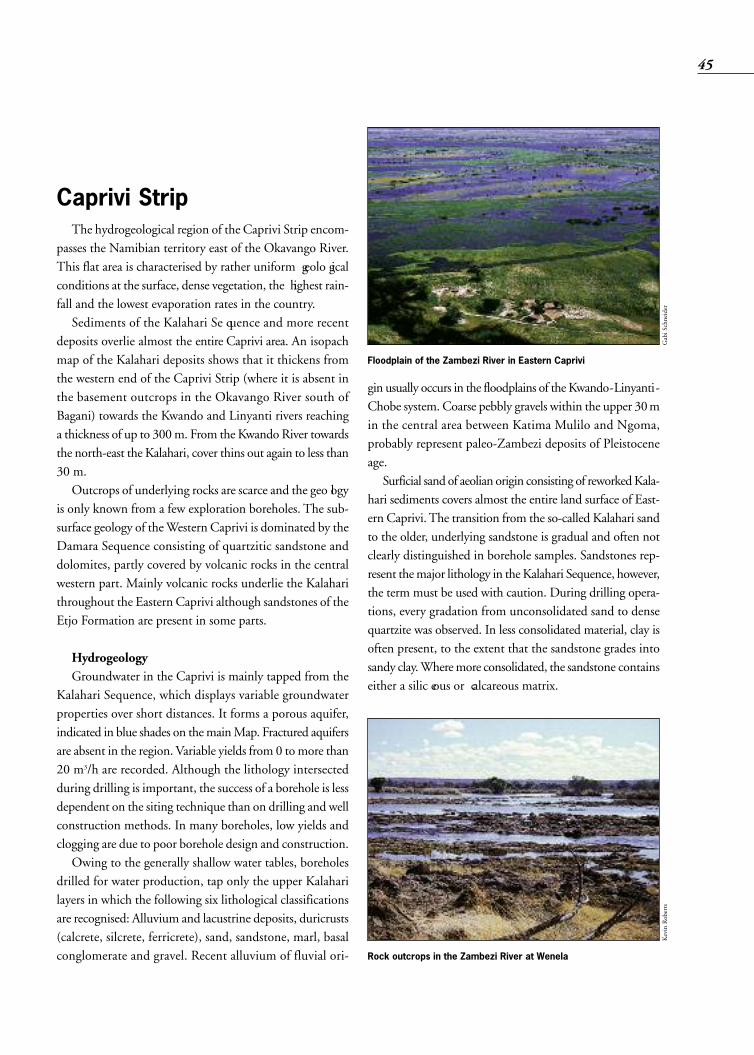
Caprivi Strip The hydrogeological region of the Caprivi Strip encom-
passes the Namibian territory east of the Okavango River.This flat area is characterised by rather uniform geolo gicalconditions at the surface, dense vegetation, the highest rain-fall and the lowest evaporation rates in the country.Sediments of the Kalahari Se quence and more recent
deposits overlie almost the entire Caprivi area. An isopachmap of the Kalahari deposits shows that it thickens fromthe western end of the Caprivi Strip (where it is absent inthe basement outcrops in the Okavango River south ofBagani) towards the Kwando and Linyanti rivers reachinga thickness of up to 300m. From the Kwando River towardsthe north-east the Kalahari, cover thins out again to less than30 m.Outcrops of underlying rocks are scarce and the geo logy
is only known from a few exploration boreholes. The sub-surface geology of the Western Caprivi is dominated by theDamara Sequence consisting of quartzitic sandstone anddolomites, partly covered by volcanic rocks in the centralwestern part. Mainly volcanic rocks underlie the Kalaharithroughout the Eastern Caprivi although sandstones of theEtjo Formation are present in some parts.
HydrogeologyGroundwater in the Caprivi is mainly tapped from the
Kalahari Sequence, which displays variable groundwaterproperties over short distances. It forms a porous aquifer,indicated in blue shades on the main Map. Fractured aquifersare absent in the region. Variable yields from 0 to more than20 m3/h are recorded. Although the lithology intersectedduring drilling is important, the success of a borehole is lessdependent on the siting technique than on drilling and wellconstruction methods. In many boreholes, low yields andclogging are due to poor borehole design and construction.Owing to the generally shallow water tables, boreholes
drilled for water production, tap only the upper Kalaharilayers in which the following six lithological classificationsare recognised: Alluvium and lacustrine deposits, duricrusts(calcrete, silcrete, ferricrete), sand, sandstone, marl, basalconglomerate and gravel. Recent alluvium of fluvial ori-
gin usually occurs in the floodplains of the Kwando-Linyanti-Chobe system. Coarse pebbly gravels within the upper 30min the central area between Katima Mulilo and Ngoma,probably represent paleo-Zambezi deposits of Pleistoceneage.Surficial sand of aeolian origin consisting of reworked Kala-
hari sediments covers almost the entire land surface of East-ern Caprivi. The transition from the so-called Kalahari sandto the older, underlying sandstone is gradual and often notclearly distinguished in borehole samples. Sandstones rep-resent the major lithology in the Kalahari Sequence, however,the term must be used with caution. During drilling opera-tions, every gradation from unconsolidated sand to densequartzite was observed. In less consolidated material, clay isoften present, to the extent that the sandstone grades intosandy clay. Where more consolidated, the sandstone containseither a silic eous or calcareous matrix.
45
Rock outcrops in the Zambezi River at Wenela
Floodplain of the Zambezi River in Eastern Caprivi
Gabi Schneider
Kevin Roberts

Lacustrine deposits are found inan extensive network of linear panslying east-north-easterly. These areseen as analogues of ancient, largerlake systems within the assumedbasin structure under lying a largepart of Eastern Caprivi. Marls gen-erally occur as thin horizons, up toseveral metres thick, and proba-bly represent rather isolated lenseswithin the succession of sandstones.
Groundwater use and qualityAlthough geophysical tech-
niques are less important for sitinghigh yielding boreholes in theCaprivi, they help trace ground -water quality. Generally, it is thechemical composition rather than the yield potential thatrestricts groundwater use. The water quality is highly vari-able throughout the region. Iron is a major concern, caus-ing a high percentage of water points to be classified as GroupD water. This can be effectively overcome through the useof low-technology iron removal systems. Good quality wateris generally found up to 5-20 km from the rivers, whichrecharge the aquifers. The water quality often deter ioratesrapidly away from the rivers and with increasing depth togroundwater. Recharge in the central part is low with mostof the water derived from precipitation. The velocity ofthe regional groundwater flow is extremely low.The Caprivi has been di vi ded into five hydrogeological
provinces displaying similar and consistent hydrogeologi-cal characteristics:The Caprivi -West Province stretches between the
Okavango and the Kwando rivers excluding a 20 km-widezone along these rivers. The water quality is usually good,groundwater can be located easily and is available in suffi-cient quantities. The depth to water level deepens towardsthe west and is mostly too deep for handpump installations.The military base at Omega (73) has a water supply schemebased on this aquifer. The thick Kalahari sediments obtainfairly regular recharge from rainfall and sustain a wellfield
of medium poten tial and GroupB water quality.The Kwando Province consists
of a 20 km-wide zone along theKwando River from the Angolanborder to the Samudono village.This province is recharged from theKwando River and borehole yieldsare mostly high. The water qualityis generally Group A, but risingiron concentrations can result inB-D Group quality.The Linyanti Province is a 20 km-wide zone north of the LinyantiRiver, stretching from Samudonoin the south-west to Lake Liambeziin the north-east. Water quality isgenerally poor, with elevated con-
centrations of sulphate and total dissolved solids. Highiron concentrations are also common, especially near LakeLiambezi. At Chinchimane (20), close to the Linyanti River,a water supply scheme was built, because the intermittentflow in the river threatened the surface water supply. Inthis area a layer of better quality water is sandwiched betweentwo layers containing poor quality water. The upper aquiferhas Group B-C water, but the lower aquifer (deeper than50m) is saline. The sediments consist of fine sand, silt andclay, that often contain organic matter, causing anaerobicconditions, an un pleasant smell, and deposits of “black mud”in the boreholes. The pumping rate of the wells is limited to2-4 m3/h to prevent the inflow of saline water from the loweraquifer.The Northern Province joins the Kwando Province and
the Linyanti Province east and north up to a line runningfrom Lake Liambezi to the Zambian border. Water qualityranges from Group A to D, with prob lems caused mainlyby sodium, sulphate and chloride, while iron concentrationsare generally low. Water levels are the deepest in the northernpart of this province, making it difficult to use conventionalhandpumps. Most of the groundwater development is along-side the B8 Golden Highway. The rest of the area is not welldeveloped and little water quality information is available.
46
After a hot day in the Caprivi, when Lake Liambezistill had water
Shirley Bethune
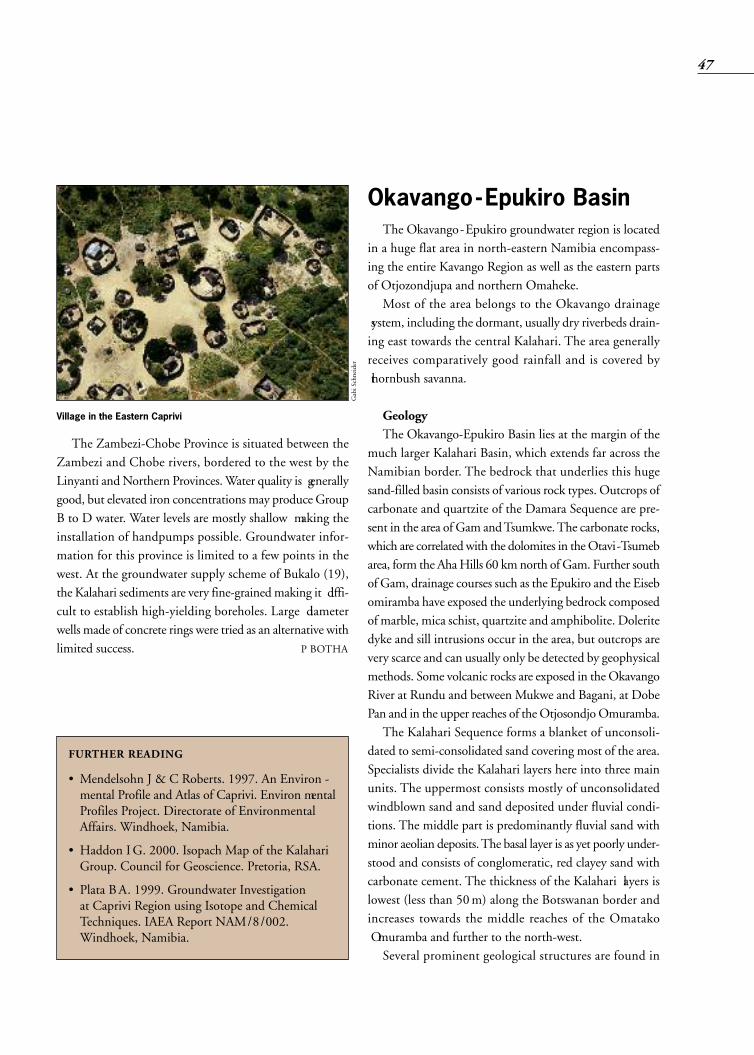
The Zambezi-Chobe Province is situated between theZambezi and Chobe rivers, bordered to the west by theLinyanti and Northern Provinces. Water quality is generallygood, but elevated iron concentrations may produce GroupB to D water. Water levels are mostly shallow making theinstallation of handpumps possible. Groundwater infor-mation for this province is limited to a few points in thewest. At the groundwater supply scheme of Bukalo (19),the Kalahari sediments are very fine-grained making it diffi -cult to establish high-yielding boreholes. Large diameterwells made of concrete rings were tried as an alternative withlimited success. P BOTHA
Okavango-Epukiro BasinThe Okavango-Epukiro groundwater region is located
in a huge flat area in north-eastern Namibia encompass-ing the entire Kavango Region as well as the eastern partsof Otjozondjupa and northern Omaheke. Most of the area belongs to the Okavango drainage
system, including the dormant, usually dry riverbeds drain-ing east towards the central Kalahari. The area generallyreceives comparatively good rainfall and is covered by thornbush savanna.
GeologyThe Okavango-Epukiro Basin lies at the margin of the
much larger Kalahari Basin, which extends far across theNamibian border. The bedrock that underlies this hugesand-filled basin consists of various rock types. Outcrops ofcarbonate and quartzite of the Damara Sequence are pre-sent in the area of Gam and Tsumkwe. The carbonate rocks,which are correlated with the dolomites in the Otavi-Tsumebarea, form the Aha Hills 60 km north of Gam. Further southof Gam, drainage courses such as the Epukiro and the Eisebomiramba have exposed the underlying bedrock composedof marble, mica schist, quartzite and amphibolite. Doleritedyke and sill intrusions occur in the area, but outcrops arevery scarce and can usually only be detected by geophysicalmethods. Some volcanic rocks are exposed in the OkavangoRiver at Rundu and between Mukwe and Bagani, at DobePan and in the upper reaches of the Otjosondjo Omuramba.The Kalahari Sequence forms a blanket of unconsoli-
dated to semi-consolidated sand covering most of the area.Specialists divide the Kalahari layers here into three mainunits. The uppermost consists mostly of unconsolidatedwindblown sand and sand deposited under fluvial condi-tions. The middle part is predominantly fluvial sand withminor aeolian deposits. The basal layer is as yet poorly under-stood and consists of conglomeratic, red clayey sand withcarbonate cement. The thickness of the Kalahari layers islowest (less than 50m) along the Botswanan border andincreases towards the middle reaches of the Omatako Omuramba and further to the north-west.Several prominent geological structures are found in
47
FURTHER READING
• Mendelsohn J & C Roberts. 1997. An Environ -mental Profile and Atlas of Caprivi. Environ mentalProfiles Project. Directorate of EnvironmentalAffairs. Windhoek, Namibia.
• Haddon IG. 2000. Isopach Map of the KalahariGroup. Council for Geoscience. Pretoria, RSA.
• Plata BA. 1999. Groundwater Investigation at Caprivi Region using Isotope and ChemicalTechniques. IAEA Report NAM/8/002.Windhoek, Namibia.
Village in the Eastern Caprivi
Gabi Schneider

north- eastern Namibia. The south-east trending Gam lineament is a major fault with a downward displacementof 200m on the southern side. The Eiseb graben extendsbetween the Eiseb and Elandslaagte omiramba and contains250m thick sand layers. Towards Otjiwarongo the north-east trending Waterberg thrust brought about an ab normalthickening of Kalahari sediments. Recent drilling in theGoblenz area penetrated more than 460m of Kalaharideposits.
HydrogeologyGroundwater within
the area is hosted in twodistinct aquifer systems,Kalahari aquifers andfractured bedrock aqui -fers. These two aquifertypes are treated sepa-rately here as they havedifferent characteristics.Kalahari aquifers holdwater in intergranularpore spaces, whereaswater in fracturedaquifers is held in cracksand fractures in other-wise impermeable strata.Kalahari aquifers arecommon in the north-eastern Otjozondjupaand Kavango regions. Innorthern Omaheke, theKalahari is generally non-saturated, but ground-water may be present infractures in the under -lying bedrock. Adjacentto the Botswana border,from Gam in the southto the Kaudom Park inthe north, bedrock for-mations crop out and
groundwater occurs in fractured aquifers.Drilling success rates, defined as the percentage of bore-
holes yielding more than 1m3/h, are commonly 100% inareas of known Kalahari aquifers, whilst the lowest successrates, of less than 25%, are common for fractured aqui fersbeneath thick unsaturated Kalahari layers. The most difficultareas to find groundwater are north and east of Otjinene.Groundwater in the Kalahari aquifers is relatively easy
to locate throughout most of the north-western and centralnorthern Tsumkwe district and the Kavango Region. Thesediments form an al most continuous permeable layer from
which generally lowyields can be abstractedvia bore holes. Factorsdetermining yieldinclude, va ri a tions inperme ability, satura tedthickness (often limitedby drilling depth) andborehole or well diame-ter and design. Shallowaquifers with water lev-els above 20m receivegood recharge eitherdirectly from rainfall orindirectly fromephemeral runoff.Deeper aquifers are recharged from theKalahari basin marginsand under lying fracturedaquifers. Groundwaterlevel elevation (piezo-metric surface) andhydrochemical evidencesuggest significant re -charge from the OtaviGroup dolomites in theTsumeb-Grootfonteinarea, e.g. to the Goblenzarea. Replenish ment ofthe deeper aquifers far
48
Natural rainwater pool with water lilies in the Khaudum Game Park
Wynand du Plessis
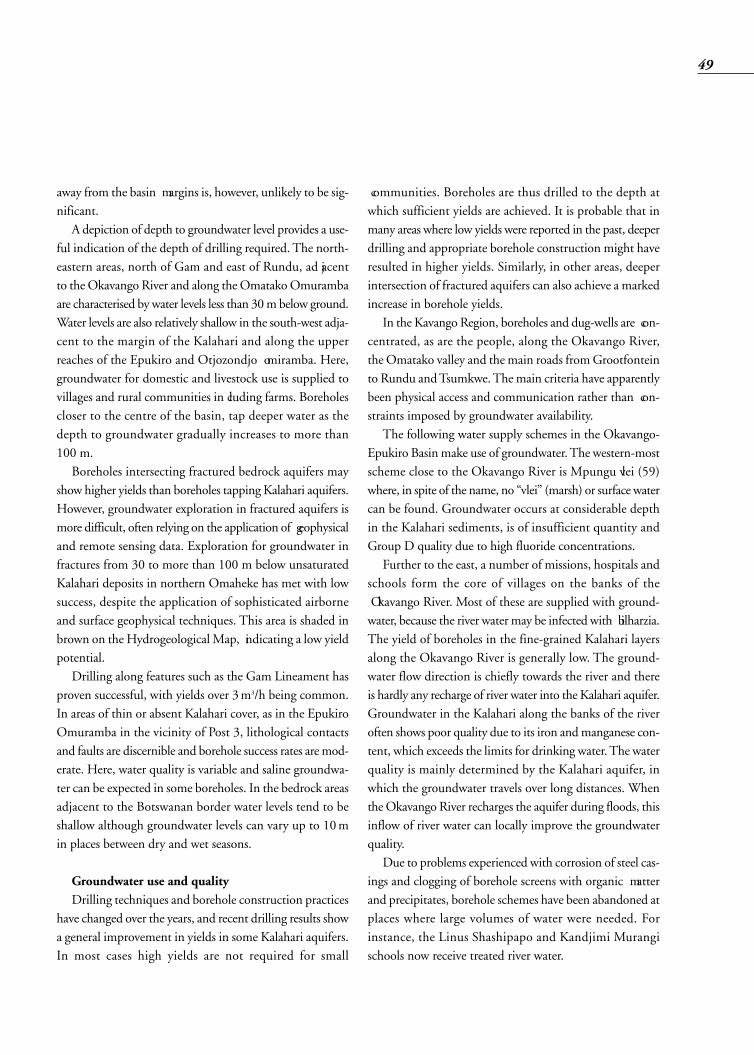
away from the basin margins is, however, unlikely to be sig-nificant.A depiction of depth to groundwater level provides a use-
ful indication of the depth of drilling required. The north-eastern areas, north of Gam and east of Rundu, ad jacentto the Okavango River and along the Omatako Omurambaare characterised by water levels less than 30m below ground.Water levels are also relatively shallow in the south-west adja-cent to the margin of the Kalahari and along the upperreaches of the Epukiro and Otjozondjo omiramba. Here,groundwater for domestic and livestock use is supplied tovillages and rural communities in cluding farms. Boreholescloser to the centre of the basin, tap deeper water as thedepth to groundwater gradually increases to more than100 m.Boreholes intersecting fractured bedrock aquifers may
show higher yields than boreholes tapping Kalahari aquifers.However, groundwater exploration in fractured aquifers ismore difficult, often relying on the application of geophysicaland remote sensing data. Exploration for groundwater infractures from 30 to more than 100 m below unsaturatedKalahari deposits in northern Omaheke has met with lowsuccess, despite the application of sophisticated airborneand surface geophysical techniques. This area is shaded inbrown on the Hydrogeological Map, indicating a low yieldpotential.Drilling along features such as the Gam Lineament has
proven successful, with yields over 3m3/h being common.In areas of thin or absent Kalahari cover, as in the EpukiroOmuramba in the vicinity of Post 3, lithological contactsand faults are discernible and borehole success rates are mod-erate. Here, water quality is variable and saline groundwa-ter can be expected in some boreholes. In the bedrock areasadjacent to the Botswanan border water levels tend to beshallow although groundwater levels can vary up to 10min places between dry and wet seasons.
Groundwater use and qualityDrilling techniques and borehole construction practices
have changed over the years, and recent drilling results showa general improvement in yields in some Kalahari aquifers.In most cases high yields are not required for small
communities. Boreholes are thus drilled to the depth atwhich sufficient yields are achieved. It is probable that inmany areas where low yields were reported in the past, deeperdrilling and appropriate borehole construction might haveresulted in higher yields. Similarly, in other areas, deeperintersection of fractured aquifers can also achieve a markedincrease in borehole yields.In the Kavango Region, boreholes and dug-wells are con -
centrated, as are the people, along the Okavango River,the Omatako valley and the main roads from Grootfonteinto Rundu and Tsumkwe. The main criteria have apparentlybeen physical access and communication rather than con -straints imposed by groundwater availability. The following water supply schemes in the Okavango-
Epukiro Basin make use of groundwater. The western-mostscheme close to the Okavango River is Mpungu vlei (59)where, in spite of the name, no “vlei” (marsh) or surface watercan be found. Groundwater occurs at considerable depthin the Kalahari sediments, is of insufficient quantity andGroup D quality due to high fluoride concentrations.Further to the east, a number of missions, hospitals and
schools form the core of villages on the banks of the Okavango River. Most of these are supplied with ground-water, because the river water may be infected with bilharzia.The yield of boreholes in the fine-grained Kalahari layersalong the Okavango River is generally low. The ground-water flow direction is chiefly towards the river and thereis hardly any recharge of river water into the Kalahari aquifer.Groundwater in the Kalahari along the banks of the riveroften shows poor quality due to its iron and manganese con-tent, which exceeds the limits for drinking water. The waterquality is mainly determined by the Kalahari aquifer, inwhich the groundwater travels over long distances. Whenthe Okavango River recharges the aquifer during floods, thisinflow of river water can locally improve the groundwaterquality. Due to problems experienced with corrosion of steel cas-
ings and clogging of borehole screens with organic matterand precipitates, borehole schemes have been abandoned atplaces where large volumes of water were needed. Forinstance, the Linus Shashipapo and Kandjimi Murangischools now receive treated river water.
49

The eleven schemes stilloperating along the Oka-vango River are from westto east: Nkurenkuru (63),Kahenge (39), Tondoro(97), Rupara (89), Buinja(17), Mupini (60), Kayeng-ona (46), a relatively newwater scheme with higherthan average pumping rates,Sambiu (90), Nyanganamission (64), where replacement boreholes with plastic casing were drilled, Andara mission (4) and Bagani school(11). The more dispersed distribution of water points and settlements in the north-eastern Otjozondjupa and northernOmaheke regions, is a consequence of poor groundwateravailability. The schemes at Rooidaghek (87) and Runduhek/Mururani gate (88) are used for veterinary border postson the roads from Grootfontein to Tsumkwe and Rundu.The Kalahari sediments in this area are up to 350 m thick,the aquifers are semi-confined and have low groundwaterpotential. Similar conditions apply to the police station atMaroelaboom (57) and the now defunct police station atTsintsabis (99). The settlement of Tsintsabis is located closeto the boundary with the Cuvelai Basin. Here the Kalaharilayers have very low yields and the water demand hasincreased to twice the sustainable yield.Four small water schemes are found further east towards
Tsumkwe: Aasvoëlnes (1), Mangetti Duin (56), M’kata (58)and Omatako (69). They supply settlements establishedat former army camps from 145-200m deep boreholes tap-ping low-yielding Kalahari aquifers. Tsumkwe (100), the centre of the former Bushman-
land is surrounded by pans and vleis. The area has a shallowwater table of 1-6m with groundwater occurring in Kalaharicalcrete and calcareous sand. The thin Kalahari sedimentsare underlain by basalt of the Kalkrand Formation. Thewater quality is variable. Two production boreholes haveGroup A water and the other two Group C water due tohigh fluoride concentrations. The yield of the scheme is in -sufficient to meet the town’s demand and extensions areplanned for the near future.
Bedrock outcrop areas suchas the Aha Hills nearTsumkwe and Gam are extremely vulnerable togroundwater contamina-tion. This is due to en hancedrecharge potent ial from shal-lower water levels, lack ofsoil cover and the domi-nance of fracture flow withinthese systems.
The water supply scheme of Goblenz (33) is located south-east of Grootfontein in an area where the rock formationsof the Karst region dip steeply to the south and disappearunder more than 460m of Kalahari sediments. The town was supplied with groundwater from deep boreholes with in -sufficient yields until it was linked to the Hereroland pipelinesystem in the late 1980s. However, the groundwater resourceswere recently re-evaluated and high-yielding boreholes estab-lished to supply Goblenz with groundwater in future. Thearea is considered to have high potential indicated in darkblue on the Map. The long-term sustainable yield of the Goblenz Aquifer has been assessed to be 2.7 Mm3/a, main-tained by diffuse groundwater flow from the dolomite rechargearea to the Kalahari sediment trough. Along the flow path,the radiocarbon age of the groundwater increases from afew decades to 3000-10000 years at Goblenz.The Otjituuo Reserve is supplied with 0.7 Mm3/a of
dolomite groundwater from two strong boreholes near BergAukas, east of Grootfontein.The Okakarara treatment plant, as part of the Eastern
National Water Carrier (ENWC), receives dolomite ground-water from Kombat Mine in the Otavi Mountains via theGrootfontein-Omatako Canal. It has a capacity of between3.2 to 3.5 Mm3/a. During the past four years (1998-2001),an average of 2.3 Mm3/a was pumped from the Kombat Minewater into the canal and treated at Okakarara. The treated watercan be piped to Otjituuo, as depicted in the Map.Okondjatu (68), a school village in the Otjinene district,
obtains water from a wellfield approximately 10 km north,where a low-yielding fractured aquifer is present in DamaraSequence meta-sediments beneath thick Kalahari layers.
50
Dryland agriculture and settlements close to the Okavango River
Wynand du Plessis

A group of old boreholes installed with wind pumps anddelivering Group C quality water was replaced with newwells showing better Group B water quality. Otjinene (81)is a town on the Eiseb Omuramba in the Omaheke Region.Kalahari sediments of about 80 m thickness overlie meta-sediments of the Damara Sequence. Production boreholeswere sited using geophysics to locate fractures in the bedrock,which promised higher yields. The water quality variesbetween boreholes from Group A to C. The scheme cur-rently comprises 11 boreholes and the sustainable yield issufficient to meet the demand.In the sandveld area of north-eastern Otjozondjupa and
northern Omaheke, groundwater resources in the Kalaharibeds and underlying bedrock are considered to require onlyminimal protection, as groundwater vulnerability here islow or negligible. Significant depth to the water table anda reasonable attenuation capability of the Kalahari sandsaccount for this.In terms of water supply, the former "Epukiro Reserve"
is a notorious problem area. The Kalahari sediments inthe area around Omawewozonjanda or Epukiro Post 3 (23)and Okovimburu/Post 10 (24) contain no groundwater.Water is only found in the underlying Damara rocks, mainlyin thin marble bands, on contact zones or fractured quartziteand schist. Finding these targets requires powerful geo-physical techniques to ensure at least a moderate success ratefor drilling. Forty boreholes were drilled at Post 3, of whichonly 6 can be used as production wells with yields of 1-4m3/h. Some boreholes are located on fractures crossingthe omuramba, but these aquifers usually show a highersalinity. The borehole yields at Post 10 are low, but the waterquality is better than at Post 3. West of Epukiro, the Plessis-plaas (85) police station is supplied from a low-yieldingaquifer in thin Kalahari layers.The Rietfontein (86) water scheme supplies a number
of farming communities along the Rietfontein River nearthe Botswanan border. The Kalahari cover is almost absentin this area exposing rocks of the Kamtsas Formation(Damara Sequence). The borehole yields are low to moderate and insufficient to meet the rising demand. Over-abstraction has caused a change in water quality fromGroup B to C. A SIMMONDS
Cuvelai - Etosha BasinThe Cuvelai-Etosha groundwater Basin is the Namibian
part of the Cuvelai River catchment. Perennial tributariesoccur only in Angola while in the Namibian part of thebasin, the oshanas flow only in the rainy season. Theseoshanas are shallow, often vegetated, poorly defined but areinterconnected flood channels and pans through which surface water flows slowly or may form pools depending onthe intensity of the floods (“efundja”). Water is also suppliedto Namibian villages and towns in the Cuvelai Basin fromCalueque Dam, just north of the Angolan border, via anextensive system of canals and pipelines.The Cuvelai Basin is bordered in the south and west
by the surface water divide running from Otavi to Outjo,Kamanjab, Otjovasandu, Otjondeka, Opuwo and Ruacana.In the east, the boundary is formed by a faint ground waterdivide running north from Tsintsabis almost at 18°E longi -tude, while in the north it is the international border betweenAngola and Namibia. The hydrogeological Cuvelai Basinthus comprises the Omusati, Oshana, Ohangwena, andOshikoto regions and parts of the Kunene Region. Most ofthe land surface of the basin is very flat dipping from some1150m above sea level (asl) in the north-east to 1 080m aslin the Etosha Pan, which is the largest pan in Namibia.All drainage is thus in the direction of the Etosha Pan.The Cuvelai Basin is the most densely populated area
of Namibia and most of the inhabitants live in rural com-munities dependent on agriculture. Rainfall decreases from600 mm/a in the north-east to 300 mm/a in the west. Inthe same direction, potential evaporation increases from2700 to 3000 mm/a. The relatively high and reliable rain-fall allows dryland crop farming in addition to cattle andsmall stock farming. Light industries and businesses havebeen established in towns like Oshakati and Ondangwa.
GeologyThe Cuvelai Basin, including Etosha Pan, is part of the
much larger Kalahari Basin covering parts of Angola,Namibia, Zambia, Botswana and South Africa. It con-tains a very thick series of rocks of various ages. The basinfloor consists of gneissic and granitic basement. Outcrops
51

of this occur in the Kamanjab Inlier along the south-west-ern rim of the basin (Fransfontein Granitic Suite andKhoabendus Group, 2 700 to 1700 Ma). Up to 8 000 m ofsedimentary rocks of the Nosib, Otavi and Mulden groupsof the late-Proterozoic Damara Sequence overlie this. Carbonatic rocks of the Otavi Group are found on thesurface in the mountain ridges south and west of the basin.The Damara Sequence is followed by 360 m of KarooSequence rocks ranging from Lower Permian to Jurassic(300 -130 Ma) and up to 600 m of semi- to unconsolidated
sediments of the Cretaceous to Recent (<70 Ma) KalahariSequence. This is shown in the table on “Aquifers andaquitards of the basin”.
HydrogeologyAll groundwater within the basin flows towards the Etosha
Pan, due to the structure of the basin and because as thepan, as the deepest point, is the base level of the ground-water flow system. Groundwater, recharged in the fractureddolomites of the Otavi Mountain Land, flows northwards
52
srefiuqafoemaN,sdratiuqadnalacigoloegordyH
retcarahc
mumixaM-kciht
ssen]m[
ygolohtiL,noitamroF,puorgbuS
puorG
dnaytilauqretawdnuorGytilibarenluv
-nocnUdenif
irahalaKsrefiuqA
ylniam(,suorop
yllacol)derutcarf
APD nihT dnaS a/n tneceR,nosaesyrdgnirudhsikcarb,hserF
noitullopotelbarenluvylemertxe
AKU LE 051-emil,eterclaC
sreyaldnas;enotsyalC
ahsotE(inodnA)rebmeMenotsemiL
-nocetartinhgihyllacol,hserFnoitullopotelbarenluv,noitartnec
AKU NA 05;dnasyeyalc,tliS
sreyaleterclacyalC
inodnAhsikcarbothserF
ASM NA 07 eterclac,dnaS enotstliSretawhserflacol,enilasothsikcarB
sesneldenifnoCirahalaKsrefiuqA
otsuorop()derutcarf
AAO NA 001,levarg,dnaS
enotsdnasyalC BpuorG,hserF
ADM NA 06 enotsdnas,dnaS-emil,etercliS
yalc,dnasdetnemec,)oloknakOfoE(hsikcarbothserF)oloknakOfoW(enilasothsikcarB
ADV LO 081 suoeraclac,dnaS-emil,etercliS
,dnasdetnemecyalc
adnokulO,amayneE,redrobnalognA(hserF
fohtuosmk5(enilasot)oloknakO)olevihsO
a/n 05,enotsdnaS
etaremolgnocenotsduM besieB a/n
a/n 001 enotsdnaS elahs,enotsduM utnalabmO a/necneuqeSooraK
ASKdratiuqAyltrap,derutcarf(
)denifnoc
002 a/n,enotsdnas,tlasaB
elahsdetaitnereffidnU
fohtuoS,CpuorG,hsikcarBilalaH;olevihsO
001 a/n sekyd,tlasaB dnarklaK a/n041 enotsdnaS a/n ojtE a/n022 a/n elahS treblAecnirP a/n061 etilliT elahS akywD a/n
puorGnedluMAGM,dratiuqAyltrap,derutcarf(
)denifnoc
0024
,enotsdnaS,etiztrauq,enotsemil
etimolod
elahs,enotstliS,tabmoK,obmawO
iduhcsT
ot)m076ot034:htped(enilaS,htpedwollahsta(hsikcarbylthgils
)ojeukuakO
etimoloDivatOADO,refiuqA
yltrap,derutcarf(yltrap,citsrak
)denifnoc
0004,etimoloD
enotsemil,elahS
,yalctsihcs
puorgbuSbemusT hserF
0002 puorgbuSbanebA )udnasavujtO(hserF
dratiuqApuorGbisoN 0021 a/n,enotsdnas,etitxiM
,etiztrauqetaremolgnoc
,otnairaVsibaN
a/n
,edulciuqAtnemesaBwollahstadratiuqa(
)htpeda/n a/n
,ssieng,etinarG,stnemides-atem
scinaclov-atem
nietnofsnarF,etiuScitinarG
.rGsudnebaohKudnasavujtOtaytilauqrooP
Aquifers and aquitards of the basin

and feeds the aquifer system of the Karoo and Kalahari.However, a major part of this northbound groundwater flowis shallow, and discharges south-east of Namutoni throughnumerous springs along the southern margin of the EtoshaPan and through the bottom of the pan from where it rapidlyevaporates. East of the groundwater divide (17° 45’ E),the groundwater flow is most likely towards the OkavangoRiver (1100 m asl). The detailed hydrogeo l ogy of the dif-ferent sediment layers is discussed, starting with the upper-most layers, working down.The Kalahari Sequence comprises the Ombalantu, Beisib,
Olukonda and Andoni formations. It is entirely of continen -tal, aeolian to fluvial origin. The aeolian material consistsof fine-grained, well-sorted sand, while the material depositedin a fluvial environment ranges from gravel to clay and oftenrepresents braided stream conditions, resulting in very variablelithologies both vertically and horizontally. Fluvial sedi-mentation dominates with some reworking of aeolian sand.Lacustrine clays and associated fluvial silts and sands weremost probably transported by endorheric rivers flowingsouth from the north-west, similarly to the way that theOkavango River now feeds into the Okavango Swamps. Thepresent pan floor consists of evaporitic calcareous sandstonescovered by a thin layer of salt-bearing chalk.At the southern and western margins of the basin, a
rim of the Etosha Limestone Member is present close to thesurface. It consists mainly of karstified calcrete, sand andminor clay and is interpreted as sedimentary-evaporitic lime-stone (groundwater calcrete). Stratigraphically, this unit ispart of the Andoni Formation, but the carbonate composition of the rock indicates a separate facies and sedimentation milieu. The thickness of the calcrete increasesfrom 20m near Tsumeb to more than 150m near Oshiveloand is therefore assumed to be a groundwater calcrete.The Kalahari Sequence Aquifers are split into an uncon-
fined and a confined to artesian part. The Unconfined Kalahari Aquifers (UKA) comprise two types of facies: theaquifer in the calcrete facies is classified as fractured, whilethe sand facies acts as a porous aquifer. The facies transitionzone is located some 7 km south of Oshivelo (green/bluecolour boundary on the Map). The Unconfined KalahariAquifer is subdivided into the Discontinuous Perched Aquifer
(DPA) above the Main Shallow Aquifer (MSAAN) in thenorth, the calcrete facies (UKAEL) in the south and west, andthe sandy facies (UKAAN) in the centre around Oshivelo.The Confined Kalahari Aquifers are the Oshivelo Arte-sian Aquifer (OAAAN) in the centre around Oshivelo andthe Main Deep Aquifer (MDAAN) above the Very DeepAquifer (VDAOL) in the north. The table shows these andprovides an easy reference to the abbreviations used here. MSAAN, UKAEL and UKAAN are stratigraphically equiv-
alent; UKAEL groundwater flows down-gradient into theUKAAN, while UKAAN and MSAAN groundwaters are mixedin the area of Omuramba Omuthiya and eventually dis-charge into the Etosha Pan (see arrows on the Map). MDAAN
and VDAOL are likely to merge into OAAAN, however, thestratigraphic equivalence and hydraulic interconnectionbetween the three aquifers have not yet been confirmed.The Discontinuous Perched Aquifer (DPA) is not a single
aquifer, but consists of a series of small perched aquifers,which occur predominantly in the dune-sand covered areanorth-east of Okankolo. These aquifers are mainly rechargedby direct infiltration of rainwater and exploited by meansof “omifima”, traditional, funnel-shaped dug wells. Althoughthe yield is generally limited by the size of the aquifers, theyprovide shallow, easily accessible and good quality drinkingwater to the scattered villages of the Ohangwena and north-ern Oshikoto regions. The water quality is subject to sea-sonal variations, and may become brackish towards the endof the dry season. Because of the shallow water table, theDiscontinuous Perched Aquifer is extremely vulnerable topollution. Care must be taken to avoid contamination bydung at cattle drinking points.
53
htroN ertneC htuoS
denifnocnU-APD
suounitnocsiDrefiuqAdehcreP
ASMNA
niaM-refiuqAwollahS
AKUNA
denifnocnU-refiuqAirahalaK
AKULE
denifnocnU-refiuqAirahalaK
denifnoCADM
NAniaM-
refiuqApeeDAAO
NAolevihsO-
refiuqAnaisetrAADV
LOyreV-refiuqApeeD
Schematic representation of the position of aquifers in the CuvelaiBasin
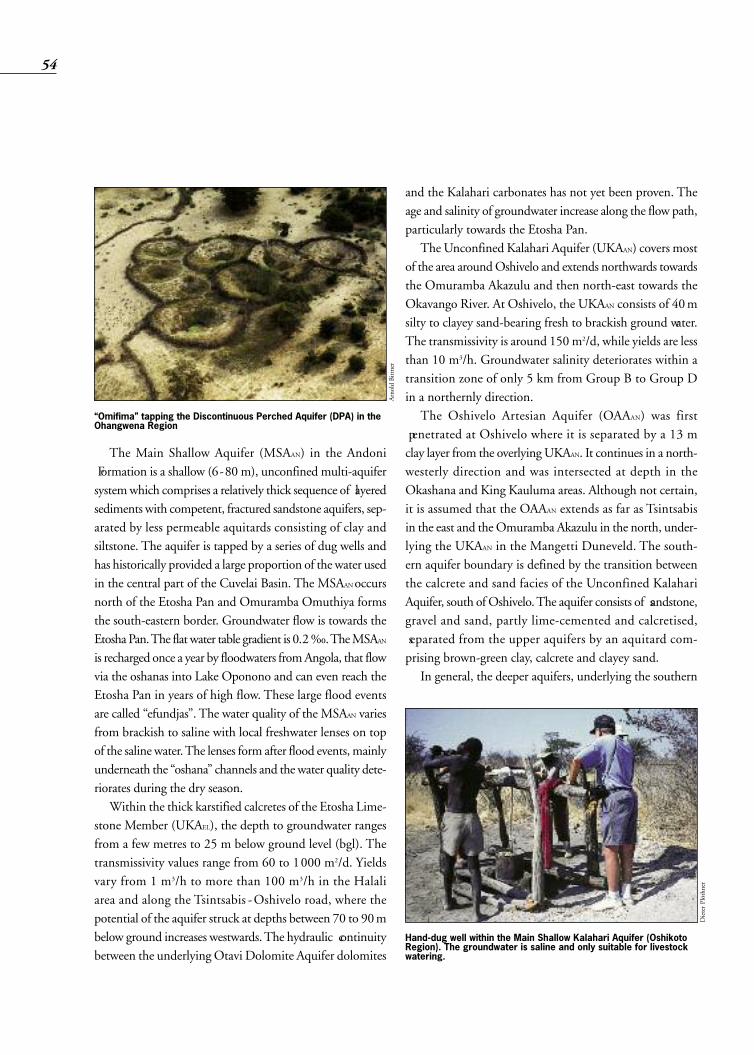
The Main Shallow Aquifer (MSAAN) in the Andoni Formation is a shallow (6-80 m), unconfined multi-aquifersystem which comprises a relatively thick sequence of layeredsediments with competent, fractured sandstone aquifers, sep-arated by less permeable aquitards consisting of clay andsiltstone. The aquifer is tapped by a series of dug wells andhas historically provided a large proportion of the water usedin the central part of the Cuvelai Basin. The MSAAN occursnorth of the Etosha Pan and Omuramba Omuthiya formsthe south-eastern border. Groundwater flow is towards theEtosha Pan. The flat water table gradient is 0.2‰. The MSAAN
is recharged once a year by floodwaters from Angola, that flowvia the oshanas into Lake Oponono and can even reach theEtosha Pan in years of high flow. These large flood eventsare called “efundjas”. The water quality of the MSAAN variesfrom brackish to saline with local freshwater lenses on topof the saline water. The lenses form after flood events, mainlyunderneath the “oshana” channels and the water quality dete-riorates during the dry season.Within the thick karstified calcretes of the Etosha Lime-
stone Member (UKAEL), the depth to groundwater rangesfrom a few metres to 25 m below ground level (bgl). Thetransmissivity values range from 60 to 1000 m2/d. Yieldsvary from 1 m3/h to more than 100 m3/h in the Halaliarea and along the Tsintsabis -Oshivelo road, where thepotential of the aquifer struck at depths between 70 to 90mbelow ground increases westwards. The hydraulic continuitybetween the underlying Otavi Dolomite Aquifer dolomites
and the Kalahari carbonates has not yet been proven. Theage and salinity of groundwater increase along the flow path,particularly towards the Etosha Pan.The Unconfined Kalahari Aquifer (UKAAN) covers most
of the area around Oshivelo and extends northwards towardsthe Omuramba Akazulu and then north-east towards theOkavango River. At Oshivelo, the UKAAN consists of 40msilty to clayey sand-bearing fresh to brackish ground water.The transmissivity is around 150 m2/d, while yields are lessthan 10 m3/h. Groundwater salinity deteriorates within atransition zone of only 5 km from Group B to Group Din a northernly direction.The Oshivelo Artesian Aquifer (OAAAN) was first
penetrated at Oshivelo where it is separated by a 13 mclay layer from the overlying UKAAN. It continues in a north-westerly direction and was intersected at depth in theOkashana and King Kauluma areas. Although not certain,it is assumed that the OAAAN extends as far as Tsintsabisin the east and the Omuramba Akazulu in the north, under-lying the UKAAN in the Mangetti Duneveld. The south-ern aquifer boundary is defined by the transition betweenthe calcrete and sand facies of the Unconfined KalahariAquifer, south of Oshivelo. The aquifer consists of sandstone,gravel and sand, partly lime-cemented and calcretised, separated from the upper aquifers by an aquitard com-prising brown-green clay, calcrete and clayey sand.In general, the deeper aquifers, underlying the southern
54
“Omifima” tapping the Discontinuous Perched Aquifer (DPA) in theOhangwena Region
Hand-dug well within the Main Shallow Kalahari Aquifer (OshikotoRegion). The groundwater is saline and only suitable for livestockwatering.
Arnold Bittner
Dieter Plöthner

and eastern parts of the Etosha Panand the area around Oshivelo up toAndoni vlakte, are under artesianpressure. The boundary of this area,some 8000km2 in size, is de lineatedon the Map. The piezometric headof the OAAAN ground water is at1102m asl. Where the surface elevation is lower, there is artesianflow. For instance, in 1923 in theAndonivlakte (1080 m asl) the piezometric head of theOAAAN groundwater was 3 bars (304 kPa) or almost 30mabove ground level. An upper freshwater layer and a lowervery brackish water horizon (TDS= 6700 mg/L) was struckand screened at an average depth of 170m bgl. In 1971, theradiocarbon dating showed this groundwater to be 14 000years old.The values of transmissivity range from 3000 to 10000
m2/d. The hydraulic conductivity is 8·10-5 for the upper sandy,and 7·10-3 m/s for the lower gravelly parts of the aquifer. Theyield can be very high in the Oshivelo area (>200 m3/h)but decreases towards the north-west where the aquifer is lesspermeable. The OAAAN is recharged by throughflow fromthe Unconfined Kalahari Aquifer and the Otavi DolomiteAquifer south of the Omuramba Owambo. In the Omu-ramba Omuthiya area, the groundwaters of the UKAAN
and OAAAN become mixed and eventually discharge into theEtosha Pan. The salinity of the artesian groundwater rangesfrom 600 to 1500 mg/L, deteriorating towards the north-west where concentration of total dissolved solids, TDS,exceed 2 600 mg/L (Group D).The high groundwater potential in the surroundings
of Oshivelo is indicated by the darkblue (OAAAN) and the dark green(UKAEL) colours on the Map. Thesustainable yield of the aquifer wasroughly estimated to be 2.5 Mm3/a.A mathe matical groundwatermodel suggests that, betweenTsintsabis and Oshivelo, a ground-water flow of some 31 Mm3/a isdirected northwards from the
dolomite areas around Tsumeb. The Main Deep Aquifer (MDAAN) is present in the eastern
Ohangwena and northern Oshikoto regions. The ground-water flow is southward, towards the Etosha Pan, whilethe recharge area is probably located in southern Angola.The southern and eastern boundary is uncertain and it isassumed that the confined MDAAN underlies the uncon-fined MSAAN in the Eenhana-Okankolo area. At KingKauluma, values of transmissivity range from 20-60 m2/dand yield from 3 -10 m3/h.The MDAAN is a continuous porous aquifer, which was
intersected between Eenhana and Okongo at depths between60 and 160 m bgl, representing the main freshwater sourcein the Ohangwena Region. West of the line Eenhana-Okankolo, the MDAAN is brackish to saline and cannotbe developed for drinking water purposes. Towards the south,the water quality deteriorates over a short distance and is ofGroup D quality in the King Kauluma area, due to salin-ity and high fluoride concentrations. Mixing with waterswelling up along fault systems from deeper aquifers causesfurther deterioration.The Very Deep Aquifer (VDAOL) was intersected at the
same locations as the MDAAN, but at depths of between130 and 380 m bgl. The VDAOL is situated within theOlukonda Formation, which underlies the Andoni Formation in most parts of the Owambo Basin. Like theMDAAN, the water quality deteriorates from north to south.The recharge area must be located in Angola. The waterquality is fresh, east of Eenhana, but becomes more andmore saline towards the south-west. In the south-westernarea, however, it is generally better than the quality of theMDAAN, resulting in the situation that groundwater from
55
Under pressure! Borehole penetrating the OshiveloArtesian Aquifer with a free flowing yield of morethan 200 m3/h.
htpeD]lgbm[
refiuqAssenkciht
]m[ygolohtiL
/refiuqAdratiuqA
retaWytilauq
04–0 04,neerg-etihw;dnas
yeyalc,suoeraclacAKU
NAASM,
NA
othserfhsikcarb
35–04 31;etilorpes;yalc
ydnas,neerg-nworbdratiuqA –
76–35 41ztrauqdnaeterclis
nworbthgil;dnasfonoitcesreppu
AAONA
hserf
18–76 41,enotsdnas,dnas
thgil,etihw;levargneerg
fonoitcesrewolAAO
NA
hserf
Generalised aquifer specifications of boreholes penetrating theOAAAN at Oshivelo
Arnold Bittner

boreholes penetrating theVDAOL at depth is fresh,while water pumped fromthe overlying MDAAN isbrackish. This occurs atOkankolo, Onayena andEenyama, where the uppersaline aquifers are sealed offand fresh groundwater ispumped from the VDAOL to supply drinking water. No details on aquifer parameters andwater quality are available for the Beisib and Ombalantu formations. In the central Cuvelai Basin, the Karoo rock succession
is made up of glaciogenic rocks (largely tillite with interbed-ded shales) of the Dwyka Formation, shales and coals of thePrince Albert Formation, and aeolian sandstone of the EtjoFormation (only at Nanzi). These lie on deeply weatheredrocks of the Owambo Formation. Aeromagnetic surveysindicate basaltic lavas equivalent to the Rundu Formationin the south-east of the basin beneath the Kalahari succes-sion. Recent drilling proved that the Karoo rocks includingbasalt lavas and dykes underlie the Kalahari sediments inthe south of Etosha.The Karoo Sequence Aquitard (KSA) comprises rocks such
as shale, mudstone, sandstone and basalt. In general it actsas an aquitard with transmissivity values ranging from 1 to10 m2/d. However, locally it constitutes an aquifer. Three bore-holes encountered pelitic sediments, while two boreholes struckweathered basalt. At four sites located between Tsumeb andOshivelo, the Karoo shales and intrusives were penetrated atdepths of between 160 and 400m bgl. The system is semi-confined to confined. The Karoo aquitard hydraulically sep-arates the underlying Otavi Dolomites from the overlyingKalahari Sequence. At Halali, some 100 km west of these sites,Karoo dolerite acts as an aquifer, where the hydraulic para-meters are: Transmissivity, T=50 m2/d and hydraulic con-ductivity, K=6 ·10-5 m/s. The water quality is Group C due tosodium con centrations above 400 mg/L. The lowest hydrogeological units in the basin are rocks
of the Damara Sequence. Al though these are described indetail in the section on the Otavi Mountain Land, they need
to be men tionedbriefly here,because of thehydraulic con - nections to theCuvelai-EtoshaBasin aquifers.The mostly fine-grained sedimentsof the Mulden
Group Aquitard (MGA) are generally considered to act asan aquitard (T=3 m2/d), however, locally they can consti-tute an aquifer. At Okaukuejo, the Mulden Group consti-tutes a local frac tured quartzite aquifer (T=300 m2/d,K=2·10 -4 m/s) and the groundwater is slightly brackish(TDS=1400 mg/L).The carbonates of the Otavi Dolomite Aquifer (ODA)
constitute a thick fractured and partly karstified aquifer sys-tem representing the main hardrock aquifer in the south-ern part of the Cuvelai Basin. Artesian boreholes tappingthe dolomite aquifer beneath Kalahari Sequence sedimentsare reported from the southern margin of the Etosha Pan.The dolomite groundwater is generally fresh (TDS <1000mg/L) in the Tsumeb area and to the north.The rocks of the Nosib Group are considered aquitards based
on experience in the area south of Tsumeb. The values of trans-missivity range from 0.2 to 3m2/d, depending on the occur-rence of faulted or non-faulted rock conditions. The base-ment generally acts as an aquiclude (T<5·10-3 m2/d), however,at shallow depth it may transmit small amounts of groundwa-ter like an aquitard, for instance, in the Kamanjab inlier.
Groundwater quality and rechargeThe quality of groundwater over much of the basin is
extremely poor and severely limits its use. The water qualityis especially poor in the central areas extending south fromthe Namibia-Angola border between Oshikango and Ruacana in a south-easterly direction towards Etosha andOshivelo. On the Map, areas of saline groundwater are indi-cated by orange hatching, and the zone of saline water corresponds largely with the distribution of the Main ShallowAquifer within the Andoni Formation (MSAAN).
56
Flooded grasslands near Lake Oponono
Wynand du Plessis

Except for brief periods of fresh -water flows into the aquifer, this sourceis of very limited use. North-west of Oshivelo, dashed orange hatching onthe Map hints at poor quality ground-water at depth, corresponding to dete-riorating quality of the Oshivelo Arte-sian Aquifer groundwater southwards.North of the Etosha Pan, the Kala-
hari and Karoo sequences and theupper part of the Owambo Formationform a large reservoir containing highlysaline groundwater. The TDS rangesfrom 30 000 to 100 000 mg/L and chloride concentrations are 10 000 to40 000 mg/L. The water quality im -proves as one moves eastwards, westwards and southwardsfrom the central zone. The best quality ground water is avail-able along the basin rim in much of the Tsumeb area, in theentire north-eastern area of Ohangwena and Oshikoto, insouth-western Omusati and Etosha, and in the Uukwaluudhiarea north towards Ruacana.Contrary to this general picture, relatively fresh ground-
water can sometimes be found within the brackish centralarea, while places of saline water may be encountered in areasusually providing fresh groundwater (see small-scale insetmap on “Groundwater quality”). Much of this patchinessis due to the fact that separate horizons in the same area can
have very different qualities of water. Thus, a borehole mayencounter a freshwater aquifer 50 m bgl, but deeper drillingcan reach a brackish aquifer at 100 m depth.The mechanism of groundwater recharge in the Cuvelai
Basin is not yet entirely understood. However, the followingscenarios, supported by the results of a stable isotope studyin the north and by numerical groundwater modelling inthe south, are most likely to occur:• Direct recharge from rainfall replenishes the UnconfinedKalahari Aquifers (UKA) in the north and in the centre ata rate of up to 1 mm or 0.2 % of the mean annual rain-fall, and 0.25 % across the calcrete areas of the EtoshaLimestone Member (UKAEL) in the south. In the north-eastern part of the basin, where annual average rainfall isabove 500 mm, groundwater recharge occurs in the Kala-hari sediments, as indicated by higher electromagneticresistivities and relatively young groundwater ages.
• Indirect recharge through oshanas originating fromAngola is likely to be the major driving force of ground-water recharge of the Main Deep Aquifer (MDAAN)and the Very Deep Aquifer (VDAOL) in the north. Theage, determined by radiocarbon dating of the MDAAN
groundwater increases from 2000 years near Okongo to15000 years near Okankolo along its south-westerly flowpath, while the VDAOL groundwater south-west ofOkankolo is 35 000 years old.
57
Isotope sampling of a solar powered well in the Northern Centralarea
Block diagramme showing the recharge of the Oshivelo Artesian Aquifer
Dieter Plöthner
Source: Ingo Bardenhagen
Department of Water Affairs, Namibia
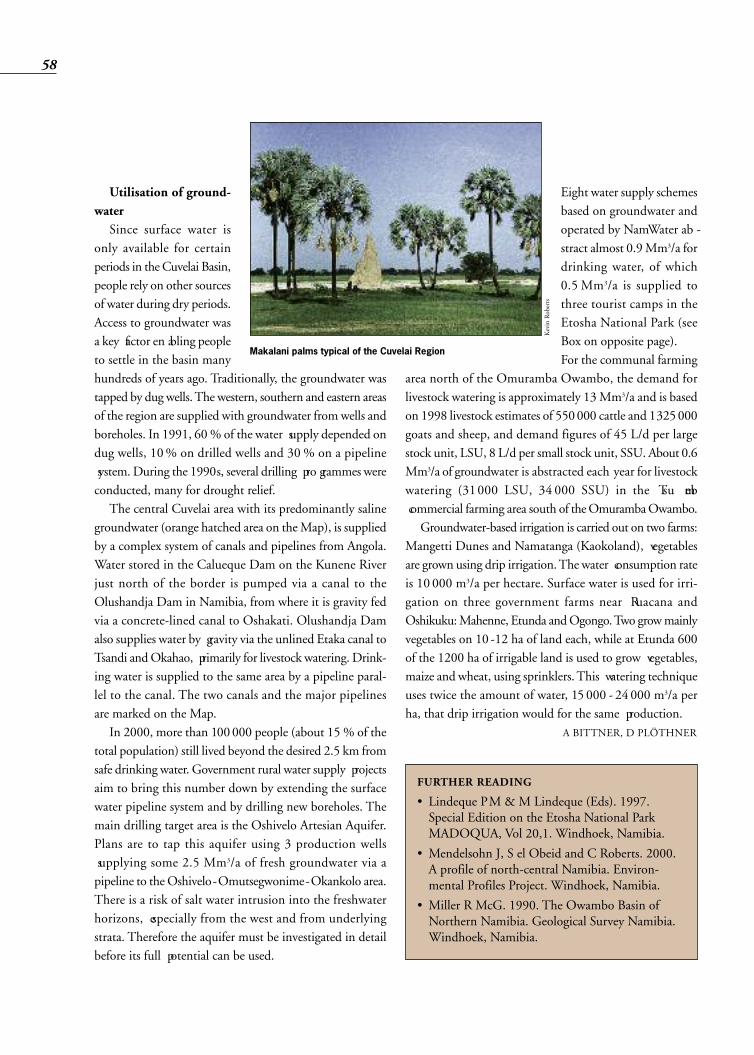
Utilisation of ground -waterSince surface water is
only available for certainperiods in the Cuvelai Basin,people rely on other sourcesof water during dry periods.Access to groundwater wasa key factor en abling peopleto settle in the basin manyhundreds of years ago. Traditionally, the groundwater wastapped by dug wells. The western, southern and eastern areasof the region are supplied with groundwater from wells andboreholes. In 1991, 60 % of the water supply depended ondug wells, 10% on drilled wells and 30 % on a pipeline system. During the 1990s, several drilling pro grammes wereconducted, many for drought relief.The central Cuvelai area with its predominantly saline
groundwater (orange hatched area on the Map), is suppliedby a complex system of canals and pipelines from Angola.Water stored in the Calueque Dam on the Kunene Riverjust north of the border is pumped via a canal to theOlushandja Dam in Namibia, from where it is gravity fedvia a concrete-lined canal to Oshakati. Olushandja Damalso supplies water by gravity via the unlined Etaka canal toTsandi and Okahao, primarily for livestock watering. Drink-ing water is supplied to the same area by a pipeline paral-lel to the canal. The two canals and the major pipelinesare marked on the Map.In 2000, more than 100000 people (about 15 % of the
total population) still lived beyond the desired 2.5 km fromsafe drinking water. Government rural water supply projectsaim to bring this number down by extending the surfacewater pipeline system and by drilling new boreholes. Themain drilling target area is the Oshivelo Artesian Aquifer.Plans are to tap this aquifer using 3 production wells supplying some 2.5 Mm3/a of fresh groundwater via apipeline to the Oshivelo-Omutsegwonime-Okankolo area.There is a risk of salt water intrusion into the freshwaterhorizons, especially from the west and from underlyingstrata. Therefore the aquifer must be investigated in detailbefore its full potential can be used.
Eight water supply schemesbased on groundwater andoperated by NamWater ab -stract almost 0.9 Mm3/a fordrinking water, of which0.5 Mm3/a is supplied tothree tourist camps in theEtosha National Park (seeBox on opposite page). For the communal farming
area north of the Omuramba Owambo, the demand forlivestock watering is approximately 13 Mm3/a and is basedon 1998 livestock estimates of 550000 cattle and 1325000goats and sheep, and demand figures of 45 L/d per largestock unit, LSU, 8 L/d per small stock unit, SSU. About 0.6Mm3/a of ground water is abstracted each year for livestockwatering (31000 LSU, 34 000 SSU) in the Tsu meb commercial farming area south of the Omuramba Owambo.Groundwater-based irrigation is carried out on two farms:
Mangetti Dunes and Namatanga (Kaokoland), vegetablesare grown using drip irrigation. The water consumption rateis 10 000 m3/a per hectare. Surface water is used for irri-gation on three government farms near Ruacana andOshikuku: Mahenne, Etunda and Ogongo. Two grow mainlyvegetables on 10 -12 ha of land each, while at Etunda 600of the 1200 ha of irrigable land is used to grow vegetables,maize and wheat, using sprinklers. This watering techniqueuses twice the amount of water, 15 000 - 24 000 m3/a perha, that drip irrigation would for the same production.
A BITTNER, D PLÖTHNER
58
FURTHER READING
• Lindeque PM & M Lindeque (Eds). 1997.Special Edition on the Etosha National ParkMADOQUA, Vol 20,1. Windhoek, Namibia.
• Mendelsohn J, S el Obeid and C Roberts. 2000.A profile of north-central Namibia. Environ -mental Profiles Project. Windhoek, Namibia.
• Miller R McG. 1990. The Owambo Basin ofNorthern Namibia. Geological Survey Namibia.Windhoek, Namibia.
Makalani palms typical of the Cuvelai Region
Kevin Roberts

Water supply ofthe EtoshaNational Park The Etosha National Park, Nami bia’s
best known tourist attraction, is one ofthe largest nature reserves in Africa,comprising an area of 22 270 km2. Theunique hydrogeological setting with50 to 60 permanent springs, mostlycontact springs situated along thesouthern rim of the Etosha Pan, hasattracted man and wildlife through outhistory.Today, boreholes tapping ground-
water from various aquifers supply mostof the waterholes frequented by game,as well as the tourist camps. Many con-tact springs have dried up because thewater table was lowered by pumping.Most of the waterholes are supplied bygroundwater from the calcretes of theUnconfined Kalahari Aquifer (UKAEL).The calcretes cover the entire area southand west of the Etosha Pan. The cal-crete groundwater quality is of GroupA and B, i.e. suitable for drinking, only
in the western and southern park area,declining to Group D, suitable onlyfor wildlife and road construction,towards the southern rim of the EtoshaPan. Alternative groundwater resourceshad to be developed at greater depthsfor the three rest camps.At Okaukuejo, groundwater of
Group B quality from a quartzitic hori-zon of the Mulden Group (MGA) istapped to supply drinking water, whilethe Group C water of the calcretes isused for landscape gardening, thewaterhole and the swimming pool.At Halali, poor quality ground water
from the calcretes is pumped from theKlein Halali wellfield to the reservoir,where it is mixed with fresh ground-water of the Otavi Dolomite Aquifer(ODA) from the Renosterkom well-field. This scheme is situated on adolomite outcrop about 6 km south ofHalali.Drinking water for Namutoni is
supplied by a wellfield at the LindequeGate 14 km east of Namutoni and tapsgroundwater from the Oshivelo Arte-sian Aquifer (OAAAN). The well at
Namutoni on the sameaquifer is slightly brack-ish and can only be usedto fill the artificial game-viewing waterhole andfor the camp gardens.The combined watercon sumption of the 3tourist rest camps was0.5 Mm3/a in 1994 andis met by the aqui fers,but water conservationis necessary to cope withthe growing demand in
the future. A total of 41000 day visi-tors and 193000 overnight guests wererecorded in 1998, giving a relativelyhigh average water demand of 210 L/dper tourist.A few waterholes for game watering
in the west near Otjovasandu and southof the park at Ombika/Anderson Gatetap fresh groundwater (Group A) fromcalcretes, dolomites and quartzites. Incontrast, the majority of the waterholeslocated in the central and eastern partsof the park provide brackish ground-water of Group C-D quality. Most ofthese do not meet the guideline val-ues for human consumption and incases exceed even those for livestockwatering. The problematic parametersare TDS, sodium, chloride and sul-phate. Poor quality water may alsoadversely affect wildlife.
K DIERKES
59
Karstified dolomites close to the artificialwater hole at Halali
The Etosha National Park – unique hydrogeological settingwith 50 to 60 permanent springs
Wilhelm Struckm
eier
Wynand du Plessis
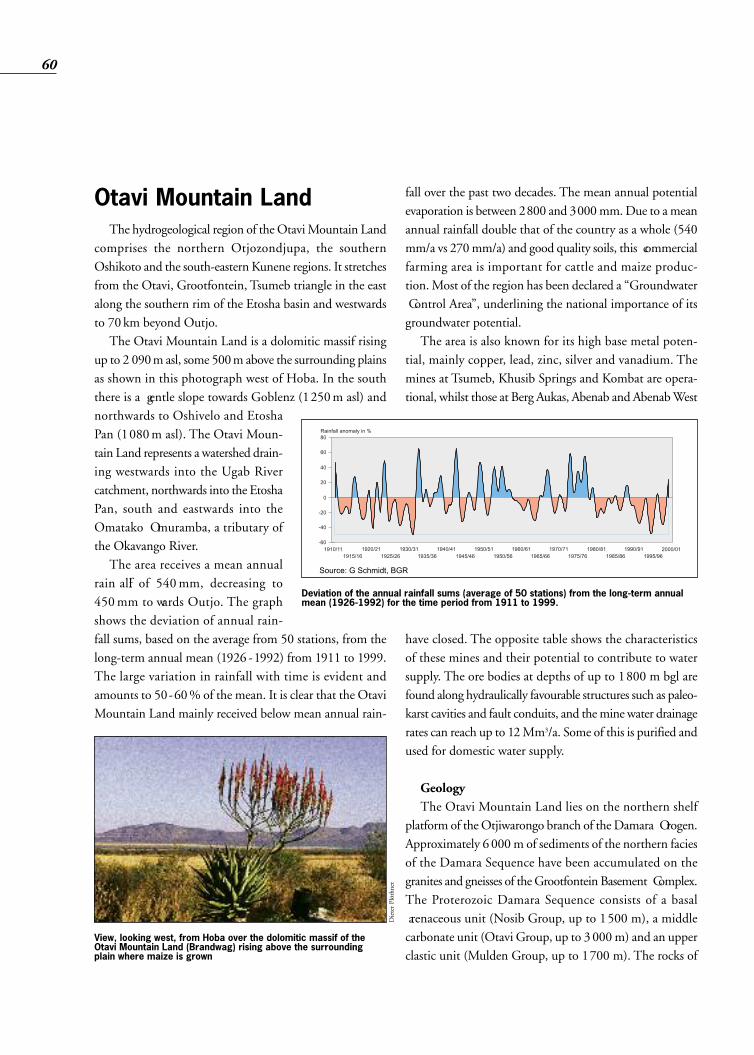
Otavi Mountain LandThe hydrogeological region of the Otavi Mountain Land
comprises the northern Otjozondjupa, the southernOshikoto and the south-eastern Kunene regions. It stretchesfrom the Otavi, Grootfontein, Tsumeb triangle in the eastalong the southern rim of the Etosha basin and westwardsto 70 km beyond Outjo.The Otavi Mountain Land is a dolomitic massif rising
up to 2 090m asl, some 500m above the surrounding plainsas shown in this photograph west of Hoba. In the souththere is a gentle slope towards Goblenz (1250m asl) andnorthwards to Oshivelo and EtoshaPan (1080m asl). The Otavi Moun-tain Land represents a watershed drain-ing westwards into the Ugab Rivercatchment, northwards into the EtoshaPan, south and eastwards into theOmatako Omuramba, a tributary ofthe Okavango River.The area receives a mean annual
rain fall of 540mm, decreasing to450mm to wards Outjo. The graphshows the deviation of annual rain-fall sums, based on the average from 50 stations, from thelong-term annual mean (1926 -1992) from 1911 to 1999.The large variation in rainfall with time is evident andamounts to 50-60% of the mean. It is clear that the OtaviMountain Land mainly received below mean annual rain-
fall over the past two decades. The mean annual potentialevaporation is between 2800 and 3000 mm. Due to a meanannual rainfall double that of the country as a whole (540mm/a vs 270 mm/a) and good quality soils, this commercialfarming area is important for cattle and maize produc-tion. Most of the region has been declared a “Groundwater Control Area”, underlining the national importance of itsgroundwater potential.The area is also known for its high base metal poten-
tial, mainly copper, lead, zinc, silver and vanadium. Themines at Tsumeb, Khusib Springs and Kombat are opera-tional, whilst those at Berg Aukas, Abenab and Abenab West
have closed. The opposite table shows the characteristicsof these mines and their potential to contribute to watersupply. The ore bodies at depths of up to 1800 m bgl arefound along hydraulically favourable structures such as paleo-karst cavities and fault conduits, and the mine water drainagerates can reach up to 12 Mm3/a. Some of this is purified andused for domestic water supply.
GeologyThe Otavi Mountain Land lies on the northern shelf
platform of the Otjiwarongo branch of the Damara Orogen.Approximately 6 000 m of sediments of the northern faciesof the Damara Sequence have been accumulated on thegranites and gneisses of the Grootfontein Basement Complex.The Proterozoic Damara Sequence consists of a basal arenaceous unit (Nosib Group, up to 1500 m), a middlecarbonate unit (Otavi Group, up to 3 000 m) and an upperclastic unit (Mulden Group, up to 1700 m). The rocks of
60
View, looking west, from Hoba over the dolomitic massif of theOtavi Mountain Land (Brandwag) rising above the surroundingplain where maize is grown
Deviation of the annual rainfall sums (average of 50 stations) from the long-term annualmean (1926-1992) for the time period from 1911 to 1999.
Dieter Plöthner
Source: G Schmidt, BGR

the Otavi Group have been stratigraphically subdivided intothe Abenab and the Tsumeb subgroups and a number ofFormations as shown in the table on stratigraphic succession.The dolomitic rocks contain interbedded layers of lime-stone, marl and shale. The strata were moderately foldedduring the Pan-African Orogeny (680-450 Ma) into sev-eral synclines and anticlines generally trending east-west evi-dent in this map. From south to north, the three dolomitesynclines are the Otavi Valley-Uitkomst (I), Grootfontein-Berg Aukas (II), Harasib-Olifantsfontein (III), and Tsumeb-Abenab (IV) synclinorium further north. The core of thesynclines is filled with the low permeable rocks of the Mulden
Group, whereas the anticlines reveal low permeable rocksof the Nosib Group and Basement.The Kalahari Sequence is represented locally by a thin
aeolian sand blanket and by calcretes which contain sub-stantial amounts of silt and clayey material. The calcretes,in general, cover the low-lying groundwater discharge areas.They can be up to 20m thick around Tsumeb, across theNosib Anticline and the Basement high near Grootfontein,and up to 50m thick near Brandwag/Uitkomst on the east-ern tip of the Otavi Valley-Uitkomst Syncline (I). Theywidely cover the foreland where the thickness increases to70m towards the south and even 150m towards the north.
61
metsyS ecneuqeS puorG puorgbuS noitamroF ygolohtiLegarevAssenkciht
]m[
lacigoloegordyHecnacifingis
,yranretauQ
yraitreT
irahalaK)aM56<(
)PBa00041ot00043(VIesahPtsraK
,tneceRinodnA
eterclac,dnasnailoeA 02 deredisnoctoN
IIIesahPtsraK,)aM56-031(ytimrofnocsiD,suoecaterC
,cissaruJ,cissairT
ooraK)aM031-003(
)dnarklaK(udnuR AKTnisekydetireloD a/n lacitreVtiudnoC
ojtE enotsdnasnailoeA .serpton a/n,naimreP
,suorefinobraC,nainoveD
,nairuliS,naicivodrO
nairbmaC
ednognimO ,tirg,etaremolgnoCenotsdum
tontneserp
a/n
IIesahPtsraK,)aM003-055(ytimrofnocsiD
naibimaN aramaD
nedluM)aM055-075(
obmawO ,elahs,.tstlis,.tsdnas,lraMetimolod,.tsemil
tontneserp
dratiuqAAGM
tabmoK ,etimolod,ettilyhPelahs,etaremolgnoc
005>
iduhcsT ,tirg,esokrAetilligra,etaremolgnoc
007>
IesahPcitsraK,)aM075-067(ytimrofnocsiDivatO
)aM067-038(bemusT grebnettüH trehc,elahs,etimoloD 048 refiuqA
ODA
keohsdnalE etimoloD 0021>grebeiaM etimoloD 081
sdebelahs,enotsemiL 007dratiuqA
souhC elahs,etillit,etiztrauQ 002
ytimrofnocsiDbanebA soruA enotsemil,etimoloD 002 refiuqA O
DA
elahs,lraM 05 dratiuqAssuaG etimoloD 057 refiuqA
sakuAgreB elahs,enotsemil,etimoloD 055)aM038-048(ytimrofnocsiD
bisoN)aM048-059(
)buahG(otnairaV etiztrauq,etitxiM 0021 dratiuqA
dloveksA etaremolgga,etillyhPsibaN ,esokra,etiztrauQ
etillyhp,tsihcs,.molgnocnailokoM )aM059-0051(ytimrofnocsiD
)xelpmoCcihpromateM(xelpmoCtnemesaBnietnoftoorG)aM0851(
,tsihs,ssieng,etinarGorbbag-atem
greB,nietnoftoorG()sakuA
a/n /edulciuqAtadratiuqA
htpedwollahs
Stratigraphic succession of the Otavi Mountain Land and its hydrogeological significance

Doleritic dykes and dyke swarms with a length of severalkilometres are present in the Tsumeb-Abenab Synclinorium(IV). These intrusive bodies of Karoo age intruded openaxial tension structures and follow a roughly north north-west to north north-east direction. Water strikes are mainlyrelated to these directions.
Four karstification periods of the dolomitic rocks ofthe Otavi Group have been found. The first and oldest periodof karstification is presumed to have lasted from 750 Ma to650 Ma in a period of uplift and erosion. A second karstification period interrupted by glaciation and sedi -mentation lasted from 450 Ma to 280 Ma. The third
62
Generalised geological map of the Otavi Mountain Land and the boundaries of the GKA and TKA numerical models
Source: HYMNAM Project
D Plöthner

karstification period occurred in earlyTertiary (65 Ma). The last major phaseof karst processes developed during thePleistocene approximately 34 000 to14 000 years ago. These are shown inthe table on stratigraphic succession.The fractured dolomites are karstifiednear the surface over a wide area andlocally covered by soil. Deep karstifi-cation (e.g. Dragon’s Breath Cave,Harasib Cave, Otjikoto and Guinaslakes) and paleo-karst (Tsumeb, BergAukas) only occur locally. The Hütten-berg Formation is the most highly karsti - fied dolomite unit in the Tsumeb area,especially where it is covered by rocksof low permeability of the Tschudi Formation. Experiencefrom Tsumeb Mine provides evidence of widely varyingtransmissivity values that range from 10 to 6 000 m2/d.
HydrogeologyThe high groundwater potential of the Otavi Mountain
Land (dark green colour on the Map) is evident in the highinflow of groundwater into the abandoned Berg Aukas,Abenab and Abenab West mines and the operating Kombat,Tsumeb and Khusib Springs mines, the large perennialsprings such as Otavifontein (1 Mm3/a), Olifantsfontein(0.3 Mm3/a) and Strydfontein (0.1 Mm3/a), and formerflows from the now dry springs at Grootfontein and Riet-fontein. The major springs (depicted on the Map) are contact
springs bound to the contact dolomite/bedrock (Nosib orBasement) and have a fairly constant discharge, which accord-ing to isotope data originate from recharge at higher alti-tudes. The depth to groundwater is relatively shallow (20m bgl)
south of Guinas Lake, whereas it may be more than 100mdeep below the higher altitude recharge areas north of Kom-bat Mine and south of Tsumeb as indicated by the contourson the Map.In the Tsumeb area, Karoo dyke systems are considered
as vertical conduits (T=1200 m2/d) intersecting the entire
multi-aquifer/aquitard system. TheTsumeb water supply wells are drilledinto these structures.The Kalahari calcretes do not form
a major aquifer in the centre of theOtavi Mountain Land. Yields of 1 and5 m3/h have been reported for the areaof the Nosib Anticline, however, withincreasing distance from the dolomiteoutcrops it may become an importantaquifer, especially northwards, wherethe calcretes of the Etosha LimestoneMember are up to 150m thick southof Oshivelo. In the south, for exampleon the Farm Schwarzfelde, the calcreteshave abundant ponors (karst holes) into
which runoff, after heavy downpours, can percolate rapidlywith little lost to evaporation. This type of indirect ground-water recharge is significant for the low-lying parts of thesouthern foreland.The low permeable phyllites and quartzites of the Kom-
bat Formation (Otavi Valley) and the Tschudi Formation(Tsumeb area) constitute the fractured Mulden GroupAquitard (MGA) with transmissivity values of 3 m2/d.From the top down, the Otavi Dolomite Aquifer (ODA)
is composed of the fractured to karstified dolomite aquiferof Hüttenberg, Elandshoek and the upper part of theMaieberg Formations (Tsumeb Subgroup), while the thin-bedded limestone and shale of the lower Maieberg Formations act as an aquitard. For instance, north of KombatMine and in the Abenab area it separates the two abandonedmines hydraulically. The dolomites of the Elandshoek andHüttenberg Formations have the highest average trans-missivity values of 300 and 1700 m2/d respectively, and aretherefore, the most important aquifers in the Tsumeb area,especially the Hüttenberg Formation.The Chuos Formation (T<1m2/d) crops out only in the
south-west, where the weathered tillite and shale act as anaquitard separating the dolomite aquifer of the underly-ing Abenab Subgroup from the dolomite aquifer of the over-lying Tsumeb Subgroup. The fractured dolomites of theAuros, Gauss and Berg Aukas Formations represent the
63
Olifantsfontein Spring with discharge gaugeDieter Plöthner

Two three-dimensional numerical groundwater flowmodels have been established for the GKA and TKA, inwhich the GKA model includes the southernmost part ofthe TKA. The model areas and the calculation results areshown in the figure “Generalised map of the Otavi Moun-tain Land”. The opposite sketch outlines the flow system ofthe GKA. The calculated water balance figures are sum-marised in the table below. The GKA model simulation isfor the period between 1979 and 1997 and is based on aninitial calculated groundwater table distribution, which rep-resents the hydraulic situation at the end of 1978, characterised by good replenishment during 3-4 years ofabove mean rainfall i.e. the system was relatively full. Withinthe TKA modelling, transient long-term calibration was exe-cuted for the period 1968-1998. The values of horizontal hydraulic conductivities KH
and storage coefficients S, assigned to the hydrogeologicalunits, are shown in the table and in the schematic profile ofthe TDK.
Small S values ranging from 1·10-4 to 1.5·10-3 indicate thatconfined groundwater conditions prevail in the TKA area.The groundwater models have assigned potential recharge
factors, e.g. in the TKA area 4 % (or 21mm) for dolomiteoutcrops, 1.5 % (8 mm) for transition zone covered by lessthan 20 m thick calcretes, and 0.25 % (1 mm) for MuldenGroup. Groundwater recharge rates based on results of anisotope study range from 0 to 9 mm (0-1.7 % of the meanannual rainfall). The calculated recharge factors for the GKAarea vary between 1.3 % (7 mm) and 5 % (28 mm) of themean annual rainfall. As an average over 19 years, the mean
recharge factor for the dolomite outcrops of the GKA areais 1.7 % (9 mm), corresponding to a mean recharge rateof about 18 Mm3/a.The discharge areas of the GKA model are springs or
seeps where more vegetation occurs than in the surround-ing area, e.g. at Khusib, Olifantsfontein, Mariabronn andat Brandwag. Due to the drought, the groundwater dis-charge of the springs and seepage (QEXF) dropped from72.3 Mm3/a in 1979 to 29.5 Mm3/a in 1997.The groundwater outflow across the system bound-
aries decreases with the decreasing hydraulic gradient. Whenthe system was almost completely replenished in 1978,the total groundwater outflow (QFIXOUT) from the mod-elled area amounted to 31.9 Mm3/a (1978) decreasing to21.5 Mm3/a in 1997. The largest reduction occurred atthe northern boundary with a decrease from 16.2 Mm3/ain 1978 to 7.3 Mm3/a in 1997, while in the south it decreasedfrom 11.2 to 8.9 Mm3/a and in the west from 6.8 to 5.3Mm3/a. Outflow to the east and west towards the PlatveldKalahari Basin is negligible.
The 19-year (1979 to 1997) change in groundwater stor-age (STOR) totalled some 990 Mm3 in addition to thecumulated recharge (QINF) of 370 Mm3. Most (87% orsome 1190 Mm3) were natural groundwater discharge
ledomAKG )m051-0reyalpot(ledomAKT
]d/m[HK ]-[S ]d/m[HK ]-[S
edulciuqA 01·5.3 3- 01·4 3- – –
dratiuqA 01·5.3 2- 01·4 3- 01·1 2- 01·7- 2- 01·1 4- 01·3- 4-
refiuqA 01·5.3 1- 01·1 2- 01·1 0- 01·7- 0- 01·1 3- 01·5.1- 3-
refiuqAnietnoftoorG(
)aera01·5.3 0 01·2 2- – –
ledomAKG ledomAKT
fotnenopmoCecnalabretaw
9791mM[ 3]
7991/6991mM[ 3]
7991ot9791tnuomalatoT
mM[ 3]
0002mM[ 3]
retawdnuorG8791-dnesevreser
0043+
FNIQ 8.21+ 3.31+ 073+ 0.33+
XIFQNI
0.0 0.0 0 8.0+
XIFQTUO
9.13- 5.12- 054- 5.42-
FXEQ 3.27- 5.92- 047- 0.0
SBAQ 7.5- 4.01- 071- 3.9-
ROTS 1.79- 1.84- 099- 0
retawdnuorG7991-dnesevreser
0142+
Water balance of the groundwater models of the GrootfonteinKarst Aquifer (GKA) and Tsumeb Karst Aquifer (TKA)
The numerical groundwater models of the GrootfonteinKarst Aquifer (GKA) and Tsumeb Karst Aquifer (TKA)
64

As a result of the TKA model, the long-term sustain-able ground water ab straction rate has been assessed at about4 Mm3/a in addition to the present groundwater abstrac-tion. Tsumeb and Abenab West mines are recom mendedabstraction points. Applying an abstraction rate of 2 Mm3/a at both mines
and an annual increase of the current abstraction by 0.75%,water levels at Abenab West Mine will decline by more than100m for average rainfall conditions from 2001 to 2016,and only by 10 to 20m in the vicinity of the Tsumeb Mine.Further away, the water table will drop by 2 to 7m and25 to 40m in the Tsumeb and Abenab areas, respectively.A net balance close to zero and no further significant declinein groundwater levels were predicted after a period of 60years, indicating that steady state conditions will be reachedafter 2061.For short-term (3 year) emergency bulk water abstrac-
tion, up to 10 Mm3/a of groundwater could be abstractedfrom Tsumeb (7 Mm3/a) and Abenab West (3 Mm3/a) minesand exported to the central areas of Namibia, providing thatthe remaining water allocation does not exceed 5.5 Mm3/a.
R BÄUMLE, D PLÖTHNER
(QEXF+QFIXOUT) and only about 13 % or some 170Mm3
(QABS) was abstracted, e.g. for Kombat Mine water drainageand domestic water supply to Grootfontein and Otavi. Thepotential groundwater reserves of some 3 400 Mm3 storedin the upper 150m of the saturated dolomites in 1979, werereduced by 29% by the end of 1997 to 2 410 Mm3. Thisresulted in a 10-30m decline of the groundwater table inthe highest central parts of the Otavi Mountain Land, rep-resenting the major recharge area of the system.The GKA modelling results indicate that the determi-
nation of a sustainable yield and conventional develop-ment of the GKA dolomite aquifer system using relatively shallow wells may not beappropriate. However, thecavities formed under-ground represent easilyaccessible groundwater,which could in the shortterm be ab stracted duringprolonged periods ofdroughts at rates exceedingthe sustainable yield. Thiscan be conveyed via theEastern National Water Carrier (ENWC) to thecen tral areas of the country(Windhoek, Okahandja,Karibib, Otjihase andNavachab mines) to over-come tem porary, emer - gency water shortages there.
65
Fluxes of the GKA model
Schematic north-south profile of the TKA. The data labels contain the depth related hydraulicconductivities [m/d] of the rock formations according to the 3-D model calibration.

major lower aquifer with transmissivities values ranging from10 to 500 m2/d. The 50 m thick shale of the lower AurosFormation acts as an aquitard, for instance, in the Abenabarea.The meta-sediments of the Nosib Group are considered
a fractured aquitard (T<1 to 3m2/d). The rocks with low
permeability of the Nosib Group outcrop within the NosibAnticline which separates the Grootfontein Karst Aquifersystem (GKA) from the Tsumeb Karst Aquifer system (TKA).This results in relatively low groundwater flow from thesouth towards the north and is indicated by a very steep gra-dient of groundwater contours.
66
Mineralogical and hydrogeological characteristics of operating and abandoned Cu-Pb-Zn-Ag-V ore mines in the Otavi Mountain Land andtheir mine water quality, mine water drainage rates, and sustainable yields for water supply (ENWC)
sgnirpSbisuhKeniM
eniMtabmoK eniMbemusT eniMsakuAgreB/)MA(eniMbanebA
eniMtseWbanebA)MWA(
tisopedfoepyT gA-nZ-bP-uC gA-bP-uC gA-nZ-uC-bP V-bP-nZ tisoped)V(-nZ-bP
sutatS ecnisgnitarepomorfdesolc,5991
,0002ot7991lirpAnidenepo-er
0002
desolc,2691ecnisgnitarepo.tpeSot8891.voNmorf
desolc,gnidoolfoteud0991,0002ot7991morf
0002lirpAnidenepo-er
,7091ecnisgnitarepodna6991tsuguAnidesolclirpAnidenepo-er,dedoolf
gnitareponehtecnis,0002,tfahs1.oN;levelht8otpu
tfahSteWeD
ot8591morfdetareponiknus:tfahS2.oN,8791
devomerdaehraeg,8691m063ruof,6991ni 3 -h/
deknildnadellatsnispmup7991niCWNEhtiw
1291morfdetarepoMA7491ot
7491morfdetarepoMWA8591.naJot
enilcnyS -bisaraH)III(nietnofstnafilO
)I(tsmoktiU-yellaVivatO )VI(muironilcnySbemusT sakuAgreB-nietnoftoorG)II(
)VI(muironilcnySbemusT
fonoitartnecnoCslatemero
eroronoitcudorp()sevreser
%2.1,uC%5.6,nZ%4.1,bP
gAt/g053
,bP%1.1,uC%1.3gAt/g62
,bP%5.3,uC%8.5,dC%40.0,nZ%2.1
gAt/g971
,nZ%8.61,bP%0.4V%5.0
,bP%61:MWA)V(,nZ%73
slarenimerO ,etitnannet,anelag,eticoclahc
etirelahpsronim
,anelag,etirypoclahc,etinrobeticoclahc
,etitnannet,anelag,eticoclahc,etirelahps
etigrane,etinrob
,etirelahps,etiziolcsedeticoclahc
,anelag,etiziolcsed,etimelliw,etisurrec
etinomilygolohtiltsoH grebeiaM3T/2T
,.mFetimolod/enotsemildetacolero;tcatnocsenotsemilytalpni
2Tehtfo
.mFgrebnettüH8Tybnialrevoetimolod
,.mFtabmoKfosetillyhp;serutcurtstsrak-oelap
asastcatluaFtseWtabmoKtiudnocretawdnuorgrojam
dnakeohsdnalEreppUpeets,.mFgrebnettüH
ekil-epipxelpmocdellif,erutcurtstsrakoelap
,enotsdnascihtapsdlefhtiwepyTyellaVippississiM
.mFsakuAgreBdnassuaGtnadnubahtiwetimolod
seitivactsrak
.mFgrebeiaM:MAeroekil-epip,etimolod
,ydob.mFsoruA:MWAenotsemil,etimolod
gninimfohtpeD m021> m008> m0081 )tfahS2oN(m057 m083:MWAm512:MA
erofoepyT cidihplus desidixo/cidihplus)m06>(
erocidihplus/desidixocidihplus,)m0051-0(
)m0051>(
desidixo/cidihplus)m008-0(
,)WA(cidihplus/desidixo)banebA(desidixoylniam
ytilauqretaweniM-araphtiw)7991(
gnideecxesretemelbissimdA.xaM
noitartnecnoC)CAM(
]ssendraHlatoT:HT*[
*HT:BpuorG.naJnidelpmas(
)1002
bP,lA:DpuorG :DpuorG:tfahS1.oNOS,aC,*HT
4nM,dC,
:BpuorG:tfahSteWeD;nM,bP,eF,*HT
citsemodrofdeifirup()6991litnuylppusretaw
*HT:BpuorG :MWAgM,*HT:BpuorG
eF:DpuorG:MA
ytivissimsnarT n/n a/n a/n m002ot001 2 d/ m022ot012 2 d/
tneiciffeocegarotS a/n a/n a/n 10.0ot500.0 210.0ot110.0
dleiyelbaniatsuS dehsilbatseteyton dehsilbatseteyton mM0.2 3 a/ mM0.2 3 a/ mM2:MWA 3 a/raeyeerhT
dleiyycnegremedehsilbatseteyton dehsilbatseteyton mM0.7 3 a/ mM5.4 3 a/
mM5.6 3 thgit-retawfi,a/denepoeblliwsrood
mM3:MWA 3 a/demuserperathgit-retawslevelllatadellatsniebot
remrofrotneceRetareganiard
)etarnoitcartsba(
5991 mM3.0 3 a/ 0791 mM0.2 3 a/ 7091 mM7.0 3 a/ mM5.4otpu:MWA 3 a/ mM5otpu:MWA 3 a/1002 mM9.0 3 a/ 8891 mM0.6 3 a/ 5.9ot0.6
mM 3 a/retawenimfo%08
gniebsieganiarddegrahceryllaicifitra
refiuqaehtotni
-8891/110991/90
dedoolF 3991 mM9.5 3 a/
2991 mM7.4 3 a/ 6991enuJ eganiarddesaec
8991 mM8.8 3 a/ 0002yluJ eganiarddetrats-er
1002 mM3.21 3 a/ 1002 mM1.3 3 a/

The granites and gneisses of theBasement are an aquiclude at greatdepth, however, at shallow depth, as inthe Grootfontein area and in the NosibAnticline, they act as a fracturedaquitard (T<0.005m2/d).
Groundwater qualityThe groundwater in the Nosib Anti-
cline is predominantly characterised bythe Mg/Ca-HCO3 water type, the TotalDissolved Solids (TDS) range from 150to 1200 mg/L. Locally, elevatedsodium, chloride and nitrate concen-trations occur in the vicinity of bore-holes used for livestock watering.The dolomite groundwater may be
characterised as a low mineralised (TDS~500 mg/L, from150 to 1300 mg/L), very hard, near-neutral Ca/Mg-HCO3
water. Within the irrigated areas of the Tsumeb Karst Aquifer,elevated sodium, chloride, sulphate and nitrate concentra-tions indicate contamination by irrigation return flows.Groundwater beneath irrigated land is subject to salinisationdue to evaporation and the dissolution of fertilizer compo-nents. In this partly karstic terrain, the high vulnerability ofgroundwater to agricultural pollutants is of concern.Some of the groundwater abstracted from the mines at
Kombat is purified for drinking water purposes (until August1996 this was also true for water from the Tsumeb mines).The water, regularly tested by NamWater, is suitable fordrinking. The groundwater is sufficiently buffered to preventheavy metals from the mines dissolving to any harmful extentdespite the relatively high proportion of oxidised ore.The table on the mineralogical and hydrogeological char-
acteristics of the mines in the area show that according totests in 1997, the water from Kombat, Tsumeb (No. 1 Shaft)and Abenab mines is of Group D quality and that of Tsumeb(De Wet Shaft) and Abenab West mines of Group B quality,as a result of the total hardness and unacceptable concen-trations of aluminium, lead, calcium, cadmium, manganese,iron and magnesium. As experience from Tsumeb Munic-ipality has shown, once treated, the mine water can be used
for domestic supply as these metals arerelatively easily removed by precipi-tation, and hardness is not a health con-cern. Because the groundwater in themines is under pressure and supersat-urated with calcite and dolomite, theseand some of the heavy metals precip-itate out at ground level and thus thewater quality in the canal at theOkakarara off-take improves to GroupA or B.
Utilisation of groundwaterThis hydrogeological region hosts eightmajor water supply schemes of whichOutjo (107), Kombat, Grootfontein(105) and Tsumeb (108) are indepen-
dent waterworks, while the Otavi (79), Brandwag (16),Karstland (45) and Berg Aukas/Otjituuo (12) schemes andthe stand-by abstraction scheme from Berg Aukas Mine aremanaged by Nam Water. In 1999, these schemes abstractedover 7 Mm3/a of groundwater.Outjo waterworks produces 0.8 Mm3/a of drinking water.
Domestic water supply to the mine town at Kombat is0.15 Mm3/a and is ab stracted through wells that belongto Ongopolo Mining and Processing Ltd., OMPL. The20 wells at Grootfontein comprise four clusters of wells.In 1978, abstraction was 1.7 Mm3/a, and this almost dou-bled to 3.2 Mm3/a by 1997.Until the early 1990s, the domestic water supply to
Tsumeb Municipality was entirely dependent on the2.5Mm3/a of groundwater supplied, and purified, from themine. With time, as the ore body dwindled, the munici-pality drilled more than 15 production wells and until theTsumeb Mine closed in June 1996, groundwater from themine was purified and mixed with groundwater from thewells. Since then, groundwater abstraction by wells increasedto a high of 3.1 Mm3/a in 1997, but by 1999 had beenreduced to 1.7 Mm3/a. OMPL supplies an additional 1Mm3/a to the Tsumeb Municipality from 3 wells, north-east of the smelter.Otavi is dependent on five wells and the inflow of an
67
View over the head of No. 2 shaft of theabandoned Berg Aukas Mine: Four strongsubmersible pumps of which each has acapacity of 360 m3/h were installed in theshaft in 1997 to lift groundwater from theopen underground mine workings and thedolomitic host rock. The four pumps canbe run simultaneously, but presently theset-up is two production pumps and onestand-by pump.
Dieter Plöthner

eighth of the total spring dis-charge of Otavifontein. Thetotal production of localwaterworks amounts to 0.5Mm3/a.The Brandwag wells
form the first phase of theKarstland scheme. These rel-atively shallow wells are sitedalong the south-eastern tipof the Otavi Valley-Uitkomst Syncline (I) next to the Nosib bedrock contact.Due to the prolonged dry period and low recharge, thescheme is currently dry. The Karstland scheme comprisessome stand-by wells east of Kombat Mine and one wellgallery of 20 stand-by wells tapping the dolomite aquifer ofthe Harasib-Olifantsfontein Syncline (III). These are shownon the Map. Tests done in 1996 estimated a total yield of3 Mm3/a for this scheme, yet it has never been fully imple-mented nor linked to the Eastern National Water Carrier,ENWC.Groundwater abstraction at the Berg Aukas-Otjituuo
scheme started in 1986. Some 0.7 Mm3/a from two strongwells is piped to Otjituuo to augment the local water sup-ply . Until it closed in 1978, Berg Aukas Mine drained morethan 4 Mm3 of groundwater annually. In 1996, the gear headof No.2 shaft was removed and 4 strong pumps each with acapacity of 360 m3/h were installed in the shaft shown inthe photograph. In 1999, an 80-day test run at dischargesvarying from 5 to 8.5 Mm3/a transferred 2 Mm3 of ground-water from the mine into the ENWC. Results showed thatthe long-term sustainable yield is assessed to be 2 Mm3/a atan expected drawdown of up to 150 m bgl, and that shouldit be necessary to cope with a 3-year water emergency inthe central region, the yield could be increased up to 6.5Mm3/a with an expected drawdown of up to 400 m bgl.Water abstraction from the Khusib Springs and Kom-
bat mines continued between 1996 and 2000, and afterthe take-over of the mines by Ongopolo from Tsumeb Cor-poration Limited, TCL, ore production recommenced inApril 2000. From 1995, when mining operations at KhusibSprings Mine commenced, water drainage increased from
0.3Mm3/a to 0.9Mm3/a in2001. About 80% of thedrained mine water is beingartificially recharged into thedolomite, while 20 % is usedfor ore dressing and to keepdust down. Kombat Mineincreased the mine waterdrainage rate from some 2Mm3/a in 1970 to more than6 Mm3/a in November 1988,
when the mine was accidentally flooded. Since October 1990,when mining operations resumed, mine water drainageincreased from 5.5 Mm3/a to 12.3 Mm3/a (1400 m3/h onan average) in 2001. Nearly half, 5.7 Mm3/a, of the minewater drained is exported via the ENWC, a quarter, 3.1Mm3/a, is used for ore dressing, processing and dust depres-sion, 22 % or 2.6 Mm3/a for irrigation of the golf course andpublic gardens in Kombat, and the remaining 0.9 Mm3/ais supplied to two commercial farmers to grow maize. Asthere is 250 ha of irrigable land in the vicinity of KombatMine, up to 4 Mm3/a of the mine water could be used forirrigation. Between 1998 and 2001 an average of 2.3 Mm3/aof Kombat Mine water supplied the Okakarara treatmentplant from where it can be piped further to Otjituuo, asdepicted on the Map. In October 2001, OMPL and NamWa-ter negotiated an assured supply of 4.4 Mm3/a from the minefor export to the ENWC at a price of 0.35 N$/m3.From 1921 to 1947, when still operational, Abenab Mine
drained 3 to 4 Mm3/a, this increased to 4.4 Mm3/a in thelast four years of operation (1955-1958) from Abenab WestMine. Groundwater is still abstracted for irrigation purposesat a rate of 0.2 Mm3/a.Annual drainage from the Tsumeb Mine was between
6 and 9.5 Mm3. In 1993, 5.9 Mm3/a of groundwater wasabstracted from the De Wet Shaft, of which 2.9 Mm3/a wasused by TCL for the ore washing plant and smelter andabout 2.5 Mm3/a supplied to Tsumeb Municipality. Inthe early 1990s, the oval-shaped cone of depression of themine extended some 9 km east-west and about 8 km north-south.
When mining and hence drainage ceased in June 1996,
68
Otjikoto Lake, one of the Karst sinkholes in Namibia
Dieter Plöthner

Tsumeb Mine got flooded, and due to the complicated karsthydrology of the mine workings, the water table rose slowlyup to 60 m bgl. By the end of July 2000, after the take-overof the mine by OMPL, drainage recommenced. The watertable dropped to 240 m bgl, where it is currently maintained.Groundwater was initially drained off at 5.3 Mm3/a butdecreased to 3.1 Mm3/a in 2001. About 20% of the minedrainage water is used on public gardens by the Municipalityof Tsumeb and the rest for ore dressing and processing,the smelter, and keeping down dust at the mine.In summary, Kombat and Berg Aukas mines can supply
from 6.4 Mm3/a to 16.5 Mm3/a to the ENWC, the latteronly in emergencies. As soon as Tsumeb and Abenab Westmines are linked to the ENWC, the water supplied by minescould be increased by 4 to 10 Mm3/a, totalling 10.4 to26.5 Mm3/a.Some 90 irrigation farms rely on groundwater within the
Otavi Mountain Land and its foreland, especially in thenorthern Tsumeb area where 83 farms abstract groundwa-ter to grow vegetables, maize, wheat, lucerne, cotton, andcitrus. Although only 1100 ha or 0.1% of the Tsumeb KarstAquifer area is under irrigation, 5.7 Mm3/a or 55% of thetotal groundwater is abstracted from the TKA for irrigation.As shown in the water balance of the Grootfontein Karst
Aquifer, more than 0.3 Mm3/a is pumped from Otjikotoand Guinas lakes for irrigation. The two lakes are collapsedsinkholes (dolina) in the dolomites of the Maieberg Formation and are the only permanent lakes in Namibia.The lakes have a diameter of 100 and 140m and a depth ofmore than 75 and 150m, respectively, and provide “windows” to the groundwater. They are also home to oneof Namibia’s rare, endemic fish species, the Otjikoto tilapia.Isotope data suggest that recharge to the two lakes is fromaltitudes from 1600 to 1900m asl, somewhere south ofTsumeb or north of Kombat. The travel time of the ground -water from the southern recharge areas to the lakes is esti-mated to be only 30-40m/a. West of Guinas Lake there aretwo other collapsed sinkholes on the farms Hoasis and Obab.Even though these are dry, boreholes sunk into the fillingof the sinkholes abstract groundwater for small-scale irri-gation, livestock watering and domestic water supply.In the GKA area, there are only 7 irrigation farms and
some 255 ha of land under irrigation, of which 185 ha isirrigated by Kombat Mine groundwater, 20 ha by springwater from Otavifontein and the remaining 50 ha by ground-water abstracted via boreholes. Rietfontein Farm, one of thefew dairies in the country, stopped irrigation when Riet-fontein spring dried up in 1989. In 2001, this large farmused 0.25 Mm3/a of groundwater abstracted by boreholes.Groundwater use for livestock farming is the same in the
Tsumeb Karst Aquifer area and Grootfontein Karst Aquiferarea, each use approximately 1 Mm3/a.
D PLÖTHNER
69
FURTHER READING
• Bäumle R, T Himmelsbach and R Bufler. 2001.Conceptual hydrogeological models to assess thegroundwater resources of the heterogeneous fractured aquifers at Tsumeb (NorthernNamibia). In: Seiler & Wohnlich (Eds): NewApproaches Characterising Groundwater Flow.Proceedings International IAH Congress,Munich.
• Hedberg RM. 1979. Stratigraphy of theOvambo land Basin, South West Africa. Bull.Precambrian Research Unit. University of CapeTown.
• Schmidt G and D Plöthner. 2000. Hydrogeo -logical Investigations in the Otavi MountainLand. In: Silio, O. et al. (Eds). Groundwater: Past Achievements and Future Challenges.Proceedings International IAH Congress, CapeTown.
• Schwartz MO and D Plöthner. 1999. Removal of heavy metals from mine water by carbonateprecipitation in the Grootfontein-OmatakoCanal, Namibia. Environmental Geology, 39.Tucson.
• Vogel JC and H van Urk. 1975. Isotopic com -position of groundwater in semi-arid regions ofsouthern Africa. Journal of Hydrology, 25.
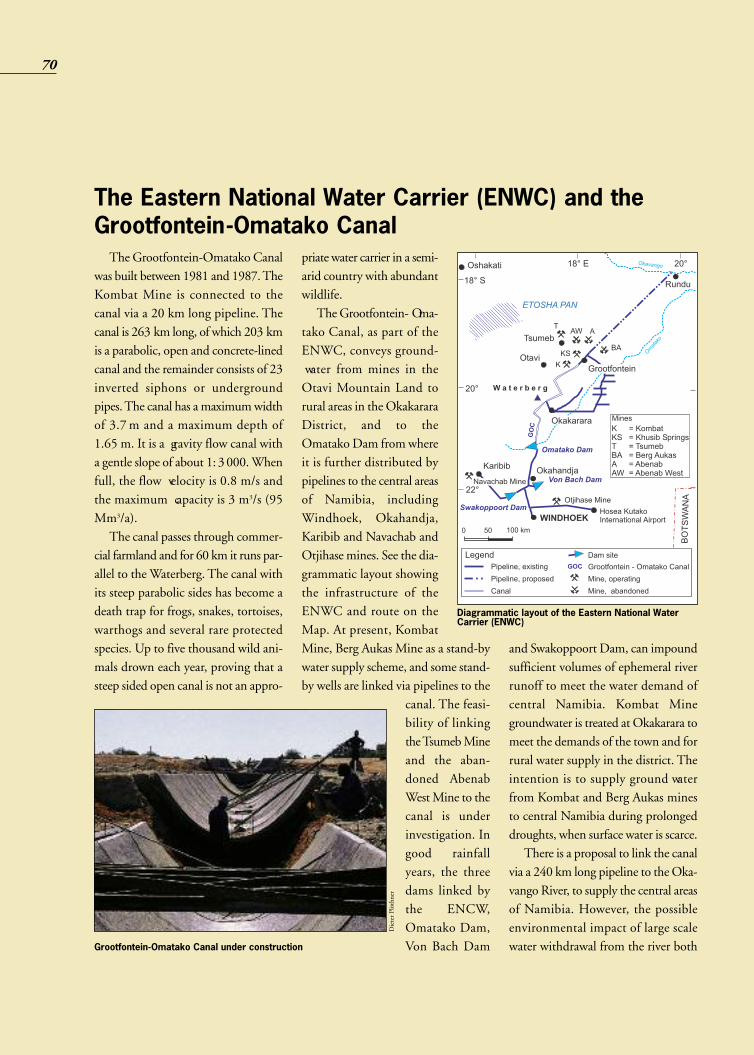
priate water carrier in a semi-arid country with abundantwildlife.The Grootfontein- Oma -
tako Canal, as part of theENWC, conveys ground - water from mines in theOtavi Mountain Land torural areas in the OkakararaDistrict, and to theOmatako Dam from whereit is further distributed bypipelines to the central areasof Namibia, includingWindhoek, Okahandja,Karibib and Navachab andOtjihase mines. See the dia-grammatic layout showingthe infrastructure of theENWC and route on theMap. At present, KombatMine, Berg Aukas Mine as a stand-bywater supply scheme, and some stand-by wells are linked via pipelines to the
canal. The feasi-bility of linkingthe Tsumeb Mineand the aban-doned AbenabWest Mine to thecanal is underinvestigation. Ingood rainfallyears, the threedams linked bythe ENCW,Omatako Dam,Von Bach Dam
and Swakoppoort Dam, can impoundsufficient volumes of ephemeral riverrunoff to meet the water demand ofcentral Namibia. Kombat Minegroundwater is treated at Okakarara tomeet the demands of the town and forrural water supply in the district. Theintention is to supply ground waterfrom Kombat and Berg Aukas minesto central Namibia during prolongeddroughts, when surface water is scarce.There is a proposal to link the canal
via a 240 km long pipeline to the Oka-vango River, to supply the central areasof Namibia. However, the possibleenvironmental impact of large scalewater withdrawal from the river both
Diagrammatic layout of the Eastern National WaterCarrier (ENWC)
The Grootfontein-Omatako Canalwas built between 1981 and 1987. TheKombat Mine is connected to thecanal via a 20 km long pipeline. Thecanal is 263 km long, of which 203 kmis a parabolic, open and concrete-linedcanal and the remainder consists of 23inverted siphons or undergroundpipes. The canal has a maximum widthof 3.7m and a maximum depth of1.65 m. It is a gravity flow canal witha gentle slope of about 1: 3000. Whenfull, the flow velocity is 0.8 m/s andthe maximum capacity is 3 m3/s (95Mm3/a).The canal passes through commer-
cial farmland and for 60 km it runs par-allel to the Waterberg. The canal withits steep parabolic sides has become adeath trap for frogs, snakes, tortoises,warthogs and several rare protectedspecies. Up to five thousand wild ani-mals drown each year, proving that asteep sided open canal is not an appro-
The Eastern National Water Carrier (ENWC) and theGrootfontein-Omatako Canal
Grootfontein-Omatako Canal under construction
70
Dieter Plöthner
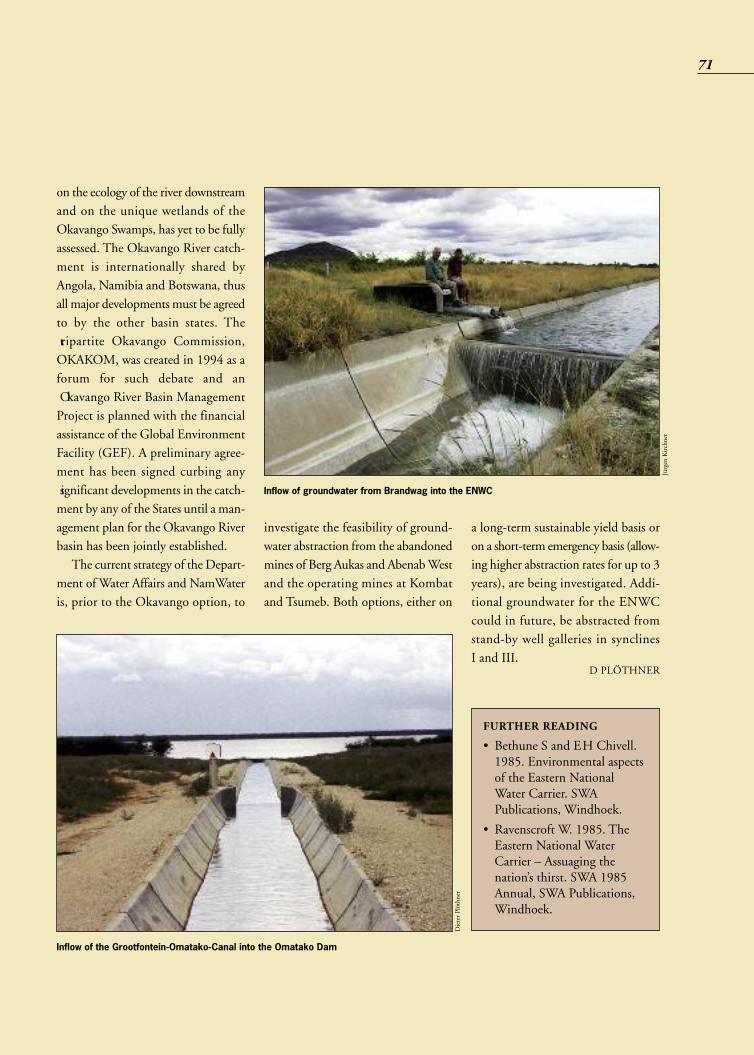
on the ecology of the river downstreamand on the unique wetlands of theOkavango Swamps, has yet to be fullyassessed. The Okavango River catch-ment is internationally shared byAngola, Namibia and Botswana, thusall major developments must be agreedto by the other basin states. The tripartite Okavango Commission,OKAKOM, was created in 1994 as aforum for such debate and an Okavango River Basin ManagementProject is planned with the financialassistance of the Global EnvironmentFacility (GEF). A preliminary agree-ment has been signed curbing any significant developments in the catch-ment by any of the States until a man-agement plan for the Okavango Riverbasin has been jointly established.The current strategy of the Depart-
ment of Water Affairs and NamWateris, prior to the Okavango option, to
investigate the feasibility of ground-water abstraction from the abandonedmines of Berg Aukas and Abenab Westand the operating mines at Kombatand Tsumeb. Both options, either on
a long-term sustainable yield basis oron a short-term emergency basis (allow-ing higher abstraction rates for up to 3years), are being investigated. Addi-tional groundwater for the ENWCcould in future, be abstracted fromstand-by well galleries in synclines I and III.
D PLÖTHNER
71
Inflow of groundwater from Brandwag into the ENWC
FURTHER READING
• Bethune S and EH Chivell.1985. Environmental aspectsof the Eastern NationalWater Carrier. SWAPublications, Windhoek.
• Ravenscroft W. 1985. TheEastern National WaterCarrier – Assuaging thenation’s thirst. SWA 1985Annual, SWA Publications,Windhoek.
Inflow of the Grootfontein-Omatako-Canal into the Omatako Dam
Jürgen Kirchner
Dieter Plöthner
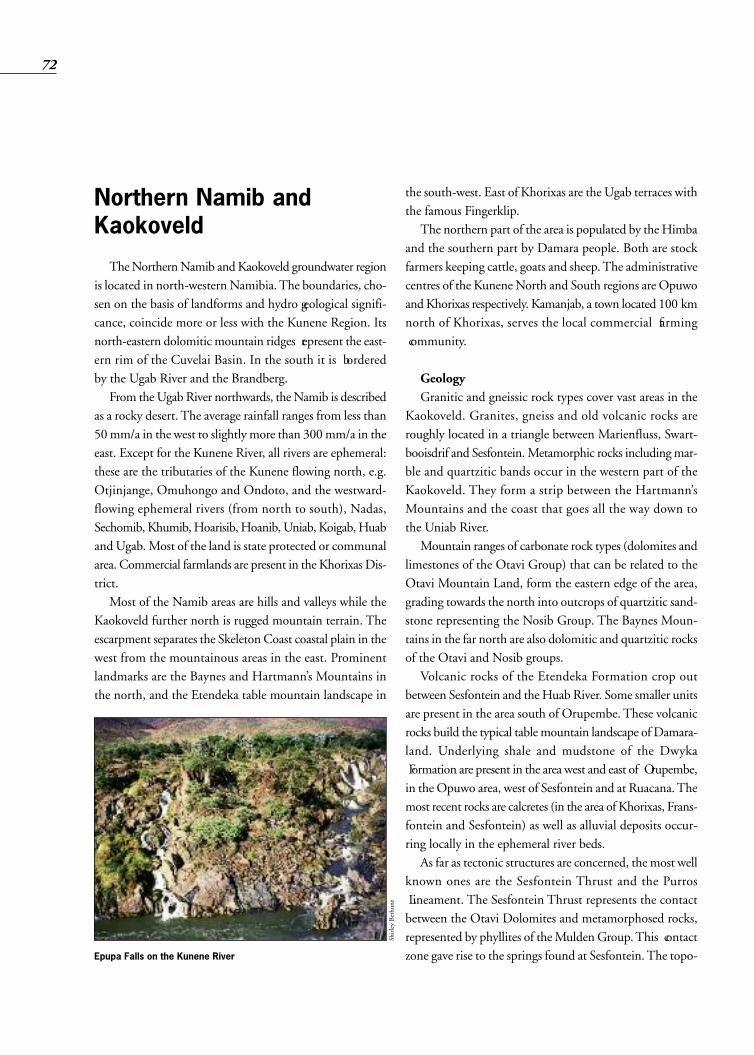
Northern Namib andKaokoveld
The Northern Namib and Kaokoveld groundwater regionis located in north-western Namibia. The boundaries, cho-sen on the basis of landforms and hydro geological signifi-cance, coincide more or less with the Kunene Region. Itsnorth-eastern dolomitic mountain ridges represent the east-ern rim of the Cuvelai Basin. In the south it is borderedby the Ugab River and the Brandberg.From the Ugab River northwards, the Namib is described
as a rocky desert. The average rainfall ranges from less than50mm/a in the west to slightly more than 300mm/a in theeast. Except for the Kunene River, all rivers are ephemeral:these are the tributaries of the Kunene flowing north, e.g.Otjinjange, Omuhongo and Ondoto, and the westward-flowing ephemeral rivers (from north to south), Nadas,Sechomib, Khumib, Hoarisib, Hoanib, Uniab, Koigab, Huaband Ugab. Most of the land is state protected or communalarea. Commercial farmlands are present in the Khorixas Dis-trict.Most of the Namib areas are hills and valleys while the
Kaokoveld further north is rugged mountain terrain. Theescarpment separates the Skeleton Coast coastal plain in thewest from the mountainous areas in the east. Prominentlandmarks are the Baynes and Hartmann’s Mountains inthe north, and the Etendeka table mountain landscape in
the south-west. East of Khorixas are the Ugab terraces withthe famous Fingerklip.The northern part of the area is populated by the Himba
and the southern part by Damara people. Both are stockfarmers keeping cattle, goats and sheep. The administrativecentres of the Kunene North and South regions are Opuwoand Khorixas respectively. Kamanjab, a town located 100 kmnorth of Khorixas, serves the local commercial farming community.
GeologyGranitic and gneissic rock types cover vast areas in the
Kaokoveld. Granites, gneiss and old volcanic rocks areroughly located in a triangle between Marienfluss, Swart-booisdrif and Sesfontein. Metamorphic rocks including mar-ble and quartzitic bands occur in the western part of theKaokoveld. They form a strip between the Hartmann’sMountains and the coast that goes all the way down tothe Uniab River.Mountain ranges of carbonate rock types (dolomites and
limestones of the Otavi Group) that can be related to theOtavi Mountain Land, form the eastern edge of the area,grading towards the north into outcrops of quartzitic sand-stone representing the Nosib Group. The Baynes Moun-tains in the far north are also dolomitic and quartzitic rocksof the Otavi and Nosib groups.Volcanic rocks of the Etendeka Formation crop out
between Sesfontein and the Huab River. Some smaller unitsare present in the area south of Orupembe. These volcanicrocks build the typical table mountain landscape of Damara -land. Underlying shale and mudstone of the Dwyka Formation are present in the area west and east of Orupembe,in the Opuwo area, west of Sesfontein and at Ruacana. Themost recent rocks are calcretes (in the area of Khorixas, Frans-fontein and Sesfontein) as well as alluvial deposits occur-ring locally in the ephemeral river beds. As far as tectonic structures are concerned, the most well
known ones are the Sesfontein Thrust and the Purros Lineament. The Sesfontein Thrust represents the contactbetween the Otavi Dolomites and metamorphosed rocks,represented by phyllites of the Mulden Group. This contactzone gave rise to the springs found at Sesfontein. The topo-
72
Epupa Falls on the Kunene River
Shirley Bethune

graphical location of the contact, on top of a hill, makes itimpossible to intersect by boreholes. The Purros Lineamenthas been investigated hydrogeologically but is not pro-ductive, despite some good yielding boreholes drilled on thelineament.
Hydrogeological fea-tures and utilisation ofgroundwaterThe region generally has a
low groundwater potential.The area with aquifer poten-tial, more or less reflects therainfall distribution, decreas-ing westwards. Know ledgeof the aquifers in this area issparse, due to the low num-ber of boreholes and fewgovernment investigationson groundwater. The area is well known
for its numerous springs that provide water for wildlife andto villages. Small-scale irrigation schemes are in operationat some of the higher yielding springs, like Warm quelle,Kaoko-Otavi and Sesfontein. There are also a number ofthermal springs in the area, e.g. Warmquelle, Ongongo,Monte Carlo and springs at Okangwati. Other well-knownsprings are Fransfontein, Gainatseb, Palmwag, Sarusas andOrupembe. The Sarusas spring, located in the lower reachesof the Khumib River, provides drinking water to wildlife inthe Skeleton Coast Park.Recharge from rainfall is an important parameter deter-
mining the groundwater potential, but the degree of metamorphism effects the groundwater potential too. Thegroundwater potential of rocks decreases, as the degree ofmetamorphism increases. Crystalline rocks, such as the various granites and gneisses that occur in the area, normallyexhibit a very low tendency to store water. Unfor tunately,as indicated by the lithology, most of the Kaokoveld is under -lain by rock that is either granitic, gneissic or meta morphosed.Therefore, the dark brown colours on the Map, represent - ing aquifers of very low potential, prevail in a triangle between
Swartbooisdrif, Kunene River mouth and the Uniab Rivermouth. Drilling targets in these hard rock areas are mainlyfractured zones and faults, but the success rate and yieldsfor these rock types are generally low. This can be consid-ered as one of the most difficult areas to drill for water.The area surrounding Okangwati is more promising due to
well-developed fractures andfaults that give rise to hotwater springs.Another zone of crystallinerocks, classified as granites,gneisses and old volcanicrocks, underlie a more or lesstriangular area betweenOtjovasando, Outjo and theconfluence of the Huab andAba Huab rivers. In geological terms this isknown as the KamanjabInlier and the KhoabendusFormation. The ground -
water potential of this rock unit is generally low, to locallymoderate; it improves as one goes further east, in the directionof increasing precipitation. Pump-tests done on boreholesin the Kamanjab area, however, illustrate that recharge isstill limited and does not occur very often in the westernparts of this zone, an area of mostly commercial farmlands.Kamanjab is a town that has outgrown its ground water
potential. The rocks of the area around Kamanjab (meta-sediments and granites of the Huab Complex overlain by volcanic rocks and meta-sediments of the KhoabendusGroup) have very little groundwater potential. A wellfield(42) to supply the town is clustered around a small earthdam that fails to provide significant recharge. Additionalboreholes drilled in the volcanic rocks at the airfield onthe farm Kamanjab Nord have similar low yields and limitedreserves. Recently, a new wellfield was installed on the farmKalkrand East east of Kamanjab in calcrete- covered HuabComplex, and dolomites of the Otavi Group north-eastof Kamanjab were also investigated as potential ground-water supply sources.Other small water supply schemes in crystalline rocks are
73
Spring east of Kaoko Otavi
Gwendal M
adec

for the schools at Anker andErwee. Anker (6), a schoolin the northern Brandbergarea is supplied with waterfrom three boreholes drilledon fractures in quartzite andgranite of the Huab Com-plex. The water quality hasdeteriorated from Group Bto C due to over-abstraction.Erwee (26) was establishedon the farm Grootberg westof Kamanjab in an areaunderlain by granite and meta-sediments of the Huab Com-plex. The low storage capacity of the rocks combined witherratic recharge and high consumption soon led to over-abstraction of the aquifer.The carbonate rocks (limestones and dolomites) of the
Otavi Group, located in the north-east of the area have moderate potential and are indicated by a light green colouron the Map. Nevertheless, where in contact with other rocktypes, particularly the non-porous sandstone, conglomer -ate and quartzites of the Nosib and Mulden Groups, weath-ering is enhanced by karstification processes and higheryields can be expected. These contact areas are indicated bydark green lines on the Map. The water supply scheme of Sesfontein (93) owes its
origin and name to the six fountains along the contact zonebetween dolomites of the Tsumeb Subgroup dolomiteaquifers and the underlying less permeable phyllites of theMulden Group (both Damara Sequence). A fort was builtin this favourable place in colonial times. As the townexpanded, the water supply from the fountains was supple -mented by boreholes, which in turn reduced the flow fromthe fountains. The yield of the water scheme is currentlyinsufficient to meet the growing demand.Another thin band of Otavi dolomites and limestones
extends all the way from the Otavi Mountain Land to theFransfontein area. The southern contact of this dolomiteridge is a good drilling target for establishing productiveboreholes (indicated as dark green) but the northern contactis less productive. Fransfontein owes its origin to springs
issuing from the dolomites.The springs are however notused for hu man consump-tion. In stead ground water issupplied from boreholes onfractured dolomite for theFransfontein water supplyscheme (27). The Khorixas water supplyscheme (47) is similar.Ground water is pumped 30km away from Braunfelswhere high-yielding bore-
holes are drilled into calcretes underlain by fractured dolomiteof the Otavi Group. The Gainatseb spring yielding between 80-100m3/h also
forms part of this scheme and contributes to the water sup-ply of Khorixas, a sprawling town with an uncommonly highwater demand. Other thick groundwater calcrete depositsin the Khorixas area, known as the Ugab terraces, are drainedby the Ugab River itself and contain little groundwater.Mudstones and shales of the Chuos Formation are found
between the Otavi Group dolomites. The groundwater poten-tial of this unit is very limited but the dolomite in contactwith the Chuos is karstified at the contact plains and pro-vides high-yielding boreholes. High concentrations of ironare associated with the groundwater in the Chuos Formation.The groundwater potential of the shale and mudstone
deposits belonging to the Dwyka is generally very limited.Where the Dwyka sediments have been deposited in deepincised glacial valleys, the potential is better as illustrated bythe Opuwo wellfield and at Ruacana. Most of these better-yielding boreholes have been drilled on the sides of these deepvalleys, but sometimes give water quality problems. The water supply scheme of Opuwo (76) comes from
a Dwyka shale aquifer, known as the north-western well-field, and from a sandstone and shale aquifer of the south-eastern wellfield. Yields of the sandstone aquifer are low butthat from the north-west wellfield exceed 15 m3/h, butthe water quality falls in Group C and D. Little is yet known about the groundwater potential of
the young volcanic rocks of the Etendeka Formation. As
74
Skeleton Coast, Khumib River: Sarusas spring near WildernessRest Camp
Jürgen Kirchner

numerous springs issue from these rocks all over the area,the groundwater potential is expected to be higher than thatof the metamorphic and granitic rocks. Most of the Etendekais however located in the far west, where direct recharge fromrainfall only occurs infrequently. The water supply schemeof the Bergsig (13) settlement and school obtains its waterfrom fractured basalt of the Cretaceous Etendeka Forma-tion. The stored reserves are limited and recharge is low.In contrast, where boreholes and wells have been sunk inthe eastern, higher rainfall area, the yields are significantlyhigher. Some of the most exclusive wilderness resorts, suchas Etendeka Mountain Camp, rely on these springs and areappropriately managed to keep the water consumption tothe minimum.In the ephemeral rivers, alluvial groundwater is in many
cases tapped by boreholes and hand-dug wells. It providesan important groundwater resource, especially in the westernhalf of the area. Boreholes drilled in bedrock nearby are alsosustained by alluvial groundwater. The groundwater poten-tial of these drainage lines is considered far better than thesurrounding rock. This is indicated by light blue on theMap. To improve the sustainability of boreholes drilled inpoor productivity areas, it is common practise to artificiallyrecharge the groundwater bodies using small-scale dams(ground swells or sand dams) built in the riverbed.The camp at Terrace Bay is supplied with water from the
alluvial aquifer in the Uniab River, 20 km to the south. Theriver flows infrequently but when it floods it can destroy theproduction boreholes. The water quality varies from GroupA-D depending on recharge, as the salinity increases withtime, due to evaporation. The entire area is dependent on groundwater resources
for domestic purposes and stock watering. Since commu-nal farmland occupies most of the area, the Directorate ofRural Water Supply is responsible for most of the water sup-plied to these farms. Water supply schemes operated byNamWater provide groundwater to the urban centres ofKhorixas, Opuwo, and Kamanjab, as well as to some of thesmaller villages such as Anker, Bergsig, Erwee and Frans-fontein. P BOTHA, A VAN WYK
The Brandberg, Erongoand Waterberg Area
The Brandberg, Erongo and Waterberg groundwater areaincludes the Waterberg in the north-east and stretches downto the Atlantic coast in the south-west. It covers most of thewestern part of the Otjozondjupa Region and the northernErongo Region. Otjiwarongo and Okahandja are situatedon the eastern edge of the area. The Waterberg Plateau Parkrun by Namibia Wildlife Resorts is a major tourist attrac-tion dependent on groundwater within this area.Most of the area is more than 1300 m above mean sea
level. Westwards, within an approximately 100 km-widezone, the land surface drops to sea level. The eastern portionof the area is of relatively flat topography with dispersedinselbergs like the twin Omatako peaks, the Paresis andErongo mountains. The Waterberg and Mount Etjo are flatplateau-type mountains. Towards the west, this old sur-face is characterised by more mountainous terrain with reg-ular, generally westward-flowing rivers. While the OmatakoOmuramba drains towards the east and finally to the north-east, the Ugab and several smaller rivers drain towards thewest coast. Annual average rainfall de creases from a highof more than 400 mm in theeast to below 50 mm westof the escarpment.
GeologyThe area is situated in the
centre of the Damaratrough. Classical geosynclinesedimentation produced athick pile of ill-sorted sedi-ments, which form theUgab and Khomas sub-groups of the SwakopGroup (Damara Sequence).On the platform edges ofthe trough chiefly calcare-ous sediments weredeposited. Both rock suites
75
Otjosongomingo (Kleiner Waterberg)
Jürgen Kirchner

were subsequently folded and metamorphosed, and graniticintrusion took place. Bands of marble and quartzite in theseotherwise phyllitic metamorphic rocks are of hydrogeo-logical significance. The youngest intrusive rocks in the areaare complexes of post-Karoo age like the Brandberg, Mes-sum Crater in the Goboboseb Mountains, Paresis Moun-tain and scattered smaller outcrops.Major north-east striking faults and thrusts, and north-
striking faults form the present outcrop boundary of youngerrocks mainly represented by aeolian sandstones of the EtjoFormation at the Waterberg and Mount Etjo. These sand-stones overlie the argillaceous sediments of the OmingondeFormation, which dominate the geology between the farmsOhakaue in the north and Vrede in the south. To the westof the Otjiwarongo-Omaruru tar road, these young sedi-mentary rocks are absent, except for some outcrop of Karoowest of the Brandberg. Two bodies of older lavas and asso-ciated pyroclastics occur south-east of Khorixas, while basaltflows of Karoo age form the Goboboseb Mountains.
HydrogeologyIn the eastern part of the area, the Waterberg Plateau
forms a major hydrogeological structure. Here, Etjo sand-stone rests with an unconformity on the underlying Omin-gonde argillite, giving rise to a series of contact fountainsthat drain water from the porous sandstone. Owing to thegeneral dip of the contact plane, springs emerge on the south-ern slope of the Waterberg and the northern edge of the
Klein Waterberg. Although this gives the impression of anabundance of groundwater, this area generally has only mod-erate to poor groundwater potential. The springs collectgroundwater over a large area of sandstone outcrop and con-centrate the flow along a shallow contact zone. The touristcamp of Bernabé de la Bat receives spring water from thesesprings discharging some 3 m3/h. The outflow is capturedin a pit, and two thirds of the spring water is used by theresort while one third goes to a nearby farm house, leav-ing none to sustain what was once a productive wetland.The Omingonde Formation generally has low ground-
water potential owing to the argillaceous character of therocks. Locally though, especially at contact zones towardsintrusive dolerites, this can improve to moderate poten-tial. Faults can also be good targets for exploration. A waterscheme on the Omingonde Formation was established atthe Omatako Dam (70) to supply operations personnel.The low-yielding boreholes supply Group B-D water. Atthe former Osire (78) police station, now a refugee camp,water is found in the Omingonde Formation, which is over-lain by Kalahari sediments. The high water demand dueto the increasing number of refugees is depleting theresources.The groundwater potential of fractured aquifers in the
Swakop Group of the Damara Sequence is generally low.However, the carbonates (marbles and limestones) are ofmoderate potential and at properly selected targets like fracture zones and karstified contact zones, even high yieldscan be found. This depends on the amount of rainfall andassociated weathering and recharge. The most significantaquifer presently utilised is the marble aquifer north andnorth-east of Otjiwarongo (82). The water supply schemerelies on a fractured and slightly karstified marble band ofthe Karibib Formation, which allows medium to high pump-ing rates and supplies Group B water. The number of bore-holes was increased to over 20 to keep up with the demand,and the scheme is spread over an area of 15 x 30 km.The water supply scheme of Kalkfeld (40) is situated
between Omaruru and Otjiwarongo in an area underlainby meta-sediments and granites of the Damara Sequence thathave a low groundwater potential. A small dam was built toprovide additional recharge to boreholes and a well. Some
76
Spring at Bernabé de la Bat, Waterberg
Jürgen Kirchner
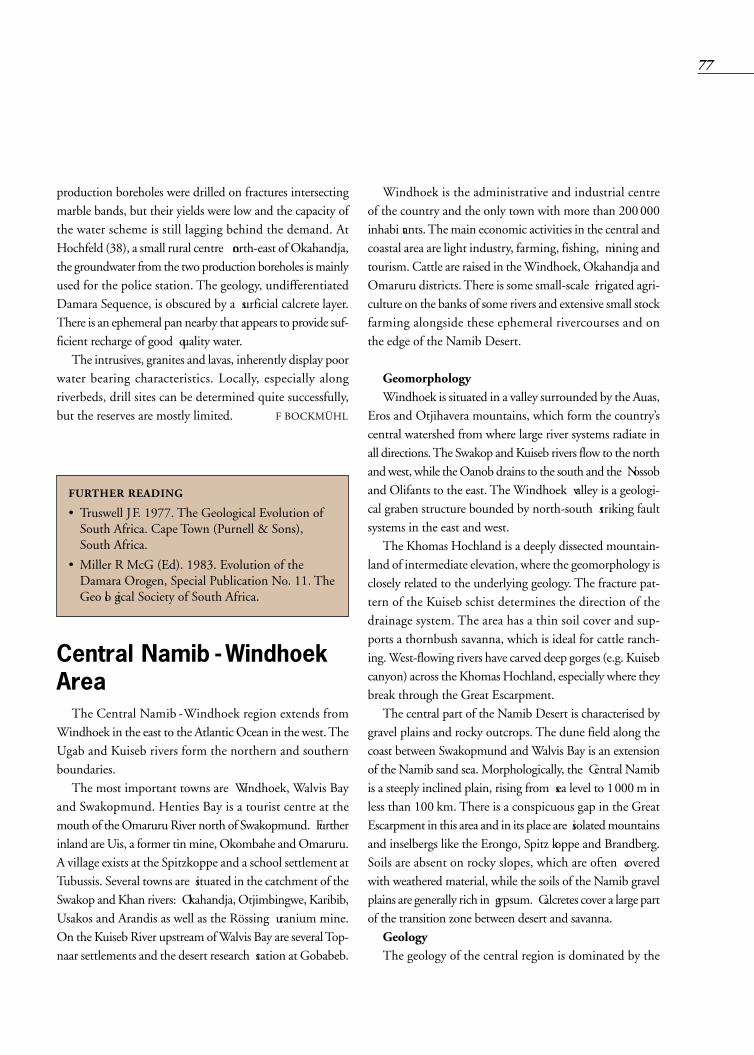
production boreholes were drilled on fractures intersectingmarble bands, but their yields were low and the capacity ofthe water scheme is still lagging behind the demand. AtHochfeld (38), a small rural centre north-east of Okahandja,the groundwater from the two production boreholes is mainlyused for the police station. The geology, undifferentiatedDamara Sequence, is obscured by a surficial calcrete layer.There is an ephemeral pan nearby that appears to provide suf-ficient recharge of good quality water.The intrusives, granites and lavas, inherently display poor
water bearing characteristics. Locally, especially alongriverbeds, drill sites can be determined quite successfully,but the reserves are mostly limited. F BOCKMÜHL
Central Namib -WindhoekAreaThe Central Namib -Windhoek region extends from
Windhoek in the east to the Atlantic Ocean in the west. TheUgab and Kuiseb rivers form the northern and southernboundaries. The most important towns are Windhoek, Walvis Bay
and Swakopmund. Henties Bay is a tourist centre at themouth of the Omaruru River north of Swakopmund. Furtherinland are Uis, a former tin mine, Okombahe and Omaruru.A village exists at the Spitzkoppe and a school settlement atTubussis. Several towns are situated in the catchment of theSwakop and Khan rivers: Okahandja, Otjimbingwe, Karibib,Usakos and Arandis as well as the Rössing uranium mine.On the Kuiseb River upstream of Walvis Bay are several Top-naar settlements and the desert research station at Gobabeb.
Windhoek is the administrative and industrial centreof the country and the only town with more than 200000inhabi tants. The main economic activities in the central andcoastal area are light industry, farming, fishing, mining andtourism. Cattle are raised in the Windhoek, Okahandja andOmaruru districts. There is some small-scale irrigated agri-culture on the banks of some rivers and extensive small stockfarming alongside these ephemeral rivercourses and onthe edge of the Namib Desert.
GeomorphologyWindhoek is situated in a valley surrounded by the Auas,
Eros and Otjihavera mountains, which form the country’scentral watershed from where large river systems radiate inall directions. The Swakop and Kuiseb rivers flow to the northand west, while the Oanob drains to the south and the Nossoband Olifants to the east. The Windhoek valley is a geologi-cal graben structure bounded by north-south striking faultsystems in the east and west.The Khomas Hochland is a deeply dissected mountain-
land of intermediate elevation, where the geomorphology isclosely related to the underlying geology. The fracture pat-tern of the Kuiseb schist determines the direction of thedrainage system. The area has a thin soil cover and sup-ports a thornbush savanna, which is ideal for cattle ranch-ing. West-flowing rivers have carved deep gorges (e.g. Kuisebcanyon) across the Khomas Hochland, especially where theybreak through the Great Escarpment.The central part of the Namib Desert is characterised by
gravel plains and rocky outcrops. The dune field along thecoast between Swakopmund and Walvis Bay is an extensionof the Namib sand sea. Morphologically, the Central Namibis a steeply inclined plain, rising from sea level to 1000m inless than 100 km. There is a conspicuous gap in the GreatEscarpment in this area and in its place are isolated mountainsand inselbergs like the Erongo, Spitz koppe and Brandberg.Soils are absent on rocky slopes, which are often coveredwith weathered material, while the soils of the Namib gravelplains are generally rich in gypsum. Calcretes cover a large partof the transition zone between desert and savanna.GeologyThe geology of the central region is dominated by the
77
FURTHER READING
• Truswell JF. 1977. The Geological Evolution ofSouth Africa. Cape Town (Purnell & Sons),South Africa.
• Miller R McG (Ed). 1983. Evolution of theDamara Orogen, Special Publication No. 11. TheGeo lo gical Society of South Africa.
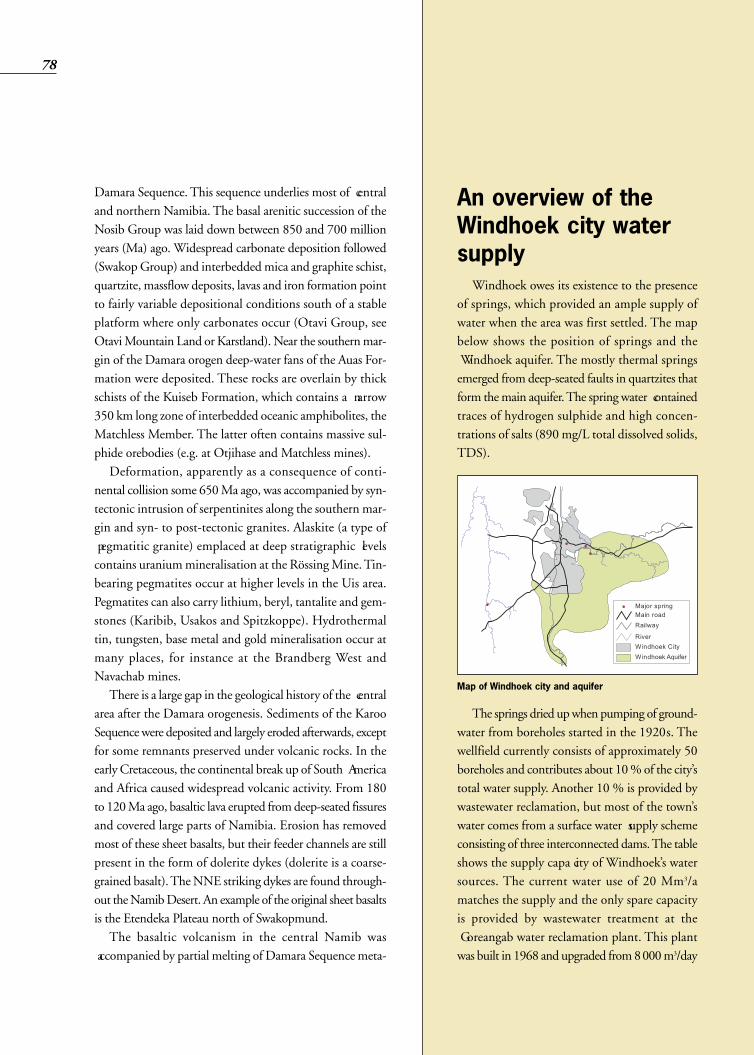
Damara Sequence. This sequence underlies most of centraland northern Namibia. The basal arenitic succession of theNosib Group was laid down between 850 and 700 millionyears (Ma) ago. Widespread carbonate deposition followed(Swakop Group) and interbedded mica and graphite schist,quartzite, massflow deposits, lavas and iron formation pointto fairly variable depositional conditions south of a stableplatform where only carbonates occur (Otavi Group, seeOtavi Mountain Land or Karstland). Near the southern mar-gin of the Damara orogen deep-water fans of the Auas For-mation were deposited. These rocks are overlain by thickschists of the Kuiseb Formation, which contains a narrow350 km long zone of interbedded oceanic amphibolites, theMatchless Member. The latter often contains massive sul-phide orebodies (e.g. at Otjihase and Matchless mines).Deformation, apparently as a consequence of conti-
nental collision some 650 Ma ago, was accompanied by syn-tectonic intrusion of serpentinites along the southern mar-gin and syn- to post-tectonic granites. Alaskite (a type of pegmatitic granite) emplaced at deep stratigraphic levelscontains uranium mineralisation at the Rössing Mine. Tin-bearing pegmatites occur at higher levels in the Uis area.Pegmatites can also carry lithium, beryl, tantalite and gem-stones (Karibib, Usakos and Spitzkoppe). Hydrothermaltin, tungsten, base metal and gold mineralisation occur atmany places, for instance at the Brandberg West andNavachab mines.There is a large gap in the geological history of the central
area after the Damara orogenesis. Sediments of the KarooSequence were deposited and largely eroded afterwards, exceptfor some remnants preserved under volcanic rocks. In theearly Cretaceous, the continental break up of South Americaand Africa caused widespread volcanic activity. From 180to 120 Ma ago, basaltic lava erupted from deep-seated fissuresand covered large parts of Namibia. Erosion has removedmost of these sheet basalts, but their feeder channels are stillpresent in the form of dolerite dykes (dolerite is a coarse-grained basalt). The NNE striking dykes are found through-out the Namib Desert. An example of the original sheet basaltsis the Etendeka Plateau north of Swakopmund.The basaltic volcanism in the central Namib was
accompanied by partial melting of Damara Sequence meta-
An overview of theWindhoek city watersupplyWindhoek owes its existence to the presence
of springs, which provided an ample supply ofwater when the area was first settled. The mapbelow shows the position of springs and the Windhoek aquifer. The mostly thermal springsemerged from deep-seated faults in quartzites thatform the main aquifer. The spring water containedtraces of hydrogen sulphide and high concen-trations of salts (890 mg/L total dissolved solids,TDS).
The springs dried up when pumping of ground-water from boreholes started in the 1920s. Thewellfield currently consists of approximately 50boreholes and contributes about 10% of the city’stotal water supply. Another 10 % is provided bywastewater reclamation, but most of the town’swater comes from a surface water supply schemeconsisting of three interconnected dams. The tableshows the supply capa city of Windhoek’s watersources. The current water use of 20 Mm3/amatches the supply and the only spare capacityis provided by wastewater treatment at the Goreangab water reclamation plant. This plantwas built in 1968 and upgraded from 8000 m3/day
78
Map of Windhoek city and aquifer
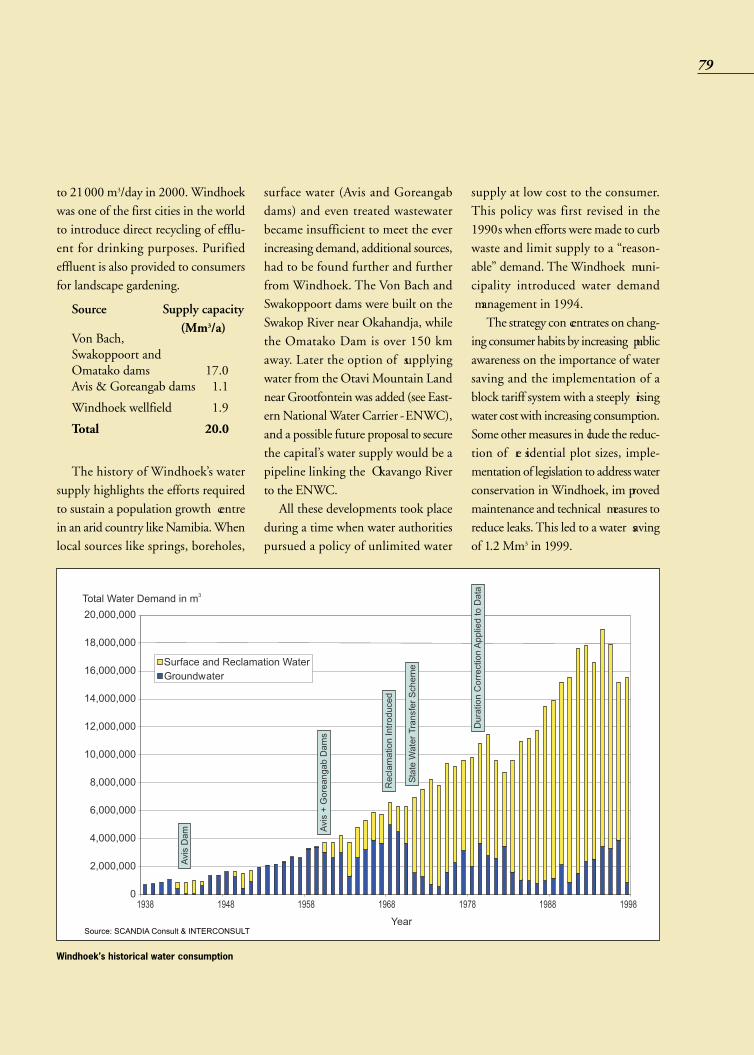
to 21000 m3/day in 2000. Windhoekwas one of the first cities in the worldto introduce direct recycling of efflu-ent for drinking purposes. Purifiedeffluent is also provided to consumersfor landscape gardening.
Source Supply capacity (Mm3/a)
Von Bach, Swakoppoort and Omatako dams 17.0Avis & Goreangab dams 1.1
Windhoek wellfield 1.9
Total 20.0
The history of Windhoek’s watersupply highlights the efforts requiredto sustain a population growth centrein an arid country like Namibia. Whenlocal sources like springs, boreholes,
surface water (Avis and Goreangabdams) and even treated wastewaterbecame insufficient to meet the everincreasing demand, additional sources,had to be found further and furtherfrom Windhoek. The Von Bach andSwakoppoort dams were built on theSwakop River near Okahandja, whilethe Omatako Dam is over 150 kmaway. Later the option of supplyingwater from the Otavi Mountain Landnear Grootfontein was added (see East-ern National Water Carrier -ENWC),and a possible future proposal to securethe capital’s water supply would be apipeline linking the Okavango Riverto the ENWC.All these developments took place
during a time when water authoritiespursued a policy of unlimited water
supply at low cost to the consumer.This policy was first revised in the1990s when efforts were made to curbwaste and limit supply to a “reason-able” demand. The Windhoek muni -cipality introduced water demand management in 1994. The strategy con centrates on chang-
ing consumer habits by increasing publicawareness on the importance of watersaving and the implementation of ablock tariff system with a steeply risingwater cost with increasing consumption.Some other measures in clude the reduc-tion of re sidential plot sizes, imple-mentation of legislation to address waterconservation in Windhoek, im provedmaintenance and technical measures toreduce leaks. This led to a water savingof 1.2 Mm3 in 1999.
79
Windhoek’s historical water consumption
Source: SCANDIA Consult & INTERCONSULT
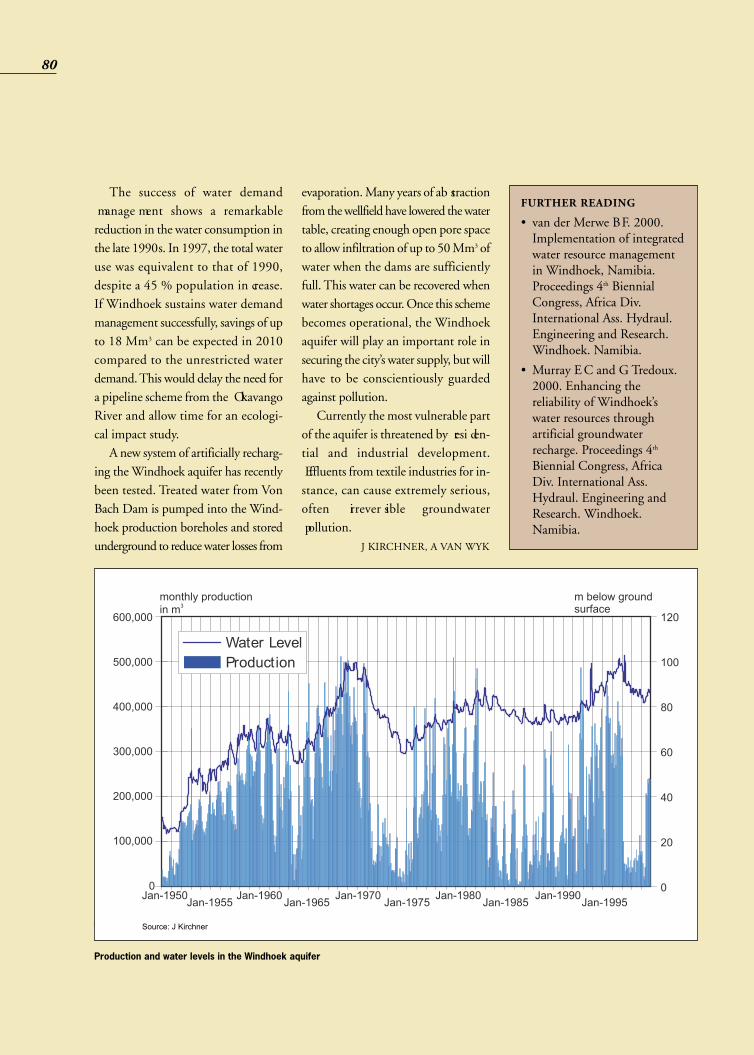
The success of water demand manage ment shows a remarkablereduction in the water consumption inthe late 1990s. In 1997, the total wateruse was equivalent to that of 1990,despite a 45 % population in crease.If Windhoek sustains water demandmanagement successfully, savings of upto 18 Mm3 can be expected in 2010compared to the unrestricted waterdemand. This would delay the need fora pipeline scheme from the OkavangoRiver and allow time for an ecologi-cal impact study.A new system of artificially recharg-
ing the Windhoek aquifer has recentlybeen tested. Treated water from VonBach Dam is pumped into the Wind-hoek production boreholes and storedunderground to reduce water losses from
evaporation. Many years of ab stractionfrom the wellfield have lowered the watertable, creating enough open pore spaceto allow infiltration of up to 50 Mm3 ofwater when the dams are sufficientlyfull. This water can be recovered whenwater shortages occur. Once this schemebecomes operational, the Windhoekaquifer will play an important role insecuring the city’s water supply, but willhave to be conscientiously guardedagainst pollution. Currently the most vulnerable part
of the aquifer is threatened by resi den -tial and industrial development. Effluents from textile industries for in -stance, can cause extremely serious,often irrever sible groundwater pollution.
J KIRCHNER, A VAN WYK
80
Production and water levels in the Windhoek aquifer
FURTHER READING
• van der Merwe BF. 2000.Implementation of integratedwater resource managementin Windhoek, Namibia.Proceedings 4th BiennialCongress, Africa Div.International Ass. Hydraul.Engineering and Research.Windhoek. Namibia.
• Murray EC and G Tredoux.2000. Enhancing thereliability of Windhoek’swater resources throughartificial groundwaterrecharge. Proceedings 4th
Biennial Congress, AfricaDiv. International Ass.Hydraul. Engineering andResearch. Windhoek.Namibia.
Source: J Kirchner

morphites, which produced granitic or granodioritic rocks.These intrusions formed ring complexes such as the ErongoMountains, Spitzkoppe and Brandberg. The Erongo is acomposite magmatic complex consisting of a lower basaltlayer (part of the sheet basalts) overlain by grano dioritic/rhyolitic volcanics and intruded by younger Erongo granite.The granites of the Erongo, Brandberg and Spitzkoppe
in truded into the earth crust, but later erosion removed thesur rounding rocks and left the harder granites towering overthe plains. The Namib was uplifted rapidly by epirogenicforces and subjected to considerable erosion (possibly 2-3km) in the early Cretaceous (120-100 Ma ago).The erosion phase was terminated by a change in climate
from humid to arid. The oldest Tertiary sediments are reddish, semi-consolidated, sandstones of the Tsondab Formation that were originally windblown dune-sands. Aslightly wetter climate caused the deposition of conglom-erates and gravels in the broad valleys of precursors to thepresent west-flowing rivers. This formation is known asKarpfenkliff conglomerate in the Kuiseb valley.Both Tsondab Sandstone and the younger gravels are
capped by pedogenic calcretes, which were formed duringa long period of semi-arid climate and tectonic stability. Arenewed uplifting phase in the late Tertiary caused the inci-sion of the major rivers in the Namib. The Oswater conglomerate was formed in the newly incised Kuisebcanyon. Periods of erosion and sedimentation under varying
climatic conditions created terraces with remnants of gravel,sand or silt deposits throughout the late Tertiary and Pleistocene. Short-lived wetter intervals gave rise to localpan carbonates and spring tufa deposits.
HydrogeologyThe fact that most towns in the western Central Region
are situated on or near rivers is a reflection of ground wateravailability in the area. Sufficient water for larger settle mentscan only be obtained by surface water storage in dams orfrom alluvial aquifers, while the potential of bedrock aquifersis very limited. This is partly due to the low rainfall and lackof recharge, and partly to the generally unfavourable aquiferproperties of Damara Sequence rocks.
Only the quartzite aquifer in the Windhoek area canbe classified as high yielding. The Windhoek aquifer is devel-oped in an area that exhibits numerous north to north-weststriking faults and extensive jointing. The high yields of theAuas quartzites are due to secondary porosity derived frombrittle deformation, while the interbedded schist layers weremore susceptible to plastic deformation. The primary poros-ity and hydraulic conductivity of both quartzite and schistare negligible. The faults associated with the developmentof the Windhoek graben are generally north-south subverticaltension faults. They form the major water conductors in theWindhoek area and extend as a zone of moderate poten-tial northward towards Okahandja. Equally moderate yieldsare found in the Auas quartzites south-west and north-east of Windhoek.The Windhoek aquifer is recharged mainly by direct infil-
tration of rainwater over areas of quartzite outcrop. In areasunderlain by schist, direct recharge is possible along faultzones. The presence of strong flows of hot water in faultzones some 3 to 4 km north of the main quartzite outcroparea indicates deep groundwater circulation. The mean ageof water pumped from Windhoek boreholes is approxi-mately 12000 years. Boreholes close to the Avis Dam receiveindirect recharge when the dam contains water (see Box on“An overview of the Windhoek city water supply”).The Khomas Hochland situated between the Kuiseb and
Swakop rivers is underlain by mica schist with occasionalquartzite intercalations. Higher rainfall east of Windhoekleads to enhanced chemical weathering of the schist andthus less recharge, while joints and fractures in the KhomasHighland tend to be open. The prevailing fracture directionsare north-south, north-west and north-east. Mean boreholeyields of about 2.4 m3/h are encountered east of Windhoek,9 m3/h in Windhoek and 2.9 m3/h further west. Boreholesuccess rates and yields decrease towards the Namib.Main targets for geological site selection are steeply
dipping north-south trending fractures and joint zones, ifpossible in competent rocks, although feldspathic quartzitesshould be avoided. Farm dams in the vicinity have a notice-able influence on borehole yields as long as they containwater. Thus it is standard practice to site boreholes near damsto render the supply more reliable. Marble bands also have
81
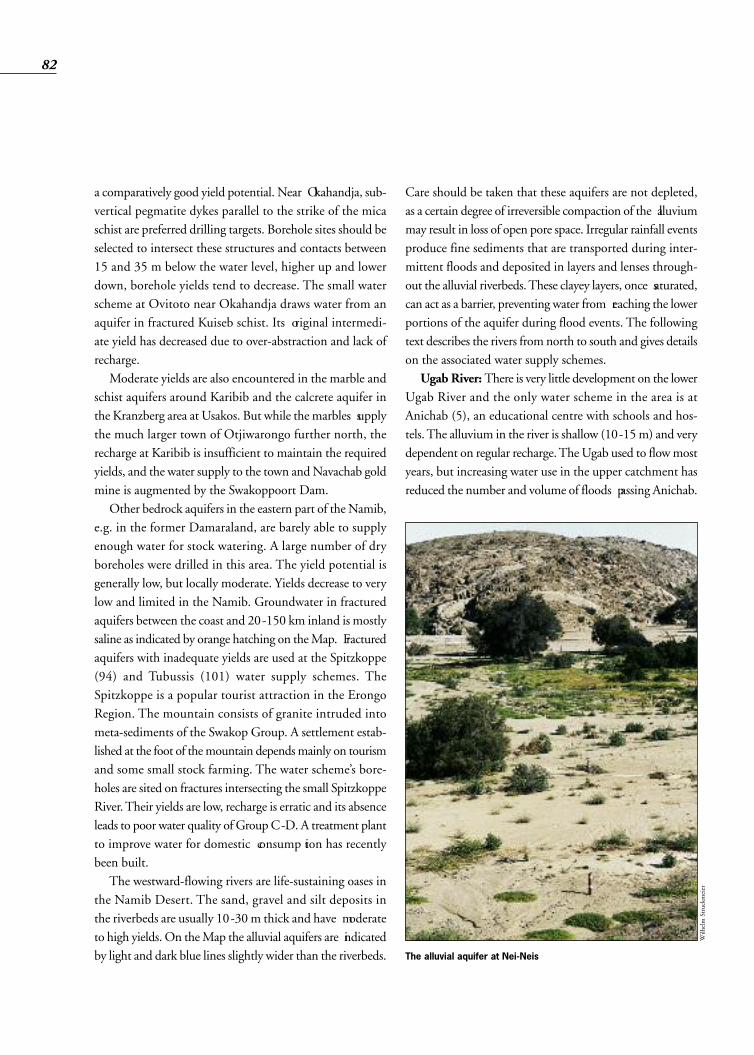
a comparatively good yield potential. Near Okahandja, sub-vertical pegmatite dykes parallel to the strike of the micaschist are preferred drilling targets. Borehole sites should beselected to intersect these structures and contacts between15 and 35 m below the water level, higher up and lowerdown, borehole yields tend to decrease. The small waterscheme at Ovitoto near Okahandja draws water from anaquifer in fractured Kuiseb schist. Its original intermedi-ate yield has decreased due to over-abstraction and lack ofrecharge.Moderate yields are also encountered in the marble and
schist aquifers around Karibib and the calcrete aquifer inthe Kranzberg area at Usakos. But while the marbles supplythe much larger town of Otjiwarongo further north, therecharge at Karibib is insufficient to maintain the requiredyields, and the water supply to the town and Navachab goldmine is augmented by the Swakoppoort Dam.Other bedrock aquifers in the eastern part of the Namib,
e.g. in the former Damaraland, are barely able to supplyenough water for stock watering. A large number of dryboreholes were drilled in this area. The yield potential isgenerally low, but locally moderate. Yields decrease to verylow and limited in the Namib. Groundwater in fracturedaquifers between the coast and 20-150 km inland is mostlysaline as indicated by orange hatching on the Map. Fracturedaquifers with inadequate yields are used at the Spitzkoppe(94) and Tubussis (101) water supply schemes. TheSpitzkoppe is a popular tourist attraction in the ErongoRegion. The mountain consists of granite intruded intometa-sediments of the Swakop Group. A settlement estab-lished at the foot of the mountain depends mainly on tourismand some small stock farming. The water scheme’s bore-holes are sited on fractures intersecting the small SpitzkoppeRiver. Their yields are low, recharge is erratic and its absenceleads to poor water quality of Group C-D. A treatment plantto improve water for domestic consump tion has recentlybeen built.The westward-flowing rivers are life-sustaining oases in
the Namib Desert. The sand, gravel and silt deposits inthe riverbeds are usually 10-30 m thick and have moderateto high yields. On the Map the alluvial aquifers are indicatedby light and dark blue lines slightly wider than the riverbeds.
Care should be taken that these aquifers are not depleted,as a certain degree of irreversible compaction of the alluviummay result in loss of open pore space. Irregular rainfall eventsproduce fine sediments that are transported during inter-mittent floods and deposited in layers and lenses through-out the alluvial riverbeds. These clayey layers, once saturated,can act as a barrier, preventing water from reaching the lowerportions of the aquifer during flood events. The followingtext describes the rivers from north to south and gives detailson the associated water supply schemes.Ugab River: There is very little development on the lower
Ugab River and the only water scheme in the area is atAnichab (5), an educational centre with schools and hos-tels. The alluvium in the river is shallow (10-15 m) and verydependent on regular recharge. The Ugab used to flow mostyears, but increasing water use in the upper catchment hasreduced the number and volume of floods passing Anichab.
82
The alluvial aquifer at Nei-Neis
Wilhelm Struckm
eier
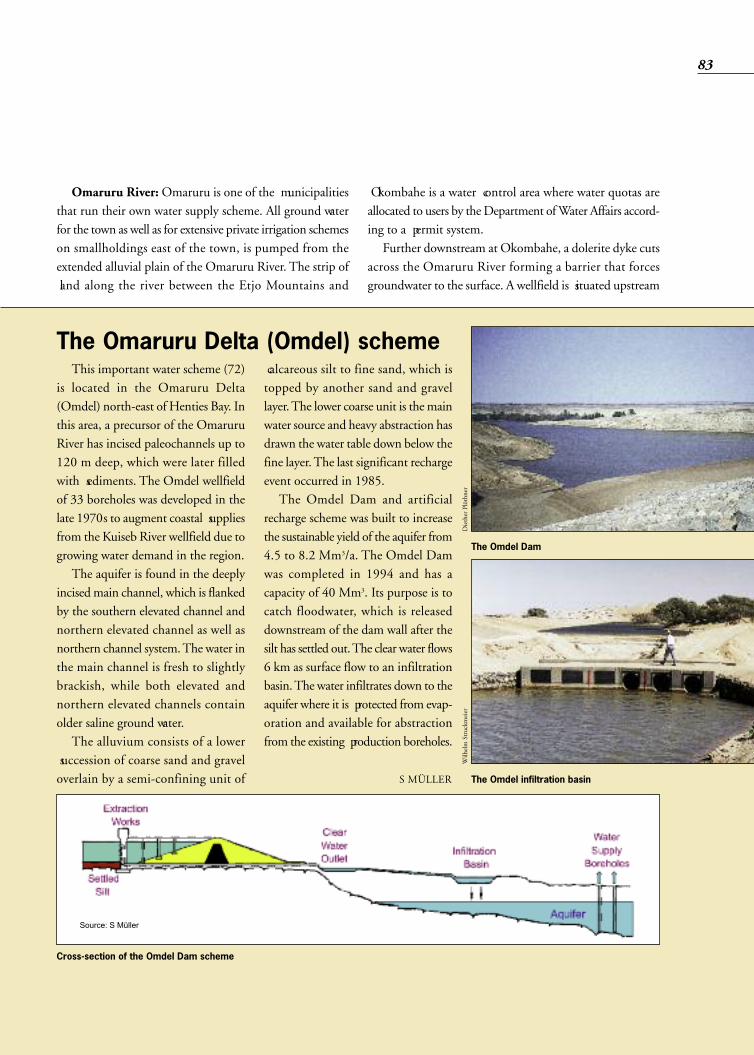
This important water scheme (72)is located in the Omaruru Delta(Omdel) north-east of Henties Bay. Inthis area, a precursor of the OmaruruRiver has incised paleochannels up to120 m deep, which were later filledwith sediments. The Omdel wellfieldof 33 boreholes was developed in thelate 1970s to augment coastal suppliesfrom the Kuiseb River wellfield due togrowing water demand in the region.The aquifer is found in the deeply
incised main channel, which is flankedby the southern elevated channel andnorthern elevated channel as well asnorthern channel system. The water inthe main channel is fresh to slightlybrackish, while both elevated andnorthern elevated channels containolder saline ground water. The alluvium consists of a lower
succession of coarse sand and graveloverlain by a semi-confining unit of
calcareous silt to fine sand, which istopped by another sand and gravellayer. The lower coarse unit is the mainwater source and heavy abstraction hasdrawn the water table down below thefine layer. The last significant rechargeevent occurred in 1985.The Omdel Dam and artificial
recharge scheme was built to increasethe sustainable yield of the aquifer from4.5 to 8.2 Mm3/a. The Omdel Damwas completed in 1994 and has acapacity of 40 Mm3. Its purpose is tocatch floodwater, which is releaseddownstream of the dam wall after thesilt has settled out. The clear water flows6 km as surface flow to an infiltrationbasin. The water infiltrates down to theaquifer where it is protected from evap-oration and available for abstractionfrom the existing production boreholes.
S MÜLLER
Omaruru River:Omaruru is one of the municipalitiesthat run their own water supply scheme. All ground waterfor the town as well as for extensive private irrigation schemeson smallholdings east of the town, is pumped from theextended alluvial plain of the Omaruru River. The strip of land along the river between the Etjo Mountains and
Okombahe is a water control area where water quotas areallocated to users by the Department of Water Affairs accord-ing to a permit system.Further downstream at Okombahe, a dolerite dyke cuts
across the Omaruru River forming a barrier that forcesgroundwater to the surface. A wellfield is situated upstream
83
The Omdel Dam
The Omdel infiltration basin
Cross-section of the Omdel Dam scheme
Source: S Müller
The Omaruru Delta (Omdel) scheme
Diether Plöthner
Wilhelm Struckm
eier

of the barrier on 10-20 mthick alluvium with veryhigh yields and regularrecharge. The alluvial aquiferat Nei-Neis (62) is used tosupply the town of Uis30 km north-west, where atin mine was in operationuntil the early 1990s. Thewellfield consists of 10 bore-holes spread out over severalkilometres. While the Omaruru
River flows almost every yearat Omaruru and Okombahe, floods become less frequentfurther downstream due to infiltration losses. The sustain-able yield of the aquifer was at times insufficient for themine’s demand, but is more than adequate for the presentlyreduced consumption rates.Swakop River:The Swakop and its tributary, the Khan
River, supply groundwater to several towns in the centralarea. Okahandja obtained water from a tributary of theSwakop, the Okahandja River, in the past, but switchedto surface water supply from the Von Bach Dam in the1970s. Otjimbingwe (80) used springs and shallow wells inthe Swakop River during colonial times. The water supplysituation changed drastically after the construction of theVon Bach and Swakoppoort dams upstream of Otjim bingwe.Floods were much reduced in frequency and volume, so thatrecharge to the borehole scheme was sometimes insufficientto meet the demand. As the Swakop River enters the NamibDesert, its groundwater becomes gradually more saline andgenerally unsuitable for human consumption. ConsequentlySwakopmund’s water supply comes from the Central Namibwater supply scheme (see Box on “The Kuiseb dune areainvestigation”).The wellfield at Spes Bona (44) on the Khan River 20
km north of Karibib is un usual because the productionboreholes draw water from both alluvium and underly-ing highly fractured and weathered bedrock (mostly lime-stone and shale of the Damara Sequence). The water schemewas mothballed when Karibib was linked by pipeline to the
Swakoppoort Dam. Usakosobtains groundwater fromthe Khan River and its trib-utary, the Aroab River (alsocalled Kranzberg River).There are two large-diame-ter wells in the Khan Riverand several boreholes on anextensive calcrete terracerecharged by the AroabRiver. The groundwater inthe Khan River becomesbrackish downstream ofUsakos. It is used at the
Rössing uranium mine for industrial purposes, reducingthe mine’s reliance on freshwater from the Kuiseb andOmdel aquifers.Kuiseb River: The Kuiseb River forms the boundary
between the gravel plains of the Central Namib and thesouthern Namib sand sea. Gobabeb, a desert research stationon the lower Kuiseb River, currently receives freshwaterby water tanker. Boreholes placed on the banks of the riversupply a mixture of Kuiseb water and saline water discharging from the desert. Between Gobabeb and thewater supply schemes near Walvis Bay, several Topnaarsettlements abstract groundwater from dug wells in theKuiseb River.The alluvial aquifer in the lower part of the Kuiseb River
at Rooibank (52) has been used since 1923 to supply waterto Walvis Bay. In 1966, the Rooibank B Area was devel-oped and in 1992 an additional wellfield at Dorop South,closer to the coast, came into operation. Another wellfieldwas established at Swartbank upstream of Rooibank in 1974to supply Swakopmund and Rössing Mine. In additionto 53 boreholes in the Kuiseb wellfields, there is one large- diameter, horizontal filter well (Fehlmann well). The alluvium in the Kuiseb River is 15-20 m thick.
Its relatively high permeability allows high pumping ratesand quick recharge in case of floods. The sustainable yieldof the aquifer was however over- estimated in the 1970s as11Mm3/a. This figure was revised to a more realistic 4.5Mm3/a in the 1990s.
84
The Kuiseb River forms the boundary
Wynand du Plessis

map shows the well fields and pipe -line network. The historical water consumption
of the coastal area since 1970 is shownin the graph below. While Swa kop -mund’s water de mand has increasedfrom 1-2.5 Mm3/a and Walvis Bay’sfrom 3-5 Mm3/a, Rössing Mine (RUL)has reduced its water consumptionfrom 10 to 2-3 Mm3/a after the imple-mentation of water recycling (75% ofthe total water used) and augmenta-tion of supplies with brackish waterfrom the Khan River (3%) in 1980.The mine’s freshwater demand is cur-rently only about 2 Mm3/a (22%).
S MÜLLER
85
The Kuiseb dunearea investigation
The geophysical investigation of thearea under the dunes south of theKuiseb River traced the channels created by the Kuiseb River while grad-ually shifting its course northwards.The river mouth was previously atSandwich Harbour where freshwater
springs still occur today. The area wasstudied as a potential water source forWalvis Bay and although the aquifercharacteristics, recharge and qualitymay be poor, promising targets forexpanding the wellfield were identi-fied. Access in some cases remains aproblem.
Central Namib water supply schemeWalvis Bay, Swakopmund, Rössing
Mine and Henties Bay obtain fresh-water from the Central Namib WaterSupply Scheme based at Swakopmund.The scheme is run by NamWater anddraws groundwater from wellfields inthe Omaruru and Kuiseb rivers, whichare the nearest sources of potable water.
In the past Swakopmund and Rössingwere supplied from the Kuiseb River,but in 1979 the Omdel scheme wasadded to augment the re sources. The
The dunes south of the Kuiseb River
The historical water consumption of the coastal area since 1970
FURTHER READING
• Schmidt G and D Plöthner.1999. Abschätzung derGrundwasservorräte im Fluß-und Dünengebiet desunteren Kuiseb, Namibia.Zeitschrift für angewandteGeologie, 45. Hannover.
Well fields and pipeline network of thecoastal area
Dieter Plöthner
Source: S Müller
Source: S Müller
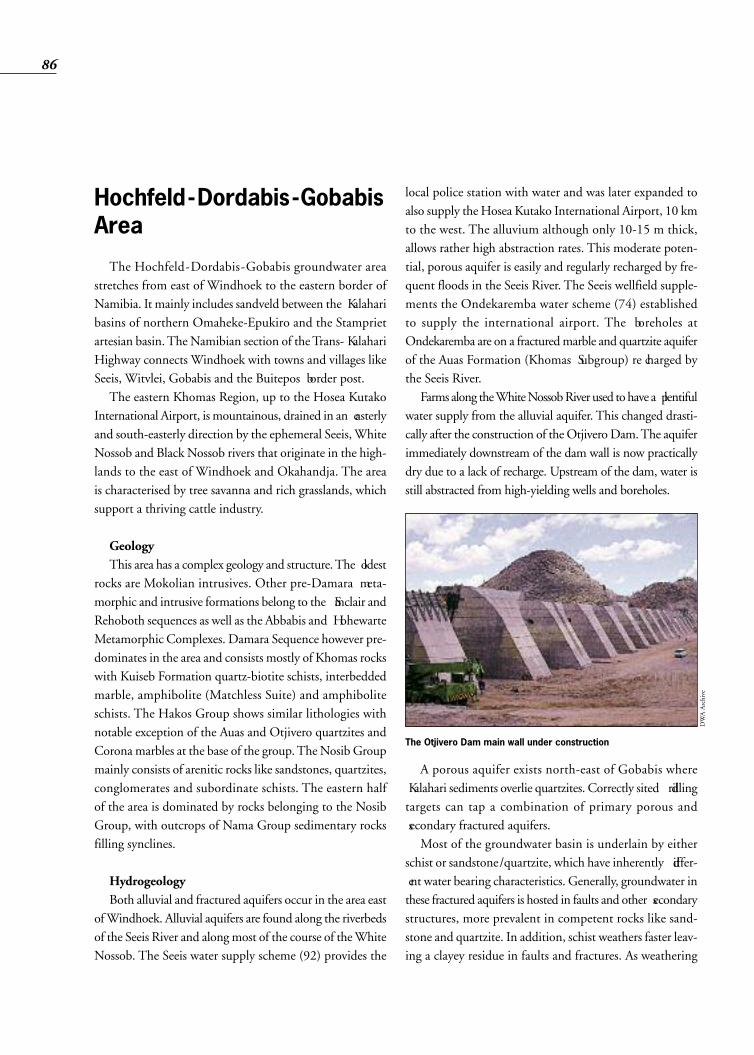
Hochfeld-Dordabis-GobabisArea
The Hochfeld-Dordabis-Gobabis groundwater areastretches from east of Windhoek to the eastern border ofNamibia. It mainly includes sandveld between the Kalaharibasins of northern Omaheke-Epukiro and the Stamprietartesian basin. The Namibian section of the Trans- KalahariHighway connects Windhoek with towns and villages likeSeeis, Witvlei, Gobabis and the Buitepos border post.The eastern Khomas Region, up to the Hosea Kutako
International Airport, is mountainous, drained in an easterlyand south-easterly direction by the ephemeral Seeis, WhiteNossob and Black Nossob rivers that originate in the high-lands to the east of Windhoek and Okahandja. The areais characterised by tree savanna and rich grasslands, whichsupport a thriving cattle industry.
GeologyThis area has a complex geology and structure. The oldest
rocks are Mokolian intrusives. Other pre-Damara meta -morphic and intrusive formations belong to the Sinclair andRehoboth sequences as well as the Abbabis and HohewarteMetamorphic Complexes. Damara Sequence however pre-dominates in the area and consists mostly of Khomas rockswith Kuiseb Formation quartz-biotite schists, interbeddedmarble, amphibolite (Matchless Suite) and amphiboliteschists. The Hakos Group shows similar lithologies withnotable exception of the Auas and Otjivero quartzites andCorona marbles at the base of the group. The Nosib Groupmainly consists of arenitic rocks like sandstones, quartzites,conglomerates and subordinate schists. The eastern halfof the area is dominated by rocks belonging to the NosibGroup, with outcrops of Nama Group sedimentary rocksfilling synclines.
HydrogeologyBoth alluvial and fractured aquifers occur in the area east
of Windhoek. Alluvial aquifers are found along the riverbedsof the Seeis River and along most of the course of the WhiteNossob. The Seeis water supply scheme (92) provides the
local police station with water and was later expanded toalso supply the Hosea Kutako International Airport, 10 kmto the west. The alluvium although only 10-15 m thick,allows rather high abstraction rates. This moderate poten-tial, porous aquifer is easily and regularly recharged by fre-quent floods in the Seeis River. The Seeis wellfield supple-ments the Ondekaremba water scheme (74) establishedto supply the international airport. The boreholes atOndekaremba are on a fractured marble and quartzite aquiferof the Auas Formation (Khomas Subgroup) re charged bythe Seeis River.Farms along the White Nossob River used to have a plentiful
water supply from the alluvial aquifer. This changed drasti-cally after the construction of the Otjivero Dam. The aquiferimmediately downstream of the dam wall is now practicallydry due to a lack of recharge. Upstream of the dam, water isstill abstracted from high-yielding wells and boreholes.
A porous aquifer exists north-east of Gobabis where Kalahari sediments overlie quartzites. Correctly sited drillingtargets can tap a combination of primary porous and secondary fractured aquifers.Most of the groundwater basin is underlain by either
schist or sandstone/quartzite, which have inherently differ - ent water bearing characteristics. Generally, groundwater inthese fractured aquifers is hosted in faults and other secondarystructures, more prevalent in competent rocks like sand-stone and quartzite. In addition, schist weathers faster leav-ing a clayey residue in faults and fractures. As weathering
86
The Otjivero Dam main wall under construction
DWA Archive
Gobabis watersupply
Originally Gobabis (32) obtainedwater from boreholes within thetown and townlands. Later thescheme was extended to the Witvleiarea and the White Nossob. More recently the Otjivero Dam
was constructed to assure a more permanent water supply for Gobabis.The borehole schemes at South Stationand Grünental were then rested. Dueto inconsistent rainfall, however, thedam was dry for several seasons in theearly 1990s and a hydrogeological
investigation for additional boreholesstarted in 1995. The old boreholes werealso re- evaluated and following adetailed investi gation a new wellfieldof eight boreholes was establishednorth-east of the town, close to theBlack Nossob River. Fractured aquiferswere identified in the basement andporous aquifers in saturated Kalaharisediments. These can form a combinedaquifer system in some places.The geology in the Gobabis area is
made up of Kamtsas quartzite (DamaraSequence) and sediments of the KuibisSubgroup (Nama Group), locally overlain by tillite and shale of theDwyka Formation (Karoo Se quence).
The fractured aquifers tapped by the various wellfields have moderate to highyields and receive fairly regular recharge.Drilling targets were selected geo -
physically, employing electrical re sis -tivity and electromagnetic methods.Drilling results proved the value ofappropriate scientific investigationmethods. Thirty-six boreholes weredrilled of which 61% had yields of over10 m3/h, 10 produced less than 10 m3/h(28%) and only 4 were dry (11%). Considering previous water short-
ages and the prevailing drought thisinvestigation was highly successful.
F BOCKMÜHL
progresses from the surface downwards, weathered faultzones at the surface are poor aquifers, but deeper intersec-tion of faults can result in higher yields. For example on thefarms Apex and Aurora, on the road between Omitara andSteinhausen, water strikes at 60 m and 120 m below theground level had yields of over 10 m3/h.Selecting drill sites for such deep intersections is how-
ever difficult as the structures are usually narrow and the(mostly steep) dip of the fractures is difficult to determineaccurately. In the quartzitic sandstone terrain, selectingdrilling targets is not as difficult, provided that the geohydrological conditions are correctly interpreted and theappropriate geophysical investigations are conducted. Thiswas proven by a recent investigation in the vicinity of Gob-abis (see Box on “Gobabis water supply”).The water scheme for the village of Witvlei (104) draws
water from fractured limestone of the Kamtsas Formation(Damara Sequence) along the White Nossob River. Theriver provides recharge ensuring a plentiful groundwatersupply. Further east of Gobabis three small water supplyschemes are situated on slightly fractured low- yieldingquartzite aquifers of the Kamtsas formation: Ernst Meyer
school (25), Buitepos border post (18) and Rietfontein (86).The latter scheme supplies a number of farming communitiesalong the Rietfontein River near the Botswanan border (ENEof Gobabis). The borehole yields are low to moderate andinsufficient to meet the rising demand. Over-abstractionhas caused a change in water quality from Group B to C.Another water scheme on Damara Sequence rocks is
Oamites (65) north of Rehoboth, formerly a mine, nowused as an army camp. The aquifer is fractured marble ofthe Swakop Subgroup. There is one strong production borehole at the camp and two on the farm Nauaspoort along-side the Usip River.The meta-sediments of the Rehoboth Sequence are
generally low-yielding aquifers, e. g. at Kwakwas (53), asmall water scheme north-west of Rehoboth where windpumps are used to abstract small volumes of groundwater.Yet locally, moderate yields are found in fractured quartzitesof the Rehoboth Sequence, for instance at Dordabis (22) south-east of Windhoek. The boreholes receive rechargefrom the Skaap River. Recently the scheme was extendedby two new boreholes to meet the rising demand.An interesting situation exists on the farms Owingi,
87

Conellan and a portion of the farm Tokat, some 60 km northof Gobabis. A gravelly and calcareous porous Kalahari aquiferoverlies basement consisting of undifferentiated sedimen-tary, volcanic and metamorphic rocks of the Eskadron For-mation, Sinclair Sequence. Farmers in the area regularlyreport that if boreholes are drilled “too deeply”, the waterfrom the upper aquifer drains away into the lower forma-tions. This is inferred from a rushing sound likened to flow-ing water in the borehole.A possible explanation for this phenomenon was found
when borehole WW35206 was drilled in this area underprofessional supervision. A blow test yield of 7.6 m3/h wasrecorded in the Kalahari aquifer. This yield drasticallyincreased to over 100 m3/h when aquifers in the basementwere intersected. After drilling, the water level in this bore-hole is 0.15 m below surface, much higher than the normalKalahari aquifer water levels. This indicates that the base-ment aquifer is under pressure and thus at least sub-arte-sian. With effective sealing of the Kalahari aquifer, properartesian conditions are likely. As with many aquifers underpressure, gas release takes place once the confining horizonhas been punctured. This gives rise to a rushing sound, whichcould explain the farmer’s observation of water “drainingaway”. F BOCKMÜHL
the Namibian border into Botswana and South Africa.
Geography and geomorphologyIn the west, the Stampriet Artesian Basin is bounded
by the Weissrand, a surface limestone plateau that rises 80mabove the Fish River plain. A dune field commences westof the Auob River and stretches eastwards to beyond theNossob River. These stationary longitudinal dunes are nearlyparallel to the river system and about 10 to 15 m high.The grass covered dune valleys in between are several hun-dred metres wide. In the north a gradual transition to com-paratively monotonous sand or calcrete plains is followedby the first north north-east trending quartzite ridges of thecentral highland.The area receives between 150 and 250 mm of rain per
annum. Potential evaporation is as high as 3 800 mm in thesouth-eastern part of the basin, and in normal years littleor no local runoff is generated. The Auob River below Stamp -riet and the Nossob River from Leonardville to Aranos,
are evidence of a much wetter climate in the past. The valleysare several hundred metres wide and sometimes incised morethan 50 m into the Kalahari. The present rivercourses aregenerally little more than 10 m-wide and only about 1.5 mdeep in occasional gullies. The Auob River is cut off fromits upper tributaries by a dune field east of Kalkrand thatblocks the Oanob and Skaap rivers. Downstream of theAuob and Nossob confluence with the Molopo River, recent
88
Mukorob shale, between Nossob and Auob
Stampriet Artesian BasinThe Stampriet Subterranean Water Control Area, as defined
by law in the Artesian Water Control Ordinance of 1955, liesin the south-eastern part of Namibia roughly bet ween 23°and 26°S; 17°30’ and 20°E, the Botswanan border. Its northern boundary is defined by sub-outcrops of
Karoo strata. In the north-west an arbitrary margin (followingthe railway line) delineates the area where sandstones withartesian groundwater might still be encountered underthe Kalkrand Basalt. In the west the basin is limited bythe escarpment of the Weissrand Plateau that rests on NamaGroup sediments. The southern boundary is a line south ofwhich no (sub)artesian conditions exist. Eastwards the Stamp -riet Artesian Basin extends some limited distance beyond
Jürgen Kirchner
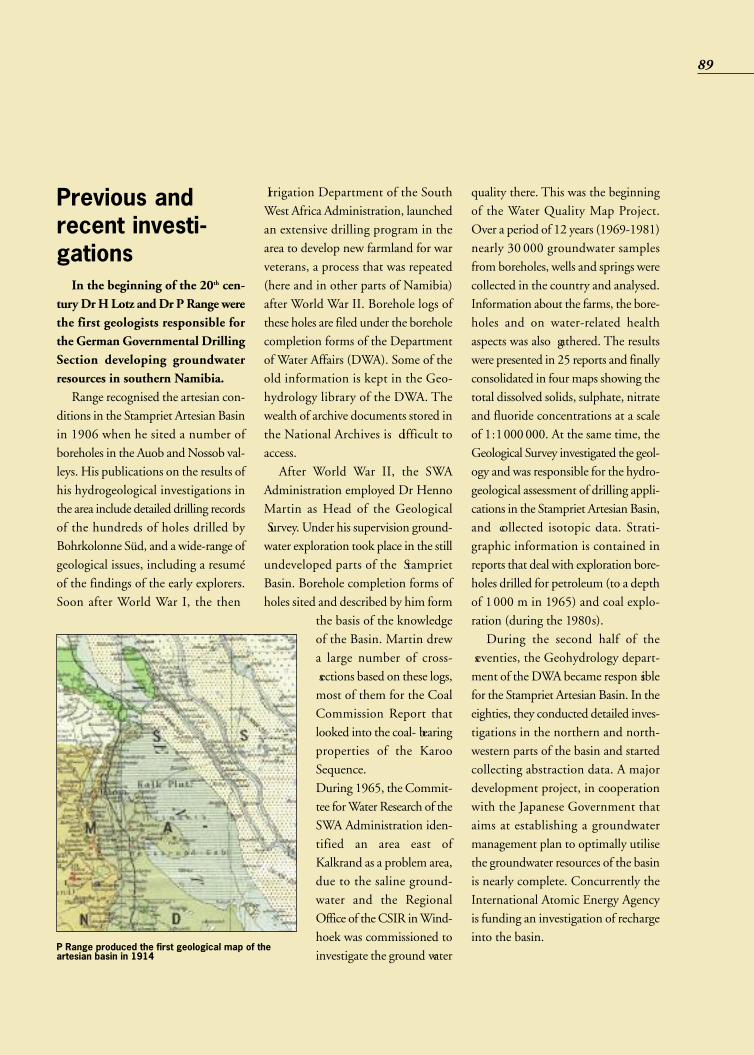
Previous andrecent investi -gationsIn the beginning of the 20th cen-
tury Dr H Lotz and Dr P Range werethe first geologists responsible forthe German Governmental Drilling Section developing groundwaterresources in southern Namibia. Range recognised the artesian con-
ditions in the Stampriet Artesian Basinin 1906 when he sited a number ofboreholes in the Auob and Nossob val-leys. His publications on the results ofhis hydrogeological investigations inthe area include detailed drilling recordsof the hundreds of holes drilled byBohrkolonne Süd, and a wide-range ofgeological issues, including a resuméof the findings of the early explorers.Soon after World War I, the then
Irrigation Department of the SouthWest Africa Administration, launchedan extensive drilling program in thearea to develop new farmland for warveterans, a process that was repeated(here and in other parts of Namibia)after World War II. Borehole logs ofthese holes are filed under the boreholecompletion forms of the Departmentof Water Affairs (DWA). Some of theold information is kept in the Geo-hydrology library of the DWA. Thewealth of archive documents stored inthe National Archives is difficult toaccess.After World War II, the SWA
Administration employed Dr HennoMartin as Head of the Geological Survey. Under his supervision ground-water exploration took place in the stillundeveloped parts of the StamprietBasin. Borehole completion forms ofholes sited and described by him form
the basis of the knowledgeof the Basin. Martin drewa large number of cross- sections based on these logs,most of them for the CoalCommission Report thatlooked into the coal- bearingproperties of the KarooSequence.During 1965, the Commit-tee for Water Research of theSWA Administration iden-tified an area east ofKalkrand as a problem area,due to the saline ground-water and the RegionalOffice of the CSIR in Wind-hoek was commissioned toinvestigate the ground water
quality there. This was the beginningof the Water Quality Map Project.Over a period of 12 years (1969-1981)nearly 30 000 groundwater samplesfrom boreholes, wells and springs werecollected in the country and analysed.Information about the farms, the bore-holes and on water-related healthaspects was also gathered. The resultswere presented in 25 reports and finallyconsolidated in four maps showing thetotal dissolved solids, sulphate, nitrateand fluoride concentrations at a scaleof 1:1000000. At the same time, theGeological Survey investigated the geol-ogy and was responsible for the hydro-geological assessment of drilling appli-cations in the Stampriet Artesian Basin,and collected isotopic data. Strati-graphic information is contained inreports that deal with exploration bore-holes drilled for petroleum (to a depthof 1000 m in 1965) and coal explo-ration (during the 1980s).During the second half of the
seventies, the Geohydrology depart-ment of the DWA became respon siblefor the Stampriet Artesian Basin. In theeighties, they conducted detailed inves-tigations in the northern and north-western parts of the basin and startedcollecting abstraction data. A majordevelopment project, in cooperationwith the Japanese Government thataims at establishing a groundwatermanagement plan to optimally utilisethe groundwater resources of the basinis nearly complete. Concurrently theInternational Atomic Energy Agencyis funding an investigation of rechargeinto the basin.
P Range produced the first geological map of theartesian basin in 1914
89

mulate in the Kalahari and the ground-water quality deteriorates in a south-easterly direction. Because the confin-ing layers and the Auob aquifer arelargely removed in the pre- Kalahari val-ley, the quality of the groundwater inthe Auob aquifer is also affected south-
east of that valley and that part of the Stampriet ArtesianBasin is called the “Saltblock”.Groundwater occurs in the Kalahari layers, in Kalkrand
Basalt in the north-west, and in the Prince Albert Formationof the Karoo Sequence. Not all aquifers occur everywhereand the use of the aquifers is determined by water quality,depth to the aquifer, and their yields. Namibia, Botswanaand South Africa share the artesian aquifers although theyare predominantly used in Namibia where they are recharged.Few people live along the Botswanan border and little drillingand groundwater exploration has been done. The south-ern part of the Stampriet Artesian Basin borders the SouthAfrican Kalahari National Game Park and the Gordonia Dis-trict. In Gordonia, the water quality of the Karoo aquifersappears to be as poor as in the Saltblock in Namibia.The Auob and the Nossob aquifers are confined and free-
flowing (artesian) in the Auob valley at and downstreamof Stampriet and in the Nossob valley around Leonardville.Elsewhere sub-artesian conditions prevail, that is, the waterin the aquifer is confined, but the pressure is not sufficientfor the water to rise above the surface.
dune fields cut off the Molopo fromthe Orange River.Economic activities in the area
concentrate on stock farming, pre-dominantly karakul breeding in thepast, now diversified to include sheep,cattle and ostrich farming. In recentyears, irrigation farming increased as electrifi cation improved.
Geology and hydrogeologyThere is a comparatively good understanding of the
geology and hydrogeology of this aquifer system in Namibia.Groundwater occurs in the Nossob and Auob sandstones ofthe Ecca Group (lower Karoo Sequence), which are dividedby shale layers and overlain by Rietmond shale and sand-stone. Younger Kalkrand Basalt occurs in the north-west andKalahari Sequence deposits. Predominantly calcrete and dunesand, cover virtually the entire surface of the Stampriet Arte-sian Basin. Several springs are located in the eastern outcroparea of the basalt. The Karoo succession rests unconformablyon Kamtsas Formation in the north and north-west andon Nama Group rocks in the remainder of the basin. Sedi-ment transport came from the north-east. The sandstones,in particular, were deposited in a deltaic environment. Thedip of the Karoo formations is slightly towards the south-east (about 3 degrees) and the groundwater flow generallyfollows that direction.Before the deposition of the Kalahari layers, a major river
system entered Namibia at about 24° S and 20°E. This riverflowed in a south-westerly direction, turning east of Gochastowards the Mata Mata area at the South African border.A major tributary from the north joined the main river atabout 24°45’S and just east of 19°E. This river system cutdeeply into the Karoo Sequence, in places right down to thebase of the Auob. Along the northern and western bound-ary of the basin the Kalahari cover is thin with calcrete ordune-sand at the surface. South-eastwards it reaches a thick-ness of 150m, but in the pre- Kalahari river mentioned it canexceed 250 m in thickness. In the central parts the Kalahariconsists mainly of fine sand, silt and clayey deposits. Con-sequently, with low rainfall, high potential evaporation andno runoff outside the Auob and Nossob valley, salts accu-
90
Longitudinal dunes after heavy rains
Hoachanas fountain with monument for the dog that found thewater
Jürgen Kirchner
Jürgen Kirchner

g r o undwa t e rresources are lim-ited and need tobe protected. Themodelling resultsof the currentdevelopment pro-ject indicate thatthe resource isover-utilised anda 30% reductionin abstraction is necessary. Less wasteful irrigation methods,reduced eva poration from reservoirs and drinking troughs,and reduction of other losses will result in sufficient savings,in other words, water demand management needs to beimplemented here. Most of the water supply schemes in the Stampriet Arte-
sian Basin extract groundwater from the Auob aquifer, onlyKoës uses the Nossob aquifer. The subartesian boreholes atAminuis (3) have maintained high yields since installation,but boreholes on the same aquifer at Onderombapa school(75) north of Aminuis and Kriess school (51) on the Weissrand east of Gibeon, have comparatively low yields.Over-abstraction causes large drawdowns in the low to moderate-yielding boreholes of the Leonardville (54) waterscheme. At Aranos (7) supply problems are experienced fromtime to time even though the aquifer can provide sufficient
Factors such as climatic variations and the construc -tion of large storage dams in river net works up stream of theaquifers, which have the effect of cutting off large floodsthat would other wise feed the Stamp riet Artesian Basin system, make it difficult to quantify this resource.The recharge mechanisms of the aquifers are better under-
stood. A recentsatellite imageinterpretation ofthe area, done forthe purposes ofthe Hydrogeo-logical Map by aBGR expert,detected “sink-holes” within theKalahari. These are small,shallow depres-sions caused bydissolution of cal-crete where localrunoff is concen-trated and fed into
permeable layers or structures below. From here the waterreaches the artesian aquifers below. Such sinkhole areas existin the north-west, west and south-west of the basin. First indications are that the artesian aquifers are recharged
here during years with abnormally high rainfall. Withinweeks after heavy rainfall events, the water level in boreholessunk into the confining layers of the aquifer some 50 kmfrom the recharge area, begins rising. The water in the arte-sian aquifers has almost no, or only a very weak isotopic evaporation signal. In contrast, a noticeable proportion ofthe rain that falls on the sandy Kalahari surface elsewhere,evaporates and the groundwater in the Kalahari layers of thecentral parts of the basin has a definite evaporation signal.These recharge investigations are continuing.Utilisation of GroundwaterPresently water in the area is used for stock watering and
increasingly for irrigation purposes. Although irrigation haseconomic advantages such as creating job opportunities, the
91
Water level recorder near Stampriet high above ground measuring the artesianwater level
Irrigation from groundwater produces green from oases in theStampriet Artesian Basin
Satellite image showing small sinkholes inthe calcrete
Landsat Thematic Mapper
Jürgen Kirchner
Wilhelm Struckm
eier

water of a good quality. Very fine sand enters through theborehole screens at higher pumping rates and leads to oper-ational problems and silting up of boreholes.The Auob aquifer at Gochas (34) is overlain by approx-
imately 150 m of Kalahari sediments, which contain poorquality water. Boreholes in town were contaminated withKalahari water and a wellfield was established 10 km to thenorth on the farm Urikuribis, where water of Group A qualityis found. The Auob aquifer is artesian at Stamp riet (95), avillage founded by missionaries who used the free-flowinggroundwater for garden irrigation. At Koës (48), a villagenorth-east of Keetmanshoop near the edge of the Saltblock,the subartesian boreholes draw water from the Nossob sand-stone. J KIRCHNER
and Bethanien rely on groundwater extracted from aquifersin Nama sediments. The landscape is extremely barren androcky with little soil cover. The vegetation consists of dwarfshrubs with some trees in riverbeds. The main economicactivities in the area are small stock farming and tourism.
Geology and geomorphologyDue to their predominantly horizontal bedding, rocks
of the Nama Group tend to weather and erode in layers,resulting in flat plains, with major drainages forming canyonsand gorges. Erosion produces rock fragments or clay-sizeparticles and rivers accumulate very little sandy alluvium.The western boundary of the Nama Group is clearly definedas the major escarpment adjacent to the Schwarzrand, whileto the east, the escarpment of the Weissrand, made up byyounger deposits of the Stampriet basin, forms the naturalboundary.The Nama Group is subdivided as follows:
The lower part of the Nama Group was deposited in ashallow to moderately deep sea, divided into two embay-
92
FURTHER READING
• Huyser D J. 1982. Chemise Kwaliteit van dieOndergrondse Waters in Suidwes-Afrika/Namibie.Vol. 1-3. Department van Waterwese, Suidwes-Afrika, Windhoek.
• Japan International Co-operation Agency. 2000.The Study on the Groundwater Potential Evalua -tion and Management Plan in the South-east Kalahari (Stampriet) Artesian Basin in theRepublic of Namibia. Interim Report. Tokyo.
• Range P. 1914. Das artesische Becken in der Süd -kalahari. Deutsches Kolonial Blatt 8. Berlin.
Fish River -Aroab BasinMuch of the area east of the Namib sand sea between
Mariental in the north and Ariamsvlei in the south is under-lain by sedimentary rocks of the Nama Group and thusforms the large hydrogeological unit of the Fish River Basinand the Keetmanshoop-Aroab area. The largest town and regional centre, Keetmanshoop,
has a surface water scheme fed from Naute Dam. Smallertowns like Aroab, Maltahöhe, Kalkrand, Gibeon, Berseba
puorG-buSpuorg
noitamroF ygolohtiL
amaN
hsiFreviR
buAssorGyllacol,enotsdnasderdnaelahsdeR
.hsineerg
sibabaN,enotsdnaselprupotderdnaelahsdeR
.hsineergyllacol
nrohkcerBdnaenotsdnascitiztrauqelprupotdeR
.elahsderetanidrobusemos
eladkcotScitiztrauqdeniargesraocelprupotderlasaB
.reyaletaremolgnocnihthtiwenotsdnas.elahs,enotsdnaselbairfdeR
-zrawhcSdnar
gisegreV .enotsdnasderdnaneerghtiwelahsneerG
sastmoN
,enotsdnashsidderdnaelahshsiddeRhtiw,ehöhatlaMfohtuosneerggnimoceb,secalpynamnietaremolgnocesraoclasab
.tsew-htuosehtsdrawotenotsemil
sisurU
ni(enotsdnashsineergdnaelahshsineerGdnaenotsemileulbkradhtiw,)htroneht
dnadereyal-retnienotsemilkcalb.)htuosehtni(detalacretni
suaduNotyerg,enotsdnashsineergdnaelahsneerG
.etiztrauqhsineerg
sibiuK
siraZyergdnaknip,enotsdnas,elahsneerg-hsiulB
.enotsemilkcalbot
sibaDyergemos,etiztrauqetihwotyerG
hsineergotyerg,enotsemilcitimolod.etiztrauq

ments by the easterly trending Osis ridge, resulting in a faciesdifferentiation between north and south in the Kuibis Sub-group. With increased thickness of sedimentation, the upperpart of the Schwarzrand Subgroup and the over lying FishRiver Subgroup were little affected by facies changes. Thesedimentation of the Kuibis Subgroup took place in the lateCambrian Era, and all the rocks of the Nama are older than450 million years (Ma). All units of the lower Nama Groupthin eastwards and many pinch out, e.g. the Kuibis Sub-group is reduced to the Kanies Quartzite Member east ofthe Karas Mountains.Major tectonic uplift affected the Nama at the end of the
Schwarzrand deposition. Dips, in general, are very shallowto the east, except where folding has taken place and in areaswhere doming has resulted in locally shallow dips, radiallyaway from the dome, e. g. in the Ubiams-Vleiveld area. TheNama Group rocks rest unconformably on older basement.Over most of the outcrop area the Nama is not folded, how-ever, intensely folded Nama sediments are found betweenGobabis and the Sossusvlei area. Faults generally, but notalways, strike in a northerly direction and have been mappedquite frequently across the entire outcrop area. Extensiveswarms of joints appear throughout the Fish River Sub-group.
HydrogeologyRock types of the Nama Group are inherently imperm e -
able with little or no primary porosity. Groundwater is hosted
in secondary features like faults and joints in sedimentaryrocks of clastic origin (sandstone, quartzite and shale) andin solution features in limestones and dolomites. In theHardap and Karas regions water levels are generally shallowin the east, close to the course of the Fish River, but becomeprogressively deeper towards the escarpment in the west,where water levels deeper than 200m are recorded. Drillingtargets are mostly tectonic features such as faults and joints.These targets can be located by geological surveys,
especially with the help of aerial photography. Detailed field-work is essential in locating and identifying the dip of faultsand to appropriately determine the optimal site for drilling.(On the photo the dip of the fault can be clearly recognisedfrom up-turned fractured sandstone, especially in the topright hand cor-ner.) Faults canbe risky drillingtargets. Collapseat several depths re quires thatbore holes bedrilled at variousdiameters to in -stall successivelysmaller dia metersof casing (“tele-scoping”).Jointing in the
Fish River Sub-group is quite often only recognised during a field survey.These structures are mostly vertical to sub-vertical, and onceidentified, drilling sites can be placed quite accurately. Jointsare often discernible by a linear “anticlinal” feature. A nar-row band of upturned shale and/or sandstone within oth-erwise horizontally bedded layers is probably a result ofswelling of the more argillaceous horizons due to percola-tion of groundwater and infiltration of rainwater alongthe strike of the joint.The various formations of the Fish River Subgroup have
different hydrogeological properties. In the younger GrossAub Formation water tables are shallow and drilling targetscan be selected geologically with good success. A high success
93
Drill site selected on a north-striking, west-dipping fault in NababisFormation sandstone
North-striking east-dipping fault,sandstone, Nababis Formation. FarmAneis, along District road No 1075
Frank Bockm
ühl
Frank Bockm
ühl

rate can be achieved in the Nababis Formation with care-ful selection of drilling sites. Water levels are generally deeperthan in the Gross Aub Formation. In the older Breck hornand Stockdale formations, up to 30% of the recorded bore-holes were dry, due to the deeper water table and resultantdifficulty in accurately determining a drilling site. With moreprecise fieldwork, the probability of intersecting ground -water on suitable structures should in crease. In the
Schwarzrand andthe Kuibis sub - groups, drillingsites should beselec ted on tec-tonic structures orcontacts bet weenlime stones andclastic rocks.The water qualityin the Fish RiverGroup is in gen-eral acceptable,even though high
nitrate concentrations can occur. Increased nitrate concen-trations are almost always a result of contamination due tohuman and livestock activities close to the boreholes. Thistype of pollution is irreversible, but new boreholes can beprotected by keeping people, their sewerage systems and live-stock pens further away.Groundwater use
The production boreholes at Ariamsvlei (8), a borderpost between Namibia and South Africa, were drilled intofractured sandstone and shale of the Schwarzrand Subgroup.These rocks are weak aquifers that receive only limitedrecharge due to the low rainfall in this area. The water isvery hard and of Group B-C quality.Amas is a farm 20 km north-east of Karasburg (43),
on which a prominent fault in quartzitic sandstone of theKuibis Subgroup along the Ham River gives rise to a strongpermanent fountain. The river provides regular recharge tothe fault zone. In 1985, boreholes were drilled to determinewhether the aquifer had sufficient groundwater to augmentthe supply to Karasburg. A long-term pumping test conducted in 1993 indicated a production potential of upto 100000 m3/a.The effect of tectonics on the yield potential becomes
clear when the schemes at Berseba (14) and Gainachas (29)are compared. Both are situated at the foot of the extinctBrukkaros crater and underlain by shale and sandstone ofthe Fish River Subgroup. The Brukkaros extrusion has frac-tured the Nama sediments at Berseba and created majorwater bearing zones. The production boreholes draw froman extensive aquifer and provide much more water than thescheme at Gainachas where the absence of large fracturezones results in very low yields.The same principle applies to the Kuibis and Schwarzrand
Subgroups. The domestic water supply for Bethanien (15)comes from a fracture in sandstone, limestone and shaleof the above subgroups, cutting across the Konkiep Rivernorth of the town. Bethanien must be the only town inNamibia to complain about an excess of groundwater. Inthe past, many inhabitants used private boreholes to watertheir gardens and the soil became waterlogged. Yet, the Kosisschool (50) situated south-east of Bethanien obtains insuf-ficient water from the slightly fractured sandstone and shaleof the Schwarzrand Subgroup.Even though Gibeon (30) lies on the Fish River, there
is no groundwater of suitable quality to supply the town.Boreholes in town were used in the past, but had very highsalt concentrations (TDS 2 000-8 000 mg/L). The closest,suitable, supply source of sufficient volume and quality wasfound on the farm Orab 40 km north of Gibeon. Very high-
94
“Maanhaar” features may indicate gooddrill sites
Drillsite placed on a joint in the Breckhorn Formation, intercalatedsandstone and shale
Source: TS Kock
Frank Bockm
ühl

Aroab water supply scheme (9)
The village of Aroab is situatedsome 165 km east of Keetmanshoopin an area underlain by sandstonewith subordinate shale layers of theNababis Formation, Fish River Sub-group. These rocks are covered by calcrete
of the Kalahari Sequence north of thevillage and Quaternary sand dunes inthe east. Boreholes in the sand-coveredarea east of the village have high nitrate
concentrations, because rainwaterwashes animal waste into the pans, thenitrates dissolve and infiltrate into thegroundwater. Boreholes in the areawhere the Nababis Formation is not cov-ered are all of good quality.The old existing production bore-
holes were located close to the villageof Aroab on the watershed. These bore-holes had a history of declining yieldsand nitrate contamination. During1986 new boreholes with better waterquality were drilled south of Aroab.Drill sites were selected on joints andon the Kannenberg fault, a prominent
west-striking feature on the farms Kan-nenberg, Koertzebeb and Nobees, aftera detailed hydrogeological investiga-tion. The groundwater gradient in thearea is from north to south. Ground-water thus drains away from Aroab andaccumulates in the Kannenberg fault,which acts as a conduit. With increas-ing distance from the existing pump-ing scheme, yields of the new boreholesincreased drastically from 5 to 50 m3/h.The results of the 1986 work clearlyindicate the value of de tailed hydro-geological investigations, preceding allmajor drilling exercises.
yielding boreholes were drilled on a fracture crossing theFish River that extends northwards as part of a fracture system underneath Hardap Dam. There is thus always abun-dant recharge from surface water. Similar to Gibeon, Malta -höhe (55) obtained groundwater from boreholes in theHutup River in the past. When these became insufficient,a new wellfield was established in a tributary north of thetown. The area around Maltahöhe is characterised by shaleand sandstone of the Stockdale Formation, which belongsto the Fish River Subgroup. The groundwater potential ofthese rocks is generally low, but high yields are obtainedon extended fracture zones like the one at Maltahöhe.Kalkrand (41) lies halfway between Rehoboth and Marien -
tal on a plateau of Karoo basalt (Kalkrand Formation). Thebasalt itself contains groundwater of poor quality andKalkrand’s water supply is obtained from boreholes onthe farm Gurus approximately 20 km to the south, wherethe basalt is underlain by sandstone and shale of the FishRiver Subgroup. High-yielding boreholes were drilled on a fracture system that crosses the Fish River and receivesregular recharge. The water scheme at Schlip (91), a ruralcentre west of Kalkrand, with a fast growing water demand,draws groundwater from fractured Nama Group sediments.The original boreholes were drilled on limestone and
shale of the Kuibis Subgroup, while a new wellfield was
located on quartzite and sandstone of the Schwarzrand Sub-group. The upper aquifer is unconfined, but the lowerSchwarzrand aquifer is confined by a shale layer. The yieldsare moderate to high (5-35 m3/h), and the water qualityis Group A-B.Tses (98) is a mission station between Mariental and
Keetmans hoop that has grown into a fairly large settlementdespite limited water resources. The geology consists ofDwyka shale (Nama Group), which is generally a weakaquifer. Boreholes of moderate yield were drilled on fracturescrossing rivercourses. Several new boreholes have recentlybeen added to the scheme. The water quality has deterio-rated due to over-abstraction and lack of recharge.
F BOCKMÜHL
95
FURTHER READING
• Germs G J B. 1972. The Stratigraphy andPalaeontology of the Lower Nama Group, South West Africa: Bull. Precambrian ResearchUnit, University of Cape Town.
• South African Committee for Stratigraphy(SACS): Stratigraphy of South Africa, Handbook8. 1980.

Southern Namib andNaukluft
The Namib sand sea and Sperrgebiet, formerly knownas Diamond Areas 1 and 2, extend along the southern coastof Namibia. Bordered by the natural boundaries of the KuisebRiver, Atlantic Ocean and Orange River to the north, westand south, the eastern boundary was drawn parallel to thecoast 100 km inland. The Namib sand sea between theKuiseb River and the Aus-Lüderitz road forms part of theNamib-Naukluft Park, except for a small coastal strip betweenLüderitz and Gibraltar Rock, which is part of the Sper-rgebiet. The Naukluft Mountain massif in the north-easthas been included in this chapter because most of thedrainage is directed towards the Namib sand sea. The areabetween Lüderitz and Oranjemund is still dedicated to dia-mond mining and closed to the public.Oranjemund and Lüderitz, both at the coast, are the only
towns in the area. The tourist camp at Sesriem and thevillage of Aus are situated on the eastern boundary. TheNamib sand sea is an extremely arid zone with erratic rain-fall in the summer season, while the Sperrgebiet receivessporadic winter rainfall. The only permanent water in thisregion is the Orange River, which supplies water to townsand mines (Oranjemund, Rosh Pinah) as well as agricul-tural and tourism projects.Small stock farming is practised on farms east of the desert,
but most of the development in the area is derived from min-ing. Diamonds are the target of the NAMDEB mines on thecoast and on the banks of the Orange River. Diamonds aredredged in several offshore concession areas. A lead-zincdeposit is mined at Rosh Pinah, and a new zinc mine is beingdeveloped at Skorpion close to Rosh Pinah.
Geology and geomorphologyThe Naukluft Mountain area dominantly consists of frac-
tured and karstified dolomites and limestones of the DamaraSequence representing a so-called nappe complex. Thenappes, tectonically rather complex features, have been over-thrown on the older, low permeable Schwarzrand andSchwarzkalk layers of the Nama Sequence.
The Namib sand sea displays most of the dune types thatcan be found in the world, ranging from simple barchanthrough compound transverse and complex linear to hugestar dune forms. The dunes are interspersed with inselbergsand low mountain ranges. The older dunes are reddish andsemi-stabilised, while the younger mobile dunes are lightcoloured.The Sperrgebiet lacks extensive dune areas and is
dominated by mountains, inselbergs, gravel plains, ephemeralwatercourses and bedrock-floored valleys shaped by a harshwind regime. Fossil soils from ancient land surfaces are preserved as silcrete and calcrete caps on hills and plains.Soils are poorly developed in the Sperrgebiet, gypsum pro-files on stable gravel plains being the most common type.While the geology of the Namib sand sea is hidden under
a shroud of sand dunes and only glimpsed in isolated out -crops, the Sperrgebiet provides good exposures of the geo-logical record dating back some 1500 million years (Ma).The oldest rocks in the area are gneisses of the Namaqua-land Metamorphic Complex that can be found in theLüderitz area and along the eastern boundary, e.g. at Aus.The next period of rock formation occurred some 900 to500 Ma ago and resulted in sedimentary and associated vol-canic rocks, known as the Gariep Group. The Gariep Groupcorresponds to the Damara Sequence in the KhomasHochland. Base metal mineralisation occurs in Gariep rocksat Rosh Pinah. In contrast, the Nama Group rocks in theSperrgebiet are relatively undeformed limestones that accu-mulated some 550-500 Million years ago in a shallow marinebasin.Following the deposition of the Gariep and Nama groups,
there was a considerable time break of some 350-400 millionyears. There is no record of the Karoo Sequence in the Sperr -gebiet. The break up of the old continent comprising SouthAmerica and Africa about 130 Ma ago gave rise to severalvolcanic complexes in the central Sperrgebiet. As the SouthAtlantic Ocean opened, extensive erosion formed the GreatEscarpment and filled the offshore Orange Basin with morethan 4 km of sediments during much of the Cretaceousperiod (120- 65 Ma).Towards the end of the Cretaceous, continental erosion
waned and remnants of land surfaces were preserved as
96
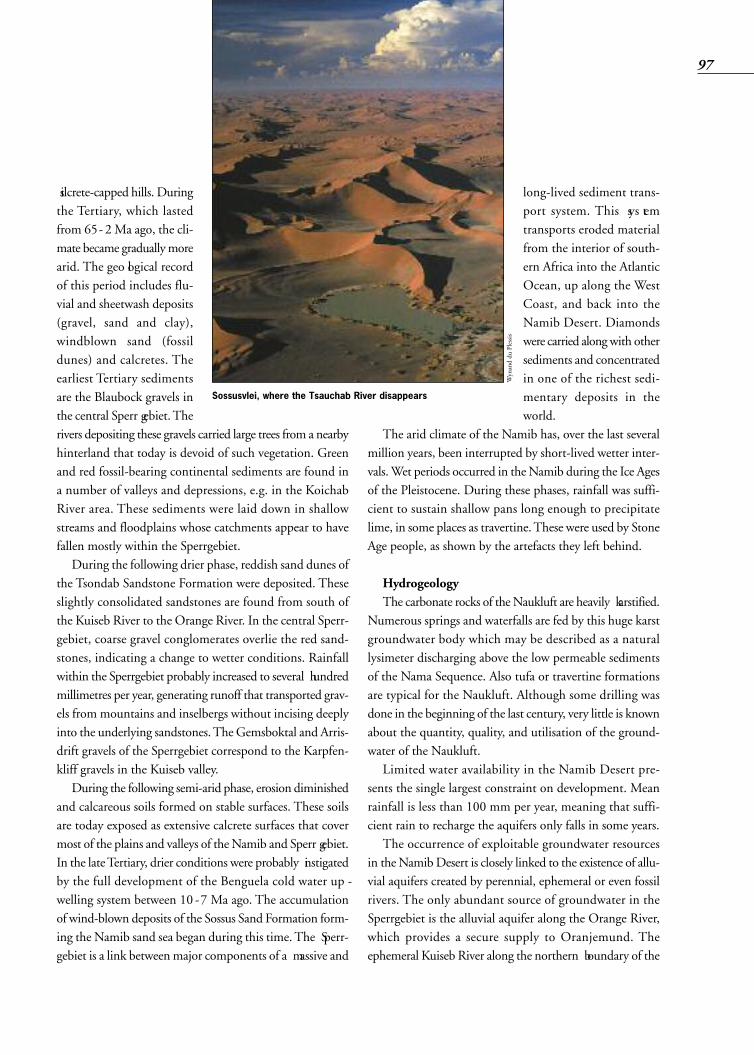
silcrete-capped hills. Duringthe Tertiary, which lastedfrom 65- 2 Ma ago, the cli-mate became gradually morearid. The geo logical recordof this period includes flu-vial and sheetwash deposits(gravel, sand and clay),windblown sand (fossildunes) and calcretes. Theearliest Tertiary sedimentsare the Blaubock gravels inthe central Sperr gebiet. Therivers depositing these gravels carried large trees from a nearbyhinterland that today is devoid of such vegetation. Greenand red fossil-bearing continental sediments are found ina number of valleys and depressions, e.g. in the KoichabRiver area. These sediments were laid down in shallowstreams and floodplains whose catchments appear to havefallen mostly within the Sperrgebiet.During the following drier phase, reddish sand dunes of
the Tsondab Sandstone Formation were deposited. Theseslightly consolidated sandstones are found from south ofthe Kuiseb River to the Orange River. In the central Sperr -gebiet, coarse gravel conglomerates overlie the red sand-stones, indicating a change to wetter conditions. Rainfallwithin the Sperrgebiet probably increased to several hundredmillimetres per year, generating runoff that transported grav-els from mountains and inselbergs without incising deeplyinto the underlying sandstones. The Gemsboktal and Arris-drift gravels of the Sperrgebiet correspond to the Karpfen-kliff gravels in the Kuiseb valley.During the following semi-arid phase, erosion diminished
and calcareous soils formed on stable surfaces. These soilsare today exposed as extensive calcrete surfaces that covermost of the plains and valleys of the Namib and Sperr gebiet.In the late Tertiary, drier conditions were probably instigatedby the full development of the Benguela cold water up -welling system between 10 -7 Ma ago. The accumulationof wind-blown deposits of the Sossus Sand Formation form-ing the Namib sand sea began during this time. The Sperr -gebiet is a link between major components of a massive and
long-lived sediment trans-port system. This sys temtransports eroded materialfrom the interior of south-ern Africa into the AtlanticOcean, up along the WestCoast, and back into theNamib Desert. Diamondswere carried alongwith othersediments and concentratedin one of the richest sedi-mentary deposits in theworld.
The arid climate of the Namib has, over the last severalmillion years, been interrupted by short-lived wetter inter-vals. Wet periods occurred in the Namib during the Ice Agesof the Pleistocene. During these phases, rainfall was suffi-cient to sustain shallow pans long enough to precipitatelime, in some places as travertine. These were used by StoneAge people, as shown by the artefacts they left behind.
HydrogeologyThe carbonate rocks of the Naukluft are heavily karstified.
Numerous springs and waterfalls are fed by this huge karstgroundwater body which may be described as a naturallysimeter discharging above the low permeable sedimentsof the Nama Sequence. Also tufa or travertine formationsare typical for the Naukluft. Although some drilling wasdone in the beginning of the last century, very little is knownabout the quantity, quality, and utilisation of the ground-water of the Naukluft.Limited water availability in the Namib Desert pre-
sents the single largest constraint on development. Meanrainfall is less than 100 mm per year, meaning that suffi-cient rain to recharge the aquifers only falls in some years.The occurrence of exploitable groundwater resources
in the Namib Desert is closely linked to the existence of allu-vial aquifers created by perennial, ephemeral or even fossilrivers. The only abundant source of groundwater in theSperrgebiet is the alluvial aquifer along the Orange River,which provides a secure supply to Oranjemund. Theephemeral Kuiseb River along the northern boundary of the
97
Sossusvlei, where the Tsauchab River disappears
Wynand du Plessis

Namib sand sea suppliesgroundwater to Walvis Bayas described earlier in thischapter.The westward-flowing
endoreic rivers that terminateagainst the Namib sand seatoday flowed into theAtlantic Ocean during phasesof wetter climate in the past. Examples of these are the Tsondab, Tsauchab and Koichabrivers. Sediments laid down by these rivers are found under-neath the dunes in former riverbeds, called paleo- channels.Under present conditions, surface water infiltrates in the upperreaches and flows as groundwater in the paleo- channels,discharging into the ocean. Some of this groundwater emergesin small freshwater springs along the coast. The more promi-nent ones are at Sandwich Harbour (paleo-channel of theKuiseb River), Meob (Tsauchab River paleo-channel) andAnigab north of Lüderitz (Koichab River paleo-channel).Tsondab and Tsauchab Rivers: The alluvium of the
Tsondab and Tsauchab at the foot of the escarpment showsa moderate yield, which is quite remarkable in this arid area.Both rivers provide water to tourist establishments. AtSesriem, the Tsauchab River is deeply incised into a thickcalcrete layer and water can be found almost permanentlyin a spring at the head of the canyon.Koichab River: The water supply to Lüderitz is based
on fossil water reserves in the Koichab paleo-channel. TheKoichab wellfield (49) is situated 100 km north-east ofLüderitz at the foot of a massive dune formation up to 200mhigh. The Koichab area was proposed as early as 1914 as themost suitable source of water supply for the grow ing townof Lüderitz, however a water supply scheme was only estab-lished in 1968.A section of the area shows the recent dunes of the Namib
sand sea underlain by fossil dunes of the Tsondab SandstoneFormation, neither of which contains groundwater. Underthe Tsondab, or directly under the recent dunes, are Tertiarysheetwash deposits, locally referred to as Koichab bedsthat consist of a mixture of clay sand and gravel. Occasionallayers of clean sand and gravel are good aquifers with yields
of 5-50m3/h, while the pre-dominant clay and silt lay-ers are aquitards.The Koichab wellfield coversan area of 20 x 3 km2with anaverage aquifer thickness of50m and water level at 16m.Radio carbon analyses showthat the groundwater in theKoichab River aquifer is fos-
sil water some 5000 -7000 years old. It is of Group A qualityand one of the best waters found in Namibia. Monitoringof the water levels indicates that no direct recharge reaches thewellfield due to the low average rainfall of 80mm/a and thepresence of clay layers covering the aquifer. There might berecharge in the upper reaches of the Koichab valley originat-ing from the Neisip River. Recharge to the Neisip area of2 Mm3/a was estimated, but isotope analyses indicate a flow velocity to the wellfield of only 13m/a. The slow decline ofthe water table in the wellfield shows that depletion of theresources occurs, despite infrequent recharge. It is estimatedthat the stored reserves in the investigated part of the Koichabpaleo-channel are 1600Mm3.The Koichab paleo-channel discharges small volumes of
freshwater in seepages at Anigab on the coast north ofLüderitz. This aquifer was investigated in the 1960s as analternative water source for the town, but the quantityand quality were insufficient.
98
Well in the Koichab Pan
Cross-section in the southern Namib from the Schwarzrand to theAtlantic Ocean
Dieter Plöthner
Source: S Müller

Emergency grazing in theSperrgebietFrom the 1950s to the early 1980s,
areas of grassland in the eastern Sperr -gebiet and the Koichab area north ofAus were used for emergency grazing. Evidently the Kaukausib Fountain
and waterholes in the Koichab Riverwere used for watering livestock untilthe late 1950s. This was apparently notfor emergency grazing but as a water-ing stop for livestock driven from theinterior to Lüderitz or Oranjemund forslaughter.
In 1951, drought-stricken farmersin southern Namibia requested that allthe land of pastoral value inside theSperrgebiet be made available to grazetheir livestock. In response, boreholeswere drilled and a 16 km-wide strip ofland running along the eastern fencewas allocated for grazing. Drillingrecords of these boreholes show the lim-
ited potential of the aquifers.Many boreholes were dry orhad very low yields just suf-ficient for stock watering.Between 30000 and 60000sheep were kept in the area,which was subsequentlywidened by 8 km in 1955.
Emergency grazing was again permitted in the mid-1960s and duringthe severe drought of 1981-82. It wasstipulated that grazing was to be madeavailable only to those farmers whoseown grazing was completely depletedand who did not have access to otherfodder.
Groundwater resources in fractured bedrock aquifersof the Namib and the Sperrgebiet are very limited and, ifexploited, extraction easily exceeds recharge. The town ofAus situated among hills of Namaqualand granite-gneiss onthe border of the Namib Desert is an example of a townwhose development is restricted by insufficient waterresources (10). The average annual rainfall of below 100mmprovides little groundwater recharge. Local aquifers of limitedextent are found in fracture zones, but the borehole yieldsare low (1-5 m3/h). Dozens of mostly dry boreholes weredrilled in and around the town to augment the water supply,until it became clear that no significant new resources couldbe found in the vicinity. Very few aquifers are found in the western part of the
Sperrgebiet. In the early 1900s, boreholes were drilled inGariep dolomite at Grillenthal to supply the mine at ElisabethBay, but other diamond mines had to bring their water inbarrels from Lüderitz. The number of boreholes and kilo-metres of pipeline required to support even short-term emer-gency grazing in the eastern part of the Namib are testimonyto the scarcity of groundwater in this area.
S MÜLLER
99
Sperrgebiet, waterhole near Koakasib
FURTHER READING
• Hellwig DHR. 1968. Water resources of theNamib Desert between Lüderitzbucht and WalvisBay (a preliminary investigation). South-west-African Regional Laboratory, National Institutefor Water Resources, CSIR, Windhoek.
• Pallett J (Ed). 1995. The Sperrgebiet – Namibia’sLeast Known Wilderness. DRFN and NAMDEB,Windhoek, Namibia.
• Range P. 1915. Ergebnisse von Bohrungen inDeutsch-Südwest-Afrika. Beiträge zur geologi -schen Erforschung der Deutschen Schutz gebiete11, Berlin.
• Ward J C. 1987. The Cenozoic Succession in theKuiseb Valley, Central Namib Desert. MemoirGeol. Survey South West Africa/Namibia 9,Windhoek.
• Ward JD. 1990. Towards an Age for the Namib.Namib Ecology 25 Years of Namib Research,Transvaal Museum Monograph 7, Pretoria.
Kevin Roberts
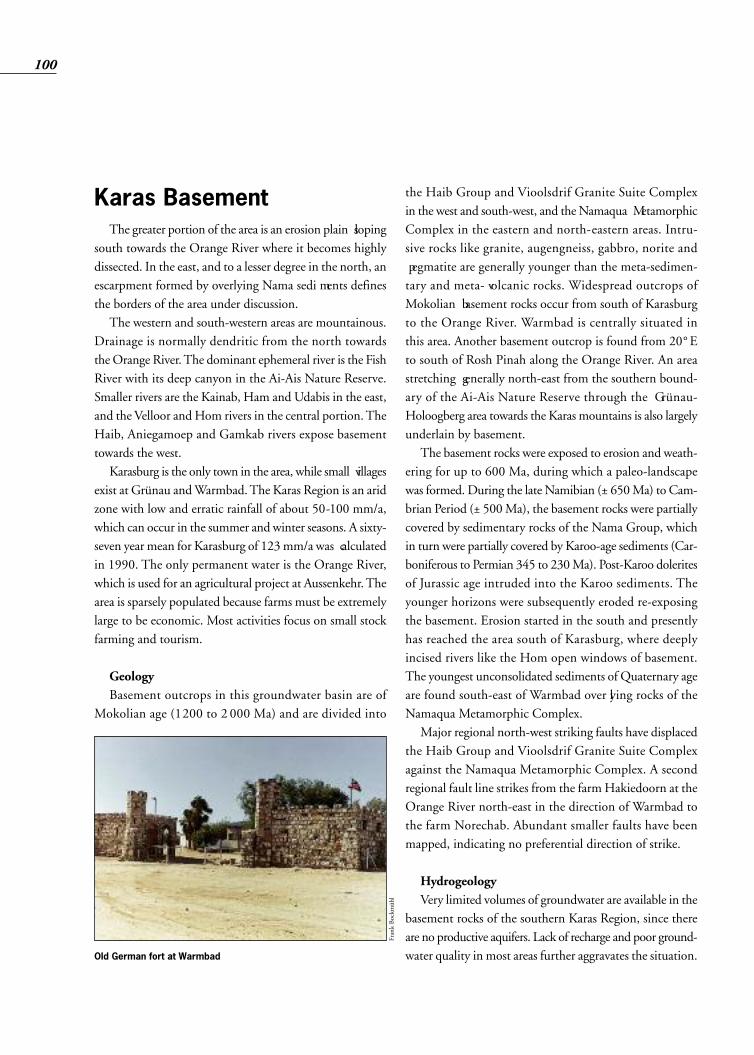
Karas BasementThe greater portion of the area is an erosion plain sloping
south towards the Orange River where it becomes highlydissected. In the east, and to a lesser degree in the north, anescarpment formed by overlying Nama sedi ments definesthe borders of the area under discussion. The western and south-western areas are mountainous.
Drainage is normally dendritic from the north towardsthe Orange River. The dominant ephemeral river is the FishRiver with its deep canyon in the Ai-Ais Nature Reserve.Smaller rivers are the Kainab, Ham and Udabis in the east,and the Velloor and Hom rivers in the central portion. TheHaib, Aniegamoep and Gamkab rivers expose basementtowards the west.Karasburg is the only town in the area, while small villages
exist at Grünau and Warmbad. The Karas Region is an aridzone with low and erratic rainfall of about 50-100 mm/a,which can occur in the summer and winter seasons. A sixty-seven year mean for Karasburg of 123mm/a was calculatedin 1990. The only permanent water is the Orange River,which is used for an agricultural project at Aussenkehr. Thearea is sparsely populated because farms must be extremelylarge to be economic. Most activities focus on small stockfarming and tourism.
GeologyBasement outcrops in this groundwater basin are of
Mokolian age (1200 to 2 000 Ma) and are divided into
the Haib Group and Vioolsdrif Granite Suite Complexin the west and south-west, and the Namaqua MetamorphicComplex in the eastern and north-eastern areas. Intru-sive rocks like granite, augengneiss, gabbro, norite and pegmatite are generally younger than the meta-sedimen-tary and meta- volcanic rocks. Widespread outcrops ofMokolian basement rocks occur from south of Karasburgto the Orange River. Warmbad is centrally situated inthis area. Another basement outcrop is found from 20° Eto south of Rosh Pinah along the Orange River. An areastretching generally north-east from the southern bound-ary of the Ai-Ais Nature Reserve through the Grünau-Holoogberg area towards the Karas mountains is also largelyunderlain by basement.The basement rocks were exposed to erosion and weath-
ering for up to 600 Ma, during which a paleo-landscapewas formed. During the late Namibian (± 650 Ma) to Cam-brian Period (± 500 Ma), the basement rocks were partiallycovered by sedimentary rocks of the Nama Group, whichin turn were partially covered by Karoo-age sediments (Car-boniferous to Permian 345 to 230 Ma). Post-Karoo doleritesof Jurassic age intruded into the Karoo sediments. Theyounger horizons were subsequently eroded re-exposingthe basement. Erosion started in the south and presentlyhas reached the area south of Karasburg, where deeplyincised rivers like the Hom open windows of basement.The youngest unconsolidated sediments of Quaternary ageare found south-east of Warmbad over lying rocks of theNamaqua Metamorphic Complex.Major regional north-west striking faults have displaced
the Haib Group and Vioolsdrif Granite Suite Complexagainst the Namaqua Metamorphic Complex. A secondregional fault line strikes from the farm Hakiedoorn at theOrange River north-east in the direction of Warmbad tothe farm Norechab. Abundant smaller faults have beenmapped, indicating no preferential direction of strike.
HydrogeologyVery limited volumes of groundwater are available in the
basement rocks of the southern Karas Region, since thereare no productive aquifers. Lack of recharge and poor ground-water quality in most areas further aggravates the situation.
100
Old German fort at Warmbad
Frank Bockm
ühl

wells and artesian boreholes. There were 445 dry boreholesrecorded, but it is presumed that only a part of these werefound. Dry boreholes are significantly located mostly on, orclose to, the watershed between the Hom and Ham rivers.The depth of boreholes was generally under 130m, with themajority being shallower than 50 m. Water levels during theCSIR survey were mostly shallower than 30m. Yields below2.3 m3/h were recorded for 63 % of the non-dry boreholes,while only 16 % had yields over 5.4 m3/h.Nearly 80% of all the water sources surveyed were unsuit-
able for human consumption, mainly due to high concentrations of fluoride and nitrate and to a lesser degreesulphate. Only 20 % of the water sources analysed provedunsuitable for livestock watering, in this case due to highsulphate contents.The water supply situation at Grünau (35) and Warmbad
The area has long been inhabited, as the abundance of oldhand-dug wells indicates. Most wells are situated along river-courses in shallow alluvium and deeply weathered channelsand basins. Wells in the Warmbad area were mostly dugbefore 1930. Very few boreholes were drilled before 1920,and these also mostly close to rivercourses. Artesian bore-holes were drilled on the farm Nieuwefontein Ost east ofKarasburg. Natural fountains occur predominantly inriverbeds. At Warmbad, a thermal spring is fault controlled(±34° C), and at Tzamab-Gründorn, some 3 kilometresnorth of Hamab station another warm spring is associ-ated with an inlier of gneiss. The most well known hot waterspring is found at Ai-Ais, a popular tourist resort on the FishRiver. The temperature of the spring water is 66.5° C. Itemerges from a fracture zone in granite and gneiss.
Exploration for groundwater should be concentratedalong faults, and where possible close to river beds, in orderto facilitate and enhance recharge. Weathered and decom-posed zones within the granitic terrain close to riverbedsmight be promising targets. Geological investi gations andgeophysical methods to determine drilling sites are essen-tial in maximising success rates. Electromagnetic surveys aswell as electrical resistivity sounding and profiling arrayshave been successfully employed.The only detailed survey of boreholes and wells in this
area has been conducted by the CSIR in 1969. During thissurvey, water samples were collected from 338 boreholes,
101
Ai-Ais hot spring eye
Drill site WW 33768 selected geologically to intersect a partlysilicified, faulted contact (ridge in background) forming an east-south-east trending feature (Borehole drilled to 100 m depth,waterstrike at 61 m, blowtest yield 2.89 m3/h, RWL 53.38 mbgl,Group B).
Fault controlled drainage channel enhancing recharge indecomposed granites
Wilhelm Struckm
eier
Frank Bockm
ühl
Frank Bockm
ühl

water treat ment was considered in the past. F BOCKMÜHL
102
(103) is typical for areas underlain by granite-gneiss of theNamaqualand Complex. Groundwater around Grünauoccurs in fracture zones recharged by small rivers and oncontact zones of younger dolerite dykes. The ground waterpotential is low and the available resources are far from sufficient to meet the demand. The groundwater flow direc-tion is north-west to south-east. Water of Group B-C qualityis found north-west of the village, but gradually increasingsalinity and fluoride concentration make the ground waternon-potable at Grünau and further to the south-east.Warmbad was established by missionaries and was the
capital of the south until this role was taken over by Karas-burg. The town is on the Hom River downstream of theDreihuk Dam. The Namaqualand granite-gneiss alongthe riverbed is deeply fractured and contains highly mineralised water of Group C-D quality. The fluoride con-centration is often too high for human consumption and
FURTHER READING
• Haughton SH and HF Frommurze. 1936. The Geology of the Warmbad District, S.W.A.,Department of Mines, S.W.A., Memoir No. II.
• Tredoux G. 1970. Waterkaart van dieondergrondse waters in Suidwes-Afrika metspesifieke verwysing na die benuttingswaarde vandie waters. Intensiewe opname van waterbronnein die gebied om Warmbad. CSIR.Projeknommer 905, Kodenommer 6321/9905.
• South African Committee for Stratigraphy(SACS). 1980. Stratigraphy of South Africa,Handbook 8.
Paleoproterozoic rocks at the Orange River
Gabi Schneider

Karasburg watersupply andDreihuk DamKarasburg (43) experienced re cur -
rent water supply problems until theDreihuk Dam was built to supply thetown with surface water. Until now the dam has never com-
pletely filled up, but at least helpedby supplying some additional waterfrom the seepage well as describedbelow. Karasburg is situated on Dwykashale and tillite of the Karoo Sequence,which are intruded by dolerite dykes.One such dyke forms the base of thedam wall of the Bondels Dam. It acts
as an underground weir damming upgroundwater in the fractured shaleaquifer, on which the Bondels wellfieldis located. High yields of 10-30 m3/hare obtained from these boreholes,while older boreholes on less fracturedrocks in town have very low yields. A
potential addi-tional wellfieldfor Karasburgwas investigatedon the farmAmas 20 kmnorth-east ofKarasburg. Thisarea is underlainby Nama sedi-ments and thusdescribed in“Nama Basin”.In 1977 the
Dreihuk Dam was built across thedeeply incised valley of the Hom River,16 km south-west of Karasburg. Thesite was geologically evaluated and
found unsuitable, because prior to thesedimentation of the Karoo shale, thepalaeo-surface was exposed to weath-ering and the weathered surface wasnot eroded later, but is still presentunderneath the remaining cover ofKaroo rocks. The deeply incised Hom
River cuts through the Karoo andexposes the weathered zone, which canbe several metres thick. When thereis water in the dam the weathered zonebecomes transmissive and water fromthe dam basin seeps through to thedownstream side of the dam wall. Adrainage pipe and sump (pit) in theeastern side of the dam wall were con-structed to collect seepage and thiswater contributes significantly to Karas-burg’s supply, about 60 000 to190000 m3/a depending on the waterlevel in the dam. The pit can also beused for Gabis mission (28), whichin the past relied entirely on two bore-holes drilled into the weathered zonedownstream of the dam.The water quality at Dreihuk is
generally poor as long as there is noinflow into the dam. High concen-trations of sulphate, chloride andsodium result in Group D water. Afterinflow, the water quality of the drainagepipe and pit temporarily deterioratesdue to a flushing effect, but it improvessome time later to Group B quality.
F BOCKMÜHL
103
Water seeping through the dam wall of the Dreihuk Dam
Dreihuk Dam
DWA Archive
DWA Archive
104
The Groundwater Map

105
Wynand du Plessis

Data and use ofthe Map
This chapter describes the technicalway in which the data used for the Mapwere collected, created, interpreted andfinally prepared. A basic distinctionis made between data serving as topographical backgroundinformation, and the thematic data layers which were con-structed, calculated or derived from various sources. Theproblems in the creation of the topographical base data weremainly due to incomplete, inaccurate or non- documenteddata sets. The creation of the thematic data themes, reliedon the geological, hydrogeological and hydrological data ofvariable quality captured over the past decades and neces-sitated a huge effort to search, collect, correct and validatethe data. Nevertheless, this process of preparing coherentand good quality data for the Hydrogeological Map hasresulted in the most up to date, accurate and complete datasets on ground- and surface water in digital form yet inthe MAWRD. It must be clearly stated, that the data collected for the
Hydrogeological Map of Namibia Project (HYMNAM) wasfirst and foremost geared at establishing a national, coun-try-wide map at a scale of 1:1000000, with 10 milli metreson the Map equal to 10 kilometres in reality. This focuson a country-wide overview map and the time frame of onlytwo years has meant that the information on the Map isinadequate to allow zooming in and enlarging. More detailed,high-resolution data on geology, boreholes and ground-water might be available for certain regions of the countryin the databases of GSN, DWA and Nam Water, but can-not be derived from the HYMNAM data sets.In addition, it must be spelled out clearly that site-specific
projects such as the correct siting of boreholes or dump sitesrequire sound, site-specific professional investigations. Theinformation presented on the Map at 1:1000000 scale, isby far too general and can only be used as orientation forthe site-specific follow-up studies. The results of the detailedinvestigations should be used to improve the HYMNAMdata sets in the future.
Topographical base dataWhen the Hydrogeological Map ofNamibia Project (HYMNAM) was initiated, it was assumed that the topo-graphic base data for the Map werereadily available in the country. In fact,it soon became apparent, that the acces-sibility of digital data of good quality
and reliability was, and still is, one of the major challengesin Namibia. Another challenge faced throughout the data-capturing period was that existing data sets were of a poorquality or occurred in strange electronic formats lacking anydocumentation. This made it very difficult to collect thedata and transform it into a consistent and correct cover-age.The first step was to implement a geographical reference
system to be used throughout the Map project. Taking intoaccount the reference systems for existing data, the followingprojection was chosen:
As the HYMNAM Project and the Hydrogeological Mapdepended greatly on a reliable topographical database, thecreation of this was considered the first important step toensure that all new thematic data fit together geographicallyand logically. The data sets representing the topographicalbackground displayed on the Map were collected or pre-pared as shown in the next table.Numerous corrections were applied to the drainage
pattern because it is both a topographic and a water-relatedfeature. The most accurate and complete data set avail-able was the Map created by the Ministry of Environmentand Tourism (MET) based on the Digital Chart of the World,which is publicly available and compiled from various datasources. Error corrections and completions were necessaryat certain places. For this, topographical maps at scale
106
epyT aerAlauqEsreblA
stinU serteM
diorehpS 1481lesseB
lellarapdradnatsts1 000062-
lellarapdradnatsdn2 000002-
naidiremlartneC 000381
nigirofoedutitaL 000022-
)sertem(gnitsaeeslaF 0)sertem(gnihtroneslaF 0
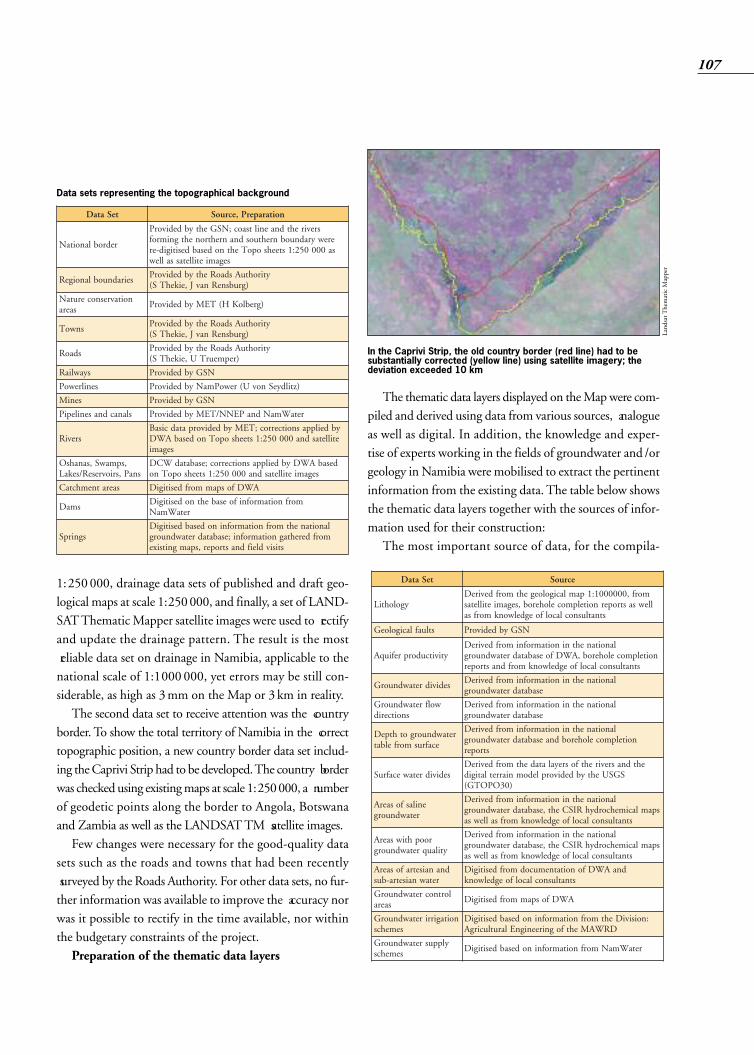
1:250 000, drainage data sets of published and draft geo-logical maps at scale 1:250000, and finally, a set of LAND-SAT Thematic Mapper satellite images were used to rectifyand update the drainage pattern. The result is the most reliable data set on drainage in Namibia, applicable to thenational scale of 1:1000 000, yet errors may be still con-siderable, as high as 3mm on the Map or 3 km in reality.The second data set to receive attention was the country
border. To show the total territory of Namibia in the correcttopographic position, a new country border data set includ-ing the Caprivi Strip had to be developed. The country borderwas checked using existing maps at scale 1:250000, a numberof geodetic points along the border to Angola, Botswanaand Zambia as well as the LANDSAT TM satellite images.Few changes were necessary for the good-quality data
sets such as the roads and towns that had been recently surveyed by the Roads Authority. For other data sets, no fur-ther information was available to improve the accuracy norwas it possible to rectify in the time available, nor withinthe budgetary constraints of the project.Preparation of the thematic data layers
The thematic data layers displayed on the Map were com-piled and derived using data from various sources, analogueas well as digital. In addition, the knowledge and exper-tise of experts working in the fields of groundwater and /orgeology in Namibia were mobilised to extract the pertinentinformation from the existing data. The table below showsthe thematic data layers together with the sources of infor-mation used for their construction: The most important source of data, for the compila-
107
teSataD noitaraperP,ecruoS
redroblanoitaN
srevirehtdnaeniltsaoc;NSGehtybdedivorPerewyradnuobnrehtuosdnanrehtronehtgnimrofsa000052:1steehsopoTehtnodesabdesitigid-er
segamietilletassallew
seiradnuoblanoigeRytirohtuAsdaoRehtybdedivorP
)grubsneRnavJ,eikehTS(
noitavresnocerutaNsaera
)grebloKH(TEMybdedivorP
snwoTytirohtuAsdaoRehtybdedivorP
)grubsneRnavJ,eikehTS(
sdaoRytirohtuAsdaoRehtybdedivorP
)repmeurTU,eikehTS(
syawliaR NSGybdedivorP
senilrewoP )ztildyeSnovU(rewoPmaNybdedivorP
seniM NSGybdedivorP
slanacdnasenilepiP retaWmaNdnaPENN/TEMybdedivorP
sreviRybdeilppasnoitcerroc;TEMybdedivorpatadcisaBetilletasdna000052:1steehsopoTnodesabAWD
segami
,spmawS,sanahsOsnaP,sriovreseR/sekaL
desabAWDybdeilppasnoitcerroc;esabatadWCDsegamietilletasdna000052:1steehsopoTno
saeratnemhctaC AWDfospammorfdesitigiD
smaDmorfnoitamrofnifoesabehtnodesitigiD
retaWmaN
sgnirpSlanoitanehtmorfnoitamrofninodesabdesitigiD
morfderehtagnoitamrofni;esabatadretawdnuorgstisivdleifdnastroper,spamgnitsixe
teSataD ecruoS
ygolohtiLmorf,0000001:1pamlacigoloegehtmorfdevireD
llewsastropernoitelpmoceloherob,segamietilletasstnatlusnoclacolfoegdelwonkmorfsa
stluaflacigoloeG NSGybdedivorP
ytivitcudorprefiuqAlanoitanehtninoitamrofnimorfdevireD
noitelpmoceloherob,AWDfoesabatadretawdnuorgstnatlusnoclacolfoegdelwonkmorfdnastroper
sedividretawdnuorGlanoitanehtninoitamrofnimorfdevireD
esabatadretawdnuorg
wolfretawdnuorGsnoitcerid
lanoitanehtninoitamrofnimorfdevireDesabatadretawdnuorg
retawdnuorgothtpeDecafrusmorfelbat
lanoitanehtninoitamrofnimorfdevireDnoitelpmoceloherobdnaesabatadretawdnuorg
stroper
sedividretawecafruSehtdnasrevirehtfosreyalatadehtmorfdevireD
SGSUehtybdedivorpledomniarretlatigid)03OPOTG(
enilasfosaerAretawdnuorg
lanoitanehtninoitamrofnimorfdevireDspamlacimehcordyhRISCeht,esabatadretawdnuorg
stnatlusnoclacolfoegdelwonkmorfsallewsa
roophtiwsaerAytilauqretawdnuorg
lanoitanehtninoitamrofnimorfdevireDspamlacimehcordyhRISCeht,esabatadretawdnuorg
stnatlusnoclacolfoegdelwonkmorfsallewsa
dnanaisetrafosaerAretawnaisetra-bus
dnaAWDfonoitatnemucodmorfdesitigiDstnatlusnoclacolfoegdelwonk
lortnocretawdnuorGsaera
AWDfospammorfdesitigiD
noitagirriretawdnuorGsemehcs
:noisiviDehtmorfnoitamrofninodesabdesitigiDDRWAMehtfognireenignElarutlucirgA
ylppusretawdnuorGsemehcs
retaWmaNmorfnoitamrofninodesabdesitigiD
In the Caprivi Strip, the old country border (red line) had to besubstantially corrected (yellow line) using satellite imagery; thedeviation exceeded 10 km
Data sets representing the topographical background
Landsat Thematic Mapper

tion of the thematic data layers related to groundwater, wasthe groundwater database operated by DWA. The secondmain thematic layer displaying the lithological units is largelybased on the existing geological map of the Geological Surveyof Namibia at a scale of 1:1000000.
Lithology layer The preparation of the thematic data set on the litho-
logical layer took place in several steps. As a starting point,the units on the 1:1000000 Geological Map were arrangedaccording to the rock types (lithology), because the type ofrock determines the groundwater flow in it. Being of minorimportance, the age and stratigraphical position were nottaken into consideration. A legend describing the differentrock types was created. This differentiation was graduallyrefined and finalised, using detailed documentation and theexpertise of local geologists. Finally, the 164 units outlinedon the geological map were reduced to the 12 units containedin the lithological data layer.The area covered by each of these large lithological units
is shown in the bar graph. Almost half of the country (48%)is covered by unconsolidated deposits such as gravel, sandand silt, while 24% are sedimentary hard rocks (limestone,dolomite, sandstone, mudstone, shale), 12% metamor phosedsedimentary rocks, 4% young volcanic rocks, and 12% base-ment rocks, bringing the percentage of hard rock areas inwhich groundwater exploration is difficult, to 52%.
Aquifer productivity
The current groundwater database stores information onpositions, construction details, depth to water level andyields from about 48000 boreholes. Problems encounteredincluded missing values and wrong entries, due to the his-torical development of the database. It started as an application in a UNIX environment, was converted intoa dBase file and finally into a MS-ACCESS database. Thiscaused many errors due to lost tables, mixed up data setsand destroyed relationships between various tables. Now,DWA together with NamWater is developing a new data-base application (GROWAS) which will be ready by the endof 2001. Nevertheless, the content of the database proved very
useful and the influence of errors was minimised by the largevolume of information available and the small scale of theMap, scale 1:1000000. The number of boreholes, and thusthe reliability of information is shown on the inset map“Density of borehole information” on the main Map. Thisis reflected here in the graph showing the number of bore-holes recorded in the database, per lithological unit of theMap. The two graphs clearly indicate the correlation between
the size of the area covered by the various lithological unitsand the number of boreholes drilled. Surprisingly, no unitstands out as a prominent aquifer with a high number ofboreholes. Instead, the distribution of population and thedemand for groundwater are decisive criteria for the number
108
Area covered by the lithology units used on the Map
Boreholes drilled in the lithological units

of boreholes in various parts of the country. Therefore, it isnecessary to analyse the distribution of borehole yields tobe able to delineate aquifers, aquitards and aquicludes.The wealth of borehole completion reports was used to
confirm and amend the information extracted from the data-base. These hardcopy documents are filled once a borehole isdrilled. There are about 21000 borehole completion reportsin the files of DWA and NamWater. These reports com-prise information about the borehole design, the initial yieldduring pumping tests and the lithological units encountered.In the compilation of the Map, only reports providing solidand complete information were used. A limited number ofrepresentative boreholes with a detailed lithological descrip-tion and complete data sets on depth, yield and groundwa-ter quality, were selected as reference bore holes and are dis-played on the Map (see Annex 4 “Comparison of selectedguideline values for drinking water quality”).Reports from previous groundwater projects available in
NamWater and DWA were scrutinised and checked to obtaincomplete and consistent data. Useful ones were selected andthe information regarding groundwater potential, quality anduse, as well as other important hydrogeological details wereextracted for the Map. This information was used to confirmor adjust the information derived from the database andthe completion reports.Using this information, the second important layer, the
aquifer productivity data set, was created step by step. Firstly,the yield figures stored in the groundwater database wereanalysed and spatially interpolated. The following categorieswere chosen, after discussion with local experts:These yield figures and the aquifer type derived from a
generalisation of the lithological layer, whether porous, uncon-solidated deposits or fractured hard rocks, made it possibleto map the country according to the International Legendfor Hydrogeological Maps, recommended by the Inter nationalAssociation of Hydrogeologists (IAH) and UNESCO
(Struck meier & Margat 1995). This legend uses a colourscheme that subdivides the rock bodies into aquifers andnon-aquifers (aquitards and aquicludes). The latter are shownin two shades of brown, while the aquifers are further splitinto porous or fractured. This distinction is useful, becausethey have fundamentally different flow characteris tics andthus groundwater investigation and exploitation also differs.Porous aquifers are shown in blue and fractured aquifers ingreen. Two shades of these colours are used to reflect the pro-ductivity. Dark blue and dark green represent aquifers withhigh potential (yields generally above 15m3/h), while lightblue or green indicate aquifers with moderate potential (yieldsgenerally between 3 and 15m3/h).The results of this data analysis exercise were discussed
with the local groundwater consultants. They provided inputbased on their experience and specialist knowledge of certainareas of the country. Their input was all the more v aluable,because few records exist about unsuccessful boreholes andthus the aquifer potential concluded from the database andother records was seriously overestimated in some areas. Thiscould be corrected by those with local experience. The other groundwater related data sets were established
in much the same way. Firstly, the data available in the data -base were analysed and the results printed on the Map. Then,local groundwater consultants were solicited to rectify andadjust those results. This multiple-step exercise, combininginformation of different sources, evaluating it, discussing itand refining it, finally created the best picture of the hydrogeological situation in the country. Involving localhydrogeologists in this project also guaranteed that the experience and intuitive expert know ledge of individuals,not captured in any database nor documented, was harnessedfor the Map.
Inset mapsThere are five inset maps and three geological cross
sections on the Map. These provide complementary infor-mation that, to retain clarity and legibility, could not be pre-sented on the main Map.In the inset map “Rainfall and main catchments in South-
109
mnidleiY 3 h/ elbissopseitivitcanamuH
5.0< kcotsevilllamsyrevroylppusretawycnegremeylnO
3–5.0 stinukcotsllamshtiwstnemelttesllamS
51–3egralfotnuomaniatrecahtiwstnemelttes/gnimraF
stinukcots
51>lapicinum,stinukcotsegralhtiwstnemelttes/gnimraF
noitagirridnaseilppusretaw

ern Africa”, at a scale of1:10000 000, the majorrivers and their catchmentbasins are shown togetherwith the rainfall distributionin southern Africa, south of12° latitude. It clearlydemon strates that Namibiashares most of the surfacewater catchments with neighbouring countries and lies inan area of very low rainfall. The data for this inset maporiginated from the data set of the “SADC Water ResourceDatabase” and from Arnestrand & Hansen, 1993; publishedin Pallett 1997, amended and revised on the basis of up todate Namibian sources.The insert map “Altitude of ground surface”, at a scale of
1:6 000000, shows altitude intervals in metres above meansea level. These contour lines were interpolated from the dig-ital terrain model GTOPO30 provided by the US GeologicalSurvey. This terrain model was developed using several datasources. The lateral grid size is about 900m. The accuracyof the height information depends heavily on the data sourceused for a specific area and can be as low as ±80m. Obvi-ous errors in the data set have been corrected on the basisof topographic maps at scale 1:250000. The inset map “Groundwater quality”, at a scale of
1:6 000000, shows the TDS (total dissolved solids) valuesin boreholes throughout the country. The classification isaccording to the Namibian Guidelines (Annex 4), whichclassifies water according to quality criteria as Groups A (excel-lent quality water), B (good quality water), C (low risk water)and D (high risk water, unsuitable for human consumption).The insert map “Density of borehole information”, at a
scale of 1:6000000, was created by calculating the numbersof boreholes existing in the database per topographical mapsheet at 1:50000. The information shown on this map to -gether with the figures provide a good indication aboutthe reliability of information, i.e. where in the country enoughknowledge about the hydrogeological situation is available,and where information is lacking. The inset map “Vulnerability of groundwater re sources”,
at 1:6 000000 scale, out lines the vulnerability of ground-
water resources to pollution.The risk of ground water pol-lution from the surfacemainly depends on the depthto the water table, the typeof the underlying aquifer(porous or fractured), theflow in the aquifers, and theamount of rainfall in the
recharge area. The vulnerability map therefore integratesdepth to groundwater, aquifer type, predominant flow andrecharge from rainfall, takes these variables into account ina simple rating system, and shows where proper protectionof aquifers from pollution is essential.The Map includes three cross-sections of important multi-
layered aquifer systems in the country. The upper two inter-sect the Stampriet Artesian Basin and the bottom one intersectsthe karstified Otavi Mountain Land area and the adjacentareas to the north-west and south-east. These cross-sectionsemphasise the vertical dimension and highlight the fact thatgroundwater flow systems are 3-dimensional in reality. Thisis difficult to portray in the 2-dimensions available for a map.Sound interpretation of a hydrogeological map requires a con-stant awareness of the third dimension.
Use of the MapThe purpose of the Map is to provide the public as well
as decision makers in the government and the private sector,with accurate information on the occurrence, utilisation andvulnerability of groundwater resources in the country. Ideally,it must provide answers to questions asking “where”, “what”and “how much”. Due to the small scale of 1:1000000 ofthe Map, it provides an overview for planning of new ground-water-related projects. For instance, it can assist in roughplanning of environmentally sound new settlements, indus-trial sites, and water abstraction schemes. It can also be usedas a strategic document for national development plans. Ithelps identify areas in which ground water know ledge is asyet insufficient, and where further investigative studies shouldbe undertaken. For a hydrogeological specialist it deliversbasic information about work to be carried out for a ground-
110
Claudia du Plessis

water exploration project (e.g. siting methods), and gives anindication about expected success rates for drilling new bore-holes in certain areas. It definitely cannot be used to exactlylocate new boreholes, since the scale is much too small andthe resolution and accuracy of the information used to com-pile the Map is insufficient.The International Legend allows the Map to be read in
two different ways, from a distance and close up. From adistance of several metres, the overview of the Map area canbe grasped and the distribution of aquifers, aquitards andaquicludes easily seen. For those wanting more detailedinformation, e.g. on the use of groundwater, there is, oncloser scrutiny, a wealth of symbols indicating water supplyand irrigation schemes, springs, boreholes and water controlareas.In particular, emphasis is placed on showing data charac -
ter ising the groundwater flow systems. Springs are naturaloutflow areas and may sustain important wetlands. The waygroundwater supplies these springs is shown, where suffi-ciently known, by arrows indicating the flow direction. Inmost of the country, particularly in the western moun-tainous areas, the boundaries of large, regional groundwa-ter flow systems coincide with the boundaries of surfacewater catchments, and the groundwater divides are notshown. Where they are known to differ from the catchmentboundaries, groundwater divides are shown as a line of pur-ple circles. They can be used to delineate the groundwaterflow systems within uniform hydrogeological units.A wealth of man-made features that affect the natural
groundwater systems is shown in red on the Map. All siteswhere groundwater is abstracted in appreciable quantities,such as water supply and irrigation schemes using ground-water are depicted. In the vicinity of these abstraction points,groundwater levels may be lowered locally or regionally.Inter-basin transfers from one catchment or groundwaterbasin to another are represented on the Map, because thisinformation is important for water balance calculations. Forinstance, in the north and in the Windhoek area, appreciableamounts of water are imported into these groundwater basinsvia canals and pipelines.Information on water quality is only considered if the
groundwater is unfit for human consumption because of
high concentrations of total dissolved solids, i.e. exceed-ing 2 600 mg/L. More detailed information on chemicalparameters can be found on the set of groundwater qualitymaps published in 1982 (Huyser et al. 1982).The inset maps, at even smaller scales, serve only as a rough
overview of the theme displayed, but provide additional back-ground information to understand and comple ment the fea-tures shown on the main Map. For example, the Map show-ing the borehole density in the country reflects the reliabilityof the productivity data in certain areas. Obviously, in areaswith a low borehole density, the productivity informationis based on fewer records and is thus less accurate. Finally, the Map user is referred to the information pro vided
in this book “Groundwater in Namibia – an explana tion tothe Hydrogeological Map”. It contains a wealth of usefulcomplementary information on the natural environ ment,rocks and groundwater, and includes aspects of ground-water use and protection pertinent to Namibia.
H STRUB, W STRUCKMEIER
111
FURTHER READING
• Goetze H D. 1982. Chemise Kwaliteit van dieOndergrondse Waters in Suidwes-Afrika/Namibie. Vol. 4. Department van Waterwese,Suidwes-Afrika, Windhoek.
• Huyser D J. 1982. Chemise Kwaliteit van dieOndergrondse Waters in Suidwes-Afrika/Namibie. Vol. 1-3. Department van Waterwese,Suidwes-Afrika, Windhoek.
• Pallet J (Ed) 1997. Sharing Water in SouthernAfrica. Desert Research Foundation of Namibia.Windhoek.
• Struckmeier W and J Margat. 1995.Hydrogeological Maps. A Guide and a StandardLegend. International Contributions toHydrogeology, 17. Hannover.
• Verheust L and G Johnson. 1998. The SADCWater Resource Database: Contents, Datastructure and User Interface. ALCOM WorkingPaper No 14. ALCOM/FAO, Harare.

Anhaeusser CR & Maske S. (Eds). 1986. Mineral Deposits of South-ern Africa. Vols. I & II: Johannesburg (Geol. Society South Africa).
Atlas of Namibia (in print): Ministry of Environment and Tourism.Directorate of Environmental Affairs. Windhoek.
Barnard P. 1998. Biological Diversity in Namibia, a country widestudy. Namibian National Biodiversity Task Force. Windhoek.
Berthelot RM, Edwards KA & Najjar IM. 1989. Assessment of theWater Resources Sector in Namibia. UNDP Base Studies on Finan-cial, Economic and Social Aspects for the Arrangements for Inde-pendence in Namibia, mission report. Windhoek.
Besler H. 1991. Der Namib-Erg: älteste Wüste oder älteste Dünen?Geomethodica, 16.
Bethune S & Puz A. 1984. Literature survey: Water quality changesduring the long distance transfer of water in pipelines and canalswith special reference to the Eastern National Water Carrier. Internal report DWA no. 85/8; Windhoek.
Bibliography of Namibian Earth Science. 1991. Vol. 2 [Publica-tions from 1981 to 1986]. Windhoek (Geol. Survey).
Bibliography of South West African/Namibian Earth Science. 1983.Vol. 1 [Publications to the end of 1980]. Windhoek (GeologicalSurvey).
Bittner A. 1999. Database for further decisions regarding the neces-sity and feasibility of future geophysical and hydrogeological inves-tigations in the study areas Oshivelo, Eastern Caprivi and East-ern Tsumkwe-Otjinene (North-Eastern Namibia). Unpublishedreport submitted to the Bundesanstalt für Geowissenschaften undRohstoffe (BGR), Hannover, and the Department of Water Affairs(DWA). Windhoek.
Blümel WD. 1991. Kalkkrusten - Ihre genetischen Beziehungen zuBodenbildung und äolischer Sedimentation. Geomethodica.
Botha BJV & Botha PJ. 1979. The Nosib Group along the lowerreaches of the Omaruru River, South West Africa. Trans. Geol.Soc. South Africa, 82.
Bremner JM. 1984. The coastline of Namibia. Joint Geol. Surv. Univ.Cape Town Mar. Geosci. Group Techn. Rep., 15.
Buch M. 1993. Känozoischer Klima- und Umweltwandel in Etoscha/Nord-Namibia - Untersuchungen zur Klimasensibilität und Geo-morphodynamik eines semi-ariden Landschaftsraumes imsüdlichen Afrika. Unpublished habil. thesis Regensburg Univer-sity. Regensburg.
Cashman AC. 1994. Drought management in Namibia 1992/93 withspecial reference to water supply and the use of public aware-ness campaigns. In: Gieske & Gould J. (Eds): Proc. IntegratedWater Resources Management Workshop 1994, 17-18 March,Kanye-Gaborone.
CAWMP - Central Area Water Master Plan: Phase 1. 1993. SummaryReport. Vol. 1-11. Republic of Namibia, Ministry of Agriculture,Water and Rural Development, Department of Water Affairs,Gesellschaft für Technische Zusammenarbeit GmbH (GTZ),Consulting Engineers Salzgitter (CES), Lund Consulting Engineers (LCE), Windhoek Consulting Engineers (WCE).Windhoek.
CAWMP - Central Area Water Master Plan: Interim Phase. 1995.Vol. 1: System Analysis; Vol. 2: Terms of Reference. Republic ofNamibia, Ministry of Agriculture, Water and Rural Development,Department of Water Affairs, Gesellschaft für Technische Zusam-
menarbeit GmbH (GTZ), Consulting Engineers Salzgitter (CES),Lund Consulting Engineers (LCE), Windhoek Consulting Engi-neers (WCE). Windhoek.
Chivell EH & Mostert A. 1991. Karst - Central Area: Rainfall Comparison. Unpublished DWA report, Windhoek.
Chivell EH & Crerar SE. 1992. Unit runoff map for Namibia. Unpub-lished DWA report, Windhoek.
Clayton AJ. 1973. Die Trinkwassergewinnung aus gereinigtem Abwasser in Windhoek. Wasserwirtschaft, 63.
Colvin C. 1994. The Hydrogeology of the Windhoek aquifer, Namibia.Unpubl. M.Sc. thesis Univ. Coll. London. London.
Crerar SE & Church JT. 1988. Evaporation map for Namibia. Unpub-lished DWA report. Windhoek.
Cunnigham T, Hubbard D, Kinahan J, Kreike E, Marsh A, SeelyM & Stuart-Williams V. 1992. Oshanas - Sustaining people, environment and development in Central Owambo, Namibia.Windhoek (Typoprint).
De Beer JH & Blume J. 1985. Geophysical and hydrogeological inves-tigations of the groundwater resources of Western Hereroland,South West Africa/Namibia. Trans. geol. Society S. Africa, 88.
Department of Water Affairs. 1982. South West Africa/Namibia -Groundwater Quality Map, Scale 1:1000000, 4 sheets: Total Dis-solved Solids, Sulphate, Nitrate and Fluoride. Windhoek (Depart-ment of Water Affairs).
Department of Water Affairs. 1991. Guidelines for the evaluationof drinking water for human consumption with reference to thechemical, physical and bacteriological quality. Windhoek.
Desert Research Foundation of Namibia. 1994. Understanding theOshana environment - Euvoko Lyoshana Nomudhingoloko. Wind-hoek (Gamsberg MacMillan Publishers).
Dierkes K. 1996. Hydrogeological Investigations at the SouthernMargin of the Etosha-Kalahari Basin/Namibia. Unpub. Diplomathesis, University of Regensburg. Regensburg.
Diester-Haas L, Heine K, Rothe P & Schrader H. 1988. Late Quater -nary history of continental climate and the Benguela Currentoff South West Africa. - Palaeogrography, Palaeo climatology,Palaeoecology, 68.
Dingle RV & Hendey Q B. 1984. Late Mesozoic and Tertiary sedi-ment supply to the eastern Cape basin (SE Atlantic) and palaeo-drainage systems in southwestern Africa. Marine Geol., 56.
Dingle RV. 1992/93. Structural and sedimentary development of thecontinental margin off southwestern Africa. Communs. GeologicalSurvey, Namibia, 8. Windhoek.
Driscoll FG. 1987. Groundwater and Wells. 2nd ed. St. Paul, Minnesota (Johnson Divison).
Fisch M. 1987. Die Hydrographie des Kavangoflusses. Journal SWAWissenschaftliche Gesellschaft, XLI. Windhoek.
Freeze R A & Cherry JA. 1979. Groundwater. London (Prentice-Hall).
Frindt M & Crerar SE. 1991. OMDEL DAM - An appropriate Solution. Namibian Eng., 4. Windhoek.
Frommurze HF. 1931. Flowing boreholes in the Rehoboth, Gibeonand Gobabis Districts, South West Africa. Trans. geol. SocietySouth Africa, 34.
112
Bibliography

Geological Map of Namibia. 1980. Geological Survey Windhoek(Government Printer).
Geological Survey of Namibia. 1982. The Geology of Namibia. Wind-hoek.
Geological Survey of Namibia. 1994. Geological Map of Namibia,1:250000 Geological Series, Windhoek.
Gevers TW. 1932. The hot springs of Windhoek, S.W. Africa. Trans.Geol. Society South Africa, XXXV.
Gevers TW, Hart O. & Martin H. 1963. Thermal waters along theSwakop River, South West Africa. Trans. Geol. Society SouthAfrica, 66.
Geyh MA & Plöthner D. 1995. Groundwater isotope study in theOmaruru River delta aquifer, central Namib Desert, Namibia.Application of Tracers in Arid Zones (Proceedings of the ViennaSymposium, August 1994; IAHS Publication No. 232.
GKW Consult - Bicon - Parkman. 1996. Water supply to the Cen-tral Namib Area of Namibia - Feasibility Study. Unpublished FinalReport (Vol. 1) to DWA and KfW, Summary Report. Windhoek.
Goetze HD. (Ed) 1982. Chemiese Kwaliteit van de Grondwater inSuidwes-Afrika/Namibië (met spesifieke Verwysing na die Benut-tingswaarde van de Water). Vol. 4. Benaderde Geografiese Posisiesvan de Waterbronne; 26 maps; Pretoria, Windhoek (DWA).
Government of the Republic of Namibia. 1995. First National Development Plan (NDP 1) Vol. 1-2. 1995 / 1996-1999 /2000. Wind hoek (National Planning Commission).
Griebel EG, Kloot RW & Schneeweiss R. 1995. Development ofwater management at Rössing mine in hyper-arid area and envi-ronmental and financial benefits. Proc. African Mining '95 conference, 7-9 June 1995, Windhoek.
Groundwater Consulting Services. 1993. Owambo Drought ReliefReport.Windhoek.
Grünert N. 2000. Namibia - Fascination of Geology. Windhoek/Göttingen. (K Hess Publ.).
Halbach AJ. 2000. Namibia. Wirtschaft, Politik, Gesellschaft nachzehn Jahren Unabhängigkeit. Nam. Wissenschaftliche Gesellschaft,Windhoek, München.
Haeton THE, Talma AS & Vogel JC. 1983. Origin and history ofnitrate in confined groundwater in the western Kalahari. Journalof Hydrology, 66.
Hedberg RM. 1979. Stratigraphy of the Owamboland Basin, SouthWest Africa. Bull. Precambrian Research Unit, University of CapeTown, 24. [PhD thesis Univ. Cape Town].
Heine K. 1992. On the ages of humid Late Quaternary phases insouthern African arid areas (Namibia, Botswana). Palaeoecol. Afr.,23.
Hellwig DHR. 1988. Challenging the Namib Dune Sea. Journal Lim-nol. Society South Africa, 14.
Heyns P. 1991. Perspective on Water Affairs. Unpublished DWAreport. Windhoek.
Heyns P. 1992. Namibia's water resources: A new approach needed.Namibia Rev., 1.
Heyns P. 1992. Water in the Desert Sands. Namibia Yearbook, 2.Windhoek.
Heyns PS, Montgomery J & Seely MK. 1998. Namibia’s Water, ADescicion Maker’s Guide. DRFN and DWA. Windhoek, Namibia.
Hoad N. 1990. Water Supply in a Desert Environment. In: Environ -mental Implications of Prospecting and Mining in the Namib.A Seminar presented by Geol. Soc. Namibia & Desert Ecol.Res. Unit Namibia. Windhoek (Geol. Survey Namibia).
Hoffmann JRH. 1979. Die chemiese samestelling van warm water -bronne in Suid- en Suidwes-Afrika. Spesiale verslag no. WAT 56;NIWN/WNNR.
Hövermann J. 1978. Formen und Formung in der Pränamib (Flächen- Namib). Z. Geomorph. N.F., 30.
Hugo PJ, Schalk KEL. & Barnes S-J. 1983. Bibliography of SouthWest African/Namibian Earth Science. Vol. 1. Windhoek (Geol.Survey). [Publications to the end of 1980]
Huyser DJ. (Ed). 1982. Chemiese Kwaliteit van de Grondwater inSuidwes-Afrika/Namibië (met spesifieke Verwysing na die Benut-tingswaarde van de Water). Vol. 1-3. Pretoria, Windhoek (DWA).
Irish J, Martini JEJ & Marais JCE. 1991. Cave Investigations inNamibia III: Some 1991 SWAKNO Results. Bull. South Africa.Spel. Association, 32.
Jackson JA. (Ed). 1997. Glossary of Geology. Fourth Edition. Amer-ican Geol. Institute. Alexandria, VA.
Jacobson PJ, Jacobson KM & Seely MK. 1995. Ephemeral Riversand their Catchments: Sustaining People and Development inWestern Namibia. Windhoek (Desert Research Foundation ofNamibia).
Jaeger F & Waibel F. 1920. Beiträge zur Landeskunde von Süd-westafrika. Mitteilungen aus den deutschen Schutzgebieten,Ergänzungsheft, 14. Berlin.
Kehrberg S. 1993. Koichab-Lüderitz Regional Water Scheme - resultsof the 1992/93 geohydrological investigation. Unpublished DWAreport. Windhoek.
Kent LE. 1949. The thermal waters of the Union of South Africa andSouth West Africa. Trans. Geol. Society South Africa, 52.
Kirchner J. 1981. An updated evaluation of the Windhoek Ground-water Resources. Unpublished report, DWA. Windhoek.
Kok TS. 1964. The occurrence and location of groundwater in SouthWest Africa. Unpubl. PhD thesis Cape Town, Univ. of Cape Town.
Korn H & Martin H. 1957. The Pleistocene in South-West Africa.In: Clark J D. (Ed). 1957. Proc. 3rd Pan African Congress on Pre-history, Livingstone, 1955.
Kruseman GP & de Ridder NA. 1991. Analysis and Evaluation ofPumping Test Data. Reprinted 2nd ed. Wageningen (Internat.Institute for Land Reclamation and Improvement/ILRI).
Lancaster J, Lancaster N & Seely MK. 1984. The climate of the centralNamib. Madoqua, 14.
Lancaster N. 1989. The Namib Sand Sea - Dune forms, processesand sediments. Rotterdam, Brookfield (Balkema).
Lau B & Stern C. 1990. Namibian Water Resources and their Manage -ment - A prelimanay History. Archeia, No 15. Windhoek.
Lindeque M & Archibald TJ. 1991. Seasonal wetlands in Owamboand the Etosha National Park. Madoqua, 17.
Littmann T. 1989. Climatic change in Africa during the Last Glacial:
113
Facts and problems. Palaeoecol. Afr., 20.
Lück AH. 1999. Water management planning in arid regions of South-west Africa - Supply problems and future prospects in the catch-ment area of the Omaruru River, Namibia. Natural Resources andDevelopment, 49/50. Tübingen (Institute for Scientific Cooper-ation).
Maritz P. 1993. The National Water Supply and Sanitation SectorPolicy of the Government of Namibia. Unpublished DWA draftreport Windhoek.
Marker ME. 1982. Aspects of Namib geomorphology: A doline karst.Palaeoecol. Afr., 15.
Marsh AC & Seely MK. 1992. Oshanas: Sustaining people, environment and development in central Owambo, Namibia. Windhoek (Typoprint).
Martin H. 1961. Hydrology and water balance of some regions coveredby Kalahari sands in South-West Africa. In: Inter-African Con-ference on Hydrology (Nairobi) CCTA Publ. No. 66.
Martin H. 1962. Das artesische Becken der Südkalahari. Wissensch.Forschung in SWA, 1. Windhoek (SWA Scientific Society).
Martin H. 1963. Geological map of South West Africa, 1:1000000.Windhoek, Pretoria (Government Printer).
Martin H. 1965. The Precambrian geology of South West Africa andNamaqualand. Precambrian Research Unit. Cape Town. Universityof Cape Town.
Martin H. 1981. The late Palaeozoic Gondwana glaciation. Geologische Rundschau, 70.
Martini JEJ, Irish J & Marais JCE. 1990. Les grottes du Sud QuestAfrique/Namibie. Spelunca, 38.
Mendelsohn J & Roberts C. 1998. An environmental profile and atlasof Caprivi. (Gamsberg Macmillan), Windhoek.
Mendelsohn J, El Obeid S & Roberts C. 2000. A profile of north-central Namibia. (Gamsberg Macmillan), Windhoek.
Mendelsohn J & El Obeid S. 2001. A prelimanary profile of theKavango Region in Namibia. Namibia Nature Foundation. Windhoek, Namibia.
Miller R McG. 2000. The Owambo Basin of Northern Namibia. In:Selley RC (Ed.) Sedimentary Basins of the World: Africa. Ams-terdam (Elsevier).
Miller R McG & Grote W. 1988. Geological map of the DamaraOrogen, 1:500000, Windhoek (Geological Survey).
Miller R McG. 1983. Evolution of the Damara Orogen of South WestAfrica/Namibia. Special Publication, Geology Society South Africa,11.
Ministry of Mines and Energy, Geological Survey 1992. The MineralResources of Namibia. Windhoek.
Momper JA. 1982. The Etosha Basin re-examined. Oil & Gas J., 5.
Nawrowski J & Tordiffe E. 1993. Investigation for Artificial Rechargeto the OMDEL Aquifer, Namibia. Africa Needs Ground Water -An International Ground Water Convention 6-8 Sept. 1993,conv. paper, Vol. II. Johannesburg.
Offenborn G. 1999. Hydrogeological investigation in the Omaruru“Delta” (OMDEL) Aquifer North of Swakopmund, NamibDesert, Namibia (Hydrochemistry, isotope hydrology, aerogeo-
physics). Unpublished Diploma thesis, Technical University ofHannover.
Office of the Prime Minister. 1992. Act No. 33 of 1992: Minerals(Prospecting and Mining) Act. Government Gazette of the Republicof Namibia, 564. Windhoek.
Pallett J. (Ed). 1995. The Sperrgebiet - Namibia’s Least Known Wilder-ness, An Environmental Profile of the Sperrgebiet or DiamontArea 1, in South-Western Namibia. - Windhoek (Desert ResearchFoundation of Namibia and NAMDEB Diamond CorporationLtd.).
Pallett J. (Ed). 1997. Sharing Water in Southern Africa. Windhoek(Desert Research Foundation of Namibia).
Passarge S. 1904. Die Kalahari. - Versuch einer physisch-geographischenDarstellung der Sandfelder des südafrikanischen Beckens. Textband+ Kartenband. Berlin (Dietrich Reimer Verlag).
Penrith M J. 1978. Otjikoto Lake. South West Africa Annual 1978.
Du Plessis NP & Bethune S. 1992. Report on the investigationinto the influence of the Grootfontein-Omatako Canal on wildanimals and methods to prevent identified problems. UnpublishedDWA report, Windhoek.
Plöthner D. 1998. Namibia: Zusammenarbeit mit dem Departmentof Water Affairs (DWA) bei der Grundwassererkundung. Zeit -schrift für Angewandte Geologie, 44.
Range P. 1914. Das artesische Becken in der Südkalahari. Dt. kolon.Blatt, 8.
Range P. 1915. Ergebnisse von Bohrungen in Deutsch-Südwest-Afrika.Beiträge z. geologischen Erforschung der dt. Schutz gebiete, 11.Berlin (Königl. Geol. Landesanstalt).
Range P. 1943. Zur Wasserwirtschaft in Deutsch-Südwestafrika.Beiträge z. Kolonialforschung, V: 135-147.
Ravenscroft W. 1985. The Eastern National Water Carrier - Assuag-ing the nation’s thirst. SWA Annual 1985. SWA Publications;Windhoek.
Rust U & Vogel JC. 1988. Late Quaternary environmental changesin the northern Namib Desert as evidenced by fluvial landforms.Palaeoecol. Afr., 19: 127-137.
Rust U. 1984. Geomorphic evidence of Quaternary environmentalchanges in Etosha, South West Africa/Namibia. In: Vogel, J.C.(Ed). Late Cainozoic Palaeoclimates of the Southern Hemisphere.Rotterdam, Boston (Balkema).
SACS (South African Committee for Stratigraphy) 1980. Stratigra-phy of South Africa: Part 1.: Geological Survey South Africa,Handbook 8.
Schalk K. 1961. Water balance of the Uhlenhorst cloudburst in SouthWest Africa. CCTA Publ., 66. Nairobi.
Schalk KEL & Hegenberger W. 1991. Bibliography of NamibianEarth Science. - Vol. 2. Windhoek (Geological Survey). [Publications from 1981 to 1986].
Schatz I. 1978. Höhlen in den Otavibergen. Newsletter SWA ScientificSociety, 18.
Schmidt G & Plöthner D. 1999. Abschätzung der Grundwasser-vorräte im Fluß- und Dünengebiet des unteren Kuiseb, Namibia.Zeitschrift für angewandte Geologie, 45.
Schmidt G & Plöthner D. 2000. Hydrogeological investigations in
114
the Otavi Mountain Land. In: Sililo O. et al. (Eds). Proceedingsof the XXX IAH Congress on Groundwater: Ground water -Past Achievments and Future Challenges, Cape Town 26Nov-1Dec 2000. Rotterdam (Balkema).
Schmidt M. 1963. Die Wasserwirtschaft Südwestafrikas. Wasser-wirtschaft, 58.
Schneider MB. 1990. Bewässerungslandwirtschaft in Namibia undihre Grundlagen in der Kolonialzeit. Wiss. Forsch. in Namibia,19. Windhoek (Wissenschaftliche Gesesellschaft, Namibia).
Schwartz MO & Plöthner D. 1999. Removal of heavy metals frommine water by carbonate precipitation in the Grootfontein-Omatako Canal, Namibia. Environmental Geology, 39.
Seeger KG. 1990. An Evaluation of the Groundwater Resources ofthe Grootfontein Karst Area. Unpubl. DWA report Windhoek.
Seely MK. 1991. Namibia: drought and desertification. Windhoek(Gamsberg Press).
Seely MK. 1992. The Namib - Natural history of an ancient desert.Shell Guide, 2nd ed. Windhoek (John Meinert).
Seely MK. & Jacobson K M. 1994. Desertification and Namibia: aperspective. Journal of African Zoology, 108.
Seimons WS & van Tonder GJ. 1993. Geohydrological characteri-sation and modelling of the Otjiwarongo marble aquifer inNamibia. Afr. Geoscience Rev., 1.
Selby MJ, Hendey CH & Seely MK. 1979. A late Quaternary lakein the central Namib Desert, southern Africa, and some impli-cations. Palaeogrography, Palaeoclimatology, Palaeoecology, 26.
Sengpiel K-P. 1997. Improved Delineation of Saline Groundwater by Air-borne Electromagnetics. Proceedings of the 14th Salt Water Instru-sion Meeting (SWIM 1996), Malmö/Sweden, 16-21 June 1996.
Siemon B & Sengpiel K-P. 1997. Helicopter-borne electromagneticgroundwater exploration survey in the Kuiseb Dune Area, CentralNamib Desert. Proceedings South African Geophysical Associa-tion (SAGA) Fifth Technical Meeting, 28-30 September 1997,Swakopmund, Namibia.
Siesser WG. 1980. Late Miocene origin of the Benguela upwellingsystem off northern Namibia. Science, 208.
Simmonds ALE & Schumann FW. 1987. The occurrence and utilisations of groundwater in Kavango S.W.A./Namibia. JournalWissenschaftliche Gesellschaft, XLI. Windhoek.
Söhnge PG. 1967. Tsumeb - a historical sketch. 2nd ed. S.W.A. Scientific Society Windhoek.
Stengel HW. (Ed). 1963. Wasserwirtschaft - Waterwese - Water Affairsin S.W.A.Windhoek (Afrika-Verlag: Der Kreis).
Stengel HW. 1966. Vom Regen und von Regenkarten in Südwest-afrika. S.W.A. Scientific Society, Spec. publ. 7. Windhoek.
Stengel HW. 1974. Bibliographie Wasserwirtschaft in Südwestafrika.Mittl. Basler Afr. Abh.
Stollhofen H. 1999. Karoo Synrift Sedimentation und ihre tektonischeKontrolle am entstehenden Kontinentalrand Namibias. Z. Dt.Geol. Gesellschaft, 149.
Struckmeier W & Margat J. 1995. Hydrogeological Maps - A Guideand a Standard Legend. International Association of Hydro -geologists/International Contributions to Hydrogeology, 17.
Symons G, Miller R McG, Hata Y, Yamasaki Y, Sugawara K & NoellU. 2000. Geology and resistivity characteristics of the StamprietArtesian Basin. In: Sililo O. et al. (Eds). Proceedings of the XXXIAH Congress on Groundwater: Past Achievements and FutureChallenges, Cape Town, South Africa, 26 Nov. - 1 Dec. 2000. Rotterdam (Balkema).
The Constitution of the Republic of Namibia. 1990. Windhoek (Min-istry of Information and Broadcasting).
Tötemeyer G. (Ed). 1987. Namibia in Perspective. Windhoek.
Tredoux G & Kirchner J. 1980. The evolution of the chemical composition of artesian water in the Auob sandstone. Ground-water 1980 Conf., Pretoria, July 1980.
Truswell, JF. 1977. The geological evolution of South Africa. CapeTown (Purnell & Sons), South Africa.
Turner SD. 1992. Reformulation mission: Ogongo-Okalongo andOshakati-Omakango water schemes. Unpublished report. Windhoek (Netherlands Development Cooperation Office).
United Nations Institute for Namibia 1986. Perspectives for NationalReconstruction and Development. Lusaka.
United Nations 1989. Ground Water in Eastern, Central and SouthernAfrica. Natural Resources/Water Series No. 19: chapter Namibia,New York (United Nations).
Van der Merwe JH. (Ed.) 1983. National Atlas of South West Africa(Namibia). Cape Town.
Vogel JC & Rust U. 1987. Environmental changes in the KaokolandNamib Desert during the present millenium. Madoqua, 15.
Vogel JC & van Urk H. 1975. Isotopic composition of ground -water in semi-arid regions of Southern Africa. Journal of Hydrology,25.
Vogel JC. 1989. Evidence of past climatic change in the Namib Desert.Palaeogrography, Palaeoclimatology, Palaeoecology, 70.
Vrba J & Zaporozec A. 1994. Guidebook on Mapping Ground waterVulnerability. International Association of Hydrogeologists. Inter-national Contributions to Hydrogeology, 16.
Ward JD. 1988. Aeolian, fluvial and pan (playa) facies of the TertiaryTsondab Formation in the Central Namib Desert, Namibia. Sedimentary Geology, 55.
Ward JD. 1990. Geological processes at work in the Namib. In: Envi-ronmental Implications of Prospecting and Mining in the Namib.A Seminar presented by Geol. Soc. Namibia & Desert Ecol.Res. Unit Namibia. Windhoek (Geological Survey, Namibia).
Wipplinger O. 1958. Storage of Water in Sand: An Investigation ofthe Properties of Natural and Artificial Sand Reservoirs and ofMethods of Developing such Reservoirs. Windhoek (South WestAfrica Administration, Water Affairs Branch).
World Bank, The United Nations Development Programme. 1995.Sub Saharan Africa - Hydrological Assessment - SADC Countries.Unpubl. Draft Country Report: Namibia. Montpellier.
World Health Organisation. 1984. Guidelines for Drinking-WaterQuality, Vol. 1: Recommendations. Geneva (WHO).
Wrabel J. 1999. Ermittlung der Grundwasserneubildung im semi-ariden Bereich Namibias mittels der Chlorid-Bilanz-Methode.Hydrogeologie und Umwelt, 16. Würzburg.
115

oN emanemehcS taL gnoL ygoloeGnoitcudorP
mT( 3 )a/htpeD
)m(ytilauQ
ssalc1 senleovsaA 00044,91- 00011,02 irahalaK 81 541 A2 siA-iA 00009,72- 00005,71 )reviRhsiF(muivullA 85 51 B-A3 siunimA 00046,32- 00073,91 )ooraK(elahs,enotsdnaS 68 681 B4 aradnA 00279,71- 00662,12 )dnas,eterclac(irahalaK 01 55 D5 bahcinA 00059,02- 00048,41 )reviRbagU(muivullA 52 51-01 B6 reknA 00077,91- 00055,41 )xelpmoCbauH(etinarg,etiztrauQ 13 66-75 C7 sonarA 00741,42- 00811,91 )ooraK(enotsdnaS 003 783-402 A8 ielvsmairA 00021,82- 00048,91 )puorGamaN(stnemides-ateM 04 021-001 C-B9 baorA 00008,62- 00036,91 )puorGamaN(enotsdnaS 06 421-77 A01 suA 00066,62- 00472,61 )dnalauqamaN(ssieng-etinarG 42 241-24 C-A11 inagaB 00901,81- 00056,12 irahalaK 1 411 D-C21 sakuAgreB 00305,91- 00632,81 )aramaD,puorGivatO(etimoloD 007 89-29 B31 gisgreB 00012,02- 00060,41 tlasaB 2 21 B-A41 abesreB 00099,52- 00067,71 )puorGamaN(enotsdnaS 04 24-43 A51 neinahteB 00005,62- 00031,71 )puorGamaN(enotsemil,elahS 021 57 D-B61 gawdnarB 00086,91- 00089,71 )aramaD,puorGivatO(etimoloD 0 06-51 B71 ajniuB 00068,71- 00063,91 irahalaK 6 97-75 A81 sopetiuB 00082,22- 00099,91 )aramaD(etiztrauQsimusT 9 06-04 B91 olakuB 00027,71- 00035,42 irahalaK 07 45-04 B02 enamihcnihC 00589,71- 00421,42 irahalaK 03 05 C-B12 neojliVnaaD 00045,22- 00059,61 )aramaD,samohK(tsihcsaciM 06 521-67 B22 sibadroD 00059,22- 00066,71 )ecneuqeShtoboheR(etiztrauQ 02 67-24 B-A32 3tsoPorikupE 00085,12- 00054,91 )aramaD(tsihcs,etiztrauq,elbraM 06 081-05 D-B42 01tsoPorikupE 00025,12- 00074,91 )aramaD(tsihcs,etiztrauq,elbraM 02 281-621 B-A52 reyeMtsnrE 00073,22- 00004,91 )aramaD(etiztrauq&irahalaK 81 06-55 A62 eewrE 00096,91- 00003,41 )xelpmoCbauH(etinarg,etiztrauQ 03 56-85 C-B72 nietnofsnarF 00012,02- 00050,51 )aramaD(enotsemil,enotsdnas,etimolod,elahS 041 151-16 B82 sibaG 00001,82- 00016,81 ssiengdnalauqamaN 91 68-65 D-C92 sahcaniaG 00067,52- 00017,71 )puorGamaN(enotsdnaS 3 93-23 A03 noebiG 00047,42- 00098,71 )ooraK,akywD(enotsdnaS 043 34-03 A13 bebaboG 00065,32- 00040,51 )reviRbesiuK(muivullA 2 04-03 D-B23 ENsibaboG 00042,22- 00011,91 ecneuqeSaramaD 08
bossoNkcalB 00023,22- 00029,81 ecneuqeSaramaD 0 03latnenurG 00273,22- 00493,81 ecneuqeSaramaD 011 801-06 A
noitatShtuoS 00015,22- 00089,81 ecneuqeSaramaD 03 67-27 A)sibaboG>(ielvtiW 00014,22- 00074,81 ecneuqeSaramaD 61 56 A
33 znelboG 00990,02- 00541,81 irahalaK 008 054-001 B-A43 sahcoG 00057,42- 00047,81 )ooraK(elahs&enotsdnaS 07 532-031 A53 uanürG 00027,72- 00083,81 )xelpmoCdnalauqamaN(etinarG 01 061-85 D-B63 ilalaH
ilalaHnielK 00050,91- 00094,61 )irahalaK(eterclaC 01 07-02 CmokretsoneR 00890,91- 00025,61 )aramaD(etimoloD 08 78-76 B
73 yaBseitneH 00090,22- 00092,41 )atleDururamO(muivullA 53 53-23 A83 dlefhcoH 00094,12- 00058,71 ecneuqeSaramaD 01 66-64 A93 egnehaK 00086,71- 00076,81 irahalaK 62 04-83 A04 dlefklaK 00098,02- 00091,61 )aramaD(etinarg,stnemides-ateM 05 381-91 B-A14 dnarklaK 00052,42- 00062,71 )ooraK(tlasaB 001 77-56 B24 bajnamaK
tropriA&nwoT 00026,91- 00048,41 )xelpmoCbauH(.desatem,sevisurtnI 43 001-06 D-BdnarklaK 00046,91- 00089,41 )yraitreT(eterclacm01derevocbauH 92 021-001 B
34 grubsaraK 00000,82- 00086,81 )ooraK(etirelod,elahS 003 87-72 B44 bibiraK
nnurbshcibläH 00069,12- 00009,51 )aramaD(elbraM 031 021-08 C-BanoBsepS 00087,12- 00049,51 )aramaD(elahs,enotsemil,)nahK(muivullA 0 67-13
54 dnaltsraK )aramaD,puorGivatO(etimoloD 01 B64 anogneyaK 00098,71- 00088,91 irahalaK 041 06-05 A74 saxirohK 00083,02- 00069,41 )aramaD(etimolod,eterclaC 6.1-007 051-13 B84 seoK 00039,52- 00021,91 )ooraK,puorGaccE(enotsdnaS 07 07-34 B94 bahcioK 00002,62- 00078,51 )yraitreT(yalc,levarg,dnaS 0.1-006 701-95 A05 sisoK 00017,62- 00023,71 ).rGamaN(enotsemil,elahs,enotsdnaS 54 07-06 B-A15 sseirK 00000,52- 00061,81 )ooraK(enotsdnaS 01 09-08 A25 besiuK 00091,32- 00066,41 )reviRbesiuK(muivullA 005.5 05-51 B-A
poroDknabiooRknabtrawS
Annex 1: Groundwater supply schemes operated by NamWater and municipalities116

oN emanemehcS taL gnoL ygoloeGnoitcudorP
mT( 3 )a/htpeD
)m(ytilauQ
ssalc35 sawkawK 00012,32- 00009,61 )ecneuqeShtoboheR(tsihcs,etiztrauQ ofnioN 401-97 B-A45 ellivdranoeL 00305,32- 00097,81 )ooraK(elahs,enotsdnaS 06 082-881 B-A55 ehöhatlaM 00018,42- 00099,61 )puorGamaN(etiztrauQ 002 64-13 C65 niuDittegnaM 00025,91- 00037,91 irahalaK 04 791-081 A75 moobaleoraM 00052,91- 00008,81 irahalaK 4 741 B85 ataK'M 00005,91- 00036,91 irahalaK 9 071 A95 ielvugnupM 00076,71- 00032,81 irahalaK 02 09-68 D06 inipuM 00068,71- 00036,91 irahalaK 5 75-05 C16 inotumaN 00008,81- 00040,71 irahalaK 051 34-93 B26 sieNieN 00074,12- 00040,51 )reviRururamO(muivullA 033 82-21 C-A36 uruknerukN 00036,71- 00026,81 irahalaK 02 06-0446 anagnayN 00020,81- 00086,02 irahalaK 0856 setimaO 00089,22- 00070,71 )aramaD(elbraM 052 051-001 ofnioN66 ojeukuakO 00081,91- 00029,51 )eterclac(irahalaK 052 08-01 B76 ehabmokO 00053,12- 00004,51 )reviRururamO(muivullA 083 62-52 A86 utajdnokO 00089,02- 00032,81 irahalaKrednuaramaD 07 001-89 B96 okatamO 00044,91- 00022,91 irahalaK 02 481-161 B07 maDokatamO 00041,12- 00071,71 )ooraK(elahs,enotsdnaS 4 09-55 D-B17 akibmO 00033,91- 00049,51 )aramaD,ivatO(enotsemil,etimoloD 21 031-02 B27 ledmO 00090,22- 00092,41 )atleDururamO(muivullA 005.5 001-05 B37 agemO 00098,71- 00051,22 irahalaK 511 09-07 B47 abmerakednO 00084,22- 00024,71 )aramaD(tsihcssamohK 4 521-69 B57 apabmorednO 00051,32- 00065,91 )ooraK(elahs,enotsdnaS 4 69-39 A67 owupO 00060,81- 00058,31
dleifllewES 00051,81- 00059,31 aramaD,puorGivatO 52 021-09 BdleifllewWN 00040,81- 00028,31 eterclac/)akywD(ooraK 087 011-65 D-C
77 olevihsO 00026,81- 00071,71 )elahs,dnas(irahalaK 003 47-86 B87 erisO 00080,12- 00073,71 )ooraK(mFednognimO 55 77-75 B-A97 ivatO 00046,91- 00053,71 )aramaD,ivatO(etimolod,enotsemiL 005 16-06 B-A08 ewgnibmijtO 00253,22- 00631,61 )reviRpokawS(muivullA 082 21 C-A18 enenijtO 00041,12- 00097,81 irahalaKrednuaramaD 051 521-36 C-A28 ognorawijtO 00064,02- 00046,61 )aramaD(elbraM 008.1 581-66 B
ouutijtO 00844,91- 00012,81 )eisamrofsakuAgreB(etimiloD 009 001-58 A38 udnasavojtO 00052,91- 00015,41 )sudnebaohK(avaldesohpromateM 01 16 C-B48 ototivO 00019,12- 00001,71 ecneuqeSaramaD 04 83-23 B58 saalpsisselP 00017,12- 00040,91 etinarggrebsmaG,irahalaK 01 28-65 A68 nietnofteiR 00409,12- 00819,02 )aramaD(mFsastmaK 041 901-84 C78 kehgadiooR 00052,91- 00072,91 irahalaK 01 08188 kehudnuR 00787,81- 00249,81 irahalaK 03 05298 arapuR 00048,71- 00080,91 irahalaK 01 28-77 A09 uibmaS 00019,71- 00030,02 irahalaK 03 07-06 A19 pilhcS 00340,42- 00131,71 )amaN(elahs,etimolod,enotsemiL 032 401-34 B29 sieeS 00054,22- 00026,71 )reviRsieeS(muivullA 03 51-21 ofnioN39 nietnofseS 00021,91- 00016,31 )aramaD(etillyhp,etimoloD 02 15-63 B-A49 eppokztipS 00058,12- 00002,51 )aramaD(tsihcs,etinarG 31 29-06 D-C59 teirpmatS 00243,42- 00904,81 )ooraK(elahs,enotsdnaS 06 101-48 A69 yaBecarreT 00981,02- 00102,31 )reviRbainU(muivullA 71 02-01 D-A79 orodnoT 00077,71- 00097,81 irahalaK 07 86-56 A89 sesT
emehcsdlO 00098,52- 00011,81 )puorGamaN,akywD(elahS 03 901-74 C-AseloherobweN 00029,52- 00049,71 )puorGamaN,akywD(elahS 0 001-75 C-B
99 sibastnisT 00087,81- 00069,71 irahalaK 03 39-13 B001 ewkmusT 00095,91- 00005,02 irahalaK 55 53-02 C-A101 sissubuT 00845,12- 00264,51 )aramaD(etiztrauq,tsihcS 02 011-31 C-B201 sokasU 00299,12- 00106,51 582 001-51 B-A
reviRnahK )reviRnahK(muivullAreviRbaorA elbramitaugnO&eterclaC
301 dabmraW 00144,82- 00247,81 xelpmocssieng-etinargdnalauqamaN 52 011-701 D-C401 ielvtiW 00014,22- 00005,81 )aramaD(enotsemil,etiztrauQ 041 83-13 D-B
semehcslapicinuM501 keohdniW 00095,22- 00080,71 setiztrauqsauA 000.2 503-77 A601 ururamO 00014,12- 00059,51 )reviRururamO(muivullA 000.1 61-21 A701 bemusT 00052,91- 00017,71 etimoloD 000.2 002-031 A801 ojtuO 00011,02- 00061,61 etimoloD 008 001-09 A901 nietnoftoorG 00065,91- 00011,81 etimoloD 000.2 07-05 A
117

118
edutitaL edutignoL onWWhtpeD
]m[
retaWlevel
]lgbm[
dleiYm[ 3 ]h/
retaWytilauq
kcortsohrefiuqA
31005.71- 75253.42 31173 94 6 22 C irahalaK
09505.71- 08497.21 26933 93 8 4 A etiztrauQ
11165.71- 79353.61 07073 952 02 81 C )refiuqApeeDyreV(irahalaK
56906.71- 06149.21 18663 47 - 0 - ssienG
21646.71- 22961.42 22663 07 41 91 C irahalaK
26186.71- 20564.42 11173 93 4 22 C irahalaK
32096.71- 31124.32 97463 86 42 91 A irahalaK
01407.71- 00657.21 36933 95 71 1 A ssienG
01707.71- 25030.42 15463 96 32 11 B irahalaK
01087.71- 04448.61 76863 002 55 31 A irahalaK
32228.71- 27293.32 20563 16 13 9 A irahalaK
70758.71- 20317.32 34563 37 61 01 B irahalaK
08688.71- 02659.51 4219 866 - 01 - ooraK,irahalaK
53788.71- 24591.42 57563 72 9 - B irahalaK
30398.71- 29382.81 26993 101 - 1 - irahalaK
05059.71- 28774.32 92563 67 92 - B irahalaK
03179.71- 01658.31 96933 07 61 3 B elahS
00379.71- 07820.41 46933 17 04 - A etimoloD
00689.71- 04818.31 85933 401 - 0 - elahS
00699.71- 00956.31 95933 801 32 3 A elahS
09160.81- 06667.21 27933 301 - 0 - elahs,etiztrauQ
26580.81- 02673.32 04563 95 7 - B irahalaK
89302.81- 89784.91 46993 27 - 22 - irahalaK
22942.81- 78630.12 16993 18 - 31 - irahalaK
56562.81- 52529.91 66993 07 - 31 - irahalaK
01743.81- 01665.61 1918 101 51 01 D irahalaK
01253.81- 07598.31 66933 07 83 7 A etimoloD
76963.81- 70801.91 56993 021 - 4 - irahalaK
09234.81- 05939.31 76933 001 26 1 A enotstliS
38025.81- 05277.61 1372 442 naisetrA 001 D )refiuqAnaisetrAolevihsO(irahalaK
76685.81- 33852.41 08663 121 3 4 A enotsdnas,enotsdum,eterclaC
03977.81- 01549.21 57933 51 7 62 - ssienG
06479.81- 55551.41 98453 65 13 7 A yalc,eterclaC
06479.81- 55551.41 09453 451 23 51 A elahs,yalc,eterclaC
63599.81- 64106.71 08993 893 11 2 B )ecneuqesooraK(enotsdum,elahS
34699.81- 06404.61 1859 23 naisetrA 8 D )puorgbuSbemusT(etimoloD
24910.91- 75174.41 72853 101 31 051 B )puorgbuSbanebA(etimoloD
78480.91- 50940.41 19453 381 65 11 A elahs,yalc,eterclaC
27901.91- 55212.51 92273 36 11 - B )refiuqAirahalaKdenifnocnUfoenotsemiL(irahalaK
98312.91- 16850.61 7163 64 51 - C )refiuqAirahalaKdenifnocnUfoenotsemiL(irahalaK
54203.91- 06470.81 00004 004 66 52 B )puorgbusbanebA(enotsemil,etimoloD
14833.91- 17281.71 48993 533 21 21 B )puorgnedluM(elahs,etiztrauQ
31783.91- 57475.41 08173 36 23 - B noitamroFsudnebaohK
04714.91- 69816.71 19993 041 35 1 B )noitamrofbisoN(etiztrauQ
34814.91- 45388.71 27993 58 73 2 B )xelpmoctnemesabnietnoftoorG(ssienG
74125.91- 70463.41 5424 94 73 3 D ssienG
79099.91- 08537.91 76993 711 - 32 - irahalaK
06920.02- 07491.81 14773 264 33 33 B irahalaK
46231.02- 45341.02 31993 522 831 0 - irahalaK
39251.02- 00797.02 90993 102 7 1 B etimoloD
00951.02- 09298.61 34603 87 5 441 A elbraM
22361.02- 43758.41 7467 13 5 8 C ssienG
Annex 2: Selected representative boreholes

119
edutitaL edutignoL onWWhtpeD
]m[
retaWlevel
]lgbm[
dleiYm[ 3 ]h/
retaWytilauq
kcortsohrefiuqA
64812.02- 73570.41 02002 85 6 2 B tlasaB
04052.02- 01167.61 49492 201 63 63 A elbraM
86643.02- 86164.41 83993 43 32 - D ssienG
46963.02- 89511.51 51803 59 11 0 C tsihcS
58164.02- 25987.02 21993 751 021 5 B etimolod,eterclaC
04335.02- 78963.71 01993 171 - 0 - tsihcs,enotsdum,enostlis,yalC
04145.02- 42994.41 3936 33 22 5 D etinarG
50676.02- 34918.02 70993 561 441 1 - irahalaK
43478.02- 79631.91 97993 102 - 0 - elbram,enotsdnaS
16349.02- 33834.71 48643 021 57 2 A enotsdnaS
71997.12- 27478.81 60253 201 1 001 A )nordaksE(etiztrauq,irahalaK
02028.12- 04165.51 95122 72 7 8 A tsihcs,etinargfokcordebhtiwreviRnahKfomuivullA
32038.12- 47874.02 60993 102 - 0 A etiztrauQ
01419.12- 02064.41 49122 001 82 07 A atleDururamOfomuivullA
08480.22- 01898.91 50993 771 - 0 A irahalaK
33341.22- 55570.91 42253 021 32 43 A etiztrauq,irahalaK
85351.22- 05111.71 80993 99 6 1 C tsihcS
83191.22- 60340.91 92253 201 42 28 A etiztrauq,irahalaK
87782.22- 87722.91 30253 801 62 86 A etiztrauQ
60863.22- 22250.91 51253 201 22 93 A etiztrauQ
51452.32- 86689.81 93893 652 85 8 - )rebmembouA(enotsdnaS
07043.32- 08477.41 64102 33 01 47 A reviRbesiuKfomuivullA
94004.32- 75526.91 64893 402 95 02 C )rebmembouA(enotsdnaS
89004.32- 98426.91 54893 35 54 0 - )tlasabdnarklaK(tlasaB
50104.32- 12626.91 74893 653 01 21 - )rebmembossoN(enotsdnaS
74746.32- 37883.81 04893 131 71 3 A )rebmembouA(enotsdnaS
80846.32- 17883.81 14893 902 7 3 - )rebmembossoN(enotsdnaS
87788.32- 33830.81 27543 93 31 43 A tlasaB
22729.32- 76640.81 43543 45 3 6 A tlasaB
71969.32- 44930.81 96543 44 6 8 A tlasaB
49100.42- 00512.81 75893 141 2 54 A )rebmembouA(enotsdnaS
29540.42- 04397.81 24893 201 91 2 - )noitamrofdnomteiR(eterclaC
29740.42- 21397.81 34893 352 61 02 A )rebmembouA(enotsdnaS
85840.42- 41697.81 44893 904 naisetrA 0 A )rebmembossoN(enotsdnaS
24823.42- 49793.81 84893 781 naisetrA 1 - )rebmembossoN(enotsdnaS
36997.42- 75433.91 15893 583 naisetrA - - )rebmembossoN(enotsdnaS
90008.42- 38433.91 94893 961 201 3 - irahalaK
95008.42- 02533.91 05893 372 401 4 B )rebmembouA(enotsdnaS
65000.52- 76658.71 94733 05 2 01 D elahssuoecanobraC
05290.52- 98805.71 06243 09 54 6 A enotsdnaS
03591.52- 00053.71 16733 451 031 1 B enotsdnaS
71192.52- 05614.81 35893 052 22 0 - )rebmembossoN(enotsdnaS
36192.52- 87614.81 25893 55 01 7 - irahalaK
04943.52- 07986.71 48733 68 21 4 A enotsdnaS
47154.52- 37334.91 55893 052 271 - D )rebmembouA(enotsdnaS
82064.52- 44424.91 45893 921 06 0 C irahalaK
84164.52- 42334.91 65893 643 02 - D )rebmembossoN(enotsdnaS
00084.52- 27984.71 29643 05 61 - A enotsdnaS
22715.52- 65535.71 59643 39 73 1 B enotsdnaS
71437.52- 11693.71 93733 052 291 1 B enotsdnaS
98812.62- 05218.81 28643 44 9 9 A enotsdnaS
02433.62- 07644.71 24733 052 902 1 B enotsdnaS

120
emaNemehcS edutitaL edutignoLaH/.snoC
m( 3 )a/9991
mM( 3 )a/nisaB sporcniaM
groblaA 51.91- 58.71 00051 0540.0 ialevuC selbategeV
banebA 92.91- 90.81 0009 0081.0 ialevuC eziaM
elponairdA 23.42- 93.91 00051 0090.0 bossoN
sagnih'A 93.52- 36.81 00081 0000.0 bouA
sia-iA 01.32- 86.81 00051 0030.0 bossoN
smaerA 68.32- 50.91 80971 7350.0 bossoN enrecuL
baodawA 00.42- 59.81 00051 0540.0 bossoN
tsrohnedaB 63.32- 07.81 00051 0060.0 bossoN
sakuAgreB 15.91- 62.81 00051 0021.0 okatamO selbategeV
yafanreB 16.42- 55.81 00002 0002.0 bouA surtic,selbategeV
yawekalB 46.22- 76.41 00002 0020.0 pokawS
saalpmooB 65.42- 35.81 00051 0051.0 bouA enrecul,eziaM
artapoelC 90.42- 70.91 68041 3650.0 bossoN enrecuL
nwaD 05.91- 01.81 00051 0510.0 okatamO selbategeV
neniuDeD 95.42- 54.81 00051 0570.0 bouA
regaJeD 12.32- 47.81 00051 0540.0 bossoN
etkalVeiD 74.91- 98.41 00001 0030.0 bauH selbategeV
nibboD 92.42- 05.81 83172 8245.0 bouA snolem,selbategeV
grebsrennoD 91.32- 56.81 92652 9670.0 bossoN enrecuL
sispoimirD 90.22- 60.91 00001 0040.0 bossoN selbategeV
orehaE 54.12- 59.71 00001 0001.0 okatamO selbategeV
gardneE 72.12- 28.71 00001 0090.0 okatamO selbategev,eziaM
nigebsreE 41.02- 25.41 00021 0063.0 bauH setaD
nigebtsreE 63.42- 85.81 99202 9060.0 bouA sraepylkcirp,selbategeV
puriE 22.42- 14.81 06222 6331.0 bouA enrecul,surtiC
roislecxE 10.91- 49.71 00001 0070.0 ialevuC eziam,selbategeV
truocirF 55.42- 66.81 85841 2792.0 bouA separgelbat,enrecuL
ehurshcirdeirF 61.91- 18.71 3067 1822.0 ialevuC eziaM
sibaG 82.82- 75.81 00081 0810.0 egnarO selbategev,reddoF
bestaniaG 92.02- 32.51 00051 0570.0 bauH surtiC
kcebnelaG 61.42- 31.81 00081 0000.0 bouA
notlaG 23.32- 86.81 00051 0540.0 bossoN
suoknieG 04.32- 17.81 00051 0540.0 bossoN
aigroeG 92.32- 66.81 00042 0420.0 bossoN enrecuL
evalG 81.42- 56.81 09282 4424.0 bouA separgelbaT
b/82onsetnokinaoG 76.22- 48.41 0489 2940.0 pokawS reddof,enrecul,setaD
95onsoOsetnokinaoG 76.22- 28.41 0008 0420.0 pokawS reddof,sugarapsa,sraepylkcirp,enrecul,setaD
sabaNssorG 05.42- 55.81 13592 2771.0 bouA snolem,selbategeV
)mraFgninneH(saniuG 52.91- 93.71 00051 0054.0 ialevuC nottoc,taehw,eziaM
)mraFsumsarE(ielvsaniuG 42.91- 32.71 00051 0030.0 ialevuC selbategeV
bahcnuG 51.42- 65.81 00231 2970.0 bouA
drooNhcietseebetraH 83.12- 68.71 00001 0510.0 okatamO selbategeV
diuShcietseebetraH 34.12- 78.71 00021 0060.0 okatamO sevilO
pooltseebetraH 63.42- 57.81 7757 9730.0 bouA
grebledieH 90.91- 57.71 45701 3161.0 ialevuC
tsOsibeiH 90.91- 18.71 00051 0090.0 ialevuC surtic,selbategeV
siegsogaoH 97.32- 59.81 00051 0540.0 bossoN enrecuL
tuohnegooH 73.42- 63.81 00042 0690.0 bouA separgelbat,enrecuL
fohnettuH 84.91- 91.71 3708 6282.0 ialevuC eziaM
fohrekmI 32.12- 47.71 00001 0001.0 okatamO nottoC
moobleemaK 52.42- 37.81 80121 6270.0 bouA eziaM
troopleemaK 92.32- 97.81 00051 0540.0 bossoN
slefnekriBnielK 46.22- 57.41 00081 0000.0 pokawS
ettuHnielK 95.42- 96.81 00081 0810.0 bouA seotatoptees,stao,enrecuL
tseWsabaNnielK 55.42- 94.81 00081 0882.0 bouA eziam,enrecuL
tabmoK 67.91- 86.71 00051 0005.1 bagU taehw,eziaM
sisoK 10.52- 43.71 00081 3600.0 hsiF selbategev,reddoF
birawoK 62.91- 57.31 8774 0680.0 binaoH surtic,occabat,eziam,taehW
llatsirK 54.12- 10.61 00002 0001.0 ururamO sugarapsa,drayeniV
thcawrevgnaL 20.52- 25.81 00051 0540.0 bouA
nietnofdiL 70.42- 52.81 00081 0000.0 bouA
nevahsgiwduL 51.91- 87.71 00002 0004.2 ialevuC surtic,selbategev,eziaM
dnaltiaM 13.12- 57.71 00001 0050.0 okatamO selbategeV
)ewkmusT(enuDittegnaM 05.81- 66.71 00001 0050.0 ialevuC selbategeV
Annex 3: Irrigation schemes using groundwater
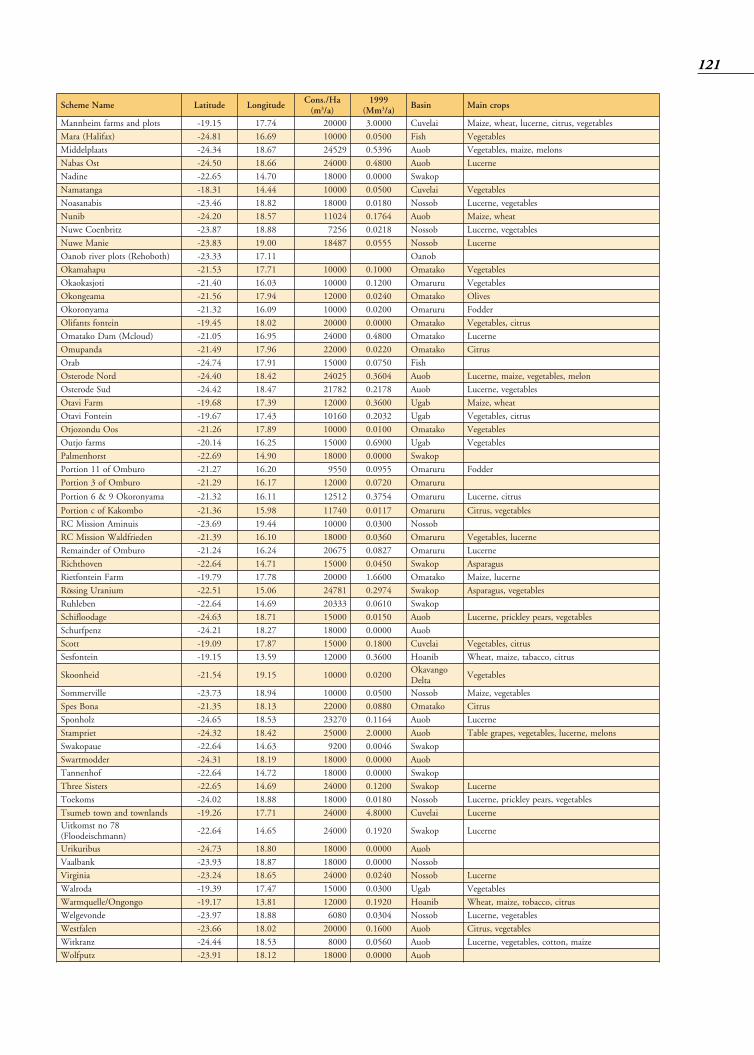
121
emaNemehcS edutitaL edutignoLaH/.snoC
m( 3 )a/9991
mM( 3 )a/nisaB sporcniaM
stolpdnasmrafmiehnnaM 51.91- 47.71 00002 0000.3 ialevuC selbategev,surtic,enrecul,taehw,eziaM
)xafilaH(araM 18.42- 96.61 00001 0050.0 hsiF selbategeV
staalpleddiM 43.42- 76.81 92542 6935.0 bouA snolem,eziam,selbategeV
tsOsabaN 05.42- 66.81 00042 0084.0 bouA enrecuL
enidaN 56.22- 07.41 00081 0000.0 pokawS
agnatamaN 13.81- 44.41 00001 0050.0 ialevuC selbategeV
sibanasaoN 64.32- 28.81 00081 0810.0 bossoN selbategev,enrecuL
binuN 02.42- 75.81 42011 4671.0 bouA taehw,eziaM
ztirbneoCewuN 78.32- 88.81 6527 8120.0 bossoN selbategev,enrecuL
einaMewuN 38.32- 00.91 78481 5550.0 bossoN enrecuL
)htoboheR(stolprevirbonaO 33.32- 11.71 bonaO
upahamakO 35.12- 17.71 00001 0001.0 okatamO selbategeV
itojsakoakO 04.12- 30.61 00001 0021.0 ururamO selbategeV
amaegnokO 65.12- 49.71 00021 0420.0 okatamO sevilO
amaynorokO 23.12- 90.61 00001 0020.0 ururamO reddoF
nietnofstnafilO 54.91- 20.81 00002 0000.0 okatamO surtic,selbategeV
)duolcM(maDokatamO 50.12- 59.61 00042 0084.0 okatamO enrecuL
adnapumO 94.12- 69.71 00022 0220.0 okatamO surtiC
barO 47.42- 19.71 00051 0570.0 hsiF
droNedoretsO 04.42- 24.81 52042 4063.0 bouA nolem,selbategev,eziam,enrecuL
duSedoretsO 24.42- 74.81 28712 8712.0 bouA selbategev,enrecuL
mraFivatO 86.91- 93.71 00021 0063.0 bagU taehw,eziaM
nietnoFivatO 76.91- 34.71 06101 2302.0 bagU surtic,selbategeV
soOudnozojtO 62.12- 98.71 00001 0010.0 okatamO selbategeV
smrafojtuO 41.02- 52.61 00051 0096.0 bagU selbategeV
tsrohnemlaP 96.22- 09.41 00081 0000.0 pokawS
orubmOfo11noitroP 72.12- 02.61 0559 5590.0 ururamO reddoF
orubmOfo3noitroP 92.12- 71.61 00021 0270.0 ururamO
amaynorokO9&6noitroP 23.12- 11.61 21521 4573.0 ururamO surtic,enrecuL
obmokaKfocnoitroP 63.12- 89.51 04711 7110.0 ururamO selbategev,surtiC
siunimAnoissiMCR 96.32- 44.91 00001 0030.0 bossoN
nedeirfdlaWnoissiMCR 93.12- 01.61 00081 0630.0 ururamO enrecul,selbategeV
orubmOforedniameR 42.12- 42.61 57602 7280.0 ururamO enrecuL
nevohthciR 46.22- 17.41 00051 0540.0 pokawS sugarapsA
mraFnietnofteiR 97.91- 87.71 00002 0066.1 okatamO enrecul,eziaM
muinarUgnissöR 15.22- 60.51 18742 4792.0 pokawS selbategev,sugarapsA
nebelhuR 46.22- 96.41 33302 0160.0 pokawS
egadoolfihcS 36.42- 17.81 00051 0510.0 bouA selbategev,sraepyelkcirp,enrecuL
znepfruhcS 12.42- 72.81 00081 0000.0 bouA
ttocS 90.91- 78.71 00051 0081.0 ialevuC surtic,selbategeV
nietnofseS 51.91- 95.31 00021 0063.0 binaoH surtic,occabat,eziam,taehW
diehnookS 45.12- 51.91 00001 0020.0ognavakO
atleDselbategeV
ellivremmoS 37.32- 49.81 00001 0050.0 bossoN selbategev,eziaM
anoBsepS 53.12- 31.81 00022 0880.0 okatamO surtiC
zlohnopS 56.42- 35.81 07232 4611.0 bouA enrecuL
teirpmatS 23.42- 24.81 00052 0000.2 bouA snolem,enrecul,selbategev,separgelbaT
euapokawS 46.22- 36.41 0029 6400.0 pokawS
reddomtrawS 13.42- 91.81 00081 0000.0 bouA
fohnennaT 46.22- 27.41 00081 0000.0 pokawS
sretsiSeerhT 56.22- 96.41 00042 0021.0 pokawS enrecuL
smokeoT 20.42- 88.81 00081 0810.0 bossoN selbategev,sraepyelkcirp,enrecuL
sdnalnwotdnanwotbemusT 62.91- 17.71 00042 0008.4 ialevuC enrecuL87ontsmoktiU
)nnamhcsiedoolF(46.22- 56.41 00042 0291.0 pokawS enrecuL
subirukirU 37.42- 08.81 00081 0000.0 bouA
knablaaV 39.32- 78.81 00081 0000.0 bossoN
ainigriV 42.32- 56.81 00042 0420.0 bossoN enrecuL
adorlaW 93.91- 74.71 00051 0030.0 bagU selbategeV
ognognO/elleuqmraW 71.91- 18.31 00021 0291.0 binaoH surtic,occabot,eziam,taehW
ednovegleW 79.32- 88.81 0806 4030.0 bossoN selbategev,enrecuL
nelaftseW 66.32- 20.81 00002 0061.0 bouA selbategev,surtiC
znarktiW 44.42- 35.81 0008 0650.0 bouA eziam,nottoc,selbategev,enrecuL
ztupfloW 19.32- 21.81 00081 0000.0 bouA

122
retemaraPdna
stluserehtfonoisserpxE
OHWsenilediuG
rof-gniknirD
retaWytilauQ
noitidedn23991
desoporPlicnuoCevitceriD
82folirpA5991
-31/C/59()30/1
CEE
evitceriDlicnuoC0891yluJ51fo
ytilauqehtotgnitalernamuhrofdednetni
noitpmusnocCEE/877/08
APE.S.UretaWgniknirD
dnasdradnatShtlaeH
seirosivdAelbaT
rebmeceD5991
sriaffAretaWfotnemtrapeD,aibimaNfonoitaulaveehtrofsenilediuG
noitpmusnocnamuhrofretaw-gniknirdlacisyhp,lacimehcotecnereferhtiw
ytilauqlacigoloiretcabdna1991yluJ
enilediuGeulaV)VG(
desoporPretemaraP
eulaV
ediuGleveL)LG(
mumixaMelbissimdA
noitartnecnoC)CAM(
mumixaMtnanimatnoC
leveL)LCM(
ApuorGtnellecxE
ytilauQ
BpuorGdooGytilauQ
CpuorGwoL
htlaeHksiR
DpuorGelbatiusnU
erutarepmeT t C° - - 21 52 - - - - -
noinegordyHnoitartnecnoc
C°52,Hp - R 0.8<ot5.6³
5.9²ot5.6³
5.8²01 - 0.9ot0.6 5.9ot5.5 0.11ot0.4
ot0.4<0.11>
ytivitcudnoccinortcelE C°52,CE m/Sm - 082 54 - - 051 003 004 004>
sdilosdevlossidlatoT SDT l/gm R 0001 - - 0051 - - - - -
ssendraHlatoT OCaC3
l/gm - - - - - 003 056 0031 0031>
muinimulA lA l/gµ R 002 002 05 002 S 002-05 051 005 0001 0001>
ainommA HN4
+ l/gm R 5.1 5.0 50.0 5.0 - 5.1 5.2 0.5 0.5>
N l/gm 0,1 40.0 4.0 - 0.1 0.2 0.4 0.4>
ynomitnA bS l/gµ P 5 3 - 01 C 6 05 001 002 002>
cinesrA sA l/gµ P 01 01 - 05 C 05 001 003 006 006>
muiraB aB l/gµ 007 - 001 - C 0002 005 0001 0002 0002>
muillyreB eB l/gµ - - - - C 4 2 5 01 01>
htumsiB iB l/gµ - - - - - 052 005 0001 0001>
noroB B l/gµ 003 003 0001 - - 005 0002 0004 0004>
etamorB OrB3
- l/gµ - 01 - - P 01 - - - -
enimorB rB l/gµ - - - - - 0001 0003 0006 0006>
muimdaC dC l/gµ 3 5 - 5 C 5 01 02 04 04>
muiclaCaC
OCaC3
l/gm - - 001 - - 051 002 004 004>
l/gm - - 052 - - 573 005 0001 0001>
muireC eC l/gµ - - - - - 0001 0002 0004 0004>
edirolhC lC - l/gm R 052 - 52 - S 052 052 006 0021 0021>
muimorhC rC l/gµ P 05 05 - 05 C 001 001 002 004 004>
tlaboC oC l/gµ - - - - - 052 005 0001 0001>
reppoC
epipnisruoh21retfa 1uC
l/gµ P 0002 2 001 - C ##TT 005 0001 0002 0002>
l/gµ - - 0003 1 - S 0001 - - - -
edinayC NC - l/gµ 07 05 - 05 C 002 002 003 006 006>
ediroulF F-l/gm 5.1 5.1 - 5.1:C°21ot8ta C 4 5.1 0.2 0.3 0.3>
l/gm - - - 7.0:C°03ot52ta S,P 2 - - - -
dloG uA l/gµ - - - - - 2 5 01 01>
edihplusnegordyH H2S l/gµ R 05 - -
elbatcetednuyllacitpelonagro
- 001 003 006 006>
enidoI I l/gµ - - - - - 005 0001 0002 0002>
lanoisivorP:PsremusnocmorfstnialpmocotnosaerevigyaM:R
;yradnoceS:S;desoporP:P;tnerruC:C;LCMciremunfoueilnieuqinhcettnemtaerT:#T
levelnoitcatadereggirteuqinhcettnemtaerT:##TTl/gµ0031fo
Annex 4: Comparison of selected guideline values for drinking water quality
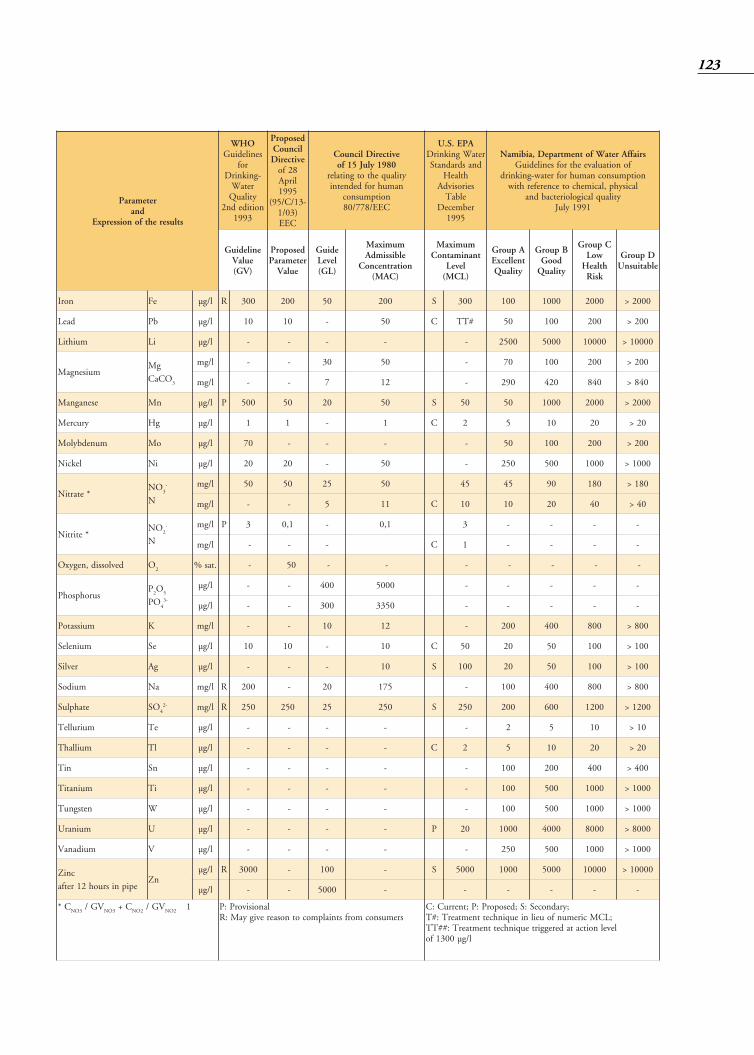
123
retemaraPdna
stluserehtfonoisserpxE
OHWsenilediuG
rof-gniknirD
retaWytilauQ
noitidedn23991
desoporPlicnuoCevitceriD
82folirpA5991
-31/C/59()30/1
CEE
evitceriDlicnuoC0891yluJ51fo
ytilauqehtotgnitalernamuhrofdednetni
noitpmusnocCEE/877/08
APE.S.UretaWgniknirD
dnasdradnatShtlaeH
seirosivdAelbaT
rebmeceD5991
sriaffAretaWfotnemtrapeD,aibimaNfonoitaulaveehtrofsenilediuG
noitpmusnocnamuhrofretaw-gniknirdlacisyhp,lacimehcotecnereferhtiw
ytilauqlacigoloiretcabdna1991yluJ
enilediuGeulaV)VG(
desoporPretemaraP
eulaV
ediuGleveL)LG(
mumixaMelbissimdA
noitartnecnoC)CAM(
mumixaMtnanimatnoC
leveL)LCM(
ApuorGtnellecxE
ytilauQ
BpuorGdooGytilauQ
CpuorGwoL
htlaeHksiR
DpuorGelbatiusnU
norI eF l/gµ R 003 002 05 002 S 003 001 0001 0002 0002>
daeL bP l/gµ 01 01 - 05 C #TT 05 001 002 002>
muihtiL iL l/gµ - - - - - 0052 0005 00001 00001>
muisengaMgM
OCaC3
l/gm - - 03 05 - 07 001 002 002>
l/gm - - 7 21 - 092 024 048 048>
esenagnaM nM l/gµ P 005 05 02 05 S 05 05 0001 0002 0002>
yrucreM gH l/gµ 1 1 - 1 C 2 5 01 02 02>
munedbyloM oM l/gµ 07 - - - - 05 001 002 002>
lekciN iN l/gµ 02 02 - 05 - 052 005 0001 0001>
*etartiNON
3-
N
l/gm 05 05 52 05 54 54 09 081 081>
l/gm - - 5 11 C 01 01 02 04 04>
*etirtiNON
2-
N
l/gm P 3 1,0 - 1,0 3 - - - -
l/gm - - - C 1 - - - -
devlossid,negyxO O2
.tas% - 05³ - - - - - - -
surohpsohPP
2O
5
OP4
-3
l/gµ - - 004 0005 - - - - -
l/gµ - - 003 0533 - - - - -
muissatoP K l/gm - - 01 21 - 002 004 008 008>
muineleS eS l/gµ 01 01 - 01 C 05 02 05 001 001>
revliS gA l/gµ - - - 01 S 001 02 05 001 001>
muidoS aN l/gm R 002 - 02 571 - 001 004 008 008>
etahpluS OS4
-2 l/gm R 052 052 52 052 S 052 002 006 0021 0021>
muirulleT eT l/gµ - - - - - 2 5 01 01>
muillahT lT l/gµ - - - - C 2 5 01 02 02>
niT nS l/gµ - - - - - 001 002 004 004>
muinatiT iT l/gµ - - - - - 001 005 0001 0001>
netsgnuT W l/gµ - - - - - 001 005 0001 0001>
muinarU U l/gµ - - - - P 02 0001 0004 0008 0008>
muidanaV V l/gµ - - - - - 052 005 0001 0001>
cniZ
epipnisruoh21retfanZ
l/gµ R 0003 - 001 - S 0005 0001 0005 00001 00001>
l/gµ - - 0005 - - - - - -
C*3ON
VG/3ON
C+2ON
VG/2ON
1² lanoisivorP:PsremusnocmorfstnialpmocotnosaerevigyaM:R
;yradnoceS:S;desoporP:P;tnerruC:C;LCMciremunfoueilnieuqinhcettnemtaerT:#T
levelnoitcatadereggirteuqinhcettnemtaerT:##TTl/gµ0031fo

a – Annum (lat.), year.
a BP – Years before present (= 1950).
Acrisol – Soil having a B horizon with illuvial accumulationof clay and low base saturation.
aeolian – Pertinent to the action of wind.
Ag – Silver.
Al – Aluminium.
Alluvium – Sediments deposited by flowing rivers. Dependingon the location in the floodplain in the river, different sizedsediments are deposited.
Amphibolite – High grade metamorphic rock.
AN – Andoni Formation.
Anion exchange – Ion exchange process in which anions insolution are exchanged for other anions from an ion exchanger.
Aquiclude – A geologic formation, group of formations, or partof a formation through which virtually no water moves.
Aquifer – Rock or sediment in a formation, group of formations,or part of a formation that is saturated and sufficiently permeable to transmit economic quantities of water to bore-holes or springs.
Aquifer, confined – An aquifer that is overlain by a confiningbed. The confining bed has a significantly lower hydraulicconductivity than the aquifer.
Aquifer, perched – Aquifer containing isolated bodies of ground-water suspended above water table.
Aquifer, semi-confined – An aquifer confined by a low permeability layer that permits water to flow slowly throughit. During pumping of the aquifer, recharge to the aquifercan occur across the confining layer. Also known as a leakyartesian or leaky confined aquifer.
Aquifer, unconfined – Aquifer where the water table is exposedto the atmosphere through openings in the overlying materials.
Aquifer test – A test involving the withdrawal of measured quantities of water from or the addition to, a well and themeasurement of the resulting changes in head in the aquiferboth during and after the period of discharge or addition.
Aquitard – A saturated, but poorly permeable bed, forma-tion, of group of formations that does not yield water freelyto a well or spring. However, an aquitard may transmit appre -ciable water to and from adjacent aquifers.
Arenosol – Weakly developed, deep sandy soil.
Argillite, argilliceous – Clayey sediment, compacted.
Arkose – A sandstone containing 25 % or more of feldspars.Usually derived from disintegrated acid igneous rock of granitoid texture.
Artesian well – A well deriving its water from an confinedaquifer in which the water level stands above the ground sur-face; synonymous with flowing artesian well.
Artificial recharge – The process by which water can be injectedor added to an aquifer. Dug basins, drilled wells, or simply
124
Glossary
the spread of water across the surface are all means of artificialrecharge.
As – Arsenic.
asl – Above sea level.
Atm – Atmosphere(s).
Basalt –A general term for dark-coloured iron- and magnesiumrich igneous rocks, commonly extrusive, but locally intru-sive. It is the principle rock making up the ocean floor.
Bedrock – A general term for the rock, usually solid, that under-lies soil or other unconsolidated material.
Bentonite – A colloidal clay, largely made up of the mineralsodium montmorillonite, a hydrated aluminium silicate.
bgl – Below ground level.
BGR – Bundesanstalt für Geowissenschaften und Rohstoffe/Federal Institute for Geosciences and Natural Resources,Hannover, Germany.
BMZ – Bundesministerium für wirtschaftliche Zusammen arbeitund Entwicklung / Federal Ministry for Economic Coop-eration and Development, Bonn/Berlin, Germany.
Borehole development – The process by which a borehole ispumped or surged to remove any fine material that maybe blocking the well screen or the aquifer outside the wellscreen.
Brackish – 1000 to 10 000 mg/L TDS or 150 to 1500 mS/mEC, or Group B to C quality.
C – Capita.
°C – Grad Celsius, dimension of temperature.
Ca – Calcium.
Calcisol – Soil characterised by calcium carbonate (CaCO3).
Calcrete – Carbonates, precipitated from rain water or ground -water (see Box on page 20-21).
Cambisol – Soil in an early stage of development.
Carbonate rocks – A rock consisting of chiefly of carbonate minerals, such as limestone and dolomite.
Casing – A solid piece of pipe, typically steel or PVC plastic,used to keep a well open in either unconsolidated materialsor un stable rock.
Cementing – The operation by which grout is placed between casing and the sides of the well bore to a predetermined heightabove the bottom of the well. This secures the casing in placeand excludes water and other fluids from the well bore.
Cone of depression – A depression in the groundwater tableor the potensiometric surface that has the shape of an invertedcone and develops around a well from which water is with-drawn. It defines the area of influence of a well.
Conglomerate – A sedimentary rock containing rounded water-worn fragments of rock or pebbles, cemented together byanother mineral substance.
Cl – Chloride.

Contaminant – Any solute or cause of change in physical prop-erties that renders water unfit for a given use.
CO2 – Carbon dioxide.
CSIR – The Council for Scientific and Industrial Research,Republic of South Africa.
Cu – Copper.
d – Day.
D – Water saturated thickness in metre.
Darcy’s Law – A derived equation for the flow of fluids onthe assumption that flow is laminar and that inertia can beneglected.
Desalination –To remove salt and other chemicals form sea orsaline water.
Discharge area –An area in which there are upward com ponentsof hydraulic head in the aquifer - Groundwater is flowingtoward the surface in a discharge area and may escape as aspring, seep, or baseflow or by evaporation and transpiration.
Drainage basin – The land area form which surface runoffdrains into a river system.
Dolerite – A coarser grained rock of basaltic composition intruding as dykes or sills within the earth’s crust.
Dolocrete – Gravel, sand or desert debris cemented by porouscalcium magnesium carbonate.
Drawdown – The lowering of the water table of unconfinedaquifer or the potensiometric surface of a confined aquifercaused by pumping of groundwater from boreholes.
Dunite – A nonfeldspathic plutonic rock consisting almostentirely of olivine and containing accessory pyroxene andchromite.
Durisol – Hard crust soil.
DWA – Department of Water Affairs, Windhoek, Namibia.
DPA – Discontinuous Perched Aquifer.
E – East.
EEC – European Economic Commission, Brussels, Belgium.
EC – Electrical conductivity of water in µS/cm or mS/cm at25 º C.
Effluent – A waste liquid discharge from a manufacturing ortreatment process, in its natural state or partially or com-pletely treated, that discharges into the environment.
e.g. – For example.
Electrical conductance – A measure of the ease with which aconducting current can be caused to flow through a materialunder the influence of an applied electric field. It is reciprocalof resistively and is measured in mhos metre.
Electrical resistively –The property of a material which resiststhe flow of an electric current measured per unit lengththrough a unit cross sectional area.
ENWC – Eastern National Water Carrier (see Box on page 70-71).
Equipotential line – A contour line on the water table or thepotensiometric surface, a line along which the pressure headof groundwater in an aquifer is the same. Fluid flow is normalto these lines in the direction of decreasing fluid potential.
Evaporation –The process by which water passes from liquidto vapour state.
Evapotranspiration – Loss of water from a land area throughtranspiration of plants and evaporation form the soil.
Facies – A stratigraphic body as distinguished from other bodiesof different appearance and composition.
Fault – A fracture or a zone of fractures along which there hasbeen displacement of the sides relative to one another par-allel to the fracture.
Fe – Iron.
Ferralsol – Soil with a high content of iron oxides.
Filterpack – Sand or gravel that is smooth, uniform, clean, well-rounded and siliceous. It is placed in the annulus of thewell between the borehole wall and the well screen to pre-vent formation material from entering the screen.
Floodplain – The surface or strip of a relative smooth land adjacent to a river channel, constructed by the present riverand covered with water when the river overflows its banks.It is build of alluvium carried by the river during floodsand deposited in the sluggish water beyond the influenceof the swiftest current.
fluvial, fluviatile – Pertinent to the action of river water.
Fm – Formation.
Fossil water – Interstitial water that was buried the same timeas the sediment.
Foyaite – Syenitic rocks containing almost equal proportionso feldspathoids and potash feldspars.
fresh – <1000 mg/L TDS or <150 mS/m EC or Group A quality.
Gabbro – Dark-coloured, basic intrusive rock.
GKA – Grootfontein Karst Aquifer comprising synclines 1 to 3.
Gleysol – Excessively wet soil with a gley horizon.
GOC – Grootfontein-Omatako Canal.
Granite – Quartz-bearing, plutonic rock.
Groundwater – The water contained in interconnected poreslocated below the water table in an unconfined aquifer orlocated in a confined aquifer.
Groundwater basin – A rather vague designation pertainingto a groundwater reservoir that is more or less separated fromneighbouring groundwater reservoirs. A ground water basincould be separated from adjacent basins by geolo gical bound-aries or by hydrological boundaries.
Groundwater flow –The movement of water through openingsin sediment and rock; occurs in the zone of saturation.
Groundwater table –The surface between the zone of saturationand the zone of aeration; the surface of an unconfined aquifer.
125
126
Group A – No risk, excellent water quality.
Group B – Insignificant risk, good quality water.
Group C – Low risk.
Group D – High risk or water unsuitable for human con-sumption.
GSN – Geological Survey of Namibia, Windhoek.
ha – Hectare, (1 ha= 10000 m2).
Hardness – A property of the water causing formation of aninsoluble residue when water is used with soap. Sum of theions which can precipitate as “hard particles” from water. Sumof Ca2+ and Mg2+, and sometimes Fe2+. Ex pressed in mg/LCaCO3 or in hardness degrees. Temporary hardness is the partof Ca2+ and Mg2+ concentrations, which are balanced by HCO3
-
and can thus precipitate as carbonate. Permanent hardnessis the part of Ca2+ and Mg2+ being in excess HCO3
-.Total hard-ness is the sum of temporary and permanent hardness.
Hardness ranges – [mg/L CaCO3] (0 -75 = soft; 75 -150 = moderately hard; 150-300=hard; >300= very hard).
HCO3 – Bicarbonate.
Head – Energy contained in a water mass, produced by elevation,pressure, or velocity.
heterogeneous – Pertaining to a substance having different characteristics in different locations. A synonym for non-uniform.
homogeneous – Pertaining to a substance having identical characteristics everywhere. A synonym is uniform.
Hydraulic conductivity – A coefficient of proportionality describing the rate at which water can move through a permeable medium. The density and kinematic viscosity ofthe water must be considered in determining the hydraulicconductivity.
Hydraulic gradient – The change in the total head with thechange in distance in a given direction. The direction isthat which yields a maximum rate of decrease in head.
Hydraulic parameter – Values (K, T, s) that are determinedquantitatively to characterise the aquifer, and are used formodelling.
Hydrogeology – The study of interrelationships of geologic materials and processes with water, especially groundwater.
Hydrologic cycle –The circulation of water from oceans throughthe atmosphere to the land and ultimately back to the ocean.
Hydrology –The study of the occurrence, distribution and chem-istry of all waters of the earth.
IAEA – International Atomic Energy Agency.
i.e. – That is.
Igneous rocks –Rocks that solidified from molten material, thatis, a magma.
Inselberg – Erosion rest of previously wider extended rock cover.
Intrusive rocks –Those igneous rocks that formed from magmainjected beneath the earth’s surface. Generally these rocks
have large crystals by slow cooling.
Ion exchange – A process by which an ion in a mineral latticeis replaced by another ion that was present in aqueous solution.
isostatic – Subject to equal pressure from every side; being inhydrostatic equilibrium.
Isopach – Contour lines indicating areas of equal depth.
K – Hydraulic conductivity in m/d or m/s, K=T/D.
Karst – The type of geologic terrain underlain by carbonaterocks where significant solution of the rock has occurred dueto the flowing of groundwater.
km – Kilometre.
L – Litre.
Landfill – A general term indicating a disposal site of refuse,dirt from excavations, and junk.
lacustrine – In a lake environment.
Leachate – A liquid that has percolated through solid waste anddissolved soluble components.
Leptosol – Shallow, stony soil overlying rock.
Limestone – A sedimentary rock consisting chiefly of calciumcarbonate, primarily in the from of the mineral calcite.
Lithology, lithologic – Rock composition, rock type.
Luvisol – Soil with prominent illuvial accumulation of clay inthe subsoil.
m –Metre.
m2 – Square metre.
Ma –Million years.
MAC –Maximum Admissible Concentration.
Mantle – Layer of the earth between crust and core.
MDA –Main Deep Aquifer.
Mm3 –Million cubic metre.
Mm3/a –Million cubic metre per annum.
meteoric – Pertaining to recent atmospheric water.
Metamorphic rocks – Any rock derived from pre-existing rocksby mineralogical, chemical, and/or structural changes, essentiallyin a solid state, in response to marked changes in temperature,pressure, shearing stress, and chemical environment, generallyat depth in the Earth’s crust.
Mg –Magnesium.
Mg/L –Milligrams per litre of sample.
Min –Minute.
mm –Millimetre, e.g. 10mm rainfall equals 10 L/m2.
mS/m –MilliSiemens/metre, dimension of EC, =10 µS/cm.
N – North.
Na – Sodium.
n/a – Not applicable, not available.
NamWater – Namibia Water Corporation (Ltd.), Windhoek.
NO3 – Nitrate.
OAA – Oshivelo Artesian Aquifer.
Observation well – A well drilled at a selected location forthe purpose of observing parameters such as water levels andpressure changes.
ODA – Otavi Dolomite Aquifer.
Ol – Olukondo formation.
OMAP – Omaruru River alluvial plain.
OMDEL – Omaruru River Delta (see Box on page 83).
OMPL – Ongopolo.
Orogeny – The process of forming mountains, particularly byfolding and thrusting.
Pb – Lead.
pedogenic – Related to soils or soil water.
Pelite – Fine grained, clayey sediment.
Permeability – The property or capacity of a porous rock,sediment, or soil transmitting a fluid; it is a measure of therelative ease of fluid flow under unequal pressure.
petrographic – Concerning the mineralogical composition ofrocks.
pH –A measure of the acidity and alkalinity of a solution, numer-ically equal to 7 for neutral solutions, increasing with increas-ing alkalinity and decreasing with increasing acidity. Origi-nally stood for the words potential of hydrogen. It is calculatedas -log [H+], the log of H+ activity.
Phyllite – A metamorphosed clay-bearing rock intermediate ingrade between slate and schist.
piezometric head –Pressure head of groundwater in a well orborehole.
plutonic rock – An igneous rock formed when magma coolsand crystallises within the earth.
Pollutant – Any solute or cause of change in physical proper-ties that renders water unfit for a given use.
Pore space – The volume between mineral grains of a porousmedium.
Porosity – The ration of volume of void spaces in a rock or sediment to the total volume of the rock or sediment.
potentiometric surface –A surface that represents the level o whichwater will rise in tightly cased boreholes. If the head varies sig-nificantly with the depth in the aquifer, then there are may bemore than one potentiometric surface. The water table is a par-ticular potentiometric surface for an unconfined aquifer.
Primary porosity – The porosity that represents the originalpore openings when a rock or sediment is formed.
Pumping test – A test made by pumping a borehole for a periodof time and observing the change in the hydraulic head ofthe aquifer. A pumping test may be used to determine thecapacity of the borehole and the hydraulic characteristics
of the aquifer. Also called an aquifer test.
Pyroclastics – A rock consisting of unreworked solid materialof whatever size explosively or aerially ejected from a volcanicvent.
Pyroxenite –A medium or coarse-grained rock consisting essen-tially of pyroxene.
Q – Pump discharge in m3/h.
Quartzite – A granulose metamorphic rock consisting essen-tially of quartz granules.
Recharge –The addition of water to a zone of saturation; also,the amount of water added.
Recharge area – An area where there are downward componentsof hydraulic head in the aquifer. Infiltration moves down-ward into the deeper parts of an aquifer in the recharge area.
Recharge basin – A basin or pit excavated to provide meansof allowing water to soak into the ground at rates exceed-ing those that would occur naturally.
Recharge well – A borehole specifically designed so that watercan be pumped into an aquifer in order to recharge theground water reservoir.
Recovery – The rate at which the water level in a well risesafter the pump has been shut off. It is the inverse of drawdown.
Regosol – Soil with weak or no development.
Rhyolite – An extrusive equivalent of a granite.
River, ephemeral – A river that is mostly dry and only sub-ject to water flow for short periods after heavier rainfall events.
River, perennial – A river that is subject to flow throughout theyear.
Runoff – The total amount of water flowing in a stream. Itincludes overland flow, return flow, interflow and baseflow.
s – Second.
s – Storage coefficient.
S – South.
Safe yield – The amount of naturally occurring groundwaterthat can be economically and legally withdrawn from anaquifer on a sustained basis without impairing the nativegroundwater quality or creating an undesirable effect such asenvironment damage. It cannot exceed the increase or leak-age from adjacent strata plus the reduction in discharge, inwhich due to the decline in head caused by pumping.
Saline – >10 000 mg/L TDS or >1500 mS/m EC or GroupD quality.
Salinity ranges – Classification: TDS [mg/L] / EC [mS/m](fresh = < 1000 / <150; brackish = 1000 to 10 000 /150 to 1500; saline =>10 000 / >1500).
Sandstone –A sedimentary rock composed of abundant roundedor angular fragments of sand set in a fine grained matrix (siltor clay) and more or less firmly united by cementing material.
Sapropelite – A fluid organic slime originating in swamps as
127

a product of putrefaction. Often contains hydrocarbons. Sub-stance becomes tough when dry.
saturated zone –The zone in which the voids in the rock or soilare filled with water at a pressure greater than atmospheric.The water table is the top of the saturated zone in an uncon-fined aquifer.
Schist – A medium or coarse-grained metamorphic rock withsub-parallel orientation of the micaceous minerals whichdominate its composition.
secondary porosity – The porosity that has been caused by fractures or weathering in a rock or sediment after it has beenformed.
sedimentary rock – A rock formed from sediments through aprocess known as diagenesis or formed by the chemical precipitation of water.
Shale – A fine-grained sedimentary rock, formed by the consolidation of clay, silt and mud. It is characterised by finelylaminated structure and it is sufficiently indurated so thatit will not fall apart on wetting.
Siltstone –A very fine-grained consolidated clastic rock composedpredominantly of particles of silt grade.
SO4 – Sulphate.
Solonetz – Soil with B horizon rich in sodium and/or magnesium.
Solonchak – Soil having a high salinity and no well- developedsubsurface horizons.
static water level –The level of water is a well that is not beingaffected by withdrawal of water.
Storativity, storage coefficient –The volume of water an aquiferreleases from or takes into storage per unit surface area ofan aquifer per unit change in hydraulic head. It is equal tothe product of specific storage and the aquifer thickness. Inan unconfined aquifer the storativity is equivalent to the spe-cific yield. Also called storage coefficient.
Stratigraphy – A study of rock strata, especially in their distribution, deposition and age.
Surface water –Water found in ponds, lakes, inland seas, streamsand rivers.
Syenite –A plutonic igneous rock consisting principally of alkalicfeldspar usually with one or more mafic minerals such ashornblende or biotite.
T –Temperature in °C.
T –Transmissivity.
TCL – Tsumeb Corporation Ltd. (Member of Gold FieldsNamibia Ltd.).
TDS – Total dissolved solids in mg/L; (sum of cations andanions); (in DWA analytical reports TDS is calculated: TDS= 6.6 x EC).
TKA –Tsumeb Karst Aquifer comprising the Abenab-TsumebSynklinorium.
TH – Total hardness, refer to “Hardness”.
Transmissivity –The rate at which water of a prevailing densityand viscosity is transmitted through a unit width of an aquiferor confining bed under a unit hydraulic gradient. It is a func-tion of the properties of the liquid, the porous media and thethickness of the porous media.
Transpiration –The process by which water absorbed by plants,usually through the roots, is evaporated into the atmosphereform the plant surface.
Travertine – Calcium carbonate, of light colour and usuallyconcretionary and compact, deposited from solution in groundand surface waters.
Tufa – A chemical sedimentary rock composed of calcium carbonate or of silica, deposited from solution in the waterof a spring or lake or from percolating ground water.
UKA – Unconfined Kalahari Aquifer.
US-EPA – United States Environmental Protection Agency, Washington, D.C.
V – Vanadium.
VDA – Very Deep Aquifer.
Vertisol – Soil topped with clay which crack when dry.
Vlei – A small swamp, usually open and containing a pond.
Volcanic rock – An igneous rock formed when molten rockcalled lava cools on the earth’s surface.
W – West.
Water budget – An evaluation of all the sources of supply andthe corresponding discharges with respect to an aquifer ordrainage basin.
Water table –The surface in an unconfined aquifer or confiningbed at which the pore water pressure is atmospheric. It canbe measured by installing shallow wells extending a few metresinto the zone of saturation and then measuring the water levelin those wells.
Water type – Ions with a relative concentration (fraction) >_ 20 meq % are name-giving, e.g. Ca-Mg-HCO3.
Well screen – Filtering device used to keep sediment from enteringwell.
Well yield –The volume of water discharged from a well in cubicmetres per hour or cubic metres per day.
Weir – A device placed across a stream and used to measurethe discharge by having water flow over a specifically designedspillway.
WHO –World Health Organisation, Geneva, Switzerland.
WL –Water level in metres below ground level (bgl).
Zn – Zinc.
128

Gro
undw
ater
in
Nam
ibia
· a
n ex
plan
atio
n to
the
Hyd
roge
olog
ical
Map