groundwater development in the lower solo river...
TRANSCRIPT

Hydrogeology in the Service of Man, Mémoires of the 18th Congress of the International Association of Hydrogeologists, Cambridge, 1985.
GROUNDWATER DEVELOPMENT IN THE LOWER SOLO RIVER BASIN EAST JAVA, INDONESIA
W.H. STIEBEL1 and IR. SURADJI2
Supervising Hydrogeologist, Monenco, Lower Solo River Development Project, Solo, Indonesia Hydrogeologist, Proyek Bengawan Solo Hilir, Solo, Indonesia
ABSTRACT The Solo River is the longest river on the Island of Java. The
Lower Solo River Basin is an area of approximately 6,300 km2 located mainly in northeast Java in the Province of East Java. Approximately 4-10,000 ha of agricultural lands are cultivated within the basin. As part of a major study to improve management of the water and land resources of the basin, a hydrogeological investigation of the entire area is being undertaken by the Government of Indonesia. The objective of the hydrogeological studies is to evaluate the potential for further groundwater development for domestic and irrigation uses. Preliminary data indicate that net annual groundwater recharge in the basin is about 1.5 x 10 m3. Limestone formations and alluvial deposits have the highest potential for groundwater development. It is estimated that between 10,000 and 25,000 ha of agricultural lands could receive supplementary dry season irrigation through exploitation of the basin's groundwater resources.
INTRODUCTION The waters of the Solo River originate in the highlands of
Central Java and from there flow north and east to discharge in the Java Sea. The Solo River has many tributaries, the main ones are the Madiun River, which enters the Solo River from the east at Ngawi, and the Kening River, which flows from the northern hills and enters the Solo River at Bojonegoro. The area from the confluence of the Solo River and Madiun River at Ngawi downstream to the delta at the river mouth is referred to as the Lower Solo River Basin (Figure 1).
Physiography and Land Use The Lower Solo River Basin has an area of approximately 6,300 km2.
More than 80?o of the 3.3 million people living in the basin are engaged in agricultural activities. Villages comprise 15 to 20% of the area on the alluvial plains. The basin contains about 4-14,000 ha of agricultural land of which about 80% is located on the alluvial plains of the Solo River and the Kening River. Approximately 100,000 ha of cropland in the basin is irrigated as part of irrigation systems operated by the Central Java and East Java Irrigation Services. Most of the lower river basin is contained in East Java, except for the western portion (where the river flows northward from Ngawi to Cepu), which is situated partly in Central Java.
Three distinct physiographic regions controlled essentially by the structural geology comprise the Lower Solo River Basin: the
- 197 -

Fig. 1 Aquifers and Groundwater Exploration Test Well Sites in the Lower Solo River Basin.
Kendeng Ridge; the Randublatung Zone; and the Rembang Hills. The highlands of the Kendeng Ridge and the Rembang Hills, respectively, comprise the south and north drainage divides for the basin; each consists of a series of east/west trending hills of exposed and folded Miocene, Pliocene and Pleistocene sedimentary rocks. The Rembang Hills and Kendeng Hills are heavily forested with teak which covers about hZ% (2,650 km2) of the basin area. The Solo River traverses the Kendeng Ridge near Ngawi and flows north and eastward into the Randublatung Zone, a synclinal depression which forms the alluvial plain of the Solo River. The Randublatung Zone is 5 to 10 km wide in the west, but opens up to a broad alluvial and lowlands plain, 10 to 25 km wide east of Bojonegoro. Terrace deposits are common in the area west of Bojonegoro through Cepu.
Numerous small tributaries enter the Solo River as it flows across the alluvial plain. The basin is characterized by two climatic seasons: a dry season (June through November) and a wet season (December through May). During the dry season, most of the tributaries are dry and flow in the Solo River ranges between 5 and 25 m3/s at Bojonegoro (about the center of the study area). At this time of the year, inhabitants of the river basin periodically experience shortages of water for both domestic and irrigation uses. The wet season has an excess of rainfall, with the result that the Solo River and many of its tributaries regularly flood, displacing the basin's inhabitants to higher land and causing extensive damage to property and crops. Flow in the Solo River at Bojonegoro in February and March often exceeds 2,000 m3/s and extensive flooding occurs.
The Lower Solo River Development Project The Government of Indonesia is currently undertaking a complete
assessment of the water and land resources of the Lower Solo River Basin. The objectives are to alleviate flooding and water shortages through the development of a Master Plan to identify, integrate and manage the available resources with the intent of improving the
- 198 -

living conditions of the population and maximizing agricultural productivity. The work is being carried out by Proyek Bengawan Solo Hilir (PBS), Directorate of Rivers, in conjunction with the Directorate of Irrigation, both part of the Directorate General of Water Resources Development of the Ministry of Public Works. International assistance on the project is provided by the Canadian International Development Agency which has provided a grant to the Government of Indonesia for consultant services on the project. The Canadian consulting firm, Montreal Engineering Company, Limited, fielded a multidisciplinary team of engineers and'specialists who began work on the studies in July 1983. The studies are broadly based covering engineering, hydrology, hydrogeology, sedimentology, soils, agriculture, fisheries, sociology and economics.
As part of the water resources studies, a basin-wide hydrogeo-logical program is being conducted (1984/85) to assess current groundwater use, identify potential aquifers, and evaluate the development potential for additional groundwater utilization for irrigation and domestic purposes. An important aspect of the groundwater studies is technology transfer to Indonesian counterpart staff in conducting hydrogeological studies and data assessment.
HYDROGEOLOGICAL STUDIES A detailed assessment of the groundwater resources of the Lower
Solo River Basin had not been undertaken previously. Brief overviews of the potential of the groundwater resources, based on limited field data, were contained in the Survey and Study for the Development of the Solo River Basin (OCTA 197*0 and the Pre-feasi-bility Study of Water and Land Resources Development in the Lower Solo River Basin (McLaren 1978). Acting on recommendations contained in these reports, PBS established a system of 23 shallow (20 m) observation wells throughout the basin and conducted a limited dug well and spring inventory including groundwater sampling and analysis. In 1980, PBS, in cooperation with P2AT (Groundwater Development Branch of the Directorate of Irrigation), drilled six groundwater exploration wells to depths between 100 and 150 m in the basin. In addition, geophysical resistivity sounding surveys were conducted by P2AT in parts of the basin in 1980 and 1981. It was concluded from the work that the best potential for groundwater development occurred in limestone terrain situated to the north of the Solo River. Present investigations by P2AT are being concentrated in these areas (Figure l).
In order to improve and build upon the data base developed up to 198l, the Lower Solo River Development Project hydrogeological studies are providing a comprehensive assessment of the groundwater resources in the basin.
The current hydrogeological studies include an inventory of domestic wells, irrigation wells and springs across the basin; monitoring and sampling of selected wells and springs to examine groundwater level fluctuations and water quality; a groundwater use survey; geological mapping; geophysical surveys (at 426 resistivity sounding stations) over an area of about 1,300 km ; assessment of groundwater recharge; and a groundwater exploration program incorporating test drilling, and the development of test wells, observation wells and multiple piezometer installations to evaluate subsurface geology, identify aquifers and determine aquifer hydraulic characteristics.
- 199 -

Throughout the hydrogeological studies, all available hydro-geological information is being reviewed and liaison maintained with P2AT, as well as other government agencies and consultants examining groundwater resources in various portions of the basin, to avoid duplication of effort and insure incorporation of all new data in the assessment of the groundwater resource.
Basin Geology The Rembang Hills comprise an anticlinorium lying to the north of
the Solo River (Figure l). The limestone of the Tuban Formation and the Upper Kalibeng Formation outcrop through much of the Rembang Hills and form an excellent aquifer.
The Randublatung Zone forms the central part of the basin and consists mainly of the alluvial deposits of the Solo River. The current hydrogeological studies have identified alluvial terrace and channel deposits in the western part of the basin which may contain extensive sand and gravel aquifers. The alluvium has been proved to a depth of about 85 m near Bojonegoro. Test drilling and test pumping are being conducted to delineate alluvial aquifers. Drilling depths are less than 100 m.
The south drainage divide of the basin consists of the folded sediments of the Kendeng Ridge. Pleistocene sandstones, marls, volcanic sedimentary facies and limestones are exposed in the Kendeng Ridge. Sandstone and limestone formations dipping into the Solo River Basin have been delineated from the resistivity surveys. Test drilling is being conducted to evaluate the groundwater development potential of some of these zones; however, the geophysical data suggest that the marl or clay facies are the most extensive materials beneath the alluvial deposits south of the Solo River.
Two isolated anticlines consisting of folded limestones occur at the north margin of the Kendeng Ridge. The Ngimbang anticline occurs in the east part of the basin and comprises Pliocene limestones and marls of the Kalibeng Formation. The Dander anticline is a back reef structure located south of Bojonegoro and consists of Pleistocene reefy limestone and coarse sandy limestone (calcarenite). Both of these areas may have high groundwater potential and are being further evaluated.
Current Groundwater Use Dug Wells Most of the inhabitants of the basin obtain their domestic water from dug wells. The wells are dug to about 1 m below the water table occurring at the time of construction and are lined with concrete casing. The casing usually extends about 1 m above the ground surface and a concrete pad is grouted around the top of the well to prevent surface drainage from entering. In areas where sand deposits occur close to the ground surface, particularly along the terraces and alluvial plain, domestic wells are often augered or hand-driven using 5 cm galvanized steel pipe and hand-pumps are installed.
Approximately 1,200 domestic wells have been inventoried throughout the basin. At each well, information concerning the geology of the water-bearing zone, well depth, depth to the water table, groundwater electrical conductance, pH and temperature, well yield, water use and continuity of supply is obtained and recorded. A total of 1̂ 0 wells completed in different geologic materials have been sampled
- 200 -
for chemical analysis, and 35 wells selected for water level monitoring. All inventoried wells have been plotted on 1:50,000 scale topographic maps of the study area along with water quality, well depth and water table data, and the water table contoured.
The main problems with the dug wells are insufficient yield, going dry during the dry season, and particularly in the east part of the study area, poor chemical quality due to brackish or saline groundwater. In some areas, it appears that deepening of the dug well will successfully alleviate the dry season/yield problem; however, in many areas where extensive clay formations and/or poor quality groundwater occur, alternative sources of domestic water will have to be provided.
It is estimated that the current annual domestic use of groundwater in the basin is about 1.0 x 10⁸ m3/yr.
Springs Approximately 170 springs have been inventoried in the study area, and data on water use, spring flow, water quality and source aquifer recorded. The spring data have been plotted on 1:50,000 scale topographic maps along with the dug well inventory data.
Nearly all of the springs discharge from limestone aquifers either as contact springs or from groundwater flow along bedding planes, fractures or fault zones. Several large springs (more than 500 1/s) discharge from karstic limestone terrain in the Kalibeng limestones north of the Solo River, and from the Dander Anticline (Figure 1). These large springs generally show consistent discharge with an average dry season flow of between 65 and 85% of the wet season flow (Table l). However, most of the springs in the basin are small with average flows of from less than 1 l/s to about 10 1/s and these springs are not regularly monitored. Dry season flow from these springs is often less than 50% of wet season flow, and many of the smaller springs go completely dry.
Spring discharge is the major source of baseflow to the tributary rivers of the Solo River during the dry season since the water table is usually below the river bed. The spring discharge is utilized for domestic, irrigation, and livestock watering purposes. Seven large springs - Semen, Ngerong, Beron, Krawak, Ngunut, Sumberarum and Kunchi - account for about 85% of the groundwater discharged annually at springs in the basin. It is estimated that the maximum wet season flow from springs is about 6,000 l/s and that the minimum dry season flow is about 3,500 l/s. Approximately ^,000 ha of padi rice are irrigated by spring flow within established irrigation areas during the dry season. Discharge from smaller springs irrigates about another 500 ha of padi and palawija outside of existing irrigation schemes.
Irrigation Wells Installed in Alluvium About 1,000 small diameter (5 to 10 cm) privately owned tube wells have been installed in the alluvial deposits of the Solo River. The wells are installed using hand augering and wash down techniques by local drilling crews to depths of as much as 60 m; however, completed well depths generally range from 10 to *t0 m. These wells are constructed using galvanized steel pipe penetrating to the top of the aquifer, which is usually sand and gravel. The wells are completed as open bottom casing; slotted casing is seldom used and manufactured screens are never used. The wells are pumped with surface mounted centrifugal pumps driven by
- 201 -

TABLE 1
Average Monthly Spring Discharge
Spring Name Years Average Monthly Discharge (1/s) and No. of J F M A M J J A S 0 N D
Records
Pirang (S-56/S-156) Semen (S-1V7) Ngerong (S-7) Ngunut (S-89) Beron (S-153) Krawak
Dander (S-155) Mayang (S-21/S-26) Segagak (S-8/S-20) Gunung Anyar (S-135) Trembul (S-165) Gomang (S-164) Baung (S-I6I)
3
2
if
3
if
3
3
if
if
2
if
3
it
780
725
830
900 867 867 789 784 697 635 602 573 632 632
800 835 862 835 784 696 636 644 631 658 721
770 78O 696 633 618 591 607 560 590 598 609
585 637 641 625 621 531 519 526 524 557 589 615
554 520 509 569 575 595 575 552 459 48l 429 512
321
102
77
48
29
31
5
10
304
98
95
54
69
37
12
17
310
105
104
54
103
31
10
10
ND
97
101
52
63
30
10
11
310
85
90
50
25
32
7
8
248 240 236
81
87
49
24
29
5
8
79
84
48
24
27
4
7
72
76
48
14
26
5
5
223 203
67
72
44
13
23
4
4
69
71
41
13
22
4
4
208 210
10 75
10 73
42 42
18 19
24 32
8 8
5 6
* Data from EJIS records, monthly monitoring of selected springs
8 HP diesel engines. Well discharge varies from 3 to 12 l/s, with an average discharge of 7 l/s. Farmers report lower discharges in some areas during the dry season, which results partly from declining water levels in the aquifers and high head loss due to the well construction method. The average installation cost of these small wells, including purchase of a pump, is approximately $1,500^US.
In areas where the small irrigation wells are used, the farmers are able to grow three crops annually, either two padi and a tobacco or palawija crop, or three padi crops, two irrigated and one rainfed. To meet the water requirements of these crops, irrigation with groundwater is carried out for about 150 days annually. Daily pump operation is reported to vary between 8 and 20 hours, with an average of 15 hr/day. At an average discharge of 7 l/s per well, the annual current groundwater use for irrigation from alluvial aquifers is about 57 Mm3.
- 202 -

Exploitation of alluvial aquifers is not particularly efficient in maximizing command area but it is effective. Many wells have been observed irrigating 5 ha or less, whereas the well yield of 10 l/s is capable of irrigating more land. In total, it is estimated that only 2,000 ha of land are irrigated at present with groundwater pumped from alluvial aquifers.
Farmers who own their pumps and irrigate k ha or more of land have average annual operating costs of about $200 US/ha for the two irrigated padi crops. The annual operating costs increase to $400 US/ha for farmers irrigating less than 4 ha. Many farmers only have a well drilled, and then, must rent the pump and pay, in addition to operating costs, pump rental costs of about $550 US/ha annually to irrigate k or 5 ha. It is apparent that farmers who can afford their own pumps and irrigate *t or more ha tend to benefit the most from irrigation with the small diameter wells.
Most farmers in the basin own small plots of land, usually about 0.25 ha. The establishment of village water users' groups having cooperative ownership of a small irrigation well (10 to 25 l/s) may be a means of attaining economical operating and maintenance costs for groundwater irrigation to smaller land holdings.
Generally, the farmers do not carry out regular maintenance on the wells. A major problem is gradual sand heave into the well due to the open bottomed casing which either reduces well yield or completely stops well discharge. Some wells are abandoned due to the sand heaving problem. Pumping of sand also causes excessive wear to the pump impeller, and periodic replacement is required to maintain pumping efficiency. The pumps are maintained by the owner, and spare parts are available locally.
Local villagers also obtain water for domestic use when irrigation wells are located near the village.
The hydrogeological studies are examining methods to improve well construction techniques and increase yields while maintaining construction and operation and maintenance costs within a level that can be maintained by a group of farmers. More efficient means of utilizing the available water in conjunction with improved well yields and crop yields are being studied.
Irrigation Wells Installed in Limestone P2AT has established four trial irrigation schemes, each of 50 ha, using groundwater pumped from wells finished in the Kalibeng limestone north of the Solo River. Each well is drilled to a depth of about 100 m and equipped with a diesel driven vertical turbine pump capable of producing 50 to 60 l/s. At present these trial groundwater irrigation systems do not contribute to existing irrigation schemes, but provide water to new areas which previously experienced water shortages. The installation costs for a typical P2AT production well including 80 m well, pump, engine, pump house, access road and irrigation channels for a 50 ha command area is about $90,000 US. Annual well operating costs (based on 3,200 hrs/yr) are currently estimated at between $8,000 and $9,000 US including fuel, lubricants, spare parts, labour, pump operator and general civil works maintenance.
These production wells are owned and installed by the Government of Indonesia. Before well installation, a water users' group is formed composed of all farmers within the command area. The command area is divided into blocks with each block receiving water on a
- 203 -
specified day. The water users' group employs a pump operator who is responsible for water distribution, and is required to purchase fuel only when sufficient operating funds are collected by the water users' group. Initially, during a two year trial period, pump operation is subsidized by the government until farmers in the command area are convinced of the value of groundwater use for irrigation. The trial period for the four systems established in .the Lower Solo River Basin commenced during the 1984 dry season. Maintenance and repair of the wells and pumps will remain the responsibility of P2AT and the East Java Irrigation Service.
During the trial period, records of pumping times and quantities of water supplied will be obtained to evaluate the effectiveness and efficiency of the systems.
Aquifers in the Lower Solo River Basin Alluvial Deposits The alluvial deposits of the Solo River seem to represent a high to very high potential for major groundwater development for both domestic and irrigation purposes. The area in the west part of the basin, from Babat to Kedungtuban (Figure 1), appears to have the highest development potential.
Groundwater exploration work conducted during 1983 and 1984 has identified alluvial channel and terrace deposits which range in thickness from 10 to over ko m. Test drilling and aquifer testing are being conducted at ten sites to confirm the lateral extent and to determine the hydraulic characteristics of the alluvial materials. Preliminary results suggest that hydraulic conductivity of more than 10~2 cm/s will be common.
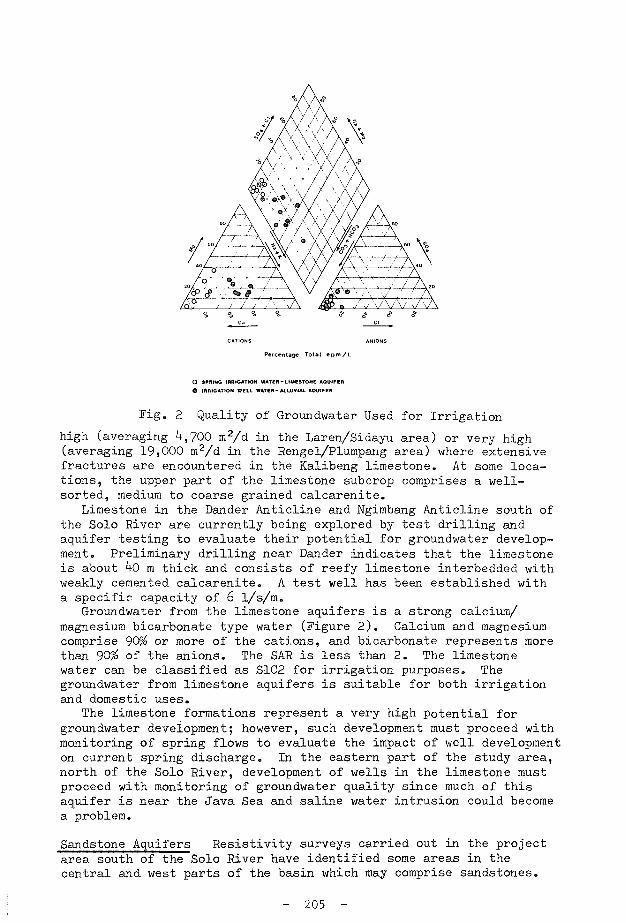
Chemical analyses conducted on groundwater samples from irrigation wells tapping the alluvial deposits indicate that the water is generally of acceptable quality for irrigation and domestic uses (Figure 2). The electrical conductivity of groundwater samples collected from irrigation wells is usually between 600 and 800 juS/cm. The groundwater appears to be a mixture of calcium and sodium bicarbonate type water, with calcium and sodium representing 70 to 80%> of the cations. Bicarbonate is the dominant anion. Chloride and sulphate concentrations are low, always less than 20%. The sodium adsorption ratio (SAR) is usually between 2 and 3. These waters may be classified as S1C2 and S1C3 according to the U.S. Department of Agriculture Sodium/Salinity Hazard designations (U.S. Department of Agriculture 1973)•
Groundwater from alluvial deposits in the eastern part of the study area is of poorer quality, and brackish or saline water occurs. Resistivity soundings conducted throughout the eastern part of the basin showed very low resistivity values over most of the area, generally less than 10 Qm where sand deposits have been identified. Nevertheless, test drilling is also being conducted in this area since brackish or saline groundwater could be of value in aquaculture, particularly shrimp culture.
Limestone Aquifers The Kalibeng limestone and Tuban limestone located north of the Solo River have been explored and hydraulically tested by over 35 exploration holes and test wells drilled by P2AT since 1980. These limestones are generally characterized by secondary hydraulic conductivity, with groundwater flow occurring mainly along fractures and solution channels. Transmissivities can range from very low where the limestone is massive and crystalline, to
- 204 -
CATIONS ANIONS
Pe rcen tage T o t a l « p i t i / L
O SPRING IRRIGATIOM WATER •-LIBE3TOHE AQUIFER
© IRRIGATION WELL WATER-ALLUVIAL AQUIFER
Fig. 2 Quality of Groundwater Used for Irrigation
high (averaging 4,700 m2/d in the Laren/Sidayu area) or very high (averaging 19,000 m2/d in the Rengel/Plumpang area) where extensive fractures are encountered in the Kalibeng limestone. At some locations, the upper part of the limestone subcrop comprises a well-sorted, medium to coarse grained calcarenite.
Limestone in the Dander Anticline and Ngimbang Anticline south of the Solo River are currently being explored by test drilling and aquifer testing to evaluate their potential for groundwater development. Preliminary drilling near Dander indicates that the limestone is about kO m thick and consists of reefy limestone interbedded with weakly cemented calcarenite. A test well has been established with a specific capacity of 6 l/s/m.
Groundwater from the limestone aquifers is a strong calcium/ magnesium bicarbonate type water (Figure 2). Calcium and magnesium comprise 90% or more of the cations, and bicarbonate represents more than 90% of the anions. The SAR is less than 2. The limestone water can be classified as S1C2 for irrigation purposes. The groundwater from limestone aquifers is suitable for both irrigation and domestic uses.
The limestone formations represent a very high potential for groundwater development; however, such development must proceed with monitoring of spring flows to evaluate the impact of well development on current spring discharge. In the eastern part of the study area, north of the Solo River, development of wells in the limestone must proceed with monitoring of groundwater quality since much of this aquifer is near the Java Sea and saline water intrusion could become a problem.
Sandstone Aquifers Resistivity surveys carried out in the project area south of the Solo River have identified some areas in the central and west parts of the basin which may comprise sandstones.
- 205 -

These areas have apparent resistivity values of more than 20 Qm, occur at depths estimated to vary from kO to over 100 m and are considered to be fine grained volcanic sandstones of the Pucangan Formation which outcrops in the Kendeng Ridge. Four groundwater exploration sites are proposed in these areas. It is expected that these formations may have a moderate potential for groundwater development, particularly for domestic use.
Groundwater Recharge An important aspect governing the exploitation of any ground
water resource is an understanding of recharge that infiltrates to the aquifers. Groundwater recharge in the Lower Solo River Basin has been estimated on the basis of indirect water balance calculations utilizing precipitation, actual évapotranspiration and surface runoff, and direct measurement of water level fluctuation in observation wells to produce hydrographs. Precipitation during the rainy season represents the only substantial source of recharge to most of the basin's aquifers. In the alluvial aquifers along the Solo River, groundwater recharge may also occur where hydraulic interconnection with saturated river deposits causes leakage induced by well extractions. At present, no data are available to quantify this component of recharge to the alluvium.
Hydrographs for observation wells installed in the alluvial deposits and water table contours indicate that the Solo River alluvium comprises the major groundwater discharge zone for the basin. Annual water level fluctuations in the alluvium observation wells are generally of the order of 2 m or less, and lag behind precipitation events. Observation wells characteristic of recharge zones show rapid water level response to precipitation and have an annual water level fluctuation which averages about 5-5 times that of discharge/ transition zones. It is considered that most natural recharge occurs to the alluvial deposits as a result of groundwater flow from the major recharge zones located to the south and north. Increased water levels observed in wells close to the Solo River during February and March 1984 also suggest some recharge occurs to the alluvium due to river water infiltration while the river is in flood. The upper boundary of the basin recharge area was delineated at the basin drainage divide, and the lower boundary (down-gradient) established from observation well hydrographs and spring discharge. The Lower Solo River Basin has a recharge area of about 4,^30 km2.
Groundwater recharge to the basin is summarized in Table 2. In order to evaluate recharge and simplify the analysis, geological formations in the basin were separated into three basic hydrogeo-logical units: Unit 1 - limestone; Unit 2 - clays/marls; and Unit 3 - sandy clays, sands and sandstone. The basin was divided into five recharge sectors. Recharge was calculated from water balance using areally weighted annual average precipitation, P; the surface runoff, SR, estimated according to the geological characteristics of each segment of the recharge area; and the actual évapotranspiration, ETA.* (see note following references)
Recharge rates obtained from hydrograph analysis gave average values of 5^6 mm/yr for Unit 1; 2^1 mm/yr for Unit 2; and k% mm/yr for Unit 3- These recharge rates were applied to various parts of the project area according to the geological characteristics of the terrain to obtain an estimate of gross annual groundwater recharge.
- 206 -

TABLE 2
Summary of Groundwater Recharge in the Lower Solo River Basin
Indirect Direct Average
Recharge Area km
k,k3k
P
mm
1922
ETA
mm
900
SR
mm
621
Recharg
MnT
325 320 323
e to 2 Mnr
"398 363 381
Hydrogeologic Unit 3 Total MnT MnT
1,055 1,065 1,060
1,778 1,7^8 1,763
Notes: P - areally weighted mean annual precipitation ETA - annual actual évapotranspiration, calculated from
ETA = Ep [l - 0.07 m(13.7 - n)] where Ep is potential évapotranspiration, m is percent of bare earth exposed each month, and n is average number of raindays per month
SR - average annual, areally weighted, surface runoff, calculated according to hydrogeologic unit as 0.2P for 1, O.'+P for 2, and 0.3P for 3.
Hydrogeologic Unit - 1: limestone 2: clay and marl, fractured 3: sandy clay, clayey sand, sand,
sandstone Direct Analysis - formation recharge determined from hydro-
graph analysis - Unit 1: 5^6 mm/yr; Unit 2: 2^1 mm/yr; Unit 3: ^56 mm/yr
Agreement between the indirect and direct methods of recharge estimate is good, varying by less than 3%'
The average annual groundwater recharge in the basin is estimated to be about 1.8 x 10⁹ m3, which is approximately 20% of the areally weighted mean annual rainfall in the basin. Recharge to the limestone (3.2 x 10⁸ m3) accounts for about 20$ of total groundwater recharge. Limestone, it should be noted, accounts for only 13% of the total recharge area. Annual spring flow accounts for the discharge of about 1.6 x 10⁸ m3 from limestone aquifers, which suggests as much as 1.6 x 10⁸ m3 (5,000 l/s) of groundwater recharge may be available to wells installed in the limestone. It is estimated that about 60% (1.1 x 10⁹ m3) of groundwater recharge occurs through sandy clay, sand and sandstone materials.
Groundwater flow from springs, and extractions from domestic wells and irrigation wells is estimated to be about 3.2 x 10 m3 annually. Therefore, annual net groundwater recharge to the Lower Solo River Basin is about 1.5 x 10⁹ m3 or ̂ 7,500 l/s.
CONCLUSION AND SUMMARY It would appear that substantial groundwater development may be
possible in the Lower Solo River Basin where aquifers of sufficient areal extent and suitable hydraulic characteristics are identified.
- 207 -

The current groundwater exploration program, comprising test drilling and aquifer testing at 19 locations in the basin, will assist in aquifer delineation, and identify areas of high potential for feasibility study and development of groundwater for irrigation and domestic uses. The exploration work is being directed towards alluvial deposits and deeper formations between the depths of 50 and 200 m.
The work carried out to date suggests that aquifers of suitable water quality and hydraulic characteristics occur in the western portion of the Solo River alluvium, and in areas of limestone terrain. It is estimated that between 10,000 and 25,000 ha of agricultural land, in addition to the approximately 6,000 ha already irrigated by groundwater, may receive supplementary dry season irrigation by exploitation of the basin's groundwater resources. Improved design of small capacity wells (15 to 25 1/s) and use of centrifugal pumps should be examined to maintain capital and operating and maintenance costs within the reach of small landowners and rural water users' groups. In addition, since the groundwater is satisfactory for domestic use, the alluvial aquifers may also be exploited to provide municipal water supplies to towns and villages in the region.
REFERENCES McLaren, James F. Limited. 1978. Prefeasibility Study of Water and
Land Resources Development in the Lower Solo River Basin Indonesia. Prepared for Canadian International Development Agency, Ottawa, Canada.
Overseas Technical Cooperation Agency, Japan. 197^• Survey and Study for the Development of the Solo River Basin. Prepared for Bengawan Solo Project, Surakarta, Indonesia.
Sir M. MacDonald & Partners. 1979. East Java Groundwater Survey. Prepared for P2AT.
U.S. Department of Agriculture. 1973» Diagnosis and Improvement of Saline and Alkali Soils. Agricultural Handbook No. 60.
* Note: The indirect estimate of gross annual groundwater recharge was determined by solving the following water balance equation :
Gr = P - ETA - SR where: Gr = annual groundwater recharge (mm) and P, ETA
and SR are as defined in Table 2. Actual évapotranspiration, ETA, is determined from the
modified Penman equation for potential évapotranspiration, Ep, minus the difference AE between Ep and ETA. AE is calculated from an empirical equation relating évapotranspiration to the number of dry surface days/month (d) based on 20 years precipitation records and the percent of bare earth/month (m) determined from cropping patterns and land use in the project area.
E = Ep (d/30)m; and, d =29.1- 2.13 n, where n is the average number of
rain days/month.
Acknowledgement: The authors would like to acknowledge the contribution of Ken Brittain, who died accidentally while working on this project. Ken was originally Team Leader and took a deep interest in the groundwater studies, as well as all other aspects of the project.
- 208 -