groundwater contamination due to municipal solid waste ... · introduction waste is a by ... waste...
TRANSCRIPT

INTERNATIONAL JOURNAL OF ENVIRONMENTAL SCIENCES Volume 1, No1,2010
© Copyright 2010 All rights reserved Integrated Publishing services Conference Paper ISSN 0976 – 4402
This paper is presented at the International Conference on Disaster Mitigation and Management, 2009
39
Groundwater Contamination Due to Municipal Solid Waste Disposal – A GIS Based Study in Erode City
N.Rajkumar 1 , T.Subramani 2 L.Elango 3 1 Department of Civil Engineering, Kongu Engineering College, Perundurai, Erode 2 Department of Civil Engineering, Government College of Engineering, Salem
3 Department of Geology Anna University, Chennai [email protected]
Abstract
Erode city, the head quarters of Erode District is located on the bank of Cauvery River in Tamil Nadu state. It lies between 11° 17’ N and 11° 23' N latitudes and 77° 40’ E and 77° 46' E longitudes with an approximate aerial extent of 120 km 2 . The city depends on Cauvery River for its drinking water supply. In addition to Cauvery River water, people in this region also depend on the groundwater resources for their domestic, agricultural and industrial needs. Urbanization and improper disposal of solid wastes lead to contamination of groundwater and surface water resources in this region. Municipal solid wastes of the city are presently disposed as open landfills at three distinct sites namely Vendipalayam, Vairapalayam and Semur. The leaches of the open dump yards directly contaminate the groundwater and surface water resources leading unsuitability of water for drinking at many places. Hence, a detailed study has been carried out using Geographical Information System (GIS) to understand the spatial variation of surface water and groundwater quality. About forty three groundwater samples and seven surface water samples were collected during February, 2009 from the study region, and the samples were analyzed for various physical and chemical parameters such as pH, Electrical Conductivity, Total Dissolved Solids, Alkalinity, Hardness, Na + , K + , Ca 2+ , Mg 2+ , Cl , HCO3
, CO3 2 , SO4
2 , NO3 and F . The concentrations of physical and
chemical constituents in the water samples were compared with the Bureau of Indian Standard (BIS) and World Health Organization (WHO) standard to know the suitability of water for drinking. The study indicates that the water quality parameters exceed the permissible limits for drinking at many locations leading the water unsuitable for drinking. The spatial variation of groundwater quality parameters was also plotted using GIS. Key words: Spatial variation, groundwater contamination, Geographical Information System
1. Introduction Waste is a byproduct of life. High standards of living and ever increasing population
have resulted in an increase in the quantity of wastes generated. Municipal Solid Waste (MSW) is generally a combination of household and commercial refuse which is generated from the living community. Among the multitude of the environmental problem existing in the urbanizing cities of developing countries, MSW management and its impact on groundwater quality have become the most prominent in the recent years.
Erode city, the head quarters of Erode District is located on the bank of Cauvery River in Tamil Nadu state. It lies between 11° 17’ N and 11° 23' N latitudes and 77° 40’ E and 77° 46' E longitudes with an approximate aerial extent of 120 sq.km. Innumerable large towns

INTERNATIONAL JOURNAL OF ENVIRONMENTAL SCIENCES Volume 1, No1,2010
© Copyright 2010 All rights reserved Integrated Publishing services Conference Paper ISSN 0976 – 4402
This paper is presented at the International Conference on Disaster Mitigation and Management, 2009
40
and many mega cities derive a major component of their domestic, agricultural and industrial water supply from aquifers. Similarly, the major part of the living community in Erode city depends also on groundwater for their drinking, domestic, and agricultural needs. During the last two decades groundwater quality has emerged as one of the most important environmental issues confronting much of the world’s populace. Due to lack of efficient solid waste management system and improper dumping of MSW as open landfills, the ground water and surface water in the Erode city is found to be contaminated in various places. In the study region, the municipal solid wastes are disposed as open landfills in three places i.e. at Vendipalayam, Semur and Vairapalayam (on the bank of Cauvery). 1.1 Study Area
Groundwater is a precious and most widely distributed resource of earth and unlike any other mineral source; it gets replenished from meteoric precipitation. Considering the fact that land is a finite resource and the burgeoning population, which requires more and more of it, an integrated landscape assessment is essential. In India, groundwater is the most precious natural resource to provide for the population at large during draught period. Considering the fact that population is increasing dramatically, an integrated landscape assessment is essential to compensate the rising needs due to Urbanization. Nowadays quality of groundwater is more important than its quantity [8] . Studies on groundwater quality have not received attention that it [10] deserves. Erode city, the head quarters of Erode District Tamil Nadu, is located in the southern part of Indian subcontinent. The boundary of the study area consisting of villages, rivers and streams along with ponds, was digitized using the Survey of India [7] Toposheet 58 I (1:50000). Erode district is located between latitudes 11º 15’ N and 11º 45’ N, and longitudes 77º 00’ E and 77º 40’ E. The study area is located between 11° 17’ N and 11° 23’ N latitudes and 77° 40’ E and 77° 46’ E longitudes. The selected area for study is Erode city and the area taken for study is about 120 sq.km. The temperature variation in the city ranges from 39.6°C to 24.1°C in summer while in winter it is found to be 32.8°C to 20.5°C. The annual average rainfall in the study area is 700mm. In the study area, the MSW is disposed as open landfills in three points, of which the larger yard is located at Vendipalayam, around 4 km from Erode city. Another disposal yard is located at Semur, at the western part of the study area (Fig 02). The third yard is located at the bank of river Cauvery, i.e. at Vairapalayam, the eastern part of the study region. The wastes are dumped in nonengineered [11] land fills which results in the contamination of surface and subsurface water in the region considered for study.
The soil found in the study area is mostly red soil, some regions have coarse sand and some regions are found to have sand loamy. The entire study area is found to comprise gneissic complex type of geology. The geomorphology of the study area indicates that the region comprises of shallow pediments in the northern boundary region and also in some parts of southern boundary region. Most of the area in the study region is found to have deep pediments. Only very small area in the study region is found to have the shallow buried pediments. Figure 01 shows the study area location in India.

INTERNATIONAL JOURNAL OF ENVIRONMENTAL SCIENCES Volume 1, No1,2010
© Copyright 2010 All rights reserved Integrated Publishing services Conference Paper ISSN 0976 – 4402
This paper is presented at the International Conference on Disaster Mitigation and Management, 2009
41
Figure 01 Location map of study area 2. Materials and Methods
INTERNATIONAL JOURNAL OF ENVIRONMENTAL SCIENCES Volume 1, No1,2010
© Copyright 2010 All rights reserved Integrated Publishing services Conference Paper ISSN 0976 – 4402
This paper is presented at the International Conference on Disaster Mitigation and Management, 2009
42
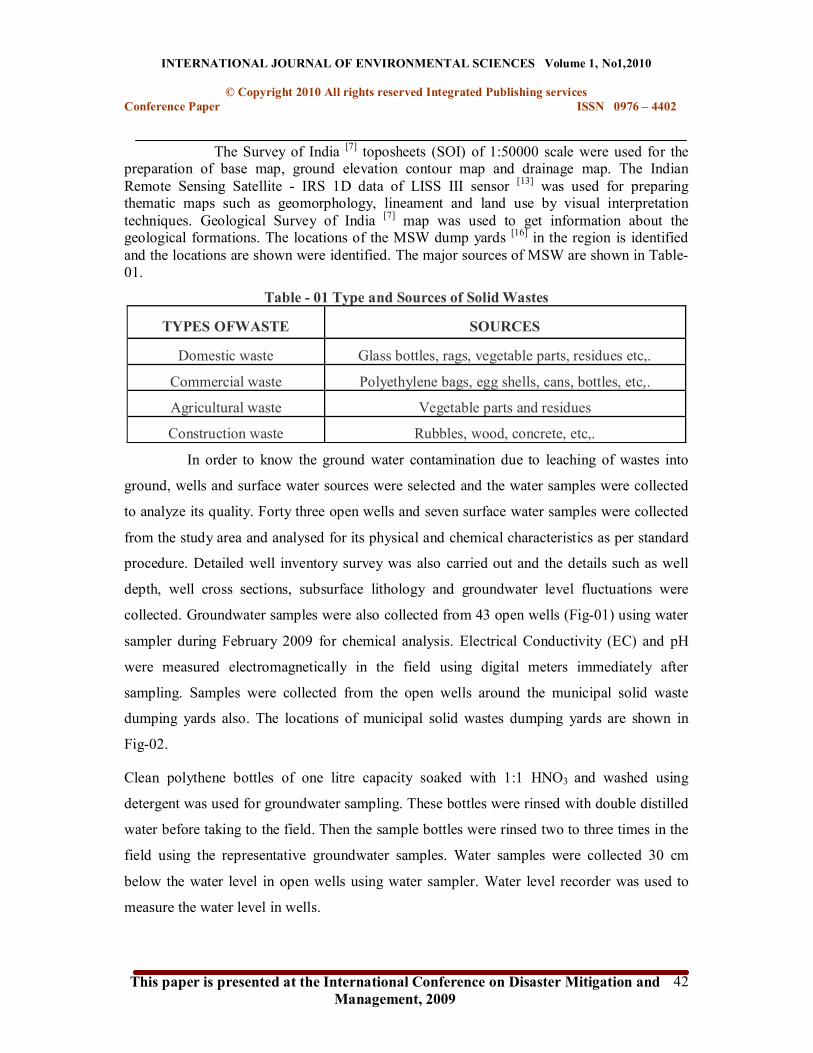
The Survey of India [7] toposheets (SOI) of 1:50000 scale were used for the preparation of base map, ground elevation contour map and drainage map. The Indian Remote Sensing Satellite IRS 1D data of LISS III sensor [13] was used for preparing thematic maps such as geomorphology, lineament and land use by visual interpretation techniques. Geological Survey of India [7] map was used to get information about the geological formations. The locations of the MSW dump yards [16] in the region is identified and the locations are shown were identified. The major sources of MSW are shown in Table 01.
Table 01 Type and Sources of Solid Wastes
TYPES OFWASTE SOURCES
Domestic waste Glass bottles, rags, vegetable parts, residues etc,.
Commercial waste Polyethylene bags, egg shells, cans, bottles, etc,.
Agricultural waste Vegetable parts and residues
Construction waste Rubbles, wood, concrete, etc,.
In order to know the ground water contamination due to leaching of wastes into
ground, wells and surface water sources were selected and the water samples were collected
to analyze its quality. Forty three open wells and seven surface water samples were collected
from the study area and analysed for its physical and chemical characteristics as per standard
procedure. Detailed well inventory survey was also carried out and the details such as well
depth, well cross sections, subsurface lithology and groundwater level fluctuations were
collected. Groundwater samples were also collected from 43 open wells (Fig01) using water
sampler during February 2009 for chemical analysis. Electrical Conductivity (EC) and pH
were measured electromagnetically in the field using digital meters immediately after
sampling. Samples were collected from the open wells around the municipal solid waste
dumping yards also. The locations of municipal solid wastes dumping yards are shown in
Fig02.
Clean polythene bottles of one litre capacity soaked with 1:1 HNO3 and washed using
detergent was used for groundwater sampling. These bottles were rinsed with double distilled
water before taking to the field. Then the sample bottles were rinsed two to three times in the
field using the representative groundwater samples. Water samples were collected 30 cm
below the water level in open wells using water sampler. Water level recorder was used to
measure the water level in wells.

INTERNATIONAL JOURNAL OF ENVIRONMENTAL SCIENCES Volume 1, No1,2010
© Copyright 2010 All rights reserved Integrated Publishing services Conference Paper ISSN 0976 – 4402
This paper is presented at the International Conference on Disaster Mitigation and Management, 2009
43
Figure 02 Location of MSW dumping yards in study area
Groundwater and surface water samples collected in the field were transported to the laboratory on the same day. They were filtered using 0.45 mm Millipore filter paper and acidified with nitric acid (Ultra pure, Merck) for cations. Halflitre of each sample was stored below 4 o C for major anion studies. Then these samples were analysed for determining the concentrations of various chemical constituents such as sodium, potassium, calcium, magnesium, chloride, bicarbonate, carbonate, sulphate, nitrate, fluoride and total dissolved solids (TDS) in the laboratory using the standard methods (Table02) as suggested by the American Public Health Association [2,3] . Ca 2+ , Mg 2+ , HCO3
− , CO3 2− , Cl − and TDS were
analysed by volumetric titrations. Concentrations of Ca 2+ and Mg 2+ were estimated titrimetrically using 0.05N EDTA. Concentrations of HCO3
− and CO3 2− were determined
using 0.01N H2SO4. Cl − was estimated using 0.05N AgNO3. Na + and K + ions were measured using flame photometer. SO4
2− , NO3 − and F − were determined by spectrophotometric
techniques. The accuracy of the chemical analysis was verified by calculating ionbalance errors where, the errors were generally around 10%.

INTERNATIONAL JOURNAL OF ENVIRONMENTAL SCIENCES Volume 1, No1,2010
© Copyright 2010 All rights reserved Integrated Publishing services Conference Paper ISSN 0976 – 4402
This paper is presented at the International Conference on Disaster Mitigation and Management, 2009
44
Table 02 Methods used for chemical analysis of groundwater
Chemical parameters Methods
Ca 2+ and Mg 2+ Titration using 0.05 N EDTA
Na + and K + Flame Photometer
HCO3 and CO3
2 Titration using 0.01 N H2SO4
Cl Titration using 0.05 N AgNO3
NO3 Spectrophotometer
SO4 2 Spectrophotometer
SiO2 Spectrophotometer
F Spectrophotometer
B Atomic Absorption Spectrophotometer
3. Results And Discussion 3.1 Groundwater Chemistry
Understanding the quality of groundwater is as important as that of its quantity as it is the main factor determining its suitability for drinking, domestic, agricultural and industrial purposes. Fortythree groundwater samples analyzed during February 2009 were used to classify the groundwater into various types based on its suitability for drinking and agricultural uses. Further, the data was used for understanding the spatial distribution of geochemical constituents over the Erode city.
The pH values in the study area vary from 7.0 to 8.2 suggesting alkaline nature of the groundwater. The electrical conductivity (EC) values were found to vary between 370 µmhos/cm and 3880 µmhos/cm. Physical and chemical parameters including minimum, maximum and average concentrations are reported in Table02. The major ions are in the order Na + >Ca 2+ >Mg 2+ >K + = HCO3
>Cl >SO4 2 >NO3
>CO3 2 . High concentration of sodium
and calcium in groundwater is due to weathering of silicate minerals. The lower concentration of potassium is, however, due to its greater resistance to weathering and its fixation in the formation of clay minerals [12] . Bicarbonate is the dominant anion in this region.

INTERNATIONAL JOURNAL OF ENVIRONMENTAL SCIENCES Volume 1, No1,2010
© Copyright 2010 All rights reserved Integrated Publishing services Conference Paper ISSN 0976 – 4402
This paper is presented at the International Conference on Disaster Mitigation and Management, 2009
45
Table 03 Minimum and maximum values of physical and chemical parameters of
groundwater
Parameters Units Minimum Maximum Mean Median Mode pH 7.1 8.2 7.63 7.6 7.5
EC µmhos/cm 410 3830 1463.48 1290 1290
TDS mg/l 267 2345 862.27 763.5
TH mg/l 170 1070 441.4 410 345
P Alk mg/l
T Alk mg/l 210 675 383.6 381.8 345
Na + mg/l 0 437 142.37 104 92
K + mg/l 4 76 26.76 20 14
Ca 2+ mg/l 28 188 84.74 82 80
Mg 2+ mg/l 5 209 55.72 48.5 35
Cl mg/l 28 759 201.76 124 71
HCO3 mg/l 189 824 468.09 457.5 409
CO3 2 mg/l
NO3 mg/l 0 47 7.93 4.5 2.0
SO4 2 mg/l 12 300 81.74 63 82
F mg/l 0.14 1.5 0.80 0.9 1.3
The analytical results of physical and chemical parameters of groundwater were compared with the standard guideline values as recommended by the World Health Organisation [20, 21] for drinking and public health purposes (Table04). The table shows the most desirable limits and maximum allowable limits of various parameters. The concentrations of ions, such as Ca 2+ , Mg 2+ , NO3
, SO4 2 and F are within the maximum
allowable limits for drinking. However, Na + and Cl ions exceed the maximum allowable limits for drinking purposes. The concentration of cation Na + is exceeding the maximum allowable limits at many places. The TDS and total hardness values are also found to exceed the maximum permissible limits at many places. Sodium ion concentration in the ground water varies from 0 to 437 mg/l with an average value of 142.4 mg/l. Ten samples out of 43 exceed the maximum permissible limit of 200 mg/l for drinking. The calcium ion concentration varies from 28 mg/l to 188 mg/l with an average value of 84.74 mg/l. All the samples are with the permissible limits. Magnesium and potassium concentrations are comparatively low. Bicarbonate, the dominant anion in the study area, varies between 189 mg/l and 824 mg/l (average 468.09 mg/l). Chloride varies from 28 mg/l to 759 mg/l (average 201.76 mg/l). Only at four locations, the chloride concentration exceeds the maximum
INTERNATIONAL JOURNAL OF ENVIRONMENTAL SCIENCES Volume 1, No1,2010
© Copyright 2010 All rights reserved Integrated Publishing services Conference Paper ISSN 0976 – 4402
This paper is presented at the International Conference on Disaster Mitigation and Management, 2009
46
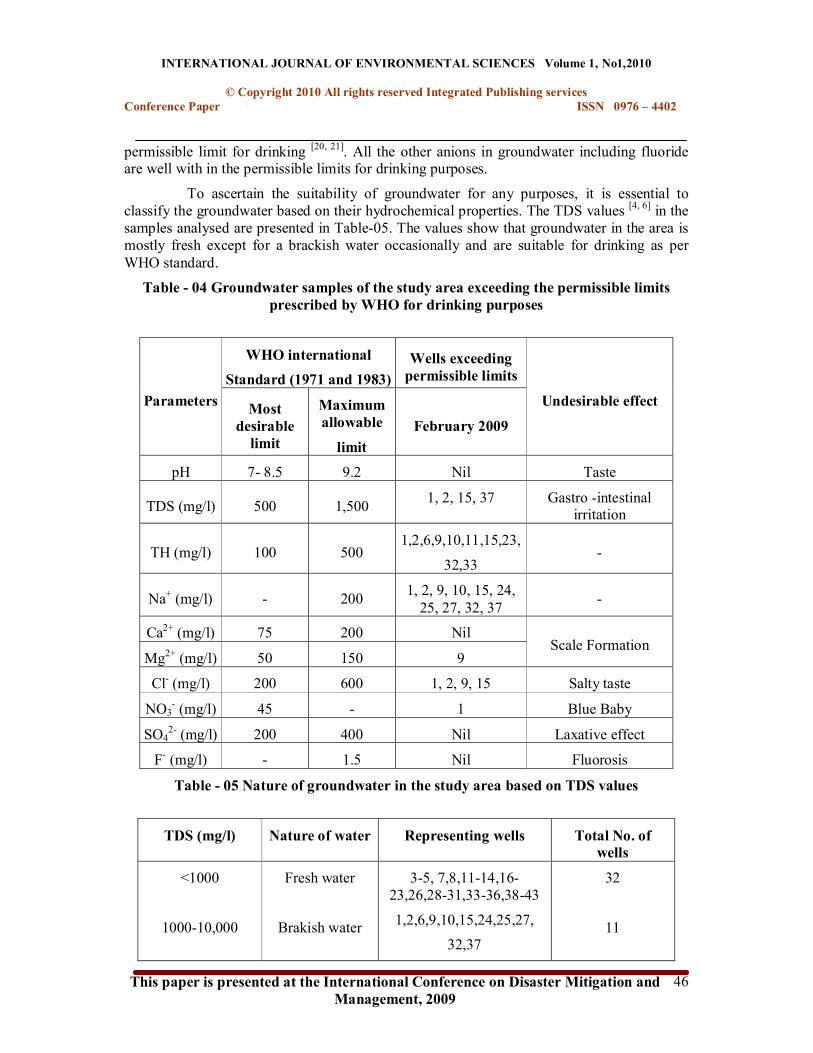
permissible limit for drinking [20, 21] . All the other anions in groundwater including fluoride are well with in the permissible limits for drinking purposes.
To ascertain the suitability of groundwater for any purposes, it is essential to classify the groundwater based on their hydrochemical properties. The TDS values [4, 6] in the samples analysed are presented in Table05. The values show that groundwater in the area is mostly fresh except for a brackish water occasionally and are suitable for drinking as per WHO standard.
Table 04 Groundwater samples of the study area exceeding the permissible limits prescribed by WHO for drinking purposes
WHO international Standard (1971 and 1983)
Wells exceeding permissible limits
Parameters Most desirable limit
Maximum allowable limit
February 2009
Undesirable effect
pH 7 8.5 9.2 Nil Taste
TDS (mg/l) 500 1,500 1, 2, 15, 37 Gastro intestinal irritation
TH (mg/l) 100 500 1,2,6,9,10,11,15,23,
32,33
Na + (mg/l) 200 1, 2, 9, 10, 15, 24, 25, 27, 32, 37
Ca 2+ (mg/l) 75 200 Nil
Mg 2+ (mg/l) 50 150 9 Scale Formation
Cl (mg/l) 200 600 1, 2, 9, 15 Salty taste
NO3 (mg/l) 45 1 Blue Baby
SO4 2 (mg/l) 200 400 Nil Laxative effect
F (mg/l) 1.5 Nil Fluorosis
Table 05 Nature of groundwater in the study area based on TDS values
TDS (mg/l) Nature of water Representing wells Total No. of wells
<1000
100010,000
Fresh water
Brakish water
35, 7,8,1114,16 23,26,2831,3336,3843
1,2,6,9,10,15,24,25,27, 32,37
32
11

INTERNATIONAL JOURNAL OF ENVIRONMENTAL SCIENCES Volume 1, No1,2010
© Copyright 2010 All rights reserved Integrated Publishing services Conference Paper ISSN 0976 – 4402
This paper is presented at the International Conference on Disaster Mitigation and Management, 2009
47
10,0001,00,000 >1,00,000
Saline water Brine water
Nil Nil
Nil Nil
Sodium Adsorption Ratio (SAR), an important parameter for determining the suitability of groundwater for irrigation purposes is defined (Karanth, 1987) as:
SAR = Na + / [(Ca 2+ + Mg 2+ )/2] 1/2
where the concentrations are reported in meq/l. The SAR values in the samples range from 0.3 to 10.62 with an average value of 2.9. The 42 groundwater samples in the area fall under low sodium (S1) class and one sample fall under S2 class (Table06) suggesting no alkali hazard. If the SAR values are more than 6, the water will have permeability problems [17] .
Table 06 Alkalinity Hazard
February 2009 SAR Alkalinity hazard
Water Class
Representing wells
Total No. of wells
< 10 1018
1826 >26
S1S2
S3S4
Excellent Good
Doubtful Unsuitable
136, 3743 37
Nil Nil
42 1
Nil Nil
The percent sodium (% Na) is calculated using the formula given below:
Na % = (Na + + K + ) x 100/ (Ca 2+ + Mg 2+ + Na + + K + ) where the concentrations are reported in meq/l.
The percent sodium in samples ranges from 4.82% to 75.98% with an average value of with an average value of 39.80% suggesting that the groundwater of the study region falls under excellent to permissible limits for irrigation (Table08). When the range of sodium is high, it will be absorbed by the clay particles, displacing Mg2 + and Ca 2+ ions [1] . The exchange process of Na + in water for Mg2 + and Ca 2+ ions in soil reduces the permeability and eventually results in soil with poor internal drainage. Hence, air and water circulation is restricted during wet conditions and such soils are usually hard when dry [5, 17] .
Table 07 Suitability of groundwater for irrigation based on percent sodium
February 2009 % Na Water class
Representing wells Total No. of wells
<20
2040
Excellent
Good
7,11,12,17,18
4,5,8,13,16,20,23,26,30,
5
14
INTERNATIONAL JOURNAL OF ENVIRONMENTAL SCIENCES Volume 1, No1,2010
© Copyright 2010 All rights reserved Integrated Publishing services Conference Paper ISSN 0976 – 4402
This paper is presented at the International Conference on Disaster Mitigation and Management, 2009
48
4060
6080
> 80
Permissible
Doubtful
Unsuitable
31,33,34,40,43
1,2,3,6,9,10,14,15,19,21 22,24,28,29,32,35,36,38
39,41,42
25,27,37
Nil
21
3
Nil
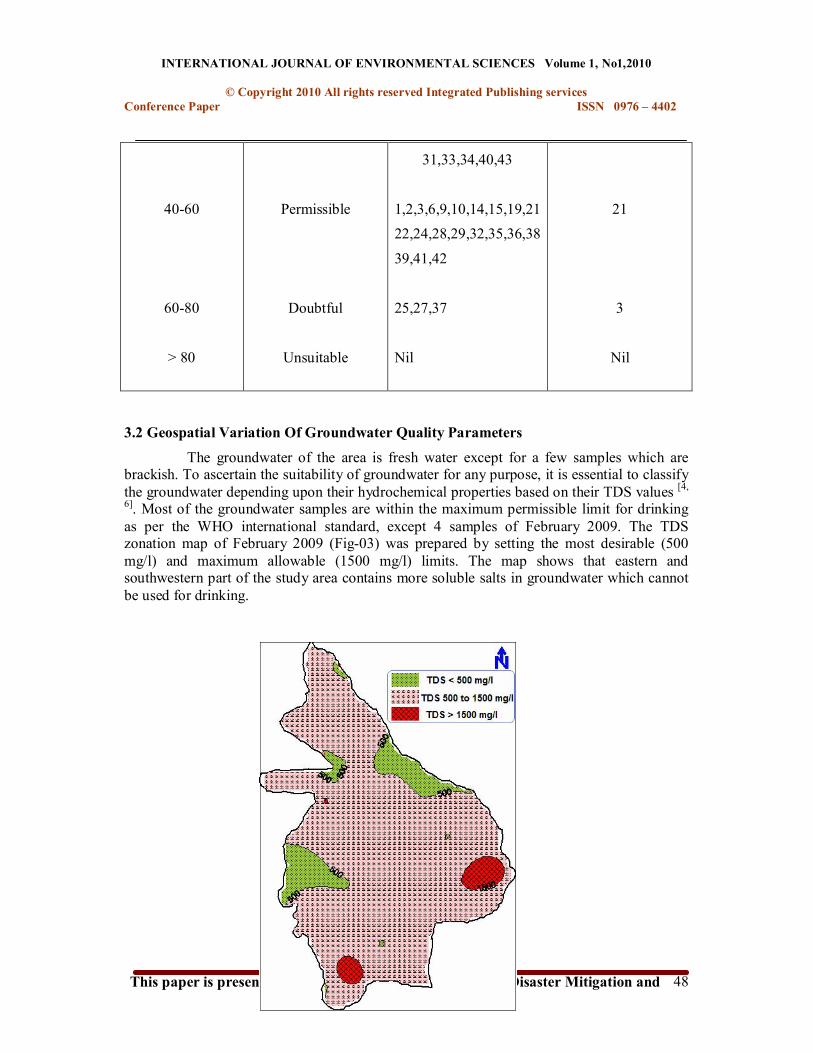
3.2 Geospatial Variation Of Groundwater Quality Parameters The groundwater of the area is fresh water except for a few samples which are
brackish. To ascertain the suitability of groundwater for any purpose, it is essential to classify the groundwater depending upon their hydrochemical properties based on their TDS values [4, 6] . Most of the groundwater samples are within the maximum permissible limit for drinking as per the WHO international standard, except 4 samples of February 2009. The TDS zonation map of February 2009 (Fig03) was prepared by setting the most desirable (500 mg/l) and maximum allowable (1500 mg/l) limits. The map shows that eastern and southwestern part of the study area contains more soluble salts in groundwater which cannot be used for drinking.

INTERNATIONAL JOURNAL OF ENVIRONMENTAL SCIENCES Volume 1, No1,2010
© Copyright 2010 All rights reserved Integrated Publishing services Conference Paper ISSN 0976 – 4402
This paper is presented at the International Conference on Disaster Mitigation and Management, 2009
49
Fig 03 TDS Zonation map of February 2009 The spatial variations of various geochemical elements in groundwater were
plotted using GIS. Higher concentrations of sodium and chloride ions were noticed in the eastern and western parts of the study area (Fig04) leading the groundwater unsuitable for drinking. Increased trend of nitrate and fluoride concentrations (Fig04) were also noticed in the spatial variation diagrams of February 2009. Disposal of Municipal Solid Waste in the eastern part of the basin might have affected the groundwater quality.
Fig 04 Spatial variation of ions in groundwater 3.3 Surface Water Chemistry
INTERNATIONAL JOURNAL OF ENVIRONMENTAL SCIENCES Volume 1, No1,2010
© Copyright 2010 All rights reserved Integrated Publishing services Conference Paper ISSN 0976 – 4402
This paper is presented at the International Conference on Disaster Mitigation and Management, 2009
50
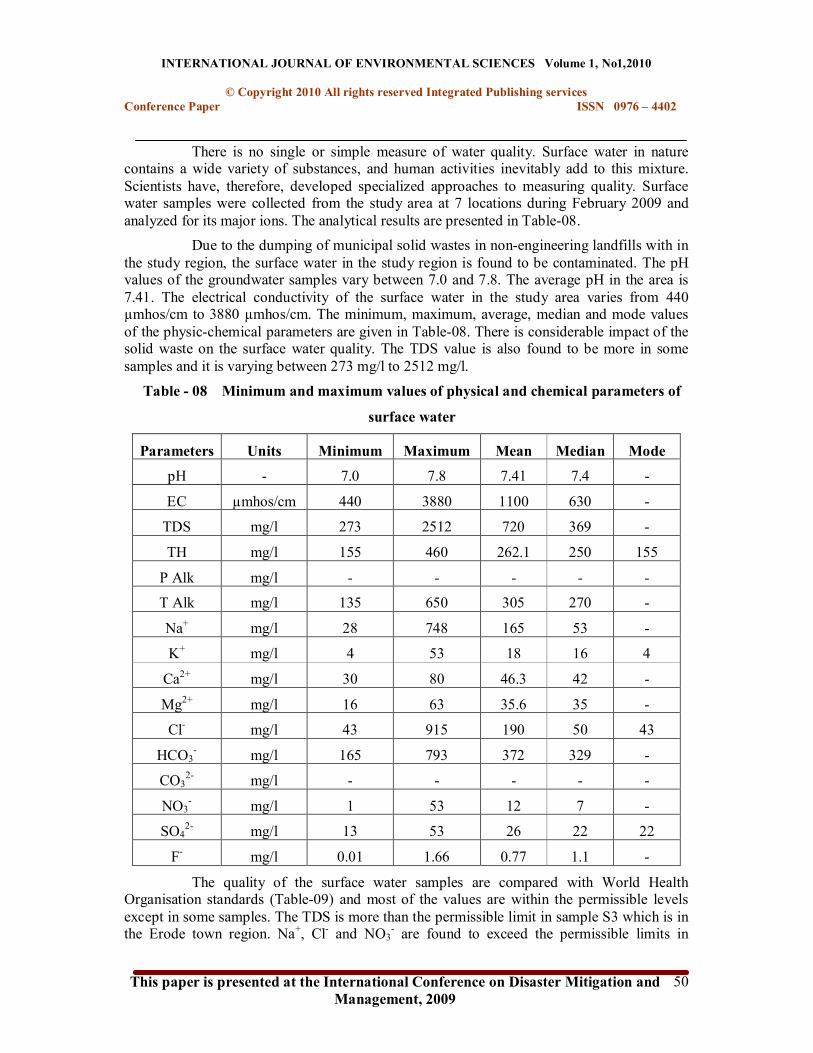
There is no single or simple measure of water quality. Surface water in nature contains a wide variety of substances, and human activities inevitably add to this mixture. Scientists have, therefore, developed specialized approaches to measuring quality. Surface water samples were collected from the study area at 7 locations during February 2009 and analyzed for its major ions. The analytical results are presented in Table08.
Due to the dumping of municipal solid wastes in nonengineering landfills with in the study region, the surface water in the study region is found to be contaminated. The pH values of the groundwater samples vary between 7.0 and 7.8. The average pH in the area is 7.41. The electrical conductivity of the surface water in the study area varies from 440 µmhos/cm to 3880 µmhos/cm. The minimum, maximum, average, median and mode values of the physicchemical parameters are given in Table08. There is considerable impact of the solid waste on the surface water quality. The TDS value is also found to be more in some samples and it is varying between 273 mg/l to 2512 mg/l.
Table 08 Minimum and maximum values of physical and chemical parameters of
surface water
Parameters Units Minimum Maximum Mean Median Mode pH 7.0 7.8 7.41 7.4
EC µmhos/cm 440 3880 1100 630
TDS mg/l 273 2512 720 369
TH mg/l 155 460 262.1 250 155
P Alk mg/l
T Alk mg/l 135 650 305 270
Na + mg/l 28 748 165 53
K + mg/l 4 53 18 16 4
Ca 2+ mg/l 30 80 46.3 42
Mg 2+ mg/l 16 63 35.6 35
Cl mg/l 43 915 190 50 43
HCO3 mg/l 165 793 372 329
CO3 2 mg/l
NO3 mg/l 1 53 12 7
SO4 2 mg/l 13 53 26 22 22
F mg/l 0.01 1.66 0.77 1.1
The quality of the surface water samples are compared with World Health Organisation standards (Table09) and most of the values are within the permissible levels except in some samples. The TDS is more than the permissible limit in sample S3 which is in the Erode town region. Na + , Cl and NO3
are found to exceed the permissible limits in

INTERNATIONAL JOURNAL OF ENVIRONMENTAL SCIENCES Volume 1, No1,2010
© Copyright 2010 All rights reserved Integrated Publishing services Conference Paper ISSN 0976 – 4402
This paper is presented at the International Conference on Disaster Mitigation and Management, 2009
51
sample S4. The F exceeds the drinking water quality limit in the sample S1 which is also used by the local community for domestic and drinking purpose.
Table 09 Surface water samples of the study area exceeding the permissible limits prescribed by WHO for drinking purposes
WHO international Standard (1971 and 1983)
Samples exceeding permissible limits
Parameters Most desirable limit
Maximum allowable limit
February 2009
Undesirable effect
pH 7 8.5 9.2 Nil Taste
TDS (mg/l) 500 1,500 S3 Gastro intestinal irritation
TH (mg/l) 100 500 Nil
Na + (mg/l) 200 S4
Ca 2+ (mg/l) 75 200 Nil
Mg 2+ (mg/l) 50 150 Nil Scale Formation
Cl (mg/l) 200 600 S4 Salty taste
NO3 (mg/l) 45 S4 Blue Baby
SO4 2 (mg/l) 200 400 Nil Laxative effect
F (mg/l) 1.5 S1 Fluorosis
The surface water sample quality has been studied and it is classified based on the TDS values. Table10 shows classification. All the samples are found to fall with in the fresh water type except the sample S4 which falls in the type of brackish water. Some of the industrial discharges and the sewage from the town are discharged into this drain. This may be the major cause for the pollution.
Table 10 Nature of surface water in the study area based on TDS values
TDS (mg/l) Nature of water Representing samples Total No. of samples
<1000 Fresh water S1S3, S5S7 06

INTERNATIONAL JOURNAL OF ENVIRONMENTAL SCIENCES Volume 1, No1,2010
© Copyright 2010 All rights reserved Integrated Publishing services Conference Paper ISSN 0976 – 4402
This paper is presented at the International Conference on Disaster Mitigation and Management, 2009
52
100010,000 10,0001,00,000
>1,00,000
Brackish water Saline water
Brine water
S4 Nil
Nil
01 Nil
Nil
The classification of surface water based on alkalinity hazard (Table11), and suitability of the same for irrigation based on percent sodium (Table12) has been done and almost all the samples are found to fall under permissible limits.
Table11 Alkalinity Hazard
February 2009 SAR Alkalinity hazard
Water Class
Representing samples
Total No. of samples
< 10 1018
1826 >26
S1S2
S3S4
Excellent Good
Doubtful Unsuitable
S1S3, S5S7 S4
Nil Nil
0601
Nil Nil
Table12 Suitability of surface water for irrigation based on percent sodium
February 2009 % Na Water class
Representing samples Total No. of samples <20
2040 4060
6080 > 80
Excellent
Good Permissible
Doubtful Unsuitable
Nil
S2, S5 S1, S3, S6, S7
S4 Nil
Nil
0204
3 Nil
4. Conclusion The groundwater in the study area is mainly alkaline in nature. The abundance of
major ions are in the following order Na + >Ca 2+ >mg 2+ >K + = HCO 3 >Cl >SO4 2 >NO3
>CO3 2 .
The concentrations of cations such as Na + and Mg 2+ exceed the maximum allowable limits for drinking water at some locations which are near to the MSW dumping yards in the study area. Ca + concentrations in the groundwater, however, are within the permissible limits in February 2009. The anions such as SO4
2 , NO3 and F are well within the permissible limits
for drinking except at one location which is near to the area of location of tanneries. Only at four locations out of which three are very near to the MSW dump yards in the study region, the chloride concentrations are found to exceed the permissible limits during February 2009.
INTERNATIONAL JOURNAL OF ENVIRONMENTAL SCIENCES Volume 1, No1,2010
© Copyright 2010 All rights reserved Integrated Publishing services Conference Paper ISSN 0976 – 4402
This paper is presented at the International Conference on Disaster Mitigation and Management, 2009
53
The zonation map indicates that TDS in 2/3 of the study area is between 500 to 1500mg/l. This indicates the presence of soluble salts in some samples of groundwater, which has to be treated before using it for drinking. So, there is a considerable impact on the groundwater within the study area because of dumping of MSW in nonengineered land fills.
The surface water in the study area is also alkaline in nature. Most of the samples are found to be within the permissible limits except one in which the industrial discharges and sewage from the study region are getting mixed.
5. References 1. Anandakumar, S., T.Subramani., L, Elango, 2009. Major Ion Groundwater Chemistry
of Lower Bhavani River Basin, TamilNadu, India. Journal of Applied Geochemistry., Vol.11 No.1 Pp 92101.
2. APHA. 1989. Standard methods for the examination of water and wastewater. 17 th edition. American Public Health Association, Washington, DC.
3. APHA, 1995. Standard methods for the examination of water and wastewater. 19 th edition. American Public Health Association. Washington, DC.
4. Caroll D., 1962. Rain water as a chemical agent of geological process A view. USGS Water Supply. Vol.1533 pp.1820.
5. Collins, R., A. Jenkins, 1996. The Impact of Agricultural Land use on Stream Chemistry in the Middle Hills of the Himalayas, Nepal. Journal of Hydrology., Vol:185, Pp7186.
6. Freeze, R.A., J.A. Cherry., 1979. Groundwater. Prentice Hall. Englewood Cliffs. New Jersey.
7. GSI. 1995. Geological and mineral map of Tamil Nadu and Pondicherry. Published in 1: 500,000 scale by the Director General, Geological Survey of India.
8. Hem., J.D., 1985. Study and interpretation of the chemical characteristics of natural water. USGS. Water Supply Paper. No.2254 p. 264.
9. Karanth, K.R., 1987. Groundwater Assessment, Development and Management. Tata McGraw Hill, New Delhi, pp: 720.
10. Krishna Rao, P.R., 1971. Hydrometeorological aspects of estimating groundwater potential. Seminar volume. Groundwater potential of hard rock areas of India, Bangalore. pp.12.
11. Li ZhenShan., Yang Lei., Qu XiaoYan., Sui YuMei., 2009. Municipal Solid Waste Management in Beijing City. Waste Management (Article in Press).
12. Mohan, R., A.K. Singh., J.K.Tripathi., G.C.Chowdhary., 2000. Hydrochemistry and quality assessment of groundwater in Naini industrial area, Allahabad District, Uttar Pradesh. Journal of the Geological Society of India. Vol.55, pp.7789.
13. Perumal, A. and Roy, A.K. (1983). Application of LANDSAT and aerial data to delineate the hydromorphogeologic zones in parts of Vaigai, Manimuthar and Pambar

INTERNATIONAL JOURNAL OF ENVIRONMENTAL SCIENCES Volume 1, No1,2010
© Copyright 2010 All rights reserved Integrated Publishing services Conference Paper ISSN 0976 – 4402
This paper is presented at the International Conference on Disaster Mitigation and Management, 2009
54
River basins, Tamil Nadu State. Proc. National Symposium on Remote Sensing in development and Managing Water Resources, New Delhi, pp. 315319.
14. Petr Stehlik., 2009. Contribution in Advances in WastetoEnergy Technologies. Journal of Cleaner Production. Vol. 17, Pp 919931.
15. Ragunath, H.M., 1987. Groundwater. Wiley Eastern Ltd. New Delhi. India, 563 p. 16. Rashmi Sharma., 2008. Municipal Solid Waste Management in Ajmer City,
Rajasthan. Nature Environment and Pollution Technology. Vol. 01 No. 4. Pp639642 17. Saleh,A., F, AlRuwaih., M. Shehata., 1999. Hydrogeochemical Processes Operating
within the Main Aquifers of Kuwait. Journal of Arid Environment. Vol.42, Pp 195 209.
18. Sreedevi P.D., S. Srinivasalu., K. Kesava Raju., 2001. Hydrogeomorphological and groundwater prospects of the Pageru River basin by using remote sensing data. Journal Environmental Geology. Vol.40, pp.10881094.
19. Subhasish Chattopadhyay., Amit Dutta., Subabrata Ray., 2009. Municipal Solid Waste Management in Kolkata, India A Review. Waste Management. Vol. 29, Pp 14491458
20. WHO. 1971. International standards for drinking water. World Health Organisation, Geneva.
21. WHO. 1983. Guidelines to drinking water quality. World Health Organisation, Geneva. 186p.

INTERNATIONAL JOURNAL OF ENVIRONMENTAL SCIENCES Volume 1, No1,2010
© Copyright 2010 All rights reserved Integrated Publishing services Conference Paper ISSN 0976 – 4402
This paper is presented at the International Conference on Disaster Mitigation and Management, 2009
55