grosvenor sample chapter canadian edition
DESCRIPTION
Chapter 2: Guidelines for a Healthy DietTRANSCRIPT
2“What you don’t know could kill you.” Those words may have been the first nutrition recommen-
dation in human history. Swallowing the wrong berry, gulping water from a suspect source, or tucking into a diseased organ from the most recent kill could have been fatal to early humans, who were hunter-gatherers. Such lessons would have served as anecdotal guide-posts to survival. As societies developed, dietary cau-tions became taboos, sometimes laws, and ultimately, nutrition recommendations.
For the past 150 years, governments have been providing what we would call modern nutrition informa-tion. Today, this information is based on the results of thousands of studies examining the dietary factors asso-ciated with a population’s highest level of health status. These results are then translated into an educational kit of dietary recommendations to inform the population which foods they should eat. The process of provid-ing nutritional information to the population traces its roots to the Industrial Revolution that swept through Great Britain in the first half of the 19th century, when urban populations—and poverty and hunger—swelled. To ensure a healthy workforce, the British government developed minimum dietary guidelines utilizing the least expensive foods. It wasn’t until World War I that the British Royal Society determined that a healthy work-force required not necessarily the least expensive diet but a healthy diet that included fruits, vegetables, and milk as elements of a solid nutritional foundation. Since then, virtually every national government, including the Canadian federal government, has sought, with varying degrees of success, to establish dietary standards for its citizens.
Today, modern public health agencies provide valu-able information regarding nutritional choices. However, this information isn’t always understood or used prop-erly. As portion sizes grow, so do Canadian waistlines—and the attendant health concerns. “What you don’t know could kill you” remains as vital an admonition today as it was 40,000 years ago.
Guidelines for a Healthy Diet
© C
an S
tock
Pho
to In
c. /
april
pho
to
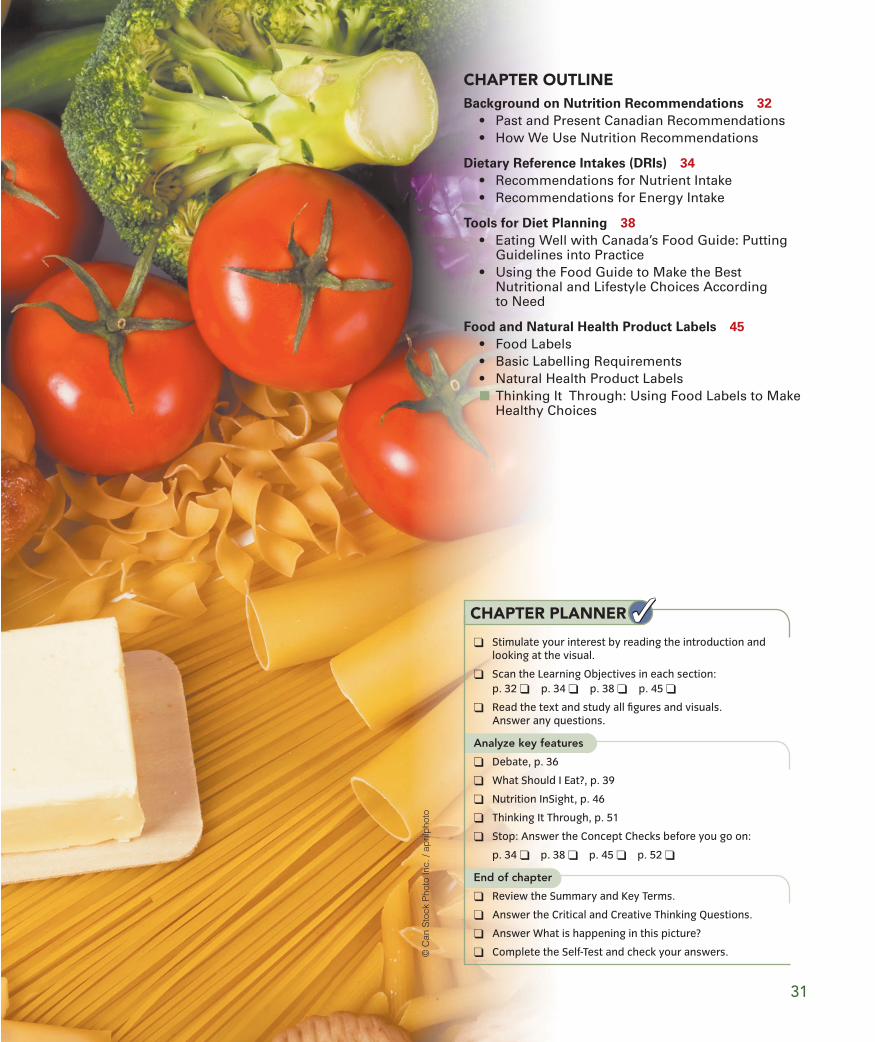
CHAPTER OUTLINEBackground on Nutrition Recommendations 32
Dietary Reference Intakes (DRIs) 34
Tools for Diet Planning 38
Food and Natural Health Product Labels 45
■
31
❑ Stimulate your interest by reading the introduction and looking at the visual.
❑ Scan the Learning Objectives in each section: p. 32 ❑ p. 34 ❑ p. 38 ❑ p. 45 ❑
❑ Read the text and study all figures and visuals. Answer any questions.
Analyze key features
❑ Debate, p. 36
❑ What Should I Eat?, p. 39
❑ Nutrition InSight, p. 46
❑ Thinking It Through, p. 51
❑ Stop: Answer the Concept Checks before you go on:
p. 34 ❑ p. 38 ❑ p. 45 ❑ p. 52 ❑
End of chapter
❑ Review the Summary and Key Terms.
❑ Answer the Critical and Creative Thinking Questions.
❑ Answer What is happening in this picture?
❑ Complete the Self-Test and check your answers.
CHAPTER PLANNER ✓✓
32 CHAPTER 2 Guidelines for a Healthy Diet
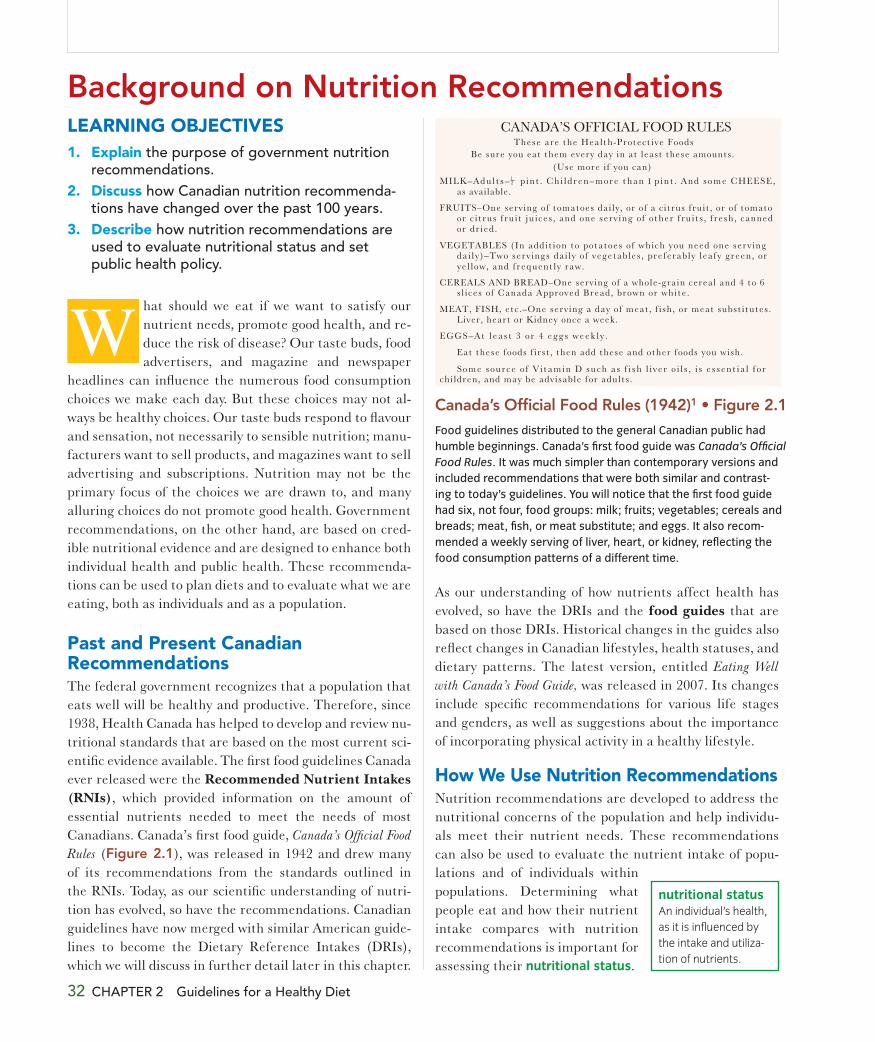
Background on Nutrition RecommendationsLEARNING OBJECTIVES
As our understanding of how nutrients affect health has evolved, so have the DRIs and the food guides that are based on those DRIs. Historical changes in the guides also reflect changes in Canadian lifestyles, health statuses, and dietary patterns. The latest version, entitled Eating Well
with Canada’s Food Guide, was released in 2007. Its changes include specific recommendations for various life stages and genders, as well as suggestions about the importance of incorporating physical activity in a healthy lifestyle.
How We Use Nutrition RecommendationsNutrition recommendations are developed to address the nutritional concerns of the population and help individu-als meet their nutrient needs. These recommendations can also be used to evaluate the nutrient intake of popu-lations and of individuals within populations. Determining what people eat and how their nutrient intake compares with nutrition recommendations is important for assessing their nutritional status.
1. Explain the purpose of government nutrition recommendations.
2. Discuss how Canadian nutrition recommenda-tions have changed over the past 100 years.
3. Describe how nutrition recommendations are used to evaluate nutritional status and set public health policy.
W
nutritional status An individual’s health, as it is influenced by the intake and utiliza-tion of nutrients.
hat should we eat if we want to satisfy our nutrient needs, promote good health, and re-duce the risk of disease? Our taste buds, food advertisers, and magazine and newspaper
headlines can influence the numerous food consumption choices we make each day. But these choices may not al-ways be healthy choices. Our taste buds respond to flavour and sensation, not necessarily to sensible nutrition; manu-facturers want to sell products, and magazines want to sell advertising and subscriptions. Nutrition may not be the primary focus of the choices we are drawn to, and many alluring choices do not promote good health. Government recommendations, on the other hand, are based on cred-ible nutritional evidence and are designed to enhance both individual health and public health. These recommenda-tions can be used to plan diets and to evaluate what we are eating, both as individuals and as a population.
Past and Present Canadian RecommendationsThe federal government recognizes that a population that eats well will be healthy and productive. Therefore, since 1938, Health Canada has helped to develop and review nu-tritional standards that are based on the most current sci-entific evidence available. The first food guidelines Canada ever released were the Recommended Nutrient Intakes (RNIs), which provided information on the amount of essential nutrients needed to meet the needs of most Canadians. Canada’s first food guide, Canada’s Official Food
Rules (Figure 2.1), was released in 1942 and drew many of its recommendations from the standards outlined in the RNIs. Today, as our scientific understanding of nutri-tion has evolved, so have the recommendations. Canadian guidelines have now merged with similar American guide-lines to become the Dietary Reference Intakes (DRIs), which we will discuss in further detail later in this chapter.
CANADA’S OFFICIAL FOOD RULESThese are the Health-Protective Foods
Be sure you eat them every day in at least these amounts.
MILK–Adults– pint . Children–more than I pint . And some CHEESE,
FRUITS–One serving of tomatoes daily, or of a citrus fruit, or of tomato
VEGETABLES (In addition to potatoes of which you need one serving
CEREALS AND BREAD–One serving of a whole-grain cereal and 4 to 6
MEAT, FISH, etc.–One serving a day of meat, fish, or meat substitutes.
EGGS–At least 3 or 4 eggs weekly .
as available.
or citrus fruit juices, and one serving of other fruits, fresh, canned
daily)–Two servings daily of vegetables, preferably leafy green, or
slices of Canada Approved Bread, brown or white.
Liver, heart or Kidney once a week.
Eat these foods first, then add these and other foods you wish.
Some source of Vitamin D such as f ish l iver oi ls , is essential forchildren, and may be advisable for adults.
yellow, and frequently raw.
or dried.
(Use more if you can)12
Canada’s Official Food Rules (1942)1
Food guidelines distributed to the general Canadian public had humble beginnings. Canada’s first food guide was Canada’s Official Food Rules. It was much simpler than contemporary versions and included recommendations that were both similar and contrast-ing to today’s guidelines. You will notice that the first food guide had six, not four, food groups: milk; fruits; vegetables; cereals and breads; meat, fish, or meat substitute; and eggs. It also recom-mended a weekly serving of liver, heart, or kidney, reflecting the food consumption patterns of a different time.
PR
OC
ESS D
IAG
RA
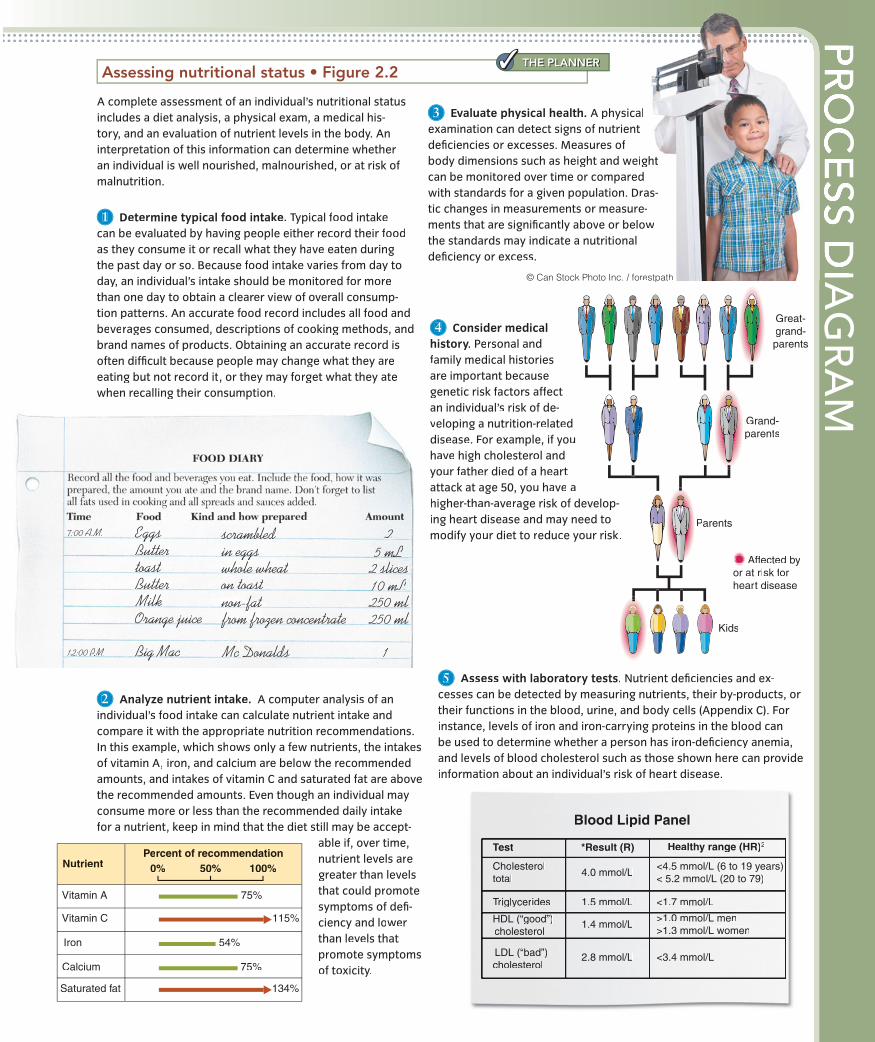
MA complete assessment of an individual’s nutritional status includes a diet analysis, a physical exam, a medical his-tory, and an evaluation of nutrient levels in the body. An interpretation of this information can determine whether an individual is well nourished, malnourished, or at risk of malnutrition.
THE PLANNER✓✓
Vitamin A
Vitamin C
Iron
Calcium
Saturated fat
NutrientPercent of recommendation
0% 50% 100%
75%
75%
115%
134%
54%
Affected byor at risk for heart disease
Grand-parents
Parents
Kids
Great-grand-parents
TTestestTTT *Re*R sulsu t ((R)R) HeaH lthy range (HR)2
ChoCholesesterterrololtottotallal
4.04 mmmmol/ol/LL
TrTriglglg yceycey rrideidess 1.51.5 mmmol/ol/LL <1.<1.7 m7 mmol/L
HDLHDL (“(“(“goooog d”)d”)chocholeslesesterterte olol
1.41.4 mmmmol/ol/LL
LDLLDL (“( badbadad”)”)chocholesesterterolol
2.82 8 mmmmol/ol/LL <3.<3.4 m4 mol/L
BlBlood d LiLipipid d PPananel
<4.<4.5 m5 mol/L (6 to 19 years)< 5< 5.2 2 mmom l/L (20 to 79)
>1.>1.0 m0 mmol/L men>1.>1.3 m3 mmol/L women
5 mL
10 mL2 slices
250 ml250 ml
scrambledin eggswhole wheaton toastnon-fatfrom frozen concentrate
Mc Donalds 1Big Mac
Orange juiceMilkButter
ButterEggs7:00 A.M.
12:00 P M.PP
toast
2
1 Determine typical food intake. Typical fTT ood intakecan be evaluated by having people either record their foodas they consume it or recall what they have eaten duringthe past day or so. Because food intake varies from day today, an individual’s intake should be monitored for morethan one day to obtain a clearer view of overall consump-tion patterns. An accurate food record includes all food andbeverages consumed, descriptions of cooking methods, andbrand names of products. Obtaining an accurate record isoften difficult because people may change what they areeating but not record it, or they may forget what they atewhen recalling their consumption.
3 Evaluate physical health. A physicaexamination can detect signs of nutrient deficiencies or excesses. Measures of
can be monitored over time or comparedwith standards for a givtic changes in measurements or measure-ments that are significantly above or belowthe standards may indicate a nutritionaldeficiency or excess.
5 Assess with laboratory tests. Nutrient deficiencies and ex-cesses can be detected by measuring nutrients, their by-products, or their functions in the blood, urine, and body cells (Appendix C). Forinstance, levels of iron and iron-carrying proteins in the blood canbe used to determine whether a person has iron-deficiency anemia, and levels of blood cholesterol such as those shown here can provideinformation about an individual’s risk of heart disease.
2 Analyze nutrient intake. A computer analysis of anindividual’s food intake can calculate nutrient intake andcompare it with the appropriate nutrition recommendations.In this example, which shows only a few nutrients, the intakesof vitamin A, iron, and calcium are below the recommendedamounts, and intakes of vitamin C and saturated fat are abovethe recommended amounts. Even though an individual mayconsume more or less than the recommended daily intakefor a nutrient, keep in mind that the diet still may be accept-
able if, over time,nutrient levels aregreater than levelsthat could promotesymptoms of defi-ciency and lowerthan levels thatpromote symptomsof toxicity.
4 Consider medical history. Personal and family medical historiesare important because genetic risk factors affect an individual’s risk of de-veloping a nutrition-related disease. For example, if yhave high cholesterol andyour father died of a hear
ou
t attack at age 50, you ha ahigher-than-arr age risk of develop-ing heart disease and may need to modify your diet to reduce your risk
ve
.
rve
body dimensions such as height and weigh
en population. Dras-
© Can Stock Photo Inc. / forestpat
al
d
e-ow
ght
ras-
restpath
© iS
tock
pho
to.c
om/K
ristia
n S
ekul
ic
Dietary Reference Intakes (DRIs)LEARNING OBJECTIVES
1. Summarize the purpose of the DRIs.2. Describe the four sets of DRI values used in
recommending nutrient intake.3. List the variables that affect energy needs
(EERs).4. Define the concept of the Acceptable
Macronutrient Distribution Ranges (AMDRs).
he Dietary Reference Intakes (DRIs) are a set of scientifically based reference values for the amounts of energy, nutrients, and other food components in the diet that are
recommended to be consumed to reduce chronic disease risk, promote general health, and minimize symptoms of deficiency.4 When Health Canada designs a new food guide or a new set of dietary guidelines, it compares population data on what Canadians do consume with the DRIs, the amounts they should consume on a daily basis, and makes recommendations accordingly. For in-stance, when results of the 2004 Canadian Community Health Survey were compared with the Estimated Average Requirement (one of the DRIs) for vitamin A, it was found that more than 35% of Canadians were inadequate in vitamin A,5 thereby increasing their risk for vision problems such as night blindness. The food guide now advises that Canadians consume at least one orange vegetable a day, as they are excellent sources of vitamin A.
T
The DRIs now replace both the Recommended Nutrient Intakes (RNIs) originally established in 1938 by Health Canada and the Recommended Dietary Allowances (RDAs) first established by the American Food and Nutrition Board in 1941. The DRIs include several types of recommendations that address both nu-trient and energy intake and include values that are ap-propriate for people of different genders and stages of life (Figure 2.3).
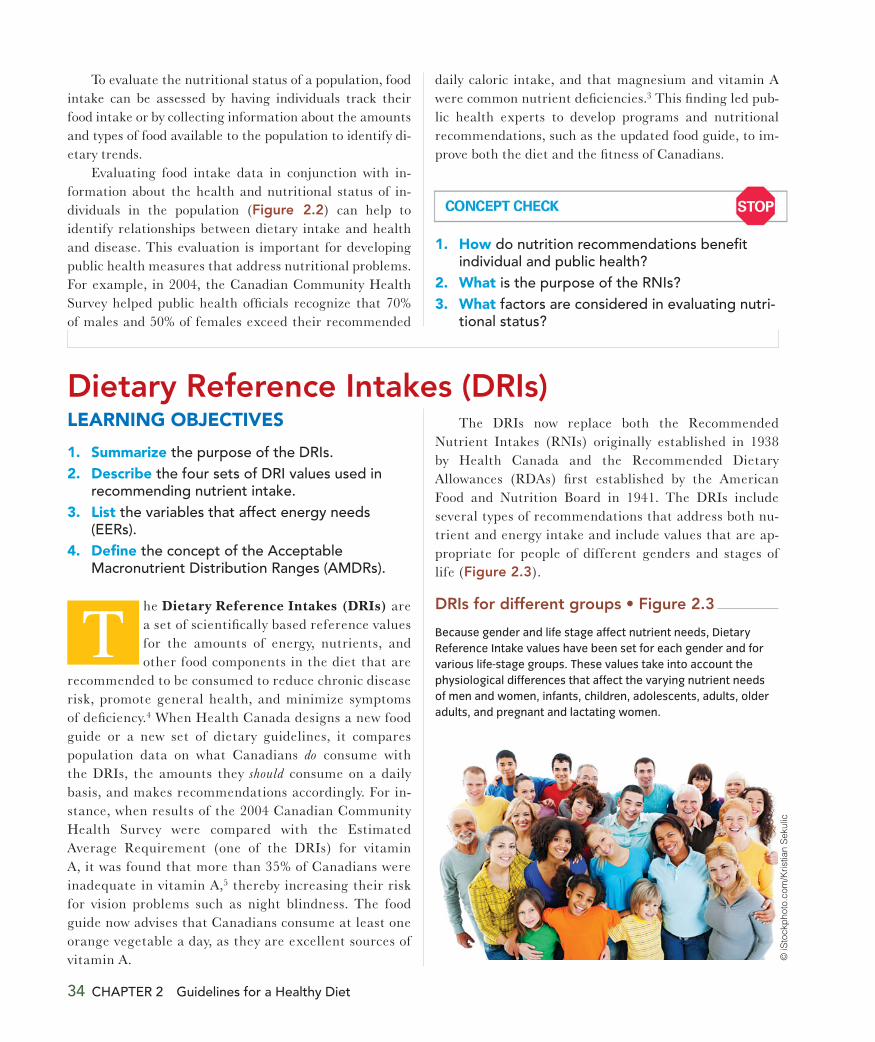
Because gender and life stage affect nutrient needs, Dietary Reference Intake values have been set for each gender and for various life-stage groups. These values take into account the physiological differences that affect the varying nutrient needs of men and women, infants, children, adolescents, adults, older adults, and pregnant and lactating women.
To evaluate the nutritional status of a population, food intake can be assessed by having individuals track their food intake or by collecting information about the amounts and types of food available to the population to identify di-etary trends.
Evaluating food intake data in conjunction with in-formation about the health and nutritional status of in-dividuals in the population (Figure 2.2) can help to identify relationships between dietary intake and health and disease. This evaluation is important for developing public health measures that address nutritional problems. For example, in 2004, the Canadian Community Health Survey helped public health officials recognize that 70% of males and 50% of females exceed their recommended
daily caloric intake, and that magnesium and vitamin A were common nutrient deficiencies.3 This finding led pub-lic health experts to develop programs and nutritional recommendations, such as the updated food guide, to im-prove both the diet and the fitness of Canadians.
1. How do nutrition recommendations benefit individual and public health?
2. What is the purpose of the RNIs?3. What factors are considered in evaluating nutri-
tional status?
34 CHAPTER 2 Guidelines for a Healthy Diet
Dietary Reference Intakes (DRIs) 35
and RDAs. In these cases, Adequate Intakes (AIs) are set, based on the typical intake levels of people that are said to be healthy and show no symptoms of deficiency or toxicity. RDA or AI values can be used as goals for individual in-take and to plan and evaluate individual diets (Appendix A and inside covers). These values are meant to represent the amounts that most healthy people should consume, on average, over several days or even weeks, not each and every day. Because these values are set high enough to meet the needs of almost all healthy people, intake be-low the RDA or AI does not necessarily mean that an in-dividual is deficient, but the risk of deficiency is greater than would be the case if the recommended amount were consumed.6
The fourth set of values, Tolerable Upper Intake Levels (ULs), specifies the maxi-mum amount of a nutrient that most people can consume on a daily basis without some adverse effect (Figure 2.4). For most nu-trients, it is difficult to exceed the UL by consuming food. Most foods do not contain enough of any one nutrient to cause toxicity; how-ever, some dietary supplements (and fortified foods) may (see Debate: Super-Fortified Foods). For some nutrients, the UL is set for total intake from all sources, including food, fortified foods, and dietary supple-ments. For other nutrients, the UL refers to intake from
Recommendations for Nutrient IntakeDRIs for nutrient intake are an umbrella term for four sets of values. The Estimated Average Requirements (EARs) are
the average amounts of nutrients or other dietary components required by healthy individuals within a spe-cific gender and life-stage group (Figure 2.4). The EARs are deter-mined from data on nutrient needs and are used to assess the adequacy of a population’s food supply or typical intake. These requirements are not appropriate for evaluating an individual’s intake but are used to calculate the Recommended Dietary Allowances (RDAs). The RDAs recommend specific amounts of nutrients and other dietary com-ponents required to meet the needs of nearly all (97–98%) of the popula-tion and are typically set 20% above the EAR values. Most recommenda-tions for adequate nutrient intake levels are based on the RDA for each specific nutrient (Figure 2.4).6
Sometimes, there is not enough data about nutrient re-quirements to establish EARs
Estimated Aver-age Requirements (EARs) Nutrient intakes estimated to meet the needs of 50% of the healthy individuals in a given gender and life-stage group.
Recommended Dietary Allow-ances (RDAs) Nutrient intakes that are sufficient to meet the needs of almost all healthy people in a specific gender and life-stage group.
Adequate Intakes (AIs) Nutrient intakes that should be used as a goal when no RDA exists. AI values are an approximation of the nutrient intake that sustains health.
Num
ber
of p
eopl
e
Daily nutrient requirement
RDAEAR UL
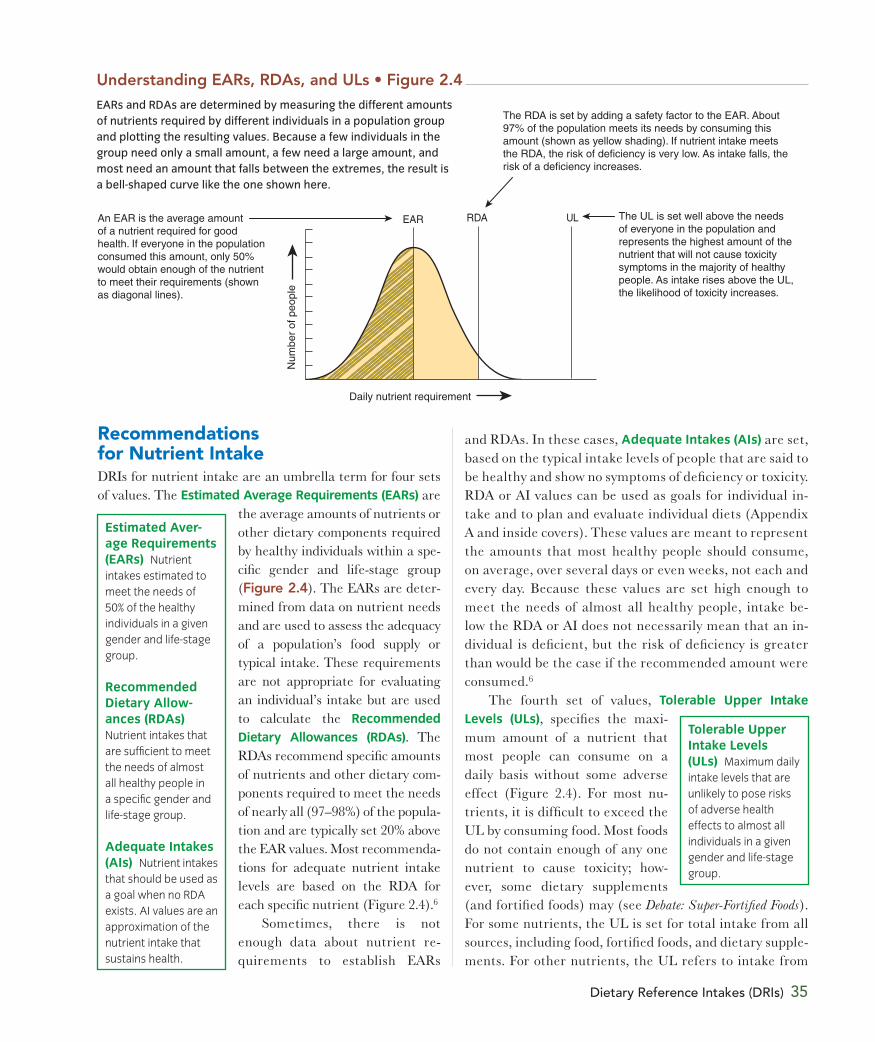
The RDA is set by adding a safety factor to the EAR. About97% of the population meets its needs by consuming thisamount (shown as yellow shading). If nutrient intake meets the RDA, the risk of deficiency is very low. As intake falls, therisk of a deficiency increases.
The UL is set well above the needsof everyone in the population andrepresents the highest amount of thenutrient that will not cause toxicitysymptoms in the majority of healthypeople. As intake rises above the UL,the likelihood of toxicity increases.
An EAR is the average amount of a nutrient required for goodhealth. If everyone in the populationconsumed this amount, only 50%would obtain enough of the nutrientto meet their requirements (shownas diagonal lines).
Tolerable Upper Intake Levels (ULs) Maximum daily intake levels that are unlikely to pose risks of adverse health effects to almost all individuals in a given gender and life-stage group.
EARs and RDAs are determined by measuring the different amounts of nutrients required by different individuals in a population group and plotting the resulting values. Because a few individuals in the group need only a small amount, a few need a large amount, and most need an amount that falls between the extremes, the result is a bell-shaped curve like the one shown here.
36 CHAPTER 2 Guidelines for a Healthy Diet
Debate Super-Fortified Foods: Are They a Healthy Addition to Your Diet?
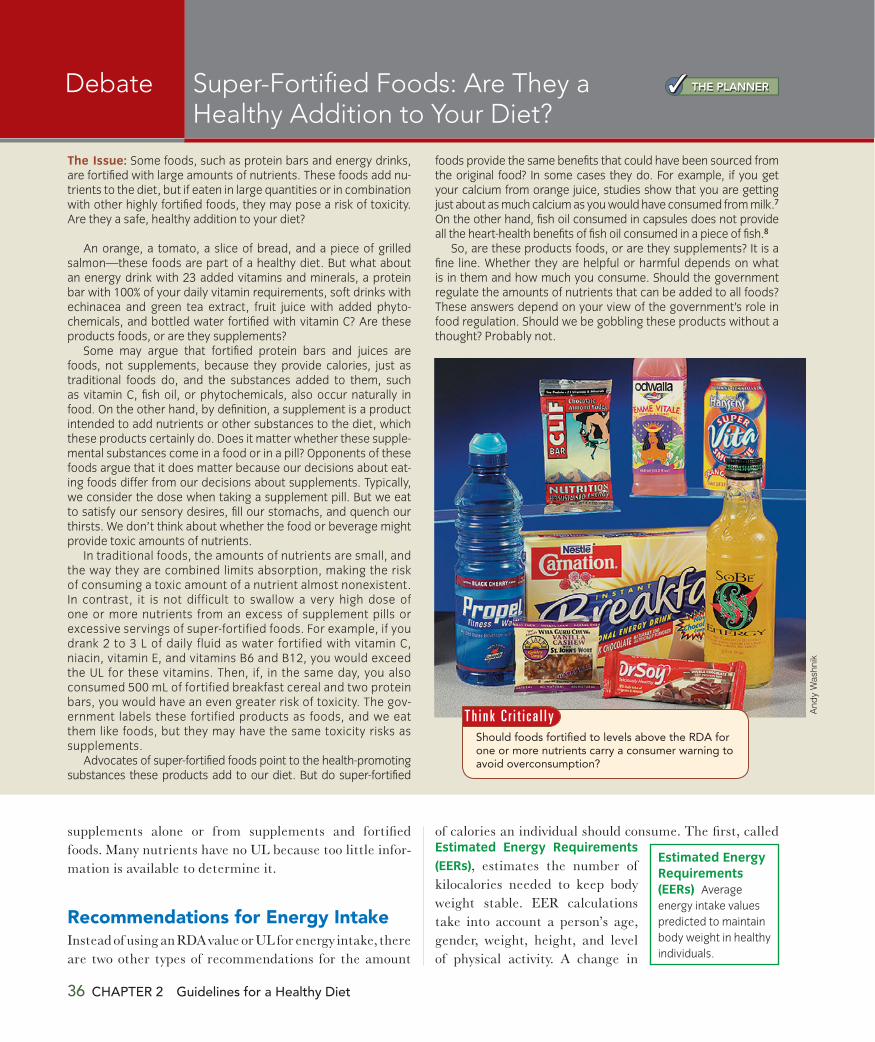
The Issue: Some foods, such as protein bars and energy drinks, are fortified with large amounts of nutrients. These foods add nu-trients to the diet, but if eaten in large quantities or in combination with other highly fortified foods, they may pose a risk of toxicity. Are they a safe, healthy addition to your diet?
An orange, a tomato, a slice of bread, and a piece of grilled salmon—these foods are part of a healthy diet. But what about an energy drink with 23 added vitamins and minerals, a protein bar with 100% of your daily vitamin requirements, soft drinks with echinacea and green tea extract, fruit juice with added phyto-chemicals, and bottled water fortified with vitamin C? Are these products foods, or are they supplements?
Some may argue that fortified protein bars and juices are foods, not supplements, because they provide calories, just as traditional foods do, and the substances added to them, such as vitamin C, fish oil, or phytochemicals, also occur naturally in food. On the other hand, by definition, a supplement is a product intended to add nutrients or other substances to the diet, which these products certainly do. Does it matter whether these supple-mental substances come in a food or in a pill? Opponents of these foods argue that it does matter because our decisions about eat-ing foods differ from our decisions about supplements. Typically, we consider the dose when taking a supplement pill. But we eat to satisfy our sensory desires, fill our stomachs, and quench our thirsts. We don’t think about whether the food or beverage might provide toxic amounts of nutrients.
In traditional foods, the amounts of nutrients are small, and the way they are combined limits absorption, making the risk of consuming a toxic amount of a nutrient almost nonexistent. In contrast, it is not difficult to swallow a very high dose of one or more nutrients from an excess of supplement pills or excessive servings of super-fortified foods. For example, if you drank 2 to 3 L of daily fluid as water fortified with vitamin C, niacin, vitamin E, and vitamins B6 and B12, you would exceed the UL for these vitamins. Then, if, in the same day, you also consumed 500 mL of fortified breakfast cereal and two protein bars, you would have an even greater risk of toxicity. The gov-ernment labels these fortified products as foods, and we eat them like foods, but they may have the same toxicity risks as supplements.
Advocates of super-fortified foods point to the health-promoting substances these products add to our diet. But do super-fortified
foods provide the same benefits that could have been sourced from the original food? In some cases they do. For example, if you get your calcium from orange juice, studies show that you are getting just about as much calcium as you would have consumed from milk.7 On the other hand, fish oil consumed in capsules does not provide all the heart-health benefits of fish oil consumed in a piece of fish.8
So, are these products foods, or are they supplements? It is a fine line. Whether they are helpful or harmful depends on what is in them and how much you consume. Should the government regulate the amounts of nutrients that can be added to all foods? These answers depend on your view of the government’s role in food regulation. Should we be gobbling these products without a thought? Probably not.
And
yW
ashn
ik
THE PLANNER✓✓
supplements alone or from supplements and fortified foods. Many nutrients have no UL because too little infor-mation is available to determine it.
Recommendations for Energy IntakeInstead of using an RDA value or UL for energy intake, there are two other types of recommendations for the amount
of calories an individual should consume. The first, called Estimated Energy Requirements (EERs), estimates the number of kilocalories needed to keep body weight stable. EER calculations take into account a person’s age, gender, weight, height, and level of physical activity. A change in
Estimated Energy Requirements (EERs) Average energy intake values predicted to maintain body weight in healthy individuals.
Should foods fortified to levels above the RDA for one or more nutrients carry a consumer warning to avoid overconsumption?
T h i n k C r i t i c a l l y
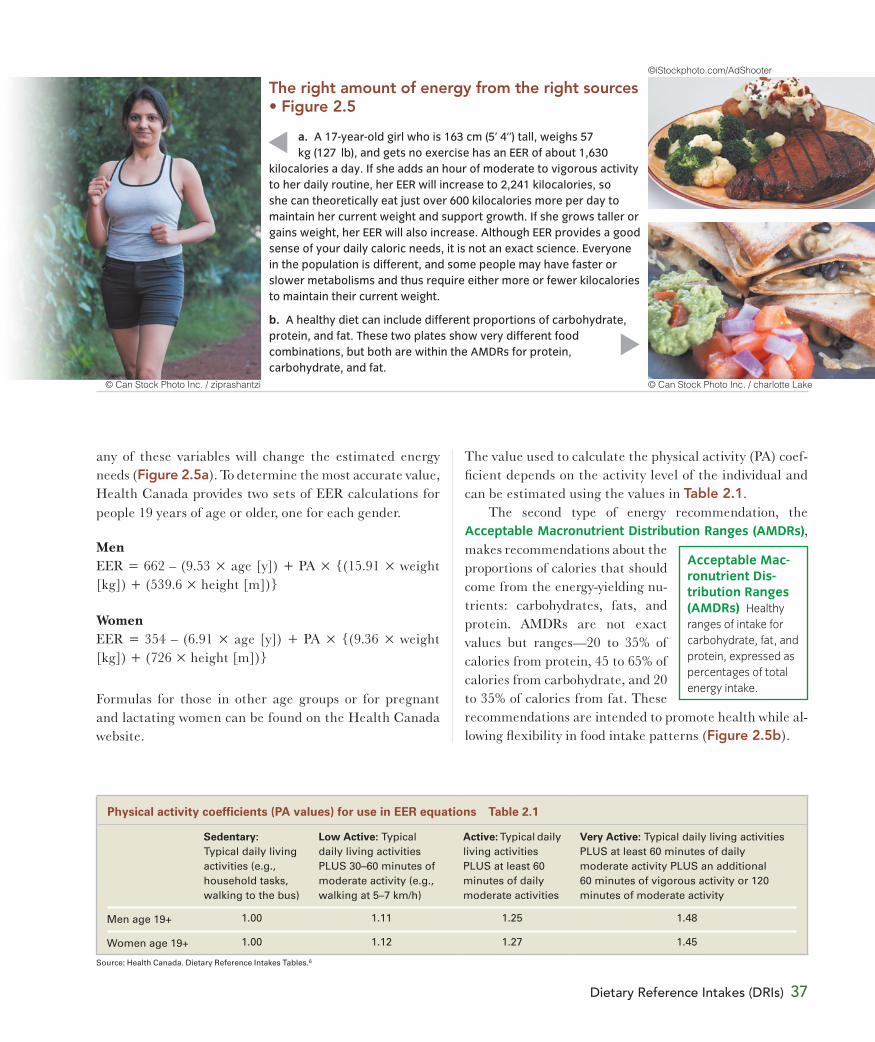
The right amount of energy from the right sources
a. A 17-year-old girl who is 163 cm (5’ 4’’) tall, weighs 57 kg (127 lb), and gets no exercise has an EER of about 1,630kilocalories a day. If she adds an hour of moderate to vigorous activityto her daily routine, her EER will increase to 2,241 kilocalories, soshe can theoretically eat just over 600 kilocalories more per day tomaintain her current weight and support growth. If she grows taller orgains weight, her EER will also increase. Although EER provides a goodsense of your daily caloric needs, it is not an exact science. Everyonein the population is different, and some people may have faster orslower metabolisms and thus require either more or fewer kilocaloriesto maintain their current weight.
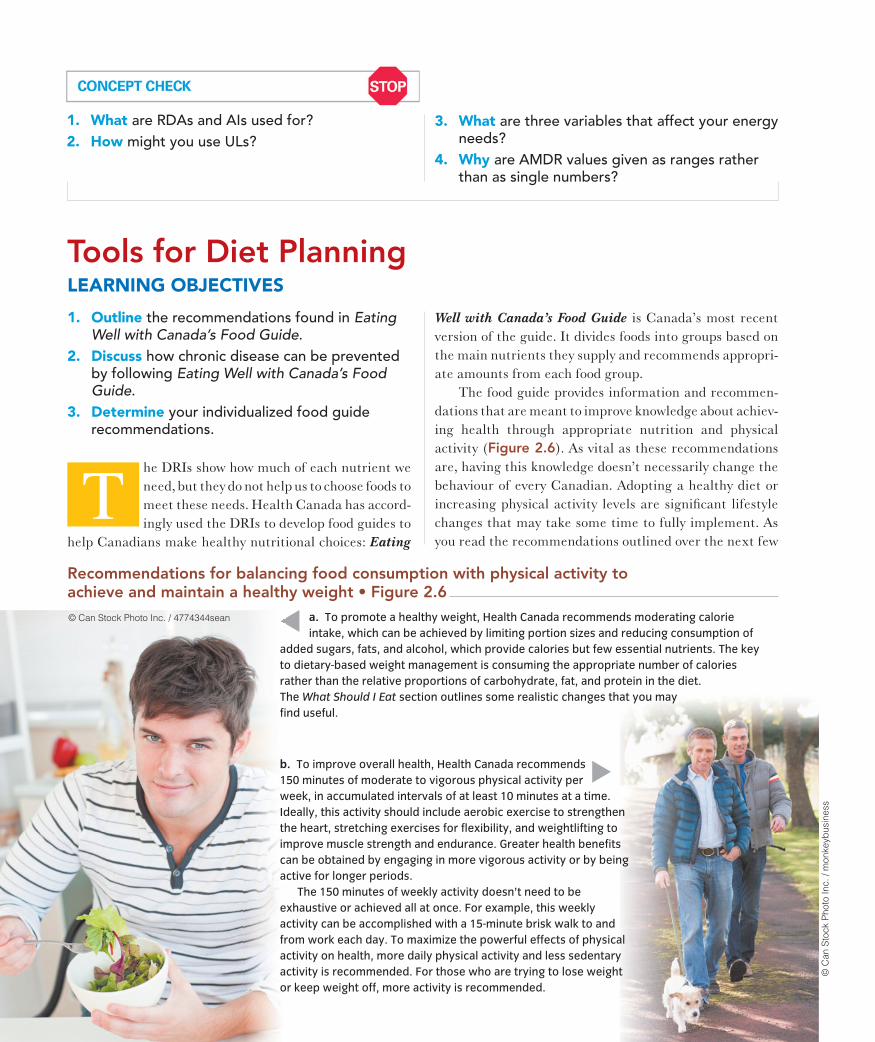
b. A healthy diet can include different proportions of carbohydrate,protein, and fat. These two plates show very different foodcombinations, but both are within the AMDRs for protein,carbohydrate, and fat.
©iStockphoto.com/AdShooter
© Can Stock Photo Inc. / ziprashantzi © Can Stock Photo Inc. / charlotte Lake
Dietary Reference Intakes (DRIs) 37
any of these variables will change the estimated energy needs ( ). To determine the most accurate value, Health Canada provides two sets of EER calculations for people 19 years of age or older, one for each gender.
MenEER = 662 – (9.53 × age [y]) + PA × {(15.91 × weight [kg]) + (539.6 × height [m])}
WomenEER = 354 – (6.91 × age [y]) + PA × {(9.36 × weight [kg]) + (726 × height [m])}
Formulas for those in other age groups or for pregnant and lactating women can be found on the Health Canada website.
Physical activity coefficients (PA values) for use in EER equations Table 2.1
Sedentary: Low Active: Active: Very Active:
The value used to calculate the physical activity (PA) coef-ficient depends on the activity level of the individual and can be estimated using the values in Table 2.1.
The second type of energy recommendation, the Acceptable Macronutrient Distribution Ranges (AMDRs), makes recommendations about the proportions of calories that should come from the energy-yielding nu-trients: carbohydrates, fats, and protein. AMDRs are not exact values but ranges—20 to 35% of calories from protein, 45 to 65% of calories from carbohydrate, and 20 to 35% of calories from fat. These recommendations are intended to promote health while al-lowing flexibility in food intake patterns ( ).
Acceptable Mac-ronutrient Dis-tribution Ranges (AMDRs) Healthy ranges of intake for carbohydrate, fat, and protein, expressed as percentages of total energy intake.
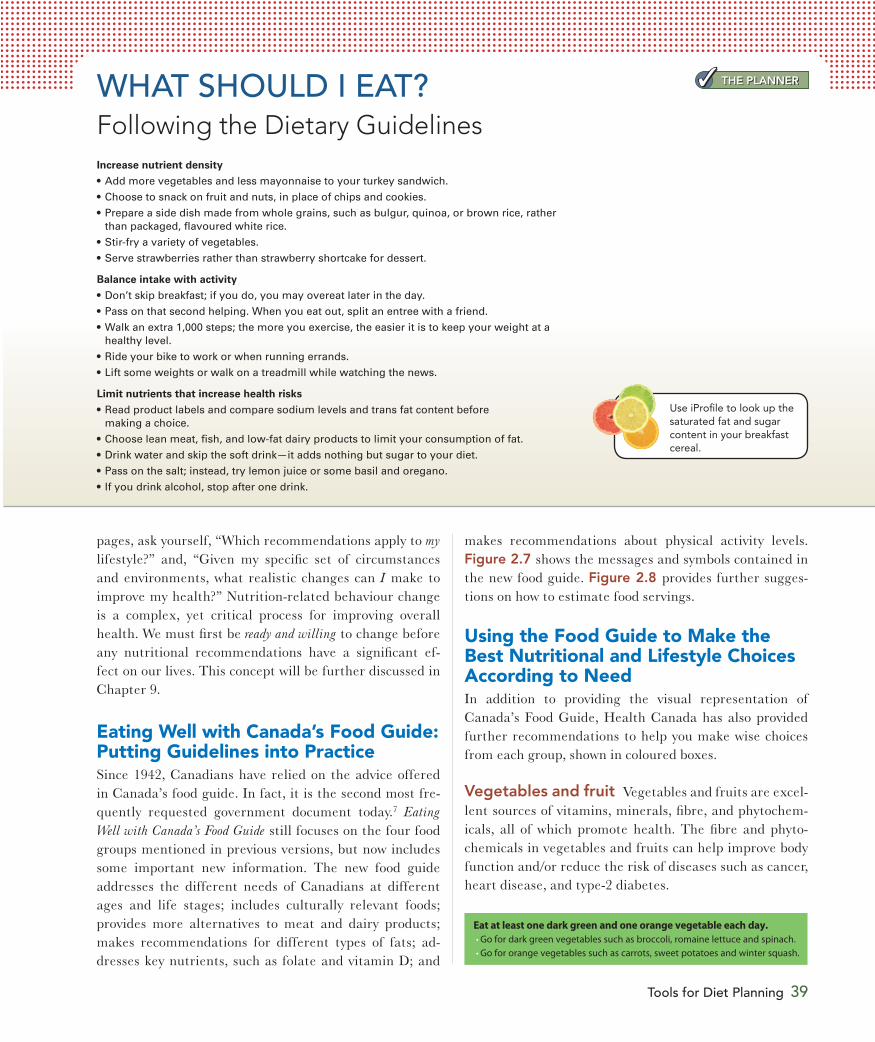
a. To promote a healthy weight, Health Canada recommends moderating calorie intake, which can be achieved by limiting portion sizes and reducing consumption ofadded sugars, fats, and alcohol, which provide calories but few essential nutrients. The keyto dietary-based weight management is consuming the appropriate number of caloriesrather than the relative proportions of carbohydrate, fat, and protein in the diet.The What Should I Eat section outlines some realistic changes that you mayfind useful.
b. To improve overall health, Health Canada recommends150 minutes of moderate to vigorous physical activity perweek, in accumulated intervals of at least 10 minutes at a time.Ideally, this activity should include aerobic exercise to strengthenthe heart, stretching exercises for flexibility, and weightlifting toimprove muscle strength and endurance. Greater health benefitscan be obtained by engaging in more vigorous activity or by beingactive for longer periods. The 150 minutes of weekly activity doesn’t need to beexhaustive or achieved all at once. For example, this weeklyactivity can be accomplished with a 15-minute brisk walk to andfrom work each day. To maximize the powerful effects of physicalactivity on health, more daily physical activity and less sedentaryactivity is recommended. For those who are trying to lose weightor keep weight off, more activity is recommended.
© C
an S
tock
Pho
to In
c. /
mon
keyb
usin
ess
© Can Stock Photo Inc. / 4774344sean
he DRIs show how much of each nutrient we need, but they do not help us to choose foods to meet these needs. Health Canada has accord-ingly used the DRIs to develop food guides to
help Canadians make healthy nutritional choices: Eating
Well with Canada’s Food Guide is Canada’s most recent version of the guide. It divides foods into groups based on the main nutrients they supply and recommends appropri-ate amounts from each food group.
The food guide provides information and recommen-dations that are meant to improve knowledge about achiev-ing health through appropriate nutrition and physical activity (Figure 2.6). As vital as these recommendations are, having this knowledge doesn’t necessarily change the behaviour of every Canadian. Adopting a healthy diet or increasing physical activity levels are significant lifestyle changes that may take some time to fully implement. As you read the recommendations outlined over the next few
1. What are RDAs and AIs used for?2. How might you use ULs?
3. What are three variables that affect your energy needs?
4. Why are AMDR values given as ranges rather than as single numbers?
Tools for Diet PlanningLEARNING OBJECTIVES
1. Outline the recommendations found in Eating Well with Canada’s Food Guide.
2. Discuss how chronic disease can be prevented by following Eating Well with Canada’s Food Guide.
3. Determine your individualized food guide recommendations.
TRecommendations for balancing food consumption with physical activity to
Tools for Diet Planning 39
pages, ask yourself, “Which recommendations apply to my lifestyle?” and, “Given my specific set of circumstances and environments, what realistic changes can I make to improve my health?” Nutrition-related behaviour change is a complex, yet critical process for improving overall health. We must first be ready and willing to change before any nutritional recommendations have a significant ef-fect on our lives. This concept will be further discussed in Chapter 9.
Eating Well with Canada’s Food Guide: Putting Guidelines into Practice Since 1942, Canadians have relied on the advice offered in Canada’s food guide. In fact, it is the second most fre-quently requested government document today.7 Eating
Well with Canada’s Food Guide still focuses on the four food groups mentioned in previous versions, but now includes some important new information. The new food guide addresses the different needs of Canadians at different ages and life stages; includes culturally relevant foods; provides more alternatives to meat and dairy products; makes recommendations for different types of fats; ad-dresses key nutrients, such as folate and vitamin D; and
WHAT SHOULD I EAT?Following the Dietary GuidelinesIncrease nutrient density
Balance intake with activity
Limit nutrients that increase health risks
THE PLANNER✓✓
makes recommendations about physical activity levels. Figure 2.7 shows the messages and symbols contained in the new food guide. Figure 2.8 provides further sugges-tions on how to estimate food servings.
Using the Food Guide to Make the Best Nutritional and Lifestyle Choices According to NeedIn addition to providing the visual representation of Canada’s Food Guide, Health Canada has also provided further recommendations to help you make wise choices from each group, shown in coloured boxes.
Vegetables and fruit Vegetables and fruits are excel-lent sources of vitamins, minerals, fibre, and phytochem-icals, all of which promote health. The fibre and phyto-chemicals in vegetables and fruits can help improve body function and/or reduce the risk of diseases such as cancer, heart disease, and type-2 diabetes.
Eat at least one dark green and one orange vegetable each day.Go for dark green vegetables such as broccoli, romaine lettuce and spinach.Go for orange vegetables such as carrots, sweet potatoes and winter squash.
Use iProfile to look up the saturated fat and sugar content in your breakfast cereal.
or couscous125 mL (1⁄ 2 cup)
Cold: 30 gHot: 175 mL (3⁄ 4 cup)
r175 g (3⁄ 4 cup)
Cheese50 g (1 1⁄ 2 oz.)
Yogurt175 g
cup)
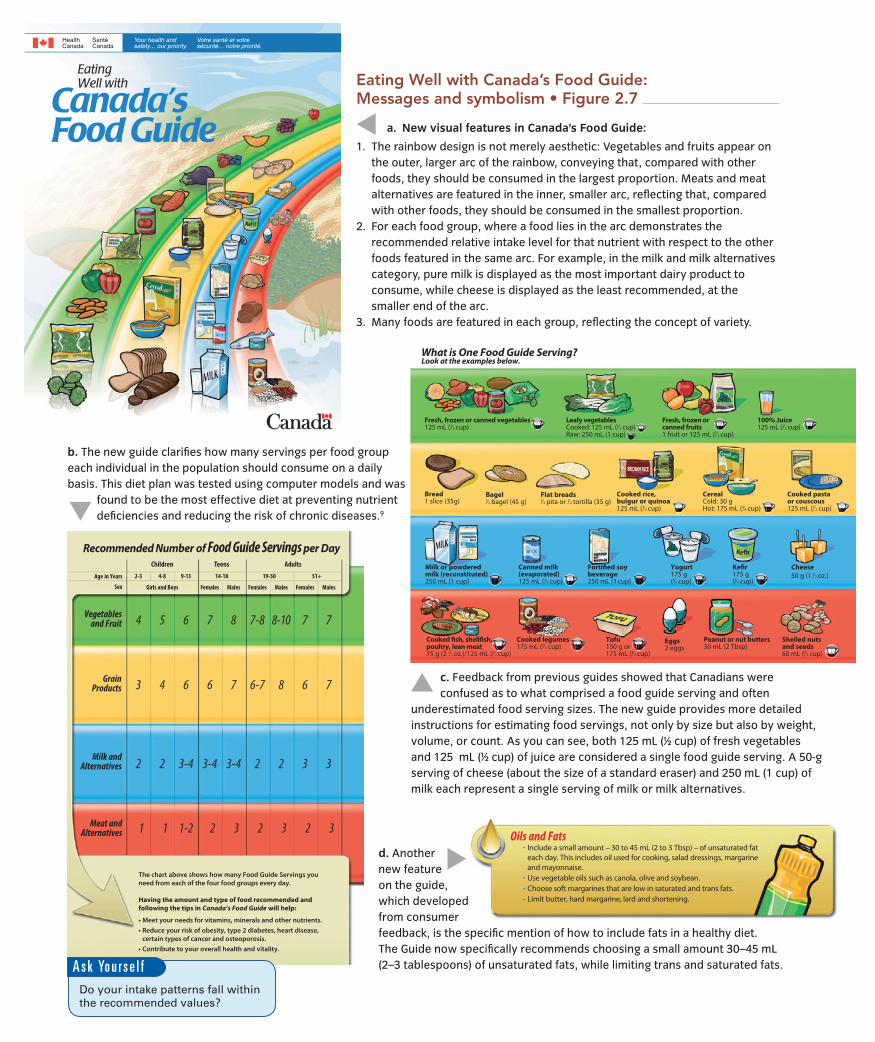
What is One Food Guide Serving? Look at the examples below.
Fresh, frozen or canned vegetables125 mL (1⁄ 2 cup)
Fresh, frozen orcanned fruits1 fruit or 125 mL (1⁄ 2 cup)
Leafy vegetablesCooked: 125 mL (1⁄ 2 cup) Raw: 250 mL (1 cup)
Bagel1⁄ 2 bagel (45 g)
Flat breads1⁄ 2 pita or 1⁄ 2 tortilla (35 g)
100% Juice125 mL (1⁄ 2 cup)
Cooked pasta Cooked rice, bulgur or quinoa125 mL (1⁄ 2 cup)
CerealBread1 slice (35g)
Milk or powdered milk (reconstituted) 250 mL (1 cup)
Canned milk (evaporated) 125 mL (1⁄ 2 cup)
soy beverage 250 mL (1 cup) (3⁄ 4
Tofu150 g or 175 mL (3⁄ 4 cup)
Eggs2 eggs
Cooked legumes175 mL (3⁄ 4 cup)
Cooked sh, , poultry, lean meat75 g (2 1⁄ 2 oz.)/125 mL (1⁄ 2 cup)
Shelled nuts and seeds60 mL (1⁄ 4 cup)
Peanut or nut butters 30 mL (2 Tbsp)
Recommended Number of Food Guide Servings per Day
Meat and Alternatives
Milk and Alternatives
Grain Products
selbategeVand Fruit
The chart above shows how many Food Guide Servings you need from each of the four food groups every day.
Having the amount and type of food recommended and following the tips in Canada’s Food Guide will help:
Meet your needs for vitamins, minerals and other nutrients. Reduce your risk of obesity, type 2 diabetes, heart disease, certain types of cancer and osteoporosis. Contribute to your overall health and vitality.
Age in Years
Sex
Children Teens Adults
2-3 4-8 9-13 14-18 19-50 51+
Girls and Boys Females Males Females Males Females Males
4 5 6 7 8 7-8 8-10 7 7
3 4 6 6 7 6-7 8 6 7
2 2 3-4 3-4 3-4 2 2 3 3
1 1 1-2 2 3 2 3 2 3
Include a small amount – 30 to 45 mL (2 to 3 Tbsp) – of unsaturated fateach day. This includes oil used for cooking, salad dressings, margarine
Use vegetable oils such as canola, olive and soybean.
Choose soft margarines that are low in saturated and trans fats.Limit butter, hard margarine, lard and shortening.
Oils and Fats
and mayonnaise.
d. Anothernew featureon the guide,which developedfrom consumerfeedback, is the specific mention of how to include fats in a healthy diet.The Guide now specifically recommends choosing a small amount 30–45 mL(2–3 tablespoons) of unsaturated fats, while limiting trans and saturated fats.
New visual features in Canada’s Food Guide:
1. The rainbow design is not merely aesthetic: Vegetables and fruits appear on the outer, larger arc of the rainbow, conveying that, compared with other foods, they should be consumed in the largest proportion. Meats and meat alternatives are featured in the inner, smaller arc, reflecting that, compared with other foods, they should be consumed in the smallest proportion.
For each food group, where a food lies in the arc demonstrates the recommended relative intake level for that nutrient with respect to the other foods featured in the same arc. For example, in the milk and milk alternatives category, pure milk is displayed as the most important dairy product to consume, while cheese is displayed as the least recommended, at the smaller end of the arc.
3. Many foods are featured in each group, reflecting the concept of variety.
a.
2.
b. The new guide clarifies how many servings per food groupeach individual in the population should consume on a dailybasis. This diet plan was tested using computer models and was found to be the most effective diet at preventing nutrient deficiencies and reducing the risk of chronic diseases.9
c. Feedback from previous guides showed that Canadians were confused as to what comprised a food guide serving and oftenunderestimated food serving sizes. The new guide provides more detailedinstructions for estimating food servings, not only by size but also by weight,volume, or count. As you can see, both 125 mL (½ cup) of fresh vegetablesand 125 mL (½ cup) of juice are considered a single food guide serving. A 50-gserving of cheese (about the size of a standard eraser) and 250 mL (1 cup) ofmilk each represent a single serving of milk or milk alternatives.
Eating Well with Canada’s Food Guide:
A s k Yo u r s e l fDo your intake patterns fall within the recommended values?
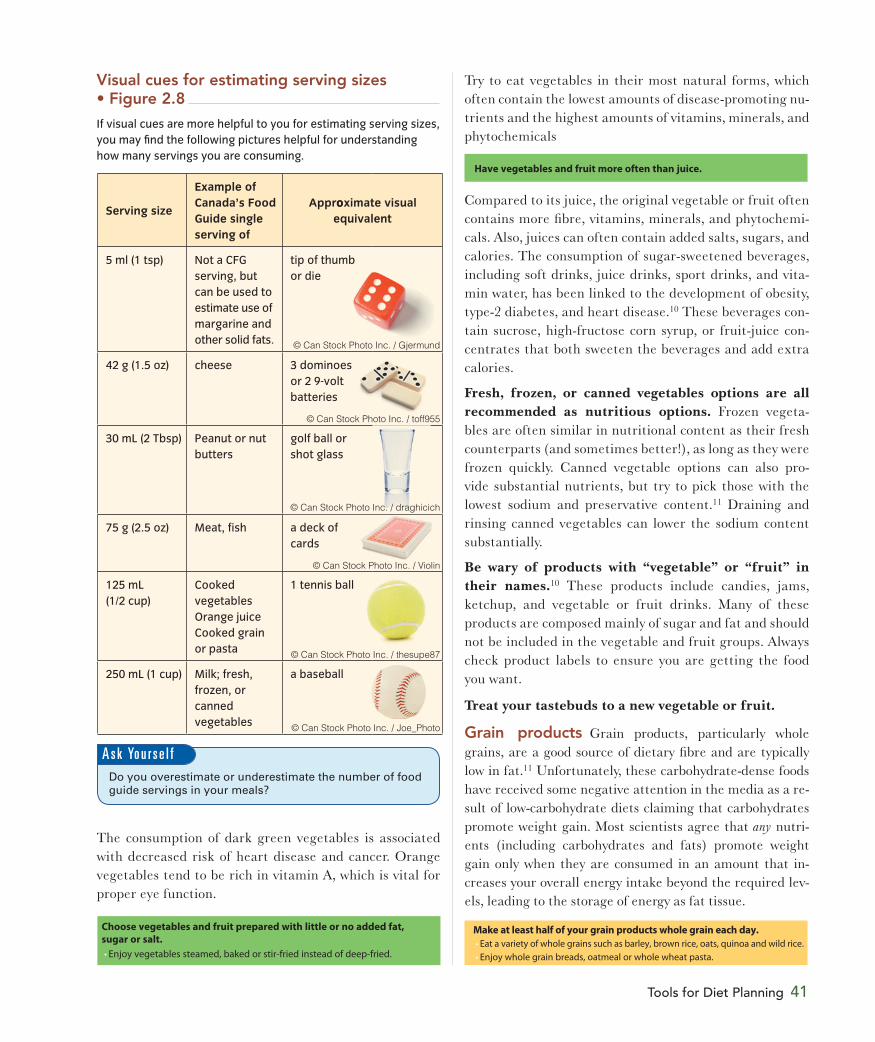
Visual cues for estimating serving sizes
If visual cues are more helpful to you for estimating serving sizes, you may find the following pictures helpful for understanding how many servings you are consuming.
The consumption of dark green vegetables is associated with decreased risk of heart disease and cancer. Orange vegetables tend to be rich in vitamin A, which is vital for proper eye function.
Try to eat vegetables in their most natural forms, which often contain the lowest amounts of disease-promoting nu-trients and the highest amounts of vitamins, minerals, and phytochemicals
Have vegetables and fruit more often than juice.
Compared to its juice, the original vegetable or fruit often contains more fibre, vitamins, minerals, and phytochemi-cals. Also, juices can often contain added salts, sugars, and calories. The consumption of sugar-sweetened beverages, including soft drinks, juice drinks, sport drinks, and vita-min water, has been linked to the development of obesity, type-2 diabetes, and heart disease.10 These beverages con-tain sucrose, high-fructose corn syrup, or fruit-juice con-centrates that both sweeten the beverages and add extra calories.
Fresh, frozen, or canned vegetables options are all recommended as nutritious options. Frozen vegeta-bles are often similar in nutritional content as their fresh counterparts (and sometimes better!), as long as they were frozen quickly. Canned vegetable options can also pro-vide substantial nutrients, but try to pick those with the lowest sodium and preservative content.11 Draining and rinsing canned vegetables can lower the sodium content substantially.
Be wary of products with “vegetable” or “fruit” in their names.10 These products include candies, jams, ketchup, and vegetable or fruit drinks. Many of these products are composed mainly of sugar and fat and should not be included in the vegetable and fruit groups. Always check product labels to ensure you are getting the food you want.
Treat your tastebuds to a new vegetable or fruit.
Grain products Grain products, particularly whole grains, are a good source of dietary fibre and are typically low in fat.11 Unfortunately, these carbohydrate-dense foods have received some negative attention in the media as a re-sult of low-carbohydrate diets claiming that carbohydrates promote weight gain. Most scientists agree that any nutri-ents (including carbohydrates and fats) promote weight gain only when they are consumed in an amount that in-creases your overall energy intake beyond the required lev-els, leading to the storage of energy as fat tissue.
Make at least half of your grain products whole grain each day.Eat a variety of whole grains such as barley, brown rice, oats, quinoa and wild rice.Enjoy whole grain breads, oatmeal or whole wheat pasta.
Tools for Diet Planning 41
A s k Yo u r s e l f
Choose vegetables and fruit prepared with little or no added fat, sugar or salt.
Enjoy vegetables steamed, baked or stir-fried instead of deep-fried.
Serving size
Example of Canada’s FoodGuide single serving of
Approximate visualoequivalent
5 ml (1 tsp) Not a CFGserving, but can be used to estimate use of margarine andother solid fats.
tip of thumb or die
42 g (1.5 oz) cheese 3 dominoes or 2 9-voltbatteries
30 mL (2 Tbsp) Peanut or nutbutters
golf ball or shot glass
75 g (2.5 oz) Meat, fish a deck of cards
125 mL (1/2 cup)
CookedvegetablesOrange juiceCooked grainor pasta
1 tennis ball
250 mL (1 cup) Milk; fresh,frozen, orcanned vegetables
a baseball
© Can Stock Photo Inc. / Gjermund
© Can Stock Photo Inc. / toff955
© Can Stock Photo Inc. / draghicich
© Can Stock Photo Inc. / Violin
© Can Stock Photo Inc. / thesupe87
© Can Stock Photo Inc. / Joe_Photo
42 CHAPTER 2 Guidelines for a Healthy Diet
milk alternative such as soy milk that has been fortified with these nutrients, keep in mind that they often sink to the bottom of the container. To improve your nutrient content of these beverages, shake them vigorously before using.
Select lower fat milk alternatives.Compare the Nutrition Facts table on yogurts or cheeses to make wise choices.
Choose lower-fat yogurts and cheeses with less than 20% milk fats.11 Use cream cheese, ice cream, coffee cream, whipping cream, and sour cream in modera-tion. These dairy products are often high in both fat and calories.
Meat and meat alternatives Meat and meat alter-natives are rich sources of protein, fats, and iron, and are a good source of many of the B vitamins that are essential for energy regulation. Many meat and meat alternative sources are dense in the above nutrients, so only a small amount of this food group is needed to satisfy your re-quirements. Another important reason not to over-con-sume meats is that their saturated fat content is high. A recent study found that as little as one daily serving of unprocessed meat was associated with a 13% increase in mortality risk, while processed meat, such as hot dogs and bacon, increased mortality risk by 20%. Conversely, replacing a serving of red meat with a meat alternative, such as nuts or leaner meats, reduced mortality risk significantly.11
Have meat alternatives such as beans, lentils and tofu often.
These meat alternatives are often inexpensive, high in fibre, low in fat, and dense in nutrients.
Select lean meat and alternatives prepared with little or no added fat or salt.Trim the visible fat from meats. Remove the skin on poultry. Use cooking methods such as roasting, baking or poaching that require little or no added fat.If you eat luncheon meats, sausages or prepackaged meats, choose those lower in salt (sodium) and fat.
To moderate your fat consumption, choose baking, broiling, and barbecuing as low-fat alternatives to frying or sautéing. You can also use a spray bottle full of veg-etable oil to grease your pan and minimize the use of fat.
Whole grains are associated with a decreased risk of heart disease and type-2 diabetes. The “white,” “bleached,” or “refined” grains you find in many baked goods do not pro-vide these same benefits.
Choose grain products that are lower in fat, sugar or salt.Compare the Nutrition Facts table on labels to make wise choices.Enjoy the true taste of grain products. When adding sauces or spreads, use small amounts.
Always check your labels! Even though a grain product may look brown, such as brown bread, it may just be its white counterpart that has been coloured with molasses. To be sure that you are buying whole grains, check that the first ingredients listed in your grain products include “whole wheat,” “whole oats,” “whole rye,” “whole grain corn,” “brown rice,” “wild rice,” or “oats.” You will find a detailed description of how to read food labels later in this chapter.
Limit cookies, cakes, pastries, and pies to special occasions. A healthy diet has room for these foods—but not too much—as they are not nutrient-dense foods and tend to be filled with added calories and fat.
Milk and milk alternatives Although some other food groups include a larger variety of foods, milk and milk alternatives have their own grouping because these foods are typically rich sources of two essential nutrients: calcium and vitamin D, which are vital for strong bones and teeth. Calcium is involved in numerous body process-es, such as muscle contraction, hormone secretion, and nerve conduction, to name a few. Vitamin D helps pro-mote strong bones and may have additional health ben-efits as well.
Drink skim, 1%, or 2% milk each day.Have 500 mL (2 cups) of milk every day for adequate vitamin D.Drink fortified soy beverages if you do not drink milk.
If you do not drink milk, perhaps because you are lactose-intolerant, try the alternatives to dairy products, which still provide the essential nutrients provided by milk. For example, canned salmon with bones is another rich source of calcium. Many fortified foods, such as breakfast cereal and almond, soy, or rice milks, often have added calcium and vitamin D. However, if you are drinking a
Tools for Diet Planning 43
multivitamin containing supplemental iron to meet their higher needs and 400 micrograms of folic acid to decrease the risk of neural tube defects in their children. The food guide further recommends increasing food intake by only
two or three food guide servings a day during pregnancy. Canadians over the age of 50 have an increased need for vitamin D, which will not be provided by following the food guide. Therefore, in addition to following the overall food guide recommendations, older adults should also supple-ment their diet with 400 international units (IU) of vita-min D per day.
Customizing your food guide The Health Canada website also provides the opportunity to cus-tomize your own food guide (Figure 2.10) by entering your gender and age group. After you learn your specific recommendations, you can then select healthy choices to satisfy those recommendations. Since the guide also focuses on physical activity, you can choose which ac-tivities to include to increase your daily energy expen-diture. Another helpful resource can be found on the Dietitians of Canada website (www.dietitians.ca). The Let’s Make a Deal feature allows consumers to select ap-propriate food choices for each meal from a selection of items that reflect the core values of Canada’s Food Guide. You can track your food choices and see how each measures up in terms of food guide servings. The web-site also offer links to delicious recipes featured in the menu-selecting tool.
As for sodium, a single serving of cold cuts can contain more than 1,000 mg, approximately half of the daily rec-ommended amount! Make sure to always check product labels for sodium content.
Eat at least two Food Guide Servings of fish each week.Choose fish such as char, herring, mackerel, salmon, sardines and trout.
Most fish, especially cold-water fish, are significant sources of omega-3 fatty acids, which are associated with improved heart health. On the other hand, large fishes, such as tuna, tend to concentrate heavy metals such as mercury, which is known to be toxic. Luckily, Health Canada states that most Canadians do not need to worry about excessive mercury consumption from fish sources because the types of fish typical in the Canadian diet are relatively low in mercury, while still providing good sources of essential fatty acids,12 These fish include pollock, salmon, smelt, rainbow trout, and many shellfish, such as clams and mussels. Conversely, frozen and fresh tuna, shark, swordfish, and orange roughy should be consumed less often because they provide the highest concentrations of mercury. Fortunately, most canned tuna uses younger tuna, which has had less time to concentrate heavy met-als. The exception is albacore tuna, which has a higher potential for mercury intake. Canada’s Food Guide ad-vises that children and pregnant women should limit its intake.
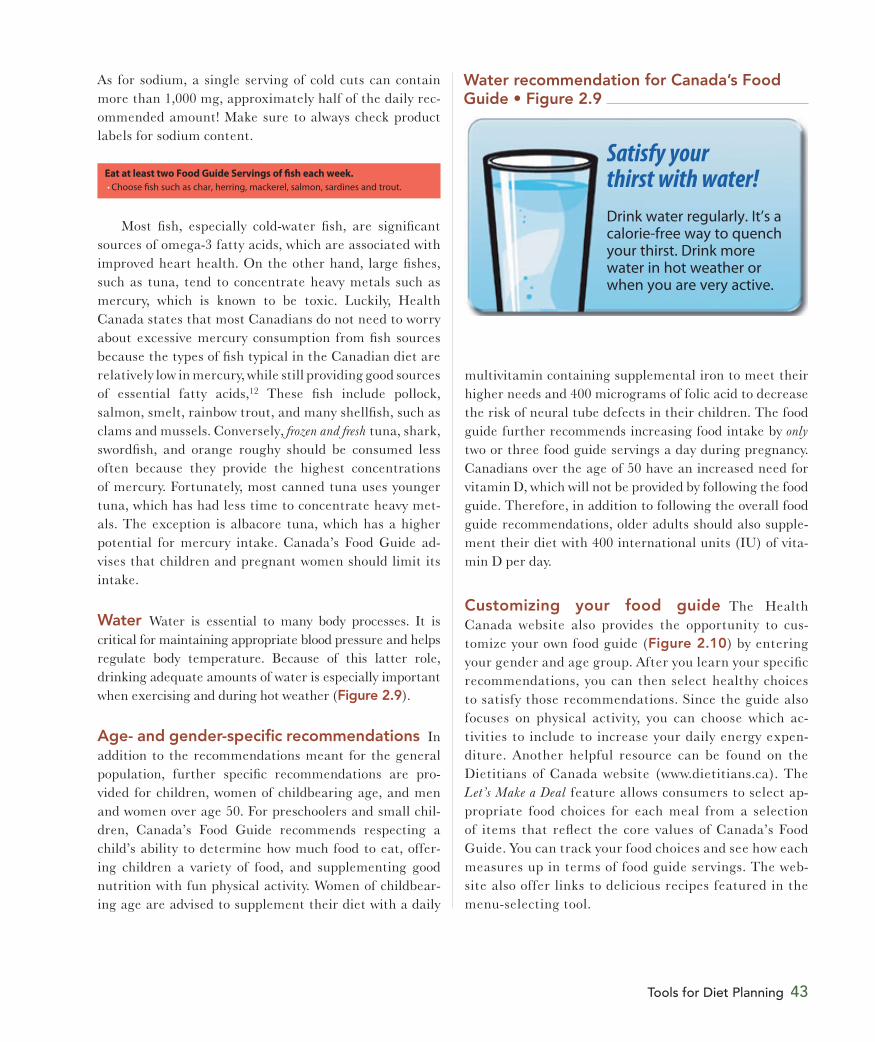
Water Water is essential to many body processes. It is critical for maintaining appropriate blood pressure and helps regulate body temperature. Because of this latter role, drinking adequate amounts of water is especially im portant when exercising and during hot weather (Figure 2.9).
Age- and gender-specific recommendations In addition to the recommendations meant for the general population, further specific recommendations are pro-vided for children, women of childbearing age, and men and women over age 50. For preschoolers and small chil-dren, Canada’s Food Guide recommends respecting a child’s ability to determine how much food to eat, offer-ing children a variety of food, and supplementing good nutrition with fun physical activity. Women of childbear-ing age are advised to supplement their diet with a daily
Satisfy your thirst with water!Drink water regularly. It’s a calorie-free way to quench your thirst. Drink more water in hot weather or when you are very active.
Water recommendation for Canada’s Food
44 CHAPTER 2 Guidelines for a Healthy Diet
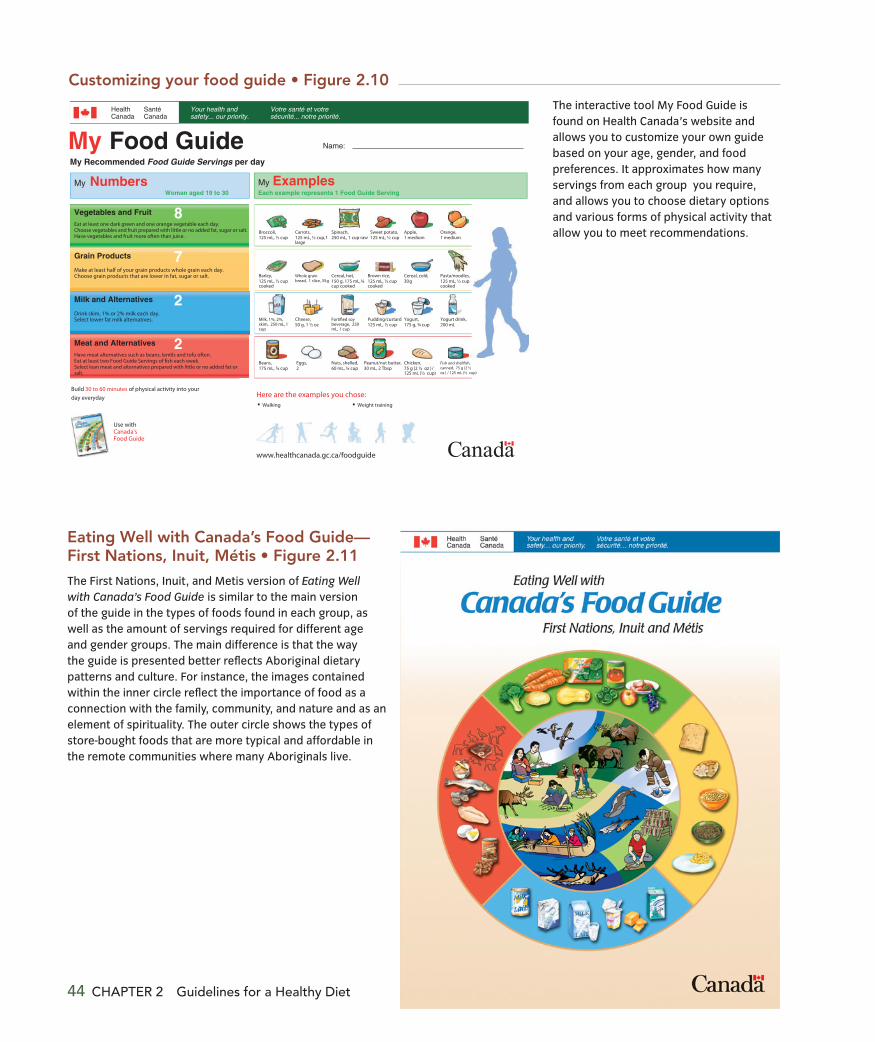
The First Nations, Inuit, and Metis version of Eating Well with Canada’s Food Guide is similar to the main version of the guide in the types of foods found in each group, as well as the amount of servings required for different age and gender groups. The main difference is that the way the guide is presented better reflects Aboriginal dietary patterns and culture. For instance, the images contained within the inner circle reflect the importance of food as a connection with the family, community, and nature and as an element of spirituality. The outer circle shows the types of store-bought foods that are more typical and affordable in the remote communities where many Aboriginals live.
The interactive tool My Food Guide is found on Health Canada’s website and allows you to customize your own guide based on your age, gender, and food preferences. It approximates how many servings from each group you require, and allows you to choose dietary options and various forms of physical activity that allow you to meet recommendations.
HealthCanada
SantéCanada
Your health andsafety... our priority.
Votre santé et votresécurité... notre priorité.
My Food Guide Name:
My Recommended Food Guide Servings per day
My NumbersWoman aged 19 to 30
My ExamplesEach example represents 1 Food Guide Serving
Vegetables and Fruit
Grain Products
Milk and Alternatives
Meat and Alternatives
8
7
2
2
anadaC
Food and Natural Health Product Labels 45
Eating Well with Canada’s Food Guide—First Nations, Inuit, and Métis Many different food guides have been produced over the years, and slightly different versions have been used in different parts of Canada, reflecting the specific food consumption patterns and nutritional needs particular to different regions. For the first time ever, a national guide specifically speaks to First Nations, Inuit, and Métis (Figure 2.11). This spe-cifically tailored guide is meant to more accurately reflect the customs, traditions, and food choices that are relevant to Canada’s Aboriginal populations and their tendency to consume store-bought foods, often because these foods are more readily available in the remote areas where many Aboriginal people live. Also, the graphics and content are specifically tailored to appeal to these populations. This version of Canada’s Food Guide is available in Cree, Ojibwe, and Inuktitut.
1. How is Eating Well with Canada’s Food Guide related to the DRIs?
2. What is the significance of the specific rainbow design of Canada’s Food Guide?
3. How many servings of grain product do you require each day? How many would be recom-mended if you were of the opposite gender?
LEARNING OBJECTIVES
1. Discuss how the information on food labels can help you choose a healthy diet.
2. Determine whether a food is high or low in fibre, trans fat, and kilocalories.
3. Explain how the order of ingredients on a food label is determined.
ow do you know whether your frozen entree is a good source of vitamin C, how much fibre your breakfast cereal provides, or the amount of calcium in your daily vitamin/mineral sup-
plement? You can find this information on food and sup-plement labels.
Food and Natural Health Product Labels
H
Food LabelsFood labels are designed to help consumers make healthy food choices by providing information about the nutrient composition of a food and how that food fits into the overall diet (Figure 2.12). Federal regulations control what can and cannot appear on a food label and what must appear on it. As of December 2007, Canadian manufacturers of prepackaged foods are required to conform to a set of new and very strict labelling rules—some of the strictest in the world. These regulations are designed to help consumers compare the nutritional quality of different products; shop for special diets, such as those required for people who have diabetes; and regulate intake of specific nutrients.13 Knowing how to interpret the information on these labels can help you choose a healthy diet. Another major aim
46 CHAPTER 2 Guidelines for a Healthy Diet
NET WT:
156gDISTRIBUTED BY: GENCO EAST, 100 RT. A, MAINSTREET PA
DINNERDINNERDINNER
FOODS
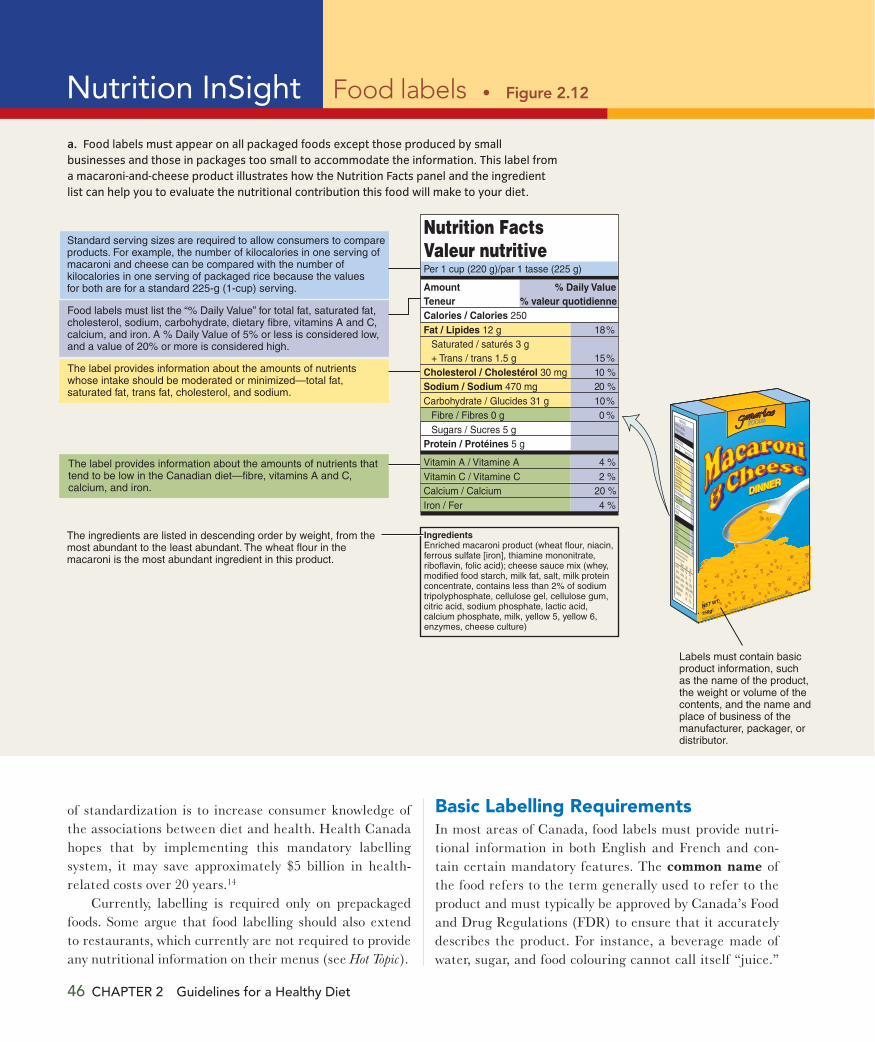
Labels must contain basicproduct information, suchas the name of the product,the weight or volume of thecontents, and the name andplace of business of themanufacturer, packager, ordistributor.
Standard serving sizes are required to allow consumers to compareproducts. For example, the number of kilocalories in one serving ofmacaroni and cheese can be compared with the number ofkilocalories in one serving of packaged rice because the valuesfor both are for a standard 225-g (1-cup) serving.
The label provides information about the amounts of nutrientswhose intake should be moderated or minimized—total fat,saturated fat, trans fat, cholesterol, and sodium.
The ingredients are listed in descending order by weight, from themost abundant to the least abundant. The wheat flour in themacaroni is the most abundant ingredient in this product.
Food labels must list the “% Daily Value” for total fat, saturated fat,cholesterol, sodium, carbohydrate, dietary fibre, vitamins A and C,calcium, and iron. A % Daily Value of 5% or less is considered low,and a value of 20% or more is considered high.
The label provides information about the amounts of nutrients thattend to be low in the Canadian diet—fibre, vitamins A and C,calcium, and iron.
Ingredients Enriched macaroni product (wheat flour, niacin,ferrous sulfate [iron], thiamine mononitrate,riboflavin, folic acid); cheese sauce mix (whey,modified food starch, milk fat, salt, milk proteinconcentrate, contains less than 2% of sodiumtripolyphosphate, cellulose gel, cellulose gum,citric acid, sodium phosphate, lactic acid,calcium phosphate, milk, yellow 5, yellow 6,enzymes, cheese culture)
Nutrition FactsValeur nutritive
AmountTeneur
% Daily Value% valeur quotidienne
Calories / Calories 250Fat / Lipides 12 g 18%
Saturated / saturés 3 g + Trans / trans 1.5 g 15%
Cholesterol / Cholestérol 30 mg 10 %Sodium / Sodium 470 mg 20 %Carbohydrate / Glucides 31 g 10%
Fibre / Fibres 0 g 0 %Sugars / Sucres 5 g
Protein / Protéines 5 g
Vitamin A / Vitamine A 4 %Vitamin C / Vitamine C 2 %Calcium / Calcium 20 %Iron / Fer 4 %
Per 1 cup (220 g)/par 1 tasse (225 g)
a. Food labels must appear on all packaged foods except those produced by smallbusinesses and those in packages too small to accommodate the information. This label froma macaroni-and-cheese product illustrates how the Nutrition Facts panel and the ingredientlist can help you to evaluate the nutritional contribution this food will make to your diet.
of standardization is to increase consumer knowledge of the associations between diet and health. Health Canada hopes that by implementing this mandatory labelling system, it may save approximately $5 billion in health- related costs over 20 years.14
Currently, labelling is required only on prepackaged foods. Some argue that food labelling should also extend to restaurants, which currently are not required to provide any nutritional information on their menus (see Hot Topic).
Basic Labelling RequirementsIn most areas of Canada, food labels must provide nutri-tional information in both English and French and con-tain certain mandatory features. The common name of the food refers to the term generally used to refer to the product and must typically be approved by Canada’s Food and Drug Regulations (FDR) to ensure that it accurately describes the product. For instance, a beverage made of water, sugar, and food colouring cannot call itself “juice.”
Nutrition InSight Food labels

c. Food served in restaurants and other eatingestablishments, such as delicatessens and bakeries,does not require labelling. However, if a claim is madeabout a food’s nutritional content or health benefits,such as being “low-fat” or “heart-healthy,” the eatingestablishment must provide nutritional informationabout that food, if requested.
b. Raw fruits, vegetables, fish, meat, and poultryare not required to carry individual labels.
© C
an S
tock
Pho
to In
c. /
pem
otre
t
© Can Stock Photo Inc. / dotshock
Food and Natural Health Product Labels 47
The durable life date of the product is the amount of time that a product is anticipated to retain its freshness, taste, quality, and nutritional content.
Nutrition facts All food labels must contain a Nutrition Facts panel (Figure 2.12). This section of the label shows the type and quantity of nutrients in a standard serving. The serving size on the label is followed by the number of servings per container and the total kilocalories. This is an
The net quantity declaration must accurately reflect the weight, volume, measure, or numerical count of the prod-uct, and it must now be expressed in metric units. Previous labels were often expressed in different measures, leading to confusion. The label must also include the name and address of the company that has either produced or manu-factured the prepackaged food so consumers can contact the company if they have any concerns or questions about the product.
THE PLANNER✓✓
48 CHAPTER 2 Guidelines for a Healthy Diet
AP
Pho
to/M
ark
Lenn
ihan
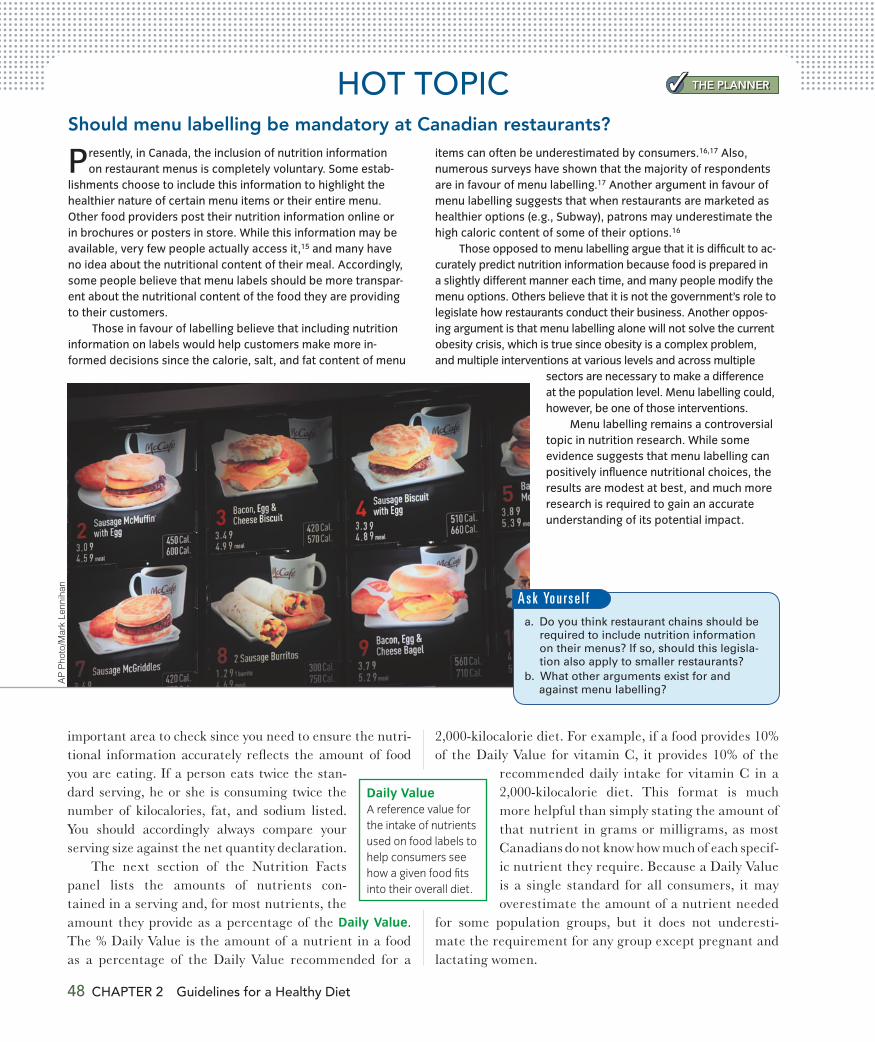
Presently, in Canada, the inclusion of nutrition information on restaurant menus is completely voluntary. Some estab-
lishments choose to include this information to highlight the healthier nature of certain menu items or their entire menu. Other food providers post their nutrition information online or in brochures or posters in store. While this information may be available, very few people actually access it,15 and many have no idea about the nutritional content of their meal. Accordingly, some people believe that menu labels should be more transpar-ent about the nutritional content of the food they are providing to their customers.
Those in favour of labelling believe that including nutrition information on labels would help customers make more in-formed decisions since the calorie, salt, and fat content of menu
HOT TOPICShould menu labelling be mandatory at Canadian restaurants?
items can often be underestimated by consumers.16,17 Also, numerous surveys have shown that the majority of respondents are in favour of menu labelling.17 Another argument in favour of menu labelling suggests that when restaurants are marketed as healthier options (e.g., Subway), patrons may underestimate the high caloric content of some of their options.16
Those opposed to menu labelling argue that it is difficult to ac-curately predict nutrition information because food is prepared in a slightly different manner each time, and many people modify the menu options. Others believe that it is not the government’s role to legislate how restaurants conduct their business. Another oppos-ing argument is that menu labelling alone will not solve the current obesity crisis, which is true since obesity is a complex problem, and multiple interventions at various levels and across multiple
sectors are necessary to make a difference at the population level. Menu labelling could, however, be one of those interventions.
Menu labelling remains a controversial topic in nutrition research. While some evidence suggests that menu labelling can positively influence nutritional choices, the results are modest at best, and much more research is required to gain an accurate understanding of its potential impact.
important area to check since you need to ensure the nutri-tional information accurately reflects the amount of food you are eating. If a person eats twice the stan-dard serving, he or she is consuming twice the number of kilocalories, fat, and sodium listed. You should accordingly always compare your serving size against the net quantity declaration.
The next section of the Nutrition Facts panel lists the amounts of nutrients con-tained in a serving and, for most nutrients, the amount they provide as a percentage of the Daily Value. The % Daily Value is the amount of a nutrient in a food as a percentage of the Daily Value recommended for a
2,000-kilocalorie diet. For example, if a food provides 10% of the Daily Value for vitamin C, it provides 10% of the
recommended daily intake for vitamin C in a 2,000-kilocalorie diet. This format is much more helpful than simply stating the amount of that nutrient in grams or milligrams, as most Canadians do not know how much of each specif-ic nutrient they require. Because a Daily Value is a single standard for all consumers, it may overestimate the amount of a nutrient needed
for some population groups, but it does not underesti-mate the requirement for any group except pregnant and lactating women.
A s k Yo u r s e l f
Daily Value A reference value for the intake of nutrients used on food labels to help consumers see how a given food fits into their overall diet.
THE PLANNER✓✓
Food and Natural Health Product Labels 49
Nutrient content and health claims Looking for low-fat or high-fibre foods (see Thinking It Through)? You may not even need to look at the Nutrition Facts. Food labels often contain nutrient content claims, which are statements that highlight specific charac-teristics of a product that might be of interest to con-sumers, such as “fat free” or “low sodium.” Standard definitions for these descriptors have been established by Canada’s Food and Drug Regulations (FDR) (see Table 2.2). Because of the importance of many types of foods in disease prevention, food labels are also per-mitted to include some diet-related health claims. Health claims refer to a relationship between a nutri-ent, food, food component, or dietary supplement and the reduced risk of a disease or health-related condi-tion. All health claims must be truthful and must not mislead or deceive consumers. There are two main types of diet-related health claims: disease-reduction
Ingredient list Do you want to know exactly what goes into your food? The ingredient list is the place to look. The ingredient list presents the contents of the product in the order of their prominence by weight. A good rule of thumb is to check the first three ingredients, which are the most abundant ingredients in the product. If the first three ingredients are sugar, glucose, fructose, high-fructose corn syrup, honey, molasses, or the like, you know that the product contains mostly simple sugars. The ingredient list can also be very helpful to consumers who are allergic to nuts, who want to avoid animal prod-ucts, or who are simply curious about the composition of the food they eat.
An ingredient list is required on all products contain-ing more than one ingredient and is optional on products that contain a single ingredient. Food additives, including food colours and flavourings, must be listed among the ingredients.
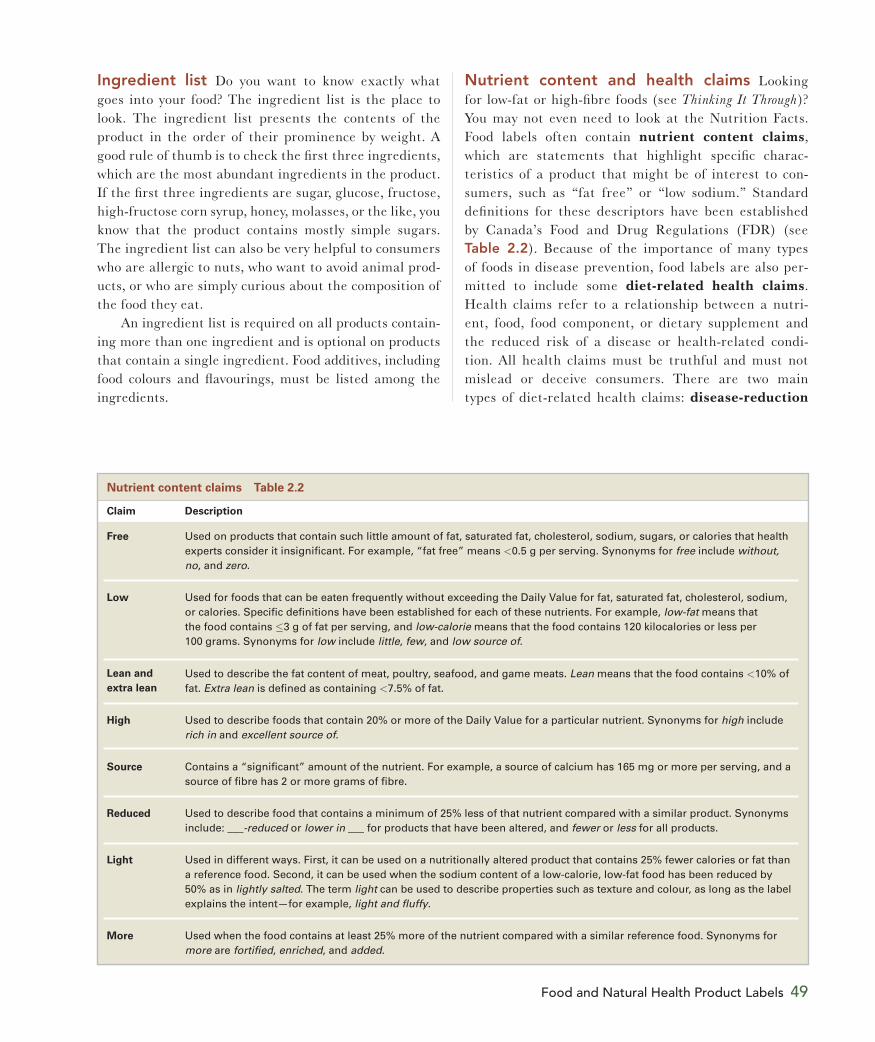
Claim Description
Free Used on products that contain such little amount of fat, saturated fat, cholesterol, sodium, sugars, or calories that health experts consider it insignificant. For example, “fat free” means 0.5 g per serving. Synonyms for free include without, no, and zero.
Low Used for foods that can be eaten frequently without exceeding the Daily Value for fat, saturated fat, cholesterol, sodium, or calories. Specific definitions have been established for each of these nutrients. For example, low-fat means that the food contains 3 g of fat per serving, and low-calorie means that the food contains 120 kilocalories or less per 100 grams. Synonyms for low include little, few, and low source of.
Lean and
extra lean
Used to describe the fat content of meat, poultry, seafood, and game meats. Lean means that the food contains 10% of fat. Extra lean is defined as containing 7.5% of fat.
High Used to describe foods that contain 20% or more of the Daily Value for a particular nutrient. Synonyms for high include rich in and excellent source of.
Source Contains a “significant” amount of the nutrient. For example, a source of calcium has 165 mg or more per serving, and a source of fibre has 2 or more grams of fibre.
Reduced Used to describe food that contains a minimum of 25% less of that nutrient compared with a similar product. Synonyms include: ___-reduced or lower in ___ for products that have been altered, and fewer or less for all products.
Light Used in different ways. First, it can be used on a nutritionally altered product that contains 25% fewer calories or fat than a reference food. Second, it can be used when the sodium content of a low-calorie, low-fat food has been reduced by 50% as in lightly salted. The term light can be used to describe properties such as texture and colour, as long as the label explains the intent—for example, light and fluffy.
More Used when the food contains at least 25% more of the nutrient compared with a similar reference food. Synonyms for more are fortified, enriched, and added.
Nutrient content claims Table 2.2
50 CHAPTER 2 Guidelines for a Healthy Diet
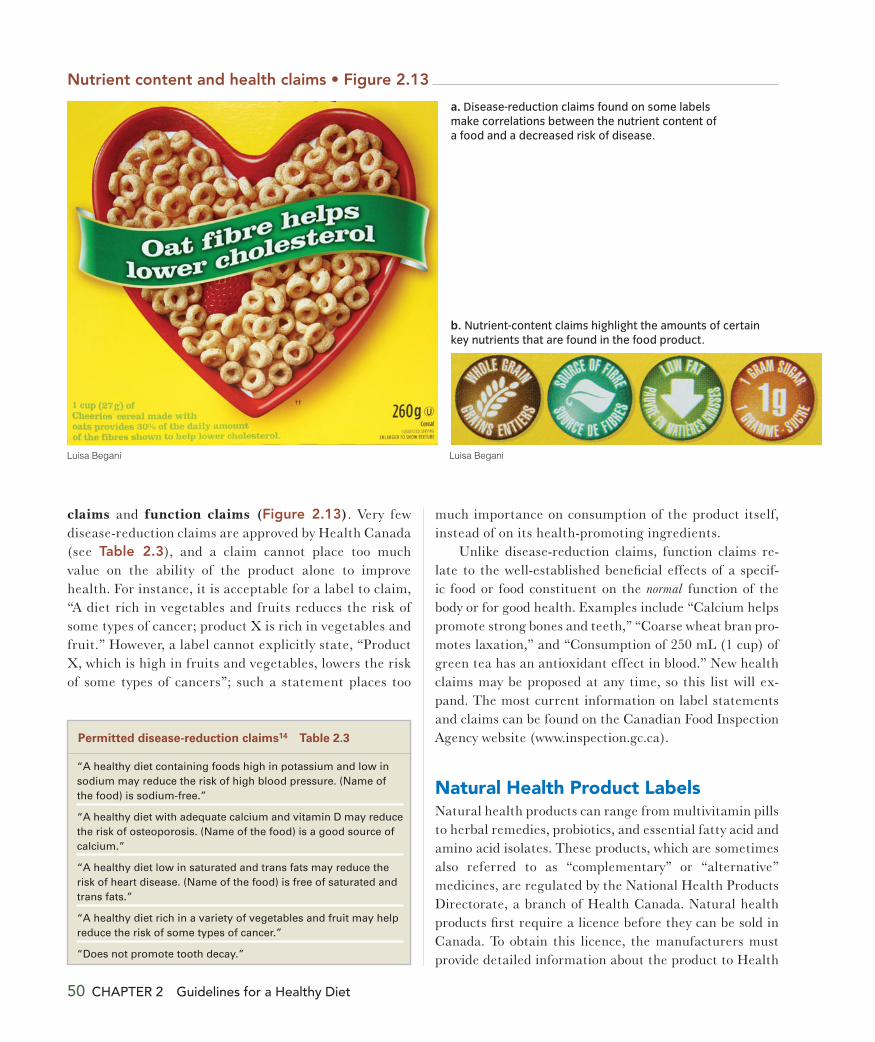
claims and function claims (Figure 2.13). Very few disease-reduction claims are approved by Health Canada (see Table 2.3), and a claim cannot place too much value on the ability of the product alone to improve health. For instance, it is acceptable for a label to claim, “A diet rich in vegetables and fruits reduces the risk of some types of cancer; product X is rich in vegetables and fruit.” However, a label cannot explicitly state, “Product X, which is high in fruits and vegetables, lowers the risk of some types of cancers”; such a statement places too
much importance on consumption of the product itself, instead of on its health-promoting ingredients.
Unlike disease-reduction claims, function claims re-late to the well-established beneficial effects of a specif-ic food or food constituent on the normal function of the body or for good health. Examples include “Calcium helps promote strong bones and teeth,” “Coarse wheat bran pro-motes laxation,” and “Consumption of 250 mL (1 cup) of green tea has an antioxidant effect in blood.” New health claims may be proposed at any time, so this list will ex-pand. The most current information on label statements and claims can be found on the Canadian Food Inspection Agency website (www.inspection.gc.ca).
Natural Health Product LabelsNatural health products can range from multivitamin pills to herbal remedies, probiotics, and essential fatty acid and amino acid isolates. These products, which are sometimes also referred to as “complementary” or “alternative” medicines, are regulated by the National Health Products Directorate, a branch of Health Canada. Natural health products first require a licence before they can be sold in Canada. To obtain this licence, the manufacturers must provide detailed information about the product to Health
Permitted disease-reduction claims14 Table 2.3
“A healthy diet containing foods high in potassium and low in sodium may reduce the risk of high blood pressure. (Name of the food) is sodium-free.”
“A healthy diet with adequate calcium and vitamin D may reduce the risk of osteoporosis. (Name of the food) is a good source of calcium.”
“A healthy diet low in saturated and trans fats may reduce the risk of heart disease. (Name of the food) is free of saturated and trans fats.”
“A healthy diet rich in a variety of vegetables and fruit may help reduce the risk of some types of cancer.”
“Does not promote tooth decay.”
Luisa Begani Luisa Begani
b. Nutrient-content claims highlight the amounts of certain key nutrients that are found in the food product.
a. Disease-reduction claims found on some labels make correlations between the nutrient content of a food and a decreased risk of disease.
THINKING IT THROUGHUsing Food Labels to Make Healthy Choices
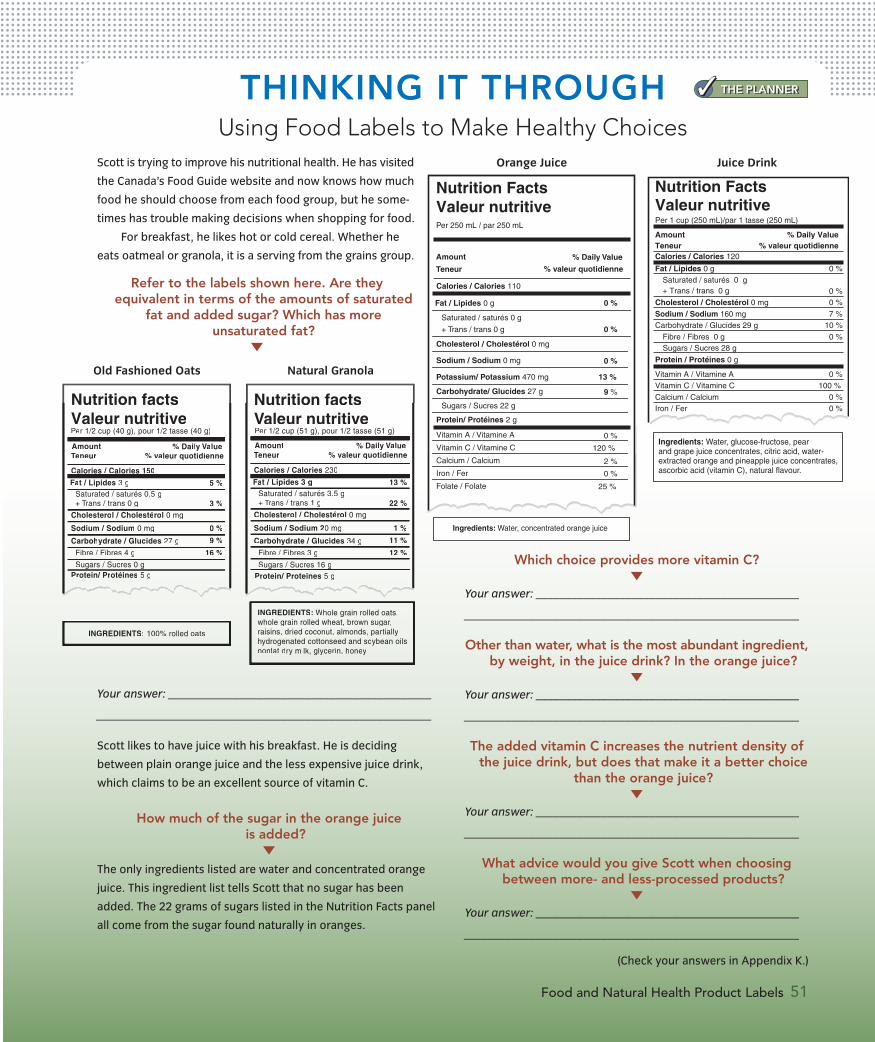
Scott is trying to improve his nutritional health. He has visited
the Canada’s Food Guide website and now knows how much
food he should choose from each food group, but he some-
times has trouble making decisions when shopping for food.
For breakfast, he likes hot or cold cereal. Whether he
eats oatmeal or granola, it is a serving from the grains group.
Refer to the labels shown here. Are they equivalent in terms of the amounts of saturated
fat and added sugar? Which has more unsaturated fat?
▼
Your answer: ____________________________________________
________________________________________________________
Scott likes to have juice with his breakfast. He is deciding
between plain orange juice and the less expensive juice drink,
which claims to be an excellent source of vitamin C.
How much of the sugar in the orange juice is added?
▼
The only ingredients listed are water and concentrated orange
juice. This ingredient list tells Scott that no sugar has been
added. The 22 grams of sugars listed in the Nutrition Facts panel
all come from the sugar found naturally in oranges.
Nutrition factsNutrition factsValeur nutritivePer 1/2 cup (40 g), pour 1/2 tasse (40 g)
Amount % Daily Value
5 %
3 %
0 %
9 %
16 %
% valeur quotidienneTeneur
Calories / Calories 150
Cholesterol / Cholestérol 0 mg
Sodium / Sodium 0 mg
Carbohydrate / Glucides 27 g
Protein/ Protéines 5 g
Fat / Lipides 3 gSaturated / saturés 0.5 g+ Trans / trans 0 g
Fibre / Fibres 4 g
Sugars / Sucres 0 g
Nutrition factsNutrition factsValeur nutritivVV ePer 1/2 cup (51 g), pour 1/2 tasse (51 g)
Amount % Daily Value
13 %
22 %
1 %
11 %
12 %
% valeur quotidienneTeneur
Calories / Calories 230
Cholesterol / Cholestérol 0 mg
Sodium / Sodium 20 mg
Carbohydrate / Glucides 34 g
Protein/ Proteines 5 g
Fat / Lipides 3 gSaturated / saturés 3.5 g+ Trans / trans 1 g
Fibre / Fibres 3 g
Sugars / Sucres 16 g
INGREDIENTS: Whole grain rolled oats,whole grain rolled wheat, brown sugar,raisins, dried coconut, almonds, partiallyhydrogenated cottonseed and soybean oils,
fnonf dat dr iy milklk, lglyce iri hn, honey
INGREDIENTS: 100% rolled oats
Natural GranolaOld Fashioned Oats
Food and Natural Health Product Labels 51
THE PLANNER✓✓
Juice DrinkOrange Juice
Ingredients: Water, glucose-fructose, pearand grape juice concentrates, citric acid, water-extracted orange and pineapple juice concentrates,ascorbic acid (vitamin C), natural flavour.
Nutrition FactsValeur nutritive
Amount
Calories / Calories 110
Cholesterol / Cholestérol 0 mg
Fat / Lipides 0 g
Saturated / saturés 0 g
Sodium / Sodium 0 mg
Potassium/ Potassium 470 mg
Carbohydrate/ Glucides 27 g
Protein/ Protéines 2 g
Sugars / Sucres 22 g
Vitamin A / Vitamine A
0 %
0 %
0 %
0 %
Vitamin C / Vitamine C 120 %
Calcium / Calcium 2 %
Iron / Fer 0 %
Folate / Folate 25 %
13 %
9 %
+ Trans / trans 0 g
% Daily Value
% valeur quotidienneTeneur
Per 250 mL / par 250 mL
Nutrition FactsValeur nutritivePer 1 cup (250 mL)/par 1 tasse (250 mL)
AmountTeneur
% Daily Value% valeur quotidienne
Calories / Calories 120
0 %Saturated / saturés 0 g+ Trans / trans 0 g 0 %
Cholesterol / Cholestérol 0 mg 0 %
Sodium / Sodium 160 mg 7 %Carbohydrate / Glucides 29 g 10 %
Fibre / Fibres 0 g 0 %Sugars / Sucres 28 g
Vitamin A / Vitamine A 0 %Vitamin C / Vitamine C 100 %
Calcium / Calcium 0 %Iron / Fer 0 %
Fat / Lipides 0 g
Protein / Protéines 0 g
Ingredients: Water, concentrated orange juice
Which choice provides more vitamin C?▼
Your answer: ____________________________________________
________________________________________________________
Other than water, what is the most abundant ingredient, by weight, in the juice drink? In the orange juice?
▼
Your answer: ____________________________________________
________________________________________________________
The added vitamin C increases the nutrient density of the juice drink, but does that make it a better choice
than the orange juice?▼
Your answer: ____________________________________________
________________________________________________________
What advice would you give Scott when choosing between more- and less-processed products?
▼
Your answer: ____________________________________________
________________________________________________________
(Check your answers in Appendix K.)

52 CHAPTER 2 Guidelines for a Healthy Diet
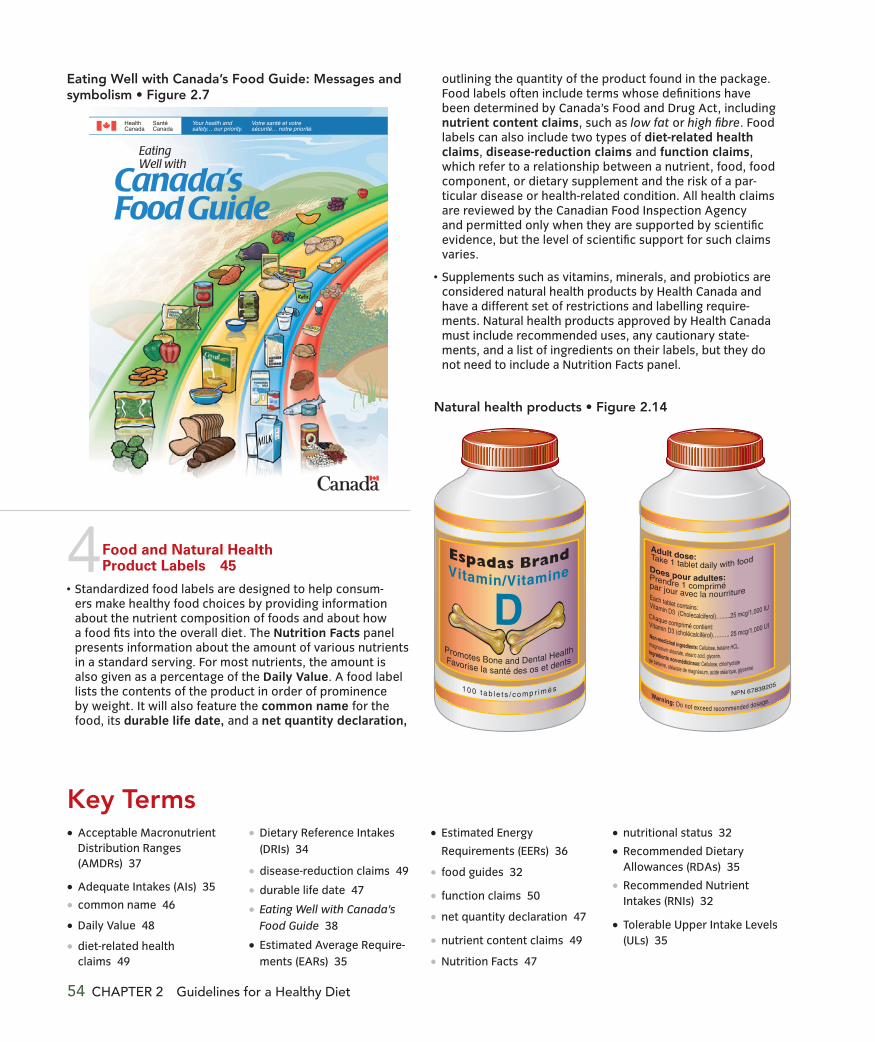
Canada, including the active medical ingredients, dose, potency, and non-medicinal ingredients. If approved, the product will then receive a Natural Product Number. The labels of these products must include the name, licence number, list of ingredients, recommended uses, and any cautionary statement (Figure 2.14).
1. Why are serving sizes standardized on food labels?
2. What food label information will help you to find foods that are low in saturated fat and cholesterol?
3. Where should you look to see if a food contains nuts?
4. How can structure and function claims on dietary supplement labels be misleading?
The labels of natural health products must contain a product license number, a list of medicinal and non-medicinal ingredients, a description of recommended doses, and, where applicable, any necessary cautionary statements. It may also include a health claim that has been authorized by Health Canada. What does not have to appear on an NHP label, however, is a nutrient facts panel.
Summary 53
(EARs) can be used to evaluate the adequacy of a popula-tion’s nutrient intake. Recommended Dietary Allowances (RDAs) and Adequate Intakes (AIs) can be used by individu-als as a goal for nutrient intake, and Tolerable Upper Intake Levels (ULs) indicate a safe upper intake limit.
The DRIs make two types of energy-intake recommenda-tions. Estimated Energy Requirements (EERs) provide an estimate of how many calories are needed to not gain or lose body weight. Acceptable Macronutrient Distribution Ranges (AMDRs) recommend the proportion of energy in a healthy diet that should be sourced from carbohydrate, fat, and protein.
The right amount of energy from the right
© Can Stock Photo Inc. / charlotteLake
3Tools for Diet Planning 38
is Health Can-ada’s current food guide. It recommends amounts from four food groups plus oils, based on individual energy needs and depending on an individual’s life stage and gender. This food guide also now includes culturally relevant foods and examples of how to estimate por-tion size. It also stresses the concepts of using variety and moderation in choosing a healthy diet and promotes physical activity.
The food guide also provides additional recommendations for how to choose wisely from each food group. These recommendations include eating one dark green and one orange vegetable a day, choosing more whole grain prod-ucts, eating two servings of fish each week, and limiting the amount of fat, sugar, and salt in our food choices.
Summary
1 Background on Nutrition Recommendations 32
Nutrition recommendations are designed to encourage consumption of a diet that promotes health and prevents disease. Some of the earliest nutrition recommendations in Canada were in the form of food guides, which translated Recommended Nutrient Intakes (RNIs) into food intake recommendations. The first set of Recommended Dietary Allowances, developed during World War II, focused on energy and the nutrients most likely to be deficient in a typical diet. Current recommendations focus on promot-ing health and preventing chronic disease and nutrient deficiencies.
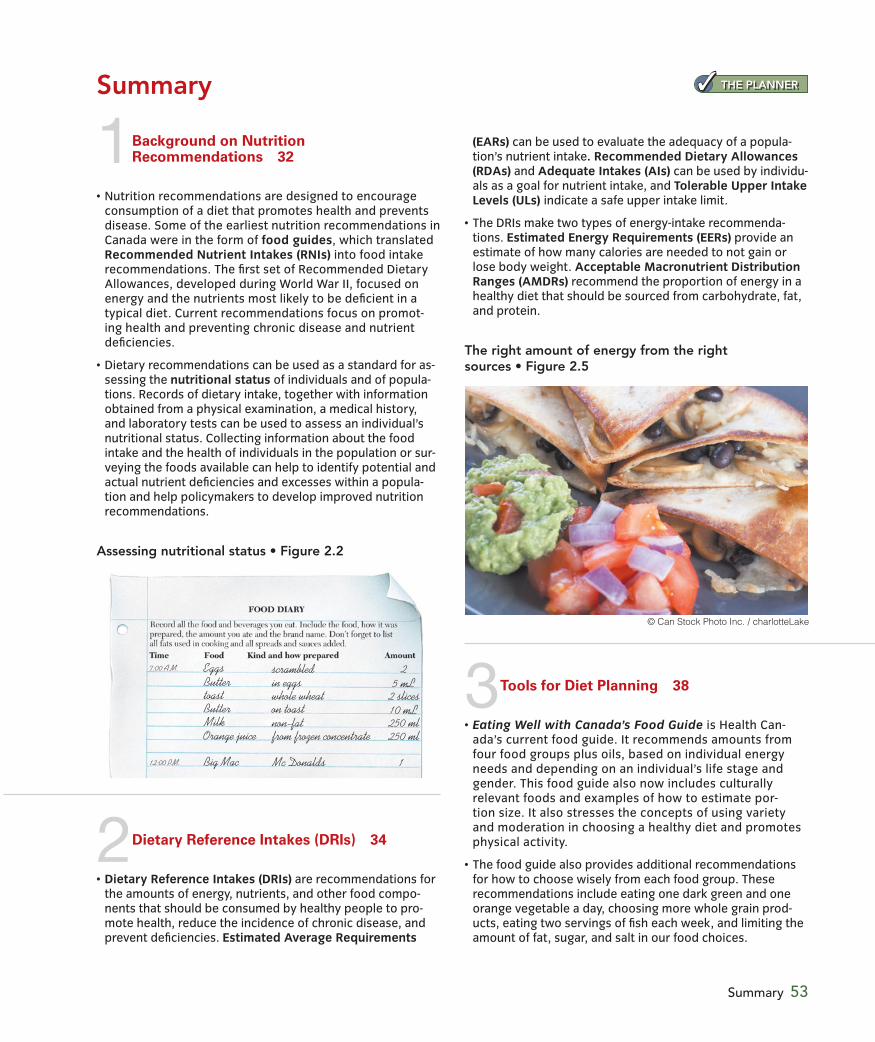
Dietary recommendations can be used as a standard for as-sessing the nutritional status of individuals and of popula-tions. Records of dietary intake, together with information obtained from a physical examination, a medical history, and laboratory tests can be used to assess an individual’s nutritional status. Collecting information about the food intake and the health of individuals in the population or sur-veying the foods available can help to identify potential and actual nutrient deficiencies and excesses within a popula-tion and help policymakers to develop improved nutrition recommendations.
5 mL
10 mL2 slices
250 ml250 ml
scrambledin eggswhole wheaton toastnon-fatfrom frozen concentrate
Mc Donalds 1Big Mac
Orange juiceMilkButter
ButterEggs7:00 A.M.
12:00 P.M.
toast
2
2Dietary Reference Intakes (DRIs) 34
Dietary Reference Intakes (DRIs) are recommendations for the amounts of energy, nutrients, and other food compo-nents that should be consumed by healthy people to pro-mote health, reduce the incidence of chronic disease, and prevent deficiencies. Estimated Average Requirements
THE PLANNER✓✓
54 CHAPTER 2 Guidelines for a Healthy Diet
outlining the quantity of the product found in the package. Food labels often include terms whose definitions have been determined by Canada’s Food and Drug Act, including nutrient content claims, such as low fat or high fibre. Food labels can also include two types of diet-related health claims, disease-reduction claims and function claims, which refer to a relationship between a nutrient, food, food component, or dietary supplement and the risk of a par-ticular disease or health-related condition. All health claims are reviewed by the Canadian Food Inspection Agency and permitted only when they are supported by scientific evidence, but the level of scientific support for such claims varies.
Supplements such as vitamins, minerals, and probiotics are considered natural health products by Health Canada and have a different set of restrictions and labelling require-ments. Natural health products approved by Health Canada must include recommended uses, any cautionary state-ments, and a list of ingredients on their labels, but they do not need to include a Nutrition Facts panel.
Eating Well with Canada’s Food Guide: Messages and
EatingWell with
Canada’sFood Guide
4 Food and Natural Health Product Labels 45
Standardized food labels are designed to help consum-ers make healthy food choices by providing information about the nutrient composition of foods and about how a food fits into the overall diet. The Nutrition Facts panel presents information about the amount of various nutrients in a standard serving. For most nutrients, the amount is also given as a percentage of the Daily Value. A food label lists the contents of the product in order of prominence by weight. It will also feature the common name for the food, its durable life date, and a net quantity declaration,
Key TermsAcceptable Macronutrient Distribution Ranges (AMDRs) 37
Adequate Intakes (AIs) 35
common name 46
Daily Value 48
diet-related healthclaims 49
Dietary Reference Intakes (DRIs) 34
disease-reduction claims 49
durable life date 47
Eating Well with Canada’s Food Guide 38
Estimated Average Require-ments (EARs) 35
Estimated Energy
Requirements (EERs) 36
food guides 32
function claims 50
net quantity declaration 47
nutrient content claims 49
Nutrition Facts 47
nutritional status 32
Recommended Dietary Allowances (RDAs) 35
Recommended Nutrient Intakes (RNIs) 32
Tolerable Upper Intake Levels (ULs) 35

What is happening in this picture? 55
Critical and Creative Thinking Questions1. The food guide recommends reducing the sugar, salt, and fat
content of foods. Suggest some changes that the food industry can implement to support these nutrition recommendations.
2. If a food record indicates that Gina consumes less than the RDA for vitamin C and more than the RDA for vitamin A, what does this information mean in terms of her nutritional status? Does she have a vitamin C deficiency? Is she at risk of vitamin A toxicity? What other factors need to be considered before drawing any conclusions about her nutritional status?
3. If a survey indicates that the consumption of red meat, which is an excellent source of iron, has been declining over the past five years, what conclusion can be drawn about the iron intake of the population during that period? How might this decline affect public health? How might it affect public health policy?
4. Select three packaged foods that have food labels. What is the percentage of calories from fat in each product? How many grams of carbohydrate, fat, and fibre are in each serv-ing? How does each product fit into your daily diet with regard to total carbohydrate recommended? Total fat? Dietary fibre? If you consumed a serving of each of these three foods, how much more saturated fat could you consume during the day without exceeding the recommendations? How much more total carbohydrate and fibre should you consume that day to meet recommendations for a 2,000-kilocalorie diet?
5. Vanessa is trying to increase her intake of calcium and vitamin D by taking a dietary supplement. How can she determine whether it contains enough of these nutrients to meet her needs but not so much that it will cause toxicity? If the prod-uct claims to build strong bones, does this mean that it will help reverse Vanessa’s osteoporosis? Why or why not?
© imagebroker / Alamy
What is happening in this picture?This man is snacking on chips while watching television.
1. The label on the bag says that a serving consists of about 20 chips. The bag contains 11 servings, and each serving provides 150 kilocalories. Why might he consume a larger portion than he plans to?
2. If the man eats half the bag, how many kilocalo-ries will he have ingested?
3. How might he moderate his portion size without counting every chip he eats?
T h i n k C r i t i c a l l y
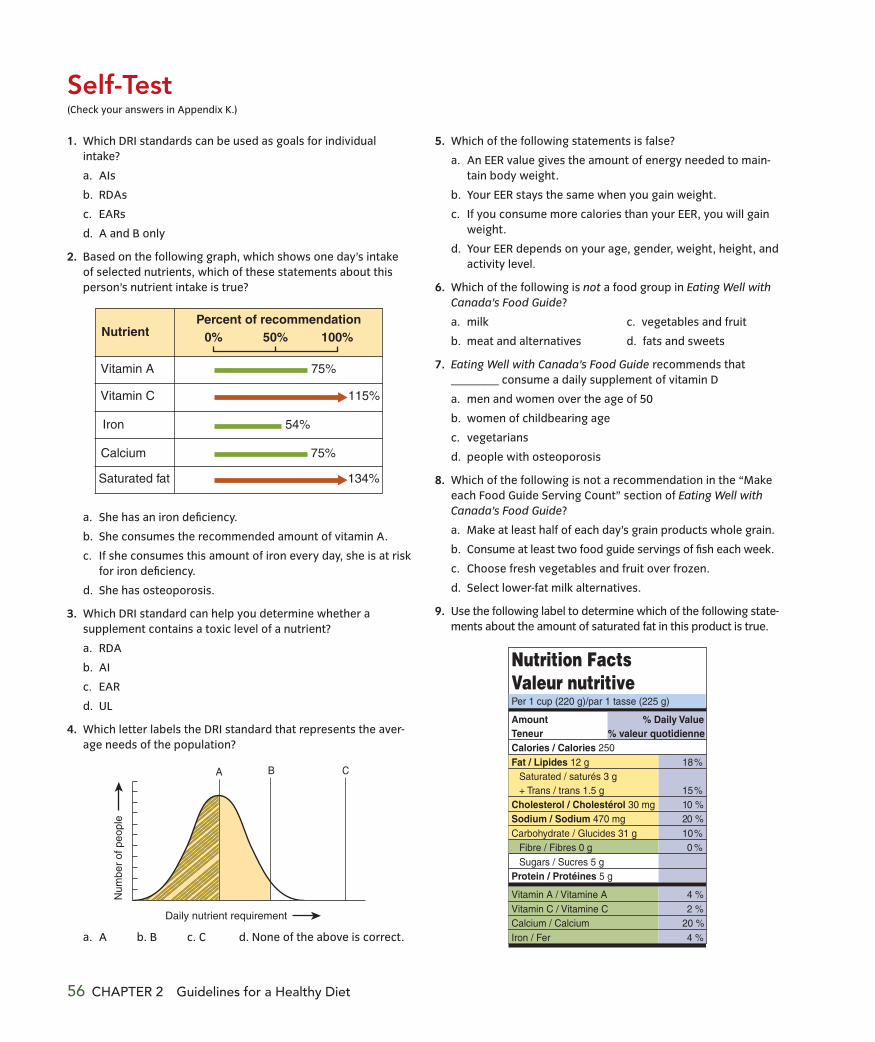
56 CHAPTER 2 Guidelines for a Healthy Diet
Self-Test(Check your answers in Appendix K.)
1. Which DRI standards can be used as goals for individual intake?
a. AIs
b. RDAs
c. EARs
d. A and B only
2. Based on the following graph, which shows one day’s intake of selected nutrients, which of these statements about this person’s nutrient intake is true?
Vitamin A
Vitamin C
Iron
Calcium
Saturated fat
NutrientPercent of recommendation
0% 50% 100%
75%
75%
115%
134%
54%
a. She has an iron deficiency.
b. She consumes the recommended amount of vitamin A.
c. If she consumes this amount of iron every day, she is at risk for iron deficiency.
d. She has osteoporosis.
3. Which DRI standard can help you determine whether a supplement contains a toxic level of a nutrient?
a. RDA
b. AI
c. EAR
d. UL
4. Which letter labels the DRI standard that represents the aver-age needs of the population?
Num
ber
of p
eopl
e
Daily nutrient requirement
BA C
a. A b. B c. C d. None of the above is correct.
5. Which of the following statements is false?
a. An EER value gives the amount of energy needed to main-tain body weight.
b. Your EER stays the same when you gain weight.
c. If you consume more calories than your EER, you will gain weight.
d. Your EER depends on your age, gender, weight, height, and activity level.
6. Which of the following is not a food group in Eating Well with Canada’s Food Guide?
a. milk c. vegetables and fruit
b. meat and alternatives d. fats and sweets
7. Eating Well with Canada’s Food Guide recommends that ________ consume a daily supplement of vitamin D
a. men and women over the age of 50
b. women of childbearing age
c. vegetarians
d. people with osteoporosis
8. Which of the following is not a recommendation in the “Make each Food Guide Serving Count” section of Eating Well with Canada’s Food Guide?
a. Make at least half of each day’s grain products whole grain.
b. Consume at least two food guide servings of fish each week.
c. Choose fresh vegetables and fruit over frozen.
d. Select lower-fat milk alternatives.
9. Use the following label to determine which of the following state-ments about the amount of saturated fat in this product is true.
Nutrition FactsValeur nutritive
AmountTeneur
% Daily Value% valeur quotidienne
Calories / Calories 250Fat / Lipides 12 g 18%
Saturated / saturés 3 g + Trans / trans 1.5 g 15%
Cholesterol / Cholestérol 30 mg 10 %Sodium / Sodium 470 mg 20 %Carbohydrate / Glucides 31 g 10%
Fibre / Fibres 0 g 0 %Sugars / Sucres 5 g
Protein / Protéines 5 g
Vitamin A / Vitamine A 4 %Vitamin C / Vitamine C 2 %Calcium / Calcium 20 %Iron / Fer 4 %
Per 1 cup (220 g)/par 1 tasse (225 g)
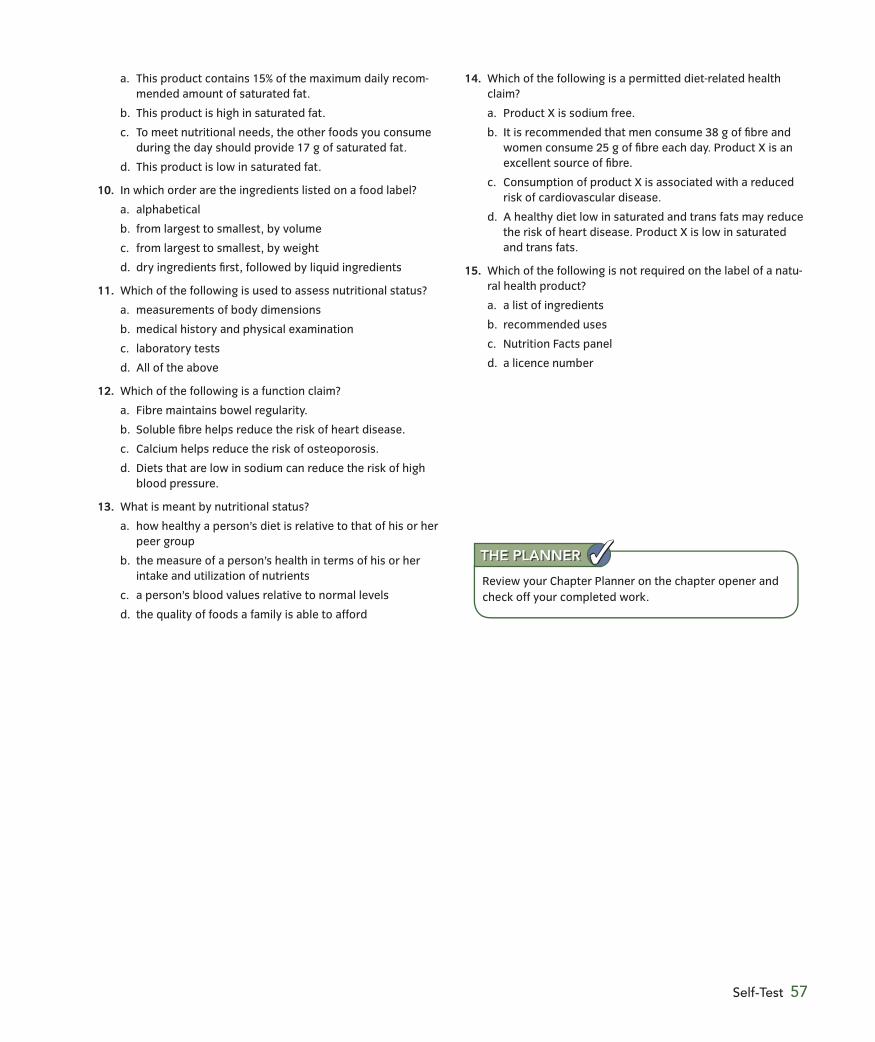
Self-Test 57
14. Which of the following is a permitted diet-related health claim?
a. Product X is sodium free.
b. It is recommended that men consume 38 g of fibre and women consume 25 g of fibre each day. Product X is an excellent source of fibre.
c. Consumption of product X is associated with a reduced risk of cardiovascular disease.
d. A healthy diet low in saturated and trans fats may reduce the risk of heart disease. Product X is low in saturated and trans fats.
15. Which of the following is not required on the label of a natu-ral health product?
a. a list of ingredients
b. recommended uses
c. Nutrition Facts panel
d. a licence number
a. This product contains 15% of the maximum daily recom-mended amount of saturated fat.
b. This product is high in saturated fat.
c. To meet nutritional needs, the other foods you consume during the day should provide 17 g of saturated fat.
d. This product is low in saturated fat.
10. In which order are the ingredients listed on a food label?
a. alphabetical
b. from largest to smallest, by volume
c. from largest to smallest, by weight
d. dry ingredients first, followed by liquid ingredients
11. Which of the following is used to assess nutritional status?
a. measurements of body dimensions
b. medical history and physical examination
c. laboratory tests
d. All of the above
12. Which of the following is a function claim?
a. Fibre maintains bowel regularity.
b. Soluble fibre helps reduce the risk of heart disease.
c. Calcium helps reduce the risk of osteoporosis.
d. Diets that are low in sodium can reduce the risk of high blood pressure.
13. What is meant by nutritional status?
a. how healthy a person’s diet is relative to that of his or her peer group
b. the measure of a person’s health in terms of his or her intake and utilization of nutrients
c. a person’s blood values relative to normal levels
d. the quality of foods a family is able to afford
Review your Chapter Planner on the chapter opener and check off your completed work.
THE PLANNER ✓✓