gross domestic products: preliminary figures in the …
TRANSCRIPT

News Release 16:00 (GMT +8)
May. 20, 2010DGBAS, Taipei
GROSS DOMESTIC PRODUCTS:
PRELIMINARY FIGURES IN THE FIRST QUARTER OF 2010 AND OUTLOOK FOR 2010
Economic Performance in the First Quarter of 2010
In the first quarter of 2010, the external sector showed powerful gain with the real exports of goods and services advanced by 42.17%. Associating with 12.93% growth of the domestic sector, the preliminary real gross domestic products (GDP) increased by 13.27% from the same quarter of the previous year. The annualized growth rate of seasonally adjusted GDP (saar) was 11.28% in the first quarter.
Meanwhile, the GDP growth rate in the fourth quarter of 2009 was revised to increase by 9.06%. For 2009 as a whole, real GDP shrank by 1.91%. Outlook for 2010
The latest evidence signals that the global recovery is proceeding at multiple speeds. As a result, Taiwan’s export is expected to expand strongly. This also helps boost the fixed investments of private sector. Real GDP is predicted to grow by 6.14% and consumer price index(CPI)will rise by 1.40%.
For further information:
Pei-hsuan Wu Statistics Database: [email protected]://61.60.106.82/pxweb/Dialog/statfile1L.asp
DGBAS news releases on the Internet: Tel: +886-2-23803489 Fax: +886-2-23803503 http://eng.stat.gov.tw/
Next release – Not Later Than Aug 27, 2010, for:
Gross Domestic Products in Second Quarter of 2010 (Preliminary).

Nominal GDP (at current prices) Real GDP ( At 2006 constant prices )Original Series(million NT$)
Seasonally Adjusted(million NT$)
Original Series(million NT$)
Seasonally Adjusted(million NT$) yoy saqr saar
1998 9,204,174 - 8,679,815 - 3.47 - -
1999 9,649,049 - 9,198,098 - 5.97 - -
2000 10,187,394 - 9,731,208 - 5.80 - -
2001 9,930,387 - 9,570,584 - -1.65 - -
2002 10,411,639 - 10,074,337 - 5.26 - -
2003 10,696,257 - 10,443,993 - 3.67 - -
2004 11,365,292 - 11,090,474 - 6.19 - -
2005 11,740,279 - 11,612,093 - 4.70 - -
2006 12,243,471 - 12,243,471 - 5.44 - -
2007 12,910,511 - 12,975,985 - 5.98 - -
2008 12,698,501 - 13,070,904 - 0.73 - -
Ⅰ 3,177,500 3,287,774 3,167,505 3,366,077 6.88 1.26 5.12
Ⅱ 3,181,229 3,274,917 3,297,130 3,354,985 5.38 -0.33 -1.31
Ⅲ 3,134,247 3,057,978 3,339,399 3,233,504 -0.80 -3.62 -13.72
Ⅳ 3,205,525 3,077,832 3,266,870 3,116,338 -7.11 -3.62 -13.73
2009(r) 12,512,678 - 12,821,384 - -1.91 - -
Ⅰ 2,984,505 3,067,135 2,880,519 3,024,518 -9.06 -2.95 -11.27
Ⅱ 2,982,515 3,096,370 3,071,247 3,166,361 -6.85 4.69 20.12
Ⅲ 3,159,580 3,118,412 3,306,737 3,251,180 -0.98 2.68 11.15
Ⅳ(r) 3,386,078 3,230,761 3,562,881 3,379,325 9.06 3.94 16.72
2010(f) 13,176,078 - 13,608,932 - 6.14 - -
Ⅰ(p) 3,238,230 3,376,070 3,262,726 3,470,865 13.27 2.71 11.28
Ⅱ(f) 3,176,481 3,277,986 3,306,425 3,389,766 7.66 -2.34 -9.02
Ⅲ(f) 3,318,486 3,261,916 3,452,279 3,367,186 4.40 -0.67 -2.64
Ⅳ(f) 3,442,881 3,260,106 3,587,502 3,381,115 0.69 0.41 1.66
Note:1. (p) indicates preliminary version, (f) indicates forecast, (r) indicates revised version. These marks mean the same in all tables. 2. The sum of the decomposed items might not be equal to the total due to the rounding of decimals. 3. yoy (year on year) means the growth rates to the correspondent quarter of previous year, saqr (seasonally adjusted quarterly growth rate) means the growth rate of seasonally adjusted value compared to the previous quarter, saar (seasonally adjusted annualized rate) means the annualized growth rate of seasonally adjusted value compared to the previous quarter.
Economic Growth Rate (%)
Table 1 Gross Domestic Product and Economic Growth Rate
Period
-1-

Table 2 Changes in Prices
Unit:%
GDP Private FinalConsumption
Government FinalConsumption
Gross FixedCapital Formation Exports Imports
1998 3.75 1.33 2.88 3.88 4.73 1.58 0.60 1.681999 -1.08 0.76 1.61 0.23 -6.80 -2.72 -4.55 0.182000 -0.20 0.89 1.11 0.06 -0.09 3.80 1.83 1.252001 -0.89 -0.32 0.23 -1.87 0.68 0.28 -1.35 -0.012002 -0.40 0.22 -0.03 0.06 -1.62 -0.15 0.05 -0.202003 -0.90 -0.32 1.53 3.01 -0.95 2.69 2.48 -0.282004 0.06 1.17 1.42 7.47 1.91 7.73 7.03 1.612005 -1.35 1.21 1.08 -0.99 -2.42 0.79 0.62 2.312006 -1.09 0.73 1.13 3.54 1.79 6.19 5.63 0.602007 -0.50 1.45 1.41 3.48 2.01 6.07 6.47 1.802008 -2.36 2.18 2.15 6.41 -1.39 7.23 5.15 3.53Ⅰ -2.26 2.85 1.22 6.22 0.56 8.76 8.68 3.58Ⅱ -1.71 2.64 3.31 7.27 0.10 8.45 8.05 4.19Ⅲ -5.24 2.59 2.16 7.19 -0.38 13.73 8.95 4.52Ⅳ -0.36 0.74 1.98 5.36 -6.43 -2.52 -4.64 1.87
2009(r) 0.45 -1.55 -0.77 -1.97 -6.67 -9.83 -8.74 -0.87Ⅰ 3.28 -1.12 0.16 1.01 -6.46 -10.95 -9.84 -0.01Ⅱ 0.65 -1.58 -1.99 -4.02 -9.06 -13.52 -12.80 -0.85Ⅲ 1.80 -2.03 -1.33 -3.36 -6.99 -12.72 -11.52 -1.35Ⅳ(r) -3.14 -1.49 -0.45 -1.63 -2.95 -1.64 0.01 -1.26
2010(f) -0.79 1.01 0.91 0.79 2.51 4.59 5.98 1.40Ⅰ(p) -4.21 0.56 -0.41 -0.53 1.32 7.35 6.57 1.28Ⅱ(f) -1.07 1.23 1.35 1.62 3.98 7.49 8.21 1.22Ⅲ(f) 0.60 1.06 1.13 1.08 2.12 2.69 4.94 1.07Ⅳ(f) 0.98 1.18 1.63 1.04 2.35 2.65 4.31 2.03
DeflatorsPeriod WPI CPI
-2-

Table 3 Gross Domestic Product by Kind of Activity (1/4)(1) At Current Prices
Unit:million NT$
Industry Service
Period
2002 10,411,639 188,436 3,151,983 52,099 2,595,812 242,556 261,516 7,033,525 1,744,101 421,717 394,088 832,267 855,445 808,341 488,249 1,489,317 37,695
2003 10,696,257 183,581 3,346,187 43,610 2,801,855 247,202 253,520 7,193,539 1,785,113 408,507 403,079 807,274 892,972 847,589 530,562 1,518,443 -27,050
2004 11,365,292 190,733 3,609,198 47,946 3,047,086 226,073 288,093 7,567,131 1,941,499 426,864 408,597 859,478 926,654 872,697 532,317 1,599,025 -1,770
2005 11,740,279 195,833 3,676,297 44,718 3,120,118 226,637 284,824 7,889,179 2,073,677 413,665 410,648 900,684 960,160 892,873 547,315 1,690,157 -21,030
2006 12,243,471 197,589 3,835,932 39,444 3,239,070 224,980 332,438 8,209,950 2,188,716 394,318 415,443 891,545 1,045,155 909,713 572,723 1,792,337 0
Ⅰ 2,921,839 48,729 829,680 8,798 697,312 48,173 75,397 2,051,625 519,904 99,408 99,216 222,620 249,670 256,140 170,148 434,519 -8,195
Ⅱ 2,940,136 54,932 910,436 9,559 766,155 50,275 84,447 1,972,891 524,465 88,162 100,400 234,233 255,550 208,297 123,979 437,805 1,877
Ⅲ 3,119,283 44,706 1,030,109 9,634 868,443 68,564 83,468 2,040,354 531,081 100,883 106,705 224,360 253,614 223,291 144,621 455,799 4,114
Ⅳ 3,262,213 49,222 1,065,707 11,453 907,160 57,968 89,126 2,145,080 613,266 105,865 109,122 210,332 286,321 221,985 133,975 464,214 2,204
2007 12,910,511 191,621 4,030,668 58,627 3,405,858 208,577 357,606 8,620,926 2,340,289 411,981 442,440 931,976 1,095,719 913,320 599,751 1,885,450 67,296
Ⅰ 3,041,846 44,829 851,126 11,733 704,776 50,406 84,211 2,131,193 554,758 102,558 104,599 213,870 263,660 261,888 177,352 452,508 14,698
Ⅱ 3,071,240 50,839 962,574 16,216 806,398 50,855 89,105 2,061,696 550,126 91,672 106,462 240,699 270,646 213,078 129,342 459,671 -3,869
Ⅲ 3,334,386 44,347 1,094,280 14,984 926,889 62,324 90,083 2,166,842 571,851 106,492 115,631 247,240 269,951 226,604 149,474 479,599 28,917
Ⅳ 3,463,039 51,606 1,122,688 15,694 967,795 44,992 94,207 2,261,195 663,554 111,259 115,748 230,167 291,462 211,750 143,583 493,672 27,550
2008 12,698,501 201,950 3,701,980 45,912 3,162,151 130,643 363,274 8,753,695 2,380,000 399,058 458,783 915,966 1,109,921 949,531 603,216 1,937,220 40,876
Ⅰ 3,177,500 46,494 891,888 12,880 753,317 34,868 90,823 2,225,799 597,629 101,429 108,367 227,017 267,342 267,986 177,759 478,270 13,319
Ⅱ 3,181,229 53,943 952,750 12,994 827,694 16,779 95,283 2,161,192 589,544 89,855 112,090 251,623 279,540 222,631 129,683 486,226 13,344
Ⅲ 3,134,247 42,951 957,411 9,776 822,619 31,995 93,021 2,133,863 569,379 92,603 116,032 222,606 268,383 236,435 150,154 478,271 22
Ⅳ 3,205,525 58,562 899,931 10,262 758,521 47,001 84,147 2,232,841 623,448 115,171 122,294 214,720 294,656 222,479 145,620 494,453 14,191
2009(r) 12,512,678 195,008 3,740,438 58,236 3,097,700 264,847 319,655 8,621,436 2,322,025 390,309 462,657 797,220 1,141,580 952,704 615,168 1,939,773 -44,204
Ⅰ 2,984,505 44,996 782,761 12,136 639,797 60,261 70,567 2,127,615 544,415 101,327 107,696 185,089 268,393 273,487 183,937 463,271 29,133
Ⅱ 2,982,515 54,912 894,067 16,844 737,694 59,315 80,214 2,062,304 546,571 91,014 111,263 208,003 278,335 220,203 133,122 473,793 -28,768
Ⅲ 3,159,580 44,226 999,548 12,925 822,289 80,579 83,755 2,126,866 562,888 91,602 118,033 197,567 283,144 238,509 153,459 481,664 -11,060
Ⅳ(r) 3,386,078 50,874 1,064,062 16,331 897,920 64,692 85,119 2,304,651 668,151 106,366 125,665 206,561 311,708 220,505 144,650 521,045 -33,509
2010 Ⅰ(p) 3,238,230 44,325 974,277 12,635 827,243 56,429 77,970 2,231,851 591,130 98,751 107,200 202,966 280,841 277,185 183,510 490,268 -12,223
Note:(1) Includes accommodation and food services, professional, scientific and technical services, support services, human health and social work services, arts, entertainment and recreation, other services, import duties and value-added tax.
Transporta-tion andStorage
Informationand
Communi-cation
Financeand
Insurance
Miningand
Quarrying
Manufac-turing
Electricity,Gas, Water
andRemediation
Services
Construc-tion
StatisticalDiscre-pancy
G D P RealEstate
PublicAdministra-
tion andDefence
Educa-tion
Other(1)
Wholesale and
RetailTrade
Agriculture, Forestry,
Fishing andAnimal
Husbandry
-3-
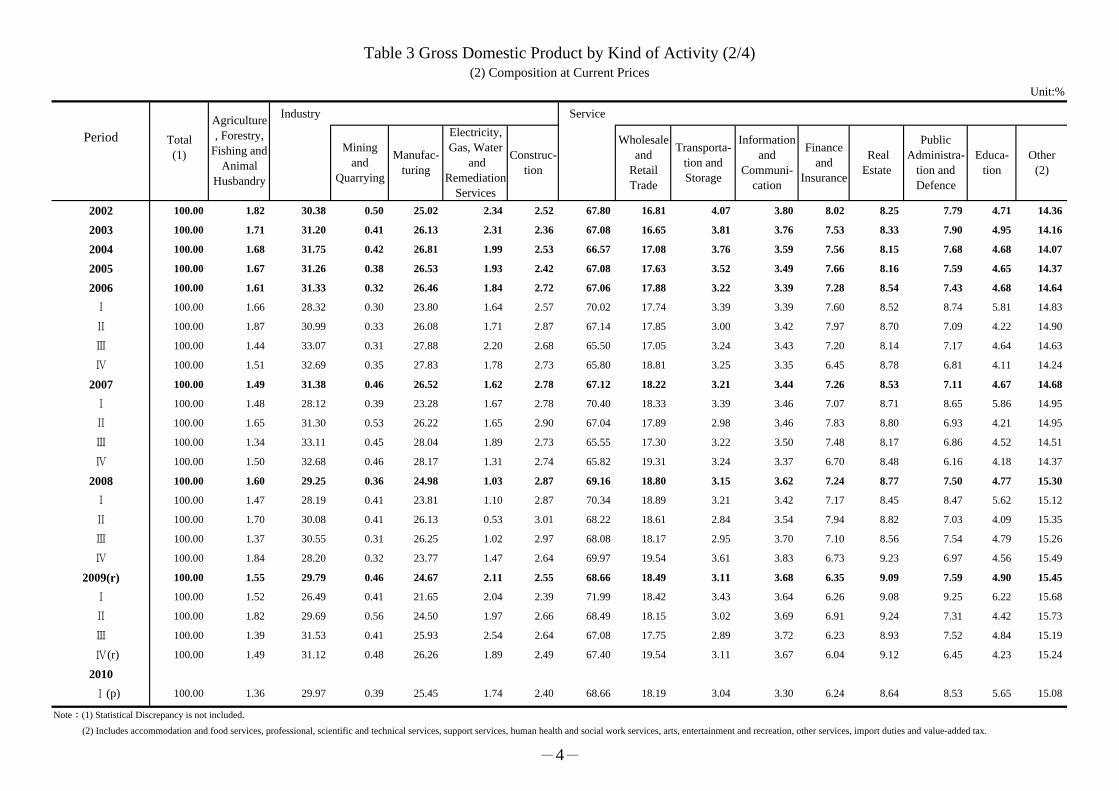
Table 3 Gross Domestic Product by Kind of Activity (2/4)(2) Composition at Current Prices
Unit:%
Industry Service
Period
2002 100.00 1.82 30.38 0.50 25.02 2.34 2.52 67.80 16.81 4.07 3.80 8.02 8.25 7.79 4.71 14.36
2003 100.00 1.71 31.20 0.41 26.13 2.31 2.36 67.08 16.65 3.81 3.76 7.53 8.33 7.90 4.95 14.16
2004 100.00 1.68 31.75 0.42 26.81 1.99 2.53 66.57 17.08 3.76 3.59 7.56 8.15 7.68 4.68 14.07
2005 100.00 1.67 31.26 0.38 26.53 1.93 2.42 67.08 17.63 3.52 3.49 7.66 8.16 7.59 4.65 14.37
2006 100.00 1.61 31.33 0.32 26.46 1.84 2.72 67.06 17.88 3.22 3.39 7.28 8.54 7.43 4.68 14.64
Ⅰ 100.00 1.66 28.32 0.30 23.80 1.64 2.57 70.02 17.74 3.39 3.39 7.60 8.52 8.74 5.81 14.83
Ⅱ 100.00 1.87 30.99 0.33 26.08 1.71 2.87 67.14 17.85 3.00 3.42 7.97 8.70 7.09 4.22 14.90
Ⅲ 100.00 1.44 33.07 0.31 27.88 2.20 2.68 65.50 17.05 3.24 3.43 7.20 8.14 7.17 4.64 14.63
Ⅳ 100.00 1.51 32.69 0.35 27.83 1.78 2.73 65.80 18.81 3.25 3.35 6.45 8.78 6.81 4.11 14.24
2007 100.00 1.49 31.38 0.46 26.52 1.62 2.78 67.12 18.22 3.21 3.44 7.26 8.53 7.11 4.67 14.68
Ⅰ 100.00 1.48 28.12 0.39 23.28 1.67 2.78 70.40 18.33 3.39 3.46 7.07 8.71 8.65 5.86 14.95
Ⅱ 100.00 1.65 31.30 0.53 26.22 1.65 2.90 67.04 17.89 2.98 3.46 7.83 8.80 6.93 4.21 14.95
Ⅲ 100.00 1.34 33.11 0.45 28.04 1.89 2.73 65.55 17.30 3.22 3.50 7.48 8.17 6.86 4.52 14.51
Ⅳ 100.00 1.50 32.68 0.46 28.17 1.31 2.74 65.82 19.31 3.24 3.37 6.70 8.48 6.16 4.18 14.37
2008 100.00 1.60 29.25 0.36 24.98 1.03 2.87 69.16 18.80 3.15 3.62 7.24 8.77 7.50 4.77 15.30
Ⅰ 100.00 1.47 28.19 0.41 23.81 1.10 2.87 70.34 18.89 3.21 3.42 7.17 8.45 8.47 5.62 15.12
Ⅱ 100.00 1.70 30.08 0.41 26.13 0.53 3.01 68.22 18.61 2.84 3.54 7.94 8.82 7.03 4.09 15.35
Ⅲ 100.00 1.37 30.55 0.31 26.25 1.02 2.97 68.08 18.17 2.95 3.70 7.10 8.56 7.54 4.79 15.26
Ⅳ 100.00 1.84 28.20 0.32 23.77 1.47 2.64 69.97 19.54 3.61 3.83 6.73 9.23 6.97 4.56 15.49
2009(r) 100.00 1.55 29.79 0.46 24.67 2.11 2.55 68.66 18.49 3.11 3.68 6.35 9.09 7.59 4.90 15.45
Ⅰ 100.00 1.52 26.49 0.41 21.65 2.04 2.39 71.99 18.42 3.43 3.64 6.26 9.08 9.25 6.22 15.68
Ⅱ 100.00 1.82 29.69 0.56 24.50 1.97 2.66 68.49 18.15 3.02 3.69 6.91 9.24 7.31 4.42 15.73
Ⅲ 100.00 1.39 31.53 0.41 25.93 2.54 2.64 67.08 17.75 2.89 3.72 6.23 8.93 7.52 4.84 15.19
Ⅳ(r) 100.00 1.49 31.12 0.48 26.26 1.89 2.49 67.40 19.54 3.11 3.67 6.04 9.12 6.45 4.23 15.24
2010 Ⅰ(p) 100.00 1.36 29.97 0.39 25.45 1.74 2.40 68.66 18.19 3.04 3.30 6.24 8.64 8.53 5.65 15.08
Note:(1) Statistical Discrepancy is not included.
(2) Includes accommodation and food services, professional, scientific and technical services, support services, human health and social work services, arts, entertainment and recreation, other services, import duties and value-added tax.
Total(1) Real
Estate
Agriculture, Forestry,
Fishing andAnimal
Husbandry
Miningand
Quarrying
Manufac-turing
Electricity,Gas, Water
andRemediation
Services
Construc-tion
PublicAdministra-
tion andDefence
Educa-tion
Other(2)
Wholesaleand
RetailTrade
Transporta-tion andStorage
Informationand
Communi-cation
Financeand
Insurance
-4-

Table 3 Gross Domestic Product by Kind of Activity (3/4)(3) Growth Rates in Real GDP (yoy)
Unit:%
Industry Service
Period
2003 3.67 -1.65 7.67 -19.28 10.09 7.27 -3.91 2.57 2.07 0.58 4.54 0.61 4.79 2.45 4.77 2.28
2004 6.19 -5.39 9.54 -1.37 10.33 6.16 7.13 5.17 6.38 5.29 6.08 7.70 4.22 0.84 3.53 5.79
2005 4.70 -4.24 6.93 -5.42 7.90 5.88 1.26 3.87 6.18 2.14 2.51 4.32 4.35 1.54 1.59 3.35
2006 5.44 13.84 7.84 -22.32 9.04 5.71 2.91 4.22 5.01 3.01 3.22 2.51 8.35 -0.06 3.86 4.71
Ⅰ 5.82 5.96 9.10 -30.84 11.34 6.96 0.59 4.75 6.90 2.95 2.26 7.83 6.21 -1.79 4.22 4.43
Ⅱ 5.78 11.36 8.90 -33.78 10.58 7.68 2.40 4.40 5.39 3.92 0.52 4.22 7.47 -1.37 4.27 5.88
Ⅲ 6.48 20.48 11.53 -18.76 12.95 5.87 6.92 3.86 4.25 5.09 3.99 -1.22 9.07 -0.83 5.36 5.03
Ⅳ 3.84 17.76 2.74 -0.24 2.89 2.91 1.19 3.92 3.74 0.36 5.93 -0.21 10.40 3.70 1.56 3.59
2007 5.98 -2.42 9.02 20.39 9.82 6.57 1.53 4.43 5.94 4.57 3.64 6.14 5.33 -1.16 2.65 4.75
Ⅰ 4.45 -0.92 3.67 17.18 3.80 4.08 0.65 4.57 6.79 5.23 3.47 0.68 6.39 0.94 2.64 5.28
Ⅱ 5.70 6.18 6.64 20.11 6.89 7.74 2.35 4.44 4.86 4.39 3.33 5.88 6.51 0.37 1.68 5.18
Ⅲ 7.08 1.40 10.54 37.35 11.50 8.41 0.30 5.41 6.71 4.64 5.74 10.91 6.31 0.75 1.25 4.54
Ⅳ 6.51 -13.48 13.73 8.38 15.15 5.78 3.10 3.37 5.48 4.04 2.00 6.90 2.51 -6.40 5.09 4.09
2008 0.73 0.55 -0.17 -13.80 0.43 1.19 -5.55 0.94 1.16 0.46 5.14 -2.20 0.96 0.90 1.00 1.36
Ⅰ 6.88 -1.68 14.17 -4.73 16.93 5.11 -1.15 3.97 6.55 1.98 4.69 5.08 1.69 0.19 0.90 4.61
Ⅱ 5.38 -0.04 9.12 -0.32 11.00 5.53 -5.14 3.91 5.77 3.39 7.59 3.69 3.55 0.25 1.80 3.74
Ⅲ -0.80 -4.37 0.90 -25.33 2.29 -2.89 -7.03 -1.37 -1.05 -1.96 2.21 -9.81 -0.43 1.15 0.93 -0.54
Ⅳ -7.11 7.27 -18.82 -22.37 -20.52 -1.59 -8.91 -2.38 -5.60 -1.34 6.30 -6.98 -0.77 1.99 0.44 -1.97
2009(r) -1.91 -3.12 -4.73 -11.84 -4.76 -0.05 -6.94 -0.27 -0.51 -2.65 3.39 -7.19 2.16 1.29 1.64 0.25
Ⅰ -9.06 -3.07 -21.01 -22.38 -22.62 -6.63 -14.27 -4.13 -5.67 -6.53 1.37 -15.15 -0.49 1.07 2.78 -4.11
Ⅱ -6.85 -1.75 -15.15 -7.95 -16.45 -5.51 -8.50 -3.05 -5.01 -5.31 2.18 -10.41 -1.53 1.35 2.43 -2.04
Ⅲ -0.98 -6.81 -4.31 -20.43 -4.71 4.38 -4.40 1.08 0.82 -2.03 4.52 -4.38 4.58 2.72 1.61 0.82
Ⅳ(r) 9.06 -1.66 22.28 6.29 25.42 6.37 0.28 4.90 7.72 3.12 5.21 2.09 5.87 -0.08 -0.17 6.22
2010 Ⅰ(p) 13.27 -1.30 35.49 2.68 41.00 7.40 9.87 6.00 7.12 7.33 4.80 10.40 4.87 1.88 0.16 7.33
Note:(1) Includes accommodation and food services, professional, scientific and technical services, support services, human health and social work services, arts, entertainment and recreation, other services, import duties and value-added tax.
PublicAdministra-
tion andDefence
Educa-tion
Other(1)
Wholesaleand
RetailTrade
Transporta-tion andStorage
Informationand
Communi-cation
Financeand
Insurance
EconomicGrowth
Rate(yoy)
RealEstate
Agriculture, Forestry,
Fishing andAnimal
Husbandry
Miningand
Quarrying
Manufac-turing
Electricity,Gas, Water
andRemediation
Services
Construc-tion
-5-

Table 3 Gross Domestic Product by Kind of Activity (4/4)(4) Contributions to Economic Growth Rate
Unit: percentage points
Industry Service
Period
2003 3.67 -0.03 2.15 -0.13 2.27 0.13 -0.12 1.79 0.37 0.02 0.16 0.05 0.40 0.21 0.24 0.35
2004 6.19 -0.10 2.77 -0.01 2.47 0.11 0.20 3.57 1.13 0.18 0.22 0.57 0.36 0.07 0.18 0.87
2005 4.70 -0.07 2.08 -0.03 1.96 0.11 0.04 2.65 1.09 0.07 0.09 0.32 0.36 0.12 0.08 0.50
2006 5.44 0.21 2.40 -0.10 2.31 0.10 0.08 2.86 0.90 0.10 0.11 0.19 0.69 0.00 0.18 0.69
Ⅰ 5.82 0.09 2.56 -0.17 2.58 0.12 0.02 3.34 1.27 0.10 0.08 0.59 0.54 -0.14 0.22 0.68
Ⅱ 5.78 0.18 2.68 -0.16 2.63 0.13 0.07 3.01 0.96 0.13 0.02 0.33 0.63 -0.11 0.19 0.86
Ⅲ 6.48 0.25 3.63 -0.08 3.38 0.12 0.21 2.59 0.72 0.16 0.14 -0.10 0.72 -0.07 0.27 0.74
Ⅳ 3.84 0.28 0.89 0.00 0.81 0.05 0.03 2.58 0.69 0.01 0.19 -0.01 0.85 0.26 0.07 0.52
2007 5.98 -0.04 2.83 0.07 2.60 0.12 0.04 2.97 1.06 0.15 0.12 0.45 0.45 -0.09 0.12 0.70
Ⅰ 4.45 -0.01 1.06 0.06 0.91 0.07 0.02 3.18 1.26 0.18 0.12 0.05 0.56 0.07 0.14 0.80
Ⅱ 5.70 0.10 2.06 0.06 1.79 0.14 0.07 2.99 0.86 0.14 0.11 0.46 0.56 0.03 0.07 0.76
Ⅲ 7.08 0.02 3.47 0.11 3.18 0.17 0.01 3.54 1.12 0.15 0.20 0.79 0.51 0.06 0.06 0.66
Ⅳ 6.51 -0.24 4.41 0.03 4.21 0.11 0.07 2.23 1.01 0.13 0.07 0.45 0.22 -0.46 0.22 0.59
2008 0.73 0.01 -0.05 -0.05 0.12 0.02 -0.14 0.62 0.21 0.01 0.17 -0.16 0.08 0.06 0.05 0.20
Ⅰ 6.88 -0.02 4.07 -0.02 4.03 0.09 -0.03 2.76 1.25 0.07 0.16 0.38 0.15 0.01 0.05 0.70
Ⅱ 5.38 0.00 2.85 0.00 2.89 0.10 -0.14 2.61 1.02 0.11 0.25 0.29 0.31 0.02 0.08 0.55
Ⅲ -0.80 -0.06 0.31 -0.10 0.66 -0.06 -0.20 -0.88 -0.17 -0.06 0.08 -0.73 -0.03 0.08 0.04 -0.08
Ⅳ -7.11 0.11 -6.46 -0.07 -6.17 -0.03 -0.19 -1.52 -1.02 -0.04 0.20 -0.46 -0.06 0.12 0.02 -0.28
2009(r) -1.91 -0.05 -1.51 -0.04 -1.30 0.00 -0.17 -0.18 -0.09 -0.08 0.12 -0.51 0.18 0.09 0.07 0.04
Ⅰ -9.06 -0.04 -6.45 -0.08 -5.89 -0.12 -0.36 -2.79 -1.08 -0.21 0.05 -1.10 -0.04 0.07 0.13 -0.61
Ⅱ -6.85 -0.03 -4.90 -0.03 -4.56 -0.10 -0.21 -2.01 -0.89 -0.16 0.07 -0.80 -0.13 0.09 0.10 -0.29
Ⅲ -0.98 -0.09 -1.49 -0.06 -1.40 0.09 -0.12 0.69 0.14 -0.06 0.16 -0.30 0.37 0.19 0.08 0.12
Ⅳ(r) 9.06 -0.03 6.69 0.02 6.54 0.12 0.01 3.30 1.44 0.10 0.19 0.14 0.53 -0.01 -0.01 0.92
2010 Ⅰ(p) 13.27 -0.02 9.47 0.01 9.09 0.13 0.24 4.29 1.40 0.25 0.18 0.70 0.45 0.14 0.01 1.15
Note:(1) Includes accommodation and food services, professional, scientific and technical services, support services, human health and social work services, arts, entertainment and recreation, other services, import duties and value-added tax.
Explanation:Statistical Discrepancy is not included, therefore sum of contributions from agriculture, industry and service is not necessarily equal to the economic growth rate.
PublicAdministra-
tion andDefence
Educa-tion
Other(1)
Wholesaleand
RetailTrade
Transporta-tion andStorage
Informationand
Communi-cation
Financeand
Insurance
EconomicGrowth
Rate(yoy)
RealEstate
Agriculture, Forestry,
Fishing andAnimal
Husbandry
Miningand
Quarrying
Manufac-turing
Electricity,Gas, Water
andRemediation
Services
Construc-tion
-6-

Table 4 Expenditures on Gross Domestic Product (1/4)(1) At Current Prices
Unit:million NT$
PrivateEnterprises
PublicEnterprises Government
1998 9,204,174 9,108,489 5,351,560 1,364,414 2,302,142 1,579,006 223,538 499,598 90,373 95,685 4,359,751 4,264,066
1999 9,649,049 9,406,732 5,665,865 1,331,713 2,351,957 1,587,639 248,402 515,916 57,197 242,317 4,562,172 4,319,855
2000 10,187,394 9,966,282 5,987,733 1,362,909 2,524,443 1,799,432 236,472 488,539 91,197 221,112 5,392,441 5,171,329
2001 9,930,387 9,389,346 6,027,593 1,391,434 2,033,527 1,354,465 237,910 441,152 -63,208 541,041 4,962,159 4,421,118
2002 10,411,639 9,663,806 6,237,569 1,412,451 2,057,650 1,437,636 230,141 389,873 -43,864 747,833 5,436,642 4,688,809
2003 10,696,257 9,944,615 6,398,604 1,416,425 2,117,282 1,504,363 223,030 389,889 12,304 751,642 5,935,611 5,183,969
2004 11,365,292 10,946,343 6,808,382 1,444,872 2,592,909 2,012,959 185,233 394,717 100,180 418,949 6,980,987 6,562,038
2005 11,740,279 11,221,828 7,090,739 1,463,234 2,635,451 2,021,011 208,435 406,005 32,404 518,451 7,341,705 6,823,254
2006 12,243,471 11,494,593 7,248,344 1,469,296 2,730,670 2,151,566 194,176 384,928 46,283 748,878 8,325,717 7,576,839
2007 12,910,511 11,883,378 7,506,467 1,521,102 2,841,353 2,242,734 202,505 396,114 14,456 1,027,133 9,304,061 8,276,928
2008 12,698,501 12,069,873 7,626,271 1,564,394 2,685,662 2,031,335 208,714 445,613 193,546 628,628 9,226,468 8,597,840
Ⅰ 3,177,500 3,024,974 1,933,694 406,259 677,195 545,119 47,788 84,288 7,826 152,526 2,331,014 2,178,488
Ⅱ 3,181,229 2,978,306 1,877,102 351,880 691,810 544,726 43,141 103,943 57,514 202,923 2,453,667 2,250,744
Ⅲ 3,134,247 3,070,649 1,918,158 388,260 693,796 534,473 45,837 113,486 70,435 63,598 2,490,208 2,426,610
Ⅳ 3,205,525 2,995,944 1,897,317 417,995 622,861 407,017 71,948 143,896 57,771 209,581 1,951,579 1,741,998
2009(r) 12,512,678 11,397,119 7,610,863 1,608,957 2,341,610 1,622,063 223,203 496,344 -164,311 1,115,559 7,826,618 6,711,059
Ⅰ 2,984,505 2,686,074 1,874,376 427,397 483,085 351,773 36,629 94,683 -98,784 298,431 1,594,368 1,295,937
Ⅱ 2,982,515 2,707,495 1,836,068 354,886 522,106 359,968 47,060 115,078 -5,565 275,020 1,846,689 1,571,669
Ⅲ 3,159,580 2,896,253 1,922,485 397,035 635,604 456,169 50,510 128,925 -58,871 263,327 2,121,507 1,858,180
Ⅳ(r) 3,386,078 3,107,297 1,977,934 429,639 700,815 454,153 89,004 157,658 -1,091 278,781 2,264,054 1,985,273
2010(f) 13,176,078 12,212,552 7,840,215 1,645,463 2,672,308 1,937,879 228,901 505,528 54,566 963,526 9,393,356 8,429,830
Ⅰ(p) 3,238,230 3,020,162 1,942,272 432,535 606,741 482,707 37,534 86,500 38,614 218,068 2,296,678 2,078,610
Ⅱ(f) 3,176,481 2,939,091 1,906,888 366,791 650,613 472,426 56,262 121,925 14,799 237,390 2,345,345 2,107,955
Ⅲ(f) 3,318,486 3,084,194 1,980,251 405,753 694,943 508,747 51,797 134,399 3,247 234,292 2,371,311 2,137,019
Ⅳ(f) 3,442,881 3,169,105 2,010,804 440,384 720,011 473,999 83,308 162,704 -2,094 273,776 2,380,022 2,106,246
Exports ofGoods andServices
Less:Imports ofGoods andServices
Period G D PSub-total Sub-totalPrivate Final
Consumption
GovernmentFinal
Consumption
Increase inStocks
Gross Fixed Capital Formation
Domestic Demand Demand of Rest of The World
-7-

Table 4 Expenditures on Gross Domestic Product (2/4)(2) Composition at Current Prices
Unit:%
PrivateEnterprises
PublicEnterprises Government
1998 100.00 98.96 58.14 14.82 25.01 17.16 2.43 5.43 0.98 1.04 47.37 46.33
1999 100.00 97.49 58.72 13.80 24.38 16.45 2.57 5.35 0.59 2.51 47.28 44.77
2000 100.00 97.83 58.78 13.38 24.78 17.66 2.32 4.80 0.90 2.17 52.93 50.76
2001 100.00 94.55 60.70 14.01 20.48 13.64 2.40 4.44 -0.64 5.45 49.97 44.52
2002 100.00 92.82 59.91 13.57 19.76 13.81 2.21 3.74 -0.42 7.18 52.22 45.03
2003 100.00 92.97 59.82 13.24 19.79 14.06 2.09 3.65 0.12 7.03 55.49 48.47
2004 100.00 96.31 59.91 12.71 22.81 17.71 1.63 3.47 0.88 3.69 61.42 57.74
2005 100.00 95.58 60.40 12.46 22.45 17.21 1.78 3.46 0.28 4.42 62.53 58.12
2006 100.00 93.88 59.20 12.00 22.30 17.57 1.59 3.14 0.38 6.12 68.00 61.88
2007 100.00 92.04 58.14 11.78 22.01 17.37 1.57 3.07 0.11 7.96 72.07 64.11
2008 100.00 95.05 60.06 12.32 21.15 16.00 1.64 3.51 1.52 4.95 72.66 67.71
Ⅰ 100.00 95.20 60.86 12.79 21.31 17.16 1.50 2.65 0.25 4.80 73.36 68.56
Ⅱ 100.00 93.62 59.01 11.06 21.75 17.12 1.36 3.27 1.81 6.38 77.13 70.75
Ⅲ 100.00 97.97 61.20 12.39 22.14 17.05 1.46 3.62 2.25 2.03 79.45 77.42
Ⅳ 100.00 93.46 59.19 13.04 19.43 12.70 2.24 4.49 1.80 6.54 60.88 54.34
2009(r) 100.00 91.08 60.83 12.86 18.71 12.96 1.78 3.97 -1.31 8.92 62.55 53.63
Ⅰ 100.00 90.00 62.80 14.32 16.19 11.79 1.23 3.17 -3.31 10.00 53.42 43.42
Ⅱ 100.00 90.78 61.56 11.90 17.51 12.07 1.58 3.86 -0.19 9.22 61.92 52.70
Ⅲ 100.00 91.67 60.85 12.57 20.12 14.44 1.60 4.08 -1.86 8.33 67.15 58.81
Ⅳ(r) 100.00 91.77 58.41 12.69 20.70 13.41 2.63 4.66 -0.03 8.23 66.86 58.63
2010(f) 100.00 92.69 59.50 12.49 20.28 14.71 1.74 3.84 0.41 7.31 71.29 63.98
Ⅰ(p) 100.00 93.27 59.98 13.36 18.74 14.91 1.16 2.67 1.19 6.73 70.92 64.19
Ⅱ(f) 100.00 92.53 60.03 11.55 20.48 14.87 1.77 3.84 0.47 7.47 73.83 66.36
Ⅲ(f) 100.00 92.94 59.67 12.23 20.94 15.33 1.56 4.05 0.10 7.06 71.46 64.40
Ⅳ(f) 100.00 92.05 58.40 12.79 20.91 13.77 2.42 4.73 -0.06 7.95 69.13 61.18
Exports ofGoods andServices
Less:Imports ofGoods andServices
Period TotalSub-total Sub-totalPrivate Final
Consumption
GovernmentFinal
Consumption
Increase inStocks
Domestic Demand Demand of Rest of The World
Gross Fixed Capital Formation
-8-

Table 4 Expenditures on Gross Domestic Product (3/4)(3) Growth Rates In Real GDP (yoy)
Unit:%
PrivateEnterprises
PublicEnterprises Government
1998 3.47 6.17 6.31 3.61 7.31 11.54 3.72 -1.67 -- -- 1.88 7.36
1999 5.97 2.40 5.07 -3.94 1.92 -0.15 13.86 3.26 -- -- 12.27 4.13
2000 5.80 5.20 4.75 1.21 7.27 13.19 -3.33 -4.17 -- -- 18.31 15.34
2001 -1.65 -5.75 0.98 1.86 -17.91 -22.98 -0.06 -9.22 -- -- -8.60 -14.75
2002 5.26 2.75 3.26 1.55 1.12 7.12 -2.58 -13.18 -- -- 11.37 6.21
2003 3.67 2.34 2.91 -1.23 -0.11 1.93 -4.70 -4.47 -- -- 10.23 7.68
2004 6.19 7.36 5.17 0.57 13.96 25.62 -20.60 -9.59 -- -- 15.40 17.50
2005 4.70 1.83 2.90 0.19 2.66 1.53 14.77 2.82 -- -- 7.78 3.16
2006 5.44 0.97 1.49 -0.71 0.07 3.31 -8.61 -11.21 -- -- 11.41 4.57
2007 5.98 1.42 2.08 2.09 0.55 1.36 1.57 -4.46 -- -- 9.55 2.98
2008 0.73 -1.72 -0.57 0.68 -11.17 -13.78 -2.38 -0.39 -- -- 0.56 -3.12
Ⅰ 6.88 4.51 2.14 1.32 3.60 3.87 9.78 -1.66 -- -- 12.37 9.51
Ⅱ 5.38 -1.45 0.65 1.68 -9.32 -11.23 2.17 -1.84 -- -- 9.12 -0.47
Ⅲ -0.80 -3.96 -2.78 -0.54 -14.65 -16.74 -10.69 -3.52 -- -- 1.87 -2.34
Ⅳ -7.11 -5.34 -2.18 0.49 -21.85 -29.49 -6.53 3.91 -- -- -17.93 -17.94
2009(r) -1.91 -3.76 1.37 3.65 -11.06 -18.38 4.04 18.62 -- -- -9.11 -13.44
Ⅰ -9.06 -11.42 -1.96 5.03 -29.37 -35.53 -28.33 13.72 -- -- -26.87 -33.20
Ⅱ -6.85 -6.61 -0.61 2.91 -21.37 -30.75 5.77 22.42 -- -- -17.24 -19.25
Ⅲ -0.98 -2.52 2.31 3.64 -5.20 -12.02 7.91 25.83 -- -- -8.41 -12.27
Ⅳ(r) 9.06 5.47 5.83 3.24 14.38 13.15 23.01 13.59 -- -- 19.54 15.88
2010(f) 6.14 6.16 1.99 1.34 13.23 18.38 4.02 -0.70 -- -- 17.07 20.10
Ⅰ(p) 13.27 12.93 3.04 1.62 26.26 37.11 4.63 -8.88 -- -- 42.17 49.42
Ⅱ(f) 7.66 7.00 2.59 1.98 22.63 28.72 19.82 2.88 -- -- 22.14 24.77
Ⅲ(f) 4.40 5.12 1.92 1.06 8.17 10.46 3.82 1.16 -- -- 9.45 11.99
Ⅳ(f) 0.69 0.73 0.47 0.86 1.69 3.44 -4.64 -0.05 -- -- 2.71 3.35
Period
EconomicGrowth
Rate(yoy)
Sub-total Sub-totalPrivate FinalConsumption
GovernmentFinal
Consumption
Increase inStocks
Domestic Demand Demand of Rest of The World
Gross Fixed Capital Formation Exports ofGoods andServices
Less:Imports ofGoods andServices
-9-

Table 4 Expenditures on Gross Domestic Product (4/4)(4) Contributions to Economic Growth Rate (yoy)
Unit: percentage points
PrivateEnterprises
PublicEnterprises Government
1998 3.47 6.76 3.95 0.61 2.09 2.12 0.10 -0.13 0.10 -3.29 0.88 4.17
1999 5.97 2.70 3.27 -0.67 0.57 -0.03 0.36 0.24 -0.46 3.27 5.70 2.43
2000 5.80 5.65 3.03 0.19 2.07 2.46 -0.09 -0.29 0.36 0.15 9.01 8.86
2001 -1.65 -6.21 0.62 0.27 -5.18 -4.59 0.00 -0.59 -1.93 4.56 -4.73 -9.29
2002 5.26 2.84 2.12 0.24 0.27 1.11 -0.07 -0.77 0.22 2.42 5.81 3.39
2003 3.67 2.37 1.85 -0.18 -0.02 0.31 -0.11 -0.22 0.72 1.30 5.53 4.23
2004 6.19 7.34 3.27 0.08 3.12 4.01 -0.46 -0.43 0.88 -1.15 8.86 10.01
2005 4.70 1.85 1.81 0.03 0.64 0.28 0.25 0.11 -0.63 2.86 4.86 2.00
2006 5.44 0.95 0.92 -0.09 0.02 0.59 -0.16 -0.42 0.10 4.49 7.34 2.85
2007 5.98 1.34 1.23 0.25 0.12 0.24 0.02 -0.14 -0.27 4.65 6.49 1.85
2008 0.73 -1.54 -0.33 0.08 -2.36 -2.32 -0.04 -0.01 1.07 2.27 0.40 -1.88
Ⅰ 6.88 4.14 1.33 0.14 0.74 0.64 0.14 -0.04 1.94 2.74 8.50 5.76
Ⅱ 5.38 -1.34 0.37 0.19 -2.06 -2.04 0.03 -0.05 0.15 6.72 6.42 -0.30
Ⅲ -0.80 -3.55 -1.57 -0.06 -3.17 -2.93 -0.15 -0.10 1.25 2.75 1.32 -1.43
Ⅳ -7.11 -4.58 -1.16 0.06 -4.47 -4.47 -0.13 0.13 0.99 -2.53 -12.69 -10.15
2009(r) -1.91 -3.29 0.77 0.42 -2.06 -2.64 0.06 0.52 -2.42 1.38 -6.39 -7.77
Ⅰ -9.06 -10.26 -1.17 0.51 -5.81 -5.72 -0.40 0.31 -3.80 1.20 -19.41 -20.61
Ⅱ -6.85 -5.72 -0.34 0.32 -4.07 -4.70 0.07 0.56 -1.63 -1.14 -12.58 -11.44
Ⅲ -0.98 -2.19 1.27 0.43 -0.97 -1.76 0.10 0.70 -2.93 1.21 -6.13 -7.34
Ⅳ(r) 9.06 4.78 3.26 0.42 2.48 1.51 0.45 0.51 -1.37 4.28 12.22 7.94
2010(f) 6.14 5.30 1.16 0.16 2.24 2.20 0.06 -0.02 1.74 0.85 11.10 10.26
Ⅰ(p) 13.27 11.31 1.95 0.19 4.03 4.23 0.05 -0.25 5.14 1.96 24.49 22.54
Ⅱ(f) 7.66 6.07 1.52 0.24 3.64 3.27 0.28 0.10 0.67 1.59 14.35 12.77
Ⅲ(f) 4.40 4.38 1.10 0.13 1.46 1.36 0.05 0.04 1.70 0.02 6.38 6.36
Ⅳ(f) 0.69 0.61 0.26 0.11 0.31 0.41 -0.10 0.00 -0.05 0.08 1.86 1.78
Exports ofGoods andServices
Less:Imports ofGoods andServices
Period
EconomicGrowth
Rate(yoy)
Sub-total Sub-totalPrivate FinalConsumption
GovernmentFinal
Consumption
Increase inStocks
Domestic Demand
Gross Fixed Capital Formation
Demand of Rest of The World
-10-
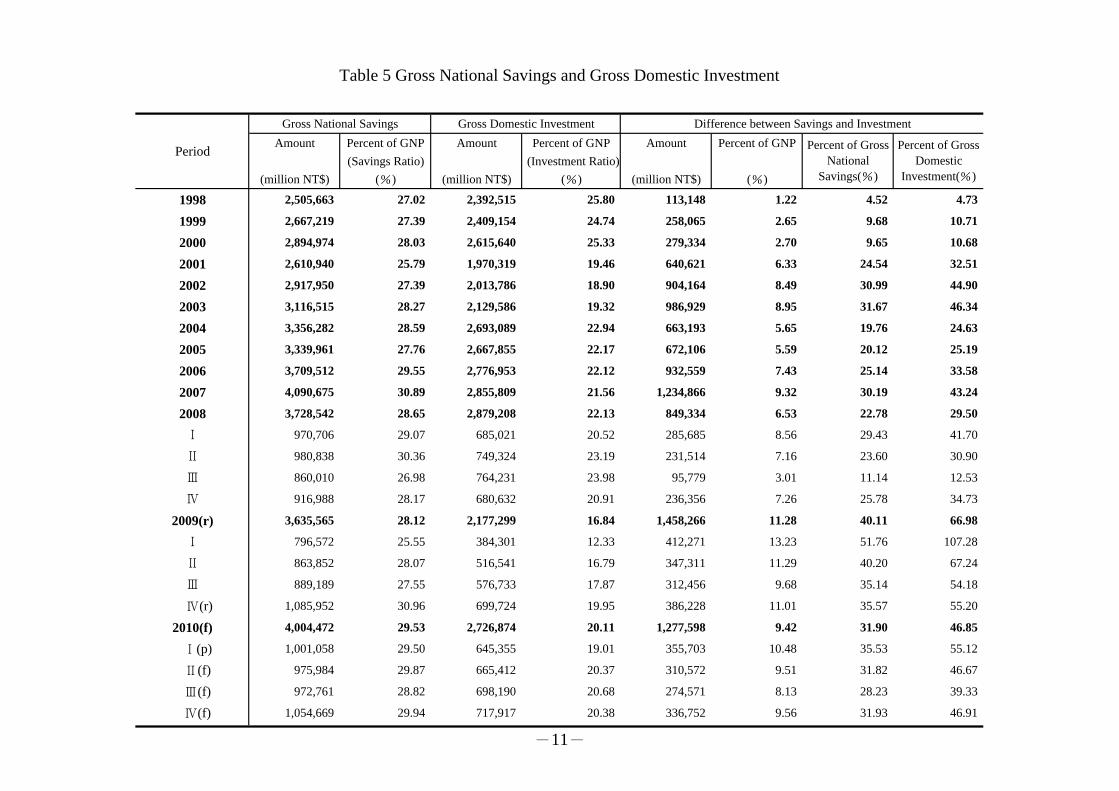
Gross National Savings Gross Domestic Investment Difference between Savings and InvestmentAmount Percent of GNP Amount Percent of GNP Amount Percent of GNP
(Savings Ratio) (Investment Ratio)(million NT$) (%) (million NT$) (%) (million NT$) (%)
1998 2,505,663 27.02 2,392,515 25.80 113,148 1.22 4.52 4.73
1999 2,667,219 27.39 2,409,154 24.74 258,065 2.65 9.68 10.71
2000 2,894,974 28.03 2,615,640 25.33 279,334 2.70 9.65 10.68
2001 2,610,940 25.79 1,970,319 19.46 640,621 6.33 24.54 32.51
2002 2,917,950 27.39 2,013,786 18.90 904,164 8.49 30.99 44.90
2003 3,116,515 28.27 2,129,586 19.32 986,929 8.95 31.67 46.34
2004 3,356,282 28.59 2,693,089 22.94 663,193 5.65 19.76 24.63
2005 3,339,961 27.76 2,667,855 22.17 672,106 5.59 20.12 25.19
2006 3,709,512 29.55 2,776,953 22.12 932,559 7.43 25.14 33.58
2007 4,090,675 30.89 2,855,809 21.56 1,234,866 9.32 30.19 43.24
2008 3,728,542 28.65 2,879,208 22.13 849,334 6.53 22.78 29.50
Ⅰ 970,706 29.07 685,021 20.52 285,685 8.56 29.43 41.70
Ⅱ 980,838 30.36 749,324 23.19 231,514 7.16 23.60 30.90
Ⅲ 860,010 26.98 764,231 23.98 95,779 3.01 11.14 12.53
Ⅳ 916,988 28.17 680,632 20.91 236,356 7.26 25.78 34.73
2009(r) 3,635,565 28.12 2,177,299 16.84 1,458,266 11.28 40.11 66.98
Ⅰ 796,572 25.55 384,301 12.33 412,271 13.23 51.76 107.28
Ⅱ 863,852 28.07 516,541 16.79 347,311 11.29 40.20 67.24
Ⅲ 889,189 27.55 576,733 17.87 312,456 9.68 35.14 54.18
Ⅳ(r) 1,085,952 30.96 699,724 19.95 386,228 11.01 35.57 55.20
2010(f) 4,004,472 29.53 2,726,874 20.11 1,277,598 9.42 31.90 46.85
Ⅰ(p) 1,001,058 29.50 645,355 19.01 355,703 10.48 35.53 55.12
Ⅱ(f) 975,984 29.87 665,412 20.37 310,572 9.51 31.82 46.67
Ⅲ(f) 972,761 28.82 698,190 20.68 274,571 8.13 28.23 39.33
Ⅳ(f) 1,054,669 29.94 717,917 20.38 336,752 9.56 31.93 46.91
Period
Table 5 Gross National Savings and Gross Domestic Investment
Percent of GrossNational
Savings(%)
Percent of GrossDomestic
Investment(%)
-11-

Table 6 Exports and Imports
Unit:million US$,%
Exports and Imports of Goods and Services (National Accounts) Custom Exports and Imports of Merchandise
Period Exports Imports Exports (FOB) Imports (CIF)
Amount Change Rate Amount Change Rate Amount Change Rate Amount Change Rate
1998 130,313 -8.47 127,453 -6.44 2,860 112,595 -9.32 105,230 -8.46 7,366
1999 141,375 8.49 133,866 5.03 7,509 123,733 9.89 111,196 5.67 12,537
2000 172,641 22.12 165,562 23.68 7,079 151,950 22.80 140,732 26.56 11,218
2001 146,753 -15.00 130,752 -21.03 16,001 126,314 -16.87 107,971 -23.28 18,344
2002 157,224 7.13 135,597 3.71 21,627 135,317 7.13 113,245 4.89 22,072
2003 172,452 9.69 150,614 11.07 21,838 150,600 11.29 128,010 13.04 22,590
2004 208,849 21.11 196,315 30.34 12,534 182,370 21.10 168,758 31.83 13,613
2005 228,152 9.24 212,041 8.01 16,111 198,432 8.81 182,614 8.21 15,817
2006 255,916 12.17 232,897 9.84 23,019 224,017 12.89 202,698 11.00 21,319
2007 283,289 10.70 252,015 8.21 31,274 246,677 10.12 219,252 8.17 27,425
2008 292,588 3.28 272,653 8.19 19,935 255,629 3.63 240,448 9.67 15,181
Ⅰ 73,687 17.65 68,840 23.92 4,847 63,997 17.54 60,673 25.97 3,324
Ⅱ 80,341 18.48 73,668 17.01 6,673 70,514 18.55 65,796 19.22 4,718
Ⅲ 79,587 6.78 77,523 16.79 2,064 69,914 8.03 69,253 19.71 660
Ⅳ 58,973 -24.69 52,622 -21.61 6,351 51,203 -24.74 44,725 -22.95 6,479
2009(r) 237,405 -18.86 203,666 -25.30 33,739 203,675 -20.32 174,371 -27.48 29,304
Ⅰ 46,918 -36.33 38,136 -44.60 8,782 40,518 -36.69 31,898 -47.43 8,620
Ⅱ 55,739 -30.62 47,438 -35.61 8,301 47,959 -31.99 40,892 -37.85 7,067
Ⅲ 64,686 -18.72 56,657 -26.92 8,029 55,324 -20.87 48,776 -29.57 6,548
Ⅳ(r) 70,062 18.80 61,435 16.75 8,627 59,874 16.93 52,805 18.07 7,069
2010(f) 295,339 24.40 265,042 30.14 30,297 253,512 24.47 229,319 31.51 24,192
Ⅰ(p) 71,870 53.18 65,046 70.56 6,824 61,795 52.51 56,915 78.43 4,879
Ⅱ(f) 74,009 32.78 66,518 40.22 7,491 63,765 32.96 57,484 40.57 6,281
Ⅲ(f) 74,593 15.32 67,223 18.65 7,370 64,098 15.86 57,932 18.77 6,166
Ⅳ(f) 74,867 6.86 66,255 7.85 8,612 63,854 6.65 56,988 7.92 6,866
Balance Balance
-12-
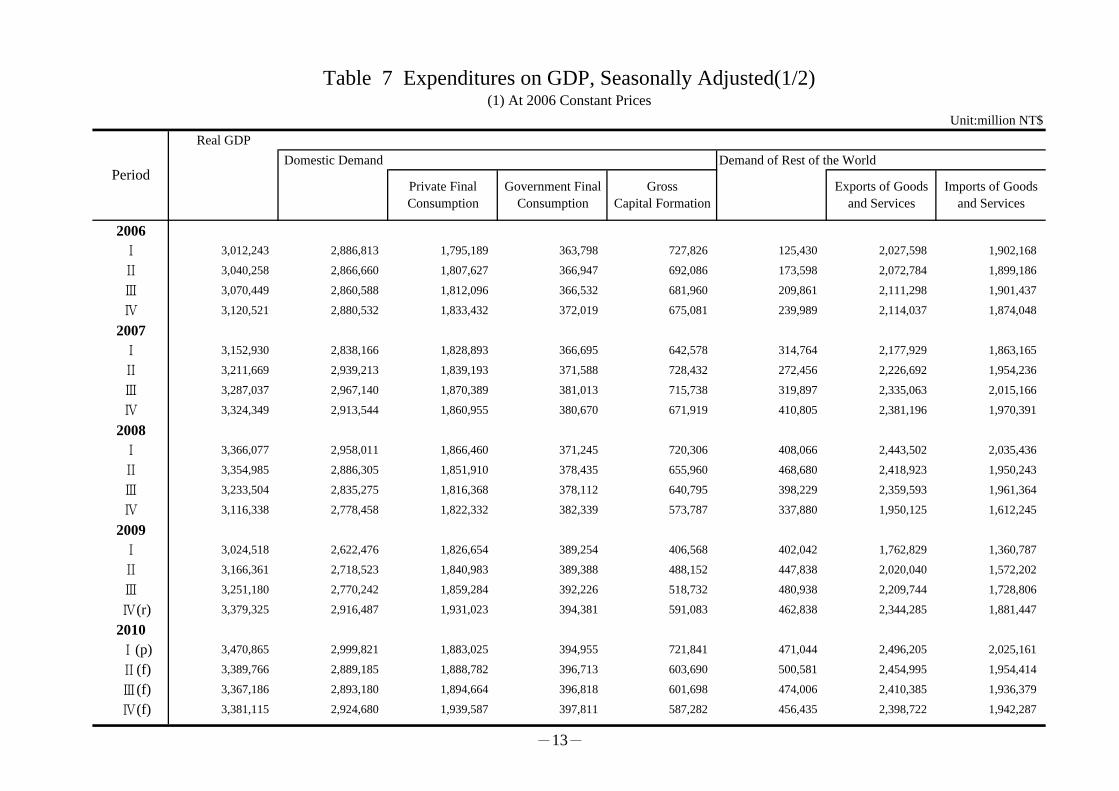
Table 7 Expenditures on GDP, Seasonally Adjusted(1/2)(1) At 2006 Constant Prices
Unit:million NT$Real GDP
Domestic Demand Demand of Rest of the World
2006Ⅰ 3,012,243 2,886,813 1,795,189 363,798 727,826 125,430 2,027,598 1,902,168
Ⅱ 3,040,258 2,866,660 1,807,627 366,947 692,086 173,598 2,072,784 1,899,186
Ⅲ 3,070,449 2,860,588 1,812,096 366,532 681,960 209,861 2,111,298 1,901,437
Ⅳ 3,120,521 2,880,532 1,833,432 372,019 675,081 239,989 2,114,037 1,874,048
2007Ⅰ 3,152,930 2,838,166 1,828,893 366,695 642,578 314,764 2,177,929 1,863,165
Ⅱ 3,211,669 2,939,213 1,839,193 371,588 728,432 272,456 2,226,692 1,954,236
Ⅲ 3,287,037 2,967,140 1,870,389 381,013 715,738 319,897 2,335,063 2,015,166
Ⅳ 3,324,349 2,913,544 1,860,955 380,670 671,919 410,805 2,381,196 1,970,391
2008Ⅰ 3,366,077 2,958,011 1,866,460 371,245 720,306 408,066 2,443,502 2,035,436
Ⅱ 3,354,985 2,886,305 1,851,910 378,435 655,960 468,680 2,418,923 1,950,243
Ⅲ 3,233,504 2,835,275 1,816,368 378,112 640,795 398,229 2,359,593 1,961,364
Ⅳ 3,116,338 2,778,458 1,822,332 382,339 573,787 337,880 1,950,125 1,612,245
2009Ⅰ 3,024,518 2,622,476 1,826,654 389,254 406,568 402,042 1,762,829 1,360,787
Ⅱ 3,166,361 2,718,523 1,840,983 389,388 488,152 447,838 2,020,040 1,572,202
Ⅲ 3,251,180 2,770,242 1,859,284 392,226 518,732 480,938 2,209,744 1,728,806
Ⅳ(r) 3,379,325 2,916,487 1,931,023 394,381 591,083 462,838 2,344,285 1,881,447
2010 Ⅰ(p) 3,470,865 2,999,821 1,883,025 394,955 721,841 471,044 2,496,205 2,025,161
Ⅱ(f) 3,389,766 2,889,185 1,888,782 396,713 603,690 500,581 2,454,995 1,954,414
Ⅲ(f) 3,367,186 2,893,180 1,894,664 396,818 601,698 474,006 2,410,385 1,936,379
Ⅳ(f) 3,381,115 2,924,680 1,939,587 397,811 587,282 456,435 2,398,722 1,942,287
Exports of Goodsand Services
Imports of Goodsand Services
PeriodPrivate FinalConsumption
Government FinalConsumption
GrossCapital Formation
-13-

Table 7 Expenditures on GDP, Seasonally Adjusted(2/2)(2) Growth Rates & Contribution
(saar) Domestic Demand Demand of Rest of the World Domestic Demand Demand of Rest of the World
2006Ⅰ 1.12 11.40 1.62 -0.70 50.15 - 2.01 18.38 10.28 0.96 -0.09 9.40 -9.16 1.35 10.51
Ⅱ 3.77 -2.76 2.80 3.51 -18.24 - 9.22 -0.63 -2.71 1.67 0.42 -4.81 6.49 6.08 -0.40
Ⅲ 4.03 -0.84 0.99 -0.45 -5.73 - 7.64 0.47 -0.81 0.60 -0.06 -1.35 4.84 5.14 0.30
Ⅳ 6.68 2.82 4.79 6.12 -3.97 - 0.52 -5.64 2.66 2.85 0.73 -0.92 4.02 0.37 -3.66
2007Ⅰ 4.22 -5.75 -0.99 -5.60 -17.91 - 12.65 -2.30 -5.52 -0.59 -0.69 -4.23 9.74 8.32 -1.42
Ⅱ 7.66 15.02 2.27 5.45 65.14 - 9.26 21.03 13.18 1.34 0.64 11.20 -5.52 6.36 11.88
Ⅲ 9.72 3.86 6.96 10.54 -6.79 - 20.94 13.07 3.60 4.02 1.22 -1.64 6.12 13.98 7.86
Ⅳ 4.62 -7.03 -2.00 -0.36 -22.33 - 8.14 -8.60 -6.63 -1.17 -0.04 -5.42 11.25 5.71 -5.54
2008Ⅰ 5.12 6.25 1.19 -9.54 32.07 - 10.88 13.87 5.45 0.67 -1.16 5.93 -0.34 7.64 7.98
Ⅱ -1.31 -9.35 -3.08 7.97 -31.22 - -3.96 -15.72 -8.48 -1.72 0.85 -7.61 7.17 -2.91 -10.07
Ⅲ -13.72 -6.89 -7.46 -0.34 -8.93 - -9.46 2.30 -5.76 -4.01 -0.04 -1.71 -7.95 -6.70 1.26
Ⅳ -13.73 -7.78 1.32 4.55 -35.71 - -53.34 -54.34 -6.66 0.70 0.50 -7.85 -7.07 -47.97 -40.90
2009Ⅰ -11.27 -20.63 0.95 7.43 -74.79 - -33.23 -49.25 -19.15 0.53 0.85 -20.53 7.88 -23.00 -30.88
Ⅱ 20.12 15.47 3.17 0.14 107.82 - 72.42 78.19 13.62 2.03 0.02 11.57 6.50 36.49 29.99
Ⅲ 11.15 7.83 4.04 2.95 27.51 - 43.20 46.20 6.80 2.41 0.37 4.02 4.35 24.95 20.59
Ⅳ(r) 16.72 22.85 16.35 2.22 68.59 - 26.67 40.28 19.08 9.36 0.28 9.44 -2.36 17.56 19.92
2010 Ⅰ(p) 11.28 11.93 -9.58 0.58 122.42 - 28.55 34.24 10.27 -5.92 0.07 16.12 1.01 18.73 17.71
Ⅱ(f) -9.02 -13.96 1.23 1.79 -51.08 - -6.44 -13.26 -12.31 0.64 0.20 -13.15 3.29 -4.59 -7.87
Ⅲ(f) -2.64 0.55 1.25 0.11 -1.31 - -7.07 -3.64 0.47 0.69 0.01 -0.23 -3.10 -5.21 -2.11
Ⅳ(f) 1.66 4.43 9.83 1.00 -9.24 - -1.92 1.23 3.77 5.37 0.12 -1.72 -2.10 -1.39 0.71
PeriodPrivate FinalConsumption
GovernmentFinal
Consumption
GrossCapital
Formation
Growth Rate (%)
Exports ofGoods andServices
Imports ofGoods andServices
Private FinalConsumption
GovernmentFinal
Consumption
Contribution (percentage points)
GrossCapital
Formation
Exports ofGoods andServices
Imports ofGoods andServices
-14-
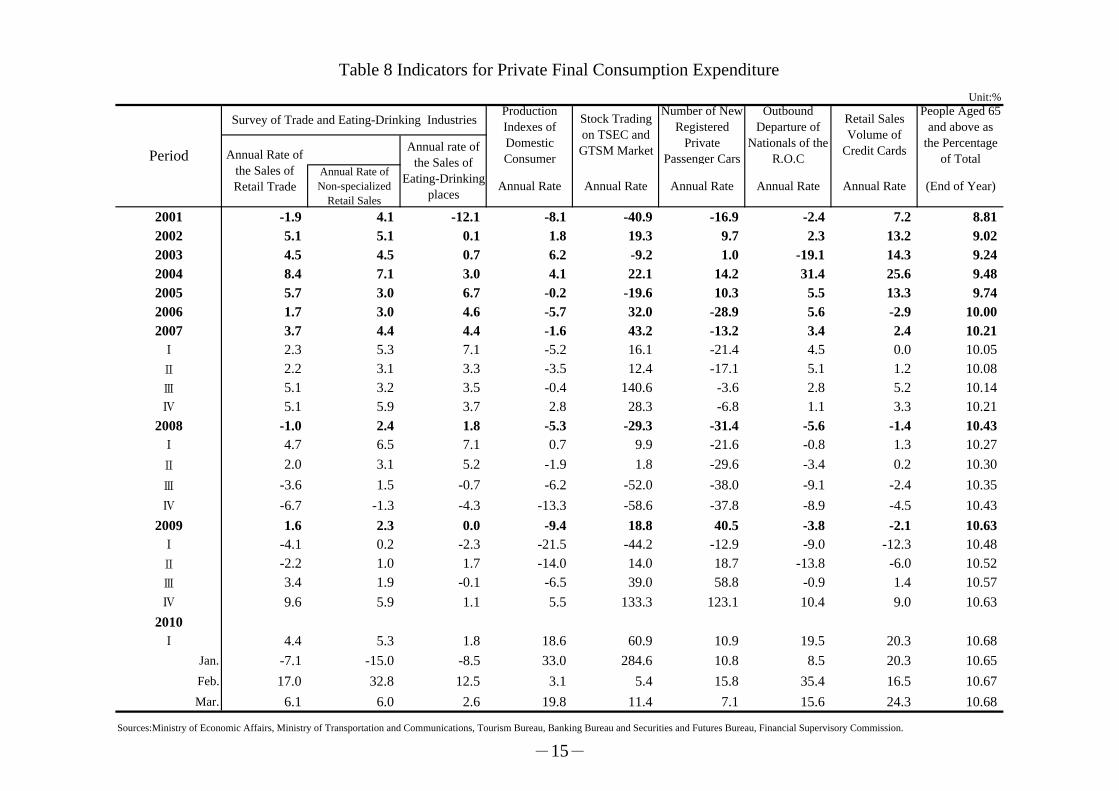
Table 8 Indicators for Private Final Consumption ExpenditureUnit:%
Annual Rate ofNon-specialized
Retail SalesAnnual Rate Annual Rate Annual Rate Annual Rate Annual Rate (End of Year)
2001 -1.9 4.1 -12.1 -8.1 -40.9 -16.9 -2.4 7.2 8.812002 5.1 5.1 0.1 1.8 19.3 9.7 2.3 13.2 9.022003 4.5 4.5 0.7 6.2 -9.2 1.0 -19.1 14.3 9.242004 8.4 7.1 3.0 4.1 22.1 14.2 31.4 25.6 9.482005 5.7 3.0 6.7 -0.2 -19.6 10.3 5.5 13.3 9.742006 1.7 3.0 4.6 -5.7 32.0 -28.9 5.6 -2.9 10.002007 3.7 4.4 4.4 -1.6 43.2 -13.2 3.4 2.4 10.21Ⅰ 2.3 5.3 7.1 -5.2 16.1 -21.4 4.5 0.0 10.05Ⅱ 2.2 3.1 3.3 -3.5 12.4 -17.1 5.1 1.2 10.08Ⅲ 5.1 3.2 3.5 -0.4 140.6 -3.6 2.8 5.2 10.14Ⅳ 5.1 5.9 3.7 2.8 28.3 -6.8 1.1 3.3 10.21
2008 -1.0 2.4 1.8 -5.3 -29.3 -31.4 -5.6 -1.4 10.43Ⅰ 4.7 6.5 7.1 0.7 9.9 -21.6 -0.8 1.3 10.27Ⅱ 2.0 3.1 5.2 -1.9 1.8 -29.6 -3.4 0.2 10.30Ⅲ -3.6 1.5 -0.7 -6.2 -52.0 -38.0 -9.1 -2.4 10.35Ⅳ -6.7 -1.3 -4.3 -13.3 -58.6 -37.8 -8.9 -4.5 10.43
2009 1.6 2.3 0.0 -9.4 18.8 40.5 -3.8 -2.1 10.63Ⅰ -4.1 0.2 -2.3 -21.5 -44.2 -12.9 -9.0 -12.3 10.48Ⅱ -2.2 1.0 1.7 -14.0 14.0 18.7 -13.8 -6.0 10.52Ⅲ 3.4 1.9 -0.1 -6.5 39.0 58.8 -0.9 1.4 10.57Ⅳ 9.6 5.9 1.1 5.5 133.3 123.1 10.4 9.0 10.63
2010Ⅰ 4.4 5.3 1.8 18.6 60.9 10.9 19.5 20.3 10.68
Jan. -7.1 -15.0 -8.5 33.0 284.6 10.8 8.5 20.3 10.65Feb. 17.0 32.8 12.5 3.1 5.4 15.8 35.4 16.5 10.67Mar. 6.1 6.0 2.6 19.8 11.4 7.1 15.6 24.3 10.68
Sources:Ministry of Economic Affairs, Ministry of Transportation and Communications, Tourism Bureau, Banking Bureau and Securities and Futures Bureau, Financial Supervisory Commission.
People Aged 65and above as
the Percentageof TotalAnnual Rate of
the Sales ofRetail Trade
Annual rate ofthe Sales of
Eating-Drinkingplaces
Stock Tradingon TSEC andGTSM Market
Number of NewRegistered
PrivatePassenger Cars
Survey of Trade and Eating-Drinking Industries
Period
ProductionIndexes ofDomesticConsumer
OutboundDeparture of
Nationals of theR.O.C
Retail SalesVolume of
Credit Cards
-15-
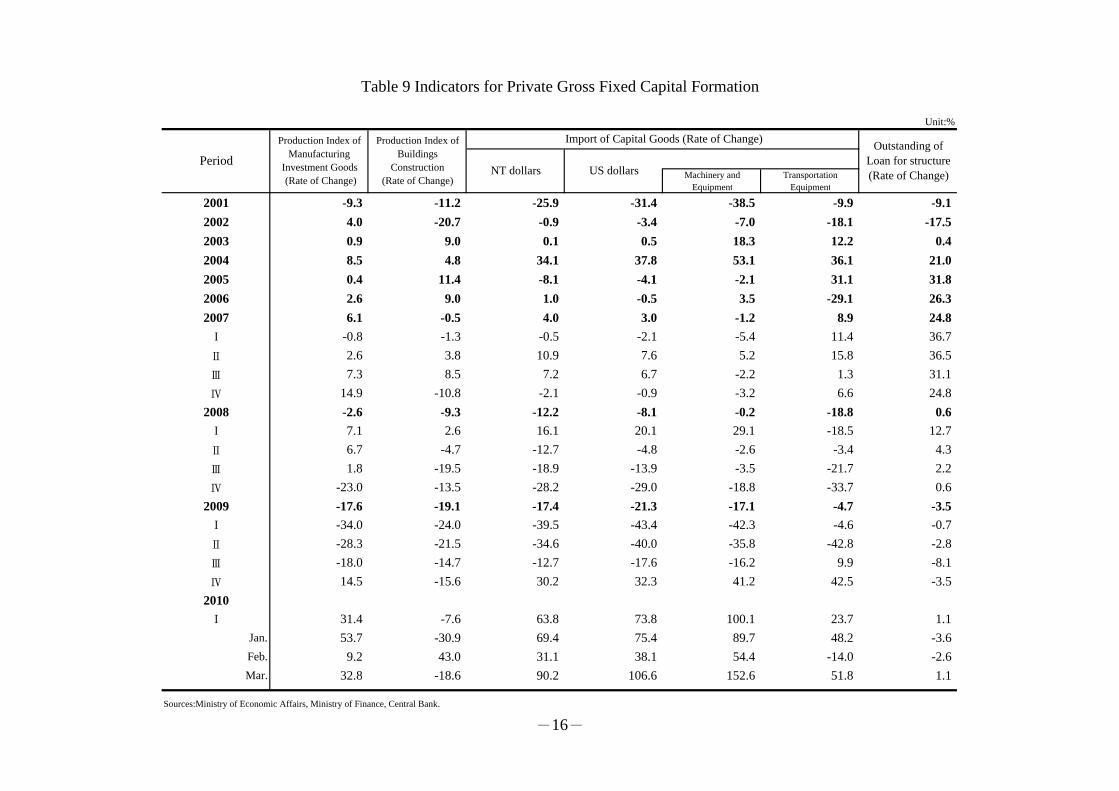
Table 9 Indicators for Private Gross Fixed Capital Formation
Unit:%
Machinery andEquipment
TransportationEquipment
2001 -9.3 -11.2 -25.9 -31.4 -38.5 -9.9 -9.12002 4.0 -20.7 -0.9 -3.4 -7.0 -18.1 -17.52003 0.9 9.0 0.1 0.5 18.3 12.2 0.42004 8.5 4.8 34.1 37.8 53.1 36.1 21.02005 0.4 11.4 -8.1 -4.1 -2.1 31.1 31.82006 2.6 9.0 1.0 -0.5 3.5 -29.1 26.32007 6.1 -0.5 4.0 3.0 -1.2 8.9 24.8Ⅰ -0.8 -1.3 -0.5 -2.1 -5.4 11.4 36.7Ⅱ 2.6 3.8 10.9 7.6 5.2 15.8 36.5Ⅲ 7.3 8.5 7.2 6.7 -2.2 1.3 31.1Ⅳ 14.9 -10.8 -2.1 -0.9 -3.2 6.6 24.8
2008 -2.6 -9.3 -12.2 -8.1 -0.2 -18.8 0.6Ⅰ 7.1 2.6 16.1 20.1 29.1 -18.5 12.7Ⅱ 6.7 -4.7 -12.7 -4.8 -2.6 -3.4 4.3Ⅲ 1.8 -19.5 -18.9 -13.9 -3.5 -21.7 2.2Ⅳ -23.0 -13.5 -28.2 -29.0 -18.8 -33.7 0.6
2009 -17.6 -19.1 -17.4 -21.3 -17.1 -4.7 -3.5Ⅰ -34.0 -24.0 -39.5 -43.4 -42.3 -4.6 -0.7Ⅱ -28.3 -21.5 -34.6 -40.0 -35.8 -42.8 -2.8Ⅲ -18.0 -14.7 -12.7 -17.6 -16.2 9.9 -8.1Ⅳ 14.5 -15.6 30.2 32.3 41.2 42.5 -3.5
2010Ⅰ 31.4 -7.6 63.8 73.8 100.1 23.7 1.1
Jan. 53.7 -30.9 69.4 75.4 89.7 48.2 -3.6Feb. 9.2 43.0 31.1 38.1 54.4 -14.0 -2.6Mar. 32.8 -18.6 90.2 106.6 152.6 51.8 1.1
Sources:Ministry of Economic Affairs, Ministry of Finance, Central Bank.
Outstanding ofLoan for structure(Rate of Change)
PeriodNT dollars US dollars
Import of Capital Goods (Rate of Change)Production Index ofManufacturing
Investment Goods (Rate of Change)
Production Index ofBuildings
Construction(Rate of Change)
-16-
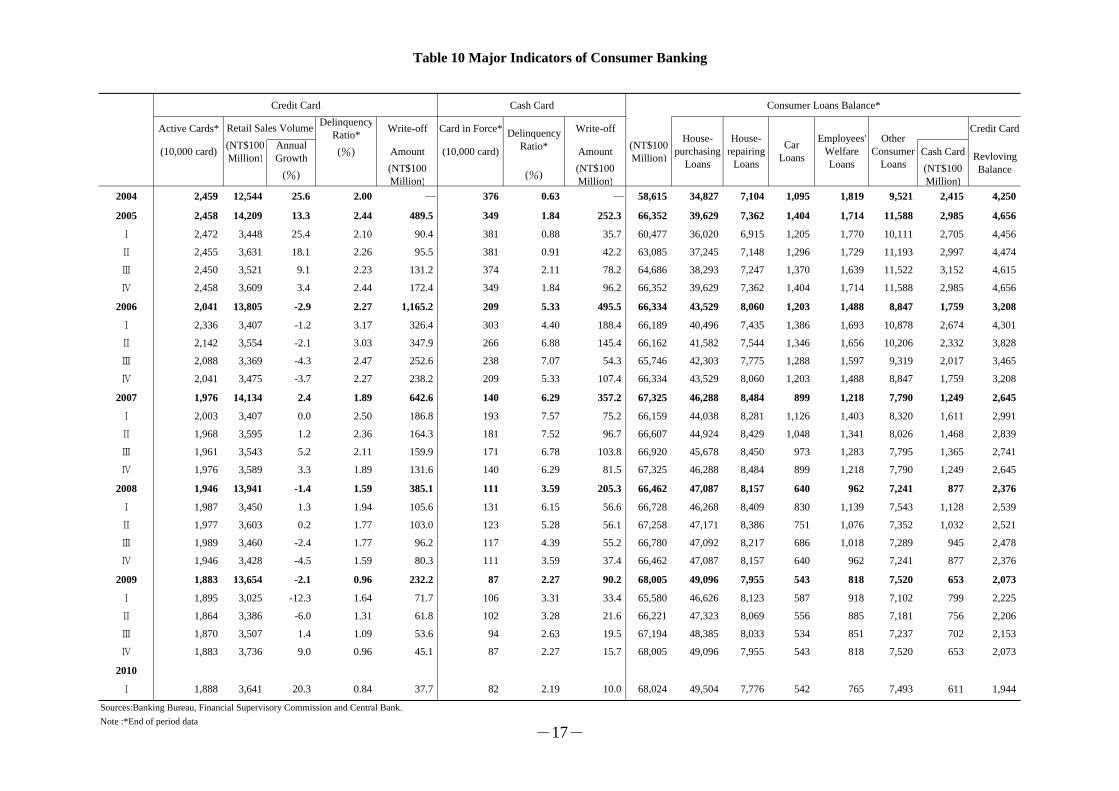
Table 10 Major Indicators of Consumer Banking
Credit Card Cash Card Consumer Loans Balance*
Active Cards* DelinquencyRatio* Write-off Card in Force* Write-off Credit Card
(10,000 card) (NT$100Million)
AnnualGrowth (%) Amount (10,000 card) Amount (NT$100
Million) Cash Card
(%) (NT$100Million) (%) (NT$100
Million)(NT$100Million)
2004 2,459 12,544 25.6 2.00 ─ 376 0.63 ─ 58,615 34,827 7,104 1,095 1,819 9,521 2,415 4,250
2005 2,458 14,209 13.3 2.44 489.5 349 1.84 252.3 66,352 39,629 7,362 1,404 1,714 11,588 2,985 4,656
Ⅰ 2,472 3,448 25.4 2.10 90.4 381 0.88 35.7 60,477 36,020 6,915 1,205 1,770 10,111 2,705 4,456
Ⅱ 2,455 3,631 18.1 2.26 95.5 381 0.91 42.2 63,085 37,245 7,148 1,296 1,729 11,193 2,997 4,474
Ⅲ 2,450 3,521 9.1 2.23 131.2 374 2.11 78.2 64,686 38,293 7,247 1,370 1,639 11,522 3,152 4,615
Ⅳ 2,458 3,609 3.4 2.44 172.4 349 1.84 96.2 66,352 39,629 7,362 1,404 1,714 11,588 2,985 4,656
2006 2,041 13,805 -2.9 2.27 1,165.2 209 5.33 495.5 66,334 43,529 8,060 1,203 1,488 8,847 1,759 3,208
Ⅰ 2,336 3,407 -1.2 3.17 326.4 303 4.40 188.4 66,189 40,496 7,435 1,386 1,693 10,878 2,674 4,301
Ⅱ 2,142 3,554 -2.1 3.03 347.9 266 6.88 145.4 66,162 41,582 7,544 1,346 1,656 10,206 2,332 3,828
Ⅲ 2,088 3,369 -4.3 2.47 252.6 238 7.07 54.3 65,746 42,303 7,775 1,288 1,597 9,319 2,017 3,465
Ⅳ 2,041 3,475 -3.7 2.27 238.2 209 5.33 107.4 66,334 43,529 8,060 1,203 1,488 8,847 1,759 3,208
2007 1,976 14,134 2.4 1.89 642.6 140 6.29 357.2 67,325 46,288 8,484 899 1,218 7,790 1,249 2,645
Ⅰ 2,003 3,407 0.0 2.50 186.8 193 7.57 75.2 66,159 44,038 8,281 1,126 1,403 8,320 1,611 2,991
Ⅱ 1,968 3,595 1.2 2.36 164.3 181 7.52 96.7 66,607 44,924 8,429 1,048 1,341 8,026 1,468 2,839
Ⅲ 1,961 3,543 5.2 2.11 159.9 171 6.78 103.8 66,920 45,678 8,450 973 1,283 7,795 1,365 2,741
Ⅳ 1,976 3,589 3.3 1.89 131.6 140 6.29 81.5 67,325 46,288 8,484 899 1,218 7,790 1,249 2,645
2008 1,946 13,941 -1.4 1.59 385.1 111 3.59 205.3 66,462 47,087 8,157 640 962 7,241 877 2,376
Ⅰ 1,987 3,450 1.3 1.94 105.6 131 6.15 56.6 66,728 46,268 8,409 830 1,139 7,543 1,128 2,539
Ⅱ 1,977 3,603 0.2 1.77 103.0 123 5.28 56.1 67,258 47,171 8,386 751 1,076 7,352 1,032 2,521
Ⅲ 1,989 3,460 -2.4 1.77 96.2 117 4.39 55.2 66,780 47,092 8,217 686 1,018 7,289 945 2,478
Ⅳ 1,946 3,428 -4.5 1.59 80.3 111 3.59 37.4 66,462 47,087 8,157 640 962 7,241 877 2,376
2009 1,883 13,654 -2.1 0.96 232.2 87 2.27 90.2 68,005 49,096 7,955 543 818 7,520 653 2,073
Ⅰ 1,895 3,025 -12.3 1.64 71.7 106 3.31 33.4 65,580 46,626 8,123 587 918 7,102 799 2,225
Ⅱ 1,864 3,386 -6.0 1.31 61.8 102 3.28 21.6 66,221 47,323 8,069 556 885 7,181 756 2,206
Ⅲ 1,870 3,507 1.4 1.09 53.6 94 2.63 19.5 67,194 48,385 8,033 534 851 7,237 702 2,153
Ⅳ 1,883 3,736 9.0 0.96 45.1 87 2.27 15.7 68,005 49,096 7,955 543 818 7,520 653 2,073
2010
Ⅰ 1,888 3,641 20.3 0.84 37.7 82 2.19 10.0 68,024 49,504 7,776 542 765 7,493 611 1,944
Sources:Banking Bureau, Financial Supervisory Commission and Central Bank.Note :*End of period data
Retail Sales Volume DelinquencyRatio*
House-purchasing
LoansRevlovingBalance
House-repairing
Loans
CarLoans
Employees'WelfareLoans
OtherConsumer
Loans
-17-

Table 11 Economic Growth Rates of Major CountriesUnit:%
US Canada Japan EU27 Germany France Italy UK China Taiwan HK South Indonesia Malaysia Philippines Thailand
SAAR(1) SAAR(1) (SA) (SA) (SA) (SA) (SA) Korea SAAR(1)
1998 4.4 4.4 4.1 -2.0 -2.0 3.0 2.0 3.5 1.4 3.6 7.8 3.47 -6.0 -5.7 -2.1 -2.1 -13.1 -7.4 -0.6 -10.5
1999 4.8 4.8 5.5 -0.1 -0.1 3.0 2.0 3.3 1.5 3.5 7.6 5.97 2.6 10.7 6.2 6.2 0.8 6.1 3.4 4.4
2000 4.1 4.1 5.2 2.9 2.9 3.9 3.2 3.9 3.7 3.9 8.4 5.80 8.0 8.8 9.1 9.1 5.4 8.9 6.0 4.8
2001 1.1 1.1 1.8 0.2 0.2 2.0 1.2 1.9 1.8 2.5 8.3 -1.65 0.5 4.0 -1.2 -1.2 3.6 0.5 1.8 2.2
2002 1.8 1.8 2.9 0.3 0.3 1.2 0.0 1.0 0.5 2.1 9.1 5.26 1.8 7.2 4.2 4.2 4.5 5.4 4.4 5.3
2003 2.5 2.5 1.9 1.4 1.4 1.3 -0.2 1.1 0.0 2.8 10.0 3.67 3.0 2.8 4.6 4.6 4.8 5.8 4.9 7.1
2004 3.6 3.6 3.1 2.7 2.7 2.5 1.2 2.5 1.5 3.0 10.1 6.19 8.5 4.6 9.2 9.2 5.0 6.8 6.4 6.3
2005 3.1 3.1 3.0 1.9 1.9 2.0 0.8 1.9 0.7 2.2 10.4 4.70 7.1 4.0 7.4 7.4 5.7 5.3 5.0 4.6
2006 2.7 2.7 2.9 2.0 2.0 3.2 3.2 2.2 2.0 2.9 11.6 5.44 7.0 5.2 8.6 8.6 5.5 5.8 5.3 5.1
2007 2.1 2.1 2.5 2.4 2.4 2.9 2.5 2.4 1.5 2.6 13.0 5.98 6.4 5.1 8.5 8.5 6.3 6.2 7.1 4.9Ⅰ 1.4 1.2 1.8 3.5 4.4 3.4 3.8 2.6 2.3 2.4 … 4.45 5.6 4.5 … 11.8 6.0 5.4 6.9 4.6Ⅱ 1.9 3.2 2.6 2.3 1.0 2.8 2.6 2.0 1.8 2.7 … 5.70 6.1 5.3 … 6.7 6.6 5.6 8.3 4.5Ⅲ 2.7 3.6 3.0 1.7 -0.1 2.8 2.5 2.6 1.5 2.7 … 7.08 6.8 4.9 … 8.4 6.6 6.5 6.8 5.3Ⅳ 2.5 2.1 2.8 1.9 1.9 2.4 1.6 2.2 0.0 2.4 … 6.51 6.9 5.7 … -0.6 5.9 7.2 6.3 5.3
2008 0.4 0.4 0.4 -1.2 -1.2 0.7 1.3 0.2 -1.3 0.5 9.6 0.73 2.2 2.3 1.8 1.8 6.1 4.6 3.8 2.5Ⅰ 2.0 -0.7 1.7 1.2 1.2 2.3 2.9 1.9 0.3 2.4 … 6.88 7.0 5.5 7.4 17.6 6.2 7.4 3.9 6.4Ⅱ 1.6 1.5 0.7 -0.4 -4.0 1.7 2.0 0.7 -0.4 1.7 … 5.38 4.0 4.4 2.7 -12.5 6.4 6.6 4.2 5.2Ⅲ 0.0 -2.7 0.3 -1.4 -4.2 0.5 0.8 -0.2 -1.8 0.2 … -0.80 1.1 3.3 0.0 -3.0 6.4 4.8 4.6 2.9Ⅳ -1.9 -5.4 -1.0 -4.1 -9.6 -1.9 -1.8 -2.0 -3.3 -2.1 … -7.11 -2.7 -3.3 -2.5 -9.0 5.2 0.1 2.9 -4.2
2009(r) -2.4 -2.4 -2.6 -5.2 -5.2 -4.2 -5.0 -2.6 -5.0 -4.9 8.7 -1.91 -2.8 0.2 -1.3 -1.3 4.1 -1.7 0.9 -2.3Ⅰ -3.3 -6.4 -2.5 -8.9 -15.9 -5.0 -6.7 -3.9 -6.5 -5.3 6.2 -9.06 -7.7 -4.3 -8.9 -11.0 4.4 -6.2 0.6 -7.1Ⅱ -3.8 -0.7 -3.5 -5.7 7.4 -5.0 -5.8 -3.2 -6.1 -5.9 7.9 -6.85 -3.8 -2.2 -1.7 -18.5 4.0 -3.9 0.8 -4.9Ⅲ -2.6 2.2 -3.3 -5.2 0.5 -4.3 -4.8 -2.6 -4.7 -5.3 9.1 -0.98 -2.4 1.0 1.8 -11.1 4.2 -1.2 0.4 -2.7
Ⅳ(r) 0.1 5.6 -1.2 -1.1 4.2 -2.3 -2.2 -0.4 -2.8 -3.1 10.7 9.06 2.5 6.0 3.8 -1.0 5.4 4.4 1.8 5.8
2010(f) 3.5 ... 3.4 2.0 ... 1.0 1.8 1.3 0.8 1.1 11.0 6.14 5.2 5.6 9.0 ... 5.7 6.5 4.2 6.3
Ⅰ(p) 2.5 3.2 ... 4.6 4.9 0.3 1.5 1.2 0.6 -0.3 11.9 13.27 8.2 7.8 15.5 38.6 5.7 10.1 ... ...
Note:(1)Seasonal adjusted annualized rate (quarter on quarter).
PeriodSingapore
-18-

Table 12 TSEC Listed and GTSM Companies Earnings Condition (Parent Company, Non-consolidated Financial Statements )
Operating Margin Operating Income Pre-Tax Income Net Income
Margin Ratio(%) Income Ratio(%)Amount (NT$100 Million)
2004 102,483 19,352 18.88 10,692 10.43 12,388 11,3622005 116,146 17,686 15.23 8,488 7.31 10,566 9,6232006 133,022 19,765 14.86 9,953 7.48 13,495 11,8852007 158,110 22,938 14.51 12,445 7.87 17,342 15,5562008 158,266 16,491 10.42 5,439 3.44 5,365 4,150
I 39,872 5,314 13.33 2,619 6.57 3,121 2,700II 40,777 5,591 13.71 2,776 6.81 3,696 3,076III 42,991 4,887 11.37 2,015 4.69 2,838 2,394IV 34,626 699 2.02 -1,971 -5.69 -4,290 -4,020
2009 146,500 17,082 11.66 6,429 4.39 8,974 7,801I 29,306 2,360 8.05 7 0.02 158 20II 33,961 3,895 11.47 1,316 3.88 1,846 1,456III 39,933 5,407 13.54 2,651 6.64 3,753 3,390IV 43,300 5,420 12.52 2,455 5.67 3,217 2,935
2010I 41,955 5,540 13.20 2,863 6.82 3,880 3,473
Annual Growth Rate(%) or Changes in percentage points2005 13.33 -8.61 -3.66 -20.61 -3.12 -14.71 -15.302006 14.53 11.75 -0.37 17.25 0.17 27.72 23.512007 18.86 16.06 -0.35 25.04 0.39 28.51 30.89
I 15.66 7.94 -1.04 8.44 -0.52 13.52 10.12II 19.36 20.34 0.12 33.80 0.90 40.98 44.62III 22.67 24.22 0.20 39.63 1.13 40.18 45.49IV 17.58 11.21 -0.73 17.00 -0.03 16.68 21.33
2008 0.10 -28.11 -4.09 -56.29 -4.43 -69.06 -73.32I 14.10 4.15 -1.27 -3.42 -1.19 -17.86 -18.70II 9.92 -1.12 -1.53 -10.09 -1.52 -16.71 -20.85III 3.10 -25.10 -4.28 -47.85 -4.58 -49.22 -53.12IV -21.97 -87.64 -10.73 - -11.96 - -
2009 -7.43 3.58 1.24 18.20 0.95 67.27 87.98I -26.50 -55.59 -5.27 -99.73 -6.54 -94.94 -99.26II -16.72 -30.33 -2.24 -52.59 -2.93 -50.05 -52.67III -7.11 10.64 2.17 31.56 1.95 32.24 41.60IV 25.05 675.39 10.50 - 11.36 - -
2010I 43.16 134.75 5.15 40,800.00 6.80 2,355.70 17,265.00
Operating Revenue
-19-