gross domestic product for guam increases … · the growth in the guam economy reflected increases...
TRANSCRIPT

EMBARGOED UNTIL RELEASE AT 8:00 P.M. EDT, Wednesday, September 21, 2016 BEA 16-50
Technical: Kevin Furlong (BEA) (301) 278-9075 [email protected] Media: Jeannine Aversa (BEA) (301) 278-9003 [email protected]
Tanya Harris Joshua (OIA) (202) 208-6008 [email protected]
GROSS DOMESTIC PRODUCT FOR GUAM INCREASES IN 2015 Tourism Spending Increases for the Second Year in a Row
HAGÅTÑA, GUAM (September 22, 2016) -- Today, the Bureau of Economic Analysis (BEA) is releasing estimates of gross domestic product (GDP) for Guam for 2015, in addition to estimates of GDP by industry and compensation by industry for 2014.1 These estimates were developed under the Statistical Improvement Program funded by the Office of Insular Affairs (OIA) of the U.S. Department of the Interior.
Revised estimates of GDP for 2013 and 2014, as well as revised estimates of GDP by industry and compensation by industry for 2013, are presented in this release.
Gross Domestic Product for 2015 The estimates of GDP for Guam show that real GDP–GDP adjusted to remove price changes–increased 0.4 percent in 2015 after increasing 1.3 percent in 2014 (see Table 1.3). For comparison, real GDP for the United States (excluding the territories) increased 2.6 percent in 2015 after increasing 2.4 percent in 2014.
1 These estimates are based on limited source data and are subject to revision.
0.0
0.5
1.0
1.5
2.0
2.5
2008 2009 2010 2011 2012 2013 2014 2015
Real GDP: Percent change from preceding year
U.S. Bureau of Economic Analysis

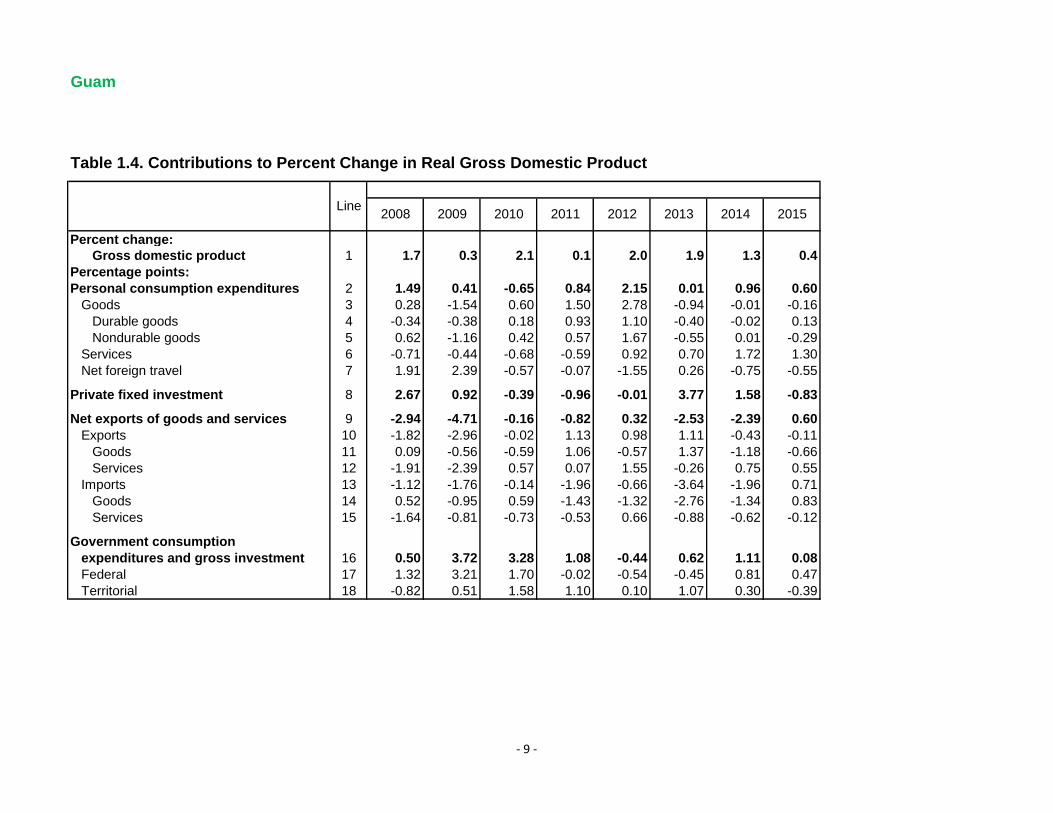
The growth in the Guam economy reflected increases in consumer spending, exports of services, and federal government spending (see Table 1.4). These increases were partly offset by a decrease in private fixed investment.
Consumer spending continued to increase in 2015, supported by growth in compensation and decreases in consumer prices.
Exports of services, which consists primarily of spending by tourists, grew for a second consecutive year. The increase reflected growth in Korean visitor arrivals and average spending by Korean tourists.
Federal government spending also increased for a second year. The increase in 2015 reflected growth in defense construction spending; major projects included fuel pipeline and aircraft maintenance hangar construction to support operations at Andersen Air Force Base.
Private fixed investment, which is spending by businesses on construction and equipment, declined in 2015 after posting strong growth in the previous two years. A number of major projects, including the construction of Guam’s first private hospital and a new luxury hotel in Tumon Bay, were near completion early in the year.
Gross Domestic Product by Industry and Compensation by Industry for 2014 The estimates of GDP by industry for Guam show that the private sector was the primary source of the increase in real GDP in 2014 (see Table 2.5). The largest contributor to growth was the accommodations and amusement sector, reflecting growth in spending by tourists. The government sector also expanded, primarily reflecting growth in the territorial government.
The compensation by industry estimates, which are measured in current dollars, show trends in compensation for major industries (see Table 2.6). Total compensation increased in 2014, reflecting increases in all sectors. The largest contributor was the territorial government.
The accompanying tables present estimates for GDP and its major components, GDP by industry, and compensation by industry. Also included in this release are estimates for the major components of gross domestic income.
Revisions to GDP Estimates for 2013 and 2014 that were released on December 2, 2015 have been revised in order to incorporate improvements to source data, including:
newly available data for territorial government spending from government financial statements, and
updated employment information from the Guam Bureau of Labor Statistics.
The revised estimates show a similar pattern of inflation-adjusted growth as the previously published estimates (see Table 1.7).
- 2 -

Future directions Moving forward, an agreement between OIA and BEA will extend and improve the estimates of GDP for Guam. The information provided by the Guam government will continue to be critical to the successful production of these estimates.
BEA currently plans to release GDP estimates for 2016 in the summer of 2017. GDP by industry and compensation by industry estimates for 2015 will also be released at the same time.
- more -
- 3 -

Additional Information
Resources
Stay informed about BEA developments by reading the BEA blog, signing up for BEA’s email subscription service, or following BEA on Twitter @BEA_News.
Historical time series for these estimates can be accessed at BEA’s Gross Domestic Product (GDP) for the U.S. Territories.
Access BEA data by registering for BEA’s Data Application Programming Interface (API).
For more on BEA’s statistics, see our monthly online journal, the Survey of Current Business.
BEA's news release schedule
Definitions Gross domestic product (GDP) is the value of the goods and services produced by the Guam economy less the value of the goods and services used up in production. GDP is also equal to the sum of personal consumption expenditures, private fixed investment, net exports of goods and services, and government consumption expenditures and gross investment. Personal consumption expenditures (PCE), also referred to as “consumer spending,” measures the goods and services purchased by “persons”—that is, by households and by nonprofit institutions serving households (NPISHs)—who are resident in Guam. Private fixed investment (PFI) measures spending by private businesses, nonprofit institutions, and households on fixed assets in the Guam economy. Fixed assets consist of structures, equipment, and software that are used in the production of goods and services. Net exports of goods and services is the difference between exports of goods and services and imports of goods and services. Exports measures the portion of total Guam production of goods and services that is provided to the rest of the world. Imports measures the portion of
total Guam expenditures that is accounted for by goods and services provided by the rest of the world. Government consumption expenditures and gross investment, or “government spending,” measures the portion of GDP that is accounted for by the government sector. Government consumption expenditures consists of spending by government to produce and provide services to the public. Gross investment consists of spending by government for fixed assets that directly benefit the public or that assist government agencies in their production activities. Gross domestic income (GDI) is the sum of incomes earned and costs incurred in the production of GDP. In national economic accounting, GDP and GDI are conceptually equal. Current-dollar estimates are valued in the prices of the period when the transactions occurred—that is, at “market value.” Also referred to as “nominal estimates” or as “current-price estimates.” Real values are inflation-adjusted estimates—that is, estimates that exclude the effects of price changes.
Statistical Conventions Quantities and prices. Quantities, or “real” volume measures, and prices are expressed as index numbers with a specified reference year equal to 100 (currently 2009). Quantity and price indexes are calculated using a Fisher chain-weighted formula that incorporates weights from two adjacent years. “Real” dollar series are calculated by multiplying the quantity index by the current-dollar value in the reference year (2009) and then dividing by 100. Chained-dollar values are not additive because the relative weights for a given period differ from those of the reference year.
- 4 -

List of News Release Tables
Table 1.1. Gross Domestic Product Table 1.2. Real Gross Domestic Product, Chained Dollars Table 1.3. Percent Change From Preceding Year in Real Gross Domestic Product Table 1.4. Contributions to Percent Change in Real Gross Domestic Product Table 1.5. Percent Change From Preceding Year in Prices for Gross Domestic Product and Price
Indexes for Gross Domestic Product Table 1.6. Gross Domestic Income Table 1.7. Revisions to Percent Change in Real Gross Domestic Product Table 2.1. Value Added by Industry Table 2.2. Value Added by Industry as a Percentage of GDP Table 2.3. Real Value Added by Industry Table 2.4. Percent Changes in Real Value Added by Industry Table 2.5. Contributions to Percent Change in Real Gross Domestic Product by Industry Table 2.6. Compensation of Employees by Industry
- 5 -

1. Domestic Product and Income
Gross domestic product 1 4,375 4,621 4,781 4,895 4,928 5,199 5,364 5,566 5,734
Personal consumption expenditures 2 2,536 2,753 2,813 2,816 2,905 3,153 3,156 3,236 3,240
Goods 3 1,414 1,512 1,448 1,462 1,564 1,765 1,700 1,710 1,669
Durable goods 4 518 542 520 523 564 635 601 594 586
Nondurable goods 5 897 970 928 939 1,001 1,130 1,099 1,116 1,083
Services 6 2,007 2,076 2,100 2,123 2,131 2,279 2,327 2,459 2,542
Net foreign travel 7 -885 -835 -735 -769 -790 -892 -871 -932 -971
Private fixed investment 8 921 1,057 1,081 1,057 1,027 1,044 1,254 1,357 1,301
Net exports of goods and services 9 -1,483 -1,699 -1,801 -1,873 -2,021 -2,033 -2,164 -2,292 -2,102
Exports 10 1,005 973 838 846 928 1,004 1,053 1,050 1,050
Goods 11 115 133 98 73 133 107 177 112 73
Services 12 890 840 740 774 795 897 876 938 977
Imports 13 2,489 2,673 2,639 2,719 2,949 3,037 3,218 3,342 3,152
Goods 14 2,018 2,115 2,051 2,098 2,289 2,395 2,518 2,598 2,404
Services 15 470 558 588 621 661 642 699 744 749
Government consumption
expenditures and gross investment 16 2,402 2,510 2,688 2,894 3,017 3,035 3,118 3,265 3,295
Federal 17 1,491 1,597 1,738 1,854 1,895 1,898 1,888 1,968 2,008
Territorial 18 911 913 950 1,039 1,121 1,138 1,230 1,296 1,288
20102009 2011 2012 2013 2015
NOTE. Detail may not add to total because of rounding.
Guam
Table 1.1. Gross Domestic Product
[Millions of dollars]
2014Line
2007 2008
- 6 -
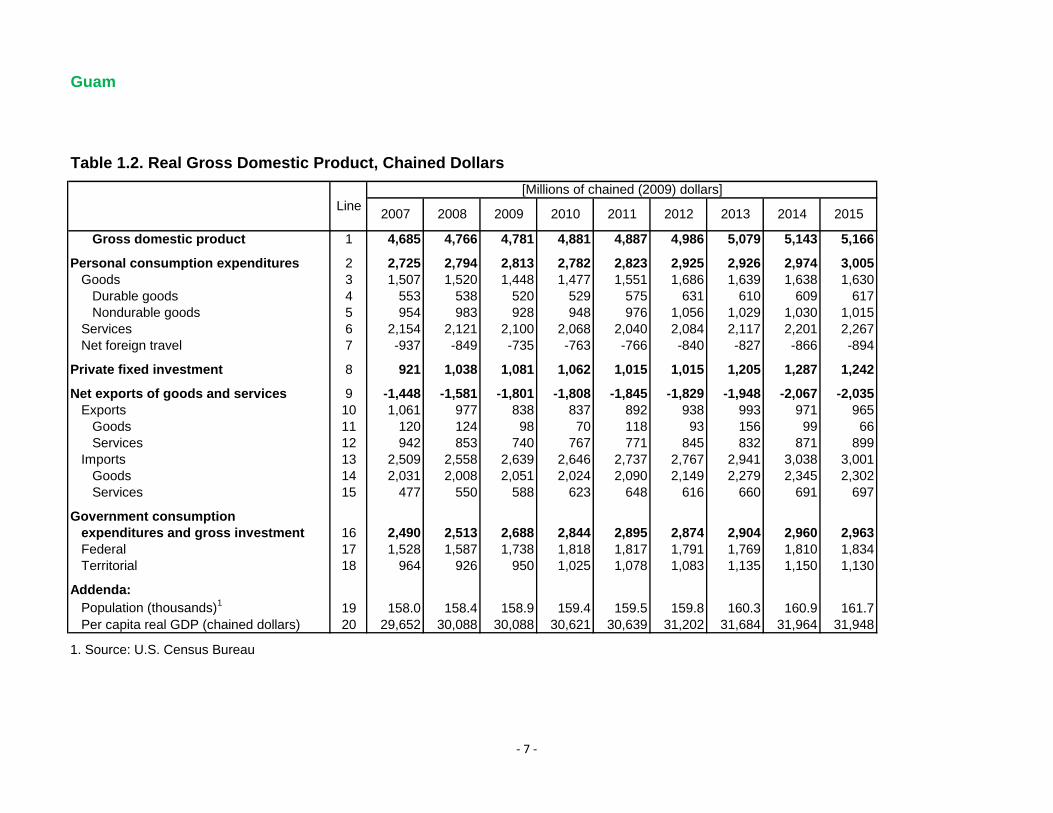
Gross domestic product 1 4,685 4,766 4,781 4,881 4,887 4,986 5,079 5,143 5,166
Personal consumption expenditures 2 2,725 2,794 2,813 2,782 2,823 2,925 2,926 2,974 3,005
Goods 3 1,507 1,520 1,448 1,477 1,551 1,686 1,639 1,638 1,630
Durable goods 4 553 538 520 529 575 631 610 609 617
Nondurable goods 5 954 983 928 948 976 1,056 1,029 1,030 1,015
Services 6 2,154 2,121 2,100 2,068 2,040 2,084 2,117 2,201 2,267
Net foreign travel 7 -937 -849 -735 -763 -766 -840 -827 -866 -894
Private fixed investment 8 921 1,038 1,081 1,062 1,015 1,015 1,205 1,287 1,242
Net exports of goods and services 9 -1,448 -1,581 -1,801 -1,808 -1,845 -1,829 -1,948 -2,067 -2,035
Exports 10 1,061 977 838 837 892 938 993 971 965
Goods 11 120 124 98 70 118 93 156 99 66
Services 12 942 853 740 767 771 845 832 871 899
Imports 13 2,509 2,558 2,639 2,646 2,737 2,767 2,941 3,038 3,001
Goods 14 2,031 2,008 2,051 2,024 2,090 2,149 2,279 2,345 2,302
Services 15 477 550 588 623 648 616 660 691 697
Government consumption
expenditures and gross investment 16 2,490 2,513 2,688 2,844 2,895 2,874 2,904 2,960 2,963
Federal 17 1,528 1,587 1,738 1,818 1,817 1,791 1,769 1,810 1,834
Territorial 18 964 926 950 1,025 1,078 1,083 1,135 1,150 1,130
Addenda:
Population (thousands)1
19 158.0 158.4 158.9 159.4 159.5 159.8 160.3 160.9 161.7
Per capita real GDP (chained dollars) 20 29,652 30,088 30,088 30,621 30,639 31,202 31,684 31,964 31,948
Line2010
Guam
Table 1.2. Real Gross Domestic Product, Chained Dollars
[Millions of chained (2009) dollars]
2013 2015
1. Source: U.S. Census Bureau
20142011 201220092007 2008
- 7 -

Gross domestic product 1 1.7 0.3 2.1 0.1 2.0 1.9 1.3 0.4
Personal consumption expenditures 2 2.5 0.7 -1.1 1.5 3.6 0.0 1.6 1.1
Goods 3 0.9 -4.8 2.0 5.0 8.7 -2.8 0.0 -0.5
Durable goods 4 -2.8 -3.3 1.7 8.8 9.7 -3.3 -0.2 1.3
Nondurable goods 5 3.0 -5.6 2.2 3.0 8.2 -2.5 0.0 -1.5
Services 6 -1.5 -1.0 -1.5 -1.4 2.1 1.6 4.0 3.0
Net foreign travel 7 …….. …….. …….. …….. …….. …….. …….. ……..
Private fixed investment 8 12.8 4.1 -1.7 -4.4 0.0 18.8 6.8 -3.5
Net exports of goods and services 9 …….. …….. …….. …….. …….. …….. …….. ……..
Exports 10 -7.9 -14.2 -0.1 6.5 5.2 5.8 -2.2 -0.6
Goods 11 3.1 -20.8 -28.2 68.1 -21.3 67.5 -36.3 -33.3
Services 12 -9.4 -13.3 3.7 0.4 9.6 -1.5 4.6 3.3
Imports 13 2.0 3.1 0.3 3.4 1.1 6.3 3.3 -1.2
Goods 14 -1.1 2.2 -1.3 3.3 2.9 6.0 2.9 -1.8
Services 15 15.3 6.8 5.9 4.1 -5.0 7.1 4.8 0.9
Government consumption
expenditures and gross investment 16 0.9 6.9 5.8 1.8 -0.7 1.1 1.9 0.1
Federal 17 3.9 9.5 4.6 -0.1 -1.4 -1.2 2.3 1.3
Territorial 18 -3.9 2.6 7.9 5.1 0.5 4.8 1.3 -1.7
Guam
Table 1.3. Percent Change From Preceding Year in Real Gross Domestic Product
[Percent]
20152010 201420132008 2009Line
2011 2012
- 8 -
Percent change:
Gross domestic product 1 1.7 0.3 2.1 0.1 2.0 1.9 1.3 0.4
Percentage points:
Personal consumption expenditures 2 1.49 0.41 -0.65 0.84 2.15 0.01 0.96 0.60
Goods 3 0.28 -1.54 0.60 1.50 2.78 -0.94 -0.01 -0.16
Durable goods 4 -0.34 -0.38 0.18 0.93 1.10 -0.40 -0.02 0.13
Nondurable goods 5 0.62 -1.16 0.42 0.57 1.67 -0.55 0.01 -0.29
Services 6 -0.71 -0.44 -0.68 -0.59 0.92 0.70 1.72 1.30
Net foreign travel 7 1.91 2.39 -0.57 -0.07 -1.55 0.26 -0.75 -0.55
Private fixed investment 8 2.67 0.92 -0.39 -0.96 -0.01 3.77 1.58 -0.83
Net exports of goods and services 9 -2.94 -4.71 -0.16 -0.82 0.32 -2.53 -2.39 0.60
Exports 10 -1.82 -2.96 -0.02 1.13 0.98 1.11 -0.43 -0.11
Goods 11 0.09 -0.56 -0.59 1.06 -0.57 1.37 -1.18 -0.66
Services 12 -1.91 -2.39 0.57 0.07 1.55 -0.26 0.75 0.55
Imports 13 -1.12 -1.76 -0.14 -1.96 -0.66 -3.64 -1.96 0.71
Goods 14 0.52 -0.95 0.59 -1.43 -1.32 -2.76 -1.34 0.83
Services 15 -1.64 -0.81 -0.73 -0.53 0.66 -0.88 -0.62 -0.12
Government consumption
expenditures and gross investment 16 0.50 3.72 3.28 1.08 -0.44 0.62 1.11 0.08
Federal 17 1.32 3.21 1.70 -0.02 -0.54 -0.45 0.81 0.47
Territorial 18 -0.82 0.51 1.58 1.10 0.10 1.07 0.30 -0.39
Guam
Table 1.4. Contributions to Percent Change in Real Gross Domestic Product
20152012 20142008 20132009 2010Line
2011
- 9 -
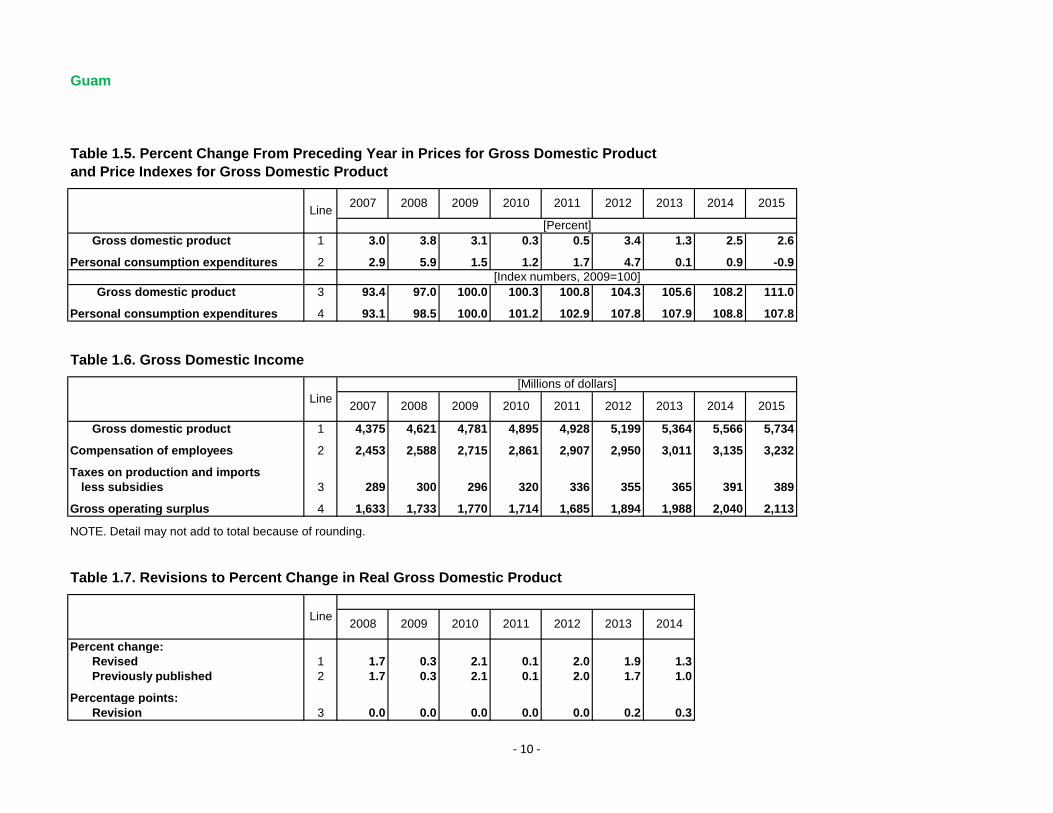
Gross domestic product 1 3.0 3.8 3.1 0.3 0.5 3.4 1.3 2.5 2.6
Personal consumption expenditures 2 2.9 5.9 1.5 1.2 1.7 4.7 0.1 0.9 -0.9
Gross domestic product 3 93.4 97.0 100.0 100.3 100.8 104.3 105.6 108.2 111.0
Personal consumption expenditures 4 93.1 98.5 100.0 101.2 102.9 107.8 107.9 108.8 107.8
Gross domestic product 1 4,375 4,621 4,781 4,895 4,928 5,199 5,364 5,566 5,734
Compensation of employees 2 2,453 2,588 2,715 2,861 2,907 2,950 3,011 3,135 3,232
Taxes on production and imports
less subsidies 3 289 300 296 320 336 355 365 391 389
Gross operating surplus 4 1,633 1,733 1,770 1,714 1,685 1,894 1,988 2,040 2,113
Percent change:
Revised 1 1.7 0.3 2.1 0.1 2.0 1.9 1.3
Previously published 2 1.7 0.3 2.1 0.1 2.0 1.7 1.0
Percentage points:
Revision 3 0.0 0.0 0.0 0.0 0.0 0.2 0.3
2011 201220102007 2014
20102008Line
201220102008 20092007
Guam
Table 1.5. Percent Change From Preceding Year in Prices for Gross Domestic Product
and Price Indexes for Gross Domestic Product
2015
20152013Line
2008 2009
20142013
2014
[Percent]
[Index numbers, 2009=100]
Table 1.6. Gross Domestic Income
[Millions of dollars]
Table 1.7. Revisions to Percent Change in Real Gross Domestic Product
NOTE. Detail may not add to total because of rounding.
20132011 20122009
Line2011
- 10 -

2. GDP by Industry
Gross domestic product 1 4,375 4,621 4,781 4,895 4,928 5,199 5,364 5,566
Private industries 2 2,654 2,827 2,872 2,875 2,847 3,117 3,232 3,346
Construction 3 291 343 360 394 367 398 448 473
Distributive Services 4 436 469 464 495 513 551 549 574
Accommodations and Amusement 5 406 422 429 452 462 487 527 594
Other Private 6 1,520 1,593 1,619 1,534 1,505 1,681 1,707 1,704
Government 7 1,721 1,795 1,910 2,020 2,081 2,082 2,132 2,220
Federal 8 1,008 1,071 1,157 1,217 1,253 1,249 1,248 1,273
Territorial 9 713 724 752 802 828 833 884 947
Gross domestic product 1 100 100 100 100 100 100 100 100
Private industries 2 61 61 60 59 58 60 60 60
Construction 3 7 7 8 8 7 8 8 8
Distributive Services 4 10 10 10 10 10 11 10 10
Accommodations and Amusement 5 9 9 9 9 9 9 10 11
Other Private 6 35 34 34 31 31 32 32 31
Government 7 39 39 40 41 42 40 40 40
Federal 8 23 23 24 25 25 24 23 23
Territorial 9 16 16 16 16 17 16 16 17
Guam
Table 2.1. Value Added by Industry
2014
NOTE. Detail may not add to total because of rounding.
201320092007 2008 20122010 2011
[Millions of dollars]
Line
[Percent]
Table 2.2. Value Added by Industry as a Percentage of GDP
2010Line
2014201320122009 201120082007
- 11 -

Gross domestic product 1 4,685 4,766 4,781 4,881 4,887 4,986 5,079 5,143
Private industries 2 2,876 2,929 2,872 2,906 2,879 2,998 3,074 3,120
Construction 3 304 360 360 402 369 391 428 437
Distributive Services 4 470 502 464 488 495 519 507 525
Accommodations and Amusement 5 437 445 429 459 478 491 534 559
Other Private 6 1,667 1,622 1,619 1,557 1,537 1,595 1,607 1,601
Government 7 1,809 1,837 1,910 1,974 2,006 1,988 2,006 2,024
Federal 8 1,033 1,070 1,157 1,185 1,199 1,181 1,179 1,184
Territorial 9 779 769 752 790 807 808 827 840
Gross domestic product 1 1.7 0.3 2.1 0.1 2.0 1.9 1.3
Private industries 2 1.8 -1.9 1.2 -0.9 4.1 2.5 1.5
Construction 3 18.4 0.0 11.6 -8.0 5.9 9.4 2.1
Distributive Services 4 7.0 -7.7 5.3 1.4 4.8 -2.2 3.5
Accommodations and Amusement 5 1.9 -3.6 7.1 4.1 2.9 8.6 4.8
Other Private 6 -2.7 -0.2 -3.8 -1.3 3.8 0.7 -0.4
Government 7 1.5 3.9 3.4 1.6 -0.9 0.9 0.9
Federal 8 3.6 8.2 2.3 1.2 -1.5 -0.1 0.4
Territorial 9 -1.4 -2.1 5.0 2.2 0.1 2.4 1.6
2014
[Millions of chained (2009) dollars]
20102009
20132012
[Percent]
2010 2011
Table 2.4. Percent Changes in Real Value Added by Industry
Line
2011
2008 2009
Guam
Table 2.3. Real Value Added by Industry
20142013Line
2008 20122007
- 12 -

Percent change:
Gross domestic product 1 1.7 0.3 2.1 0.1 2.0 1.9 1.3
Percentage points:
Private industries 2 1.11 -1.19 0.72 -0.54 2.39 1.52 0.90
Construction 3 1.20 0.00 0.86 -0.65 0.44 0.73 0.18
Distributive Services 4 0.69 -0.80 0.52 0.15 0.49 -0.24 0.36
Accommodations and Amusement 5 0.17 -0.34 0.63 0.37 0.27 0.80 0.49
Other Private 6 -0.94 -0.06 -1.29 -0.41 1.19 0.23 -0.12
Government 7 0.60 1.53 1.37 0.67 -0.37 0.35 0.35
Federal 8 0.83 1.86 0.58 0.30 -0.38 -0.03 0.09
Territorial 9 -0.22 -0.34 0.79 0.36 0.01 0.38 0.26
Total compensation 1 2,453 2,588 2,715 2,861 2,907 2,950 3,011 3,135
Private industries 2 1,224 1,299 1,348 1,407 1,397 1,446 1,480 1,549
Construction 3 135 155 171 192 183 186 214 228
Distributive Services 4 245 260 255 270 278 298 296 310
Accommodations and Amusement 5 203 212 217 227 231 243 257 273
Other Private 6 641 671 704 718 706 719 713 737
Government 7 1,228 1,289 1,367 1,455 1,510 1,504 1,531 1,586
Federal 8 647 695 746 802 835 829 825 848
Territorial 9 582 594 621 653 676 675 706 738
Guam
2014
NOTE. Percentage-point contributions do not sum to the percent change in real gross domestic product because of
rounding and differences in source data used to estimate GDP by industry and the expenditures measure of real GDP.
201320112010 2012Line
2009
2014
[Millions of dollars]
Table 2.5. Contributions to Percent Change in Real Gross Domestic Product by Industry
NOTE. Detail may not add to total because of rounding.
2008
20132012201120102008 2009Line
Table 2.6. Compensation of Employees by Industry
2007
- 13 -