gridcarbon: a smartphone app to calculate the carbon ... · to calculate the carbon intensity of...
TRANSCRIPT

GridCarbon: A smartphone appto calculate the carbon intensityof the GB electricity gridProf. Alex Rogers1 and Dr. Oliver Parson2
1University of Oxford, Oxford, UK. Email: [email protected]: [email protected]
February 25, 2019
GridCarbon is a smartphone app, first released inDecember 2009, that calculates the carbon inten-sity of the GB electricity grid. This paper reportson the current version of the app, released in Febru-ary 2019, that merges two online data sources inorder to use actual and estimated wind and solargeneration in the calculation of carbon intensity.
GridCarbon
GridCarbon was first released in December 2009 anduses instantaneous generation mix data from ELEXON,updated every five minutes, to calculate the carbonintensity of the GB electricity grid. Since its launch, re-newable generation within the grid has grown steadilyand now represents a significant proportion of elec-tricity generation. Much of this generation is fromwind and solar sources deployed within the distribu-tion network and is un-metered. It is not included inthe standard generation mix data. Thus, the currentversion of the app combines estimates of wind and so-lar data with the instantaneous generation mix data toprovide an improved estimate of the carbon intensityof the electricity grid.
Carbon Intensity
GridCarbon makes use of three data sources: twoavailable through the ELEXON portal1 and one fromSheffield Solar2. The first is the instantaneous genera-tion mix (FUELINST), categorised by fuel type, whichprovides 24 hour data divided into five minute periods,updated every five minutes.3 The second is the actual
1www.elexonportal.co.uk2www.solar.sheffield.ac.uk/pvlive/3api.bmreports.com/BMRS/FUELINST/v1?APIKey=<APIKey>
&ServiceType=xml
Figure 1: GridCarbon app showing live carbon intensity.
or estimated wind and solar power generation (B1630)over the previous 48 hours, divided into 30 minutesettlement periods, updated every 30 minutes.4 Thissource provides estimates of wind and solar genera-tion from both metered and un-metered sources, withmuch of the latter being small scale generation withinthe distribution network, but only the wind generationis used by the app. Both data sets are also available ona public website.5 The final data source is an estimatedsolar generation over the previous 48 hours from Solar
4api.bmreports.com/BMRS/B1630/v1?APIKey=<APIKey>&SettlementDate=<SettlementDate>&Period=<Period>&ServiceType=xml
5www.bmreports.com/bmrs/?q=generation/
GridCarbon: A smartphone app to calculate the carbon intensity of the GB electricity grid
Jun 2017 Jul 2017 Aug 2017 Sep 2017 Oct 2017 Nov 2017 Dec 2017 Jan 2018 Feb 2018 Mar 2018 Apr 2018 May 2018 Jun 2018
0
100
200
300
400
500
Carbon Intensity (gCO₂/kWh)
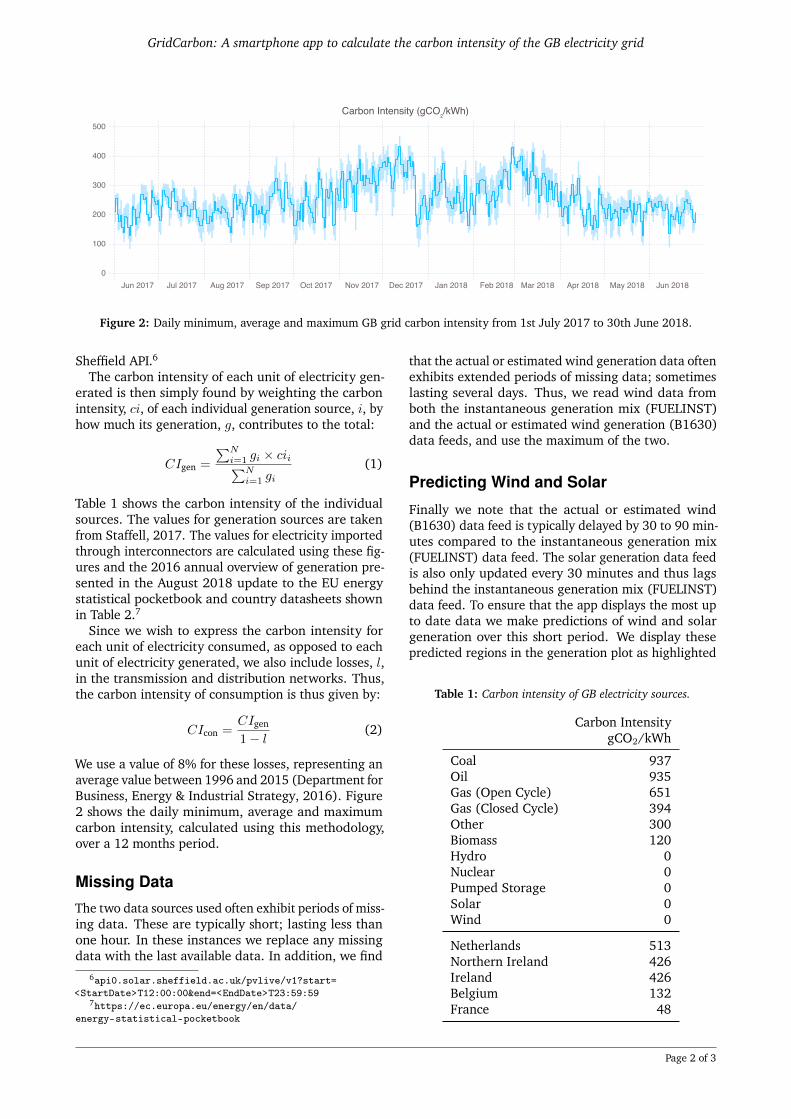
Figure 2: Daily minimum, average and maximum GB grid carbon intensity from 1st July 2017 to 30th June 2018.
Sheffield API.6
The carbon intensity of each unit of electricity gen-erated is then simply found by weighting the carbonintensity, ci, of each individual generation source, i, byhow much its generation, g, contributes to the total:
CIgen =
∑Ni=1 gi × cii∑N
i=1 gi(1)
Table 1 shows the carbon intensity of the individualsources. The values for generation sources are takenfrom Staffell, 2017. The values for electricity importedthrough interconnectors are calculated using these fig-ures and the 2016 annual overview of generation pre-sented in the August 2018 update to the EU energystatistical pocketbook and country datasheets shownin Table 2.7
Since we wish to express the carbon intensity foreach unit of electricity consumed, as opposed to eachunit of electricity generated, we also include losses, l,in the transmission and distribution networks. Thus,the carbon intensity of consumption is thus given by:
CIcon =CIgen1− l
(2)
We use a value of 8% for these losses, representing anaverage value between 1996 and 2015 (Department forBusiness, Energy & Industrial Strategy, 2016). Figure2 shows the daily minimum, average and maximumcarbon intensity, calculated using this methodology,over a 12 months period.
Missing Data
The two data sources used often exhibit periods of miss-ing data. These are typically short; lasting less thanone hour. In these instances we replace any missingdata with the last available data. In addition, we find
6api0.solar.sheffield.ac.uk/pvlive/v1?start=<StartDate>T12:00:00&end=<EndDate>T23:59:59
7https://ec.europa.eu/energy/en/data/energy-statistical-pocketbook
that the actual or estimated wind generation data oftenexhibits extended periods of missing data; sometimeslasting several days. Thus, we read wind data fromboth the instantaneous generation mix (FUELINST)and the actual or estimated wind generation (B1630)data feeds, and use the maximum of the two.
Predicting Wind and Solar
Finally we note that the actual or estimated wind(B1630) data feed is typically delayed by 30 to 90 min-utes compared to the instantaneous generation mix(FUELINST) data feed. The solar generation data feedis also only updated every 30 minutes and thus lagsbehind the instantaneous generation mix (FUELINST)data feed. To ensure that the app displays the most upto date data we make predictions of wind and solargeneration over this short period. We display thesepredicted regions in the generation plot as highlighted
Table 1: Carbon intensity of GB electricity sources.
Carbon IntensitygCO2/kWh
Coal 937Oil 935Gas (Open Cycle) 651Gas (Closed Cycle) 394Other 300Biomass 120Hydro 0Nuclear 0Pumped Storage 0Solar 0Wind 0
Netherlands 513Northern Ireland 426Ireland 426Belgium 132France 48
Page 2 of 3

GridCarbon: A smartphone app to calculate the carbon intensity of the GB electricity grid
Figure 3: Highlighted bars (at extreme right of graph) indicating predicted wind and solar data.
bars at the extreme right of the generation mix bargraph (see Figure 3).
Wind
To predict the wind generation we make use of the rela-tionship between the value of metered wind generationwithin the instantaneous generation mix (FUELINST)data feed and that within the actual or estimated windgeneration (B1630) data feed. In doing so we assumethat metered wind generation is a constant factor ofthe total of metered wind and unmetered wind gener-ation. We calculate this factor over the last four hoursof the actual or estimated wind generation data, andthen use the metered instantaneous generation mix(FUELINST) data, scaled by the reciprocal of this factor,over this short prediction period.
Solar
Predicting the solar generation is more complex aswe have no parallel data feed, and solar generationcan exhibit significant change over this short period.
Table 2: Generation mix of interconnector sources.
Generation Mix (%)
BE IR FR NL
Coal 0.5 23.1 1.5 31.9Oil 0.2 1.0 0.5 1.1Gas (Closed Cycle) 28.5 50.1 6.6 49.1Nuclear 50.9 0.0 72.5 3.4Hydro 1.7 3.2 11.7 0.1Pumped Storage 1.3 1.0 0.9 0.0Wind 6.4 20.2 3.8 7.1Biomass 6.2 2.2 1.3 4.3Solar 3.6 0.0 1.5 1.4Other 2.1 0.2 0.5 1.7
However, solar generation has a characteristic increaseand decrease over the course of the day and we canuse historic data to predict this behaviour.To do so, we approximate the pattern of solar gener-
ation over the course of the day using a simple threeparameter model consisting of a sunrise time, tsr, a sun-set time, tss, and a peak solar generation value, gmax.Our predicted solar generation, gsolar, is then assumedto be zero when the time, t is earlier than tsr or laterthan tss, and given by:
gsolar = gmax × sin2 (πr) (3)
otherwise, where r is given by:
r =t− tsrtss − tsr
(4)
Solar generation exhibits significant variation betweendays due to changing weather conditions. Thus, aswith the prediction of wind generation, we calibratethe peak value, gmax, using the the last half hour of solargeneration data available. This provides an effectiveand robust short-term prediction of solar generationover one to two hours.
References
Department for Business, Energy & Industrial Strategy(2016). “Government GHG Conversion Factors forCompany Reporting: Methodology Paper for Emis-sion Factors”. In: url: www.gov.uk/government/uploads / system / uploads / attachment _ data /file/553488/2016_methodology_paper_Final_V01-00.pdf.
Staffell, Iain (2017). “Measuring the progress and im-pacts of decarbonising British electricity”. In: EnergyPolicy 102, pp. 463–475.
Page 3 of 3