grid development and integration of re in china - … · grid development and integration of re in...
TRANSCRIPT

0
00
State Grid Corporation of China
Frankfurt
22. February 2017
Grid Development and Integration
of RE in China
1
1 Overview SGCC
4 Global Energy Interconnection
3 Integration of Renewable Energy
2 Development of Renewable Energy in China
Outline

2
Northwest
North
North-
east
Central East
Geographic Coverage
88% of China’s territory
Customers
Serving over 1.1 billion customers
Employees
1.8 million
Key Figures (2016)
Assets: €464Bn Revenue €285Bn
Core business
Power grid construction and operation,
R&D
Overseas Business
Runs overseas business in the Philippines,
Portugal, Brazil, Australia,Italy,etc.
R&D
4 Research institutes
24,000 Researchers & Developers
Ranked 2nd Fortune Global 500Data Source: 2015
SGCC Overview

3
Distribution of overseas assets and offices
SGCC’s service areas in China
SGCC’s overseas service areas
SGCC’s overseas offices
International Business

4
State Grid Europe
Representative Office,
Skyper/ Frankfurt
State Grid and State Grid GEIRI - Headquarters
Global Energy Interconnection Research Institute Europe
GEIRI Europe, Berlin
GEIRI Europe

5
1 Overview SGCC
4 Global Energy Interconnection
3 Integration of Renewable Energy
2 Development of Renewable Energy in China
Outline

6
Hydro power:330 GW, ranking No.1 in the world;
Wind power:169 GW, ranking No.1 in the world;
PV power:78 GW, ranking No.1 in the world;
Wind power has been the third largest power source in China.
Over 20%
Wind and PV power capacity growth
from 2006 to 2014
37 times
GW GW
350 times
Wind PV
Oslo Workshop 20151022.ppt
Data Source: 2015
Development of Renewable Energy

7
9 large-scale wind power bases are in planning
or under construction, each of them with a
capacity of more than 10GW.
Large-scale of Offshore wind-farms
Large, distributed PV and wind turbines
2015 2020
Wind:100GWSolar: 21GW
Wind:200GWSolar: 150GW
Wind, Solar, Storage Pilot Project
Wind: 600MW
Solar: 60MW
Storage: 50MW
Data Source: 2015
Development of Renewable Energy

8
1 Overview SGCC
4 Global Energy Interconnection
3 Integration of Renewable Energy
2 Development of Renewable Energy in China
Outline

9
UHV operation & construction:
13 UHV (6 AC and 7 DC)Projects in Operation
9 UHV (2 AC and 7 DC)Projects under Constr.
UHV AC
UHV DC
ProjectsLength
of line
Conversio
n capacity
AnnualCO2
emission
reduction
1000kV
Jindongnan--
Jimen
640km 18GVA --
±800kV
Xiangjiaba-
Shanghai
1,907km 12.8GW26.0 million
tons
±800kV
Jinping-Sunan2,059km 14.4GW
32.4 million
tons
1000kV
Huainan-
Zhebei-
Shanghai
2×649km 21GVA --
±800kV
Haminan-
Zhengzhou
2,210km 16GW40 million
tons
±800kV
Xiluodu-Zhexi1,669km 16GW
34.0 million
tons
Total 9,782km 98.20G132.4 million
tons
Commissioned UHV projects
Combination transmission of
wind power and thermal
power
Transmission of
hydro power
Data Source: 2015
UHV Power Transmission in China

10
1000 kV AC
±800 kV DC
±1100 kV DC
By 2020:
- More than 22 UHVDC lines
- Wind power: 250GW
- Solar power:150GW
UHV Power Transmission in the Future

11
Zhoushan400MW
Daishan300MW
Qushan100MW
Yangshan100MW
Sijiao100MW
Launch of
operation4th July 2014
Rated capacity 400/300/100/100/100 MW
Rated DC voltage ±200 kV
• Power supply to islands
• Wind power integration
Current status
• Transform to HVDC grid
• Solution 1 – dashed blue line
• Solution 2 – dashed red line
• Solution 3 – dashed green line
• Redundancy
• Grid reliability and security
• DC CBs → DC side fault clearance
Upgrade plan
Zhaoshan
Qushan
SijiaoYangshan
Daishan
AC
舟山换流站
AC
岱山
换流站
AC
衢山
换流站
AC AC
泗礁
换流站
洋山
换流站
World Record 1: Multi-Terminal HVDC

12
Baoding
3000MW
Pump storage
(2GW)
Wind Power
(3.GW)
ES
Solar Power
(1.5GW)
ES
Winter Olympic 2020 – DC Grid Demo Project
Proposal 1 Proposal 2
Beijing
3GW
Pump storage
(2GW)
Wind Power
(3GW)
Zhangbei
Beijing
West
10GW
HVAC
ES
100万千瓦
Solar Power
(1.5GW)
ES
Zhangbei
Beijing
West
World Record 2: DC GRID

13
Phase I:100MW Wind, 40MW PV, 20MW storage
Phase II:400MW Wind, 60MW PV, 50MW storage
In total: 500MW Wind,100MW PV, 70MW storage
Data Source: 2015
World Record 3: Wind-PV-Storage Farm

14
Strong and Smart Grid
Smart Substations: 2700
Smart Meters: 430 million
EV Charging Stations/Poles: 1 million
Data Source: 2016
Pumping Storage (57 Plants): 65 GW
Operation (29 Plants): 25 GW
Construction (15 Plants): 21 GW
Planned (13 Plants): 19 GW
Smart Grid for Distributed RE

15
Since 2009 500 pilot projects completed so far
10 billion Euros invested in total
Data Source: 2015
Advanced Smart Grid
16
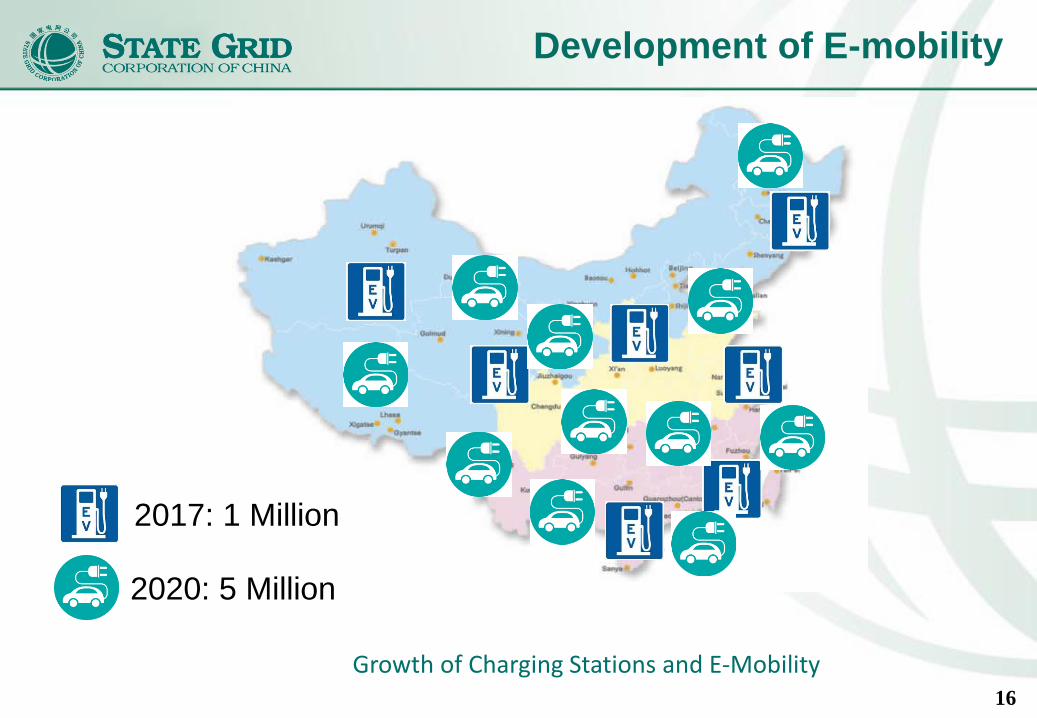
Development of E-mobility
Growth of Charging Stations and E-Mobility
2020: 5 Million
2017: 1 Million

17
1.Fossil fuels must be replaced by clean energy sources,
such as solar energy, wind power and hydropower.
2.Electric energy replaces coal, oil and gas. Clean
electricity is transported over long distances, thus solving
the problem of excessive dependency on fossil fuels and
the emission of CO2.
Two Principles for RE
18
1 Overview SGCC
4 Global Energy Interconnection
3 Integration of Renewable Energy
2 Development of Renewable Energy in China
Outline

19
-Wind: North Pole, Northern and Northern Asia, Northern Europe,
Central North America, Eastern Africa
-Solar: North Africa, East Africa, The Middle East, Central and South America
and Equatorial Regions
-RE: Random & intermittent: only large power grids can fundamentally
solve the integration & utilization of RE: Global Energy Interconnection
Distribution of global wind
energy resources
Distribution of global solar energy
resources
Large-scale RE: Global Energy Distribution Platform

20
Global Energy Interconnection

21
60%
70%
80%
90%
100%
110%
0 2 4 6 8 10 12 14 16 18 20 22
时间,h
功率,P%
24小时实时负荷率拟合
60%
70%
80%
90%
100%
110%
0 2 4 6 8 10 12 14 16 18 20 22时间,h
功率,P%
中国24小时实时负荷率
60%
70%
80%
90%
100%
110%
0 2 4 6 8 10 12 14 16 18 20 22时间,h
功率,P%
北美24小时实时负荷率
60%
70%
80%
90%
100%
110%
0 2 4 6 8 10 12 14 16 18 20 22时间,h
功率,P%
欧洲24小时实时负荷率
中国、欧洲、北美电网互联
24 Hour Power Curves of China、Europe、North America respectively
24 Hour Power Curve stemming from the
superposition of the curves of China、Europe、North America
Global Energy Interconnection

22
1.If 80% of the Energy Consumption comes
from Clean Energy by 2050, CO2 will be
reduced to the half of its level in 1990.
2.By the end of 21 century, the increase of
global temperature can be limited to 1.5℃,
which will meet the target requirement (COP21).
Global Energy Interconnection

23
Thank you for your attention!