greenhouse gas emissions report fy2021
TRANSCRIPT

Greenhouse
Gas Emissions
Report F Y 2021

Content
Introduction
Ch 2. Organizational
Boundaries
Ch 4. Inventory of
Emissions and
offsets
Conclusion
Ch 1. Organizational
description
Ch 3. Reporting
Boundaries
Ch 5. Performance
Tracking &
Reduction
Projects
SIEMENS GAMESA GHG EMISSIONS REPORT 2021
3
Introduction 1.1. Objectives and principles
The voluntary Greenhouse Gas (GHG) Emissions
Report describes the emissions and details
the verification of the inventory of greenhouse
gas (GHG) for Siemens Gamesa Renewable
Energy S.A., hereinafter referred to as “SGRE”,
“Siemens Gamesa” or “the Company”.
The company publishes this report annually
in order to transparently disclose to its
stakeholders its GHG emissions in
accordance with the commitments made in
the Company’s environmental policy and
strategy. Further, the report supports in
measuring, monitoring and managing the
environmental performance of SGRE.
The information contained in this report
discloses the inventory of GHGs and associated
emissions during fiscal year 2021, October 1,
2020 to September 30, 2021. The report covers
all countries where commercial activities are
performed under the scope of SGRE.
This is the third consecutive year that
Siemens Gamesa publishes a GHG report
that includes the three scopes, and the
first year that includes the six categories
described in the ISO 14064-1:2018. The
report presents the targets certified by
the Science Based Targets initiative (SBTi)
to reduce Scope 1 and 2 emissions by
2025 that are aligned on the path to a
complete decarbonization by 2040. This
report also includes an overview of the
direct actions performed based on
internal targets and strategies to manage
and reduce GHG emissions. As Corporate
Head of Quality Management, Health,
Safety and Environment, Mr, Gregorio
Francisco Acero Alvarez is the person
responsible for Siemens Gamesa’s GHG
report.
This report is subject to external review by
the accredited verifier, TÜV Rheinland.
Gregorio Francisco Acero Alvarez Head of Corporate QM&HSE
Siemens Gamesa Renewable
Energy
The GHG emissions report has been
restructured in accordance to the
requirements described in ISO 14064-1:2018
“Greenhouse gases - Part 1: “Specification
with guidance at the organization level for
quantification and reporting of greenhouse gas
emissions and removals”. It includes all
required information, except those details
that the standard does not consider
mandatory and has not been considered
relevant following the principle of relevance.
This report is carried out in accordance with
the GHG Accounting and Reporting Principles
found within the GHG Protocol Corporate
Accounting and Reporting Standard.
As a result of the verification process in
accordance with procedure 6-PS2 .670.00
TÜV Rheinland states that:
It is considered that the
SIEMENS GAMESA RENEWABLE ENERGY
GREENHOUSE GAS EMISSIONS REPORT
FISCAL YEAR 2021, as of 29 October 2021 and
ratified by the Management of the
organization, is substantially correct and
corresponds to a faithful representation of
the emissions of the activities for the scope
defined by the company; in conformity
requirements of standard ISO 14064-1:2018
for a reasonable level of assurance.
Andoni Mur Herrero Senior auditor TÜVRheinland Almudena Bouza Reviewer TÜVRheinland

SIEMENS GAMESA GHG EMISSIONS REPORT 2021
4
1. Organizational
description
Siemens Gamesa Renewable Energy S. A. was created in April 2017, with the merger of Gamesa Corporación Tecnológica S. A. and Siemens Wind Power A/S. The company designs and manufactures wind turbines and provides onshore and offshore wind services.
Siemens Gamesa is a leading supplier of wind power solutions to customers all over the globe. It is committed to providing innovative and effective solutions for the energy challenges of tomorrow. Siemens Gamesa is thus leading the way forward in the renewable energy sector by providing cleaner, more reliable and affordable as well as integrated renewable technologies and services.
The company’s scale, global reach and proven track record ensures that it will continue to play a central role in shaping the energy landscape of the future. As key player and innovative pioneer in the renewable energy sector, the Company has installed products and technology in more than 90 countries, with a total capacity base of over 117 GW and 26,182 employees. Most recently, Siemens Gamesa and Siemens Energy are joining forces to kickstart a new era of offshore green hydrogen production that will power a cleaner future. Together, they are developing an innovative solution that fully integrates an electrolyzer into an offshore wind turbine as a single synchronized system to directly produce green hydrogen1.
Onshore wind power
99 GW installed since 1979
Offshore wind power
19 GW installed since 1991. The most
experienced offshore wind company
Service
79 GW maintained in more than 65 countries
worldwide
Key facts as of September 30, 2020
+117 GW Globally installed
99 GW installed Onshore
1 See; Siemens Gamesa and Siemens Energy to unlock a new era of offshore green hydrogen
production. Link
+26,182 Employees
19 GW installed Offshore
329 MTCO² Annual GHG savings to
customers
79 GW maintained Services

SIEMENS GAMESA GHG EMISSIONS REPORT 2021
5
Siemens Gamesa global footprint
SIEMENS GAMESA GHG EMISSIONS REPORT 2021
6
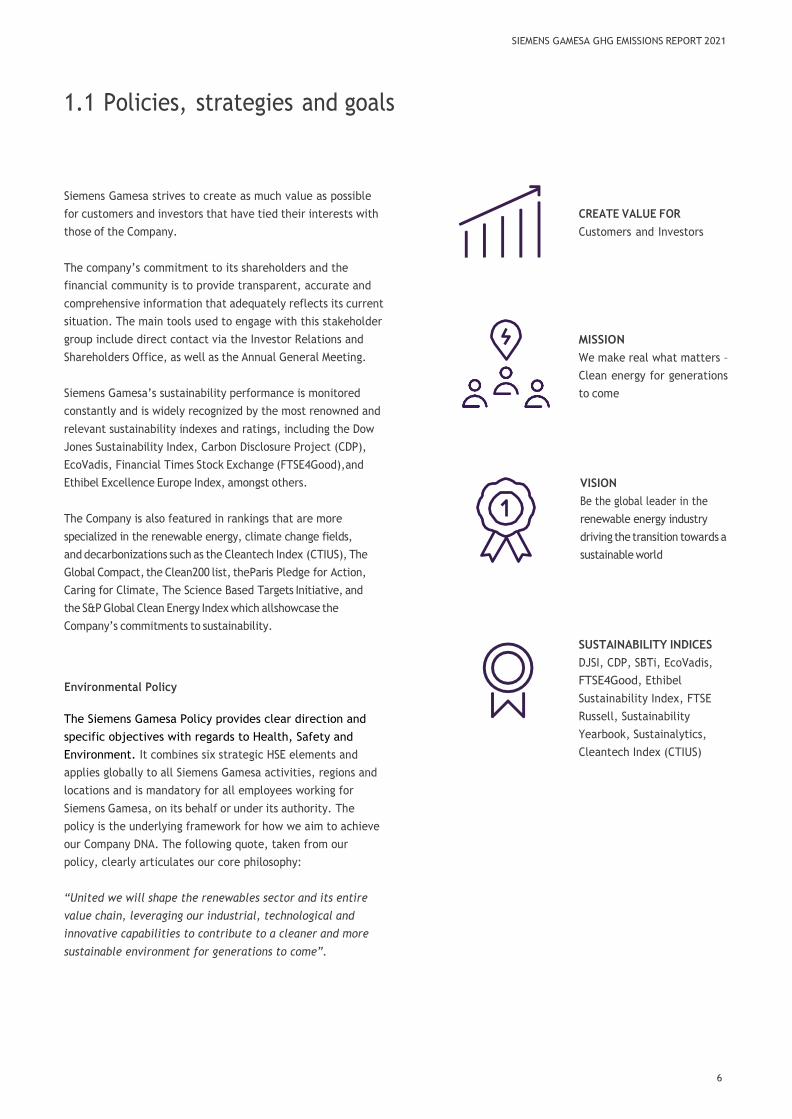
1.1 Policies, strategies and goals
Siemens Gamesa strives to create as much value as possible
for customers and investors that have tied their interests with
those of the Company.
The company’s commitment to its shareholders and the
financial community is to provide transparent, accurate and
comprehensive information that adequately reflects its current
situation. The main tools used to engage with this stakeholder
group include direct contact via the Investor Relations and
Shareholders Office, as well as the Annual General Meeting.
Siemens Gamesa’s sustainability performance is monitored
constantly and is widely recognized by the most renowned and
relevant sustainability indexes and ratings, including the Dow
Jones Sustainability Index, Carbon Disclosure Project (CDP),
EcoVadis, Financial Times Stock Exchange (FTSE4Good), and
Ethibel Excellence Europe Index, amongst others.
The Company is also featured in rankings that are more
specialized in the renewable energy, climate change fields,
and decarbonizations such as the Cleantech Index (CTIUS), The
Global Compact, the Clean200 list, the Paris Pledge for Action,
Caring for Climate, The Science Based Targets Initiative, and
the S&P Global Clean Energy Index which all showcase the
Company’s commitments to sustainability.
Environmental Policy
The Siemens Gamesa Policy provides clear direction and
specific objectives with regards to Health, Safety and
Environment. It combines six strategic HSE elements and
applies globally to all Siemens Gamesa activities, regions and
locations and is mandatory for all employees working for
Siemens Gamesa, on its behalf or under its authority. The
policy is the underlying framework for how we aim to achieve
our Company DNA. The following quote, taken from our
policy, clearly articulates our core philosophy:
“United we will shape the renewables sector and its entire
value chain, leveraging our industrial, technological and
innovative capabilities to contribute to a cleaner and more
sustainable environment for generations to come”.
CREATE VALUE FOR
Customers and Investors
MISSION
We make real what matters –
Clean energy for generations
to come
VISION
Be the global leader in the
renewable energy industry
driving the transition towards a
sustainable world
SUSTAINABILITY INDICES
DJSI, CDP, SBTi, EcoVadis,
FTSE4Good, Ethibel
Sustainability Index, FTSE
Russell, Sustainability
Yearbook, Sustainalytics,
Cleantech Index (CTIUS)
SIEMENS GAMESA GHG EMISSIONS REPORT 2021
7
Climate Strategy
Siemens Gamesa recognizes that climate change is a global
issue requiring urgent and collective action by governments,
businesses and citizens alike. As a provider of clean affordable
energy, we contribute to the global economy’s
decarbonization in terms of the products and services we
develop, the ways in which we operate and the partnerships
we engage in with policymakers, industry associations and
business partners to address climate change collectively. We
are shaping the future’s energy landscape. Siemens Gamesa
climate change strategy covers the full scope of Siemens
Gamesa’s operations e.g. design and manufacture, pre-
assembly and commissioning, operation and maintenance.
We are a member of multiple global communities who share
our commitment to climate protection and decarbonization.
For example, the Paris Pledge for Action, Caring for Climate and
The Science Based Targets Initiative.
In addition, Siemens Gamesa is adapting the recommendations
of the Task force on Climate-related Financial Disclosures
(TCFD) for the voluntary reporting of the financial impact of
climate risks in order to publicly disclose this information in a
transparent manner. The Taskforce on Climate-related
Financial Disclosures (TCFD) recommendations are voluntary
principles that allows for a better understanding of business
risks and opportunities that are derived from climate change
impacts and greater transparency in companies’ climate
governance, strategy and performance in mainstream financial
reporting.
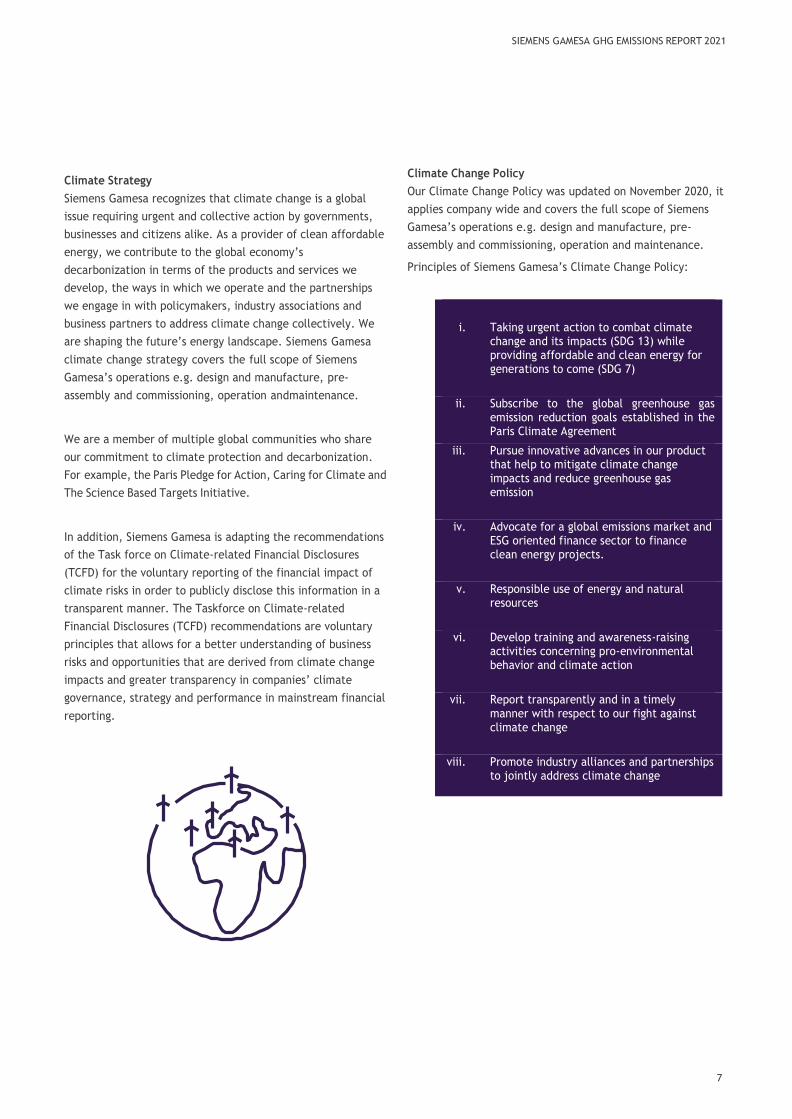
Climate Change Policy
Our Climate Change Policy was updated on November 2020, it
applies company wide and covers the full scope of Siemens
Gamesa’s operations e.g. design and manufacture, pre-
assembly and commissioning, operation and maintenance.
Principles of Siemens Gamesa’s Climate Change Policy:
i. Taking urgent action to combat climate
change and its impacts (SDG 13) while providing affordable and clean energy for generations to come (SDG 7)
ii. Subscribe to the global greenhouse gas
emission reduction goals established in the Paris Climate Agreement
iii. Pursue innovative advances in our product that help to mitigate climate change impacts and reduce greenhouse gas emission
iv. Advocate for a global emissions market and
ESG oriented finance sector to finance clean energy projects.
v. Responsible use of energy and natural
resources
vi. Develop training and awareness-raising
activities concerning pro-environmental behavior and climate action
vii. Report transparently and in a timely
manner with respect to our fight against climate change
viii. Promote industry alliances and partnerships
to jointly address climate change

SIEMENS GAMESA GHG EMISSIONS REPORT 2021
8
Net-Zero carbon strategy
In 2019, 5 years ahead of schedule, Siemens Gamesa became
carbon neutral - a major milestone towards the company’s
long-term ambition of net-zero CO2 emissions by 2040.
Commitment to become
Net-Zero Carbon by 2040
The global roadmap towards Net-Zero emissions by 2040
involves six emission reduction levers:
Energy reductions and efficiency measures in our
operations.
Electricity supply from renewable energy-based sources
Green mobility plan to reduce fleet emissions Offset of
Offset of non-avoided emissions through compensation
projects
Employee awareness campaigns and idea management
Engagement of suppliers across the value chain
Siemens Gamesa will engage more with our key suppliers to
encourage them to reduce their emissions affecting the products
and services they supply to Siemens Gamesa.
Science Based Targets
The Science Based Targets Initiative (SBTi) is an initiative
between the Carbon Disclosure Project, the United Nations
Global Compact, World Resources Institute, the World
Wildlife Fund for Nature and the We Mean Business Coalition.
The SBTi encourages companies to set carbon emissions
reduction targets at a level necessary to meet the 1.5/2°C
compared with preindustrial temperatures set in the Paris
Climate Agreement.
Siemens Gamesa committed to the SBTi as the first
renewable energy manufacturer in September 2018 and by
2020 the SBT verified that Siemens Gamesa’s emission
reduction strategy is aligned with what climate science
estimates necessary to meet the 1.5°C trajectory.
Target verified
By the SBTi in August 2020

SIEMENS GAMESA GHG EMISSIONS REPORT 2021
9
Siemens Gamesa has set the following targets for the next five
years until 2025 to meet its net-zero goal by 2040:
Reduce scope 1 and scope 2 greenhouse gas emissions by
70% per MW installed (compared to 2017)
Increase the annual sourcing of renewable electricity to
100% (up from 58% in 2017)
30% of Siemens Gamesa’s suppliers by spend covering
purchased goods and services and transportation and
distribution will have science-based targets by 2025
The first two targets have been achieved and the company is
working closely with its supply chain to deliver the third target.
Strategic focus for our Scope 3 emissions
The management of sustainability risks, such as the scope 3
emission reduction, is a key point in the supply chain strategy
of Siemens Gamesa.
In line with the verified Siemens Gamesa targets of the
Science Based Targets initiative (SBTi), as mentioned in
chapter 8.3 Supply Chain Principles and section Climate
Change, 30% of Siemens Gamesa’s purchasing volume (PVO)
shall have science-based targets until 2025, covering the
categories of purchased goods and services as well as
transportation and distribution.
Therefore, in order to achieve this target, Siemens Gamesa is
preparing collaborative measures with selected tier 1 suppliers
in order to develop a global downstream supply chain strategy
and goal setting. The global end-to-end strategy with the
selected tier 1 suppliers, will derive following measure plan
that will be developed in detail:
Understand focus areas and increase the awareness and
transparency in the supply chain.
Specific target settings for tier 1 suppliers as well as
reward suppliers with clear commitments to SBTi emission
reduction.
Develop suppliers to increase the overall maturity
downstream supply chain and in the industry.
Figure 1: Siemens Gamesa verified Science Based Targets
SIEMENS GAMESA GHG EMISSIONS REPORT 2021
10
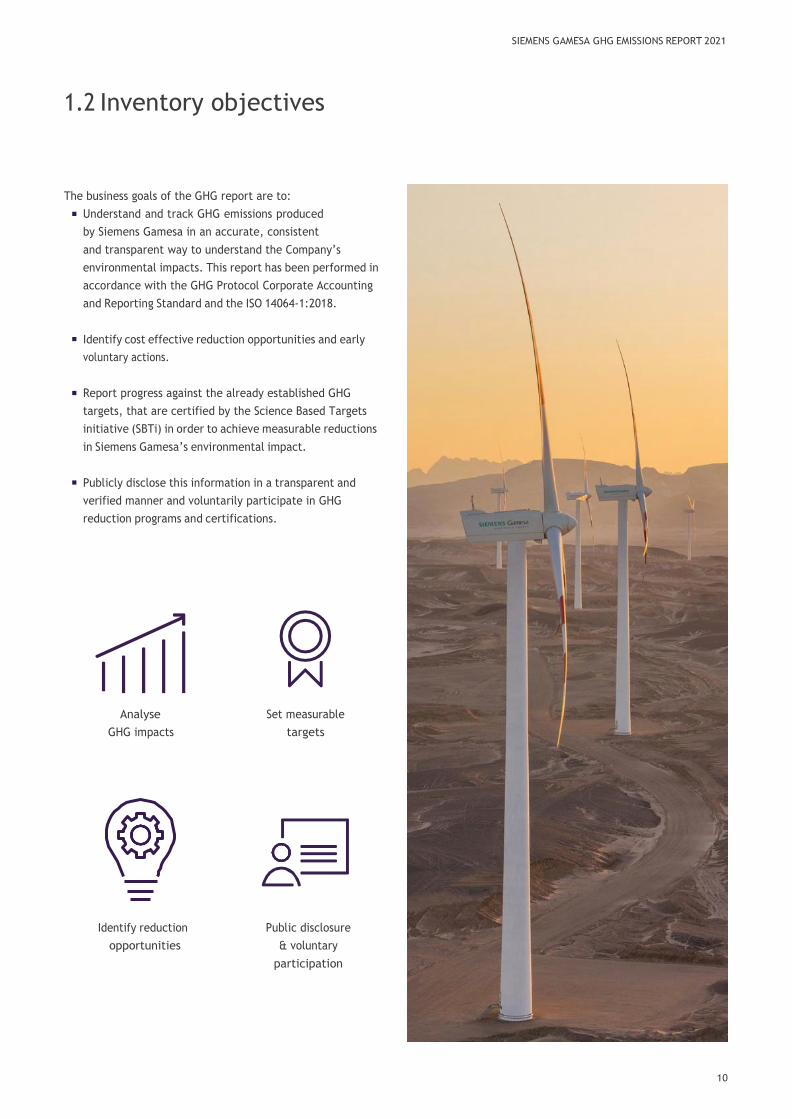
1.2 Inventory objectives
The business goals of the GHG report are to:
Understand and track GHG emissions produced
by Siemens Gamesa in an accurate, consistent
and transparent way to understand the Company’s
environmental impacts. This report has been performed in
accordance with the GHG Protocol Corporate Accounting
and Reporting Standard and the ISO 14064-1:2018.
Identify cost effective reduction opportunities and early
voluntary actions.
Report progress against the already established GHG
targets, that are certified by the Science Based Targets
initiative (SBTi) in order to achieve measurable reductions
in Siemens Gamesa’s environmental impact.
Publicly disclose this information in a transparent and
verified manner and voluntarily participate in GHG
reduction programs and certifications.
Analyse
GHG impacts
Identify reduction
opportunities
Set measurable
targets
Public disclosure
& voluntary
participation

SIEMENS GAMESA GHG EMISSIONS REPORT 2021
11
2. Organizational boundaries
2.1. Organizational boundaries
In order to define the boundaries of the organization the operational control
approach is selected, since it best represents the organization’s activities with
respect to the work centres performing operational control of the activity and it
is the approach that allows greater potential for reducing GHG emissions.
A total of 68 Siemens Gamesa locations are considered for this GHG emissions
report. These locations were selected following our internal Environmental
Monitoring procedure that ensures a total amount of energy consumption
(Scope 1+2) monitored shall cover 95 % of the total energy consumption of
SGRE. The table shows number of locations and type per region included2.
Business Type
Region/Number of Sites
APAC BRAZIL INDIA LATAM NAM NEME SE&A Total
Construction site 2 1 1 1 2 2 1 10
Distribution center 2 1 3
Office 1 1 1 1 4 2 10
Pre-assembly 2 2
Production Blades 1 1 1 3 2 8
Production Electrical/Gearbox 10 10
Production Nacelle/Hub/Generator 1 1 1 1 2 1 7
Service Wind Farms 1 1 1 1 1 1 6
Substations 1 1
Training location 1 1 2
Warehouse 1 2 2 3 8
Work Shop 1 1
68
2 The reduction in the number of locations from FY20 to FY21 is due to the following change: Previously Service sites where mentioned individually, now they have been
consolidated and presented as one for each region.

SIEMENS GAMESA GHG EMISSIONS REPORT 2021
12
2.2. Emission sources by locations
Siemens Gamesa has a range of sites already listed in section 3.1. The figure
below illustrates the geographic location and associated emissions types per
business type.
>50 Sales offices
in 39 countries
7 Service core competence centers
covering all regions
Main Sales Offices Main Engineering Centers Nacelles Blades
Electric Consumption
Diesel Consumption
Nat. Gas
Refrig. Consumption
Electric
Vehicle Fuel
Refrig. Consumption
Electric
Propane Consumption
Nat. Gas
Diesel Consumption
Refrig. Consumption
Figure 2: Overview of
main SGRE locations and
associated emissions at the main categories.
SIEMENS GAMESA GHG EMISSIONS REPORT 2021
13
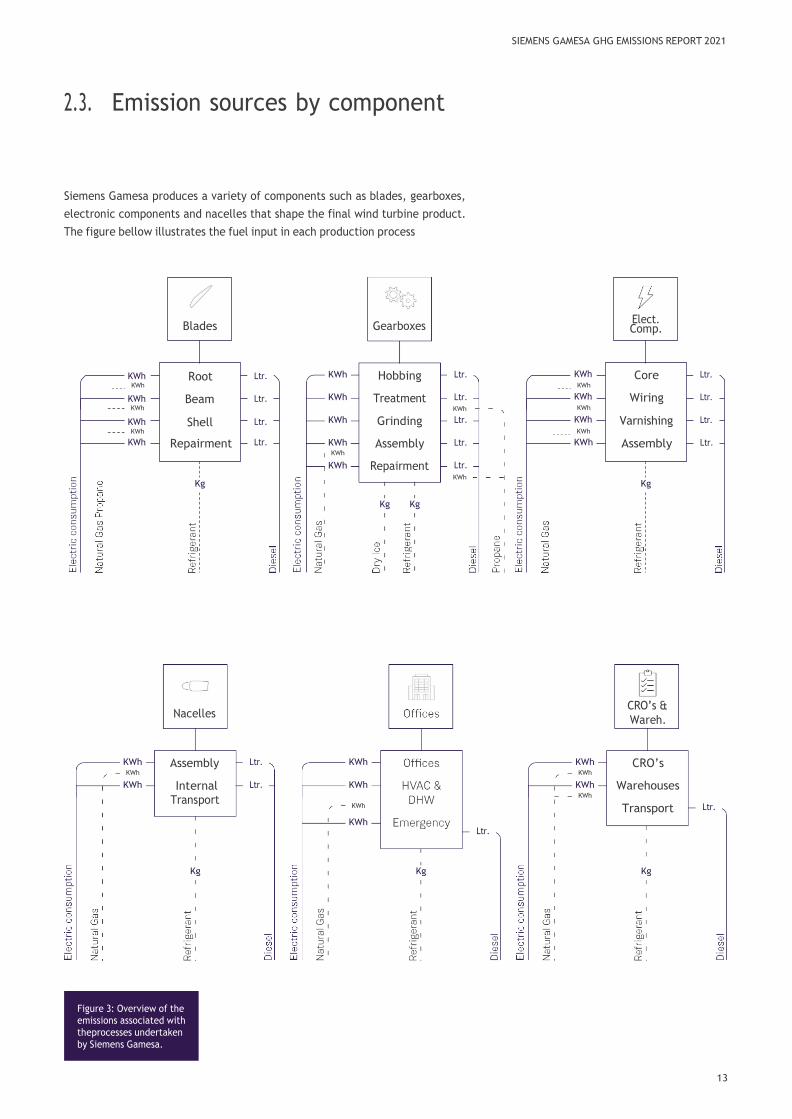
2.3. Emission sources by component
Siemens Gamesa produces a variety of components such as blades, gearboxes,
electronic components and nacelles that shape the final wind turbine product.
The figure bellow illustrates the fuel input in each production process
Blades
KWh Root
KWh Beam
KWh Shell
KWh Repairment
Hobbing
Grinding
Assembly
KWh Core
KWh Wiring
KWh Varnishing
Assembly
Internal
CRO’s
Warehouses
Transport
Figure 3: Overview of the emissions associated with
the processes undertaken
by Siemens Gamesa.
SIEMENS GAMESA GHG EMISSIONS REPORT 2021
14
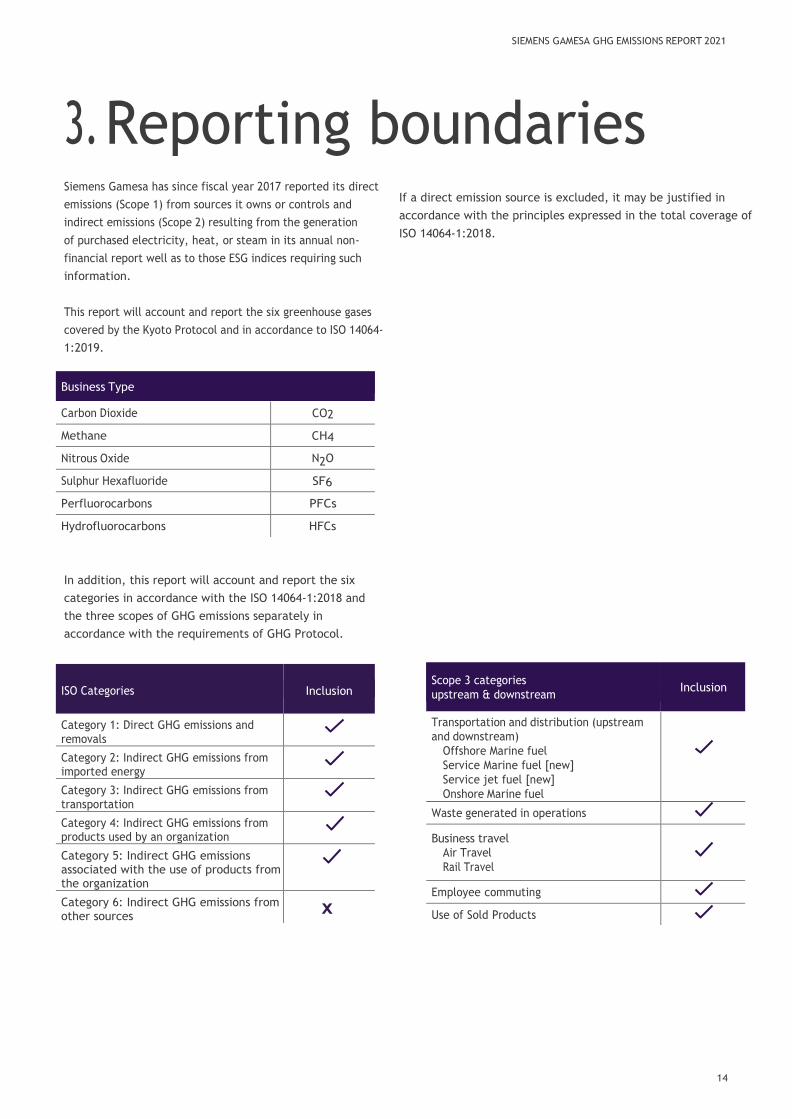
3. Reporting boundaries
Siemens Gamesa has since fiscal year 2017 reported its direct
emissions (Scope 1) from sources it owns or controls and
indirect emissions (Scope 2) resulting from the generation
of purchased electricity, heat, or steam in its annual non-
financial report well as to those ESG indices requiring such
information.
This report will account and report the six greenhouse gases
covered by the Kyoto Protocol and in accordance to ISO 14064-
1:2019.
In addition, this report will account and report the six
categories in accordance with the ISO 14064-1:2018 and
the three scopes of GHG emissions separately in
accordance with the requirements of GHG Protocol.
If a direct emission source is excluded, it may be justified in
accordance with the principles expressed in the total coverage of
ISO 14064-1:2018.
Business Type
Carbon Dioxide CO2
Methane CH4
Nitrous Oxide N2O
Sulphur Hexafluoride SF6
Perfluorocarbons PFCs
Hydrofluorocarbons HFCs
Scope 3 categories
upstream & downstream
Inclusion
Transportation and distribution (upstream
and downstream)
Offshore Marine fuel
Service Marine fuel [new]
Service jet fuel [new]
Onshore Marine fuel
Waste generated in operations
Business travel
Air Travel
Rail Travel
Employee commuting
Use of Sold Products
ISO Categories Inclusion
Category 1: Direct GHG emissions and removals
Category 2: Indirect GHG emissions from imported energy
Category 3: Indirect GHG emissions from transportation
Category 4: Indirect GHG emissions from products used by an organization
Category 5: Indirect GHG emissions associated with the use of products from the organization
Category 6: Indirect GHG emissions from other sources
x

SIEMENS GAMESA GHG EMISSIONS REPORT 2021
15
GHG Scopes:
▪ GHG direct emissions (Scope 1) – Direct
emissions that occur from sources that are
owned or controlled by the Company.
▪ GHG indirect emissions (Scope 2) – Indirect
emissions from the generation of purchased
electricity consumed by the Company as well as
district heating.
▪ Other GHG indirect emissions (Scope 3) –
Indirect emissions that are a consequence of the
activities of the Company but occur from sources not
owned or controlled by the Company.
The GHG Protocol splits scope 3 emissions in 15 distinct categories
that occur in the company’s value chain. It is the intention of SGRE
to report scope 3 emission categories as reliable and transparent
data becomes available and in future reports in accordance with
the verified science-based target. The following Scope 3 emissions
from both upstream and downstream sources were accounted for
and included in this report:

SIEMENS GAMESA GHG EMISSIONS REPORT 2021
16
Scope 3 emissions categories such as “business travel”,
“waste generated in operations” and “upstream and
downstream transportation and distribution” were quantified
with a higher level of accuracy due to:
Data availability and reliability from suppliers and Siemens
Gamesa facilities.
Potential emissions reductions that could be undertaken or
influenced by the Company.
CO2 emissions from biomass combustion and other sources of
carbon emissions from short-cycle are not used by Siemens
Gamesa.
Together the three emissions scopes provide a
comprehensive accounting framework for managing and
reducing direct and indirect emissions. The following picture
provides an overview of the direct and indirect emissions,
the relationship between the scopes and the upstream and
downstream sections.
Upstream activities Siemens Gamesa Downstream activities
Indirect
Direct
Indirect
Indirect
Figure 4: Overview of scope
1, 2 and 3 emissions
Scope 1
Company facilities and vehicles
Scope 3
Transport and distribution (upstream
& downstream), waste generated in
operations, business travel,
employee commuting and use of
sold products
Scope 2
Purchased electricity, steam, heating
and cooling for own use
CO2 N2OH

SIEMENS GAMESA GHG EMISSIONS REPORT 2021
17
3.5 Direct and indirect emissions sources reported
GHG direct emissions sources (Scope 1)
Energy direct emissions
Point Activity / Category Generated GHG Details
1.1 Natural gas combustion CO2, CH4, N2O Boilers
1.2 Diesel combustion CO2, CH4, N2O Power generator units and boilers
1.3 Propane combustion CO2, CH4, N2O Production lines, forklifts
1.4 Combustion of diesel and gasoline for automotive CO2, CH4, N2O Vehicles (pickups)
1.5 Refrigerants PFCs, HFCs Air conditioning
1.6 Dry ice CO2 Dry ice
GHG indirect emissions sources (Scope 2)
Energy indirect emissions
Point Activity / Category Generated GHG Details
2.1 Electricity consumption CO2, CH4, N2O Power and lighting
2.2 District heating CO2, CH4, N2O Heating
Other GHG indirect emissions (Scope 3)
Other Indirect Emissions
Point Activity / Category Generated GHG Details
3.1 Transportation and distribution CO2, CH4, N2O Marine and jet fuel
3.2 Waste generated in operations CO2, CH4, N2O All facilities listed in section 2.1
3.3 Business travel CO2, CH4, N2O Air and rail travel
3.4 Employee Commuting CO2, CH4, N2O All SGRE employees
3.5 Use of sold products No GHG generation SGRE sold products are powered
with wind renewable energy

SIEMENS GAMESA GHG EMISSIONS REPORT 2021
18
3.6 Exclusions
Reporting locations
The SGRE procedure PRO-15083 “Environmental Monitoring”
describes the internal assessment and energy consumption
threshold for locations that need to be included in the
environmental monitoring in which SGRE has operational control.
A total of 68 facilities have being considered for the report
following our internal Environmental Monitoring procedure
that ensures a total amount of energy consumption (scope
1+2) monitored shall cover 95 % of the total energy
consumption of SGRE. This corresponds approximately to an
annual energy consumption above 2.000 GJ per location/site.
For more details about these sites, please refer to section 2.1.
Locations excluded from the inventory therefore do not
exceed 5% of total issuance due to our internal cut off criteria.
The exclusions have been estimated according to the following:
Employees assigned to locations without data information is 547 employees.
Ratio of t CO2e per employee: 1,10 t CO2e.
Maximum GHG emissions not counted: 602 t CO2e.
% Total GHG emissions not counted: 2,09%
Other indirect emissions (Scope 3)
The following table express the upstream and downstream
categories that are included and exclude of the report.
Scope 3 categories
upstream & downstream
Inclusion
Purchased goods, services and capital
goods
Fuel- and energy-related activities not
included in Scope 1 or Scope 2 n.a
Transportation and distribution (upstream
and downstream)
▪ Offshore marine fuel
▪ Service marine fuel [new]
▪ Service jet fuel [new]
▪ Onshore marine fuel
Waste generated in operations
Business travel
Air
Rail
Employee commuting
Upstream leased assets
Processing of Sold Products n.a
Use of Sold Products
End-of-Life Treatment of Sold Products
Downstream Leased Assets
Franchises n.a
Investments
Emissions excluded from upstream and downstream
value chain are not accounted in this report due to lack of
completeness and accuracy principles.

SIEMENS GAMESA GHG EMISSIONS REPORT 2021
19
4. Inventory of emission and offsets
4.1 Reporting period and general methodology
Base year
The base year is Siemens Gamesa’s fiscal year 2019, or the
period between October 1, 2018 and September 30, 2019.
Reporting period
This GHG emissions report reflects the situation of Siemens
Gamesa’s fiscal year 2021, or the period between October 1,
2020 and September 30, 2021.
Methodology
Quantifying GHG emissions includes the data collection
process and the application of documented emission
factors. The quantification is based on two calculation-based
methodologies, depending on the type of emission source:
Emission sources in which there is a chemical
transformation process (combustion, fixed or mobile)
and indirect emissions from electricity consumption:
Emissions of CO2 (t CO2e) = Activity data x Emission factor
Emission sources where there is no chemical
transformation process (fugitive emissions), or in case
the results in GHG are different than CO2 are converted to
tones of CO2e using the Global Warming Potential (GWP)
values provided by the IPCC (e.g. tones of CH4):
Emissions of CO2 (t CO2e) = Activity data x Global warming
potential

SIEMENS GAMESA GHG EMISSIONS REPORT 2021
20
4.2. Activity data, emissions factors and methodology per emission type
Siemens Gamesa collects environmental information through a software tool that tracks energy
and fuel consumption, and waste generation of all locations. In this way the Company minimizes
the uncertainty, enables to standardize the information and allows to compile the data in order to
obtain accurate activity data to calculate global emissions. The activity data that is not tracked by the
software is requested to suppliers and different internal areas such as spend reports.
Emission Type Activity Data Emission
Factors Methodology Methodology Details
Direct emissions
(Scope 1)
Energy consumption
and Fuel volume
GHG
Protocol
Link
Fuel volume
and energy
consumption
converted to GJ x
Emission Factors
Purchased volumes of commercial fuels such
as natural gas, LPG, diesel, gasoline, heating
oil and jet fuel were converted into Gigajoules
(GJ) and multiplied by the published emission
factors in the GHG Protocol.
Indirect emissions
(Scope 2)
Electricity consumption
IEA
Link
Purchased
electricity x
Emission Factor
District heating x
emission factor
Purchased electricity in kWh multiplied by the
published emission factors in the IEA 2016
report. When Energy Attribute Certificates
are bought, zero emission is applied.
Purchased m3 district heating multiplied
by the emissions factors published by the
district heating provider.
Other indirect
emissions (Scope 3)
Transportation
and distribution
(upstream and
downstream)
Marine fuel
(OF-ON-SE)
Jet fuel (SE)
Fuel volume and
Distance travelled
IMO-Link
p.58
GHG
Protocol-
Link
Fuel-based method
Distance-based
method
Purchased volumes of marine, jet and
road transport or distance travelled were
multiplied by the published emission
factor.
Waste generated in
operations
Amount of waste
generated in operations
(t)
DEFRA
Link
Waste-type-
specific method in
accordance with
GHG Protocol
“Waste generated in operations” emis-
sions were calculated using waste volu-
mes at facility-level and emission factors
from DEFRA.
Business
travel
Air Travel
Rail Travel
Supplier data -Distance
Travelled (miles)
Supplier data –
Emissions Factors
DEFRA
Link
Supplier
calculations -
Distance-based
method
Travel emissions for air and rail were
calculated using activity data and emis-
sion factors provided by the supplier. The
emission factors source is DEFRA.
Employee commuting
SGRE workforce
Modal split per
representing
countries
Distances travelled
per country (km)
DEFRA
Link
Distance-based
method in
accordance with
GHG Protocol
Employee commuting emissions were
calculated using SGRE workforce number
per country, multiplied by the average
transport commute distance by country
(Sönnichesen, 2019) and the modal split
(Rodrigue, 2017) multiplied by the emis-
sions factor DEFRA.
Use of Sold Products Energy consumption in
sold products (kWh)
IEA
Link
Energy
consumption
Energy consumption multiplied by the
published emission factors from the IEA.

SIEMENS GAMESA GHG EMISSIONS REPORT 2021
21
4.3. GHG emissions inventory quantification by scope
The following table shows the quantification of GHG emissions related to scope
1, scope 2 and scope 3 where data has been found available.
Indicator Fiscal Year 2019
(Base year) t CO2e Fiscal Year 2020
t CO2e Fiscal Year 2021
t CO2e
Total Direct GHG emissions (Scope 1) 26.437 26.052 26.788
Carbon dioxide (CO2) 26.389 26.009 23.834
Methane (CH4) 0,41 0,43 0,43
Nitrous oxide (N2O) 0,14 0,12 0,14
Total Indirect GHG emissions (Scope 2) 44.262 1.8571 2.017
Total Other indirect emissions (Scope 3) 71.825 516.853 856.082
Business travel total 9.739 5.101 2.777
Disposal of waste generated in operations 3.061 10.6662 6.376
Employee commuting 4.841 3.041 3.077
Transport and Distribution 54.183 498.0453 843.8523
Use of sold products 0 0 0
TOTAL GHG EMISSIONS (Scope 1, 2 and 3) 142.523 544.762 884.887
1Decrease in Scope 2 emissions is due to the purchase of Energy Attribute
Certificates (EACs) which ensure that the origin of the electricity is from renewable sources. 2Increase in the amount of waste emissions is due to the increase of waste
tones reported compared with FY19. 3Increased in transport and distribution category between FY19-21 is due to the addition of jet and marine fuel data for construction and service
activities.

SIEMENS GAMESA GHG EMISSIONS REPORT 2021
22
4.4. Consolidated statement of GHG emissions FY21
In the table below, GHG emissions quantification breakdown by
business unit and category in conformity requirements of standard ISO
14064-1:2018.
Direct GHG Emissions Fiscal Year 2021
t CO2e
Category 1: Direct GHG emissions and removals 26.788
Onshore 15.609
Gasoline 628
Diesel 10.357
Natural Gas 3.270
LPG 1.125
Heating fuel oil 0
Refrigerants 230
Offshore 6.112
Gasoline 20
Diesel 1.710
Natural Gas 4.066
LPG 176
Heating fuel oil 101
Refrigerants 39
Service 2.118
Gasoline 147
Diesel 1.594
Natural Gas 288
LPG 39
Heating fuel oil 37
Refrigerants 13
Corporate 2.949
Gasoline 0
Diesel 104
Natural Gas 914
LPG 434
Heating fuel oil 187
Refrigerants 1.310
Indirect GHG Emissions Fiscal Year 2021
t CO2e
Category 2: Indirect GHG emissions from imported energy 2017
Onshore 241,27
Electricity from non-renewable sources 0

SIEMENS GAMESA GHG EMISSIONS REPORT 2021
23
District heating 241,27
Offshore 1775,45
Electricity from non-renewable sources 0
District heating 1775,45
Service 0
Electricity from non-renewable sources 0
District heating 0
Category 3: Indirect GHG emissions from transportation 849.706
Transportation and distribution (Upstream and Downstream) 843.852
Onshore (deep sea component transport) 726.785,15
Offshore (installation vessels) 19.804,25
Service (service vessels and helicopters) 97.262,37
Business Travel (air and rail) 2.777
Air 2.739
Rail 37,64
Employee Commuting 3.077
Category 4: Indirect GHG emissions from products used by an organization 6.376
Waste generation in operations 6.376
Category 5: Indirect GHG emissions associated with the use of products from the organization
0
Use of sold products 0
Removals 0

SIEMENS GAMESA GHG EMISSIONS REPORT 2021
24
4.5 Offsetting
Siemens Gamesa has been investing in Clean Development
Mechanism (CDM) projects and sink projects involving
reforestation actions that aim to reduce future emissions to
balance its carbon footprint.
The wind power project Bii Nee Stipa in Oaxaca, Mexico, was
registered as a Clean Development Mechanism (CDM) under the
United Nations Framework Convention for Climate Change
(UNFCCC). This project generates Certified Emission Reductions (CER)
for Siemens Gamesa that are used to offset the non- avoided
emissions. Siemens Gamesa has again this year chosen to cancel CERs
equivalent to its scope 1 and 2 emissions.
Siemens Gamesa is continuously working to decrease the need for
offsetting towards the achievement of the net-zero emissions target
by 2040.
28.805 CERs cancelled in FY21
Figure 7 Wind power project in Bii Nee Stipa

SIEMENS GAMESA GHG EMISSIONS REPORT 2021
25
4.6 Uncertainty in GHG emissions inventory
Uncertainty in the emissions inventory is
a combination of the uncertainties in the
emission factors and in the corresponding
activity data.
Emission Factors
The emission factors, caloric data value
and oxidation factors used are considered
null uncertain as they come from official
sources and they are beyond the control of
the organization.
Activity Data
Direct emissions (Scope 1) and Indirect
emissions (Scope 2):
Data for Scope 1 and 2 is obtained from
commercial invoices. As activity data
from commercial operation is governed
by legal procedure is not necessary to
calculate the uncertainty.
Other indirect emissions (Scope 3):
Uncertainties in the accounting of the
Scope 3 emissions are related to generic
assumptions made.
Emission Type Uncertainty description
Transport and Distribution
Emission subcategories such as marine fuel
in Onshore, Offshore and Service for either
component transport or construction
services, as well as jet fuel in Service are
included as data becomes available
following the ISO and GHG Accounting and
Reporting Principles.
Waste generated in
operations
Lack of emissions factors for some waste types
and waste treatment methods in the DEFRA
source. Allocation of emissions factors for waste
types and waste treatment methods that do not
have value in DEFRA emissions source.
Business travel
Some estimates due to gaps in the availability of
air and rail travel from supplier.
Employee commuting Employee commuting uses average distances
travelled by country and generic modal split
(public transport and private vehicle) in big
cities which are then multiplied by DEFRA
emissions factors.
As a result of a COVID-19 home office
protocol, the same methodology was used
from the previous reporting year where a
conservative estimate of 53 working days for
white collar employees was assumed.

SIEMENS GAMESA GHG EMISSIONS REPORT 2021
26
4.7 Reducing uncertainty
Uncertainties in this GHG inventory arise
mainly from Scope 3 emissions. As a result,
Siemens Gamesa is engaging its supply
chain towards a complete decarbonization
in line with its Scope 3 science-based
target. The company is on the way to
implement a procurement approach, that
will give to suppliers an opportunity to
present their environmental efforts
translated in CO2 reductions. The intention
of Siemens Gamesa is to improve the
future inventory quality and increase the
level of confidence users have in the
inventory results. For more details see
section 1.1 Strategic focus for our Scope 3
emissions.
As a matter of fact, COVID-19 has been
impacting our business travel and
employees commuting categories from
Scope 3 since last fiscal year.
Employees were required to work from
home when the work was suitable for it,
and business travel activity was carried out
only in critical situations and in accordance
with national and international regulations.
Consequently, emissions in both categories
were significantly reduced without affecting
business operations.
In addition to the already mentioned, Siemens Gamesa will
follow concrete steps to reduce the uncertainty in the Scope 3
categories reported in this inventory:
Other indirect emissions (Scope 3):
Emission Type Reduce Uncertainty Actions
Transport and
Distribution
Keep tracking additional sources of GHG
emissions within the Transport and Distribution
(upstream and downstream) category, and
report emissions based on the ISO and GHG
Accounting and Reporting Principles.
Waste generated in
operations
Siemens Gamesa has been improving the reporting of waste generation in the facilities. Siemens Gamesa will continue to encourage facilities to improve the reporting and the classification of waste destination; recovery, recycling and reuse.
Business travel
Air Travel
Rail Travel
Continue to inform travel suppliers about the
efforts SGRE is making towards the development
of a GHG inventory and bring awareness of the
net-zero emissions target.
Continue with the awareness campaign to
communicate to employees the efforts that
SGRE is making towards the net-zero emissions
target.
Encourage suppliers to improve the GHG data
delivered to include not only air travel but also
rail, automotive and bus emissions.
Employee commuting
Siemens Gamesa will consider applying an
internal survey to calculate SGRE employees
commuting data. Communicate to employees
the efforts that SGRE is making towards the
development of a GHG inventory and the net-
zero emissions target.
The survey will be applied once the return-to-
the-office protocol has been activated in most
of the countries as a result of the recovery of
the pandemic, in order to get the updated
commuting patterns of the employees.
SIEMENS GAMESA GHG EMISSIONS REPORT 2021
27
5. Performance tracking
& reductions project
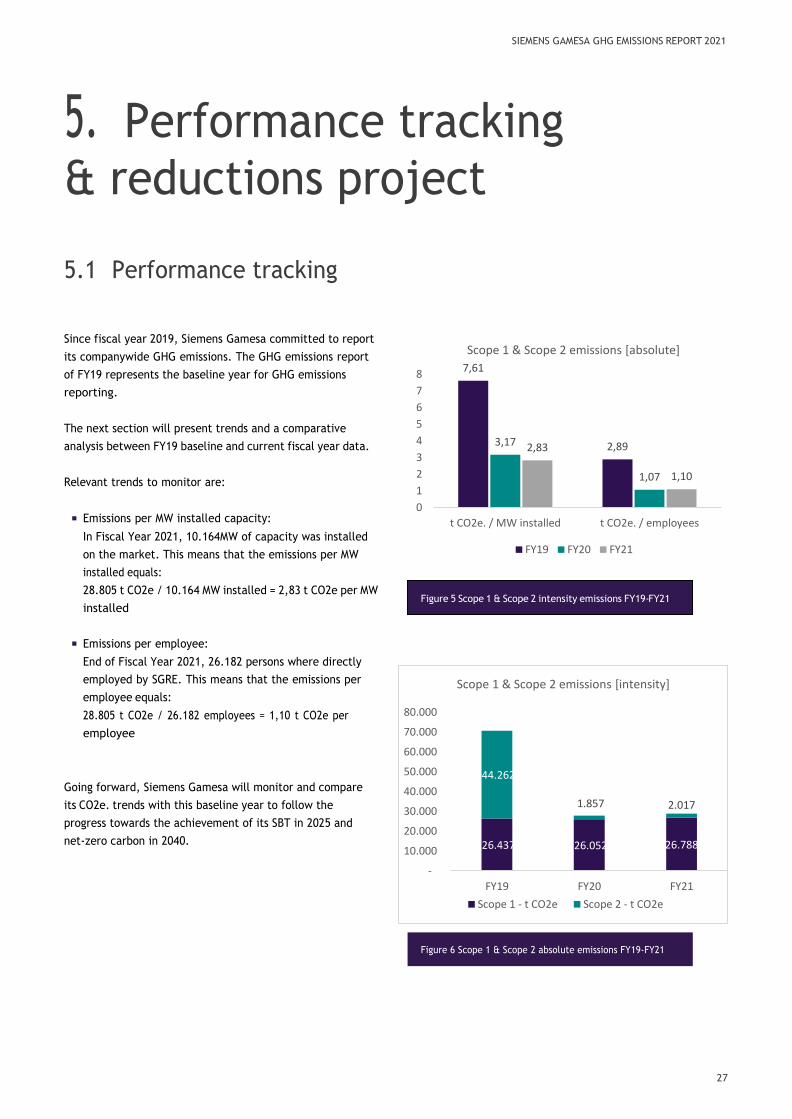
5.1 Performance tracking
Since fiscal year 2019, Siemens Gamesa committed to report
its companywide GHG emissions. The GHG emissions report
of FY19 represents the baseline year for GHG emissions
reporting.
The next section will present trends and a comparative
analysis between FY19 baseline and current fiscal year data.
Relevant trends to monitor are:
Emissions per MW installed capacity:
In Fiscal Year 2021, 10.164MW of capacity was installed
on the market. This means that the emissions per MW
installed equals:
28.805 t CO2e / 10.164 MW installed = 2,83 t CO2e per MW
installed
Emissions per employee:
End of Fiscal Year 2021, 26.182 persons where directly
employed by SGRE. This means that the emissions per
employee equals:
28.805 t CO2e / 26.182 employees = 1,10 t CO2e per
employee
Going forward, Siemens Gamesa will monitor and compare
its CO2e. trends with this baseline year to follow the
progress towards the achievement of its SBT in 2025 and
net-zero carbon in 2040.
7,61
2,893,17
1,07
2,83
1,10
0
1
2
3
4
5
6
7
8
t CO2e. / MW installed t CO2e. / employees
Scope 1 & Scope 2 emissions [absolute]
FY19 FY20 FY21
26.437 26.052 26.788
44.262
1.857 2.017
-
10.000
20.000
30.000
40.000
50.000
60.000
70.000
80.000
FY19 FY20 FY21
Scope 1 & Scope 2 emissions [intensity]
Scope 1 - t CO2e Scope 2 - t CO2e
Figure 5 Scope 1 & Scope 2 intensity emissions FY19-FY21
Figure 6 Scope 1 & Scope 2 absolute emissions FY19-FY21

SIEMENS GAMESA GHG EMISSIONS REPORT 2021
28
5.2 Reduction projects
Siemens Gamesa continues to make reductions and
implement energy efficiency measures related to their
operations across production facilities and project sites to
fulfill its emissions targets. Energy improvement projects are
being monitored through energy improvement actions plans.
In FY21, several improvement actions were proposed and
for those implemented the following energy savings were
achieved: 27.359 GJ
The following actions are examples of initiatives that have
been implemented at different plants and offices during the
reporting period. The below actions aimed at reducing
consumption and increase energy efficiency cover 64% of the
total reductions projects in FY21:
Country Location Initiative Savings (GJ) t CO2e Saved
US Fort Madison Change of building use resulting in reductions in electricity and heating
19.066 1.840
DK Aalborg Lighting exchange to LED 2.033 252
DE Cuxhaven Energy efficiency through reduced illumination 1.556 193
IN Nellore Reduced energy use with chiller pump automation 1.109 224
DK Brande Exchange of Uninterruptible Power Supply (UPS) Systems to more energy efficient units
748 43
CN Lingang Replacement of electrical dehumidifier with fresh air dehumidification system
347 60

SIEMENS GAMESA GHG EMISSIONS REPORT 2021
29
Conclusion
Siemens Gamesa recognizes that climate change is a global
issue requiring urgent and collective action and is committed
to contributing to the global economy’s decarbonization. We
believe that companies can play a pioneering role in the fight
against climate change
The Company has pledged it’s commitment to the Paris
Pledge for Action, the Science Based Target Initiative and
expanded its ambitions by incorporating a long term target of
achieving net-zero emissions by 2040. These commitments
demonstrate Siemens Gamesa’s agreement to contribute
to the accomplishment of the objectives established by the
United Nations Sustainable Development Goals.
Total scope 1 and 2 emissions of the Company in FY21:
28.805 t CO2e Total scope 3 emissions of the Company in FY21:
856.082 t CO2e
Total energy savings achieved in FY21:
27.359 GJ
Total CERs cancelled in FY21
28.805
The company will work continuously to reduce its emissions
towards the achievement of the net-zero emissions target
through the following emission reduction levers:
Energy reductions and energy efficiency measures
Electricity supply from renewable energy-based sources
Green mobility plan to reduce fleet emissions
Employee awareness campaigns and idea management as a
way to capture and implement employee ideas related to
sustainability
Supplier engagement across the value chain
Offset of non-avoided emissions through compensation
projects
Siemens Gamesa is working on strengthening the accuracy
and reliability of the data through the HSE reporting software
by improving the methods to collect and track data such as
energy consumption, fuel consumption and waste generation
for all locations of the Company. This software minimizes the
uncertainty, standardizes the information flow and compiles
analytics from the data to calculate global emissions related to
the organization.
In this report, Siemens Gamesa reports the six categories
described in the ISO 14064-1:2018. In addition, the company
continues reporting the three scopes in accordance with the
GHG Protocol Corporate Accounting and Reporting Standard,
and five GHG inventory categories of the Scope 3 upstream and
downstream value chain. Siemens Gamesa is currently
establishing a new strategic program in light of its SBT for
Scope 3 to engage more with key suppliers to encourage them
to reduce their Scope 1 and Scope 2 emissions affecting the
products and services they supply us. This program is the
basis for the development of company-wide program to reduce
emission in the company’s value chain.
Overall, the GHG emissions report supports in:
Obtaining an improved overview of Siemens Gamesa’s
direct and indirect GHG emissions and supporting the
decision-making process towards the reduction of GHG
impacts.
Identify cost effective reduction opportunities and early
voluntary actions.
Setting ambitious GHG reduction targets as well as
effectively measuring and reporting progress towards
these targets.
Publicly disclose this information in a transparent and
verified manner and voluntarily participate in GHG
reduction programs and certifications.
