greenhouse gas emissions from cultivation of winter wheat
TRANSCRIPT

Greenhouse gas emissions from cultivation of winter wheat and winter rapeseed for biofuels and from production of biogas from manure
- according to the Directive 2009/28/EC of the European Parliament on the promotion of the use of energy from renewable sources
Lars Elsgaard Department of Agroecology and Environment The Faculty of Agricultural Sciences Aarhus University

PREFACE This report has been produced on a request from February 22nd 2010 by the Danish Ministry of Food, Agriculture and Fisheries, with which The Faculty of Agricultural Sciences at Aarhus University (DJF) has a contract on provision of research-based public-sector consultancy. DJF was requested to produce a report that was structured in a similar way as the Swedish report on the same subject on describing greenhouse gas emissions from cultivation of agricultural crops for biofuels and production of biogas from manure (Ahlgren et al., 2009). The present report was authored by senior scientist Lars Elsgaard, DJF, and reviewed by research professor Jørgen E. Olesen and Head of Research Unit, John E. Hermansen, DJF. The report was finalized on June 15th 2010.
ii

SUMMARY Greenhouse gas (GHG) emissions were calculated for cultivation of winter wheat for ethanol production, winter rapeseed for biodiesel production and for production of biogas (vehicle gas) from manure under Danish conditions at the NUTS 2 level. The calculations were made to comply with the requirements outlined in the EU Directive 2009/28/EC from the European Parliament (2009). LCA methodology and interpretations of the EU Directive 2009/28/EC were generally used according to the report of Ahlgren et al. (2009). The base scenario and assumptions made resulted in the following emission estimates for winter wheat, winter rapeseed, and vehicle gas from manure.
Region
Win
ter w
heat
(g
CO
2eq/M
J eth
anol
)
Win
ter r
apes
eed
(g
CO
2eq/M
J rap
esee
d m
ethy
l est
er)
Bio
gas f
rom
solid
cat
tle m
anur
e (g
CO
2eq/M
J veh
icle
gas
)
Bio
gas f
rom
liqu
id c
attle
man
ure
(g C
O2e
q/MJ v
ehic
le g
as)
Bio
gas f
rom
liqu
id sw
ine
man
ure
(g C
O2e
q/MJ v
ehic
le g
as)
Hovedstaden 22 23 -15 -29 -30 Sjælland 19 23 -15 -29 -30 Syddanmark 22 25 -15 -29 -30 Midtjylland 23 26 -15 -29 -30 Nordjylland 23 27 -15 -29 -30 Sensitivity analyses of the cropping systems showed that the final emission results depended to a large extent on the emission factors assumed for N2O emission from the soil. For example, the uncertainty range reported for the IPCC N2O emission factors (IPCC, 2006) caused the final emission results to range from 12 to 48 g CO2eq/MJ ethanol for winter wheat and from 14 to 55 g CO2eq/MJ rapeseed methyl ester for winter rapeseed. Likewise, the assumptions made for GHG emissions associated with production of N fertilizer had a major impact on the final emission results. Production of mineral fertilizers using best available technology (with catalytic removal of N2O) has the potential to reduce the emission result as compared to N production at older European facilities. For biogas production from manure the main uncertainties in the emission estimates were related to emission factors used for methane and nitrous oxide from storage of manure. The emissions calculated for the present base scenarios were equal to or lower than the emissions stated as disaggregated default values for cultivation in the Directive 2009/28/EC.
iii

TABLE OF CONTENTS PREFACE……………………………………………………………………………... ii SUMMARY……………………………………………………………………………. iii TABLE OF CONTENTS……………………………………………………………... iv 1. INTRODUCTION……………………………………………………………… 1 2. METHODOLOGY……………………………………………………………… 2 3. INPUT DATA FOR CULTIVATION OF CROPS AND BIOGAS FOR
BIOFUEL PRODUCTION……...……………………………………………… 4 3.1 Cultivated areas and yields at the NUTS 2 level…………………………………. 4 3.2 Seed rate………………………………………………………………………….. 5 3.3 Fertilizer application……………………………………………………………… 5 3.4 Greenhouse gas emissions associated with fertilizer production………………….. 7 3.5 Pesticides…………………………………………………………………………. 8 3.6 Field operations…………………………………………………………………... 8 3.7 Liming……………………………………………………………………………. 9 3.8 Irrigation………………………………………………………………………...... 9 3.9 Crop drying……………………………………………………………………...... 10 3.10 Nitrous oxide emissions from cultivation………………………………………… 11 3.11 Energy balance and allocation……………………………………………………. 13 3.12 Input data for biofuel production from biogas……………………………………. 14 4. RESULTS………………………………………………………………………... 15 4.1 Greenhouse gas emissions from cultivation of crops for biofuel production…….. 15 4.2 Greenhouse gas emissions from production of biogas from solid
and liquid manure……………………………………………………………….... 17 5. DISCUSSION AND SENSITIVITY ANALYSES…………………………….. 18 5.1 Diesel consumption in cultivation………………………………………………... 18 5.2 Application of slurry as fertilizer………………………………………………… 18 5.3 Irrigation and crop drying………………………………………………………... 20 5.4 Crop yields……………………………………………………………………….. 21 5.5 Fertilizer production……………………………………………………………… 22 5.6 Emission of nitrous oxide from soil……………………………………………… 23 5.7 Biogas production………………………………………………………………… 25 5.8 Conclusions from the sensitivity analysis………………………………………… 25 6. ACKNOWLEDGEMENTS…………………………………………………….. 26 7. REFERENCES………………………………………………………………….. 27
g
iv

1. INTRODUCTION The EU Directive 2009/28/EC from the European Parliament (2009) concerns the promotion of the use of energy from renewable sources in the Member States. One of the purposes of the Directive is to ensure that biofuels are produced in a sustainable way, and it is stated, among others, that greenhouse gas (GHG) emission savings from the use of biofuels and bioliquids shall be at least 35% as compared to a reference fossil fuel. With effect from 2017 these requirements for GHG savings are increased to 50%. Fulfilments of the sustainability criteria are required if energy from biofuels and bioliquids are to be taken into account for (i) measuring compliance with the requirements of the EU Directive 2009/28/EC concerning national targets, (ii) measuring compliance with renewable energy obligations and (iii) eligibility for financial support for the consumption of biofuels and bioliquids. The present reporting has been done in relation to Article 19.2 in the EU Directive 2009/28/EC, which states specifically that:
“[…] Member States shall submit to the Commission a report including a list of those areas on their territory classified as level 2 in the nomenclature of territorial units for statistics (NUTS) […] where the typical greenhouse gas emissions from cultivation of agricultural raw materials can be expected to be lower than or equal to the emissions reported under the heading ‘Disaggregated default values for cultivation’ in part D of Annex V to this Directive, accompanied by a description of the method and data used to establish that list. That method shall take into account soil characteristics, climate and expected raw material yields”
For Danish conditions it was considered that wheat ethanol, rapeseed biodiesel (Rapeseed methyl ester, RME) and biogas from manure would be the major relevant production pathways of those listed in part D of Annex V to the EU Directive 2009/28/EC, and the reporting is aiming at these pathways of biofuel production. Yet, concerning the production of biofuel from manure, no current Danish facilities are in place for upgrading and distribution, and the time frame for possible implementation of such technologies is uncertain. Therefore, it was chosen to exclude a detailed calculation for biofuels from manure as no key figures on process conditions under Danish conditions could be presented. Rather, it was considered that emission results from modern Swedish facilities would be the best representation of future Danish process technology after adjustment for differences in the GHG emission associated with production of electricity for the upgrading processes. In the EU Directive 2009/28/EC, the typical disaggregated GHG emissions from cultivation of agricultural raw materials (eec), as listed in part D of Annex V to the Directive are 23 g CO2eq/MJ for wheat ethanol, 29 g CO2eq/MJ for rape seed biodiesel and 0 g CO2eq/MJ for biogas from wet and dry manure (European Parliament, 2009). The results presented in the report are derived from LCA practices, which have a range of embedded uncertainties. Therefore, sensitivity analyses were made in order to evaluate the effect of the assumptions made. It is recommended, however, that the present estimates should be updated with regular intervals, to account for effects of technological developments in the agricultural sector (e.g., in the sector of fertilizer production or use of biofuels), better knowledge on GHG emission factors and/or updated interpretations of the EU Directive 2009/28/EC.
1

2. METHODOLOGY The present task was to calculate the typical greenhouse gas emissions from cultivation of agricultural raw materials (eec), and compare this to the disaggregated default values for cultivation, according to the stipulations in the Directive 2009/28/EC. However, as also recognized by Ahlgren et al. (2009), the Directive contains relatively little information on the methodology for calculation of greenhouse gas emissions from cultivation of crops for biofuel production. Therefore interpretations of the directive were sometimes necessary. As far as possible the present interpretations were done in accordance with the work of Ahlgren and colleagues (2009). This work was based an extended working process and several discussions with reference group members, the Swedish Ministry of Agriculture and experts from IPCC. Regarding the methodology presented in the EU Directive 2009/28/EC the following requirements are central to the calculations of eec: • Emissions from the extraction or cultivation of raw materials, eec, shall include emissions
from the extraction or cultivation process itself; from the collection of raw materials; from waste and leakages; and from the production of chemicals or products used in extraction or cultivation. Capture of CO2 in the cultivation of raw materials shall be excluded. Certified reductions of greenhouse gas emissions from flaring at oil production sites anywhere in the world shall be deducted. Estimates of emissions from cultivation may be derived from the use of averages calculated for smaller geographical areas than those used in the calculation of the default values, as an alternative to using actual values. [Annex V, Part C, Point 6]
• Greenhouse gas emissions from fuels, E, shall be expressed in terms of grams of CO2 equivalents per MJ of fuel, g CO2eq/MJ. [Annex V, Part C, Point 2]
• Emissions from the manufacture of machinery and equipment shall not be taken into account. [Annex V, Part C, Point 1]
• The greenhouse gases to be taken into account are CO2, N2O and CH4, and for calculation in terms of CO2 equivalences those gases shall be valued as follows CO2: 1; CH4: 23 and N2O: 296. [Annex V, Part C, Point 5]
• Where a fuel production process produces, in combination, the fuel for which emissions are being calculated and one or more other products (co-products), greenhouse gas emissions shall be divided between the fuel or its intermediate product and the co-products in proportion to their energy content (determined by lower heating value in the case of co-products other than electricity). [Annex V, Part C, Point 17]
• Wastes, agricultural crop residues, including straw, bagasse, husks, cobs and nut shells, and residues from processing, including crude glycerine (glycerine that is not refined), shall be considered to have zero life-cycle greenhouse gas emissions up to the process of collection of those materials. [Annex V, Part C, Point 18]
Additional requirements for the reporting were that the results should (as far as possible) be representative for the situation in 2010 and take into account specific conditions at the NUTS 2 level. Input data to fulfil these requirements were mainly obtained from Statistics Denmark and from specifically requested data from the Department of Agroecology and Environment, Aarhus University (senior scientist Christen D. Børgesen and academic employee Inge T. Kristensen). Base scenarios were calculated for crops fertilized with commercial fertilizers, whereas the effect of slurry application was addressed in the sensitivity analyses.
2

As suggested by Ahlgren et al. (2009) crop drying was taken into account in the calculation of eec, and extensive grasslands were used as reference systems for calculation of N2O emissions from crop cultivation. As an expansion of the parameters considered by Ahlgren et al. (2009), irrigation, which may be important on sandy Danish soils, were included in the calculations. Likewise, the emissions associated with liming were included as liming belongs to normal agricultural practice on Danish soils. Data on the average GHG emissions from production and distribution of electricity in Denmark in 2009 was obtained from Energinet.dk (2010). These data were considered to be representative also for 2010. So far, the electricity systems in Eastern and Western Denmark are separated and therefore separate environmental declarations are reported by Energinet.dk. According to Energinet.dk (2010) the loss in the distribution net is not included in the environmental declaration, but can be accounted for by an average loss value of 5%. A resulting value of 489 g CO2eq/kWh was then used for electricity in Eastern Denmark, and a value of 461 g CO2eq/kWh was used for Western Denmark.
3
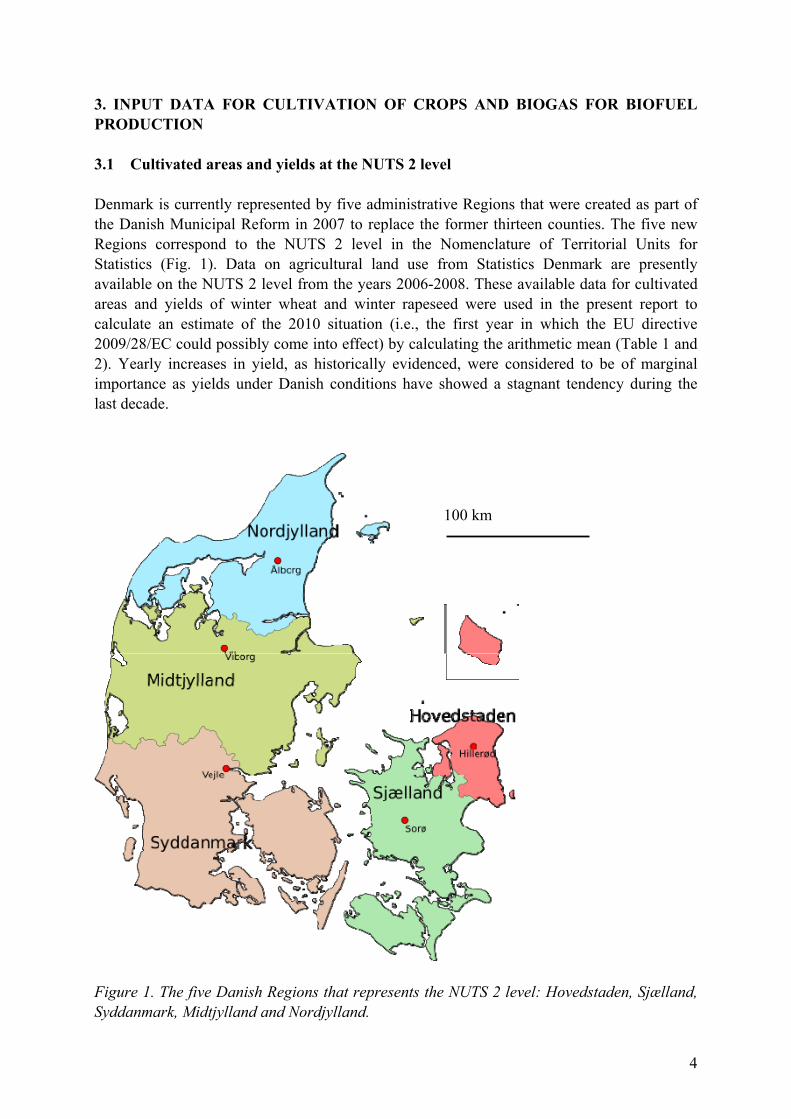
3. INPUT DATA FOR CULTIVATION OF CROPS AND BIOGAS FOR BIOFUEL PRODUCTION 3.1 Cultivated areas and yields at the NUTS 2 level Denmark is currently represented by five administrative Regions that were created as part of the Danish Municipal Reform in 2007 to replace the former thirteen counties. The five new Regions correspond to the NUTS 2 level in the Nomenclature of Territorial Units for Statistics (Fig. 1). Data on agricultural land use from Statistics Denmark are presently available on the NUTS 2 level from the years 2006-2008. These available data for cultivated areas and yields of winter wheat and winter rapeseed were used in the present report to calculate an estimate of the 2010 situation (i.e., the first year in which the EU directive 2009/28/EC could possibly come into effect) by calculating the arithmetic mean (Table 1 and 2). Yearly increases in yield, as historically evidenced, were considered to be of marginal importance as yields under Danish conditions have showed a stagnant tendency during the last decade.
100 km
Figure 1. The five Danish Regions that represents the NUTS 2 level: Hovedstaden, Sjælland, Syddanmark, Midtjylland and Nordjylland.
4
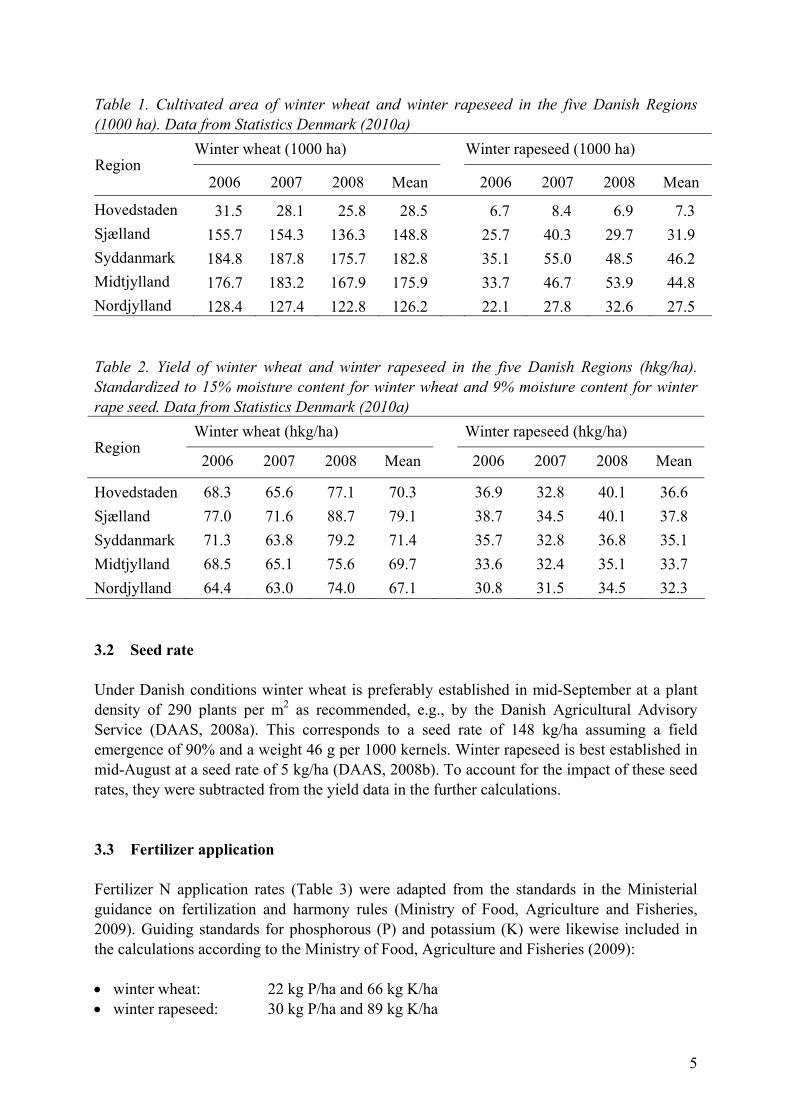
Table 1. Cultivated area of winter wheat and winter rapeseed in the five Danish Regions (1000 ha). Data from Statistics Denmark (2010a)
Winter wheat (1000 ha) Winter rapeseed (1000 ha) Region
2006 2007 2008 Mean 2006 2007 2008 Mean
Hovedstaden 31.5 28.1 25.8 28.5 6.7 8.4 6.9 7.3 Sjælland 155.7 154.3 136.3 148.8 25.7 40.3 29.7 31.9 Syddanmark 184.8 187.8 175.7 182.8 35.1 55.0 48.5 46.2 Midtjylland 176.7 183.2 167.9 175.9 33.7 46.7 53.9 44.8 Nordjylland 128.4 127.4 122.8 126.2 22.1 27.8 32.6 27.5 Table 2. Yield of winter wheat and winter rapeseed in the five Danish Regions (hkg/ha). Standardized to 15% moisture content for winter wheat and 9% moisture content for winter rape seed. Data from Statistics Denmark (2010a)
Winter wheat (hkg/ha) Winter rapeseed (hkg/ha) Region
2006 2007 2008 Mean 2006 2007 2008 Mean
Hovedstaden 68.3 65.6 77.1 70.3 36.9 32.8 40.1 36.6 Sjælland 77.0 71.6 88.7 79.1 38.7 34.5 40.1 37.8 Syddanmark 71.3 63.8 79.2 71.4 35.7 32.8 36.8 35.1 Midtjylland 68.5 65.1 75.6 69.7 33.6 32.4 35.1 33.7 Nordjylland 64.4 63.0 74.0 67.1 30.8 31.5 34.5 32.3 3.2 Seed rate Under Danish conditions winter wheat is preferably established in mid-September at a plant density of 290 plants per m2 as recommended, e.g., by the Danish Agricultural Advisory Service (DAAS, 2008a). This corresponds to a seed rate of 148 kg/ha assuming a field emergence of 90% and a weight 46 g per 1000 kernels. Winter rapeseed is best established in mid-August at a seed rate of 5 kg/ha (DAAS, 2008b). To account for the impact of these seed rates, they were subtracted from the yield data in the further calculations. 3.3 Fertilizer application Fertilizer N application rates (Table 3) were adapted from the standards in the Ministerial guidance on fertilization and harmony rules (Ministry of Food, Agriculture and Fisheries, 2009). Guiding standards for phosphorous (P) and potassium (K) were likewise included in the calculations according to the Ministry of Food, Agriculture and Fisheries (2009): • winter wheat: 22 kg P/ha and 66 kg K/ha • winter rapeseed: 30 kg P/ha and 89 kg K/ha
5

Table 3. Danish nitrogen standards (kg N/ha) for 2009/2010 (Ministry of Food, Agriculture and Fisheries, 2009)
Nitrogen standards for different soil types (kg N/ha) Crop
Coarse sand JB 1+3
Fine sand JB 2+4 & 10-12a
Irrigated sandy soilJB 1-4
Sandy loam JB 5-6
Loamy soils JB 7-9
Winter wheat 146 149 166 161 174 Winter rapeseed 166 177 177 183 186 a JB 10-12 soils represent silt, humus and special soil types The definition of soil types in the nitrogen standards relates the Danish JB soil classification system which divides soils into types from JB 1 to 12. To calculate the average fertilizer application in each Region, the distribution of crops and irrigation on different soil types was analysed with data obtained from the Department of Agroecology and Environment, Aarhus University (Inge T. Kristensen, personal communication). The data compiled represented an estimate of the situation in 2007, and based on the total cropping areas in 2007 and 2010, the data were recalculated to represent the 2010 situation (Table 4 and 5). Table 4. Area estimates (ha) of soil types cropped with winter wheat in 2010 in each of the five Regions. Estimates are the total areas and areas with irrigation (irrigt) for each soil type
Hovedstaden Sjælland Syddanmark Midtjylland Nordjylland Soil type total irrigt total irrigt total irrigt total irrigt total irrigt
JB 1 69 0 545 41 19503 13053 22305 13495 6923 2694 JB 2 203 36 1353 136 1163 334 7338 3614 39029 15423 JB 3-4 7205 823 19638 2647 46998 17885 72864 22049 47197 14794 JB 5-6 13556 941 87919 8460 93365 14971 55558 9003 15804 3305 JB 7 6731 164 34923 2537 14100 2460 8494 1059 5797 1381 JB 8-10 163 0 843 57 3007 1091 1752 547 1276 218 JB 11 532 107 2769 810 4585 2634 6283 3201 9515 4714 JB 12 40 9 810 197 79 29 1306 578 659 163 SUM 28500 2081 148800 14884 182800 52456 175900 53547 126200 42694 Table 5. Area estimates (ha) of soil types cropped with winter rapeseed in 2010 in each of the five Regions. Estimates are total areas and areas with irrigation (irrigt) for each soil type
Hovedstaden Sjælland Syddanmark Midtjylland Nordjylland Soil type total irrigt total irrigt total irrigt total irrigt total irrigt
JB 1 43 3 75 16 6958 4403 7591 4223 2430 912JB 2 62 12 274 54 390 132 2356 1063 10503 4183JB 3-4 3505 443 5823 878 13274 4790 21037 5931 10609 3321JB 5-6 2609 273 19833 1988 21237 3428 11549 1823 2256 523JB 7 918 51 5039 512 2710 336 1362 198 553 82JB 8-10 9 0 155 0 524 198 102 13 65 24JB 11 151 44 687 192 1098 645 782 435 968 554JB 12 4 1 14 1 9 5 20 8 116 54SUM 7300 828 31900 3642 46200 13937 44800 13694 27500 9653
6

Soil classes for the N standards and the area estimates (Table 3 to 5) were not completely overlapping. Therefore, three assumptions were made: (i) the area fertilized according to JB 7-9 standards was estimated as the cropping area on JB 7-10, (ii) the area fertilized according to JB 10-12 standards was estimated as the cropping area on JB 11-12, and (iii) an average nitrogen standard was used for the non-irrigated JB 1-4 soil types (147.5 kg N/ha for winter wheat and 171.5 kg N/ha for winter rapeseed). As the share of JB 8-10 areas is very minor, the impact of the assumptions was considered to be negligible, but allowed an assessment of the mean application of fertilizer-N in the five Regions (Table 6). Table 6. Mean application rate of fertilizer-N estimated for each of the five Regions (kg N/ha)
Region Winter wheat (kg N/ha) Rapeseed (kg N/ha)
Hovedstaden 161 178 Sjælland 162 181 Syddanmark 160 179 Midtjylland 157 176 Nordjylland 156 175 3.4 Greenhouse gas emissions associated with fertilizer production Greenhouse gas emissions associated with fertilizer production vary according to, e.g., different processing technologies, energy sources and utilization of co-products (Wood and Cowie, 2004; Cherubini, 2010). New technologies, including catalytic cleaning of nitrous oxide, has lowered the emissions from production of fertilizers over the last decade, and therefore the average European emission estimate of 6.8 kg CO2eq/kg N, as listed in the review by Jenssen and Kongshaug (2003), was considered by Ahlgren et al. (2009) to represent a present ‘worst case’ scenario. Based on recent data from the dominant producer (Yara) on the Swedish market, Ahlgren et al. (2009) adopted the estimate that the emissions of greenhouse gases during production of nitrogen fertilizers for Sweden would on average be 2.9 kg CO2eq/kg N in 2010. On the Danish market, Yara has a major position that can be estimated to ca. 60% of the market share (Lars Johansen, personal communication). At the same time, Yara from 2010 guarantees an environmental load of less than 4 kg CO2eq/kg N for fertilizers produced for Denmark, Finland, Norway and Sweden (Yara, 2010). This figure is set as a maximum, and a value of 3.52 kg CO2eq/kg N is considered to be a realistic emission factor to be used in the present calculations as this is reported as the average carbon footprint for Yara fertilizers supplied to Denmark (Jenssen, 2010). For the rest of the Danish market (ca. 40% of the market share) different European producers from, e.g., Balticum, Poland, Russia, Netherlands and Germany are involved. For this market share, the average European emission factor estimate of 6.8 kg CO2eq/kg N (Jenssen and Kongshaug, 2003) may represent a worst case scenario. However, to avoid a worst case scenario in the baseline calculations it was assumed that since the review of Jenssen and Kongshaug (2003) an average improvement of 20% in relation to the greenhouse gas
7

emissions has been obtained among European producers. This estimate was based on discussions with specialists in the Danish fertilizer business. Based on the market shares and carbon footprints, a contemporary estimate of greenhouse gas emissions associated with production of commercial fertilizers (Efert) for the Danish market in 2010 would be 4.3 kg CO2eq/kg N: Efert = 3.52 kg CO2eq/kg N × 60% + 0.8 × 6.8 kg CO2eq/kg N × 40% = 4.3 kg CO2eq/kg N Emission values for production of phosphorous (P) and potassium (K) were adopted from LowCVP (2004). The values used were 0.71 kg CO2eq/kg P and 0.46 kg CO2eq/kg K. The emissions associated with transport of fertilizers to Denmark were tentatively estimated by considering a route involving 1000 km of sea freight and 350 km of road transportation. These distances were considered to be within a realistic range although detailed assessments were not performed. Emissions of greenhouse gas equivalents associated with transport were derived from the LCA Food database (Nielsen et al., 2003) and the values used were 8.99 g CO2eq/ton/km for sea freight and 227 g CO2eq/ton/km for road transportation by truck. The contribution from transport was in the range of 3% of the emissions calculated for production of fertilizers. 3.5 Pesticides For the application of pesticides, no detailed statistic were available that specified the amount of active substance given to individual crops in each of the five Regions. However, according to Statistics Denmark (2010b) the average amount of active substance applied per treatment was 0.56 kg/ha in 2008. This value was used in the present calculations. To estimate the greenhouse gas emissions from the production of chemical pesticides, data from Olesen et al. (2004) were used (Table 7). Table 7. Emission of greenhouse gases from production of pesticides (Olesen et al., 2004)
Greenhouse gas Emission (kg/kg active substance)
CO2 4.92 CH4 0.00018 N2O 0.0015 3.6 Field operations The type and number of field operations assumed for cultivation of winter wheat and winter rapeseed were adapted from the ‘budget kalkuler 2009-2010’ from the Danish Agricultural Advice Service (DAAS, 2009a). All regions were assumed to have the same type and number of field operations (Table 8).
8

Table 8. Field operations during cultivation of winter wheat and rapeseed (DAAS, 2009a), and diesel consumption associated with field operations (Dalgaard et al., 2004)
Frequency Operation Winter wheat Winter rapeseed
Diesel consumption
Ploughing 1 1 23 L/ha Stubble-harrowing 0 1 7 L/ha Fertilizing 2 2 2 L/ha Combined sowing/harrowing 1 1 ~5 L/ha Rolling 1 1 2 L/ha Application of pesticides 3 3 1.5 L/ha Threshing 1 1 14 L/ha The quantity of lubrification oil consumed was rated to 0.7% of the diesel consumed and the emission associated with production of lubrification oil was assumed to be the same as for diesel oil (Bernesson et al., 2006). To account for differences in energy needed for soil operations on different soil types, the diesel consumption for ploughing, stubble-harrowing, combined sowing/harrowing and rolling was multiplied by 1.1 for calculations on clay soils and organic soils (>JB nr. 7) and by 0.9 for calculations on sandy soils (here JB nr. 1-4) as suggested by Dalgaard et al. (2004). To estimate the energy needed for field operations in each Region, calculations were done on the basis of the cropping area estimates for different soil types in the five Regions as presented in Table 4 and 5. The standard value used for the indirect and direct GHG load of diesel consumption was 3.36 kg (Nielsen et al., 2003). 3.7 Liming The GHG effect of liming (used to increase soil pH) was included in the calculations according to Hvid (2009). The calculations were based on an average use of 275 kg lime per year and included the environmental effects of excavation, transport and CO2 release associated with mineralization of lime in the soil. The total contribution of liming, according to the assumed rate, was previously estimated to 121 kg CO2eq/year (Hvid, 2009). Consumption of diesel during the field operation of liming was assumed to be 1.5 L/ha (Dalgaard et al., 2004). 3.8 Irrigation Precipitation in Denmark may have a considerable year-to-year variation as well as a geographical variation. The typical range is between 600 to 900 mm of precipitation. Due to the prevalence of sandy soils in the western part of the country, these areas have the highest and most frequent need for irrigation in periods of drought. The crop-specific requirements
9

for irrigation on sandy soils (here JB nr. 1-4) are assumed to be 80 mm/ha for winter wheat and 125 mm/ha for winter rapeseed (Mogensen and Jensen, 2002). For the remaining soil types the need for irrigation is lower and more infrequent than for the sandy soils. In the present calculations it was assumed that irrigation on these soil types generally represented one third of the value for sandy soils. Irrigation is generally accomplished by self-moving systems with water pumping comprising the main energy consumption. It was assumed that water pumping was driven by electricity and the energy consumption for irrigation was taken to be 4.6 kWh/mm/ha (Refsgaard et al., 1998; Jens J. Høy, personal communication). Thus, in terms of GHG emissions associated with use of electricity, irrigation corresponded to 2.12 kg CO2eq/mm/ha as calculated for electricity supplied in Western Demark and 2.25 kg CO2eq/mm/ha as calculated for electricity supplied in Eastern Denmark. To calculate the energy needed for irrigation in each of the five Regions, calculations were done on the basis of the area estimates for irrigation presented in Table 4 and 5. 3.9 Crop drying Energy consumption for grain drying varies from year to year, notably according to the weather conditions at harvest time. Thus, some years no drying is required, whereas a need for 3 to 4 %-points reduction in the water content may occur in other years. Likewise, the systems used for drying are diverse (Kristensen, 2010) and have an impact on the energy use. In a well-dimensioned drying facility an energy consumption of ca. 5 MJ per kg evaporated water can be expected (Dalgaard et al., 2004; Jonsson, 2006). Drying of, e.g., 1 hkg grain from initially 19.25% water content to 15% water content requires an evaporation of 5 kg water and thus an energy consumption of 25 MJ. This is equivalent to 7 kWh in electricity or 0.7 L of oil (Dalgaard et al., 2004). In the present base scenario it was assumed that the share of crop drying facilities using electricity and oil each was 50%. This was based on estimates of energy use in on-farm drying practice (Kristensen and Gundtoft, 2004), estimates of the energy use in continuous central drying plants were oil is relatively important, and discussions with specialists in the field of grain drying. The environmental GHG load of oil for heating was rated to 94.2 g CO2eq/MJ (Nielsen et al., 2003). Drying of crops after harvest was assumed to aim at final moisture contents of 14.5% for winter wheat and 8.5% for rapeseed. The need for drying during 2006-2008 was tentatively estimated from data on water content reported from farmers to Statistics Denmark. Thus, from data provided by Statistics Denmark (Merete Iisager, personal communication) the percentage of farmers needing crop drying (i.e., where reported water contents were higher than 15% for winter wheat and 9% for rapeseed) were calculated and also the average need for drying (%-points) among these respondents were calculated. From these two numbers an average need for drying (%-points) in each of the five Regions was estimated (Table 9). The outcome of these calculations generally agreed with the expert judgement that an average need for drying could be estimated to 4 %-points for 1/3 to 1/2 of the harvest (Erik Fløjgaard Kristensen, personal communication).
10

Table 9. Estimated average need for grain drying in 2006-2008 (%-points water). Based on recalculation of data provided by Statistics Denmark (personal communication)
Winter wheat (%-points water) Winter rapeseed (%-points water) Region
2006 2007 2008 Mean 2006 2007 2008 Mean
Hovedstaden 2.1 1.8 1.6 1.8 1.1 1.7 0.8 1.2 Sjælland 0.9 1.5 1.4 1.3 0.8 1.2 0.9 1.0 Syddanmark 1.0 1.2 1.5 1.2 1.2 1.3 1.0 1.2 Midtjylland 1.6 1.5 1.7 1.6 0.9 1.4 0.8 1.0 Nordjylland 1.8 1.7 1.7 1.8 1.0 1.5 0.8 1.1 3.10 Nitrous oxide emissions from cultivation Nitrous oxide is formed in soil mainly as a result of microbial nitrification and denitrification activity (Sahrawat and Keeney, 1986). The potential of a soil to form and emit N2O increases with increasing N availability, but other major controllers of the N2O production also exist, such as oxygen status, temperature and soil pH (e.g., Granli and Bøckman, 1994). It is generally observed that the production and emission of N2O is highly variable in time and space and it is challenging, therefore, to model and predict the N2O emission from agricultural cropping systems (Vinther and Hansen, 2004). In the present assessment, nitrous oxide emissions from cultivation of winter wheat and winter rapeseed were calculated according to the methodology of IPCC (2006), which is intended for national greenhouse gas inventories. The method includes a direct contribution from N2O produced from added N in the soil system and an indirect contribution of N2O produced from N that escapes the cropping system via leaching and volatilization. Direct N2O emission in the IPCC (2006) methodology is calculated from the empirical assumption that 1% of the added nitrogen in soil system is emitted as N2O. To calculate the amount of added nitrogen, the IPCC methodology includes the amount of fertilizer N applied and a contribution from above-ground and below-ground crop residues: N2O (direct) = (FSN + FON + FCR) × EFN × 44/28 (kg N2O/ha) where: FSN = Amount of synthetic fertilizer applied (kg N/ha) FON = Amount of annual manure applied (kg N/ha) FCR = Amount of N crop residues above ground and below-ground (kg N/ha) EFN = IPCC emission factor for added nitrogen (0.01 kg N2O-N/kg N) Estimates for the amount of N in crop residues were calculated according to Mikkelsen et al. (2006), including contributions from stubble, chaff and non-salvaged straw. The percentage of the cropped area with non-salvaged straw (Table 10) was calculated as the average of data
11

from 2006-2008 (Statistics Denmark, 2010c). Values assumed for the amount of straw yield relative to grain yield and the N content in straw of winter wheat and winter rapeseed are shown in Table 11. Table 10. Percentage of cropped area with non-salvaged straw (%). Calculated from data in Statistics Denmark (2010c)
Winter wheat Winter rapeseed Region
2006 2007 2008 Mean 2006 2007 2008 Mean
Hovedstaden 57 57 48 55 97 92 93 94Sjælland 32 33 24 30 87 88 72 83Syddanmark 44 40 25 36 88 87 63 79Midtjylland 49 41 27 39 84 86 70 79Nordjylland 55 45 37 46 90 87 75 83 Table 11. Parameters included to calculate the direct N2O emission from crop residues. Data from Statistics Denmark (2010c) and Swedish Environmental Protection Agency (2007)
Parameter Winter wheat Rapeseed
Salvageable straw (DM) relative to harvested grains 0.55 0.90 N content in straw (% of DM) 0.51 1.07 As recommended by Ahlgren et al. (2009) – based on discussions with the IPCC - the N2O emission from cultivation of biofuels was estimated as the surplus in relation the N2O emission from extensive grassland as a reference system. Based on the work of Bouwman (1996), Vinther and Hansen (2004) developed an empirical model – SimDen – for quantifying denitrification under Danish soil conditions. As a standard value for unfertilized soil systems this model includes an annual emission of 1.57 kg N2O/ha. For extensive grasslands under Swedish soil conditions a synthesis of published measurement data suggested an emission corresponding to 0.50 ± 0.14 kg N2O/ha/year (Ahlgren et al., 2009). Direct measurements of N2O from extensive grasslands under Danish conditions in one published study ranged from 0.13 to 0.44 kg N2O/ha (Flechard et al. 2007), whereas unpublished data showed an emission of 1.0 kg N2O/ha based on 305 daily measurements (Per Ambus, personal communication). Based on this range of values, the N2O emission from the reference system in the present calculations was assumed to be 0.7 kg N2O/ha. Indirect nitrous oxide emissions are calculated from the nitrogen lost by leaching and volatilization. Leaching losses were estimated for each crop and Region (Table 12) based on data from Department of Agroecology and Environment, Aarhus University (Christen D. Børgesen, personal communication). To account for a reference system, typical leaching losses from extensive grassland under Danish conditions were subtracted from the crop-specific leaching losses. No deductions were made for leaching of nitrogen deposited via air
12
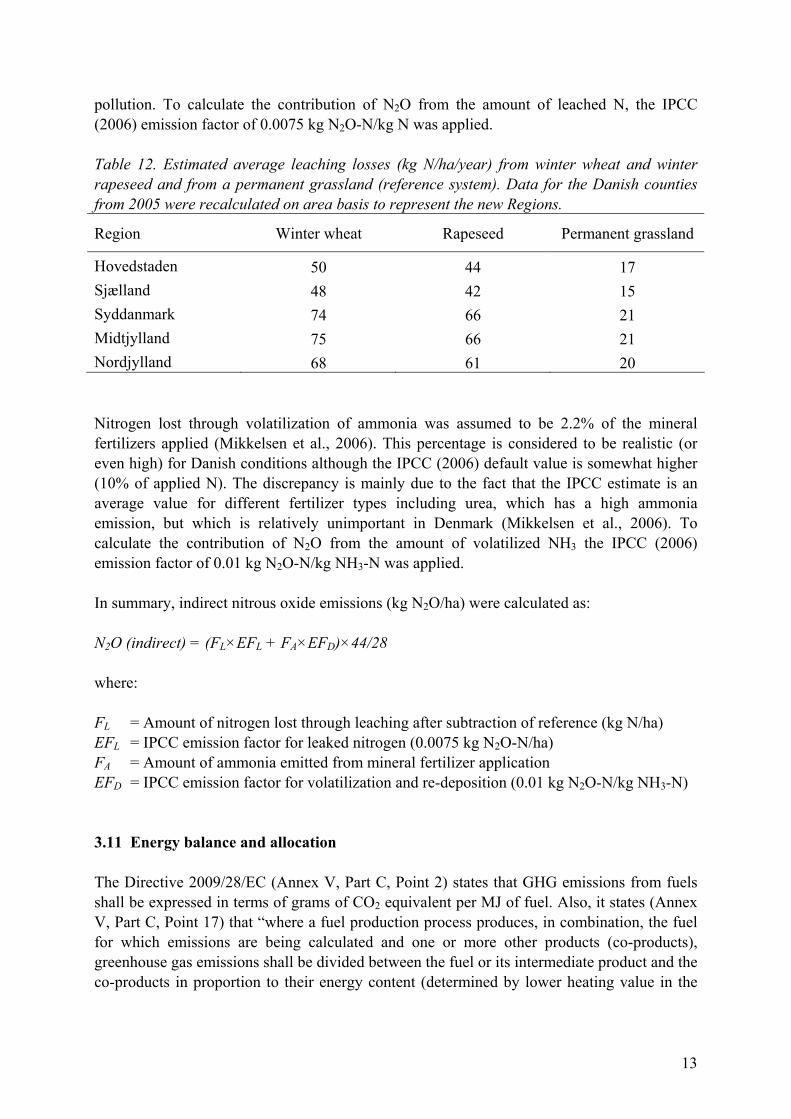
pollution. To calculate the contribution of N2O from the amount of leached N, the IPCC (2006) emission factor of 0.0075 kg N2O-N/kg N was applied. Table 12. Estimated average leaching losses (kg N/ha/year) from winter wheat and winter rapeseed and from a permanent grassland (reference system). Data for the Danish counties from 2005 were recalculated on area basis to represent the new Regions.
Region Winter wheat Rapeseed Permanent grassland
Hovedstaden 50 44 17 Sjælland 48 42 15 Syddanmark 74 66 21 Midtjylland 75 66 21 Nordjylland 68 61 20 Nitrogen lost through volatilization of ammonia was assumed to be 2.2% of the mineral fertilizers applied (Mikkelsen et al., 2006). This percentage is considered to be realistic (or even high) for Danish conditions although the IPCC (2006) default value is somewhat higher (10% of applied N). The discrepancy is mainly due to the fact that the IPCC estimate is an average value for different fertilizer types including urea, which has a high ammonia emission, but which is relatively unimportant in Denmark (Mikkelsen et al., 2006). To calculate the contribution of N2O from the amount of volatilized NH3 the IPCC (2006) emission factor of 0.01 kg N2O-N/kg NH3-N was applied. In summary, indirect nitrous oxide emissions (kg N2O/ha) were calculated as: N2O (indirect) = (FL×EFL + FA×EFD)×44/28 where: FL = Amount of nitrogen lost through leaching after subtraction of reference (kg N/ha) EFL = IPCC emission factor for leaked nitrogen (0.0075 kg N2O-N/ha) FA = Amount of ammonia emitted from mineral fertilizer application EFD = IPCC emission factor for volatilization and re-deposition (0.01 kg N2O-N/kg NH3-N) 3.11 Energy balance and allocation The Directive 2009/28/EC (Annex V, Part C, Point 2) states that GHG emissions from fuels shall be expressed in terms of grams of CO2 equivalent per MJ of fuel. Also, it states (Annex V, Part C, Point 17) that “where a fuel production process produces, in combination, the fuel for which emissions are being calculated and one or more other products (co-products), greenhouse gas emissions shall be divided between the fuel or its intermediate product and the co-products in proportion to their energy content (determined by lower heating value in the
13

case of co-products other than electricity”. Therefore, for the final calculations of the emission results, energy balance and allocations were included as described below. Calculations of energy balance for winter wheat were based on the estimates that 1 L of pure ethanol is produced from 2.65 kg wheat (Bernesson et al., 2006) and that the energy content of ethanol (the lower calorific value) is 21 MJ/L (Directive 2009/28/EC, Annex III). Thus, the energy content per unit mass was calculated to 7.92 MJ/kg. Production of ethanol generates the by-product distiller’s waste, which is usually used for animal feed. Therefore, the environmental load of the production process is shared between ethanol and distiller’s waste by allocation. In the present calculations this was done according to Bernesson et al. (2006), who calculated a share for ethanol of 60.8% based on the two product’s total energy yield. In the case of winter rapeseed, it was assumed that 1 kg rapeseed corresponded to 16.3 MJ RME (Ahlgren et al., 2009). For the allocations, the environmental load was shared between RME, rapemeal and glycerine. The share allocated to RME was 64.4% based on the three product’s total energy yield (Bernesson et al., 2004). Based on these estimates of energy balance and allocation, the final emission results were calculated as:
Emission result (g CO2eq/MJ) = )/()/(
)/( 2
kgMJobtainedenergyfuelhakgyieldCropfactorallocationhaCOgEmission eq
××
3.12 Input data for biofuel production from biogas In relation to production of biofuel and vehicle gas from manure, the present assessment were based on the system description of biogas plant and upgrading facilities presented by Ahlgren et al. (2009) for modern Swedish technologies. No differences on these processes on the NUTS 2 level were assumed by Ahlgren et al. (2009). Thus, factors such as need for process heating and GHG emissions from storage and spreading of manure were considered to be similar within the country. The system considered by Ahlgren et al. (2009) comprised a comparison between the emission from manure treated in a biogas and gas-upgrading plant and the emission from a reference system where the manure is collected in a storage tank and applied to the field without prior digestion. Process technology for upgrading was assumed to be of modern standard (with low methane leakage) and GHG emissions from handling of manure were generally calculated according to the methodology of IPCC (2006). As there is a notable difference between the GHG emissions associated with production of electricity in Sweden and Denmark, the effect of these differences were included in the present assessments. The average emission assumed for the Swedish electricity mix was 22.6 g CO2eq/kWh (Ahlgren et al., 2009), while for Danish conditions an average value of 475 g CO2eq/kWh was used (Energinet.dk, 2010).
14
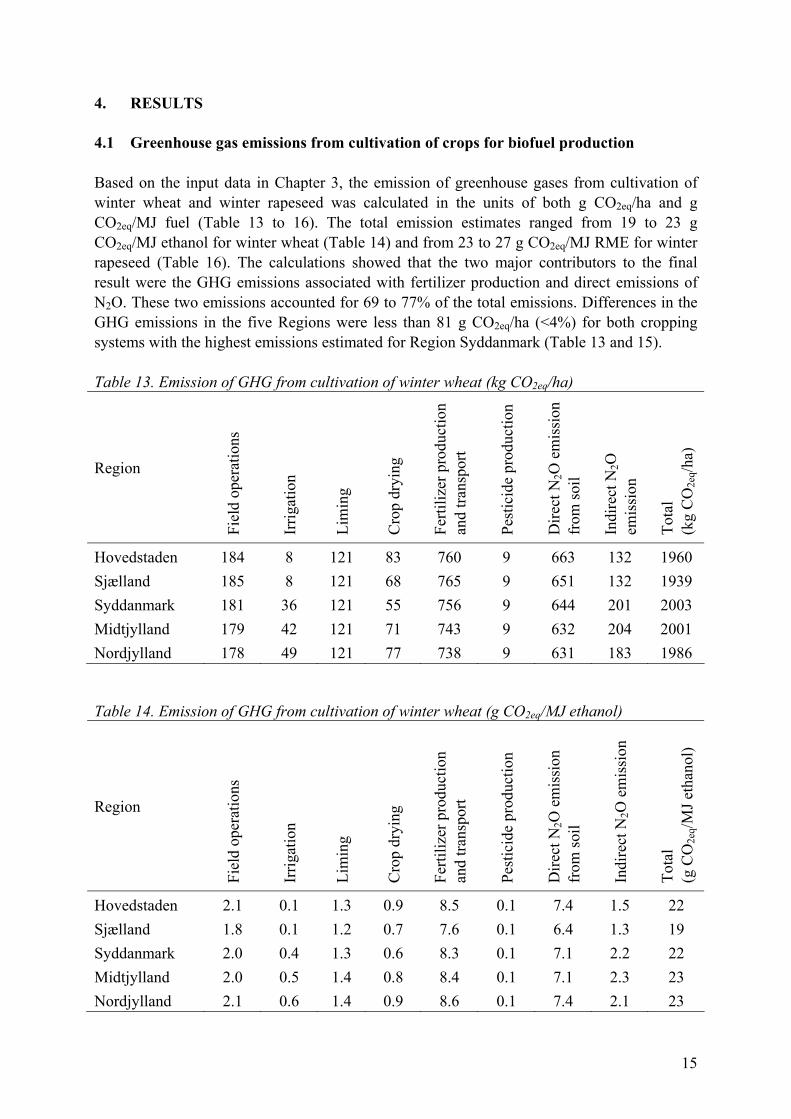
4. RESULTS 4.1 Greenhouse gas emissions from cultivation of crops for biofuel production Based on the input data in Chapter 3, the emission of greenhouse gases from cultivation of winter wheat and winter rapeseed was calculated in the units of both g CO2eq/ha and g CO2eq/MJ fuel (Table 13 to 16). The total emission estimates ranged from 19 to 23 g CO2eq/MJ ethanol for winter wheat (Table 14) and from 23 to 27 g CO2eq/MJ RME for winter rapeseed (Table 16). The calculations showed that the two major contributors to the final result were the GHG emissions associated with fertilizer production and direct emissions of N2O. These two emissions accounted for 69 to 77% of the total emissions. Differences in the GHG emissions in the five Regions were less than 81 g CO2eq/ha (<4%) for both cropping systems with the highest emissions estimated for Region Syddanmark (Table 13 and 15). Table 13. Emission of GHG from cultivation of winter wheat (kg CO2eq/ha)
Region
Fiel
d op
erat
ions
Irrig
atio
n
Lim
ing
Cro
p dr
ying
Ferti
lizer
pro
duct
ion
and
trans
port
Pest
icid
e pr
oduc
tion
Dire
ct N
2O e
mis
sion
fr
om so
il
Indi
rect
N2O
em
issi
on
Tota
l (k
g C
O2e
q/ha)
Hovedstaden 184 8 121 83 760 9 663 132 1960 Sjælland 185 8 121 68 765 9 651 132 1939 Syddanmark 181 36 121 55 756 9 644 201 2003 Midtjylland 179 42 121 71 743 9 632 204 2001 Nordjylland 178 49 121 77 738 9 631 183 1986 Table 14. Emission of GHG from cultivation of winter wheat (g CO2eq/MJ ethanol)
Region
Fiel
d op
erat
ions
Irrig
atio
n
Lim
ing
Cro
p dr
ying
Ferti
lizer
pro
duct
ion
and
trans
port
Pest
icid
e pr
oduc
tion
Dire
ct N
2O e
mis
sion
fr
om so
il
Indi
rect
N2O
em
issi
on
Tota
l (g
CO
2eq/M
J eth
anol
)
Hovedstaden 2.1 0.1 1.3 0.9 8.5 0.1 7.4 1.5 22 Sjælland 1.8 0.1 1.2 0.7 7.6 0.1 6.4 1.3 19 Syddanmark 2.0 0.4 1.3 0.6 8.3 0.1 7.1 2.2 22 Midtjylland 2.0 0.5 1.4 0.8 8.4 0.1 7.1 2.3 23 Nordjylland 2.1 0.6 1.4 0.9 8.6 0.1 7.4 2.1 23
15
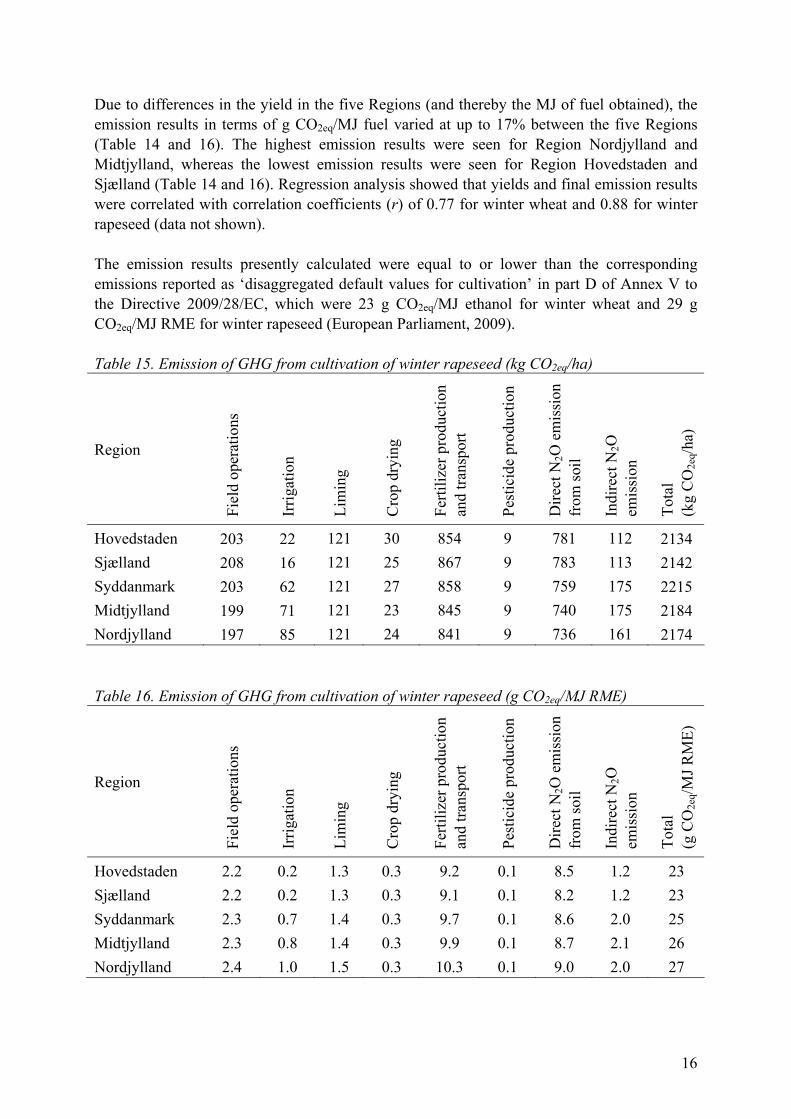
Due to differences in the yield in the five Regions (and thereby the MJ of fuel obtained), the emission results in terms of g CO2eq/MJ fuel varied at up to 17% between the five Regions (Table 14 and 16). The highest emission results were seen for Region Nordjylland and Midtjylland, whereas the lowest emission results were seen for Region Hovedstaden and Sjælland (Table 14 and 16). Regression analysis showed that yields and final emission results were correlated with correlation coefficients (r) of 0.77 for winter wheat and 0.88 for winter rapeseed (data not shown). The emission results presently calculated were equal to or lower than the corresponding emissions reported as ‘disaggregated default values for cultivation’ in part D of Annex V to the Directive 2009/28/EC, which were 23 g CO2eq/MJ ethanol for winter wheat and 29 g CO2eq/MJ RME for winter rapeseed (European Parliament, 2009). Table 15. Emission of GHG from cultivation of winter rapeseed (kg CO2eq/ha)
Region
Fiel
d op
erat
ions
Irrig
atio
n
Lim
ing
Cro
p dr
ying
Ferti
lizer
pro
duct
ion
and
trans
port
Pest
icid
e pr
oduc
tion
Dire
ct N
2O e
mis
sion
fr
om so
il
Indi
rect
N2O
em
issi
on
Tota
l (k
g C
O2e
q/ha)
Hovedstaden 203 22 121 30 854 9 781 112 2134 Sjælland 208 16 121 25 867 9 783 113 2142 Syddanmark 203 62 121 27 858 9 759 175 2215 Midtjylland 199 71 121 23 845 9 740 175 2184 Nordjylland 197 85 121 24 841 9 736 161 2174 Table 16. Emission of GHG from cultivation of winter rapeseed (g CO2eq/MJ RME)
Region
Fiel
d op
erat
ions
Irrig
atio
n
Lim
ing
Cro
p dr
ying
Ferti
lizer
pro
duct
ion
and
trans
port
Pest
icid
e pr
oduc
tion
Dire
ct N
2O e
mis
sion
fr
om so
il
Indi
rect
N2O
em
issi
on
Tota
l (g
CO
2eq/M
J RM
E)
Hovedstaden 2.2 0.2 1.3 0.3 9.2 0.1 8.5 1.2 23 Sjælland 2.2 0.2 1.3 0.3 9.1 0.1 8.2 1.2 23 Syddanmark 2.3 0.7 1.4 0.3 9.7 0.1 8.6 2.0 25 Midtjylland 2.3 0.8 1.4 0.3 9.9 0.1 8.7 2.1 26 Nordjylland 2.4 1.0 1.5 0.3 10.3 0.1 9.0 2.0 27
16

4.2 Greenhouse gas emissions from production of biogas from solid and liquid manure Table 17 presents the total emissions of greenhouse gases from production of biogas and the emissions from the corresponding amount of manure in the reference system. Table 17 also shows the net emissions, i.e., the difference between the biogas system and the reference system. In all cases biogas production reduced the emissions of GHG to the atmosphere. Thus, the present emission results for biogas were lower than the corresponding emissions reported as ‘disaggregated default values for cultivation’ in part D of Annex V to the Directive 2009/28/EC, which was 0 (zero) g CO2eq/MJ vehicle gas (European Parliament, 2009). Table 17. Emission of greenhouse gases (g CO2eq/MJ vehicle gas) from biogas production, and emissions when the corresponding amount of manure is spread directly on the fields without passing through the digestion system. Data are adapted from Ahlgren et al. (2009) for Swedish conditions and adjusted for Danish greenhouse gas emissions associated with production of electricity for use as process electricity in digestion and upgrading
Production system
Met
hane
leak
age
in
stor
age
N2O
em
issi
on in
stor
age
Met
hane
leak
age
in
upgr
adin
g
Proc
ess h
eat i
n di
gest
ion
Proc
ess e
lect
ricity
in
dige
stio
n
Proc
ess e
lect
ricity
in
upgr
adin
g
Spre
adin
g of
dig
estio
n re
sidu
es/m
anur
e
Tota
l (g
CO
2eq/M
J veh
icle
gas
)
Solid cattle manure Biogas production 0.75 1.29 0.48 0.28 4.62 6.31 0.50 14.2Reference system 4.13 24.50 0.80 29.4 Net emissions -3.38 -23.21 0.48 0.28 4.62 6.31 -0.30 -15.2Liquid cattle manure Biogas production 0.71 3.21 0.48 0.46 4.62 6.31 0.48 16.3Reference system 41.50 3.22 0.49 45.2 Net emissions -40.79 -0.01 0.48 0.46 4.62 6.31 -0.02 -28.9Liquid swine manure Biogas production 0.51 2.72 0.48 0.39 4.62 6.31 0.44 15.5Reference system 42.66 2.57 0.46 45.7 Net emissions -42.15 0.48 0.39 4.62 6.31 -0.02 -30.2
17

5. DISCUSSION AND SENSITIVITY ANALYSES The results derived for GHG emissions from cultivation of agricultural crops for biofuels and production of biogas from manure – as presented in Table 14, 16 and 17 – were calculated according to a number of assumptions and interpretations of the Directive 2009/28/EC. The assumptions and interpretations were justified as described in detail in Chapter 3, but still were associated with embedded uncertainties, that have to be considered in order to interpret the robustness of the results. Therefore, a number of sensitivity analyses were performed. 5.1 Diesel consumption in cultivation The present estimate of fuel consumption related to field operations was 53-62 L of diesel per ha. This was based on separate estimates of diesel consumption for individual cultivation operations according to DAAS (2009a). It is generally found that the diesel consumption actually experienced may be somewhat higher than the result of these calculations, and, for example, a diesel consumption of 97 L/ha was included in the calculations of Hvid (2009) for cultivation of winter wheat on a Danish JB 6 soil (including diesel consumption for slurry application). Dalgaard and Dalgaard (2006) presented examples of field operations for winter wheat and winter rapeseed resulting in diesel consumptions of 81 to 93 L/ha depending on the soil type. Using diesel consumption estimates calculated according to Dalgaard and Dalgaard (2006) would increase the final emission results in Table 14 and 16 by 4 to 6%. 5.2 Application of slurry as fertilizer The cultivation systems considered in the present calculations are based on application of mineral fertilizer to meet the plant requirement for major nutrients. Use of animal slurry may substitute a part of the mineral fertilizer and thereby have an impact on the results. Considering slurry as a waste product, the Directive 2009/28/EC specifies that it shall be considered to have zero life-cycle greenhouse gas emissions up to the process of collection. However, it is not clear if the point of collection includes or excludes the management and storage in slurry tanks prior to spreading on the field. During storage in slurry tanks a notable emission of CH4 and N2O occur which will have a large impact on the emission results. Because of these uncertainties in relation to the Directive 2009/28/EC, Ahlgren et al. (2099) chose not to present calculations based on scenarios with slurry. For the present purpose of testing the impact of slurry fertilization, tentative calculations were made based on the assumptions that (i) use of slurry was ‘free’ of emissions up to the point of collection in the storage tanks and (ii) use of slurry was associated with N2O and CH4 emissions related management and storage. To estimate the slurry emissions relative to the amount of N in the slurry the following assessment was made: Greenhouse gas emissions from handling and storage of animal manure in Denmark in 2002 was reported to 1.95 gG N2O and 47.1 gG CH4 (Mikkelsen et al., 2006), corresponding to a total of 1.66 mio. ton CO2eq. Assuming that slurry represents 83% of the total animal manure in Denmark (Petersen and Sørensen, 2008), the GHG emission from slurry was tentatively estimated to 1.38 mio. ton CO2eq. Further, the total N content of animal slurry has recently been estimated to 141.731 ton N based on data from 2005 (Petersen and Sørensen, 2008).
18
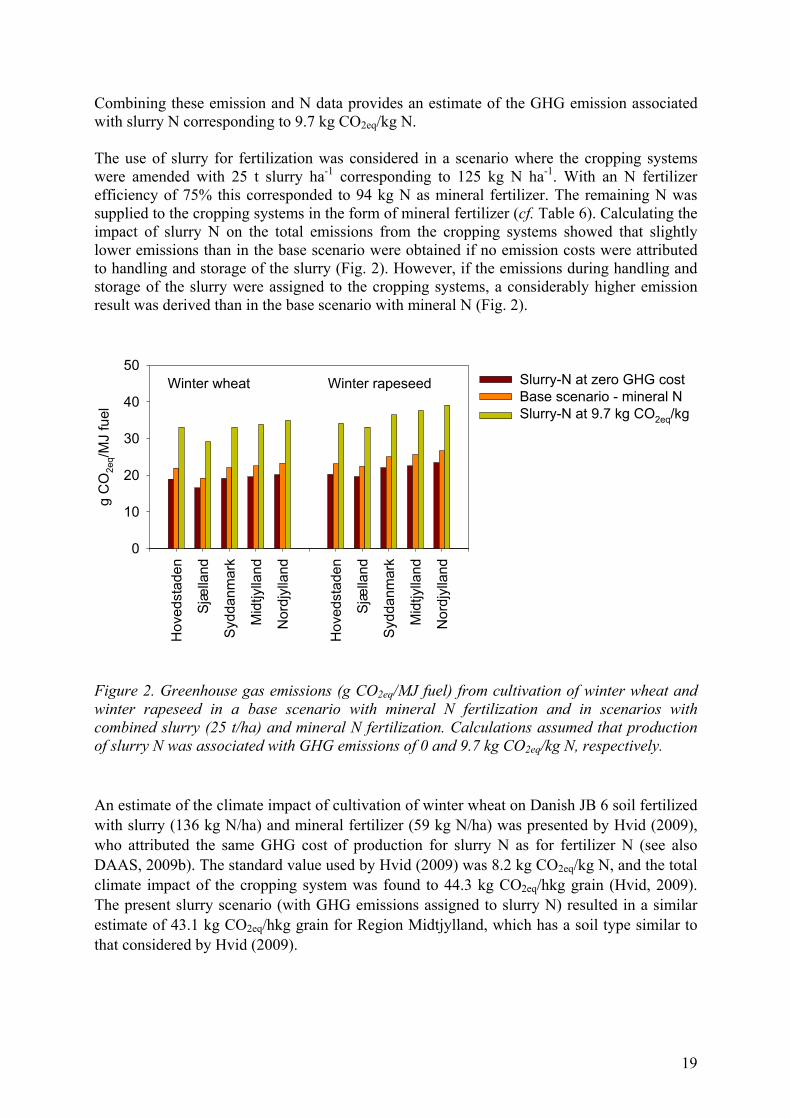
Combining these emission and N data provides an estimate of the GHG emission associated with slurry N corresponding to 9.7 kg CO2eq/kg N. The use of slurry for fertilization was considered in a scenario where the cropping systems were amended with 25 t slurry ha-1 corresponding to 125 kg N ha-1. With an N fertilizer efficiency of 75% this corresponded to 94 kg N as mineral fertilizer. The remaining N was supplied to the cropping systems in the form of mineral fertilizer (cf. Table 6). Calculating the impact of slurry N on the total emissions from the cropping systems showed that slightly lower emissions than in the base scenario were obtained if no emission costs were attributed to handling and storage of the slurry (Fig. 2). However, if the emissions during handling and storage of the slurry were assigned to the cropping systems, a considerably higher emission result was derived than in the base scenario with mineral N (Fig. 2).
Hov
edst
aden
Sjæ
lland
Syd
danm
ark
Mid
tjylla
nd
Nor
djyl
land
Hov
edst
aden
Sjæ
lland
Syd
danm
ark
Mid
tjylla
nd
Nor
djyl
land
g C
O2e
q/MJ
fuel
0
10
20
30
40
50Slurry-N at zero GHG costBase scenario - mineral NSlurry-N at 9.7 kg CO2eq/kg
Winter wheat Winter rapeseed
Figure 2. Greenhouse gas emissions (g CO2eq/MJ fuel) from cultivation of winter wheat and winter rapeseed in a base scenario with mineral N fertilization and in scenarios with combined slurry (25 t/ha) and mineral N fertilization. Calculations assumed that production of slurry N was associated with GHG emissions of 0 and 9.7 kg CO2eq/kg N, respectively. An estimate of the climate impact of cultivation of winter wheat on Danish JB 6 soil fertilized with slurry (136 kg N/ha) and mineral fertilizer (59 kg N/ha) was presented by Hvid (2009), who attributed the same GHG cost of production for slurry N as for fertilizer N (see also DAAS, 2009b). The standard value used by Hvid (2009) was 8.2 kg CO2eq/kg N, and the total climate impact of the cropping system was found to 44.3 kg CO2eq/hkg grain (Hvid, 2009). The present slurry scenario (with GHG emissions assigned to slurry N) resulted in a similar estimate of 43.1 kg CO2eq/hkg grain for Region Midtjylland, which has a soil type similar to that considered by Hvid (2009).
19
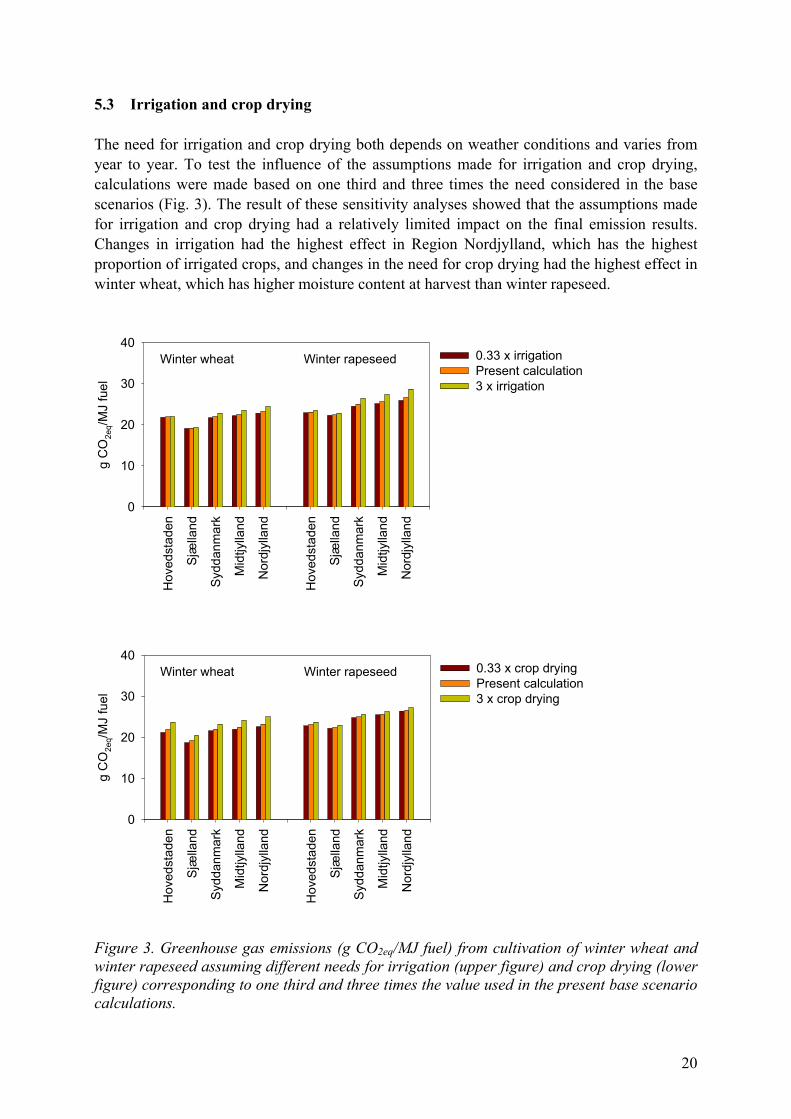
5.3 Irrigation and crop drying The need for irrigation and crop drying both depends on weather conditions and varies from year to year. To test the influence of the assumptions made for irrigation and crop drying, calculations were made based on one third and three times the need considered in the base scenarios (Fig. 3). The result of these sensitivity analyses showed that the assumptions made for irrigation and crop drying had a relatively limited impact on the final emission results. Changes in irrigation had the highest effect in Region Nordjylland, which has the highest proportion of irrigated crops, and changes in the need for crop drying had the highest effect in winter wheat, which has higher moisture content at harvest than winter rapeseed.
Hov
edst
aden
Sjæ
lland
Sydd
anm
ark
Mid
tjylla
nd
Nor
djyl
land
Hov
edst
aden
Sjæ
lland
Sydd
anm
ark
Mid
tjylla
nd
Nor
djyl
land
g C
O2e
q/MJ
fuel
0
10
20
30
400.33 x irrigationPresent calculation3 x irrigation
Winter wheat Winter rapeseed
Hov
edst
aden
Sjæ
lland
Sydd
anm
ark
Mid
tjylla
nd
Nor
djyl
land
Hov
edst
aden
Sjæ
lland
Sydd
anm
ark
Mid
tjylla
nd
Nor
djyl
land
g C
O2e
q/MJ
fuel
0
10
20
30
400.33 x crop dryingPresent calculation3 x crop drying
Winter wheat Winter rapeseed
Figure 3. Greenhouse gas emissions (g CO2eq/MJ fuel) from cultivation of winter wheat and winter rapeseed assuming different needs for irrigation (upper figure) and crop drying (lower figure) corresponding to one third and three times the value used in the present base scenario calculations.
20

5.4 Crop yields Data on crop yields from Statistics Denmark were reported on the NUTS 2 level from the years 2006-2008. In the present calculations the base scenario was calculated according to the average yields on the NUTS 2 level based on these data. However, the variation between yields in individual years influences the emission results as the yields are the basis for the MJ fuel obtained. The emission results according to the yield in individual years are shown in Fig. 4, which demonstrates the importance of the yield estimates.
Hov
edst
aden
Sjæ
lland
Syd
danm
ark
Mid
tjylla
nd
Nor
djyl
land
Hov
edst
aden
Sjæ
lland
Syd
danm
ark
Mid
tjylla
nd
Nor
djyl
land
g C
O2e
q/MJ
fuel
0
10
20
30
40200620072008
Winter wheat Winter rapeseed
Figure 4. Greenhouse gas emissions (g CO2eq/MJ fuel) from cultivation of winter wheat and winter rapeseed calculated according to crop yields in individual years (2006-2008). To qualify the yield estimates for 2010, Region Syddanmark was taken as an example and data for 1990 to 2006 (Statistics Denmark, 2010d) were recalculated from the older Counties to the new Region (Fyns Amt, Sønderjyllands Amt and Ribe Amt were merged to become Region Syddanmark)). This calculation showed a good agreement between the yield estimates based on 3 years of data from the Region (1996-1998) and the yield estimates based on 19 years of data from the Counties and Regions (Fig. 5). The effect of yields on the final emission result also reflects the potential effect of cultivation of wheat varieties dedicated for bioethanol production. Such varieties typically have low protein and high starch content, and give a higher yield relative to the amount of fertilizer N used than other wheat varieties. Ahlgren et al. (2009) showed that under Swedish conditions the use of dedicated wheat varieties for ethanol production reduced the total greenhouse gas emissions by 3 g CO2eq/MJ ethanol.
21

1990
1992
1994
1996
1998
2000
2002
2004
2006
2008
2010
2012
Yie
ld (h
kg/h
a)
0
20
40
60
80Winter wheatWinter rapeseed
Figure 5. Yields of winter wheat (open circles) and winter rapeseed (open triangles) for Region Syddanmark as re-calculated from County data (1990-2006) and as available for the Region (2006-2008). Lines represent linear regression for predicting the yield in 2010 from the 1990-2008 data. Closed symbols represent the yield estimates for 2010 used in the base scenario that were based on the data available for the Region in 2006-2008. 5.5 Fertilizer production The production of nitrogen fertilizer represents the main single contribution to the GHG emissions calculated for the two cropping systems. Therefore, the final result is sensitive to the assumptions made for the environmental load of fertilizer N production. In the present report, the approach of Ahlgren et al. (2009) was followed, and a contemporary estimate for the environmental load of fertilizer produced for the Danish market was derived which amounted to 4.3 kg CO2eq/kg N. This is considerably lower than older estimates of European average values for fertilizer production, which can be found in the literature or in databases. Hence, in the calculations presented by Hvid (2009), a standard value of 8.2 kg CO2eq/kg N was used for the environmental load of fertilizer N production and mainly therefore, a higher total emission for crop cultivation was obtained by Hvid (2009) than in the present base scenario. To test the effect of the present assumptions made for the environmental load of fertilizer N production, two scenarios were considered. One scenario was that all fertilizers could be supplied with the environmental load of less than 4 kg CO2eq/kg N as guaranteed by Yara (2010). The other scenario was that the European average emission estimate of 6.8 kg CO2eq/kg N applied for all fertilizer N supplied (considered by Ahlgren et al. (2009) to represent a present ‘worst case’ scenario). The changes in the emission results associated with these two scenarios are shown in Fig. 6, which demonstrates the importance of the technological improvements for reducing N2O emissions during fertilizer production in Europe.
22

Hov
edst
aden
Sjæ
lland
Syd
danm
ark
Mid
tjylla
nd
Nor
djyl
land
Hov
edst
aden
Sjæ
lland
Syd
danm
ark
Mid
tjylla
nd
Nor
djyl
land
g C
O2e
q/MJ
fuel
0
10
20
30
40Yara 2010 Present calculationEuropean average
Winter wheat Winter rapeseed
Figure 6. Greenhouse gas emissions (g CO2eq/MJ fuel) from cultivation of winter wheat and winter rapeseed with synthetic fertilizer N assumed to have environmental loads of 4 kg CO2eq/kg N (Yara 2010), 4.3 kg CO2eq/kg N (present calculations) and 6.8 kg CO2eq/kg N (European average). 5.6 Emission of nitrous oxide from soil The emission of N2O from application of N-fertilizer to the soil was calculated as the direct and the indirect contributions according to the IPCC (2006) guidelines. This comprises the use of standard emission factors which by the IPCC (2006) are presented as default values with associated uncertainty ranges (Table 17). The relatively large ranges reflect the uncertainty of predicting the N2O emissions, which are the result of dynamic and heterogeneous microbial soil processes. The emission factors presently suggested by IPCC (2006) have been found to be more appropriate than the emission factors previously proposed (IPCC, 1997; Mosier et al., 1999). However, Danish national GHG inventories are still required to be estimated by use of the IPCC (1997) emission factors (Table 17). Table 17. Emission factors (EF) for calculation of nitrous oxide emissions including the uncertainty ranges (IPCC, 1997; 2006)
IPCC (2006) IPCC (1997) Emission factor (EF) Default
value Uncertainty
range Default value
Uncertainty range
EF for added nitrogen (kg N2O-N/kg N) 0.01 0.003 - 0.030 0.0125 0.0025 - 0.0225
EF for leaked nitrogen (kg N2O-N/kg N 0.0075 0.0005 - 0.025 0.025 0.002 – 0.12
EF for volatilization and re- deposition (kg N2O-N/kg NH3-N) 0.01 0.002 - 0.050 0.01 0.002 – 0.02
23

The effects of calculation of N2O emission according to the IPCC (1997) and the IPCC (2006) emission factors are shown in Fig. 7. The final emission results are on average decreased by 21% when calculated according to the emission factors from 2006. Including the uncertainty ranges for the emission factors in the calculations show that the final results can be significantly higher or lower than estimated from the default values (Fig. 8). Thus, the result for winter wheat in, e.g., Region Midtjylland will vary between 14 and 47 g CO2eq/MJ ethanol according to the IPCC (2006) uncertainty range for N2O emissions from soils (Fig. 8).
Hov
edst
aden
Sjæ
lland
Sydd
anm
ark
Mid
tjylla
nd
Nor
djyl
land
Hov
edst
aden
Sjæ
lland
Sydd
anm
ark
Mid
tjylla
nd
Nor
djyl
land
g C
O2e
q/MJ
fuel
0
10
20
30
40IPCC 2006 IPCC 1997
Winter wheat Winter rapeseed
Figure 7. Greenhouse gas emissions (g CO2eq/MJ fuel) from cultivation of winter wheat and winter rapeseed with synthetic fertilizer N according to N2O emission factors from IPCC (2006) and IPCC (1997).
Hov
edst
aden
Sjæ
lland
Sydd
anm
ark
Mid
tjylla
nd
Nor
djyl
land
Hov
edst
aden
Sjæ
lland
Sydd
anm
ark
Mid
tjylla
nd
Nor
djyl
land
g C
O2e
q/MJ
fuel
0
10
20
30
40
50
60
70IPCC 2006 Winter wheat Winter rapeseed
Figure 8. Greenhouse gas emissions (g CO2eq/MJ fuel) from cultivation of winter wheat and winter rapeseed with synthetic fertilizer N according to N2O emission factors and uncertainty estimates from IPCC (2006). Grey bars show the results for the default emission factors; lines indicate the ranges derived from the uncertainty range for the emission factors.
24
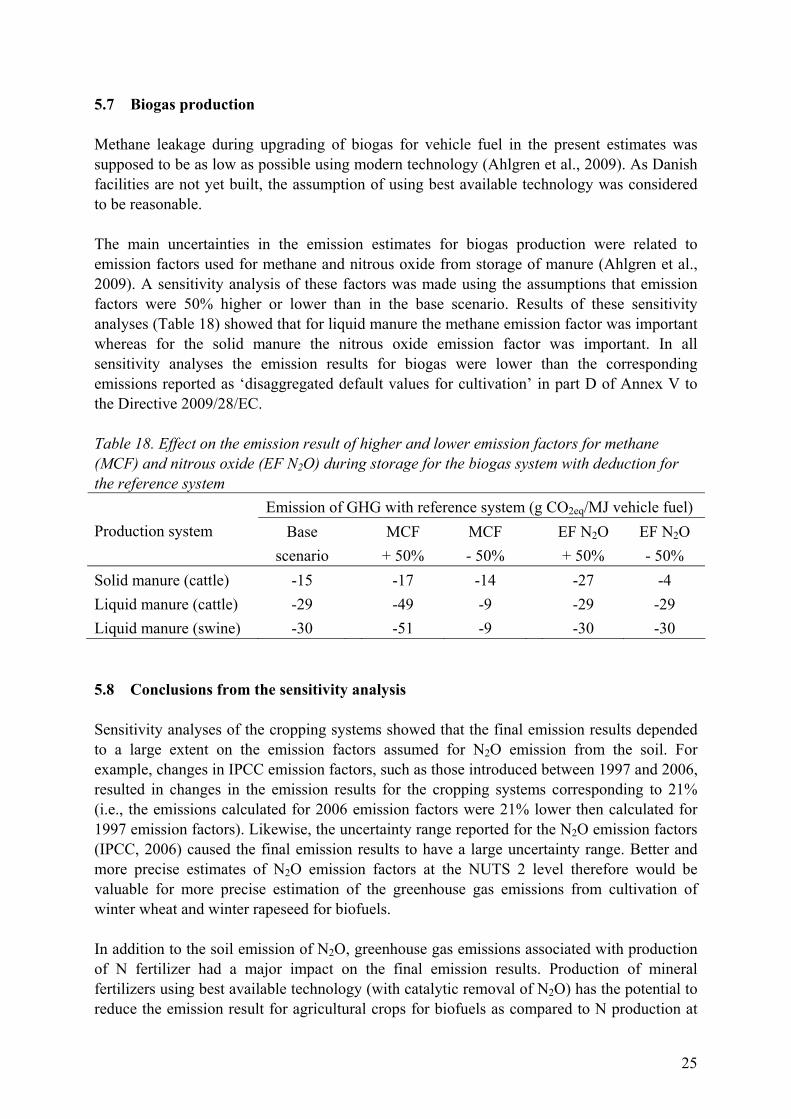
5.7 Biogas production Methane leakage during upgrading of biogas for vehicle fuel in the present estimates was supposed to be as low as possible using modern technology (Ahlgren et al., 2009). As Danish facilities are not yet built, the assumption of using best available technology was considered to be reasonable. The main uncertainties in the emission estimates for biogas production were related to emission factors used for methane and nitrous oxide from storage of manure (Ahlgren et al., 2009). A sensitivity analysis of these factors was made using the assumptions that emission factors were 50% higher or lower than in the base scenario. Results of these sensitivity analyses (Table 18) showed that for liquid manure the methane emission factor was important whereas for the solid manure the nitrous oxide emission factor was important. In all sensitivity analyses the emission results for biogas were lower than the corresponding emissions reported as ‘disaggregated default values for cultivation’ in part D of Annex V to the Directive 2009/28/EC. Table 18. Effect on the emission result of higher and lower emission factors for methane (MCF) and nitrous oxide (EF N2O) during storage for the biogas system with deduction for the reference system
Emission of GHG with reference system (g CO2eq/MJ vehicle fuel) Production system Base
scenario MCF
+ 50% MCF - 50%
EF N2O + 50%
EF N2O - 50%
Solid manure (cattle) -15 -17 -14 -27 -4 Liquid manure (cattle) -29 -49 -9 -29 -29 Liquid manure (swine) -30 -51 -9 -30 -30 5.8 Conclusions from the sensitivity analysis Sensitivity analyses of the cropping systems showed that the final emission results depended to a large extent on the emission factors assumed for N2O emission from the soil. For example, changes in IPCC emission factors, such as those introduced between 1997 and 2006, resulted in changes in the emission results for the cropping systems corresponding to 21% (i.e., the emissions calculated for 2006 emission factors were 21% lower then calculated for 1997 emission factors). Likewise, the uncertainty range reported for the N2O emission factors (IPCC, 2006) caused the final emission results to have a large uncertainty range. Better and more precise estimates of N2O emission factors at the NUTS 2 level therefore would be valuable for more precise estimation of the greenhouse gas emissions from cultivation of winter wheat and winter rapeseed for biofuels. In addition to the soil emission of N2O, greenhouse gas emissions associated with production of N fertilizer had a major impact on the final emission results. Production of mineral fertilizers using best available technology (with catalytic removal of N2O) has the potential to reduce the emission result for agricultural crops for biofuels as compared to N production at
25

older European facilities. Use of animal slurry as a source of N fertilizer changes the emission result depending on the assumptions made for allocation of the GHG emission from handling and storage of the slurry prior to spreading at the fields. Crop yields determine the amount of biofuel obtained per ha in the agricultural cropping systems. Therefore the final emission results will vary according to the crop yields and the N input required to obtain these yields. Use of, e.g., dedicated wheat varieties for ethanol production thus has a potential to lower the final emission results for biofuel production. For biogas production from manure the main uncertainties in the emission estimates for biogas production were related to emission factors used for methane and nitrous oxide from storage of manure. 6. ACKNOWLEDGEMENTS Data on distribution of cropping areas and irrigation on different soil types were provided by Inge T. Kristensen (AU) and data on N leaching in the Danish regions were provided by Christen D. Børgesen (AU). During the work several helpful discussions took place with a number of colleagues including Mogens Nielsen (Yara Denmark), Lars Johansen (DLG), Erik F. Kristensen (AU), Henrik B. Møller (AU), Finn P. Vinther (AU), Jens J. Høy (AgroTech); Søren K. Hvid (DAAS), Per Ambus (DTU), Steen Gyldenkærne (AU), Mette Hjorth Mikkelsen (AU), Tommy Dalgaard (AU), Thu Lan Thi Nguyen (AU), Kent Gordon (Emmelev A/S), Serina Ahlgren (SLU), Helene Lundkvist (SLU), and Merete Iisager (Statistics Denmark). The report was improved after discussions with Jørgen E. Olesen (AU) and John E. Hermansen (AU). These and other colleagues are thanked for their help.
26
7. REFRENCES Ahlgren, S., Hansson, P.A., Kimming, M., Aronsson, P., Lundkvist, H., 2009. Greenhouse gas emissions from cultivation of agricultural crops for biofuels and production of biogas from manure. Report from Swedish University of Agricultural Sciences (SLU), Dnr SLU ua 12-4067/08, Revised version 2009-09-08, 52 pp. Bernesson, S., Nilsson, D., Hansson, P.A., 2004. A limited LCA comparing large- and small-scale production of rape methyl ester (RME) under Swedish conditions. Biomass and Bioenergy 26, 545-559. Bernesson, S., Nilsson, D., Hansson, P.A., 2006. A limited LCA comparing large- and small-scale production of ethanol for heavy engines under Swedish conditions. Biomass and Bioenergy 30, 46-57. Bouwman, A.F., 1996. Direct emission of nitrous oxide from agricultural soils. Nutrient Cycling in Agroecosystems 46, 53-70. Cherubini, F., 2010. GHG balances of bioenergy systems – overview of key steps in the production chain and methodological concerns. Renewable Energy 35, 1565–1573. DAAS, 2008a (Danish Agricultural Advisory Service). Vinterhvede – dyrkningsvejleding. http://app4.landscentret.dk/DyrkVejl/Forms/Main.aspx?page=Vejledning&cropID=12 (visited April 2010). DAAS, 2008b (Danish Agricultural Advisory Service). Vinterraps – dyrkningsvejleding. http://app4.landscentret.dk/DyrkVejl/Forms/Main.aspx?page=Vejledning&cropID=13 (visited April 2010). DAAS, 2009a (Danish Agricultural Advisory Service). Budgetkalkuler 2009-2010. www.landbrugsinfo.dk/Diverse/KA/Filer/Budgetkalkuler_2010_salg.pdf (visited April 2010). DAAS, 2009b (Danish Agricultural Advisory Service). Datablad – klimapåvirkning ved dyrkning af vinterhvede. www.landbrugsinfo.dk/Planteavl/Afgroeder/Korn/Vinterhvede/Filer/pl_09_033_datablad.pdf (visited May 2010). Dalgaard, T., Halberg, N., Jørgensen, M.H., 2004. Status for energiinput og –output i økologisk jordbrug samt muligheder for energibesparelser. In: Jørgensen, U., Dalgaard, T. (eds.) Energi i økologisk jordbrug – reduktion af fossilt energiforbrug og produktion af vedvarende energi, pp. 25-45. Forskningscenter for Økologisk Jordbrug. Dalgaard, T., Dalgaard, R., 2006. Model til beregning af fossilt energiforbrug i jordbrugssystemer med og uden mekanisk ukrudtsbekæmpelse. In: Odderskær, P., Topping, C., Petersen, M.B., Rasmussen, J., Dalgaard, T., Erlandsen, M. (2006) Ukrudtsstriglingens
27

effekter på dyr, planter og ressourceforbrug, bilag D, pp. 115-127. Miljøministeriet, Bekæmpelsesmiddelforskning fra Miljøstyrelsen, Nr. 105. Energinet.dk, 2010. Miljødeklarationer for el. www.energinet.dk/da/menu/Klima+og+milj%c3%b8/Milj%c3%b8deklarationer+for+el/Milj%c3%b8deklarationer+for+el.htm (visited May 2010) European Parliament, 2009. Directive 2009/28/EC of the European Parliament and of the Council of 23 April 2009 on the promotion of the use of energy from renewable sources and amending and subsequently repealing Directives 2001/77/EC and 2003/30/EC. http://eur-lex.europa.eu/LexUriServ/LexUriServ.do?uri=OJ:L:2009:140:0016:0062:EN:PDF (visited April-May 2010). Flechard, C., Ambus, P., Skiba. U., Rees, R.M., Hensen, A., Van den Pol, A., Soussana, J.F., Jones M, Clifton-Brwon J, Raschi A, Horvath L, Van Amstel A, Neftel A, Jocher M, Ammann C, Fuhrer J, Calanca P, Thalman E, Pilegaard K, Di Marco C, Campbell C, Nemitz E, Hargreaves KJ, Levy P, Ball B, Jones S, Van de Bulk WCM, Groot T, Blom M, Gunnink H, Kasper G, Allard V, Cellier P, Laville P, Henault C, Bizouard F, Jolivot D, Abdalla M, Williams M, Baronti S, Berretti F, Grosz B, Dominques R., 2007. Effects of climate and management intensity on nitrous oxide emissions in grassland systems across Europe. Agriculture, Ecosystems and Environment 121, 135–152. Granli, T., Bøckman, O.C., 1994. Nitous oxide from agriculture. Norwegial Journal of Agricultural Sciences, Supplement No. 12, 7-128. Hvid, S.K., 2009. Klimapåvirkning ved dyrkning – vinterhvede som eksempel. Note from Danish Agricultural Advisory Service. www.landbrugsinfo.dk/Planteavl/Afgroeder/Korn/Vinterhvede/Sider/pl_09_033.aspx (visited May 2010). IPCC, 1997. Intergovernmental Panel on Climate Change Guidelines for National Greenhouse Gas Inventories. Chap. 4. Agriculture: nitrous oxide from agricultural soils and manure management. IPCC, 2006. IPCC Guidelines for National Greenhouse Gas Inventory. Volume 4 Agriculture, Forestry and Other Land Use. Jenssen, T.K., 2010. Beregning af gødningsproduktionens carbon footprint. Note from YARA Health, Environment, Safety & Quality. www.yara.dk/doc/302912010_Carbon_Footprint_of_AN_Calculation_Method_final.pdf Jenssen, T.K., Kongshaug, G., 2003. Energy Consumption and Greenhouse Gas Emissions in Fertiliser Production. The International Fertiliser Society, York, UK, Proceedings No. 509. Jonsson, N. 2006. Uppdatering av gårdens spannmålstork. Ett projekt utfört på uppdrag av SLA. JTI – Institutet för jordbruks- och miljöteknik.
28

http://www.sla-arbetsgivarna.org/MediaBinaryLoader.axd?MediaArchive_FileID=191f7bc9-f272-4688-95cb-362e3fa5d4ad&MediaArchive_ForceDownload=True (visited May 2010) Kristensen., E.F., 2010. Tørring og lagring af korn og frøafgrøder. DJF rapport, Markbrug nr. 145. Det Jordbrugsvidenskabelige Fakultet, Aarhus Universitet. Kristensen, E.F., Gundtoft, S., 2004. Energy savings achieved by optimised management of on-floor grain drying plants. In: AgEng 2004, Leuven, Belgium. Book of Abstracts, ISBN 90-76019-258. Paper on CD 174, 8 pp. LowCVP, 2004. Well-to-Wheel Evaluation for Production of Ethanol from Wheat. A Report by the LowCVP Fuels Working Group, WTW Sub-Group. FWG-P-04-024. Mikkelsen, M.H., Gyldenkærne, S., Poulsen, H.D. Olesen, J.E., Sommer, S.G., 2006. Emission of ammonia, nitrous oxide and methane from Danish Agriculture 1985-2002. Methodology and Estimates, 90 pp. National Environmental Research Institute, Ministry of the Environment, Denmark. http://www2.dmu.dk/Pub/AR231.pdf (visited May 2010). Ministry of Food, Agriculture and Fisheries, 2009. Vejledning om Gødsknings- og Harmoniregler. Mogensen, V.O, Jensen, C.R. 2002. Markafgrøder, klima og vandforsyning.DSR-forlag, Den Kgl. Veterinær- og Landbohøjskole. Mosier, A., Kroeze, C., Nevison, C., Oenema, O., Seitzinger, S., van Cleemput O. 1999. An overview of the revised 1996 IPCC guidelines for national greenhouse gas inventory methodology for nitrous oxide from agriculture. Environmental Science & Policy 2: 325-333. Nielsen, P.H., Nielsen, A.M., Weidema, B.P., Dalgaard, R., Halberg, N., 2003. LCA Food Data Base. www.lcafood.dk. Olesen, J.E., Weiske, A., Asman, W.A., Weisbjerg, M.R., Djurhuus, J., Schelde, K. 2004. FarmGHG. A model for estimating greenhouse gas emissions from livestock farms. Documentation. Danish Institute of Agricultural Sciences. Petersen, J., Sørensen, P. (2008). Gødningsvirkning af kvælstof i husdyrgødning – Grundlag for fastlæggelse af substitutionskrav. DJF markbrug nr. 138, Det Jordbrugsvidenskabelige Fakultet, Aarhus Universitet. Sahrawat, K.L., Keeney, D.R., 1986. Nitrous oxide emission from soils. Advances in Soil Sciences 4, 103–148. Statistics Denmark, 2010a. HST77: Harvest by Region, Crop and Unit (2006-2008). www.statistikbanken.dk (visited May 2010).
29

Statistics Denmark 2010b. PEST1: Salget af pesticider til anvendelse i landbrugets planteavl samt behandlingshyppighed efter pesticidgruppe og måleenhed. www.statistikbanken.dk (visited May 2010). Statistics Denmark, 2010c. HALM1: Straw yield and use by region, crop, unit and use. www.statistikbanken.dk (visited May 2010). Statistics Denmark, 2010d. HST7: Høstresultat efter område, afgrøde og enhed (afsluttet). www.statistikbanken.dk (visited May 2010). Swedish Environmental Protection Agency, 2007. Sweden’s National Inventory Report 2008. Submitted under the United Nations Framework Convention on Climate Change. www.naturvardsverket.se/upload/02_tillstandet_i_miljon/utsl%C3%A4ppsdata/vaxthusgaser/2007/nir_klimatrapportering_2008.pdf (visited May 2010). Vinther, F.P., Hansen, S., 2004. SimDen – en simple model til kvantificering af N2O emission og denitrifikation. DJF Rapport, Markbrug nr. 104. Danmarks JordbrugsForskning. Wood, S., Cowie, A., 2004. A review of greenhouse gas emission factors for fertiliser production, IEA bioenergy task 38. www.ieabioenergy-task38.org/publications/GHG_ Emission_Fertilizer%20Production_July2004.pdf (visited May 2010). Yara, 2010. Yara indfører carbon footprint garanti. Press release, Yara Denmark, May 2010. www.yara.dk/doc/30303Pressemedelelse%20Final.pdf (visited May 2010).
30