greencape broadcap fund
TRANSCRIPT

Greencape Broadcap Fund
Quarterly report - December 2020
Performance # Quarter %
1 year %
3 years % p.a.
5 years % p.a.
10 years % p.a.
Inception % p.a.
Fund return 11.96 9.41 9.67 11.29 10.21 9.84
Growth return 7.94 5.21 3.53 4.98 3.26 3.59
Distribution return 4.03 4.21 6.14 6.31 6.95 6.24
S&P/ASX 300 Accumulation Index 13.79 1.73 6.86 8.84 7.75 6.30
Active return^ -1.83 7.68 2.81 2.46 2.46 3.54
Past performance is not a reliable indicator of future performance. # Performance figures are calculated after fees have been deducted and assume distributions have been reinvested. No allowance is made for tax when calculating these figures. ^ Numbers may not add due to rounding
Investment objective
The Fund aims to outperform its benchmark over rolling three-year periods.
Responsible entity
Fidante Partners Limited
Investment manager
Greencape Capital Pty Ltd
Investment strategy
Greencape is an active, 'bottom-up' stock picker. Whilst Greencape does not target any specific investment style and will invest in stocks displaying 'value' and 'growth' characteristics, its focus on a company's qualitative attributes will generally lead to 'growth' oriented portfolios. This is an outcome of its bottom-up process. As such, Greencape's investment style may be classified as 'growth at a reasonable price'.
Distribution frequency
Quarterly
Suggested minimum investment timeframe
At least five years
Growth of $10,000 invested since inception (net of fees)
Asset allocation Actual % Range %
Security 95.78 85-100
Cash 4.22 0-15 Fund facts
Inception date 11 September 2006
APIR code HOW0034AU Fees
Entry fee Nil
2019-2020 ICR 1.89%
Management fee 0.95% p.a.
Performance fee 15% of the Fund's daily return (after fees and expenses and after adding back any distributions paid) above the Fund's
Performance Benchmark (the daily return of S&P/ASX 300 Accumulation Index).
Buy/sell spread +0.20% / -0.20% Data Source: Fidante Partners Limited, 31 December 2020.
$5,000
$7,000
$9,000
$11,000
$13,000
$15,000
$17,000
$19,000
$21,000
$23,000
$25,000
$27,000
$29,000
$31,000
$33,000
$35,000
$37,000
$39,000
Greencape BroadcapFund
S&P/ASX 300Accumulation Index

Greencape Broadcap Fund - December 2020 - continued
Sector exposure as at 31 December 2020
Data Source: Fidante Partners Limited, 31 December 2020.
Fund performance summary
The S&P/ASX 300 Accumulation Index returned +13.79% for the quarter. The fund underperformed the market and delivered a +11.96% return over the quarter.
0
10
20
30
Cash
Com
munic
atio
nS
erv
ices
Consum
er
Dis
cre
tio
nary
Consum
er
Sta
ple
s
En
erg
y
Fin
ancia
lsE
x P
ropert
y
Health C
are
Industr
ials
Info
rma
tio
nT
echnolo
gy
Mate
rials
Pro
pert
yT
rusts
Utilit
ies
Greencape Broadcap Fund (%) S&P/ASX 300 Accumulation Index (%)
Commentary - continued
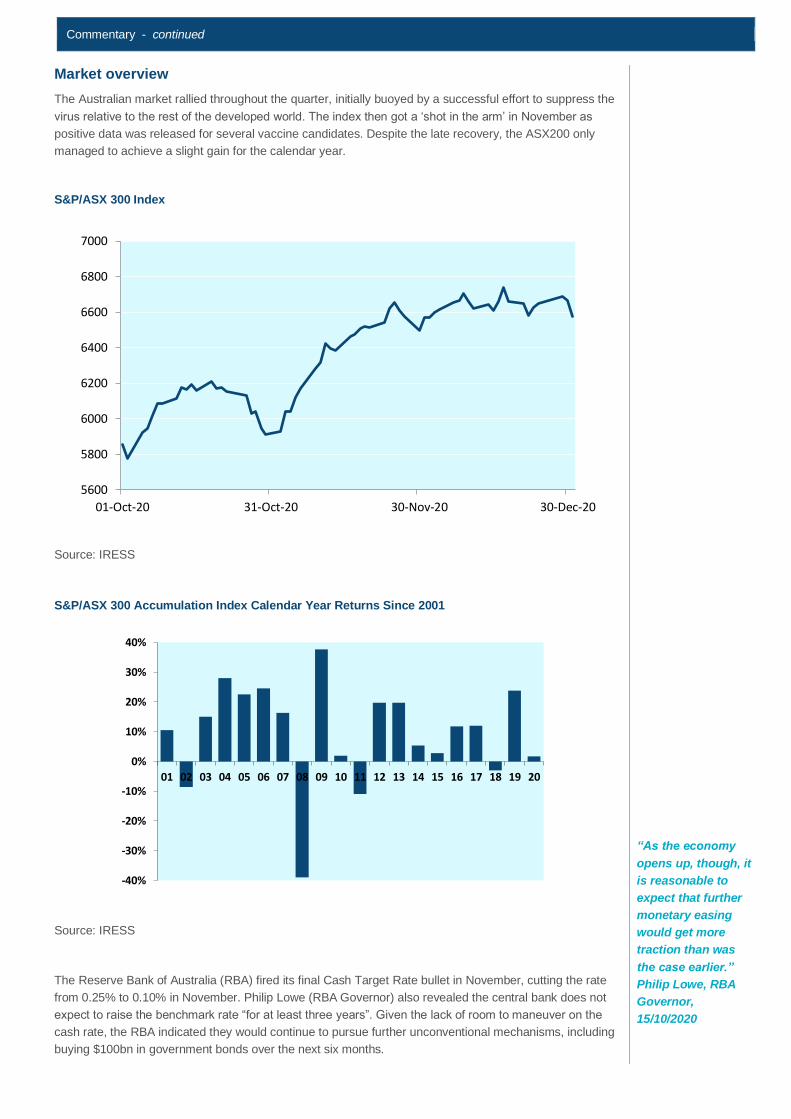
Market overview
The Australian market rallied throughout the quarter, initially buoyed by a successful effort to suppress the
virus relative to the rest of the developed world. The index then got a ‘shot in the arm’ in November as
positive data was released for several vaccine candidates. Despite the late recovery, the ASX200 only
managed to achieve a slight gain for the calendar year.
S&P/ASX 300 Index
Source: IRESS
S&P/ASX 300 Accumulation Index Calendar Year Returns Since 2001
Source: IRESS
The Reserve Bank of Australia (RBA) fired its final Cash Target Rate bullet in November, cutting the rate
from 0.25% to 0.10% in November. Philip Lowe (RBA Governor) also revealed the central bank does not
expect to raise the benchmark rate “for at least three years”. Given the lack of room to maneuver on the
cash rate, the RBA indicated they would continue to pursue further unconventional mechanisms, including
buying $100bn in government bonds over the next six months.
“As the economy
opens up, though, it
is reasonable to
expect that further
monetary easing
would get more
traction than was
the case earlier.”
Philip Lowe, RBA
Governor,
15/10/2020
5600
5800
6000
6200
6400
6600
6800
7000
01-Oct-20 31-Oct-20 30-Nov-20 30-Dec-20
-40%
-30%
-20%
-10%
0%
10%
20%
30%
40%
01 02 03 04 05 06 07 08 09 10 11 12 13 14 15 16 17 18 19 20

Commentary - continued
Incredibly, the average G10 central policy rate went negative in December. This suggests that monetary
policy will continue to be more unconventional going forward, and fiscal policy will be likely be forced to
carry more of the stimulus burden.
Source: Bloomberg
Elsewhere, much of the focus was on the US Election which ran in November. As has become custom, the
result was much closer than the polls suggested in the lead up to the vote. The likely outcome in the
aftermath of the election, whereby Biden takes the White House but the Republicans retain control of the
senate, was viewed as a ‘goldilocks’ outcome for global markets. Under this scenario, Biden likely didn’t
have a path to implementing his administration’s proposed tax reform, however he was still in theory able
to implement immediate stimulus. This scenario was forced to be reconsidered post period end following
the Senate run-off elections which were both won by the Democrats.
The market reaction to the election was relatively muted compared to the announcement a week later that
the Pfizer vaccine was indicated to be over 90% effective in preventing COVID-19. Value and Cyclical
stocks which had been hit by the pandemic rallied strongly, whilst COVID-19 ‘winners’ were sold off
harshly.
This saw investors trade out of sectors such as Technology and E-Commerce into Travel and Energy, the
latter whose recovery profile became a lot more visible due to the encouraging vaccine data.
Source: Goldman Sachs
“They’ll spread
these vaccines over
the world so fast,
it’ll make your head
spin.” Charlie
Munger, Vice
Chairman of
Berkshire
Hathaway,
15/12/2020

Commentary - continued
Following the release of the Pfizer data, the Equal Weight S&P 500 Index had its largest outperformance
day on record relative to the (market weight) S&P 500.
Source: Bloomberg
The outperformance of Value over Momentum was also historic.
Source: Twitter @wjruss84
Commentary - continued
The local experience was in tune with offshore, with the Energy sector topping the performance table for
the quarter. However, despite the sector’s remarkable rally in Q4, it was still by far the worst returning
sector for the calendar year. Financial stocks (namely the banks) also benefitted from the flight to ‘Value’.
QUARTER YEAR
ASX300 Accumulation Index 13.8% 1.7%
Best Performing Sectors
Energy 26.1% -27.4%
Fin Ex-Property Trust 22.8% -5.9%
Information Technology 22.8% 52.4%
Worst Performing Sectors
Utilities -5.4% -15.7%
Healthcare -1.0% 4.3%
Industrials 5.7% -12.2%
Source: IRESS
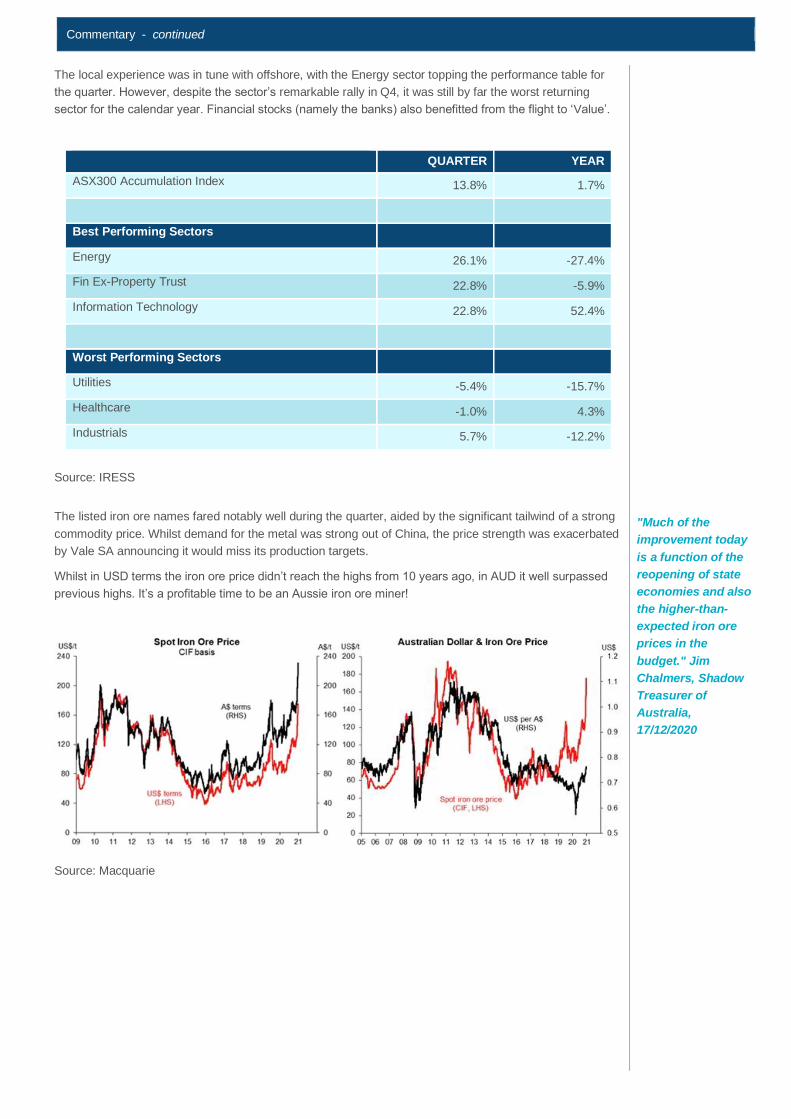
The listed iron ore names fared notably well during the quarter, aided by the significant tailwind of a strong
commodity price. Whilst demand for the metal was strong out of China, the price strength was exacerbated
by Vale SA announcing it would miss its production targets.
Whilst in USD terms the iron ore price didn’t reach the highs from 10 years ago, in AUD it well surpassed
previous highs. It’s a profitable time to be an Aussie iron ore miner!
Source: Macquarie
"Much of the
improvement today
is a function of the
reopening of state
economies and also
the higher-than-
expected iron ore
prices in the
budget." Jim
Chalmers, Shadow
Treasurer of
Australia,
17/12/2020

Commentary - continued
REA Group
We last talked about REA in our December 2018 report, when the stock was trading around $72. Quite a
bit has happened since then notwithstanding the share price trading close to $150. This share price
performance has been driven by both earnings’ growth and a substantial re-rating in the business by the
market.
Our original thesis was that increasing ‘depth’ penetration of ‘Premiere’ property listings would continue to
provide strong revenue growth. We were also expecting annual price rises given the franchise has strong
pricing power due to the its position in the market and specifically, the relationship and reliance on REA by
agents and vendors alike. Understanding the impact that ‘vendor paid advertising’ has in key depth
markets was important in gaining conviction around these price increases. By and large, this has been
playing out as expected and importantly from here, we continue to think that ‘depth’ as well price increases
can continue to play a material role in driving group revenues higher.
Source: Company reports
Commentary - continued
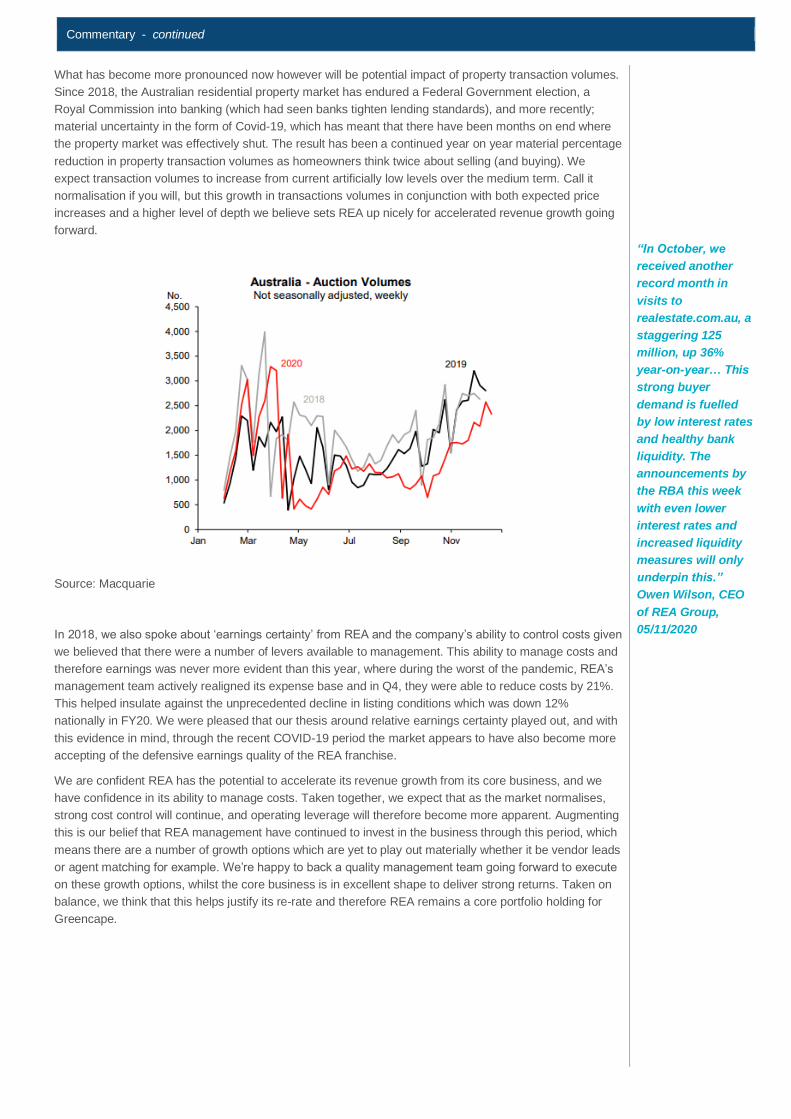
What has become more pronounced now however will be potential impact of property transaction volumes.
Since 2018, the Australian residential property market has endured a Federal Government election, a
Royal Commission into banking (which had seen banks tighten lending standards), and more recently;
material uncertainty in the form of Covid-19, which has meant that there have been months on end where
the property market was effectively shut. The result has been a continued year on year material percentage
reduction in property transaction volumes as homeowners think twice about selling (and buying). We
expect transaction volumes to increase from current artificially low levels over the medium term. Call it
normalisation if you will, but this growth in transactions volumes in conjunction with both expected price
increases and a higher level of depth we believe sets REA up nicely for accelerated revenue growth going
forward.
Source: Macquarie
In 2018, we also spoke about ‘earnings certainty’ from REA and the company’s ability to control costs given
we believed that there were a number of levers available to management. This ability to manage costs and
therefore earnings was never more evident than this year, where during the worst of the pandemic, REA’s
management team actively realigned its expense base and in Q4, they were able to reduce costs by 21%.
This helped insulate against the unprecedented decline in listing conditions which was down 12%
nationally in FY20. We were pleased that our thesis around relative earnings certainty played out, and with
this evidence in mind, through the recent COVID-19 period the market appears to have also become more
accepting of the defensive earnings quality of the REA franchise.
We are confident REA has the potential to accelerate its revenue growth from its core business, and we
have confidence in its ability to manage costs. Taken together, we expect that as the market normalises,
strong cost control will continue, and operating leverage will therefore become more apparent. Augmenting
this is our belief that REA management have continued to invest in the business through this period, which
means there are a number of growth options which are yet to play out materially whether it be vendor leads
or agent matching for example. We’re happy to back a quality management team going forward to execute
on these growth options, whilst the core business is in excellent shape to deliver strong returns. Taken on
balance, we think that this helps justify its re-rate and therefore REA remains a core portfolio holding for
Greencape.
“In October, we
received another
record month in
visits to
realestate.com.au, a
staggering 125
million, up 36%
year-on-year… This
strong buyer
demand is fuelled
by low interest rates
and healthy bank
liquidity. The
announcements by
the RBA this week
with even lower
interest rates and
increased liquidity
measures will only
underpin this.”
Owen Wilson, CEO
of REA Group,
05/11/2020

Commentary - continued
Outlook
Optimism remains evident in the equities market fuelled by supportive high frequency economic data,
expedited vaccine roll out expectations, reduced geopolitical uncertainty (post Trump) and further fiscal
stimulus. This is in addition to persistently low interest rates and lack of attractive investment alternatives.
Mitigants to the upside from here include already embedded optimism in asset prices, Democrat Senate
control (higher US corporate taxes & inflationary expectations) and rising energy prices.
Rotation from Growth to Value names has been evident, although the biggest influence on index returns
has been strength in major bank stocks given the large weight they carry, as well as resources names on
the back of strong commodity prices and weak USD. This has helped the index claw back some
underperformance relative to other global indices, however we still remain some distance away from our
previous highs.
The market’s focus now shifts firmly to the forthcoming February results season. We expect vague
guidance statements as input prices, FX and patchy consumer demand (with various COVID driven
shutdowns) act to make forecasting more difficult. We observe that many companies are turning to their
dividends as a key confidence signalling tool, and for others, potential acquisitions. Given the wide range of
potential outcomes, capital allocation decision making by management and boards is all the more critical.
Greencape’s focus on Shareholder Stewardship remains key to our stock picking, as are our Market
Milestone assessments. We remain confident that the combination of cheap money plus effective
management will deliver attractive long term returns.
“If you buy
something with a
10% free cash flow
yield and hold it for
3 years,
management is
going to be
responsible for
allocating a third of
the value of the
company over that
time. You have to
really care about
that.” Adam Weiss,
Founder of Scout
Capital

Greencape Broadcap Fund - December 2020 - continued
Morningstar Awards 2018 (c). Morningstar Inc. All Rights Reserved. Awarded to Greencape Capital for Australian Fund Manager of the Year Domestic Equities – Large Caps Category, Australia.
The Professional Planner/Zenith Fund Awards are determined using proprietary methodologies. Fund Awards and ratings are solely statements of opinion and do not represent recommendations to purchase, hold, or sell any securities or make any other investment decisions. Ratings are subject to change.
Unless otherwise specified, any information contained in this publication is current as at the date of this report and is provided by Greencape Capital Pty Ltd ABN 98 120 328 529 AFSL 303 903 (Greencape), the investment manager of the Greencape Broadcap Fund ARSN 121 326 341 (Fund). Fidante Partners Limited ABN 94 002 835 592 AFSL 234 668 (Fidante Partners) is the responsible entity and issuer of interests in the Fund. The information in this publication should be regarded as general information and not financial product advice, and has been prepared without taking into account of any person's objectives, financial situation or needs. Because of that, each person should, before acting on any such information, consider its appropriateness, having regard to their objectives, financial situation and needs. Each person should obtain and consider the Product Disclosure Statement (PDS) and any additional information booklet (AIB) for the Fund before deciding whether to acquire or continue to hold an interest in the Fund. A copy of the PDS and AIB can be obtained from your financial adviser, our Investor Services team on 13 51 53, or on our website www.fidante.com.au. Please also refer to the Financial Services Guide on the Fidante Partners website. Past performance is not a reliable indicator of future performance. Neither your investment nor any particular rate of return is guaranteed. The information contained in this document is not intended to be relied upon as a forecast and is not a recommendation, offer or solicitation to buy or sell any securities or to adopt any investment strategy, nor is it investment advice. If you acquire or hold the product, we, Fidante Partners or a related company will receive fees and other benefits which are generally disclosed in the PDS or other disclosure document for the Fund. Neither Fidante Partners nor a Fidante Partners related company and its respective employees receive any specific remuneration for any advice provided to you. However, financial advisers (including some Fidante Partners related companies) may receive fees or commissions if they provide advice to you or arrange for you to invest in the Fund. Greencape, some or all Fidante Partners related companies and directors of those companies may benefit from fees, commissions and other benefits received by another group company.
More information
To find out more about investing with Greencape, please contact:
Fidante Partners Investor Services team on: 13 51 53
Visit the Greencape website: www.greencapecapital.com.au
Email Greencape at: [email protected]
Financial advisers
For more information, please contact:
Fidante Partners Adviser Services
Phone: +61 1800 195 853
Email: [email protected]