green river interim system-wide improvement...
TRANSCRIPT

Green River Interim
System-Wide Improvement
Framework
Mark Isaacson
Division Director
FCD Advisory Committee
July 27, 2016
Department of Natural Resources and Parks
Water and Land Resources Division
River and Floodplain Management Section

Presentation Overview PL 84-99 Program and SWIF
• Project Area and Context
• Advisory Structure
• Technical Studies
Deficiency Action Plan
Capital Plan
Vegetation Plan
Interim Risk Reduction Measures
Funding and Implementation
• Lower Russell Project Example

What is a System Wide Improvement
Framework (SWIF)?
USACE SWIF policy, November 2011:
“A plan prepared by levee sponsors and approved by the
USACE to implement system-wide improvements to a levee
system (or multiple levee systems within a watershed) …”
“… solutions will satisfy the multiple requirements that apply
to levee systems (ESA, Tribal Treaty Rights, etc.) while
allowing levee sponsors to remain eligible for PL84-99
funding while addressing deficiencies.”

1. Deficiency Action Plan to correct unacceptable
or minimally acceptable deficiencies
2. Capital Plan to correct slope stability deficiencies
that cannot be corrected through routine
maintenance actions
3. Vegetation Plan to guide the design,
maintenance and stewarship of shoreline
vegetation on levees
4. Interim Risk Reduction Measures

Green River SWIF: Who is Involved? • King County Flood Control
District, lead agency
• King County
• Green River Cities
• Muckleshoot Tribe
• USACE, FEMA, NOAA
• WRIA 9
• PSP, Ecology, WDFW
• Business community
• Environmental organizations
• Citizens

Technical Studies: Flood Risk Assessment
• Geomorphic Assessment – channel patterns and gradient, stream incision, and damages to levees and revetments
• Geotechnical Assessment – levee stability, vulnerability, and potential breach locations
• Hydraulic Assessment – flooding patterns, channel capacity, and floodplain inundation (for flood flows of 12,000 to 26,800 cfs)
• Economic Analysis – Expected annual damages and economic impacts
Aquatic, Floodplain, and Riparian Habitat
• Riparian vegetation – trees, shrubs, invasive species
• Aquatic Habitat – pools, large wood, edge habitat

Deficiency Action Plan
356 Deficiencies Across 11 Levees
1. Near-term actions: 2015-17
• Culvert CCTV, fence removal, flap
gates/tide flex,
2. Mid-term actions to complete within
6-year CIP (2016-2021)
3. Long-term actions: capital projects
• Capital plan – slope stability
4. Programmatic actions (ongoing) –
vegetation and animal burrows
5. Monitoring actions (ongoing) –
monitoring acceptable slope stability
problems
Unacceptable
slope stability
Animal burrows

Types of Problems…
Culverts – CCTV and Inspect/replace flap gates and Tideflex
Slope stability – range from 1:1 to 1.7:1 slopes

…More Problems
Levee vegetation – trees and shrubs, rotting stumps, inspectability
Encroachments – fences/gates, stairs

Capital Plan 11 minimally acceptable or unacceptable
slope stability deficiencies on 4 levees
• Address slope stability deficiencies that
cannot be corrected by maintenance
• Achieve provisional level of protection
from flooding goal (500-year
containment)
• Achieve factors of safety to support future
certification/accreditation
• Capital Projects:
Lower Russell setback levee
Tukwila 205 – 3 locations
Horseshoe Bend – 3 locations
Tukwila 205

Vegetation Plan
• Goals – (1) levees and floodwalls function as
designed, (2) inspectability, (3) compliance with
Clean Water and Endangered Species acts
• Achieve desired outcomes:
Vegetation management and maintenance to
support annual inspections
Improved riparian habitat and shade conditions
along PL 84-99 shorelines
Alignment of flood risk management activities
with requirements to protect and restore natural
resources
• Vegetation M&O:
Annual brushing/mowing (before flood season)
Hazard tree mgmt. (public safety, levee integrity)
Vegetation maintenance on levees
Six Vegetation Management Zones
- Landward zone
- Landward slope zone
- Crest zone
- Upper riverward slope zone
- Riverward bench zone
- Lower riverward slope zone

Interim Risk Reduction Measures
• Physical:
Flood Warning Center and Program
Flood Patrol and Levee Inspection
Public Communications – preparedness,
education, understanding of residual risk
Emergency Response (post-flood recovery)
Animal Burrow Response Plan
Tech studies, assistance, and consultation
Flood hazard area regulations
Effectiveness monitoring to improve
performance
• Physical:
Sand bags
Bulk bags (e.g., Hescos) –
temporary increase in height
Earthen levee raising (low spots)
Small capital projects for scour
and erosion
Temporary rock placement

Funding and Implementation
SWIF implementation organized to resolve
PL 84-99 deficiencies using a worst-first
approach:
Funding constraints limit pace of capital
project implementation
Capital Project Costs = $85-101 million
PL 84-99 Levee M&O costs = $780,000/yr
Vegetation, encroachments, culverts,
burrows, assessments/monitoring
IRRM Costs:
Non-structural = $523,000 countywide
Structural = variable (per LF)
Submittal of SWIF to USACE – Feb 2016

Funding and Implementation

Project website:
Google “Green River System Wide Improvement Framework”

Questions?
Mark Isaacson, Division Director
Water and Land Resources Division
206-477-4601

Example Green River Levee USACE PL 84-99 Repairs
Kent Shops-Narita Galli’s levee – toe rock and willows
Lily Pointe
Segale – launchable toe and floodwall

Project Area: Green-Duwamish River
• Watershed Area = 475 mi2
• Population = 370,000
• 10 cities
• Residential, commercial,
industrial and agriculture
• Green River: 36 miles of levees
and revetments
• Howard Hanson Dam
(constructed 1962 at RM 64.5)
• All species of salmon present

Lower Green River: Context
Socio-Economic
• $7.3 billion in floodplain
structures and contents
• 100,000+ jobs
• 100 million sf warehouse
+ distribution space (2nd
largest on West Coast)
• Comprises 1/8th of the
GDP for WA State
• Annual taxable revenue of
$8 billion
• Boeing, REI HQ, Amazon
Fulfillment Center,
Starbucks roasting plant

Lower Green River: Context
Salmon Populations & Habitat • All species of salmon present,
including ESA-listed Chinook
salmon Historical pop. approx. 38,000
40-year average = 5,000
Low of 800 adults in 2009
25-65% hatchery origin
• Limited spawning in Lower Green
(above RM 24)
• Lethal water temperatures (> 23oC)
have occurred in Green River
mainstem (July 2006); TMDL water
quality standard is 16oC
• Tribal fishing rights

Location Levees (#/miles)
Revetments
(#/miles)
Total
Miles
Duwamish (RM 5.5-11) 3 (0.6 miles) 22 (3.3 miles) 3.9
Lower Green (RM 11-32) 41 (17.7 miles) 45 (9.8 miles) 27.5
Middle Green (RM 32-44) 12 (1.9 miles) 13 (2.9 miles) 4.8
Total 56 (20.2 miles) 80 (16.0 miles) 36.2
PL 84-99 levees (RM 12.4-30.8) 12 (16 miles)
Green River Flood Facility Deficiencies
• Aging system of levees – built to protect agricultural land uses, not regionally significant urban areas
• Slope stability and toe scour issues
• Other deficiencies – culverts, vegetation, encroachments, animal burrows, etc.
• Current containment = 12,000 cfs with variable freeboard
• Certification and Accreditation of Levees; FEMA mapping
Levees and Revetments

Levee Deficiencies (PL84-99) Horseshoe Bend Levee System example
Category (item) Unacceptable Min. Acceptable
Acceptable Total
Encroachments 0 20 6 26
Unwanted Veg. Growth 19 3 1 23
Other (e.g., culverts) 7 1 6 14
Slope Stability 0 4 1 5
Depressions/Rutting 0 4 0 4
Erosion/Bank Caving 0 4 0 4
Debris 0 1 0 1
Cracking 0 1 0 1
Total 26 38 14 78
Deficiency Action Plan
Near-term actions: encroachments, animal burrows, debris,
depressions, brushing
Mid-term actions: vegetation
Long-term actions: slope stability (and toe scour)

Risk Assessment – Key Findings
Geomorphology • Channel incision between 1986 and 2011 was a minimum of
1-2 feet everywhere, with maximum incision of 7-10.5 feet at
channel bends in all four reaches of Lower Green
• Most damaged levees and revetments are located around
channel bends
• Channel locations with >5 feet of incision represent a
substantial risk of future damage to levees and revetments

Risk Assessment – Key Findings
Geotechnical
• Most levees constructed in 1960s used river alluvium
(sand/ gravel), and dragline methods without compaction
• Levee stability analyses shallow failure surfaces that
would not result in significant reduction of levee prism
– Considered a maintenance issue, with a low probability of causing
a levee breach, but must be repaired
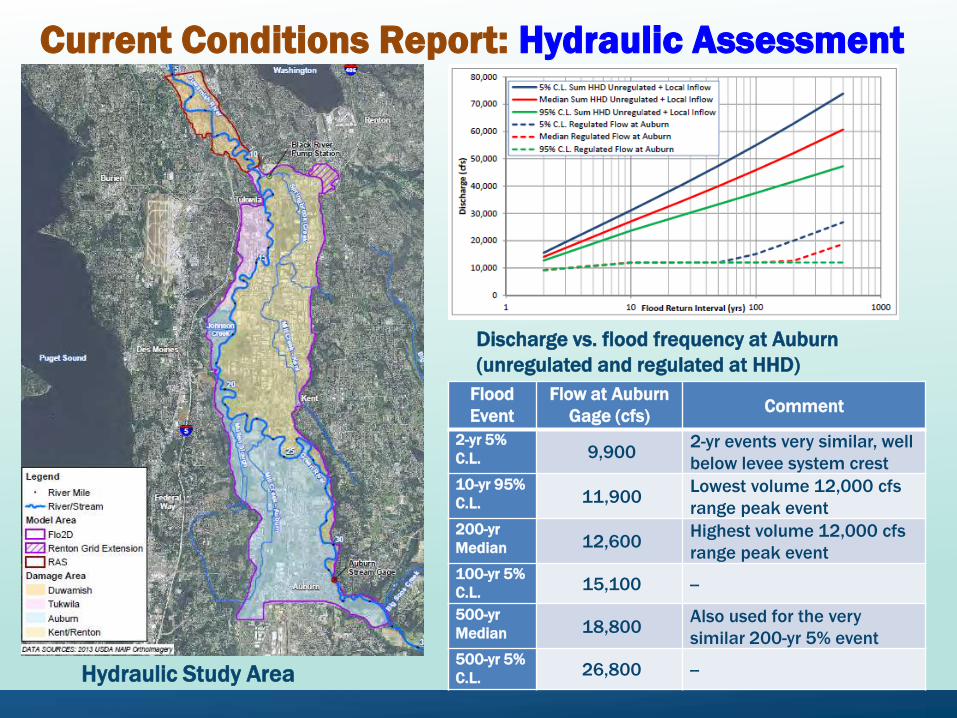
Current Conditions Report: Hydraulic Assessment
Hydraulic Study Area
Discharge vs. flood frequency at Auburn
(unregulated and regulated at HHD)
Flood
Event Flow at Auburn
Gage (cfs) Comment
2-yr 5%
C.L. 9,900 2-yr events very similar, well
below levee system crest 10-yr 95%
C.L. 11,900 Lowest volume 12,000 cfs
range peak event 200-yr
Median 12,600 Highest volume 12,000 cfs
range peak event 100-yr 5%
C.L. 15,100 --
500-yr
Median 18,800 Also used for the very
similar 200-yr 5% event 500-yr 5%
C.L. 26,800 --

Current Conditions Report: Hydraulic Assessment (Inundation)
12,600 cfs 18,800 cfs 15,100 cfs
Levee overtopping that exceeds design protection will result in
floodplain inundation of <1 to 10+ feet

Risk Assessment – Key Findings
Economics
• HEC-FDA (Flood Damages Assessment) modeling
estimated system-wide estimated annual damages of
$47.1 million
– National and Regional Economic Development (NED, RED) effects
• Present value damages (based on 50 years and 3.5%
discount rate) is $1.1 billion
– Analysis assumes all businesses remain and re-open following
downtime caused by flood
– There are 5,371 residential structures in planning area

Shoreline/Riparian Vegetation and Aquatic Habitat
Findings
• Low diversity, quality and substantially modified from historical conditions
• Habitat dominated by glides; Riffles and pools limited downstream of RM 24
• Temperature impaired water body (TMDL), with lethal conditions for salmonids in some years

Lower Green River Riparian Aspect Priorities
(Muckleshoot Tribe 2013)

Vegetation Plan – Three shoreline types
Type A – Original (invasive vegetation) Type B – Bioengineered Repairs
Type C – Recently Built Capital Projects – Setback levees, floodwalls

Lower Russell Road Levee Setback
November 2006 Flood
Green River Natural
Resources Area
Relocated Van
Doren’s Park Riparian Habitat
Restoration
Levee Setback
and Green River
Trail
Aquatic and
Riparian Habitat
Restoration

Lower Russell Project Location
City of Kent – Right Bank Green River
between River Mile 17.85-19.25
S 212th to Veterans Drive/S. 228th bridges

33
Green River Trail
Van Doren’s Park
Toe Scour &
Oversteepened
Slope

Lower Russell Rd Levee Setback
• Goal: Remove/replace existing flood containment system of levee/revetments to provide long-term flood protection, improve riparian and aquatic habitat, and recreation
• Existing levee/revetments do not
meet current engineering design standards
• System prone to scour and slope instability
• Unacceptable deficiencies in PL84-99 (slope stability, encroachments, unwanted vegetation)
Lower Russell Road Levee 2006 Flood Photo

Flood Protection, Habitat Restoration and Recreation Enhancements