green computing: approaches and practices in the fermilab data centers
TRANSCRIPT

NLIT 2009
Green Computing: Approaches and Practices in the Fermilab Data Centers
June 1, 2009
f Fermi National Accelerator Laboratory DOCDB #3170

Scope
Fermilab operates over 30,000 square feet of Data Center space for high availability computing and high density computational computing equipment. Covering the life cycle from design to operations, this presentation will provide an overview of the strategies and practices leveraged to improve the energy efficiency of computer rooms.
Green Accomplishments and Practices in the Fermilab Data Centers (DOCDB 2637)

Outline
► Fermilab Data Centers► What is Green Computing?► Baseline Each Computer Room► Cooling Equipment Efficiencies► Air Management► Server Management & Energy Effectiveness► Maintenance► Conclusions

► Fermilab Data Centers
Grid Computing Center (GCC)
Lattice Computing Center (LCC)
Feynman Computing Center (FCC)
• 3 data centers
• 11 computer rooms
• 30,000 square feet of space
• 3-15kW rack power densities
• Cooling - water & refrigerant
• 3.5 MW footprint
• > 7000 computers
• > 1 Petabyte disk
• >14 Petabytes tape storage

Fermilab Data Centers Overview Feynman Computing Center (FCC)
• 3 computer rooms • 17891 ft2 24” raised floor (typical) • 750kVA UPS for all computing systems • 1.5 MWatt standby diesel generator • 270 tons*; Chilled Water cooling • <4kW/cabinet (typical) • 220 rack positions • Security system • Fire detection/suppression systems • Under floor water detection system
Lattice Computing Center (LCC)
• 2 computer rooms • 2841 ft2 12” raised floor (typical) • No UPS / ~850kVA total capacity for computing • Tap boxes to connect portable generators • 210 tons*; Chilled Water & air cooling mix • 4kW & 8kW/cabinet ( typical) • 76 rack positions • Security system (access only) • Fire detection/suppression systems
Grid Computing Center (GCC)
• 4 computer rooms / 2 communication rooms • 10384 ft2 24” & 36” raised floor (typical) • 1000kVA * 3 UPS for all computing systems • Tap boxes to connect portable generators • 1000 tons*, air cooled units • 10kW & 14kW/cabinet (typical) • 235 rack positions • Security system • Fire detection/suppression systems (including VESDA)
Fiber Central (FC)
• 1 communication room • 792 ft2 12” raised f loor ( typical) • 20kVA UPS for computing systems • Standby generator • 10 tons*; Chilled Water cooling • <3kW/cabinet (typical) • 12 rack positions • Security system (access only) • Fire detection/suppression systems
* One ton = 12,000 Btu/h; One Btu/h = 0.293 watts; One ton = 3.516kW

The Architected Model for Locating Computing in the Data Centers
Lattice Computing Center (LCC) High Performance Computing
(HPC) Accel. Sim, Cosmology nodes No UPS; taps for portable generators
Feynman Computing Center (FCC) High Availability Services Networking, Computer Security,
BSS, Email, Web, Databases, Core Site Services
Tape Robotic Storage UPS & Standby Power Generation
Grid Computing Center (GCC)
High Density Computational Computing
CMS, RUNII, GP batch worker nodes
Lattice HPC nodes Tape Robotic Storage UPS & taps for portable generators
Highest Availability (99.99%)
Low Density (2-5kW/rack)
Power Capacity: 750kVA
High Density (10-15kW/rack)
High Availability (99.78%)
Power Capacity: 3000kVA
Medium Density (4-8kW/rack)
Outage Tolerant (98.53%)
Power Capacity: 850kVA

► What is Green Computing?
• Procuring more efficient technology• Recycling end of life hardware• Environmentally friendly components used
in computing and data center equipment• Engineered design of data centers • Operating data centers efficiently
All the above and more…

Incentives?
Saving money is where the rubber meets the road(and all the rest is great too)
PL 109-341: Mandates Study by EPA on Rapid Growth of Energy Usage by Data Centers [Dec. 20, 2006]PL 110-140: Energy Independence and Security Act of 2007 [Dec. 19, 2007]
…reducing our carbon footprint … adhering to standards and guidance … Public Laws 109-341 & 110-140 … audits … recognition … reducing capital investments and operating budget! …

How To Pursue $Green$?
• Strategies & planning in the design stage– New construction
• Significant modifications– Significant capital budget and multi-year
return on investment• Operational improvements
– Modest investments & high effectiveness – Non invasive – immediate ROI– Low hanging fruit -- today’s focus!

► Baseline Each Computer Room
• Obtain the power usage with best granularity possible throughout the power distribution– Automated monitoring is best, but pursue manual data collection
if necessary to start today• Benchmarking the system makes it possible to view the
impact of efficiency modifications and provides comparison to other data centers
Example of Data Center Energy Use• Accurate power consumption data over time is the best indicator of actual needs and the predictor of future growth requirements

Measure the Electrical PowerWhat is the electric power used to operate the critical load so that it can provide useful computing?
What is the electric power used by non-critical load? Includes the cooling system, lighting, uninterruptible power supplies (UPS), PDUs and transformers
Measure at many points throughout the power train. Notably at the building entrance, the critical load and where electrical power conversion occurs (transformers, UPS, PDUs)

Electrical Losses• Power is lost at each power transformation
– UPS AC-DC & DC-AC– PDU 480V 3Φ – 208V 1Φ– Server 208V AC – 12V DC
• Computer rooms are most efficient when operated near the designed full load capacity– UPS are dramatically less efficient at light
loads– It’s not efficient to run 100% of your
infrastructure when demand is less than that

Energy (kWh) versus Power (kW)
• Energy (kWh) consumption reflects the quantity of fuel used (and that must be generated) and the size of the electric bill
• Power (kW) is a measurement at a particular time
Reducing power consumption will allow increased computing within the same
facility footprint and push off large capital investments for new data centers
Scenario 2
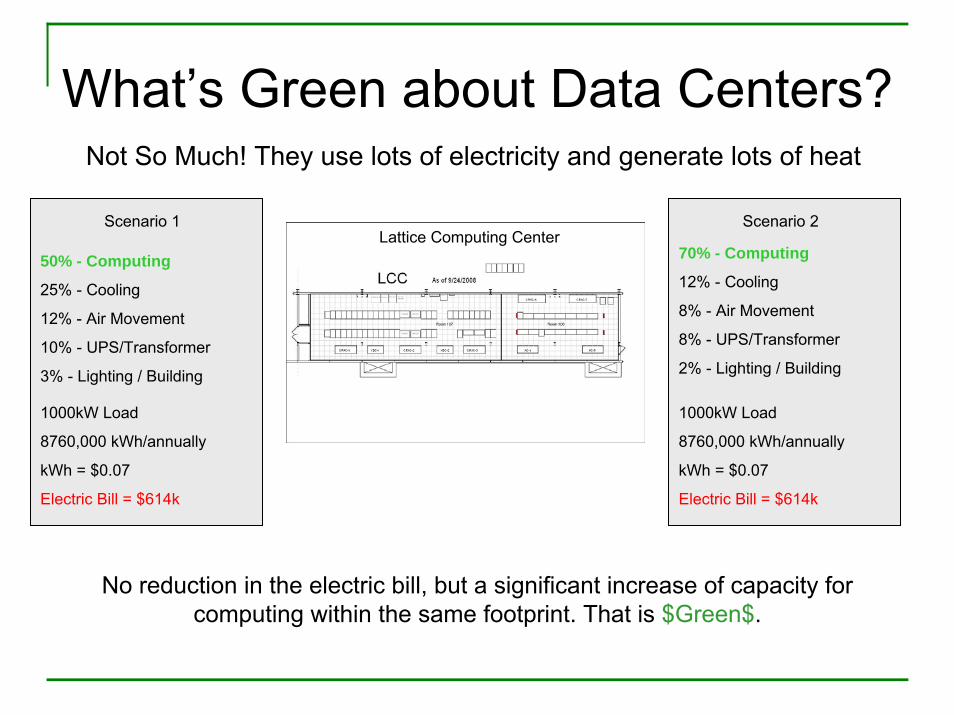
What’s Green about Data Centers?
50% - Computing
25% - Cooling
12% - Air Movement
10% - UPS/Transformer
3% - Lighting / Building
1000kW Load
8760,000 kWh/annually
kWh = $0.07
Electric Bill = $614k
Scenario 1
Not So Much! They use lots of electricity and generate lots of heat
70% - Computing
12% - Cooling
8% - Air Movement
8% - UPS/Transformer
2% - Lighting / Building
1000kW Load
8760,000 kWh/annually
kWh = $0.07
Electric Bill = $614k
Lattice Computing Center
No reduction in the electric bill, but a significant increase of capacity for computing within the same footprint. That is $Green$.

PUE – Power Usage Effectiveness
Total Facility PowerPUE = ________________
IT Equipment Power
• The PUE is the ratio of the total data center load to the IT equipment load. A PUE of 2.0 means the data center requires twice the IT equipment power to operate
• Typical range: 1.5 (better) to 3– The industry average PUE is about 2.5, according to The Uptime
Institute
Source: The Green Grid

DCIE – Data Center Infrastructure Efficiency
IT Equipment PowerDCIE = ________________ X 100
Total Facility Power
• Percentage of data center power used by the IT equipment
• Typical range: 30% to 70% (better)– The industry average DCIE is about 40%, according to The
Uptime Institute
Source: The Green Grid

►Cooling Equipment Efficiencies
• ASHRAE recommended standards– 20°C to 25°C (68°F - 77°F)– Humidity 40% to 55%
• Ensure air conditioner units are tuned to the room and balanced with each other
• Save energy and gain cooling capacity by relaxing stringent relative humidity and temperature requirements
Humidity• ASHRAE recommended standards
– Humidity 40% to 55% • Humidification is often accomplished by electric
heating coils in the CRACs that vaporize water, and involves an energy-intensive phase change from liquid to vapor
• De-Humidification requires a phase change from vapor to liquid, a very energy-intensive and expensive process
• Don’t over control & do not allow CRACs fight each other

Undesired Solar Heating• One computer room had nine large
windows with south and southeast exposure
Solid Window Panel
• Temperatures in front of the windows during mid day measured in excess of 105°F
• Installing solid panels reduced energy consumption of cooling units by 11-15kW
Clean Rooms• Storage of materials in computer rooms is
discouraged• Activities inside the data center that generate
particulates, dust and debris are limited• Small bits of cellophane, tie wraps, wire,
insulation, cardboard and other debris will be blown around the room
• Ultimately this ends up in the cooling units and intakes on servers, networking and tape libraries
• A cleaning service visits the data center on a regular schedule to keep equipment running at an optimum level

Displays and Monitors• While considering ways to be efficient, nearly 50 CRT displays were
counted in one computer room
• Older CRTs had no power save modes and CRT displays use 75W versus 20W for LCDs. In total, this was equivalent to the power used for a rack of computing
• The number of displays was greatly reduced using KVM switches, software and crash carts. Flat screens replaced most CRTs
• Additional saving gained by not having to remove the extra warm air generated by the CRTs (power used by the cooling units)
Humans – 360BTU/Hr Seated, 1650BTU/Hr Active

► Air Management
• Cool air is drawn through the racks by equipment fans and the warm air is exhausted from the back of the rack into the hot aisle Hot Aisle – Cold Aisle Cooling Schematic
Facilities Engineering - Fermilab
• To extend the benefits of this configuration, power distribution & communications cabling are delivered to the racks in cables trays above the racks
Cold Aisle Containment
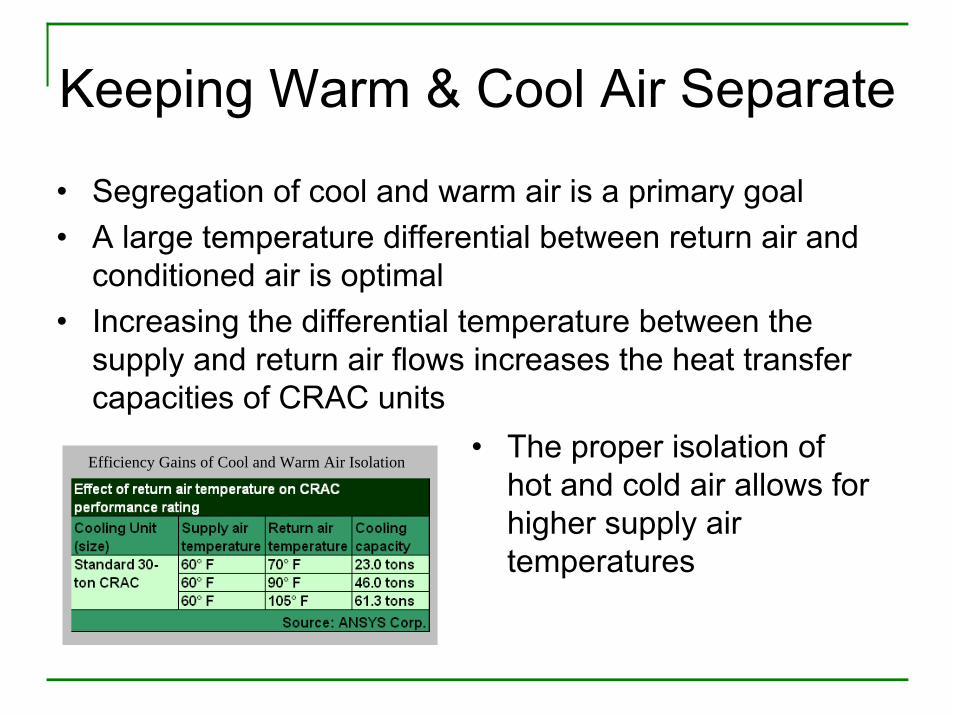
Keeping Warm & Cool Air Separate
• Segregation of cool and warm air is a primary goal• A large temperature differential between return air and
conditioned air is optimal• Increasing the differential temperature between the
supply and return air flows increases the heat transfer capacities of CRAC units
Efficiency Gains of Cool and Warm Air Isolation • The proper isolation of hot and cold air allows for higher supply air temperatures

Rack Cable Management
Establish a Standard
Proper rack cable management is a science
Don’t impair the air flow
Reduce time required for troubleshooting
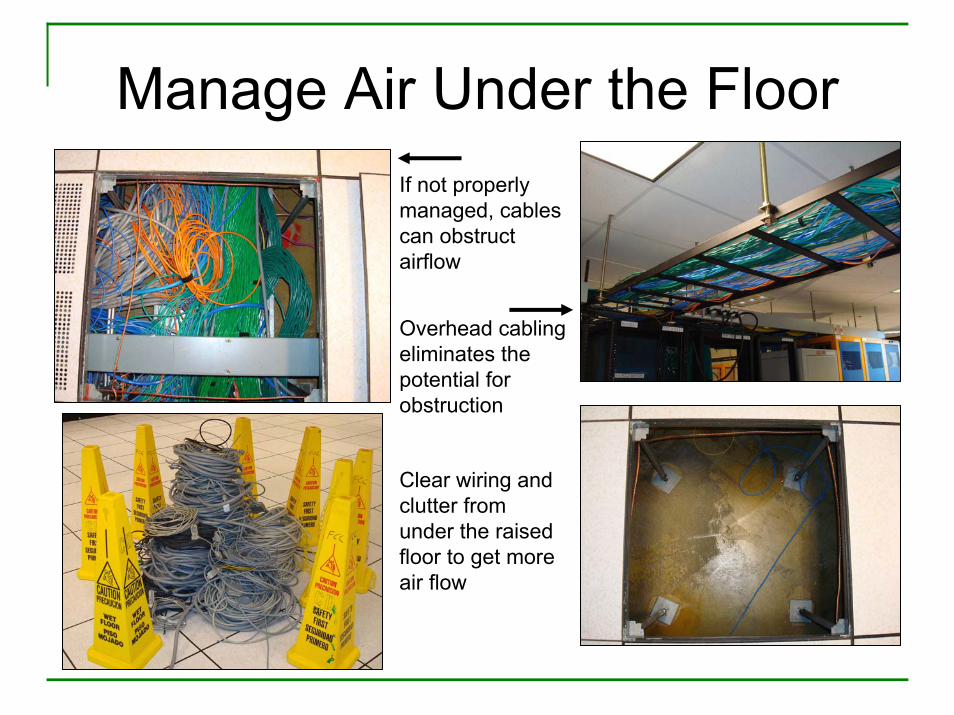
Manage Air Under the Floor
Overhead cabling eliminates the potential for obstruction
If not properly managed, cables can obstruct airflow
Clear wiring and clutter from under the raised floor to get more air flow
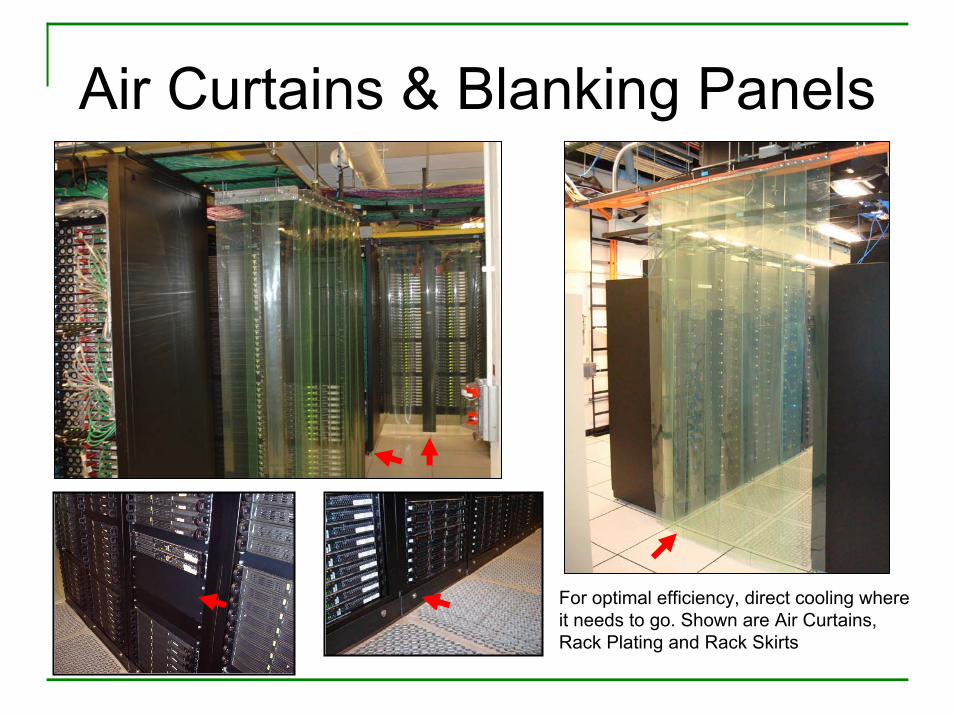
Air Curtains & Blanking Panels
For optimal efficiency, direct cooling where it needs to go. Shown are Air Curtains, Rack Plating and Rack Skirts

►Server Management & Energy Effectiveness
• Consolidated Server Procurement Approach for Compute Servers
• 80 Plus power supply requirement– 90%+ efficient supplies requested
• Incentives for ‘Green’ solutions– rewarded through a weighting algorithm
• Energy consumption and efficiency of the computing equipment are now a standard part of the purchase evaluation
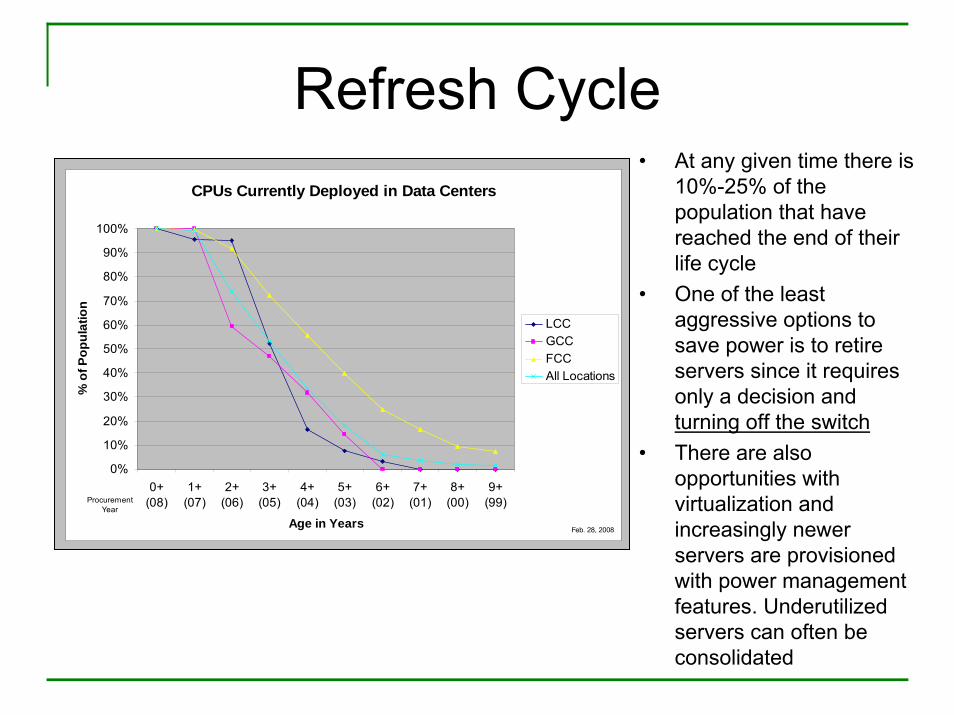
Refresh CycleCPUs Currently Deployed in Data Centers
0%
10%
20%
30%
40%
50%
60%
70%
80%
90%
100%
0+(08)
1+(07)
2+(06)
3+(05)
4+(04)
5+(03)
6+(02)
7+(01)
8+(00)
9+(99)
Age in Years
% o
f Pop
ulat
ion
LCCGCCFCCAll Locations
Feb. 28, 2008
ProcurementYear
• At any given time there is 10%-25% of the population that have reached the end of their life cycle
• One of the least aggressive options to save power is to retire servers since it requires only a decision and turning off the switch
• There are also opportunities with virtualization and increasingly newer servers are provisioned with power management features. Underutilized servers can often be consolidated

Recycling End of Life Computing
• Mature recycling program– Reuse on site– Donations to schools– Sales to recyclers
• Representatives from the Laboratory received award at White House December 16, 2008

► Maintenance
• ‘Run to failure’ maintenance works great for light bulbs
• Electric & Cooling systems run 24x7 365 days/year
• Data Centers require a stringent maintenance program for peak efficiency
• Replace air filters regularly; in the Midwest check and clean the air intake on condensers

► Conclusions
• Collect and measure power usage– What gets measured gets managed
• Establish a baseline– Start today
• Benchmark improvements & compare– Understand & document the ROI
• Continue to improve tools – share & learn
Ordinary Improvements Can Provide Extraordinary Impact

Balance & Constraints
• Available Budget• Risk to Availability Goals• Culture Shock
• Can be overcome with homework• Identify the benefits and make the case
Business objectives & environmental goals are starting to align

Additional Resources
• ASHRAE• Energy Star• EPEAT• The Green Grid • LBNL Datacenter Web Site• Uptime Institute• 80 Plus
Feynman Computing Center @ Fermilab

Questions & Comments?
Network Room Racks at the Grid Computing Center