green building in multifamily affordable housing: impacts ... · green building in multifamily...
TRANSCRIPT

Green Building in Multifamily
Affordable Housing: Impacts and
Policies

Mission: Southface
promotes sustainable
homes, workplaces and
communities through
education, research,
advocacy and technical
assistance.
Established in 1978
Atlanta, GA
www.southface.org

▪ Commercial Sustainability Services
• Grants to Green
▪ Residential Sustainability Services
• EarthCraft
• Home Energy Rating System
(HERS)
▪ Community Sustainability Services
• Impact of Green Affordable Housing
• City Energy Project
▪ Policy
• Energy Efficiency for All (EEFA)
▪ Communication and Development
• Sustainable Atlanta Round Table
(SART)
▪ Education and Training
• Building Energy Codes & Standards
• BPI

▪ Evaluate and Support
Green Affordable
Housing Policy &
Planning
▪ Data Sharing
▪ Enhanced
Understanding of Costs
& Benefits
▪ Increased Adoption
▪ Appropriations &
Budgeting
PROJECT GOALS
Impact of Green Affordable Housing

PROJECT DESCRIPTION
Impact of Green Affordable Housing▪ MFAH Developers
• AL, GA, NC & SC
▪ Recently Constructed or Rehabbed
• 12 Months Occupancy Data
▪ Affordable - LIHTC Properties, HUD
Subsidized, PHA, etc.
▪ Comparison Data Across Many
Types of Developments
• NC
• Rehab
• Family
• Senior
• LR/MR/HR
▪ Analyze and Evaluate Cost-Benefit
(Triple Bottom Line) for All
Stakeholders
• Residents
• Managers
• Developers
• HFA

PROJECT TIMELINE AND PROCESS
Impact of Green Affordable HousingTask 1: Preliminary Analysis
7/2014-9/2014
Task 2: Partner Recruitment and
Engagement
7/2014-2/2015
Task 3: Research Design
9/2014-2/2015
Task 4: Development Identification and
Data Access
10/2014-8/2015
Task 5: Data Collection and Research
Analysis
1/2015-8/2015
Task 6: Stakeholder and Industry
Communications
7/2014-8/2015

▪ Peer Reviewed Literature
• Internal
• External
▪ Advisory Committee
▪ Development & Construction
Costs
• Cost Certifications
• AIA G702
▪ Surveys (SurveyGizmo)
• Development & Construction
• Construction & Specifications
• Property Management
• Resident - HUD MF Sampling
Rate
• HFA
PROJECT METHODS & DATA RESOURCES
Impact of Green Affordable Housing
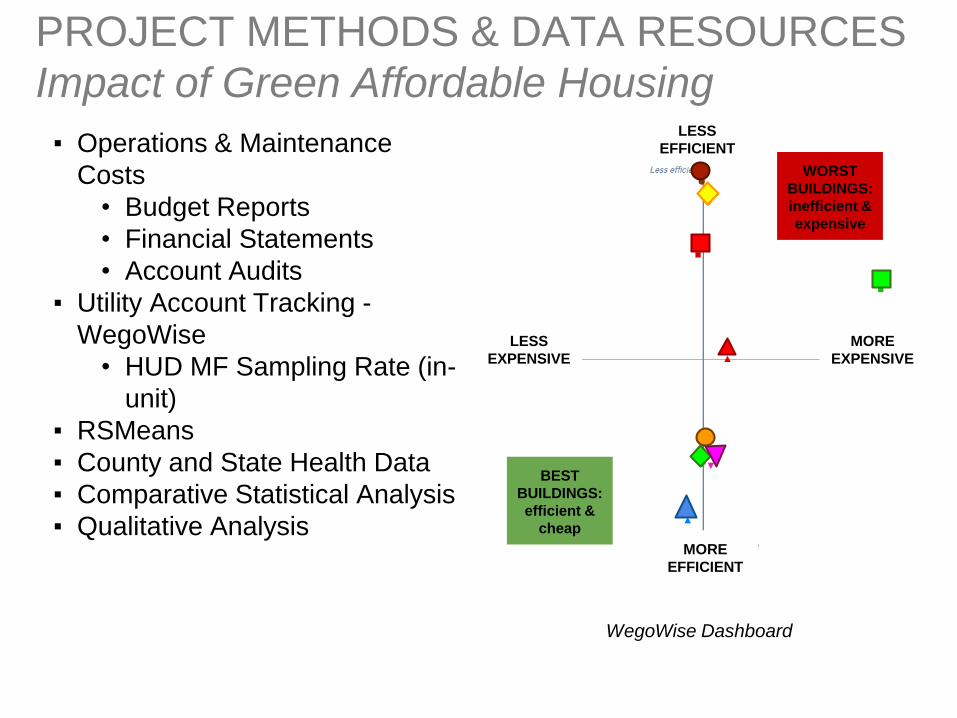
▪ Operations & Maintenance
Costs
• Budget Reports
• Financial Statements
• Account Audits
▪ Utility Account Tracking -
WegoWise
• HUD MF Sampling Rate (in-
unit)
▪ RSMeans
▪ County and State Health Data
▪ Comparative Statistical Analysis
▪ Qualitative Analysis
PROJECT METHODS & DATA RESOURCES
Impact of Green Affordable Housing
LESS
EXPENSIVE
MORE
EXPENSIVE
LESS
EFFICIENT
MORE
EFFICIENT
BEST
BUILDINGS:
efficient &
cheap
WORST
BUILDINGS:
inefficient &
expensive
WegoWise Dashboard

RESEARCH PARTICIPANTSGreen
DevelopmentCertification Placed
in Service
Year
State City Urban/Rural Construction Type
Gross SF
Number of Units
Resident Type
Building Type
Green 1 EarthCraft &
ENERGY
STAR
2012 GA Cordele Rural Acquisition
Rehab
31,352 46 Elderly Low Rise
Green 2 EarthCraft 2012 GA Rincon Rural NC 75,803 60 Family Low Rise
Green 3 LEED 2011 GA Atlanta Urban NC 202,343 156 Family Low Rise
*Green HR LEED 2014 GA Atlanta Urban Historic
Rehab
59,368 90 Supportive
Housing
High Rise
Green 4 EarthCraft &
LEED
2012 GA Pooler Rural NC 69,075 50 Family Low Rise
Green 5 EarthCraft 2013 NC Charlotte Urban NC 111,000 110 Senior Mid Rise
Green 6 EarthCraft 2014 NC Charlotte Urban NC 103,300 74 Family Mid Rise
Green 7 ENERGY
STAR
2012 NC Holly
Springs
Rural NC 74,444 64 Senior Low Rise
Green 8 EarthCraft 2012 NC Hudson Rural NC 40,720 40 Senior Low Rise
Green 9 ENERGY
STAR
2011 NC Hudson Rural NC 47,784 40 Family Low Rise
Green 10 ENERGY
STAR
2012 SC Greenville Urban NC 85,327 60 Family Low Rise

RESEARCH PARTICIPANTSNon-Green
DevelopmentPlaced In
Service YearState City Urban/Rural Constructio
n TypeGross SF Number of
UnitsResident
TypeType
Non-Green 1 2012 AL Centre Rural NC 40,367 40 Elderly Low Rise
Non-Green 2 2010 AL Monroeville Rural NC 59,806 56 Elderly Low Rise
Non-Green 3 2012 AL Mobile Urban NC 57,613 51 Elderly Low Rise
Non-Green 4 2011 AL Gadsden Rural NC 46,630 40 Elderly Low Rise
Non-Green 5 2011 AL Montgomery Urban NC 109,232 96 Family Low Rise
Non-Green 6 2011 SC Charleston Urban NC 62,873 46 Family Low Rise
Non-Green 7 2010 SC Hardeeville Rural NC 59,543 50 Family Low Rise

▪ Established by the Virginia
Legislature in 1989 as the state’s
housing research center.
▪ An "an interdisciplinary study,
research, and information resource
on housing for the Commonwealth of
Virginia."
▪ VCHR provides housing-related data
services.
▪ Solving the nation’s critical housing
needs through national research
related to housing affordability,
sustainability, and innovative
housing technologies.
VIRGINIA CENTER FOR HOUSING
RESEARCH AT VIRGINIA TECH
(VCHR)
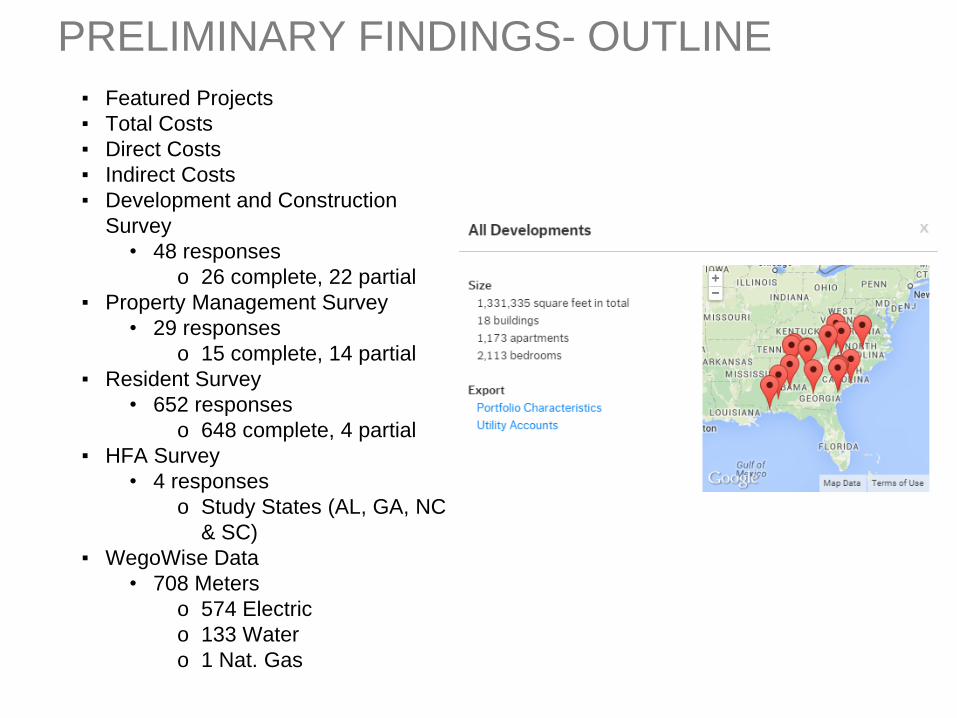
PRELIMINARY FINDINGS- OUTLINE
▪ Featured Projects
▪ Total Costs
▪ Direct Costs
▪ Indirect Costs
▪ Development and Construction
Survey
• 48 responses
o 26 complete, 22 partial
▪ Property Management Survey
• 29 responses
o 15 complete, 14 partial
▪ Resident Survey
• 652 responses
o 648 complete, 4 partial
▪ HFA Survey
• 4 responses
o Study States (AL, GA, NC
& SC)
▪ WegoWise Data
• 708 Meters
o 574 Electric
o 133 Water
o 1 Nat. Gas

Green vs. Non-Green Average
Development SF Costs Summary
Development Type Total Cost / SF Hard Cost / SF Soft Cost / SF
Green $94.55 $55.68 $38.87
Non-Green $96.09 $54.54 $41.55
% Difference – Green vs. Non-Green
-1.61% +2.09% -6.46%
Hard costs - materials, labor and
equipment directly used in the
construction of the building
Soft costs - design and construction
fees associated with the management
of the development process
Green certified buildings in GA, NC and SC cost less to design and build than non-green alternatives in AL and SC.
Such a finding could suggest that green building processes have diffused into the industry and do not represent a price premium.
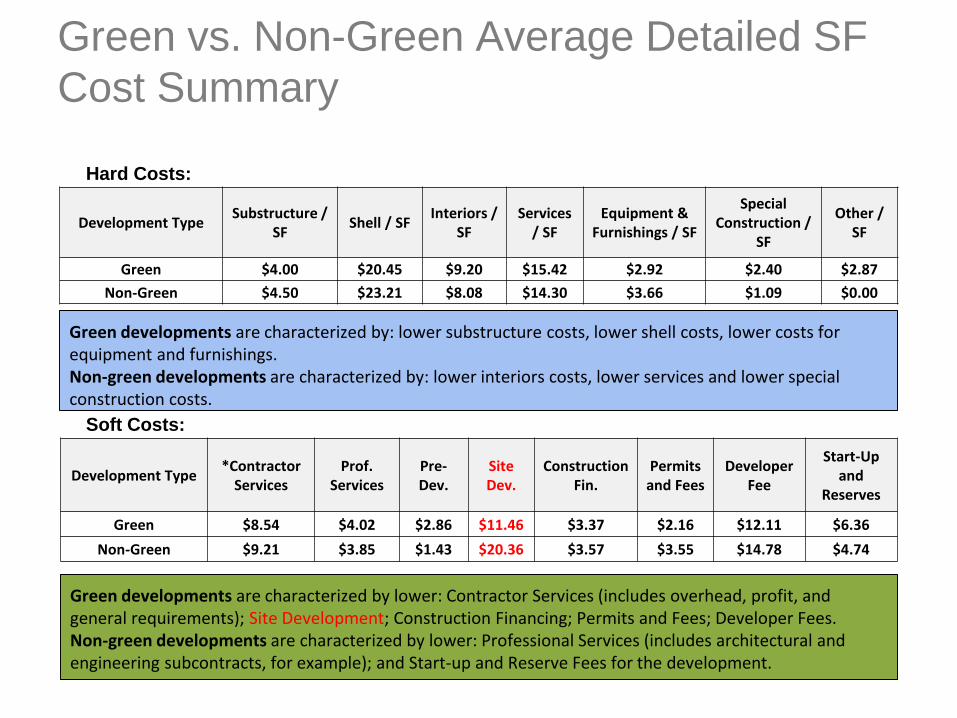
Development TypeSubstructure /
SFShell / SF
Interiors / SF
Services / SF
Equipment & Furnishings / SF
Special Construction /
SF
Other / SF
Green $4.00 $20.45 $9.20 $15.42 $2.92 $2.40 $2.87
Non-Green $4.50 $23.21 $8.08 $14.30 $3.66 $1.09 $0.00
Development Type*Contractor
ServicesProf.
ServicesPre-Dev.
Site Dev.
Construction Fin.
Permits and Fees
Developer Fee
Start-Up and
Reserves
Green $8.54 $4.02 $2.86 $11.46 $3.37 $2.16 $12.11 $6.36
Non-Green $9.21 $3.85 $1.43 $20.36 $3.57 $3.55 $14.78 $4.74
Green vs. Non-Green Average Detailed SF
Cost Summary
Hard Costs:
Soft Costs:
Green developments are characterized by: lower substructure costs, lower shell costs, lower costs for equipment and furnishings. Non-green developments are characterized by: lower interiors costs, lower services and lower special construction costs.
Green developments are characterized by lower: Contractor Services (includes overhead, profit, and general requirements); Site Development; Construction Financing; Permits and Fees; Developer Fees. Non-green developments are characterized by lower: Professional Services (includes architectural and engineering subcontracts, for example); and Start-up and Reserve Fees for the development.

Green vs. Non-Green Average Annual
Development O&M SF Costs Summary
Development TypeTotal O&M Cost /
SFMaintenance /
SFUtilities / SF
Administration / SF
Green $2.79 $0.90 $0.49 $1.40
Non-Green $2.42 $0.67 $0.55 $1.20
% Difference – Green vs. Non-Green
+15.07% +33.89% -11.71% +16.92%
Anecdotally, education of maintenance staff and administration on technology of green buildings is needed.
Emphasis on energy efficiency is working.
Findings in this study suggest that the gap between green and non-green buildings is wider than simply education of managers, but includes cost as well.
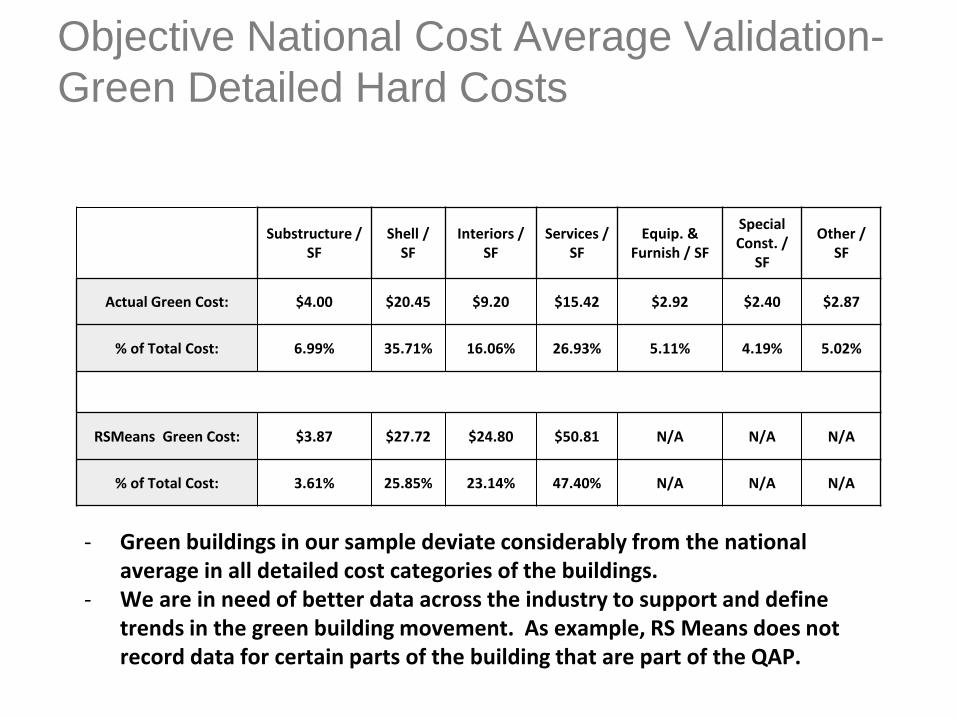
Objective National Cost Average Validation-
Green Detailed Hard Costs
Substructure / SF
Shell / SF
Interiors / SF
Services / SF
Equip. & Furnish / SF
Special Const. /
SF
Other / SF
Actual Green Cost: $4.00 $20.45 $9.20 $15.42 $2.92 $2.40 $2.87
% of Total Cost: 6.99% 35.71% 16.06% 26.93% 5.11% 4.19% 5.02%
RSMeans Green Cost: $3.87 $27.72 $24.80 $50.81 N/A N/A N/A
% of Total Cost: 3.61% 25.85% 23.14% 47.40% N/A N/A N/A
- Green buildings in our sample deviate considerably from the national average in all detailed cost categories of the buildings.
- We are in need of better data across the industry to support and define trends in the green building movement. As example, RS Means does not record data for certain parts of the building that are part of the QAP.

Objective National Cost Average Validation-
Non-Green Detailed Hard Costs
Substructure / SF
Shell / SFInteriors /
SFServices /
SFEquip. &
Furnish / SF
Special Const. /
SFOther / SF
Actual Non-Green Cost: $4.50 $23.21 $8.08 $14.30 $3.66 $1.09 $0.00
% of Total Cost: 8.21% 42.32% 14.73% 26.08% 6.67% 1.98% 0.00%
RSMeans Non-Green Cost:
$4.01 $23.91 $22.96 $43.16 N/A N/A N/A
% of Total Cost: 4.26% 25.42% 24.41% 45.90% N/A N/A N/A
The green and non-green data in our sample do not vary widely in their deviation from national data. As a benchmark to national data, the low variability suggests consistency across the sample.

DEVELOPER/BUILDER SURVEY
Affordable Developments
Constructed to Above-Code
Green Building
Certifications:
Primary Motivations for
Implementing Green
Technologies:
National
Green
Building
Standard
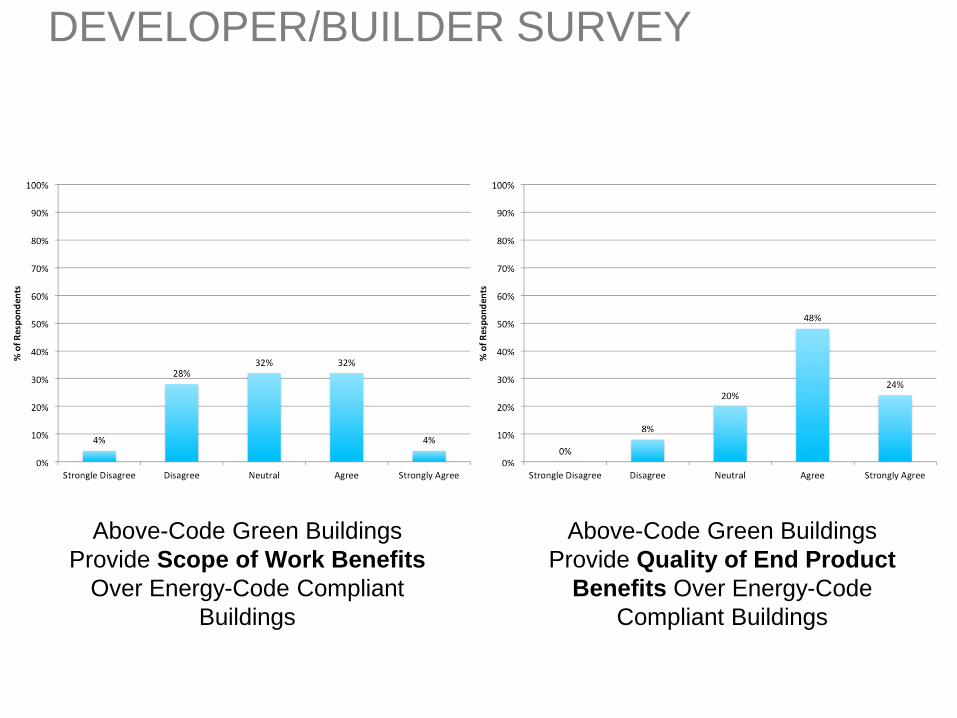
DEVELOPER/BUILDER SURVEY
Above-Code Green Buildings
Provide Scope of Work Benefits
Over Energy-Code Compliant
Buildings
Above-Code Green Buildings
Provide Quality of End Product
Benefits Over Energy-Code
Compliant Buildings
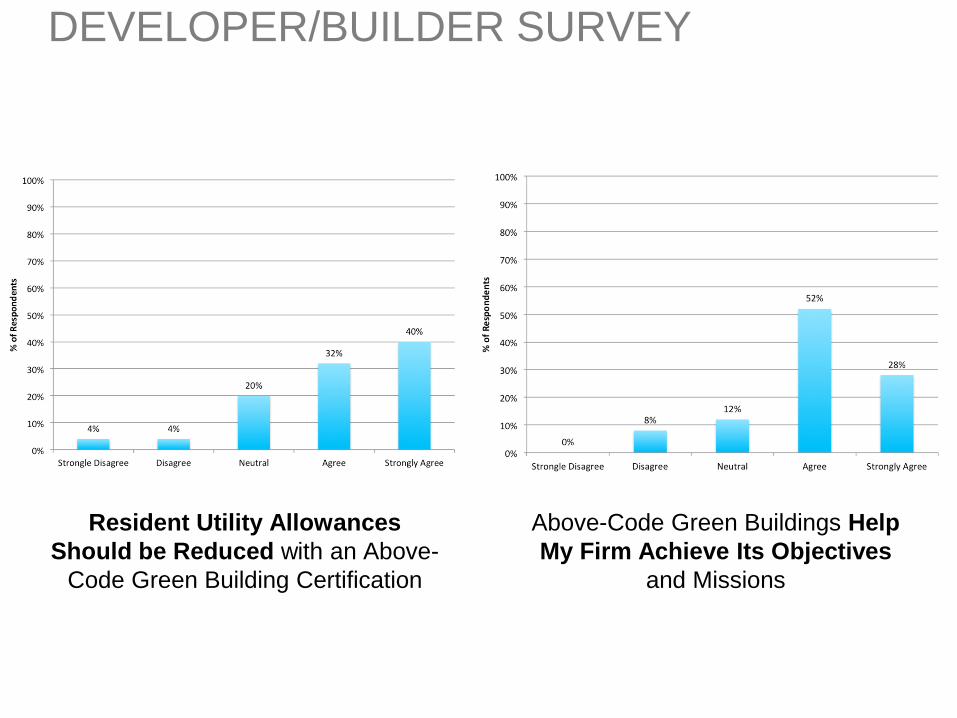
DEVELOPER/BUILDER SURVEY
Resident Utility Allowances
Should be Reduced with an Above-
Code Green Building Certification
Above-Code Green Buildings Help
My Firm Achieve Its Objectives
and Missions

RESIDENT SURVEY
Current Overall Affordability
Compared to Previous Home:
Green Developments
Current Overall Affordability
Compared to Previous Home:
Non-Green Developments
7%
31%
62%
9%
40%
51%

RESIDENT SURVEY
Current Overall Satisfaction of
Comfort and Affordability
Compared to Previous Home:
Green Developments
Current Overall Satisfaction of
Comfort and Affordability
Compared to Previous Home:
Non-Green Developments
6%
26%
68%
2%
29%
69%

Above-Code Green Buildings Are More
Energy Efficient Than Energy-Code
Compliant Buildings
PROPERTY MANAGEMENT &
ADMINISTRATION SURVEY
Above-Code Green Buildings Are More
Water Efficient Than Energy-Code
Compliant Buildings
Comments:
“Because of rising utility costs, I cannot tell any difference.”

PROPERTY MANAGEMENT &
ADMINISTRATION SURVEY
Above-Code Green Buildings Have
Lower Utility Costs Than Energy-Code
Compliant Buildings
Above-Code Green Buildings Have
Lower Utility Costs Than Energy-
Code Compliant Buildings, And Allow
For Reduced Utility Allowance
Comments:
“We do see some savings on the systems but it's hard to determine if it's simply because they're newer
units (and by default more efficient) or if it's because it's the specifically high efficient units.”
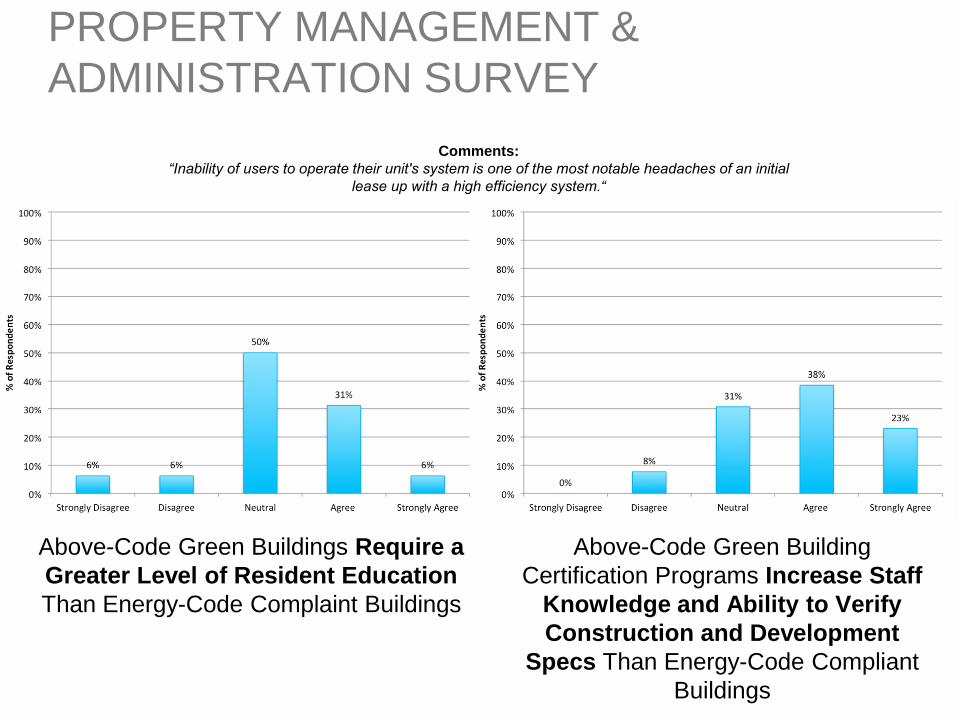
PROPERTY MANAGEMENT &
ADMINISTRATION SURVEY
Above-Code Green Buildings Require a
Greater Level of Resident Education
Than Energy-Code Complaint Buildings
Above-Code Green Building
Certification Programs Increase Staff
Knowledge and Ability to Verify
Construction and Development
Specs Than Energy-Code Compliant
Buildings
Comments:
“Inability of users to operate their unit's system is one of the most notable headaches of an initial
lease up with a high efficiency system.“

WEGOWISE

IMPACT OF GREEN AFFORDABLE
HOUSING REPORT
The final report will be released in September
2015
Please contact Alex Trachtenberg with any
inquiries
404-604-3592
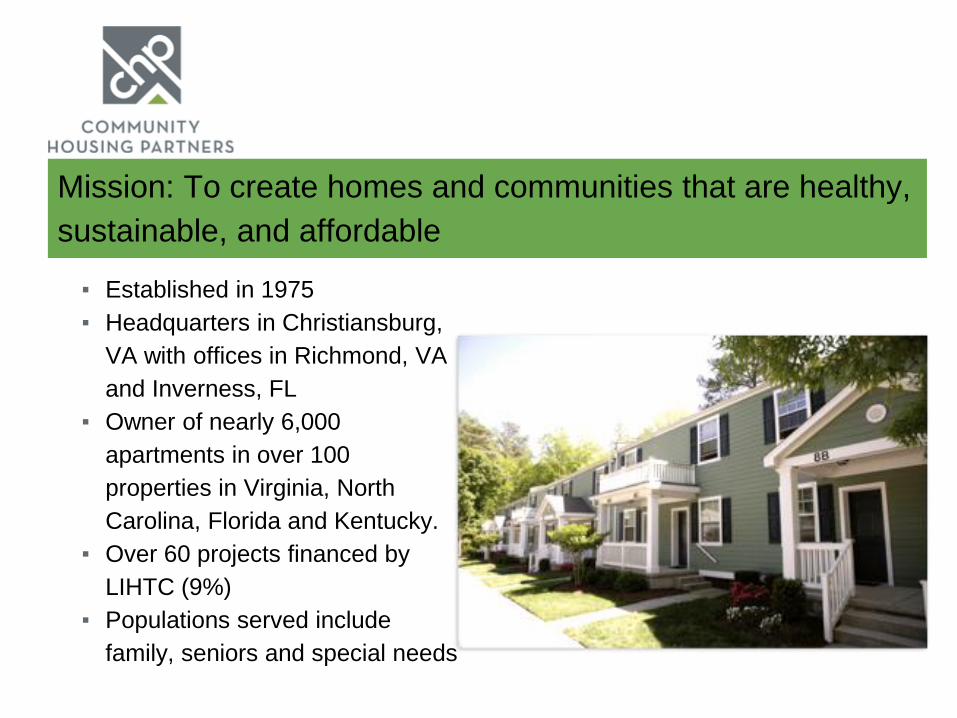
▪ Established in 1975
▪ Headquarters in Christiansburg,
VA with offices in Richmond, VA
and Inverness, FL
▪ Owner of nearly 6,000
apartments in over 100
properties in Virginia, North
Carolina, Florida and Kentucky.
▪ Over 60 projects financed by
LIHTC (9%)
▪ Populations served include
family, seniors and special needs
Mission: To create homes and communities that are healthy,
sustainable, and affordable

•Long-term commitment to green building and design
•First EarthCraft certified multifamily rehab in Virginia-2007
•Twelve CHP properties with over 1,000 apartments have received
EarthCraft certification
•CHP’s Richmond office building one of first in Virginia to receive
EarthCraft Light Commercial certification
•Served as architect and/or general contractor on nearly 20
EarthCraft certified multifamily properties for other owners
Lessons learned:
•Initial commitment based on mission
•Early expectation of energy savings based on the anticipated performance
of finished product
•Difficulty in developing and implementing methodology to measure savings
•Study by Virginia Tech Center for Housing Research and Housing Virginia in
2014 first demonstration of correlation between EarthCraft certification and
savings
•Importance of initial and ongoing resident training
•Anecdotal evidence of energy savings to residents resulting in modest asset
building and reduced rent delinquency