green and blue water resources and management scenarios ... · green and blue water resources and...
TRANSCRIPT

FutureWater
Costerweg 1V
6702 AA Wageningen
The Netherlands
+31 (0)317 460050
www.futurewater.nl
Green Water Management & Credits Toolbox China
Green and Blue Water Resources and
Management Scenarios using the SWAT model
for the Upper Duhe Basin, China -
Feasibility Study
November 2013
Commissioned by
Partners for Water, project PVWS12001
Authors
J. Brandsma
G.A.P.H. van den Eertwegh
P. Droogers
Z. Bai / ISRIC – World Soil Information
S. Zhang / ISRIC – World Soil Information
Report FutureWater 126

2
Table of contents
Preface 8
Executive summary 9
1 Introduction 11
1.1 Context 11 1.2 Principles of Green Water Credits 12 1.3 Study area and background 14
1.3.1 Problem definition and background of Danjiangkou catchment 14
1.3.2 Sub basin selection 16 1.3.3 Upper Duhe basin overview 17 1.3.4 Overall water balance 18 1.3.5 Sediment load at Zhushan gauging station – basin outlet 19
1.4 The project – a feasibility study 20
2 Methodology 22
2.1 Simulation model selection 22 2.2 SWAT 23
2.3 Data needs 25
3 Baseline Datasets 27
3.1 Introduction 27
3.2 Digital Elevation Model 27 3.3 Climate information 28
3.3.1 Data needs 28
3.3.2 Data sources 28
3.4 Land use 31 3.4.1 Processing of land use data 32
3.5 Soils 33
3.6 Discharge – outflow of basin 34 3.7 Reservoirs 35
4 Baseline modelling assessment 38
4.1 Introduction 38 4.2 Baseline model set-up 38
4.2.1 Basin delineation 38
4.2.2 Hydrological Response Units 39 4.3 Reservoirs 41 4.4 Climate data in SWAT 41
4.5 Model performance on outflow and sediment loads 41 4.6 Role of agriculture in GWC practices 46 4.7 Spatial analysis of calculation results 48
5 Future Management Options for GWC 56
5.1 Potential benefits upstream and downstream 56 5.2 From baseline model to scenario analysis 57 5.3 Selection of management options 58
5.3.1 Stone lines 58 5.3.2 Bench terraces 59
5.3.3 Contour tillage 60 5.3.4 Mulching 60

3
5.3.5 Forest management 61 5.4 Scenario analysis 61 5.5 Analysis of green water management options 63
5.6 Project targets, further steps, and outlook 64
6 Conclusions 67
7 Recommendations 69
8 References 70

4
Tables
Table 1: Land use change within Duhe catchment (Yan et al., 2013). ....................................... 14
Table 2: Location and elevation of the precipitation stations. ..................................................... 29 Table 3: Land use types and areal coverage (%) in the Duhe basin. ......................................... 32 Table 4: Soil hydrological groups and some characteristics. ...................................................... 34 Table 5: Statistics of soil type in the Upper Duhe basin. ............................................................. 34 Table 6: Major reservoirs in the Upper Duhe basin..................................................................... 36
Table 7: Parameters used for sensitivity analysis and model optimization with respect to stream
flow and water balance. ............................................................................................................... 42 Table 8: Parameters used for sensitivity analysis and model performance improvement with
respect to the calculated sediment load. ..................................................................................... 44 Table 9: SWAT – Model parameter values and changes for each of the green water
management scenarios. .............................................................................................................. 63 Table 10: SWAT – Adapted model parameters for the scenario forest management. ............... 63 Table 11: Key outcome indicators for green water management scenarios (averages for 2001-
2010 period). ............................................................................................................................... 64

5
Figures
Figure 1: Danjiangkou Reservoir or the Small Pacific at Danjiangkou City, Hubei province ...... 11 Figure 2: ‘Green Water Credits’ concept ..................................................................................... 12 Figure 3: Example of land erosion............................................................................................... 13 Figure 4: Basin selection for feasibility study. ............................................................................. 17 Figure 5: Digital Elevation Model (DEM) at 250m resolution ...................................................... 18
Figure 6: Yearly average measured stream flow at Zhushan gauging station in mm y-1
. ........... 19 Figure 7: Aerial averaged precipitation in Upper Duhe basin in mm d
-1. .................................... 19
Figure 8: Sediment load at Zhushan gauging station in ton y-1
................................................... 19 Figure 9: The Upper Duhe basin in China ................................................................................... 20 Figure 10: Schematisation of the water cycle. ............................................................................ 22
Figure 11: Main hydrological processes implemented in the SWAT model. ............................... 23 Figure 12: Schematisation of the SWAT sub-surface water fluxes. ............................................ 24
Figure 13: Parameterisation of crop production in SWAT. .......................................................... 25 Figure 14: Diagram of required data and modelling components for the GWC bio-physical
assessment for the Duhe basin. .................................................................................................. 25 Figure 15: Digital Elevation Model (DEM) of the Duhe basin at 250m spatial resolution. .......... 28
Figure 16: Locations of ground-based precipitation station and CFSR grid locations. ............... 30 Figure 17: Land use in Upper Duhe basin for year 1990, 2000, and 2007. ................................ 31
Figure 18: Soil types in the Upper Duhe watershed.................................................................... 33 Figure 19: Danjiangkou Reservoir (upper picture) and heightened dam, China, September 2012.
..................................................................................................................................................... 36
Figure 20: Location of the major reservoirs in the Upper Duhe basin. ........................................ 37
Figure 21: Locations of the 55 delineated sub-basins along with the derived streams. The
threshold for delineation was set at 10,000 ha. ........................................................................... 39 Figure 22: SWAT - hydrological response units (HRUs) in Upper Duhe basin. .......................... 40
Figure 23: Reservoir volume vs. surface area. ........................................................................... 41 Figure 24: Upper Duhe basin, annual water balance terms in mm y
-1 (1980-2010). PCP for
precipitation, ET for evapotranspiration, Q for outflow, and DS for storage change. .................. 43 Figure 25: Correlation between simulated (X-axis) and measured discharge (Y-axis) at Zhushan
station. Data period 2001-2010, monthly data. ........................................................................... 43
Figure 26: Observed and simulated stream flow at Zhushan station in MCM (106 m
3) for the
2001-2010 period. ....................................................................................................................... 44 Figure 27: Observed and simulated sediment load (tons/month) at Zhushan station before
optimization of baseline model. Data period 1980-2010. ............................................................ 44
Figure 28: Measured and simulated sediment load in (tons/month) at Zhushan gauging station
with optimized baseline model. Data period 1980-2010. ............................................................ 45 Figure 29: Correlation between simulated (X-axis) and measured sediment load (Y-axis) at
Zhushan gauging station. Data period 2001-2010, monthly data. .............................................. 45 Figure 30: Annual evapotranspiration (ET) in (mm y
-1), split into plant transpiration (T) and soil
evaporation (E) for each land cover class, average data for 2001-2010 period. ........................ 47
Figure 31: Water entering the drainage network and rivers by groundwater recharge, surface
runoff, and lateral drainage. Average calculated data for 2001-2010 period. ............................. 48
Figure 32: Total calculated sediment loss in terms of gross annual erosion rates per land use
class. Average data for 2001-2010 period. ................................................................................. 48 Figure 33: Annual precipitation, averaged over the period 2001-2010. ...................................... 49 Figure 34: Annual evapotranspiration (ET), averaged over 2001-2010. ..................................... 50

6
Figure 35: Annual plant transpiration (T), averaged over 2001-2010. ........................................ 51 Figure 36: Annual soil evaporation (E), averaged over 2001-2010. ........................................... 51
Figure 37: Transpiration (T) as percentage of total evapotranspiration (ET), averaged over the
2001-2010 period. ....................................................................................................................... 52 Figure 38: Annual blue water yield as the sum of runoff, sub-surface drainage flow, and base
flow, averaged over 2001-2010. .................................................................................................. 53 Figure 39: Annual groundwater recharge, averaged over 2001-2010. ....................................... 54 Figure 40: Annual sediment yield by erosion, averaged over 2001-2010. .................................. 55 Figure 41: GWC - The four domains. .......................................................................................... 56 Figure 42: GWC - Examples of potential upstream and downstream benefits. .......................... 57
Figure 43: GWC - Example of stone lines (source: www.wocat.net). ......................................... 59 Figure 44: GWC - Example of bench terraces (source: www.wocat.net). ................................... 59 Figure 45: GWC - Example of contour tillage (source: www.wocat.net). .................................... 60 Figure 46: GWC - Example of Mulching with rice residues. ........................................................ 61
Figure 47: GWC - Example of forest management ..................................................................... 61 Figure 48: Blue water and SWAT output - sum of surface runoff, lateral drainage, and
groundwater discharge. ............................................................................................................... 62
Figure 49: GWC-overview. ......................................................................................................... 65 Figure 50: Danjiangkou Reservoir - in and outgoing annual stream flow. .................................. 66

7
Abbreviations and Acronyms
APAR Absorbed Photosynthetical Radiation
AWC Available Water holding Capacity
CFSR Climate Forecast System Reanalysis
DEM Digital Elevation Model
EEA European Environment Agency
ENVISAT Environmental Satellite
ESA European Space Agency
eSOTER Soil and Terrain database
FAO Food and Agriculture Organisation
GAEZ Global Agro-ecological Assessment study
GLC2000 Global Land Cover 2000
GlobCover Global Land Cover Map
GOFC-GOLD Global Observation of Forest and Land Cover Dynamics
GSOD Global Summary of the Day
GWC Green Water Credits
HRU Hydrological Response Unit
HWSD Harmonized World Soil Database
ISRIC International Soil Reference and Information Center
LCCS Land Cover Classification System
LUE Light Use Efficiency
MRP Middle Route Project
MERIS Medium Resolution Imaging Spectrometer
NCDC National Climatic Data Center
NCEP National Center for Environmental Prediction
PTF Pedotransfer Functions
RMSE Root Mean Squared Error
SPAM Spatial Production Allocation Model
SRTM Shuttle Radar Data Topography
SWAT Soil and Water Assessment Tool
TRMM Tropical Rainfall Measuring Mission
UNEP United Nations Environment Programme
USDA – ARS Agricultural Research Service
USLE Universal Soil Loss Equation
WISE World Inventory of Soil Emission Potentials
WMO World Meteorological Organization
WOCAT World Overview of Conservation Approaches and Technologies

8
Preface
The Netherlands’ “Partners for Water” program has supported our project. This program states
the following:
‘The Netherlands has a solid reputation in water management. Its knowledge and
powers of innovation enable the Dutch water sector to make significant advances
internationally. We can achieve much more if we work together. This is why the
Partners for Water program brings the water sector together via networks, platforms
and other innovative forms of partnership. In addition, the program helps the water
sector tap into new markets. Through improved coordination and a joint approach, we
can ensure that the Netherlands, Water Management Nation, is placed firmly on the
map. Businesses, government agencies, NGOs and knowledge institutes with
international ambitions can apply to Partners for Water for subsidies to fund water
projects abroad. With its ‘Working with Water Worldwide’ (Wereldwijd Werken met
Water) subsidy scheme, the program supports the projects of cooperating parties from
the Dutch water sector in some 26 countries.’
A call for proposal was announced by “Partners for Water” in tender 2012-1. A consortium of
three Netherlands’ partners developed a proposal on request of two Chinese partners under the
name “Refinement and capacity building of green water management and credits toolkit for
China”. Our proposal was submitted on March, 7, 2012. The project was granted on 6-Jun-2012
and will run from 1-Jul-2012 to 31-Dec-2013.
The contract number is PVWS12001.
The project partners are:
Changjiang Water Resources Protection Institute of the Changjiang Water Resources
Commission, Wuhan, China.
Huazhong Agricultural University, Wuhan, China.
ISRIC-World Soil Information, Wageningen, The Netherlands.
FutureWater, Wageningen, The Netherlands.
Nelen&Schuurmans, Utrecht, The Netherlands.

9
Executive summary
The Green Water Credits (GWC) concept (www.greenwatercredits.net) is brought to China by
the Dutch consortium of ISRIC, FutureWater and Nelen-Schuurmans. The concept was
developed by ISRIC and allows quantification of erosion reduction, yield increase,
sedimentation amounts, water availability, and electricity production that is needed to calculate
the economic costs and benefits of environmental protection measures. This information allows
the development of a financial mechanism in e.g. river basins, based on upstream supply and
downstream demand of water services for long term investments in communities. In order run
this concept, an analytical toolkit in combination with adequate database resources and know
how is necessary. The toolkit consists of two simulation models, SWAT and WEAP, and a data
and presentation portal Lizard. GWC for a region can only be developed and implemented by a
team of experts from ISRIC/FutureWater and a strong leveled local counterpart.
For this report, we have performed the biophysical modelling using the SWAT model for the
Upper Duhe basin, part of the Danjiangkou Reservoir catchment area. We have quantified the
GWC-measures and effects on hydrology and erosion within the basin, in both space and time.
This leads to scenario development in case policy makers want to preview results of future
measures to be taken to e.g. generate more blue water and reduce sediment loads of Upper
Duhe.
The calculation results of this demonstration project for the five GWC-interventions are plausible
and mutual consistent. Based on the model calculations for the agricultural area, it can be
concluded that for the overall Upper Duhe basin, the proposed GWC-measures will lead to
further reduction of soil erosion and sediment loads to the streams. At the basin scale, there is
little effect on blue water volumes generated for downstream use. The green water that is
generated by the measures because of reduced surface runoff and increased groundwater
recharge, leads to increased plant transpiration i.e. crop production. This benefits the local
farmer’s income, and does not increase the downstream blue water. The overall influence of
measures taken in the agricultural area on the Upper Duhe basin as a whole is basically a
matter of area, with agriculture covering less than 6% of the surface area. On the contrary, the
forest land covers about 76%. Any significant measure taken in this area to decrease
evapotranspiration and keep the erosion protection of forest land, will lead to increased blue
water production for downstream use. Locally, improved agricultural practices by incorporating
GWC-measures will lead to small changes in evaporation and transpiration, but to larger
reductions of surface runoff, to less erosion, and to increased groundwater recharge.
We have used regional data and on-site knowledge, provided for by our Chinese partners in
good cooperation. We have processed these data to be used in the modelling environment. The
partnership between the CWRPI and HAU and our consortium has been set up and works
efficiently and effectively. In a parallel process, we have been working on capacity building and
training of employees of our Chinese partners. Currently, we are investigating and exploring
possibilities of generating follow-up projects together with our partners through various funding
channels. This would allow us to further work together on solutions, based on tools that work,
for the water challenges that China faces.
It is important that the follow-up of this demonstration project, using the initial results, leads to
further exploration of the GWM&C concept within the Chinese legal framework for eco-
compensation. Also, the credits of green water in China should be addressed in the framework

10
of effective use of the water from the Changjiang Basin. Possibly, a water service market should
be combined with payments and supervision by the national or regional governments. Finally,
international cooperation appeared fruitful in this project.

11
1 Introduction
1.1 Context
The Changjiang (Yangtze River) provides water for the Middle Route Project (MRP) for South-
to-North Water Transfer. This water will be extracted from the Danjiangkou Reservoir, situated
in the Danjiangkou City, Hubei province, which will divert water from Danjiangkou Reservoir on
the Hanjiang (Han River), a tributary of Changjiang River, to Beijing City through canals along
Funiu and Taihang Mountains. Heightening the Danjiangkou Dam will increase the ability for
flood control of middle and lower Hanjiang (Han River) and assure the safety of Wuhan City and
the plain in the north of Hanjiang Basin.
Figure 1: Danjiangkou Reservoir or the Small Pacific at Danjiangkou City, Hubei province
The Duhe basin is one of the contributors to the Danjiangkou Reservoir. Within the Duhe basin,
the pressure on the water resources is increasing as large scale water allocation is planned
within the South-to-North Water Transfer. Water efficiency is getting more and more important
to increase the amount of water available for downstream users and to increase the inflow of
Danjiangkou reservoir. Over the last three decades, the Chinese government has been
preparing the transfer, and several measures have been taken to reduce the pressure on the
water. Mainly land use has been changed, forest area increased, and the area of cultivated land
decreased by over 40% from 1978 to 2007 (see Table 1). People have been actively stimulated
to move from the rural area towards the urban areas. However, the separate effects of these
measures are unclear and measurements show that stream flow decreased over the last
decades (see Figure 6). Major problems identified remain the erosion rate, the loss of fertile soil,
the corresponding sedimentation of reservoirs, and the amount of water available for
downstream users.

12
A mind-shift is necessary regarding the way we think about water and agriculture, instead of a
narrow focus on utilisation of surface water and groundwater. It is important to be aware that
precipitation is the ultimate source of water that can be managed. There is high potential to
improve the use and management of rainwater in upstream rain-fed agriculture: this is termed
green water management (see Figure 3). Current land management practices by farmers show
loss of rainwater by (i) surface runoff, enhancing both flash floods and erosion (see Figure 2),
and (ii) losses of water by evaporation directly from the soil, not by plant transpiration.
The knowledge and tools to improve upstream management and land use in arable, range and
forest areas are available, but these need to be more widely implemented. Upstream land users
can effectively provide rainwater management services to water users downstream, to improve
the available blue water resources in terms of quantity and quality.
The implementation of green water management options can enhance water availability, but
farmers need incentives to put them in place. At the same time, downstream users may be
unaware of the benefits they can gain through farmer’s implementation of these measures in
upstream areas. This is the reason why part of the ‘Green Water Credits’ concept is about
upstream and downstream cooperation (www.greenwatercredits.net).
Figure 2: ‘Green Water Credits’ concept
1.2 Principles of Green Water Credits
The 'Green Water Credits' concept (GWC) aims first and foremost to create a sustainable
relationship between the beneficiaries of watershed development and those who carry out the
management, to encourage a financial relationship with the latter. The GWC system therefor
enhances a payment system which rewards the people in rural areas which implement the
green water measures, and carry out the soil and water management.
The watershed management is to reduce runoff and promote infiltration of precipitation to
reduce water erosion. The water running off loosens soil particles, reducing soil fertility and
increasing turbidity of the water. These transported solids settle downstream in the reservoirs of
13
dams and reduce their ability to regulate water intake. When the ratio of infiltrated water and
rainfall improves, the residence time of water in the watershed grows, floods are reduced, the
erosive power of rain is reduced, plant production increases, which increases the resistance to
soil erosion on the one hand and soil fertility on the other. In other words, increase the
proportion of infiltrated water precipitated improves the quality of water from the catchment and
reduces siltation of reservoirs and dams. The connection between the concept of green water
and basin-scale water management is direct. Green water is infiltrated water used preferably for
biomass production where it falls as precipitation. Green water should be used for plant
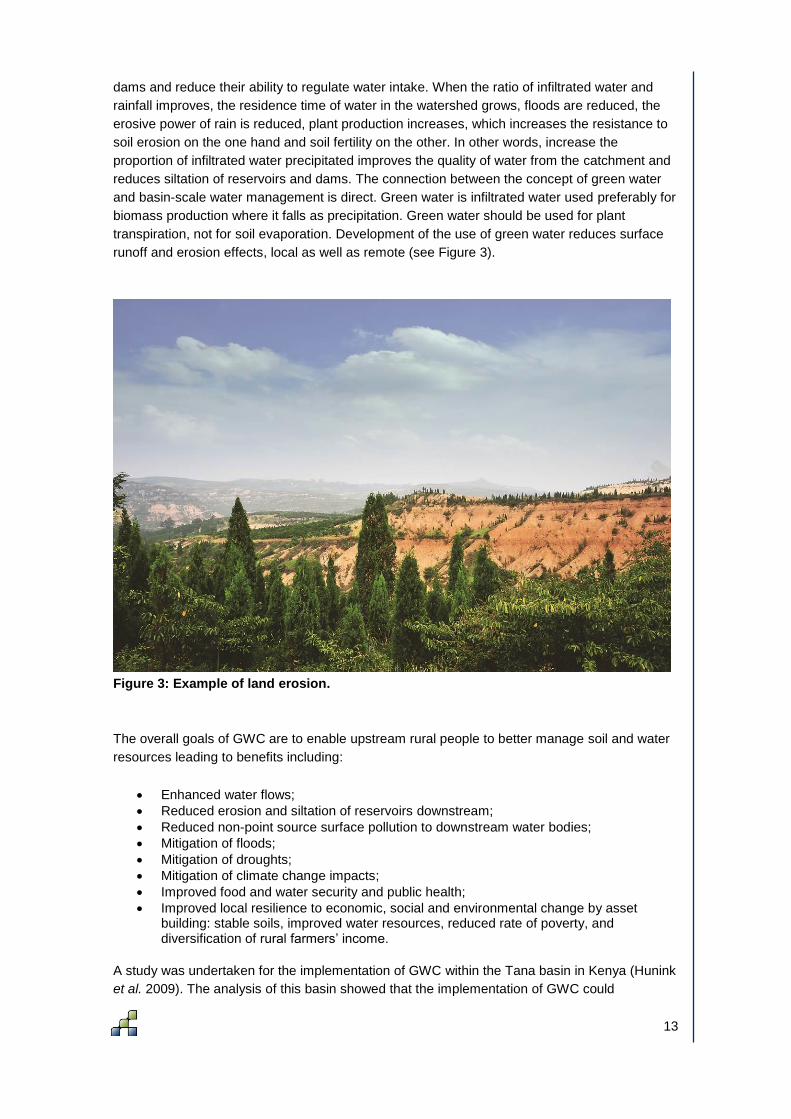
transpiration, not for soil evaporation. Development of the use of green water reduces surface
runoff and erosion effects, local as well as remote (see Figure 3).
Figure 3: Example of land erosion.
The overall goals of GWC are to enable upstream rural people to better manage soil and water
resources leading to benefits including:
Enhanced water flows;
Reduced erosion and siltation of reservoirs downstream;
Reduced non-point source surface pollution to downstream water bodies;
Mitigation of floods;
Mitigation of droughts;
Mitigation of climate change impacts;
Improved food and water security and public health;
Improved local resilience to economic, social and environmental change by asset building: stable soils, improved water resources, reduced rate of poverty, and diversification of rural farmers’ income.
A study was undertaken for the implementation of GWC within the Tana basin in Kenya (Hunink
et al. 2009). The analysis of this basin showed that the implementation of GWC could

14
significantly reduce problems related to the growing demands for hydropower generation, and of
both municipal water utilities, and irrigators. Different green water management options were
analysed, which showed that considerable improvements could be obtained in terms of water
security for both upstream as well as downstream stakeholders.
Table 1: Land use change within Duhe catchment (Yan et al., 2013).
Land use types 1978 1987 1999 2007 Change rates
(1978−2007)
(%) (%) (%) (%) (%)
water body 0.4 0.4 0.3 0.3 -25
residential area 0.8 0.9 1.1 1.4 +75
bare soil 0.3 0.4 0.4 0.7 +133
forest land 70.9 70.4 69.3 76.2 +7.5
shrub land 10.2 10.4 9.4 9.5 -6.9
grassland 7.6 7.3 5.9 6.1 -19.7
arable land 9.8 10.2 13.6 5.8 -40.8
1.3 Study area and background
1.3.1 Problem definition and background of Danjiangkou catchment
Danjiangkou Reservoir Dam is situated in the Danjiangkou City, Hubei province. It is the water
source for the Middle Route Project (MRP) for South-to-North Water Transfer which will divert
water from Danjiangkou Reservoir on the Hanjiang (Han River), a tributary of Changjiang River,
to Beijing City through canals along Funiu and Taihang Mountains. The MRP will mitigate the
crisis of water resources in Beijing, Tianjin and North China, and increase irrigated area by 0.6
million ha, 6.4 billion m3 for municipal and industrial water supply, 3.0 billion m
3 for agriculture,
for Beijing, Tianjin, Hebei and Henan provinces, and significantly improve the biological
environment and investment environment of receiving areas, and boost the economic
development in China.
Heightened the Danjiangkou Dam will increase the ability for flood control of middle and lower
Hanjiang and assure the safety of Wuhan City and the plain in the north of Hanjiang Basin
(http://www.nsbd.gov.cn/zx/english/mrp.htm).
Hanjiang, upper Danjiangkou Reservoir, is approximately 925 km in length; catchment area is
91,388 km2, of which 62,263 km
2 in Shanxi Province, 7,911 km
2 in Henan Province and 21,214
km2 in Hubei Province. It covers three provinces, six cities and 33 counties (see Figure 8).
Distributing in the surroundings of Danjiangkou Reservoir, upper and middle stream of the
Hanjiang, catchments of Xunhe River and Jinqian River, valley of Hanjiang, the peripheral area
of Hanzhong Basin and the area of Hanjiang head.
There are various issues on the protection and management of eco-environment of the water
resources of the Danjiangkou Reservoir:

15
Vulnerable ecosystems: In the Qinling and Bashan rocky mountain region in the
Reservoir Basin, soil is thin, eco-environment is frail, and soil erosion and water loss is
severe. Spatial distribution of soil erosion corresponds to population density, mainly
distributing in the surroundings of Danjiangkou Reservoir, upper and middle stream of
the Han River, catchments of Xun River and Jinqian River, valley of Han River, the
peripheral area of Hanzhong Basin and the area of Han River head. With increasing
population and human activities in the region, soil erosion will no doubt be worsening:
rocky desertification, lessening water source resulting in increase of river
sedimentation, pollution of water resources. If the current situation could not be
mitigated now, The Middle Route Project (MRP) for South-to-North Water Transfer
would be at risk.
Vulnerable environmental supporting capacity: In the surroundings of the Danjiangkou
Reservoir, the submergence intensified conflict between population and arable land,
e.g., in the Shiyan City region, average arable land per capita is only 0.92 mu (1 ha
equals 15 mu), less than the average of the nation-wide (1.43 mu), Hubei provincial
mean (0.96 mu). Immigration from the submerged area also caused problem that some
immigrants return home from the new setting places because of un-acclimatization.
Serious water pollution: Due to the historical and some objective reasons, the Reservoir
receives large amounts of waste water derived from upstream industrial development
and sewage. Recent monitoring at the 20 cross-sections on the 16 distributaries flowing
into the Reservoir indicates that the water quality at 12 cross-sections (60% of all the
sections) belongs to the standard of Grade IV; 8 sections belong to V or worsening.
Organic pollutants, phosphorus and nitrogen are dominant; eutrophication is
approaching due to increasing “non-point source” pollution from cultivated land e.g.,
chemical fertilizer, pesticide application. In addition, rapid development of fishery
cultivation in the Reservoir also pollutes the Reservoir water quality.
Lagged economic development: Poverty appears in the most region of the Reservoir
Basin. There is a prominent contradiction between local economic development and
water source protection: the central government has formulated and implemented
series strict policies and regulations on energy saving and CO2 reduction for
environmental protection; concrete standards have been implemented, which have
restricted the local economic development by forbidding mining and so on; the mining
industries and companies which could not meet the standards have to be closed
leading to reduction of local government’s treasury and lots of jobless, taking Hanzhong
City as an example: due to the limitation, Hanzhong City reduces industrial GDP
US$140 million, lessens profits and taxes US$ 13million, jobless 22,000.
All these eco-environmental issues are greatly affecting the protection of the Reservoir at
source.

16
1.3.2 Sub basin selection
During the project’s kick-off meeting in Wuhan, China on 17-21 September 2012, the selection
for the Upper Duhe catchment was made. During a field visit to the Danjiangkou reservoir Dam
an interactive session with delegates from all partners and local experts decided that the Upper
Duhe catchment was most suitable for the demonstration of the GWC concept as the catchment
was representative for the greater Danjiangkou catchment, and data sources where available to
carry out the study. Also, Chinese partners have already been studying the Upper Duhe basin,
looking at land use, streamflow, and soil losses by erosion. In Figure 4 an overview is given
from China, Yangtze River basin, the Danjiangkou Reservoir and its Upper Duhe sub-basin.
Discussion at the Danjiangkou Reservoir on sub basin selection in September 2012.

17
Figure 4: Basin selection for feasibility study.
1.3.3 Upper Duhe basin overview
The Upper Duhe catchment is situated in the upstream part of the Hanjiang basin and covers an
area of 9,027 km2. The most downstream point in the catchment is the Zhushan gauging
station. The elevation ranges between over 3000 m in the South and South-West and goes
down towards 280 m at Zhushan (see Figure 5). The source of the Duhe is situated in the Daba
Mountains and after a 354 km course the river joins the Hanjiang (Yan et al., 2013). The
average slope of the Duhe is 4.8%. The topography in the area is undulating, in the Southern
part slopes are steepest reaching op to over 80% and in the Northern lower part slopes are
more gentile with mostly under 10%. The area has a typical sub-tropical monsoon climate, for
which the mean annual temperature over the past 50 years has varied between 12.4 and
18.4ºC. Annual rainfall has varied between 728 and 1480 mm with a mean annual precipitation
of 973mm of which over 80% falls in the monsoon (June – October). Soils in the northern part
are predominantly classified as Yellow-brown-earths with over 70% of the total area. In the
southern part Brown earths are more regular, and limestone soils cover another 5% of the total
area. (National Soil Survey Office, 1992) The dominant land use types are forest and shrub
land; villages, small towns and agricultural land are concentrated along the river. The major
arable crops are corn and wheat (Yan et al., 2013).

18
Figure 5: Digital Elevation Model (DEM) at 250m resolution
1.3.4 Overall water balance
Over the last two to three decades measures have been taken within the Duhe basin to improve
water availability and water quality, besides soil conservation. However these measures have
not resulted in a higher stream flow and water for downstream users became even scarcer.
Figure 6 shows a downwards trend of the average flow at Zhushan station over the last 30
years. However, this downward trend is mainly caused by the relatively high discharges from
1980-1985. Meanwhile the average precipitation over the nine gauging stations show a
complete flat trend line, so the downwards flow trend cannot be explained by a decrease in
precipitation and must be caused by a higher evapotranspiration or storage change. During the
GWC project the aim is to find sustainable measures which increases the stream flow and
decreases evaporation.
The overall water balance (1980-2010) of the Upper Duhe basin shows that roughly 60% of the
total precipitation returns as stream flow (blue water), 40% is captured by evapotranspiration
(green water). The 40% evapotranspiration of water is the so-called working space which
determines the limit of how much extra stream flow or blue water may be generated with the
correct measures. To define measures, splitting of evapotranspiration into soil evaporation and
plant transpiration is needed and will gain insight in the water balance terms. This plant
transpiration is strongly related to crop production in agriculture.

19
1.3.5 Sediment load at Zhushan gauging station – basin outlet
Erosion and sedimentation are important aspects within the GWC concept. By decreasing
surface runoff, water can be stored as green water source in the soil and the soil can be
conserved. The measures which the government has been implementing over the last decades
resulted in a reduced sediment load at Zhushan gauging station (see Figure 8). Erosion
decreasing measures include the land use change from cultivated land to forest (see Table 1).
The downward trend in sediment load shows that achievements has been made so far and that
any further GWC measures should aim in continuing this trend.
Figure 6: Yearly average measured stream flow at Zhushan gauging station in mm y-1
.
Figure 7: Aerial averaged precipitation in Upper Duhe basin in mm d-1
.
Figure 8: Sediment load at Zhushan gauging station in ton y-1

20
Figure 9: The Upper Duhe basin in China
1.4 The project – a feasibility study
The GWM&C approach is a unique knowledge point of the consortium partners. In order to have
concrete outputs and quantified results, as required to implement the GWM&C approach, the
GWM&C-Toolkit will be used. The toolkit needs to be refined to the Chinese conditions. It is a
combination of three components: (i) data resources, (ii) analytical assessment tools, and (iii)
presenting and decision system.
(i) The data resources are inter-linked and include all the GWM&C knowledge that has been
obtained by the consortium over the last decades. These knowledge databases are being used
for new GWM&C projects and are still expanding. The data in these database can be used
freely, however the use of the information stored in these database required advanced
knowledge available at the consortium.
(ii) The analytical assessment tools are computer simulation models that provide support to
policy and decision makers to support them in their role to make sound decisions in what the
impact will be of implementing GWM&C and where the most promising areas are located.
(iii) The presentation and decision part of the GWM&C Toolkit is essential to show and present
in a convincing way what the impact of certain decision will be. The Lizard tool is the backbone
of this presenting system.
This study has been performed within the Partners for Water project PVWS12001 ‘Refinement
and Capacity Building of Green Water Management & Credits Toolkit for China’. The project
has two components, the feasibility study and capacity building. This report is on the feasibility

21
study, and more specific on the analytical / biophysical assessment tool SWAT. This regional-
scale simulation model allows us to quantify the effect of separate measures taken or to be
taken in basin areas in terms of water flow and erosion and sediment transport.
This report will show the feasibility of the use of the simulation model SWAT to evaluate and
predict effects of GWM&C-measures on the water and sediment resources by different water
and soil management practices. These models can be applied to several basins, feeding the
Danjiangkou Reservoir. For the feasibility study, the Upper Duhe basin was chosen as the study
area. In the next chapters, we will present the methodology and the model concept (Chapter 2),
data needed (Chapter 3), and the baseline model for the situation at present (Chapter 4). The
scenario analysis calculations are based on the baseline model, which will be adapted
according to measures proposed (Chapter 5).

22
2 Methodology
2.1 Simulation model selection
The circulation of water within the earth and atmosphere is a complex mechanism of energy
exchange and different ways of transportation. A schematisation of the different processes
involved in the water cycle is shown in Figure 10. Hydrological models are a tool to simulate
these paths of water movement under different conditions. They are used to study, for example,
the impact of climate change on water availability, the impact of land use change on river
discharges, and the impact of (agricultural) management strategies on water availability and
sediment yield.
Figure 10: Schematisation of the water cycle.
Currently, a huge number of hydrological models are available to analyse soil-water
relationships at the field and catchment/basin level. For the current study, the Soil and Water
Assessment Tool (SWAT) (Gassman et al. 2007) was chosen to evaluate the impact of crop-
land-soil management on downstream water and sediment flows. SWAT (version 2005) was
chosen because it is a basin-scale model, which is able to quantify the impact of land
management practices in large, complex watersheds.
The main advantage of SWAT for the exploration of GWC in the Duhe basin is that SWAT uses
a physical-based rainfall-runoff scheme, instead of a purely data-based statistic or conceptual
scheme. This guarantees more reliable scenario simulations and better performance in poorly
gauged catchments, which is essential for a study at this scale. Besides, the model is primarily
focused on the interaction between land management versus water-and erosion processes.
This makes the tool appropriate for this study, as it is able to represent and simulate the impact
of land management practices on basin-scale water and sediment yields.

23
In brief, strong aspects of the SWAT model that make it suitable for the current project can be
summarised as:
Physical-based rather than parametric-based rainfall-runoff scheme to ensure more
reliable scenario simulations.
Focus on water-erosion-land management processes.
Public domain, including source code.
User-friendly interface.
Large user-group worldwide.
Excellent documentation, including training materials.
Consortium’s extensive experiences in application as well as training.
Modelling experience with previous Green Water Credits assessments in Kenya
Morocco and Algeria. (Kauffman et al. 2007; Hunink et al. 2009). The relevant
components of SWAT for this study will be described in the following paragraphs.
2.2 SWAT
SWAT is a distributed, regional-scale basin model developed originally by the USDA
Agricultural Research Service (ARS) and Texas A&M University and is currently one of the
world’s leading spatially distributed hydrological models. A distributed rainfall-runoff model –
such as SWAT – divides a catchment into smaller discrete calculation units for which the spatial
variation of the major physical properties are limited and hydrological processes can be treated
as being homogeneous. The total catchment behaviour is a net result of manifold small sub-
catchments. The soil map and land cover map within sub-catchment boundaries are used to
generate unique combinations, and each combination will be considered as a homogeneous
physical entity, namely a Hydrological Response Unit (HRU). The water balance for HRUs is
computed on a daily time basis. Hence, SWAT disaggregates the river basin into units that have
similar characteristics in terms of soil, land cover, and that are located in the same sub-
catchment.
Figure 11: Main hydrological processes implemented in the SWAT model.

24
Irrigation in SWAT can be scheduled by the user, or automatically determined by the model
depending on a set of criteria. In addition to specifying the timing and application amount, the
source of irrigation water must be specified, which can be canal water, a reservoir, a shallow
aquifer, a deep aquifer, or a source outside the basin.
SWAT can deal with standard groundwater processes (see Figure 11). Water enters
groundwater storage primarily by infiltration/percolation, although recharge by seepage from
surface water bodies is also included. Water leaves groundwater storage primarily by discharge
into rivers or lakes, but it is also possible for water to move upward from the water table into the
capillary fringe, i.e. capillary rise. As mentioned before, water can also be extracted for irrigation
purposes. SWAT distinguishes recharge and discharge zones.
Recharge to unconfined aquifers occurs via percolation of excessively wet root zones.
Recharge to confined aquifers by percolation from the surface occurs only at the upstream end
of the confined aquifer. Where the geologic formation containing the aquifer is exposed at the
earth’s surface, flow is not confined, and a water table is present. Irrigation and link canals can
be connected to the groundwater system; this can be an effluent as well as an influent stream.
After water has infiltrated into the soil, it can leave the ground again as lateral flow from the
upper soil layer – which mimics a 2D flow domain in the unsaturated zone – or as return flow
that leaves the shallow aquifer and drains into a nearby river (see Figure 12). The remaining
part of the soil moisture can feed into the deep aquifer, from which it can be pumped back. The
total return flow thus consists of surface runoff, lateral outflow from root zone and aquifer
drainage to river.
Figure 12: Schematisation of the SWAT sub-surface water fluxes.
For each simulation day, potential plant growth, i.e. plant growth under ideal growing conditions,
is calculated. Ideal growing conditions require adequate water and nutrient supply and a
favourable climate. First the Absorbed Photosynthetical Radiation (APAR) is computed from
intercepted solar radiation, followed by a Light Use Efficiency (LUE) that, under SWAT, is
essentially a function of carbon dioxide concentrations and vapour pressure deficits. The crop
yield is computed as the harvestable fraction of the accumulated biomass production across the
growing season (see
Figure 13).

25
Figure 13: Parameterisation of crop production in SWAT.
2.3 Data needs
An overview of the data required to perform the biophysical assessment is provided for in Figure
14. The datasets were requested and obtained from the Chinese counterparts and evaluated,
as described in the following sections. In addition, the remainder of the data necessary for the
schematisation of the model was obtained from global public domain datasets.
It was discussed with the local counterparts that the time resolution of the climate-data needs to
be daily data. These data need to be from various weather stations, well-distributed throughout
the basin, both from mountain areas as well as downstream locations.
Figure 14: Diagram of required data and modelling components for the GWC bio-physical
assessment for the Duhe basin.
The following sections will describe the datasets that have been evaluated and prepared for the
assessment. The main datasets that are discussed are:
Digital Elevation Model (DEM)
Climate information

26
Land use and management
Soil types and properties
Streamflow gauging stations
Reservoir location, volume, management

27
3 Baseline Datasets
3.1 Introduction
For the Green Water Credits concept it is crucial to fully understand and quantify the up- and
downstream interactions in terms of water flows and sediment transport. Consequently good
data on the interfering variables of the current situation are needed and must be analysed with
the appropriate tool. As was mentioned before, the SWAT model is used in this study to analyse
the impacts of land use management strategies on the water and sediment dynamics in the
Upper Duhe basin.
The current chapter describes the available datasets which were used to build-up the distributed
hydrological model in the Upper Duhe basin. Different datasets are available, which are
compared and evaluated in order to make an appropriate dataset selection to obtain optimal
accuracy in the quantification of the interactions relevant for the scope of Green Water Credits.
3.2 Digital Elevation Model
Digital elevation data for Duhe watershed were obtained from the Shuttle Radar Data
Topography Mission (SRTM) of NASA’s Space Shuttle Endeavour flight on 11-22 February
2000 and shown in Figure 15. SRTM data were processed from raw radar echoes into digital
elevation models (DEM) at the Jet Propulsion Laboratory2 (JPL) in California.
SRTM data at a spatial resolution of 3 arc-second (90 meters) are available for global coverage
between latitude 60 degrees North and 56 degrees South. This product consists of seamless
raster data and is available in geographic coordinates (latitude/longitude), and is horizontally
and vertically referenced to as the EGM96 Geoid (Lemoine et al., 1998). The SRTM-DEM data
were obtained using the Data Distribution System of CIAT (http://srtm.csi.cgiar.org/) where the
original DEMs were further processed to fill in these no-data voids. This involved the production
of vector contours and points, and the re-interpolation of these derived contours back into a
raster DEM. These interpolated DEM values are then used to fill in the original no-data holes
within the SRTM data. These processes were implemented using Arc/Info and an Arc Macro
Language AML script. The DEM was resampled to the Lambert Conformal Conic 3 projection
with a resolution of 250 m using a bilinear algorithm. Finally it was clipped to the boundary of
the basin, and sink were filled using the method of Tarboton et al. (1991) with a threshold of 20
m.
The elevations in the Duhe watershed range between 141 m and 2944 m. Large gradients are
found: highest in the Wudang mountains in the south-western, southern and north-eastern part
of the watershed. The lowest elevation of the watershed is 141 m, at Zhushan station. The
average DEM is about 1145 m (See Figure 15).

28
Figure 15: Digital Elevation Model (DEM) of the Duhe basin at 250m spatial resolution.
3.3 Climate information
3.3.1 Data needs
SWAT requires daily rainfall data, as well as other meteorological input data that depend on the
evapotranspiration method used. Several methods are available to calculate the potential
evapotranspiration. The most advanced method available, the Penman-Monteith method
(Monteith et al., 1965), requires data on temperature, solar radiation, wind speed, and humidity
for the calculation of the spatially distributed potential evapotranspiration rates. For this phase,
the Penman-Monteith method was used for the calculation of the potential evapotranspiration.
However, for the temperature, solar radiation, wind speed, and humidity data there are no
ground-based measurements available. A Climate Forecast System Reanalysis (CFSR) was
used to obtain these data (http://rda.ucar.edu/pub/cfsr.html).
3.3.2 Data sources
The data used for the SWAT model is a combination of locally obtained data and global climate
data from a Climate Forecast System Reanalysis. In the following paragraphs both will be
discussed.
3.3.2.1 Locally obtained climate data
Daily precipitation data at nine stations, seven (Guandu, Baofeng, Taoyuan, Qingu, Hongmiao,
Caijiaba, Huangjiawan) in the upper Duhe area and the another two (Yeda and Damuchang) in

29
the downstream of the Upper Duhe basin (see Figure 16) were provided by the Chinese
partners who collected the data from the Water Conservancy Department of Hubei province.
These daily data are time-series of precipitation for the period from 1965 to 2010. Precipitation
data at two stations (Laohekou and Wanyuan) which are outside the watershed were collected
for the period of 1951-2000. The location and elevation of the stations are show in Table 2. In
this study the precipitation from 1980-2010 were used.
Table 2: Location and elevation of the precipitation stations.
Precipitation station Longitude Latitude Elevation (m)
Guandu 110°05’E 32°00’N 345
Baofeng 110°00’E 32°19’ N 484
Taoyuan 109°49’ E 31°44’N 894
Qingu 109°50’ E 32°26’ N 570
Hongmiao 109°38’E 32°22’ N 525
Caijiaba 109°51’ E 32°01’N 676
Huangjiawan 110°01’E 31°35’ N 1305
Yeda 110°27’ E 32°33’ N 239
Damuchang 110°33’E 32°23’N 434
Laohekou 111°24’E 32°14’N 900
Wanyuan 108°12’E 32°24’N 674

30
Meteorological station at the bank of the Danjiangkou Reservoir.
Figure 16: Locations of ground-based precipitation station and CFSR grid locations.

31
3.3.2.2 CFSR climate data
For the period (1980-2010) daily precipitation, daily minimum and maximum air temperature
data, daily humidity data, daily wind speed data and daily solar radiation data are required for
the SWAT model. We use gridded air temperature extracted from the PRINCETON Global
Meteorological Forcing Dataset for land surface modelling (PRINCETON) (Sheffield et al.,
2006]. The PRINCETON dataset is constructed by combining a suite of global observation-
based datasets with the National Center for Environmental Prediction – National Center for
Atmospheric Research (NCEP– NCAR) reanalysis. The data is available at 0.5° x 0.5° spatial
resolution (see also grid in Figure 16).
3.4 Land use
Land use data for the years of 1990, 2000 and 2007 were provided for by the Huazhong
Agricultural University (see Figure 17). The land use data of the year 2007 were used as an
input data in this study, because our simulation period is 2001-2010.
Figure 17: Land use in Upper Duhe basin for year 1990, 2000, and 2007.

32
The data were produced using the satellite images of Landsat TM 5 and 7 at 30m spatial
resolution. Landsat TM 7 was launched on 15th April, 1999, which was operated and managed
by NASA in California. The Landsat TM 7 is a sun-synchronous orbit satellite, at altitude of 705
km, which covers the entire globe every 16 days (except for the highest polar latitude). The
Inclined is 98.2°. The sensors of Landsat TM 7 are Enhanced Thematic Mapper Plus, which
produces satellite images resolution in 30m*30m with eight spectral bands, including a
panchromatic and thermal band. The Scene size is 170 km*185 km. These photos are aimed to
provide up-to-date and cloud-free image (USGS, 2013).
3.4.1 Processing of land use data
The satellite images were classified in ERDAS Imagine 9.2 according to the Current Land Use
Condition Classification for National Standard of the People’s Republic of China (China's
National Standard (GB/T 21010 -2007) by the following steps:
All data were re-projected to WGS_1984_UTM_Zone_49N;
The data were clipped for the Duhe watershed;
According to the classification system, the data were classified using supervised
classification and visual interpretation;
Draw the boundaries of the land use and added the labels of the polygons to produce
digital map;
Edit and compile the vector digital maps;
The processed data were converted to 250 m grids using nearest neighbour’s
resampling.
The error from Landsat TM data interpretation was estimated by sampling frames. For each 7
km, a 200 m width sampling frames was built. Seven land use classes were identified in the
study area and shown in Table 3. In the National Standard Land Use Condition Classification,
cultivated land is defined as all agricultural lands, including permanently cultivated land, new
cultivated land, paddy, grassland-farming rotated land and inter cropping land (crop-fruiter and
crop-mulberry). Grasslands include dense, moderate and sparse grass. Water bodies include
stream, rivers, reservoir and ponds (Chen and Zhou, 2007). In Duhe watershed, forest lands
account for most of the total area, i.e., more than 70% of the total area, followed by bush fallow,
grassland, cultivated land; water body, residential area took up only around 2% of the total area.
Table 3: Land use types and areal coverage (%) in the Duhe basin.
Land use class Area (km2) % of total area SWAT_name Code
Water body 31 0.35% WATR 11
Residential area 113 1.26% PLAN 21
Bare land 61 0.68% BARE 31
Forest land 6852 76.36% FRST 41
Bush fallow 845 9.41% RNGB 51
Grassland 553 6.16% RNGE 81
Cultivated land 519 5.78% AGRL 82
Total 8973 100%

33
3.5 Soils
Soil data for Duhe watershed, including soil types and properties, were obtained from the Soil
Survey Office of Hubei Province (Figure 18). The data were surveyed during the Second
National Soil Survey from 1979 and 1994 (Shi et al., 2004). Soil types in the Duhe watershed
are shallow and vary in space due to diverse parent materials. According to the Chinese Soil
Classification System (National Soil Survey Office, 1992), the soil types include yellow-brown
earths, brown earths, limestone soils, paddy soils, dark-brown earths, purplish soils, fluvo-aquic
soils and meadow soils. These soil types were converted to the USA Soil Taxonomy (Shi et al.,
2010).
Given the fact that most soils are shallow and based on rocky sediments, a regional-scale
aquifer system is assumed to be absent or not relevant enough to play a significant role in the
hydrology of the Upper Duhe basin.
Figure 18: Soil types in the Upper Duhe watershed
The soil chemical properties are relevant to water quality and used in the SWAT model. The soil
physical properties affect water cycle in simulation process. They are 1) soil layers (NLAYERS);
2) the maximum root depth in soil profile (SOL_ZMX); 3) the depth between soil surface and soil
basement (SOL_Z); 4) soil saturated hydraulic conductivity (SOL_K); 5) soil surface spectral
reflectance (SOL_ALB); the factor of soil erosion (SOL_EC); 6) soil bulk density (SOL_BD); 7)
soil available water storage (SOL_AWC); 8) soil hydrology groups (HYDGRP); 9) soil organic
carbon content (SOL_CBN); 10) soil clay content (CLAY); 11) soil silt content (SILT); 12) soil
sand content (SAND); 13) soil rock content (ROCK); 14) soil texture (TEXTURE). The soil
properties from 1) to 5) were looked up in the two books << Xun Yang Soil>> (Wang, 1988) and
<<Hu Bei Province Soil Outline>> (Wang and Xu, 1997). The other soil physical properties were

34
calculated in the model of Soil Water Characteristics of the software Soil Water Atmosphere
Plant (SWAP) according to the percentage of soil particles size. The soil properties are shown
in Annex A.
The soil hydrological groups were classified by final constant infiltration rate in terms of similar
rainfall and surface runoff (Musgrave, 1955). Four soil hydrological groups are defined, which
classification standards are shown in Table 4 (Cronshey, 1986).
Table 4: Soil hydrological groups and some characteristics.
Soil hydrological
groups
Soil textures Infiltration speed Infiltration
rate(mm/h)
A Mainly with sand High 7.6 -11.4
B Silt loam or loam Medium 3.8-7.6
C Sandy clay loam Low 1.3-3.8
D Mainly with clay Very low 0-1.3
To distinguish soil data in SWAT model, a soil type index table (Table 5) has been built, where
“Value” and “SNAM_CN” stand for the code of soil type in number and words in SWAT model.
Table 5: Statistics of soil type in the Upper Duhe basin.
Soil types Area (km2) Area in total
(%)
Value SNAM_CN
Yellow-brown earths 6415.7 71.5 7 huangzongrang
Brown earths 1660 18.5 2 zongrang
Limestone soils 493.5 5.5 5 shuihuitu
Paddy soils 143.6 1.6 1 shuidaotu
Dark-brown earths 116.6 1.3 3 anzongrang
Purplish soils 89.7 1 6 zisetu
Fluvo-aquic soils 44.9 0.5 4 chaotu
Meadow soils 9 0.1 8 caodiantu
3.6 Discharge – outflow of basin
Daily mean streamflow at five stations (Zhushan, E'Ping, Huangwan, Xinzhou and Yanba) were
collected from the Water Conservancy Department of Hubei Province, for the period from 1965
to 2010. Daily sediment load data at two stations (Zhanshan and Xinzhou) were collected for
the period of 1965-2010 and 1975-2009, respectively. Zhushan station, built in 1958, is the
biggest hydrological gauging station in the basin and the second biggest discharge station in
Hubei Province (Wang, 2007; Luo and Chen, 2010).
There is no other water transfer to or from the Upper Duhe basin. All surface water leaves the
catchment at the Zhushan gauging station. We have used measured data from this station to
check and optimize the SWAT model for the period 2001-2010.

35
3.7 Reservoirs
The Upper Duhe basin is part of the Danjiangkou Reservoir basin. The Danjiangkou Reservoir,
with its dam situated near Danjiangkou City, Hubei Province, is the water source for the Middle
Route Project (MRP) for the South-to-North Water Transfer, which will divert water from
Danjiangkou reservoir on the Hanjiang (Han River), a tributary of Changjiang (the Yangtze
River), to Beijing City through canals along Funiu and Taihang Mountains. The MRP will
mitigate the crisis of water resources in Beijing, Tianjin and North China, and increase irrigated
area by 0.6 million ha, 6.4 billion m3 for municipal and industrial water supply, 3.0 billion m
3 for
agriculture, for Beijing, Tianjin, Hebei and Henan provinces, and significantly improve the
biological environment and investment environment of receiving areas, and boost the economic
development in China. Hanjiang, upper Danjiangkou Reservoir, is approximately 925 km in
length, the catchment area is 91,388 km2.
Within the Upper Duhe basin, the five major reservoirs are illustrated in Table 6and Figure 20.
Several other small reservoirs were built in this area with a volume below 100km3 and with
unsufficient data to include them in the SWAT model. The small reservoirs could serve as
sediment traps though, to some extent.

36
Figure 19: Danjiangkou Reservoir (upper picture) and heightened dam, China, September
2012.
Table 6: Major reservoirs in the Upper Duhe basin.

37
Figure 20: Location of the major reservoirs in the Upper Duhe basin.

38
4 Baseline modelling assessment
4.1 Introduction
This chapter describes the set-up of the SWAT hydrological basin-scale simulation model to
serve as the quantitative tool for exploring the effect of measures within the framework of the
‘Green Water Credits’ concept (GWC). This technical part of the GWC-Toolbox will enable us to
simulate the basin situation in terms of water and sediment at present, to evaluate relevant
measures from the past (e.g., see Yan et al., 2013), and to assess future water and land
management measures as a part of policy programs.
Using the SWAT model, we can quantify the hydrological and erosion-sedimentation processes
in the Upper Duhe basin at present. To be able to do this, we have setup a baseline model.
Given this model, we will calculate the separate and total effect of future GWC-measures in
terms of green water, blue water, and erosion. We will quantify these effects, based on the field
measurements and baseline calculation results at Zhushan gauging station in terms of stream
flow and sediment load. Steps taken to build and optimize the baseline model will be discussed
and model performance will be shown. Furthermore, the spatial distribution of the SWAT model
output will be analysed at the spatial level of Hydrological Response Units (HRUs). These
spatial units build up to sub-basins, while the sub-basins add up to the total Upper Duhe basin
under consideration in this project.
We are not aiming at calculating results on the water and sediment balance of the Upper Duhe
catchment to judge or influence policy plans or issues. Our main goal is to show that SWAT is
an appropriate tool at the basin-scale, to quantitatively evaluate measures on beforehand, in
time and space.
The baseline SWAT model has been set-up for a period of 31 years (1980-2010). Justification
of data used to build the model was provided for in the previous section. To summarise:
DEM: NASA SRTM dataset;
Climate: for precipitation measurement stations derived from Chinese counterpart (9).
For temperature, solar radiation, humidity and wind speed the NCEP Climate Forecast
System Reanalysis (CFSR) dataset is used (13 ‘stations’ / grid points);
Land use: aggregated land use map by Huazhong Agricultural University, based on
Landsat TM 5 and 7;
Soil types were obtained from the Soil Survey Office of Hubei Province;
Discharge measurements and reservoir characteristics have been obtained from local
counterparts in China.
4.2 Baseline model set-up
4.2.1 Basin delineation
Under SWAT, the basin outlet is set to the gauging station at Zhushan, just before the tributary
from Huohe/Muyushan reservoir. All upstream tributaries from Zhushan are included in the
analysis. This delineation for which the basin outlet is similar as the gauging station is very
favourable for optimizing the model as the model can be calibrated for the full study area.

39
The DEM forms the base to delineate the catchment boundary, stream network and sub-
catchments. This is performed by the pre-processing module of SWAT and requires a threshold
area. This refers to a critical source defining the minimum drainage area required to form the
origin of a stream. The determination of an appropriate threshold area has to be in accordance
with the desired level of detail.
In the current study we found an appropriate threshold of 10,000 ha, which provides a good
balance between the level of detail and computational constraints. This resulted in a total of 55
sub-catchments. A first trial was performed with a threshold area of 20,000 ha, but this led to a
total of 33 sub-catchments, which lacks the desired detail for this study. A threshold of
20,000 ha also results in elongated sub-catchments with large elevation differences within the
sub-catchment. This has negative effects on the simulation of the orographic precipitation
regimes. The delineation of the 55 sub-catchments is shown in Figure 21. It can be seen that
the sub-catchments are more or less equally sized, and that they are not too stretched. The
average sub-catchment area with the defined threshold of 10,000 ha is 164 km2.
Figure 21: Locations of the 55 delineated sub-basins along with the derived streams. The
threshold for delineation was set at 10,000 ha.
4.2.2 Hydrological Response Units
For the spatial disaggregation of the sub-catchments, SWAT uses the concept of Hydrological
Response Units (HRUs) (Neitsch et al., 2000). These are portions of a sub-catchment that
possess unique land use, management, and soil attributes. In other words, an HRU is the total
area within a sub-catchment with a unique land use, management, and soil combination. HRUs
are used in SWAT since they simplify a run by lumping all similar soil and land use areas into a

40
single response unit. The size of a HRU depends on the size of the total area under
consideration.
Implicit in the concept of the HRU is the assumption that there is no interaction between HRUs
within one sub-catchment. Loadings (runoff with sediment, nutrients, etc. transported by the
runoff) from each HRU are calculated separately and then summed to determine the total
loadings from the sub-catchment. If the interaction of one land use area with another is
significant, rather than defining those land use areas as HRUs they should be defined as sub-
catchments. It is only at the sub-catchment level that spatial relationships can be defined. The
benefit of HRUs is the increase in accuracy this adds to the prediction of loadings from the sub-
catchment. The growth and development of plants can differ greatly substantially among
species. If the diversity in plant cover within a sub-catchment is accounted for, then the net
amount of runoff entering the main channel from the sub-catchment will be much more
accurate.
In practice the HRUs are defined by overlaying three data layers:
Sub-catchments;
Land use;
Soils.
Based on these three data layers 829 HRUs (see Figure 22) were determined for the upper
Duhe catchment. The land use is most responsible for the spatial differentiation among the
HRUs. This results in smaller HRUs in the north of the Upper Duhe basin where land use is
more diversified.
Figure 22: SWAT - hydrological response units (HRUs) in Upper Duhe basin.

41
4.3 Reservoirs
All five major reservoirs within the Upper Duhe catchment are implemented in the model. During
the determination of the sub-basins, additional outlet points are created on the place of the
reservoirs. This co-defines the layout of the sub basins as outlet points are seen as the most
downstream point within a sub-basin. This additional added outlet points are later on linked to
the reservoir data. Missing data concerning reservoir surface area was calculated by dividing
the total volume by the water level. For those reservoirs for which the water level was not known
a linear regression was made of the surface area and the volume to fill the data gaps. See
Figure 23.
Figure 23: Reservoir volume vs. surface area.
4.4 Climate data in SWAT
The location and elevation of the weather stations and daily time series for precipitation, solar
radiation, relative humidity, wind speed and temperature are included in the model. The
Penman-Monteith method (Monteith et al. 1965) is used for the calculation of the spatially
distributed potential evapotranspiration rates. This method requires data on temperature, solar
radiation, wind speed, and humidity. See paragraph 4.7 for the spatial results of the climate
data.
4.5 Model performance on outflow and sediment loads
The long-term time series of stream flow and sediment load at Zhushan gauging station will be
used to optimize the model performance. Since the land use has changed over the last
decades, the choice is made to focus on the modelling period 2001-2010. This period is most
representative for the land use map used in the model, dated 2007, and it is a good starting
period to calculate and evaluate future GWC-measures. The period 1980-2000 is used to
initialize the model. For this feasibility study, the key focus is to assess the impact of the green
water management practices on water and sediment in the basin, quantifying the differences
between the studied scenarios and the current management situation, represented in the
baseline model. In this sense, it is crucial to note that conclusions drawn from scenario analysis
are much more reliable than absolute model predictions (relative vs. absolute model accuracy,
e.g. Droogers et al., 2008).
y = 3E-07x + 0.8614 R² = 0.992
0
100
200
300
400
500
600
700
0 500000000 1E+09 1.5E+09 2E+09 2.5E+09
Surf
ace
are
a in
ha
Reservoir volume

42
In order to optimize the model, a sensitivity analysis was first carried out using the parameters
shown in Table 7. These seven parameters were altered within realistic ranges (Neitsch et al.,
2005), showing that the model was most sensitive to parameters CN, LAI_INIT, SOL_AWC,
SOL_K, PLAPS and ESCO.
The Curve Number (CN) parameter varies non–linearly with the moisture content of the soil.
The curve number drops as the soil approaches the wilting point and increases to near 100 as
the soil approaches saturation. The LAI_INIT is the initial leaf area index. These numbers are
slightly adapted for the land use classes’ forest, urban and bare soil, to better fit with the local
situation. The PLAPS rate is the precipitation laps rate, which adjusts the precipitation for the
elevation bands in the sub basin. SOL_K relates soil water flow rate to the hydraulic gradient
and is a measure of the ease of water movement through the soil. SOL_AWC is the available
water capacity of the soil layer, which is available for the plants. The ESCO factor varies
between 0.01 and 1. A lower value allows the model to extract more of the evaporation demand
from lower levels. The USLE_P factor increases with steeper slopes and is a ratio between soil
loss and slope.
Table 7: Parameters used for sensitivity analysis and model optimization with respect to
stream flow and water balance.
The model is optimized based on the overall water balance, the outflow at Zhushan gauging
station and based on the sediment load at the Zhushan gauging station. The optimization was
performed both, on a monthly base and on a yearly base. For a first annual mass balance, the
following formula was used: P-ET-Q=ΔS (see Figure 24) in units [mm/y], in which:
P = Precipitation
ET = Evapotranspiration
Q = Discharge/outflow of basin
ΔS = is the change of storage within the time step.
As mentioned in chapter 1.3, the overall mass balance shows that from all precipitation, about
40% returns as evapotranspiration (green water) into the atmosphere, 58% becomes discharge
out of the basin (blue water), which is available for downstream water users. The remaining 2%
is net storage change. Note that this storage change is relatively small and could be caused by
uncertainties in e.g. precipitation data. Unless the catchment as a whole is becoming
significantly wetter with time (trend), the long-term expected storage change should approach
zero.
Parameter Unit Variable
CN
Initial SCS runoff curve number for moisture
condition
LAI_INIT Initial leaf area index (forest,bare,urban)
PLAPS mm H2O/km Precipitation laps rate
SOL_K mm/hr Saturated hydraulic conductivity of the soil layer
SOL_AWC mm H2O/mm soil Available water holding capacity of the soil layer
ESCO Soil evaporation compensation factor
USLE_P USLE equation support practice factor

43
Figure 24: Upper Duhe basin, annual water balance terms in mm y
-1 (1980-2010). PCP for
precipitation, ET for evapotranspiration, Q for outflow, and DS for storage change.
The correlation of the measured and simulated discharge at Zhushan shows that the low
discharges and base flow are simulated well, and that the higher discharges are slightly
overestimated by the model calculations. However, with an overall correlation coefficient of
nearly 0.8, the model is performing well (see Figure 25).
When plotting the measured and simulated discharge at Zhushan station in the time it becomes
clear that the measured and calculated time series are quite similar and that both peak flows
and base flow are simulated well (see Figure 26). The model seems to have a small time delay
in generating the discharge, which may be caused by a slightly higher storage capacity of the
soils as compared to the soils in reality. No further analysis was performed on this subject.
-200
0
200
400
600
800
1000
1200
1400
PCP mm
ET mm
Q out mm
DS mm
Figure 25: Correlation between simulated (X-axis) and measured discharge (Y-axis) at
Zhushan station. Data period 2001-2010, monthly data.

44
The sediment load at Zhushan gauging station was initially simulated too low by the non-
optimized baseline model at a long-term average of 23% of the measured values (see Figure
27). Several parameters influence the amount of erosion and sediment in the reach (see Table
8). The largest adjustments have been done to the SPCON parameter which was adapted from
0.0001 towards 0.0006, which is still within the allowable range of 0.0001 to 0.01. Improving the
model performance for sediment load results in Figure 28, which shows the measured vs.
simulated sediment load at Zhushan station. Extreme events are underestimated, especially
during the first years of the period. However, the overall mass balance of sediment load is
resulting in 105% of the measured sediment load over the 30-year period. This is mainly
accountable for the last four years in which the total amount of sediment is overestimated,
which may be caused by the two new large reservoirs upstream of Zhushan gauging station.
Table 8: Parameters used for sensitivity analysis and model performance improvement
with respect to the calculated sediment load.
Parameter Unit Variable
SPEXP
Linear parameter for calculating the maximum
amount of sediment that can be reentrained.
SPCON
Exponent parameter for calculating sediment
reentrained in channel sediment routing
FILTERW m With of edge-of-field filter strip
OV_N Manning's "n" value for overland flow
USLE_P USLE equation support practice factor
Figure 27: Observed and simulated sediment load (tons/month) at Zhushan station
before optimization of baseline model. Data period 1980-2010.
Figure 26: Observed and simulated stream flow at Zhushan station in MCM (106 m
3) for
the 2001-2010 period.

45
Figure 28: Measured and simulated sediment load in (tons/month) at Zhushan gauging
station with optimized baseline model. Data period 1980-2010.
Figure 29: Correlation between simulated (X-axis) and measured sediment load (Y-axis)
at Zhushan gauging station. Data period 2001-2010, monthly data.

46
Example of sediment present in tributary river to Danjiankou Reservoir, September 2012.
4.6 Role of agriculture in GWC practices
To explore the most relevant land use classes regarding Green Water Credits, baseline results
were aggregated for each land use class. The following results have been plotted:
The total amount of water consumed by vegetation through plant transpiration and
water lost by soil evaporation (see Figure 30);
Blue water: water entering the streams by surface runoff, lateral drainage, and
groundwater discharge (see Figure 31);
Erosion: gross erosion rates (see Figure 32).
Evapotranspiration is the sum of water consumed by the plants for transpiration and the water
lost by soil evaporation. Evaporation also occurs of intercepted rainfall, but this process was not
included in the analysis. Soil evaporation can be considered a non-beneficial loss of green
water from the soil system. The water gained by reducing soil evaporation can be either used
for plant transpiration or can infiltrate and serve as groundwater recharge, in the end becoming
blue water downstream.
Figure 33 shows annual evapotranspiration (ET) data for each land cover class, split into plant
transpiration (T) and soil evaporation (E). It can be remarked that evaporation from bare soil is
somewhat high and possibly overestimated by the model calculations, but the total area of bare
soil is fairly small. The calculated evaporation from bare soil has only a small influence on the
basin water balance.
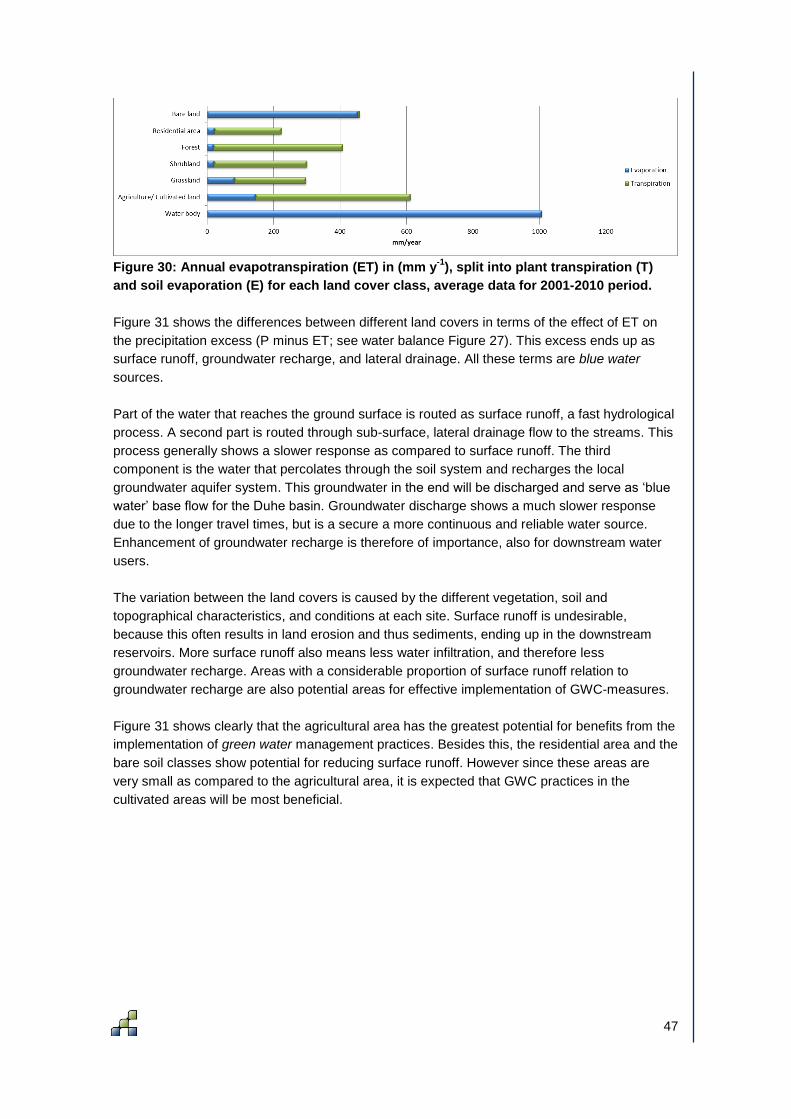
47
Figure 30: Annual evapotranspiration (ET) in (mm y
-1), split into plant transpiration (T)
and soil evaporation (E) for each land cover class, average data for 2001-2010 period.
Figure 31 shows the differences between different land covers in terms of the effect of ET on
the precipitation excess (P minus ET; see water balance Figure 27). This excess ends up as
surface runoff, groundwater recharge, and lateral drainage. All these terms are blue water
sources.
Part of the water that reaches the ground surface is routed as surface runoff, a fast hydrological
process. A second part is routed through sub-surface, lateral drainage flow to the streams. This
process generally shows a slower response as compared to surface runoff. The third
component is the water that percolates through the soil system and recharges the local
groundwater aquifer system. This groundwater in the end will be discharged and serve as ‘blue
water’ base flow for the Duhe basin. Groundwater discharge shows a much slower response
due to the longer travel times, but is a secure a more continuous and reliable water source.
Enhancement of groundwater recharge is therefore of importance, also for downstream water
users.
The variation between the land covers is caused by the different vegetation, soil and
topographical characteristics, and conditions at each site. Surface runoff is undesirable,
because this often results in land erosion and thus sediments, ending up in the downstream
reservoirs. More surface runoff also means less water infiltration, and therefore less
groundwater recharge. Areas with a considerable proportion of surface runoff relation to
groundwater recharge are also potential areas for effective implementation of GWC-measures.
Figure 31 shows clearly that the agricultural area has the greatest potential for benefits from the
implementation of green water management practices. Besides this, the residential area and the
bare soil classes show potential for reducing surface runoff. However since these areas are
very small as compared to the agricultural area, it is expected that GWC practices in the
cultivated areas will be most beneficial.

48
Figure 31: Water entering the drainage network and rivers by groundwater recharge,
surface runoff, and lateral drainage. Average calculated data for 2001-2010 period.
Figure 32 shows the sediment yields for the different land covers classes, where it is clear that
bare soil shows the highest erosion rate. Considering all land use classes, potential green water
management practices which reduce soil erosion, will be most effective on the agricultural land
and to a lesser extent on grassland. The gross erosion rate for agriculture is roughly 38,000 kg
ha-1
y-1
. If we take the unit weight for soil as 1,600 kg/m3, then this corresponds to a gross
erosion rate of an equivalent 2.4 mm y-1
soil depth. These numbers confirm that there is a great
potential for green water management measures to reduce the erosion rates so as to limit the
loss of fertile lands and mitigate the sedimentation of downstream reservoirs. The preliminary
scenario analysis done so far within this study confirms that sediment yields can be reduced
significantly (see also Yan et al., 2013).
Figure 32: Total calculated sediment loss in terms of gross annual erosion rates per land
use class. Average data for 2001-2010 period.
4.7 Spatial analysis of calculation results
The SWAT distributed modelling approach that was chosen for the bio-physical assessment of
Green Water Credits in the Upper Duhe basin gives the ability to assess the water and
sediment flows at a high spatial detail. For this Proof-of-Concept and feasibility phase, this will
give insight into the areas where green water management implementation is most significant in
terms of benefits. To provide insight into the output that will form the basis for the green water
management biophysical analysis, the following maps have been plotted, based on averages
for the 2001-2010 period:
Annual precipitation: spatial distribution of the annual precipitation sum;
Annual evapotranspiration: total amount of water consumed by plant transpiration and
water lost by soil evaporation;

49
Annual actual transpiration: total amount of water that is used by vegetation (agricultural
crops as well as natural plants) to produce biomass with green water as its source;
Annual soil evaporation: total amount of water that is lost by soil evaporation. This
includes bare soils, but also areas partly covered by vegetation. This soil evaporation
can be considered as a non-beneficial loss of green water;
T-fraction: percentage of total evapotranspiration used for plant transpiration. This
factor quantifies the effectiveness of the crop to use the green water source;
Annual water yield: water entering the streams by surface runoff and sub-surface lateral
drainage, turning into blue water for downstream users;
Annual groundwater recharge: water that contributes to the groundwater aquifer and
eventually becomes base flow and blue water;
Annual erosion rate.
Figure 33: Annual precipitation, averaged over the period 2001-2010.
The spatial pattern of the annual precipitation is shown in Figure 33. The distribution of annual
precipitation is based on the 9 measurement stations. It is clear that the largest precipitation
rates are found in the South western part of the Duhe catchment where the mountains are
highest. Annual precipitation rates in this area can be up to 1100 mm y-1
. The annual average
precipitation is approximately 850 mm y-1
near Zhushan.
The distribution of annual evapotranspiration rates, averaged over the period 2001-2010, is
shown in Figure 34. This is the sum of water consumed by vegetation (transpiration) and by soil
water evaporation. The largest evapotranspiration rates are found in the Northern, lower part of
Duhe, and in the agricultural areas. The main crop type in these regions is winter wheat and
maize (Yan et al., 2013). It is, however, more interesting to know which part is transpiration and

50
which part is evaporation, because evaporation from the soil surface can be considered as a
loss of green water. Therefore, the average annual transpiration and evaporation are shown in
Figure 35 and Figure 36, respectively. The areas with the largest potential for green water
management practices are the areas with high evaporation rates. From Figure 36, it is clear that
areas with high evaporation rates are located in the Northern, lower parts of the basin which are
mainly used for agriculture. These areas were already marked in Section 4.6 as having potential
for green water management practices. Figure 35 shows that transpiration is highest in the
Forest areas in the North and to a lesser extend in the South East. Decreasing transpiration
rates from the non-agricultural vegetation, e.g. like the forest, can also contribute to a higher
stream flow, without compromising the food security. This is an option that will be explored
further in chapter 5.
Figure 34: Annual evapotranspiration (ET), averaged over 2001-2010.

51
Figure 35: Annual plant transpiration (T), averaged over 2001-2010.
Figure 36: Annual soil evaporation (E), averaged over 2001-2010.

52
The proportion of transpiration relative to total evapotranspiration is defined here as the T-
fraction. The lower this percentage, the more water is lost by evaporation. The average annual
T-fraction is shown in Figure 37. Again the Northern flat area stands out as especially the flat
lower valleys have a relative low T-fraction. The T-fraction from the forest in the Northern part
stands out and is extraordinary high, approaching 100%.
The average annual water yield (sum of runoff, sub-surface flow and base flow) is shown in
Figure 38. The largest water yields are found in the Southern mountainous part of the Duhe
basin. Water yield is closely correlated with annual precipitation. Figure 33 already showed that
the Southern mountains receive the largest amount of annual precipitation. That explains the
large water yields in these areas. Besides high water yields can be found on the paddy soils
and on the scrublands and grasslands areas. As can be seen from Figure 31, these land use
types “generate” more water than the surrounding forest, which can merely be explained from
the difference in ET from the land use types.
The average annual groundwater recharge is shown in Figure 39. Again, these are very closely
correlated with the rainfall amounts. The groundwater recharge depends on the land use (ET),
the soil type (infiltration capacity), and the slope (more or less surface runoff). Soil types with
low permeability hardly allow the water to percolate to the saturated zone. After recharge, part
of the groundwater will eventually enter the streams and turn into base flow for the Duhe basin.
Figure 37: Transpiration (T) as percentage of total evapotranspiration (ET), averaged over
the 2001-2010 period.
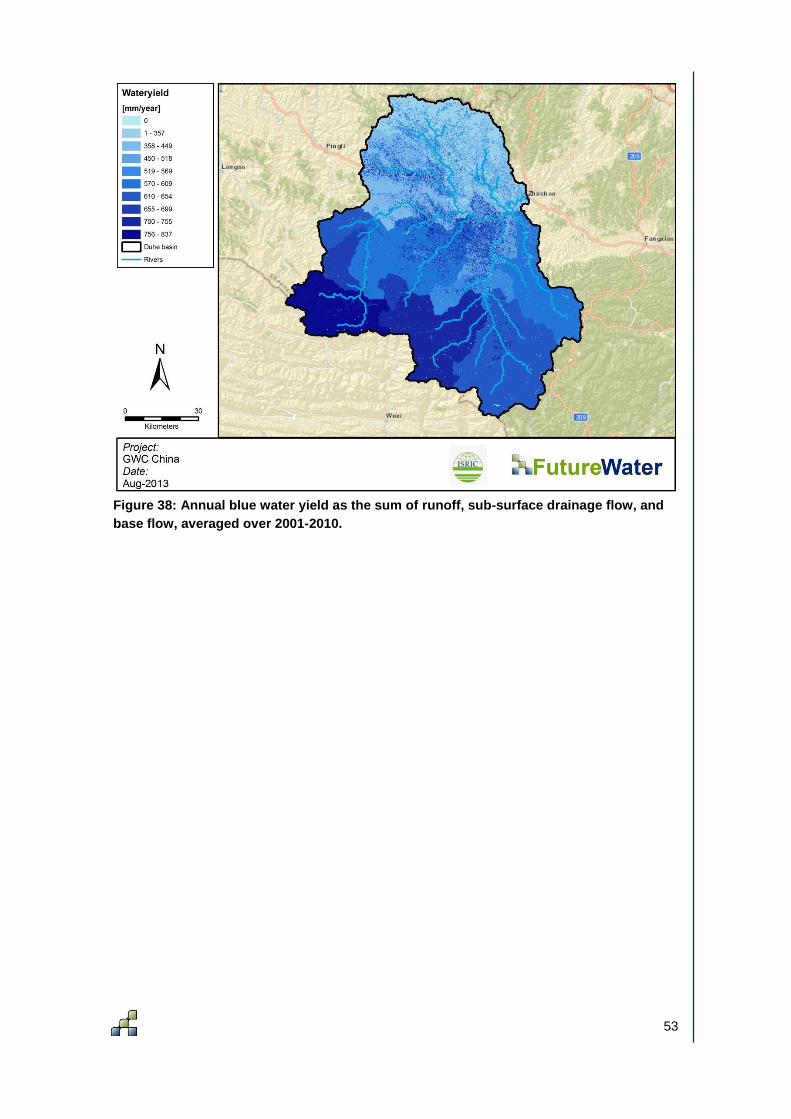
53
Figure 38: Annual blue water yield as the sum of runoff, sub-surface drainage flow, and
base flow, averaged over 2001-2010.

54
Figure 39: Annual groundwater recharge, averaged over 2001-2010.
The sediment yield in a sub-catchment is mainly dependent on the rainfall intensity, the land
use and management, the slope, and soil type. The average annual sediment yield is shown in
Figure 40. Sediment yields are largest in the northern area of the basin. This is mainly a result
of the land use and erodible soils. Forest is less vulnerable for erosion, which can clearly be
seen in Figure 40.
The changes in land use greatly affect stream flow and sediment yield in the Upper Duhe basin.
The major land use changes that affected stream flow are changes to farmland, forest, and
urban areas. The biggest contribution to the sediment yield is from the farmland, followed by
forest (Yan et al., 2013). Their results also indicated that changes in grassland did not exert a
significant influence on either stream flow or sediment yield.

55
Figure 40: Annual sediment yield by erosion, averaged over 2001-2010.
Based on the model calculations shown in this chapter, GWC measures will need to focus on
decrease of soil evaporation (E) and decrease of sediment losses by erosion. The GWC
measures could lead to increased agricultural crop production by increased plant transpiration,
to enlarge the farmer’s income. Finally, if the overall evapotranspiration rates for non-
agricultural vegetation could decrease, more blue water could be generated at the Zhushan
gauging station, with the Duhe basin finally feeding the Danjiangkou reservoir.

56
5 Future Management Options for GWC
5.1 Potential benefits upstream and downstream
Green Water Credits is about meeting the interests of upstream land users and downstream
water users at the same time. By linking downstream water users and upstream farmers, green
water management enhances the overall water management of the basin and benefits both
parties. These potential benefits need to be quantified in order to transform them to an
institutional and financial arrangement that sustains GWC implementation. Within the ‘Soil and
water management’ domain (see Figure 44), different land management options have been
studied and evaluated in order to obtain the most optimal implementation scheme.
Figure 41: GWC - The four domains.
The principal potential benefits that need to be quantified for upstream farmers are:
- Increased transpiration rates, determining crop production, and reduction of non-
productive soil evaporation;
- Infiltration and retention of water in the soil system;
- Reduction of erosion rates and loss of fertile top soil.
For downstream water users, e.g. irrigators, hydropower, industrial and drinking water supply,
the principal potential benefits that have to be assessed can be summarised as follows:
- Total water flowing from the mountainous areas into the reservoirs;
- Enhancement of groundwater discharge or base flow due to increased soil infiltration
and increased groundwater recharge;
- Reduction of sediment loads to the drainage network and reservoirs and preserved
storage capacity.
These benefits will be quantified by introducing a set of key outcome indicators, as will be
explained in the following sections.

57
Figure 42: GWC - Examples of potential upstream and downstream benefits.
A major problem in basin-scale water management is to cope with the irregular rainfall and flow
regimes that lead to floods in some seasons and to drought in others. Infrastructural solutions
such as dams, canals and diversions, are able to hold certain amounts of water temporarily so
as to redistribute the water available during the drier seasons and to lessen hazardous peak
flows. The soil and groundwater system storages regulate flows and their capacity is, in most
basins, much larger than man-made reservoirs. Due to land use change and inappropriate land
management, the use of these natural reservoirs is usually not at its full potential. By changing
to better land management practices, the use of the soil and groundwater reservoirs can be
enhanced.
The main strength of green water management is that both upstream as well as downstream
stakeholders have profits. Aiming at only one single stakeholder group would lead to other
solutions, e.g. fertilizers, sediment traps, artificial groundwater recharge. Green Water Credits
(GWC) aims at a sustainable mechanism to be implemented by enabling the interaction
between up- and downstream stakeholders.
Different land and water management options are available as possible candidates for
incorporation in the Upper Duhe case. These have to be selected, studied and evaluated. A first
selection has been conducted in the following section. Also, a first indicative analysis was
carried out in order to show the methodology and outcomes of this part of the assessment.
5.2 From baseline model to scenario analysis
The SWAT baseline model has been set up, tested and optimized, as shown in Chapter 4. The
model calculation results are plausible and show a good fit between measured and calculated
outflow and sediment load data. This all means that the baseline model is capable of simulating
hydrological processes at the basin scale at present (2001-2010). If the spatially distributed
hydrological model represents the Upper Duhe system well enough, we trust it to be applied to
GWC-measures and scenario analysis.
The hydrological processes involved in the Upper Duhe basin have all (sets of) model
parameters that control the computed process. We have to make a translation of GWC-
measures to processes, and from these processes to specific model parameters involved. Once
we know which baseline model parameters are connected to a GWC-measure, we can adjust
the parameters to represent the new situation in the Upper Duhe basin, given the measures
taken. Because the SWAT model has a spatially distributed setup, we can also choose to put
the measures in a spatial context. To give two examples, in sloping areas we can build terraces,

58
and we apply mulching to arable land. In this way, we move from the baseline model to scenario
analysis model versions, using adjusted model parameters that fit GWC-measures.
5.3 Selection of management options
The World Overview of Conservation Approaches and Technologies (WOCAT) is a programme
whose objective is to use existing knowledge and funds more efficiently to improve decision-
making for sustainable land management. It is a framework for collecting databases of
successful SWC experiences concerning technologies, approaches and aerial distribution
through the use of standardised and simplified questionnaires worldwide. All data are readily
analysed, and can be disseminated and prepared for presentation, evaluation and monitoring.
WOCAT can be used as a tool in land management for all land users (stakeholders) with
benefits that are multiple and mutual through the improved WOCAT decision support system.
A selection was made of management practices from the WOCAT database and from
discussion with local experts of measures that have shown large potential in previous GWC
assessments. They are presented here and will be projected with the local stakeholders and
representatives in order to initiate the quantitative scenario analysis and determine the
upstream and downstream benefits. The following GWC-management options were selected by
discussions held with our Chinese partners and trainees:
1. Stone lines;
2. Bench terraces;
3. Contour tillage;
4. Mulching;
5. Forest management.
With the SWAT model, the impacts and possible trade-offs of these practices can be studied
and quantified. The following paragraphs give a more detailed explanation on these practices.
5.3.1 Stone lines
Stone lines (Figure 43) are small structures (WOCAT: NIG01 and NIG02) of stones, where the
stones are placed in a horizontal line across the slope. The distance between the lines is a
function of the slope and availability of stone.
Stone lines are intended to slow down runoff. They thereby increase the rate of infiltration, while
simultaneously protecting the planting pits from sedimentation. Often grass establishes between
the stones, which helps increase infiltration further and accelerates the accumulation of fertile
sediment. Wind-blown particles may also build up along the stone lines due to a local reduction
in wind velocity. The accumulation of sediment along the stone lines in turn favours water
infiltration on the upslope side. This then improves plant growth, which further enhances the
effect of the system.
Construction does not require heavy machinery (unless the stones need to be brought from afar
by lorry). The technique is therefore favourable to spontaneous adoption. Stone lines may need
to be repaired annually, especially if heavy rains have occurred.

59
Figure 43: GWC - Example of stone lines (source: www.wocat.net).
5.3.2 Bench terraces
This measure (Figure 44) is an embankment constructed along the contour by the use of stone
and soil as a construction material (WOCAT: ETH32). The technology is used in areas where
there is not sufficient stone and where the soil shallow. Terraces are established by excavating
soil, and using this to shape the embankment. Stone is used to face the downslope side (the
terrace “riser”) for reinforcement. Vegetation is planted on the upper part of the embankment
when there is sufficient soil.
Figure 44: GWC - Example of bench terraces (source: www.wocat.net).
The purpose is to reduce surface runoff, decrease slope length, increase infiltration rate, and
consequently minimise soil erosion. The structures require regular maintenance, since the
embankments are often made of small stones, which are unstable. In order to properly stabilise
the structure livestock should not be allowed to graze where the structures are placed.
Checking for breaks after heavy storms is necessary.
In terms of bio-physical processes, this measure will have the following impact:
Reduction in soil loss by erosion, and
Reduced overland flow / surface runoff.

60
5.3.3 Contour tillage
This green water management option comprises contour ploughing (WOCAT: HUN2) often
combined with soil bunds (WOCAT: ETH43). The basis of the technology is the annual
ploughing. The ploughing and all other cultivation is carried out along the contour lines. This can
significantly decrease erosion. Rotary cultivation aims to reduce wind and water erosion, to
control weed and to develop a good seedbed. On very low slopes contour tillage may be
adequate on its own without bunds.
Figure 45: GWC - Example of contour tillage (source: www.wocat.net).
On slopes of more than 3%, soil bunds can be supplemented to the contour cultivation. Stone,
and stone faced, bund height depends on the availability of stones. On average the base width
is 1.0 -1.2 m and height is 0.6 - 0.7 m. Bunds reduce the velocity of runoff and soil erosion,
retain water behind the structure and allow it to infiltrate. This further helps the process of
groundwater recharge.
Planning is carried out by initial community/group and individual discussion, and a consensus
reached on layout, spacing, implementation modalities and management requirement. The
technology is applicable in areas where soil is moderately deep and stones are available.
5.3.4 Mulching
The use of mulches in landscape plantings is increasing. Mulches have been promoted by
water conservation, green waste reduction, and other programs primarily to reduce evaporation
from soil. In addition, many of the materials used for mulching provide an improved aesthetic
appearance for the landscape and provide weed control. Many different materials are available
from composted products such as manures, sludge, and green waste to non-composted
products such as wood chips and yard waste from landscape maintenance operations, bark
products from lumber mills, and rock (CIWMB).

61
Mulches can benefit landscapes by reducing soil evaporation, cooling the soil, suppressing
weed growth, and possibly providing nutrients for plant growth. Several studies have evaluated
the moisture retention and cooling of soils under mulch (Bennett, 1982).
Figure 46: GWC - Example of Mulching with rice residues.
5.3.5 Forest management
Forest management or a change of use of natural areas is an often used method in GWC
measures. A different land use usually comes with different values for water yield, erosion and
infiltration. Also see the figures in Chapter 4. In the Upper Duhe basin, forest can be associated
with a very low erosion rate compared to agriculture and grassland and scrubland. However the
evapotranspiration of forest is about 100 mm higher per year, which does affect the water yield
from the forest areas. In the most ideal case a low erosion rate can be combined with a high
value for water yield.
Figure 47: GWC - Example of forest management
5.4 Scenario analysis
A preliminary analysis has been carried out for each of the selected green water management
options. In order to compare these scenarios with the baseline current situation, a set of
indicators is introduced that gives insight into the impact of the practices.

62
The main challenges which are defined within the Upper Duhe basin and in the greater
Danjiangkou catchment are the water efficiency, erosion, and to a lesser extend flooding. In
1998 a large flood occurred in the Duhe catchment. Erosion related problems include loss of
fertile topsoil in upstream area, and sedimentation of the canals, reservoirs and the
corresponding capacity loss. In the larger Danjiangkou catchment the main aim is to create a
higher discharge to have water available for the South-to-North Water Transfer, without
compromising downstream water demands. As key indicators the water yield and the erosion
rate will be used.
To quantify the effect of the green water management scenarios on the reservoirs, the change
in surface runoff and sediment loss has been analysed. Besides the effect on the reservoirs, the
change in plant transpiration, soil evaporation, and groundwater recharge has also been
evaluated. A reduction in soil evaporation and an increase in plant transpiration will result in
increased crop growth, and thus higher yields per hectare. Groundwater recharge, which
eventually becomes base flow, feeds the streams and reservoirs (See Figure 48). Therefore, an
increase in groundwater recharge will by groundwater discharge result in more water in the
reservoirs and streams. This means that more green water from upstream sources is available
as blue water to the downstream users, and for the planned water transfer.
Figure 48: Blue water and SWAT output - sum of surface runoff, lateral drainage, and
groundwater discharge.
For the preliminary assessment, it has been assumed that the practices are implemented in the
agricultural/cultivated areas, except for the forest management scenario. This area remains part
of the natural area in the basin and will replace part the forest area with the smallest slopes,
less than 20%. This results in 3.5% of the total forest area of the Upper Duhe catchment. The
scenario of forest management is modelled in a way that several options are possible. Model
parameters which have been changed compared to forest can be observed in Table 10. In
practice this result in a forest which is not so dense, has a smaller leaf area index, a lower
canopy height and smaller rooting depth.
The SWAT model parameters, which were used for the scenario analyses, were based on
expert knowledge and previous GWC studies (e.g. Hunink et al. 2011). The parameters used for
the baseline (current situation) scenario, and five selected green water management scenarios
are shown in Table 9.

63
Table 9: SWAT – Model parameter values and changes for each of the green water
management scenarios.
Table 10: SWAT – Adapted model parameters for the scenario forest management.
The description of these parameters is as follows:
ESCO: soil evaporation compensation coefficient: a higher value results in reduced soil
evaporation, making more water available for transpiration or as blue water.
P_USLE: support practice factor for soil loss: a lower value results in reduced soil
erosion.
CN2: runoff curve number: a lower value results in reduced soil erosion and increased
groundwater recharge.
SLOPE: average slope steepness: a lower value will reduce the overland flow and
erosion, and will increase the groundwater recharge.
OV_N: Manning’s “n” value for overland flow: a higher value means more resistance to
flow, lower flow velocities and less erosion.
FILTERW: width of edge-of-field filter strip: represents buffer zone around HRU area.
Higher values mean less erosion, more infiltration, and less overland flow.
BLAI: Maximum potential leaf area index.
CHTMX: Maximum canopy height (m).
RDMX: Maximum root depth (m).
GSI: Maximum stomatal conductance at high solar radiation and low vapour pressure
deficit (m/s).
ALAI_MIN: Minimum leaf area index for plant during dormant period (m2/m
2).
BIO_LEAF: Fraction of the tree biomass accumulated each year that is converted to
residue during dormancy.
MAT_YRS: Number of year required for tree species to reach full development (years).
BMX_TREES: Maximum biomass for a forest (metric tons/ha).
5.5 Analysis of green water management options
The results of the five selected green water management scenarios and the baseline scenario
are shown in Table 11. The principal water balance components of the potential green water
management practices areas are also shown, as well as the entire basin balance.
OBJECTID ICNUM CPNM IDC CROPNAME BLAI CHTMX RDMX GSI ALAI_MIN BIO_LEAF MAT_YRS BMX_TREES
6 6 FRST 7
Forest-
Mixed 5 6 3.5 0.002 0.75 0.3 50 1000
114 114 NEW NEW 3.5 0.8 1 0.005 0.5 0.1 2 50

64
Table 11: Key outcome indicators for green water management scenarios (averages for
2001-2010 period).
The results from the five green water management scenarios show that the measures taken
within the cultivated/agricultural land will reduce the sediment loss up to 50%. However, the
agricultural land covers just about 6% of the total study area, which reduces the effects of the
measures when expressed as percentage of the total basin balance. For the first four scenarios
the increased groundwater recharge and the corresponding increased green water results in
higher transpiration rates. This is very favorable for the farmers in the area as yields will
increase. A change can be observed that surface runoff and the related sediment loss
decreases and that the green water contributes more to the streams. However due to the
increase in transpiration within these scenarios the total amount of blue water generated will
slightly decrease for all these four scenarios. The scenario of the forest management shows
that by replacing forest by a relatively low, ground covering crop the high transpiration of the
forest can be reduced by over 20%. The lower leaf area index of the new crop results in an
increase of soil evaporation and surface runoff. The sediment loss increases by 15% compared
to forest. However the reduction of transpiration causes an additional flow towards the blue
water of 28%. Whenever combined with erosion reducing measures this scenario may have the
potential to increase the downstream water availability without causing additional sediment loss.
5.6 Project targets, further steps, and outlook
The targets of this project were:
To show the use of the GWC-concept in China.
To prove the feasibility of using biophysical modelling tools to quantify GWC-measures
on a basin scale. We have taken the Upper Duhe basin as an example for sub-basins
that count to the Danjiangkou Reservoir catchment.

65
To establish a partnership between Chinese parties involved and the Dutch consortium
of ISRIC, FutureWater and Nelen&Schuurmans.
To provide a firm basis for future projects in China within the GWC-framework, opening
the Chinese market, based on knowledge, tools, and cooperation.
We have shown useful biophysical modelling results and have started our partnership with the
Changjiang Water Resources Commission, CWRPI, and HAU. We will focus on strengthening
our partnership and future cooperation within the GWM&C framework by analysing catchment
areas and by facilitating possible implementation plans of GWC-measures. The setup and start
of follow-up projects should be part of this.
Figure 49: GWC-overview.
We have looked at hydrological features of the Duhe basin and SWAT modelling results on
hydrology and erosion. One of the aspects we did not take into account is the quality of
groundwater and surface water. Point and non-point sources can pollute the water system,
reducing the possibilities of using the blue water downstream. With respect to agriculture, direct
spill of agro-chemicals and diffuse sources of nutrients and pesticides can negatively influence
the downstream water quality. Nutrients and pesticides are used for crop production and
protection to pests. Direct spills should be avoided by using correct management practices at
the right time. E.g., just before or during rainfall events, agro-chemicals can be lost to the
environment and its water system by surface runoff. Also, nutrients can be transported through
the subsoil system into the groundwater aquifer if the crops are not able to uptake all the
nutrients applied by the farmer.
Rate and timing of applications of agro-chemicals are both important factors. The soil and
hydrological system come in as factors when the flow and transport of water is determined by
land surface and subsoil conditions. To give an example, surface runoff as a discharge
component serves as a risk of losses of agro-chemicals and acts as a ‘freeway’ of chemicals on
their way to the surface water system. Agro-chemicals are applied to the land surface, to the top
part of the soil. The shallow flow path of the water can take sediments with adsorbed chemicals
directly and/or dissolve chemicals from the soil and transport these towards a ditch or stream.
It is not easy and not directly possible to translate the modelling results we obtained into effects
on downstream water quality. What we can say is that any decrease of surface runoff leads to
both a smaller risk of chemical loads entering the surface water system and probably to a
smaller absolute load of agro-chemicals. A logical next step in the SWAT modelling could be to

66
follow and calculate the transport of chemicals through the soil and water system the Duhe
basin. Also, to model and analyse another sub basin of the Danjiangkou Reservoir with a larger
area of agricultural land could be very useful to evaluate the environmental losses of agro-
chemicals.
Further steps can be made in analysing other sub basins in terms of hydrology and land and
water management. We can also assist in setting up monitoring programs for the situation at
present, and for measuring the effect of measures actually taken in the field. Data collection and
processing will be part of a follow-up project, feeding the partnership between Chinese and
Dutch institutes and companies. Of course, the parallel process that we followed of knowledge
transfer and capacity building is also important. We can enlarge the group of Chinese partners if
there is more attention from other areas and/or other issues are involved. The most concrete
follow-up activity is to define, setup, and fund a project to start during 2014. We then can
continue the work from our side and further build our cooperation.
Figure 50: Danjiangkou Reservoir - in and outgoing annual stream flow.

67
6 Conclusions
GWC concept
Green Water Credits (GWC) is a mechanism for payments to land users in return for specified
green water management activities that determine the water supply to stakeholders in the
basin. Within the Upper Duhe basin there are various interrelated issues related to water
availability, reservoir sedimentation and flooding that offer unique opportunities for
implementation of green water management measures. The implementation of these
management options can enhance the water availability for downstream users and reduce
problems related to flooding and erosion. However, farmers need incentives to sustainably
implement these measures. At the same time, downstream users may be unaware of the
benefits they might gain through farmer implementation of these measures in upstream areas.
This feasibility study is meant to demonstrate and quantify the potential benefits to all
stakeholders in the basin.
Data
The data available allowed us to carry out the study reported here. However, the study results
are always a reflection of the data which are used for building the model. The more detailed the
input maps and time series are, the more detailed the outcome will reflect reality. For this study
the best available data is used, mainly obtained from the Chinese counterparts. Data which
could make the model more detailed include a detailed land use map, which indicated the crops
grown in specific areas and whether they are irrigated or not. This would allow for a more in
depth analysis per crop, as each crop has different growing seasons, and different parameters
concerning soil erodibility, transpiration and evaporation. Precipitation data was available for
nice station scattered around the Duhe basin. However these stations unfortunately had no
information about solar radiation, wind speed, humidity and temperature and the range of
elevation of the stations raises the question whether the data is also realistic on higher
elevations. The limited data available did not allow an in depth validation of the data as limited
or no documentation was available.
Biophysical assessment using SWAT
We managed to setup and run the SWAT model for the Upper Duhe basin, giving realistic
calculation results. The main reason of using the spatially distributed hydrological model was
that this tool would enable us to model processes and to quantify beforehand the effect of
GWC-measures. The SWAT model performed well, showing quantified fluxes of both water and
sediment in time and space. The instrument is complex in its handling, covers many processes
at the basin scale, and has many features. If setup and used well, it is a very powerful tool to
hydrologically analyse a catchment area and serve as a basis for policy making on water and
land management.
Calculation results
The calculation results for the five GWC-scenarios are plausible and mutual consistent. Based
on the model calculations for the agricultural area, it can be concluded that for the overall Upper
Duhe basin, the proposed GWC-measures will lead to further reduction of soil erosion and
sediment loads to the streams. At the basin scale, there is little effect on blue water volumes
downstream. The green water that is generated by the scenarios because of reduced surface
runoff and increased groundwater recharge leads to increased plant transpiration i.e. crop
production. This benefits the local farmer’s income, and does not increase the downstream blue
water. The overall influence of measures taken in the agricultural area on the Upper Duhe basin

68
as a whole is basically a matter of area, with agriculture covering less than 6% of the surface
area. On the contrary, the forest land covers about 76%. Any significant measure taken in this
area to decrease evapotranspiration and keep the erosion protection of forest land, will lead to
increased blue water production for downstream use.
Locally, improved agricultural practices by incorporating GWC-measures will lead to small
changes in evaporation and transpiration, but to larger reductions of surface runoff, to less
erosion, and to increased groundwater recharge.
Upscaling towards Danijangkou Reservoir catchment
To generate more blue water and to decrease the sediment load to the Danjiangkou Reservoir,
each sub-basin within the 91,388 km2 reservoir area will play its role. It depends on the land use
distribution, hydrology, and water and land management which targets can be met. GWC-
measures in agricultural areas will probably lead to reduced erosion and smaller sediment
loads. The larger these areas are, the more effect will be seen towards the reservoir system.
Local measures can lead to higher crop production by increased plant transpiration, supporting
the farmer’s income. Forest areas show small erosion and high evapotranspiration rates.
The SWAT model, being part of the GWM&C Toolbox, has proven to be a useful instrument in
quantification of the effect of past and future land and water management measures. This
information is very useful to facilitate policy issues on water and land management. If SWAT
models would be available for other sub-basins within the reservoir catchment, a complete
overview could be generated on measures and effects.
69
7 Recommendations
Based on the conclusions and the project experience, the following recommendations can be
made:
The GWC-concept has started working in the Duhe basin and for Chinese partners.
Therefore, a follow up will give a push forward to the people and issues involved.
On-site data: quality control, extension of monitoring with evapotranspiration data,
rainfall data at higher altitudes, more information on operational reservoir management.
Introduction of up to date monitoring and management technologies of Dutch
companies, like soil moisture monitoring (www.dacom.com), spectral water quality
control (www.waterinsight.nl) and climate adaptive drainage (www.futurewater.nl/kad),
can be fitted into a preparation or implementation program of GWC-measures.
The SWAT model has proved to be a successful tool to apply to hydrology and erosion
issues at the basin scale. The quantification of water volumes and sediment loads
allowed us to start scenario development for GWC-measures. This can become a
structural part of the work involved within the process of policy making on land and
water management. Different issues, e.g. water quality can be added, and the
modelling exercise can be extended to other (sub) basins.
Further cooperation between Chinese partners and the project consortium is very
fruitful in handling water and sediment challenges.

70
8 References
ABHS 2006. Debat National Sur L’Eau. L’Avenir De L’Eau, L’Affaire De Tous.
ABHS 2010. Evenements Hydropluviometriques Dans Le Bassin Du Sebou 2009-2010.
Royaume Du Maroc. Agence Du Bassin Hydraulique Du Sebou.
ABHS. 2006. Royaume Du Maroc Agence Du Bassin Hydraulique Du Sebou. Debat National
Sur L’ Eau. L’ Avenir De L’ Eau, L’ Affaire De Tous.
Beijing, pp. 42–64, (in Chinese).
Bennett, J. 1982. Mulches to retain moisture and cool the soil. Horticulture. 60(7):55–56.
Burrough PA 1986. Principles of Geographical Information Systems for Land Resources
Assessment. New York: Oxford University Press.
California Integrated Waste Management Board (CIWMB). 2002. A landscaper’s guide to
mulch. CIWMB Publication # 443-02-010.
http://ucanr.edu/sites/UrbanHort/files/80238.pdf).
Droogers P and Immerzeel W 2008. Green water credits: Basin identification Sebou, Morocco.
Technical report, FutureWater.
Droogers P and Kite G 2001. Simulation modeling at different scales to evaluate the productivity
of water. Physics and Chemistry of the Eart 26:877–880.
Droogers P, Torabi M, Akbari M and Pazira E 2001. Field scale modeling to explore salinity in
irrigated agriculture. Irrigation and Drainage 50:77–90.
FAO. 1974. Soil map of the world Volume 1, Legend, FAO Rome Italy, 59 p.
Fischer G, van Velthuizen H, Shah M and Nachtergaele FO 2002.Global agro-ecological
assessment for agriculture in the 21st century: methodology and results. IIASA RR-02-02
2002a Laxenburg, Austria:IIASA.
Fischer, G., Nachtergaele, F., Prieler, S., van Velthuizen, H.T., Verelst, L., Wiberg, D. 2008.
Global Agro-ecological Zones Assessment for Agriculture (GAEZ 2008). IIASA,
Laxenburg, Austria and FAO, Rome, Italy.
Gassman P, Reyes M, Green C and Arnold J 2007. The Soil and Water Assessment Tool:
Historical development, applications, and future research directions. American Society of
Agricultural and Biological Engineers 50(4):1211–1250.
Green Water Credits. 2010. Proof-of-Concept, Sebou catchment (Project Sebou Eau Vert).
Work Plan. Draft.
Hargreaves G and Samani Z 1985. Reference crop evapotranspiration from temperature.
Applied Engineering in Agriculture 1(2):96–99.
Hunink J, Droogers P and Kauffman S 2011. Green Water Credits for the Upper Tana Basin,
Kenya. Evaluation of different management options.
Hunink J, Immerzeel W and Droogers P 2009. Green Water Credits for the Upper Tana Basin,
Kenya. phase II – Pilot Operations. Technical report, FutureWater.
Jabro JD 1992. Estimation of saturated hydraulic conductivity of soils from particle distribution
and bulkdensity data. Transactions of the ASABE 35(2):557-560.
Kauffman S, Droogers P, Odada E, Macharia P, Gicheru P and Dijkshoorn K 2007. Green
Water Credits. green and blue water resources and assessment of soil and water
management scenarios using an integrated modelling framework. Technical report, ISRIC
- World Soil Information.
Lemoine, F.G., Kenyon, S.C., Factor, J.K., Trimmer, R.G., Pavlis, N.K., Chinn, D.S., Cox, C.M.,
Klosko, S.M., Luthcke, S.B., Torrence, M.H., Wang, Y.M., Williamson, R.G., Pavlis, E.C.,
Rapp, R.H., Olson, T.R. 1998. NASA Goddard Space Flight Center, Greenbelt, Maryland,
20771 USA.

71
Monteith et al. 1965 (4.4 climate data).
National Soil Survey Office, 1992. Soil Survey Technique in China. Agricultural Press,
Yan, B., N.F. Fang, P.C. Zhang, and Z.H. Shi, 2013. Impacts of land use change on watershed
streamflow and sediment yield: an assessment using hydrologic modelling and partial
least squares regression. Journal of Hydrology 484 (2013), pp. 26-37.
Links:
http://english.iswc.cas.cn/ns/es/201008/t20100825_57920.html (erosion rate) 04-07-2013.