great lakes shipping study - detroit/wayne · 1 executive summary the great lakes st. lawrence...
TRANSCRIPT

UNCLASSIFIED
UNCLASSIFIED
National Protection and Programs Directorate Integrated Analysis Task Force Homeland Infrastructure Threat and Risk Analysis Center
This page intentionally left blank.
January 13, 2014
Great Lakes Shipping Study

1
Executive Summary
The Great Lakes St. Lawrence Seaway (GLSLS) system is a vast, interconnected series of
navigable waterways, with intersecting modes of transportation and landscapes. The enormity
and importance of the GLSLS system cannot be overstated as the region is critically dependent
upon it; therefore, it is vital to understand the nature of the system, the industries that rely upon
it, its economic impact, and major commodities that flow through the GLSLS. This study
provides an overview of the GLSLS system, focusing on geography, system infrastructure,
economic and employment data derived from the GLSLS, and detailed analysis of three key
commodities: iron ore, steel, and refined petroleum products.
The GLSLS, which borders eight states and spans 2,300 miles, comprises Lake Superior, Lakes
Michigan and Huron, Lake Erie, Montreal-Lake Ontario, and the Saint Lawrence Seaway, as
well as the channels that connect these navigable sections. U.S. and Canadian companies and
industries rely on the GLSLS for low-cost, long-distance transportation of raw materials and
finished goods.
In 2010, U.S. and Canadian companies that depend on the GLSLS for moving cargo reported
revenues of over $30 billion, more than half of which was generated in the United States. The
GLSLS is also responsible for the creation of hundreds of thousands of jobs, providing direct
employment for mariners, many types of port employees, and support positions within the
companies, as well as creating indirect jobs that result from the spending power of the previously
mentioned workers. In 2011, more than 225,000 in the United States and Canada were tied either
directly or indirectly to the GLSLS system. Of those, 57 percent were located in the United
States.
Every year, hundreds of millions of tons of commodities are shipped in the GLSLS.
Commodities include iron ore, coal, limestone, cement, salt, sand, and grain, as well as
chemicals, petroleum, finished products, and containerized cargo to a lesser extent.
Key findings include the following:
The Soo Locks, a system of two functioning parallel locks, represent a single point of
failure for industries that rely on coal, iron ore, and limestone shipments that transit
the GLSLS. Specifically, the Soo Locks System’s Poe Lock is critical, as it is the
only lock in the entire GLSLS system that accommodates 1,000-foot vessels. An
extended disruption of the Poe Lock can potentially disrupt the operations of the
industries that depend on commodities shipped through the Soo Locks system.
The U.S. Army Corps of Engineers (USACE) assesses that 50 percent of the
infrastructure in the GLSLS is failing or had failed, meaning that the infrastructure
is unable to adequately serve the navigation needs for which it was designed.
Low water levels contribute to impact shipping and the challenges of dredging. The
GLSLS has experienced low water levels for more than a decade; however, 2012 set
a new record low for Lakes Michigan and Huron.
Some estimates assess that the GLSLS is currently operating significantly below its
maximum capacity, and indicate that reliance on the GLSLS for shipping will
increase in future years. If dredging backlogs and low water levels remain the norm

2
for the unforeseeable future, growth projections may intersect with physical
constraints in the system.
Use of the GLSLS system is economically efficient due to economies of scale. A 2007
estimate indicated the average cost savings of shipping on the GLSLS was $14.80
per ton when compared to all other modes. A single Laker (type of ship) can haul
approximately 70,000 tons of cargo, which is equivalent to seven 100-car trains. A
ship can travel 607 miles on 1 gallon of fuel per ton of cargo, significantly farther
than freight trains and trucks.
Steel mills located on the GLSLS depend on low-cost transport of raw materials as
an input to the industry. However, the steel industry is not dependent upon the
GLSLS for transport of its outputs, finished steel products, as only 1 percent of
finished U.S. steel is shipped on the GLSLS.
Steel mills that use iron ore as a raw material are more dependent upon the GLSLS
for transport of raw materials than electric arc furnace (EAF) mills that do not use
iron ore as a primary input.
Although some communities and companies are dependent on the GLSLS for
transport of petroleum, the petroleum industry at large is not dependent on the
GLSLS for transport of finished products or raw crude.

3
Table of Contents
Executive Summary .................................................................................................................... 1
Introduction ................................................................................................................................. 6
Methodology ............................................................................................................................... 6
Key Infrastructure Assets ............................................................................................................ 7
Geographic Profile ................................................................................................................... 7
Asset Overview........................................................................................................................ 9
Lock Systems ......................................................................................................................... 10
Soo Locks........................................................................................................................... 10
Other Locks ........................................................................................................................ 11
River/Lake Systems ............................................................................................................... 12
St. Mary’s River ................................................................................................................. 12
St. Clair and Detroit River System .................................................................................... 13
Canals .................................................................................................................................... 14
Welland Canal .................................................................................................................... 14
Montreal-Lake Ontario ...................................................................................................... 15
Ports and Harbors .................................................................................................................. 16
Shipping and Navigation ....................................................................................................... 17
Types of Ships.................................................................................................................... 18
U.S.-Flag vs. Canadian-Flag .............................................................................................. 18
Current Conditions .................................................................................................................... 19
Federal Roles ......................................................................................................................... 19
Dredging ................................................................................................................................ 20
Economic Importance ............................................................................................................... 22
Revenue and Efficiencies ...................................................................................................... 22
Employment Data .................................................................................................................. 23
Key Products and Commodities ................................................................................................ 24
Key Commodities Analysis ....................................................................................................... 25
Iron Ore.................................................................................................................................. 25
Iron Ore Mining and Production ........................................................................................ 26
GLSLS Iron Ore Shipping Volume ................................................................................... 26
Iron Ore Shipment Flows ................................................................................................... 27
Limestone Shipment Flows ................................................................................................... 29
Economic Importance ........................................................................................................ 32
Steel Manufacturing Inputs ................................................................................................... 32
Introduction ........................................................................................................................ 32
Steel Mills and Ports in the GLSLS ................................................................................... 34
Flow of Coke through the GLSLS ..................................................................................... 35
Steel Summary ................................................................................................................... 36
Refined Petroleum Products .................................................................................................. 37
Introduction ........................................................................................................................ 37
The GLSLS Petroleum Network ........................................................................................ 37
GLSLS Petroleum Flows ................................................................................................... 40
Refined Petroleum Product Flow ....................................................................................... 40
GLSLS Island Community Petroleum Product Flow ........................................................ 41
Conclusion ................................................................................................................................. 42
Recommendations for Further Study ........................................................................................ 42

4
Figures
FIGURE 1.—Map of Eight States Bordering the GLSLS. ............................................................. 7
FIGURE 2.—GLSLS Lock Systems and Chokepoints. ................................................................. 8
FIGURE 3.—Great Lakes – St. Lawrence Seaway Profile. (Courtesy of the St. Lawrence Seaway
Management Corporation 2003.) .................................................................................................... 9
FIGURE 4.—Location of Soo Locks............................................................................................ 10
FIGURE 5.—Location of St. Mary’s River. ................................................................................. 12
FIGURE 6.—Location of St. Clair and Detroit River System. .................................................... 13
FIGURE 7.—Location of Welland Canal. .................................................................................... 14
FIGURE 8.—Welland Canal Profile. (Courtesy of the United States and Canada 2007.) ........... 15
FIGURE 9.—Location of Montreal-Lake Ontario. ...................................................................... 15
FIGURE 10.—Dry-Bulk Commodities - GLSLS 1993–2011. (Courtesy of LCA 2012.) ........... 25
FIGURE 11.—Iron Ore Shipped on the GLSLS 1993–2012. (Courtesy of LCA 2012.) ............. 27
FIGURE 12.—Flow Of Iron Ore through the GLSLS. ................................................................ 28
FIGURE 13.—Flow of Limestone through the GLSLS to Iron Ore Shipping Ports. ................... 30
FIGURE 14.—Map of Integrated Steel Mills and Flow of Steel on the GLSLS ......................... 34
FIGURE 15.—Map of Petroleum Flow on the GLSLS. ............................................................... 41
Tables
TABLE 1.—Ten Most Trafficked U.S. Great Lakes Ports (thousands of short tons/year).
(Courtesy of USACE Great Lakes and Ohio River Division 2010.) ............................................ 17
TABLE 2.—2011 U.S.-flag Share of Major Commodities (short tons). (Courtesy of LCA 2012.)
....................................................................................................................................................... 18
TABLE 3.—U.S.-Flag Lakers Allocated to USACE Great Lakes Vessel Classification, 2012.
(Courtesy of DOT MARAD 2013.) .............................................................................................. 19
TABLE 4.—Revenue Losses Due to Draft Restrictions for Classes 8 through 10 Lakers.
(Courtesy of DOT MARAD 2013.) .............................................................................................. 21
TABLE 5.—Great Lakes Jobs by State. (Courtesy of Vaccaro 2011.) ........................................ 24
TABLE 6.—Great Lakes Jobs by Industry. (Courtesy of Vaccaro 2011.) ................................... 24
TABLE 7.—Great Lakes Iron Ore Shipping Ports, United States. (Domestic data courtesy of
USACE 2011; foreign data courtesy of USACE Waterborne Commerce Statistics Center 2011.)
....................................................................................................................................................... 28
TABLE 8.—Great Lakes Iron Ore Receiving Ports, United States. (Domestic data courtesy of
USACE 2011; foreign data courtesy of USACE Waterborne Commerce Statistics Center 2011.)
....................................................................................................................................................... 29
TABLE 9.—Top Five Limestone Shipping Ports in 2011. (Domestic data courtesy of USACE
2011; foreign data courtesy of USACE Waterborne Commerce Statistics Center 2011.) ........... 30
TABLE 10.—Limestone Received at Top Iron Ore Shipping Ports in 2011. (Courtesy of USACE
2011.) ............................................................................................................................................ 31
TABLE 11.—Limestone Receipts in Ports near Steel Mills in the GLSLS. (Courtesy of USACE
2011 and American Iron and Steel Institute.) ............................................................................... 31
TABLE 12.—Economic Impact of Iron Ore Mining on the Minnesota Economy. (Courtesy of
Labovitz School of Business and Economics, University of Minnesota Duluth, 2012.).............. 32

5
TABLE 13.—GLSLS and CAWS Steel Shipments and Receipts 2011. (Courtesy of USACE
Waterborne Commerce Statistics Center 2011.) ........................................................................... 33
TABLE 14.—U.S. Integrated Steel Mills on the Great Lakes. (Courtesy of American Iron and
Steel Institute.) .............................................................................................................................. 35
TABLE 15.—GLSLS and CAWS Petroleum Shipments and Receipts 2011. (Domestic data
courtesy of USACE 2011; foreign data courtesy of USACE Waterborne Commerce Statistics
Center 2011.)................................................................................................................................. 37
TABLE 16.—Petroleum Shipments and Receipts on the GLSLS and CAWS 2011 (Domestic
data courtesy of USACE Waterborne Commerce, 2011; foreign data courtesy of USACE
Waterborne Commerce Statistics Center, 2011.) .......................................................................... 39

6
Introduction
The purpose of this report is to provide an orientation to the Great Lakes St. Lawrence Seaway
(GLSLS), identify likely risks associated with critical infrastructure, briefly analyze several key
commodities that are transported in the system, describe possible economic impacts of a
disruption, and identify future study areas for the GLSLS. Although both Canada and the United
States use the GLSLS to transport goods over long distances, this report mostly covers U.S.
infrastructure, vessels, and commodities. Where available, some figures for Canadian
infrastructure, vessels, and commodities have been provided, but with less detail because of
constraints on the availability of data.
Critical infrastructure stakeholders in the Great Lakes region have requested analysis of the
transit of iron ore, steel inputs, and petroleum products within the GLSLS system. Because the
analysis focuses on the shipping of these commodities on the system, it does not include
environmental factors or the recreational boating industry. For each of the commodities, the
origin of raw materials, the GLSLS’s economic importance, and its dependencies are identified
with respect to shipping. The commodity analysis does not account for all dependencies or
economic effects of the industry at large. An attempt has been made to estimate the portion of
each commodity that is actually shipped on the system.1,2
Methodology
Stakeholders in the Great Lakes Region understand their own relationship to the GLSLS, but this
study offers an introductory overview of the system for interested parties both with and without
detailed knowledge of the GLSLS. Deciding upon the areas of focus for this study involved
collecting and evaluating input from multiple stakeholders, including officials from the State
Fusion Centers, the Homeland Security Offices, and the Protective Security Advisors with the
Department of Homeland Security’s Office of Infrastructure Protection. Discussions about the
system considered what aspects of the shipping industry and infrastructure are important to
analyze and which commodities need further analysis. The focus of this analysis is a product of a
compromise of those interests and concerns. The consensus view that emerged decided on
defining geographic boundaries, related infrastructure, and general patterns of trade. It was then
decided that iron ore, steel and petroleum were three commodities that should be explored in
detail.
1 All figures are in short tons (2,000 pounds), and conversions from metric tons to short tons were completed by multiplying metric ton figures
by 1.10231. 2 U.S. Energy Information Administration, Frequently Asked Questions, 2012, at www.eia.gov/tools/faqs/faq.cfm?id=7&t=2, accessed June 4,
2013.

7
Key Infrastructure Assets
Geographic Profile
The GLSLS spans 2,300 miles of the northern United States, from eastern Minnesota, through
the upper Midwest and southeastern Canada, to the Gulf of St. Lawrence in eastern Canada. The
GLSLS borders eight U.S. States: Minnesota, Wisconsin, Michigan, Illinois, Indiana, Ohio,
Pennsylvania, and New York (see Figure 1).
FIGURE 1.—Map of Eight States Bordering the GLSLS.
The system can be divided into five main navigable sections: Lake Superior, Lakes Michigan
and Huron (hydrographically considered one body of water), Lake Erie, Montreal-Lake Ontario
(MLO), and the St. Lawrence Shipping Channel. Six channels connect the navigable sections of
the GLSLS and unite the region into one system (see Figure 2). The Soo Locks system controls
the eastern entry and exit to Lake Superior. Lakes Michigan and Huron are “down bound” of the
Soo Locks system. Lake Erie is situated between the St. Clair River at its west end and the
Welland Canal, which separates Lake Erie from Lake Ontario to the east. MLO stretches from
the Welland Canal east to the city of Montreal. The last section spans the waterway from
Montreal to the St. Lawrence Shipping Channel, which empties into the Atlantic Ocean.

8
FIGURE 2.—GLSLS Lock Systems and Chokepoints.
The annual GLSLS shipping season begins in March and generally lasts until late December.
During the winter months, the extent and duration of ice cover determines the length of the
shipping season.3 Since 1959, new technologies against ice formation in locks and canals have
extended the shipping season by more than 25 days.4
Between 1996 to 2005, the average
navigation season lasted 276 days.5
Although the overall shipping season is considered to be approximately 10 months, individual
infrastructure is also governed by weather conditions, especially ice in the waterways. In the St.
Lawrence Seaway, ice breaking and other ice management activities are often required near the
beginning and end of the season, depending on weather conditions. Generally, the Seaway from
Montreal to Lake Erie operates on a nine-and-a-half-month season, while on the upper Great
Lakes, the Soo Locks are open for approximately 10 months.6
3 USACE, Great Lakes and Ohio River Division, Supplemental Reconnaissance Report, Great Lakes Navigation System Review, 2010, p. 86. 4 USACE, Great Lakes and Ohio River Division, Supplemental Reconnaissance Report, Great Lakes Navigation System Review, 2010, p. 27. 5 USACE, Great Lakes and Ohio River Division, Supplemental Reconnaissance Report, Great Lakes Navigation System Review, 2010, p. 86. 6 USACE, Great Lakes and Ohio River Division, Supplemental Reconnaissance Report, Great Lakes Navigation System Review, 2010, p. 31.

9
Asset Overview
The composition of the GLSLS system consists mostly of open waterways that act as a series of
large reservoirs (a profile of the overall system is shown in Figure 3). These reservoirs are
connected by a series of manmade and natural canals, locks systems, and straits that represent the
most significant locations for navigational restrictions and hazards. Three lock systems and three
canals without locks make up the six channels. The lock systems include: the Soo Locks system
(2 locks currently in use, 4 total), Welland Canal (8 locks), and MLO (7 locks). The canal
systems include the St. Mary’s River, the Straits of Mackinac, and the Detroit/St. Clair River
System.
FIGURE 3.—Great Lakes – St. Lawrence Seaway Profile. (Courtesy of the St. Lawrence Seaway Management Corporation, 2003.)
Roughly 45 percent of all cargo traffic travels far enough to transit at least one component or a
combination of the Soo Locks system, Welland Canal, or MLO lock system.7 These locks
systems represent a limiting factor on cargo volume in terms of ship size and draft depth
depending on conditions. For instance, low water levels can cause a ship’s draft to be severely
restricted at these critical points. The volume of bulk cargo is constrained by the lowest draft
depth in a vessel’s path. The U.S. Army Corps of Engineers (USACE) is charged with
maintaining much of the infrastructure and navigation channels in the GLSLS system. Currently,
there are 47 deep draft ports, 55 shallow draft ports, and 745 miles of navigation channels that
must be dredged and maintained.8 Between 1995 and 2003, the GLSLS moved an average of
approximately 287 million tons of cargo annually. Dry-bulk commodities, such as iron ore,
stone, coal, and grain, make up more than 80 percent of the average yearly cargo. The remainder
of cargo consists of non-bulk items such as finished products, containerized cargo, and liquid-
bulk items.
Other infrastructure which supports shipping or is connected to the GLSLS system includes a
network of more than 40 highways and 30 railway lines. Although the GLSLS is a water
navigation system, its intersections with other modes of transportation are critical components to
7 Vaccaro, L., Vital to Our Nation’s Economy: Great Lakes Jobs 2011 Report, 2011.See footnote 14, p. 2. 8 USACE, Great Lakes and Ohio River Division, Supplemental Reconnaissance Report, 2010, p. 77.

10
its functionality and economic viability.9 Ports are the main gateway onto and off of the GLSLS.
There are more than 85 commercial ports and 117 Federal harbors on the GLSLS that ship and
receive freight and provide safety for ships during inclement weather.10
The ports generate jobs,
personal income, and revenue in the localities they serve.
Lock Systems
Soo Locks
FIGURE 4.—Location of Soo Locks.
The Soo Locks system is a vital link between ports at the Canadian Lakehead and Minnesota that
move raw materials to ports in the lower Great Lakes. The locks, originally built in 1855, are
located on the St. Mary’s River, at Sault Ste. Marie, Michigan. The locks allow ships to traverse
the 21-foot drop between Lake Superior and Lake Huron, and connect Lake Superior to the rest
of the GLSLS. The facility currently includes four locks: Poe and MacArthur, which are still in
operation, and Sabine and Davis, which are no longer operational. Although there are two
functioning locks in the system, a ship must pass through only one as the locks are positioned in
parallel and not in succession like those in the Welland Canal or the MLO. The MacArthur and
Poe locks handle commercial freight in the region but only the Poe lock can accommodate the
largest ships on the Great Lakes.11
9 USACE Great Lakes and Ohio River Division, Supplemental Reconnaissance Report, 2010, p. 22. 10 DOT MARAD (U.S. Department of Transportation Maritime Administration), Status of the U.S.-Flag Great Lakes Water Transportation
Industry, 2013, p. 33. 11 USACE Detroit District, “Celebrating 150 Years at ‘The Soo,’” Great Lakes Update, Vol. 159, 2005.

11
The Poe Lock represents a single point of failure for the many industries that depend on
shipments throughout the Great Lakes system. More than 90 percent of the iron ore (the highest
volume commodity on the GLSLS) that is produced in the United States must pass through the
Soo Locks system in order to reach steel mills in the lower Great Lakes region.12
Iron ore and
coal are the two highest volume commodities shipped through the Soo Locks system, and the
annual total traffic through the locks is about 80 million tons of all types of cargo.13
Because of
the Poe Lock’s ability to accommodate all sizes of ships, if the lock were to be taken out of
service, approximately 70 percent of all traffic through the St. Mary’s River would be halted,
including key commodities essential to the steel industry and potentially cutting off some power
plants from their source of coal.14
There are plans to construct another lock at the Soo Locks site
that would be able to handle 1,000-foot vessels in order to add redundancy to the system;
however, as of the publishing date of this report, construction on this project has stopped
indefinitely because of funding issues.15
Other Locks
The USACE also operates the Chicago Lock in Chicago, IL, and the Black Rock Lock in
Buffalo, New York. Located in downtown Chicago, the Chicago Lock allows for passage
between Lake Michigan and the Chicago River for over 35,000 commercial and recreational
boats, transporting 680,000 passengers and approximately 125,000 tons of cargo annually. The
Chicago Lock overcomes a 2- to 5-foot change in elevation and helps to control flooding in the
Chicago area.16
The Black Rock Lock provides safe passage between Buffalo Harbor and
Tonawanda Harbor by routing boats around obstacles, rapids, and fast currents in the upstream
portion of the Niagara River.17
More than 300 commercial and 1,300 recreational boats navigate
this lock annually.18
12 USACE, Waterborne Commerce of the United States, 2011. 13 USACE Great Lakes Navigation Team, Great Lakes Navigation System: Economic Strength to the Nation, 2009, p. 8. 14 USACE Great Lakes Navigation Team, Great Lakes Navigation System: Economic Strength to the Nation, 2009, p. 8. 15 NOAA, United States Coast Pilot 6, 43rd Edition, U.S. Department of Commerce, 2013, p. 406. 16 USACE Great Lakes and Ohio River Division, Supplemental Reconnaissance Report, Great Lakes Navigation System Review, 2010, p. 32. 17 USACE Buffalo District, Black Rock Lock, Buffalo, New York, undated, at
www.lrb.usace.army.mil/Missions/Recreation/BlackRockLock.aspx, accessed June 4, 2013. 18 USACE Great Lakes and Ohio River Division, Supplemental Reconnaissance Report, Great Lakes Navigation System Review, 2010, p. 32.

12
River/Lake Systems
St. Mary’s River
FIGURE 5.—Location of St. Mary’s River.
The St. Mary’s River is a 63-mile-long deep-draft commercial channel composed of both natural
features and manmade structures that connect the east end of Lake Superior at the Soo Locks,
with the northern end of Lake Huron. Continuous dredging maintains a target depth of 27 feet in
order to accommodate the ships that transit the area.19
Because the opening of the ship canal has
increased the flow of water, there is an extensive system in place to control the flow out of Lake
Superior. The control system structures include two hydroelectric plants, five navigation locks
(four at the Soo Locks and one Canadian lock), and a 16-gated control structure at the head of
the St. Mary’s Rapids.20
The average monthly water fluctuations in the St. Mary’s River are
about 1 foot; however, the water levels can change daily by several inches to as much as 1 foot.
These conditions—along with swift currents, narrow channels, and shallow depths—make the
St. Mary’s River a potentially hazardous segment of the GLSLS.
19 USACE Detroit District, St. Mary’s River, undated, at www.lre.usace.army.mil/Missions/
GreatLakesInformation/Outflows/DischargeMeasurements/StMarysRiver.aspx, accessed June 4, 2013. 20 USACE Great Lakes and Ohio River Division, Supplemental Reconnaissance Report, Great Lakes Navigation System Review, 2010, p. 33.

13
St. Clair and Detroit River System
FIGURE 6.—Location of St. Clair and Detroit River System.
The St. Clair and Detroit River System connects Lake Huron to Lake Erie. Water from Lake
Huron flows through the St. Clair River, connects to a shipping channel through Lake St. Clair,
and then flows into the Detroit River and on to Lake Erie. An average of 65 million tons of cargo
transit the river annually, generating $1.83 billion and supporting 41,000 jobs in the area.21
The St. Clair River is approximately 39 miles long and connects the southern end of Lake Huron
with the northern end of Lake St. Clair. There is a natural 5-foot change in elevation in the river,
and there are no control structures to limit the flow of water through the system.22
The St. Clair
River is a deep-draft commercial channel that is maintained at 27.1 to 30 feet in depth through
regular dredging cycles, the last of which was completed in 2012. The St. Clair River empties
into Lake St. Clair, which contains a 14.5-mile channel.23
The Detroit River is 32 miles long and connects the southern end of Lake St. Clair to the west
end of Lake Erie. The shipping channels are maintained at 25–29 feet deep. Approximately
59.3 million tons of cargo transits the river every year. Major U.S. ports include the Port of
Detroit and the Rouge River Wharf, which are both major industrial ports involved in the iron
ore trade.24
21 USACE, St. Clair River, MI fact sheet, April, 2013, at
www.lre.usace.army.mil/Portals/69/docs/Navigation/FactSheets2013/St.%20Clair%20River.pdf, accessed June 4, 2013. 22 USACE Great Lakes and Ohio River Division, Supplemental Reconnaissance Report, 2010, p. 35. 23 USACE Detroit District, Channels in Lake St. Clair, MI fact sheet, April, 2013, at
www.lre.usace.army.mil/Portals/69/docs/Navigation/FactSheets2013/Channels%20in%20Lake%20St%20Clair.pdf, accessed June 4, 2013. 24 USACE Detroit District, Detroit River, MI fact sheet, April, 2013, at
www.lre.usace.army.mil/Portals/69/docs/Navigation/FactSheets2013/Detroit%20River.pdf, accessed June 4, 2013.

14
Canals
The St. Lawrence Seaway, which includes the MLO and Welland Canal, handles approximately
4,000 ships and 44 million tons of cargo during a single navigation season.25
This region is the
gateway to ocean shipping for the entire GLSLS system and a transshipment point for cargo
arriving from and destined for international markets.
Welland Canal
FIGURE 7.—Location of Welland Canal.
In its current configuration, the Welland Canal was finished in 1932 and is owned by the
Canadian Government and operated by the Canadian St. Lawrence Seaway Management
Corporation. Its purpose is to accommodate the 326.5-foot change in elevation between Lake
Ontario and Lake Erie and circumvent Niagara Falls (see Figure 8). The entire system is 27 miles
long and consists of eight locks with an average lift of 46.5 feet per lock.26
Many U.S. ships are
too large (1,014 feet long by 105 feet wide) to traverse the Welland Canal, which can
accommodate ships that are up to 740 feet long and 78 feet wide, a standard known as the
“Seaway Max.” The canal can support Canadian-flag ships, which are usually built to Seaway
Max standard or smaller.
The canal handles approximately 41 million tons of cargo annually, most of which consists of
iron ore that is up bound from the St. Lawrence River into Lake Erie and grain that is
25 The St. Lawrence Seaway Management Corporation, The Montreal/Lake Ontario Section of the Seaway, 2003, at www.greatlakes-
seaway.com/en/pdf/mlo.pdf, accessed June 4, 2013. 26 St. Lawrence Seaway Management Corporation, The Welland Canal Section of the St. Lawrence Seaway, 2003, at www.greatlakes-
seaway.com/en/pdf/welland.pdf, accessed June 4, 2013.

15
down bound from the four upper lakes into Lake Ontario.27
Grain is loaded in the Thunder Bay
region of Canada and shipped to ports in the lower St. Lawrence River.
FIGURE 8.—Welland Canal Profile. (Courtesy of the United States and Canada, 2007.28
)
Montreal-Lake Ontario
FIGURE 9.—Location of Montreal-Lake Ontario.
27 Transport Canada, U.S. Army Corps of Engineers, U.S. Department of Transportation, The St. Lawrence Seaway Management Corporation,
Saint Lawrence Seaway Development Corporation, Environment Canada, and U.S. Fish and Wildlife Service. Great Lakes St. Lawrence Seaway Study: Final Report. Fall 2007. www.marad.dot.gov/documents/GLSLs_finalreport_Fall_2007.pdf, p. 25–26.
28 Transport Canada, U.S. Army Corps of Engineers, U.S. Department of Transportation, The St. Lawrence Seaway Management Corporation,
Saint Lawrence Seaway Development Corporation, Environment Canada, and U.S. Fish and Wildlife Service. Great Lakes St. Lawrence Seaway Study: Final Report. Fall 2007. www.marad.dot.gov/documents/GLSLs_finalreport_Fall_2007.pdf, p. 24.

16
The completion of the MLO in 1959 permitted bulk cargo to transit between the St. Lawrence
River and Lake Ontario (see Figure 2 for location within the GLSLS). This provided commercial
traffic access to the Atlantic Ocean via the entire GLSLS system. This portion of the GLSLS
system handles approximately 12 percent of the yearly traffic on the GLSLS.29
Iron ore shipped
from the Labrador mining complex in Quebec, Canada, is one of the main commodities moved
through the MLO; various grains, coal, salt, stone, and manufactured products are also
transported through this section.
Using a series of seven locks, the MLO moves ships over 226 feet in elevation from Montreal,
Quebec, to Iroquois, Ontario, Canada. Five of the locks are owned by the Canadian Government:
St. Lambert Lock, Cote Ste., Catherine Lock, Beauharnois Lock, and Iroquois Lock. The other
two locks are owned by the U.S. Government: Snell Lock and Eisenhower Lock. Similar to the
Welland Canal, all seven MLO locks are configured to support Seaway Max standards.30
To compensate for the increased water flow three major control structures were constructed: the
Moses-Saunders, Long Sault, and Iroquois Dams. These dams also control the flow of water
during flooding or drought conditions.31
Ports and Harbors
Great Lakes ports and harbors are transfer points for all traffic on the GLSLS system. Although
the system ports usually have easy road access, fewer ports have rail access. Ports require rail
access to receive raw materials from mines or manufacturing plants. In addition, some ports
receive commodities by ship and then rely on rail service to deliver them to factories, mills, and
markets. In many cases, ports are involved in both shipping and receiving.32
Great Lakes transportation and shipping networks have been developed to minimize shipping
time, cost, and required resources. In order to accomplish this goal, a complex combination of
infrastructure investment, ship technology, and intermodal freight transfers all converge at a
series of key ports throughout the GLSLS.33
One such port is the Superior Midwest Energy
Terminal, constructed in 1976 at the Port of Superior, Wisconsin. The terminal receives coal
from the Powder River Basin (PRB) in Wyoming and can handle two 123-car trains
simultaneously, offloading them at a rate of 5,000 tons per hour (TPH); the port can store 5
million tons of coal onsite. The terminal loads 1,000-foot vessels at a rate of 11,500 TPH and
ships a large portion of this cargo through the GLSLS system for the Detroit Edison Company.34
There are more than 85 commercial ports (70 serviced by U.S.-flag lakers) and 117 federal
harbors on the GLSLS. A small number of ports move most of the cargo on the GLSLS every
29 Transport Canada, U.S. Army Corps of Engineers, U.S. Department of Transportation, The St. Lawrence Seaway Management Corporation,
Saint Lawrence Seaway Development Corporation, Environment Canada, and U.S. Fish and Wildlife Service. Great Lakes St. Lawrence
Seaway Study: Final Report. Fall 2007. www.marad.dot.gov/documents/GLSLs_finalreport_Fall_2007.pdf, p. 2. 30 The St. Lawrence Seaway Management Corporation, The Montreal/Lake Ontario Section of the Seaway, 2003, at www.greatlakes-
seaway.com/en/pdf/mlo.pdf, accessed June 4, 2013. 31 USACE Detroit District, St. Lawrence River, undated, at www.lre.usace.army.mil/Missions/
GreatLakesInformation/Outflows/DischargeMeasurements/StLawrenceRiver.aspx, accessed June 4, 2013. 32 USACE Great Lakes and Ohio River Division, Supplemental Reconnaissance Report, Great Lakes Navigation System Review, 2010. 33 DOT MARAD, Status of the U.S.-Flag Great Lakes Water Transportation Industry, 2013, p. 32. 34 Midwest Energy Resources Company, About Us, 2013, at www.midwestenergy.com/about.php, accessed June 4, 2013.
17
year.35
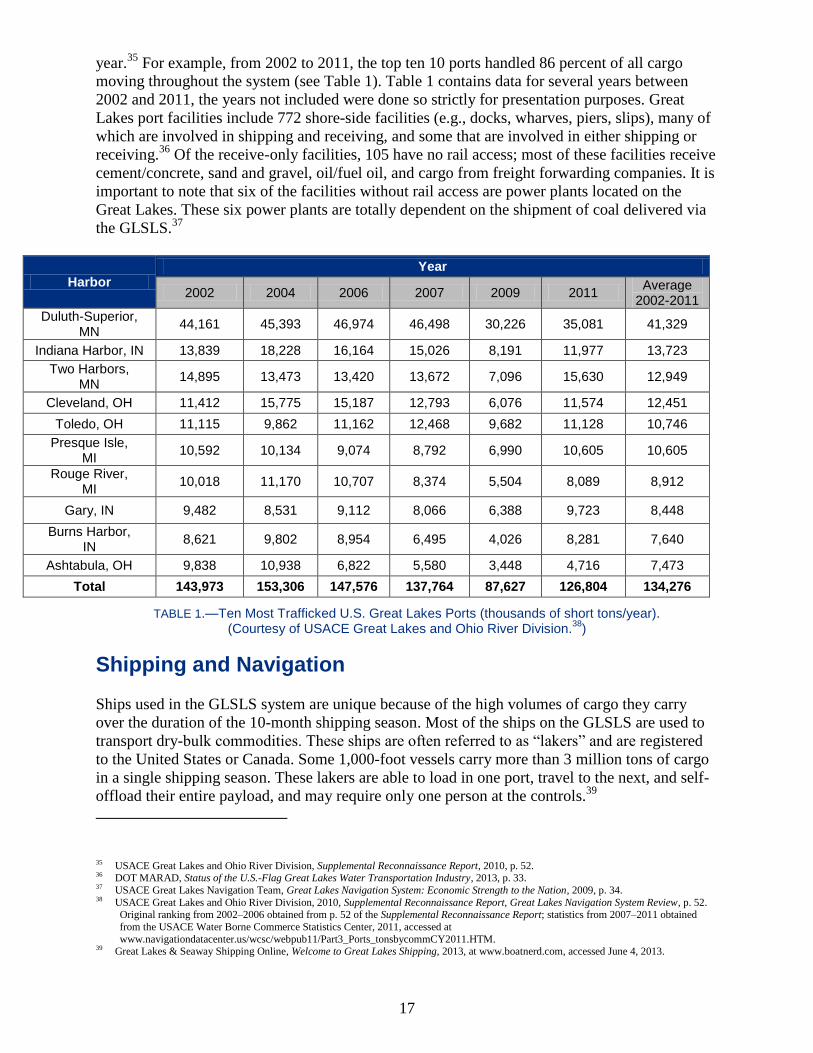
For example, from 2002 to 2011, the top ten 10 ports handled 86 percent of all cargo
moving throughout the system (see Table 1). Table 1 contains data for several years between
2002 and 2011, the years not included were done so strictly for presentation purposes. Great
Lakes port facilities include 772 shore-side facilities (e.g., docks, wharves, piers, slips), many of
which are involved in shipping and receiving, and some that are involved in either shipping or
receiving.36
Of the receive-only facilities, 105 have no rail access; most of these facilities receive
cement/concrete, sand and gravel, oil/fuel oil, and cargo from freight forwarding companies. It is
important to note that six of the facilities without rail access are power plants located on the
Great Lakes. These six power plants are totally dependent on the shipment of coal delivered via
the GLSLS.37
Harbor
Year
2002 2004 2006 2007 2009 2011 Average
2002-2011
Duluth-Superior, MN
44,161 45,393 46,974 46,498 30,226 35,081 41,329
Indiana Harbor, IN 13,839 18,228 16,164 15,026 8,191 11,977 13,723
Two Harbors, MN
14,895 13,473 13,420 13,672 7,096 15,630 12,949
Cleveland, OH 11,412 15,775 15,187 12,793 6,076 11,574 12,451
Toledo, OH 11,115 9,862 11,162 12,468 9,682 11,128 10,746
Presque Isle, MI
10,592 10,134 9,074 8,792 6,990 10,605 10,605
Rouge River, MI
10,018 11,170 10,707 8,374 5,504 8,089 8,912
Gary, IN 9,482 8,531 9,112 8,066 6,388 9,723 8,448
Burns Harbor, IN
8,621 9,802 8,954 6,495 4,026 8,281 7,640
Ashtabula, OH 9,838 10,938 6,822 5,580 3,448 4,716 7,473
Total 143,973 153,306 147,576 137,764 87,627 126,804 134,276
TABLE 1.—Ten Most Trafficked U.S. Great Lakes Ports (thousands of short tons/year). (Courtesy of USACE Great Lakes and Ohio River Division.
38)
Shipping and Navigation
Ships used in the GLSLS system are unique because of the high volumes of cargo they carry
over the duration of the 10-month shipping season. Most of the ships on the GLSLS are used to
transport dry-bulk commodities. These ships are often referred to as “lakers” and are registered
to the United States or Canada. Some 1,000-foot vessels carry more than 3 million tons of cargo
in a single shipping season. These lakers are able to load in one port, travel to the next, and self-
offload their entire payload, and may require only one person at the controls.39
35 USACE Great Lakes and Ohio River Division, Supplemental Reconnaissance Report, 2010, p. 52. 36 DOT MARAD, Status of the U.S.-Flag Great Lakes Water Transportation Industry, 2013, p. 33. 37 USACE Great Lakes Navigation Team, Great Lakes Navigation System: Economic Strength to the Nation, 2009, p. 34. 38 USACE Great Lakes and Ohio River Division, 2010, Supplemental Reconnaissance Report, Great Lakes Navigation System Review, p. 52.
Original ranking from 2002–2006 obtained from p. 52 of the Supplemental Reconnaissance Report; statistics from 2007–2011 obtained
from the USACE Water Borne Commerce Statistics Center, 2011, accessed at
www.navigationdatacenter.us/wcsc/webpub11/Part3_Ports_tonsbycommCY2011.HTM. 39 Great Lakes & Seaway Shipping Online, Welcome to Great Lakes Shipping, 2013, at www.boatnerd.com, accessed June 4, 2013.

18
Types of Ships
The three major types of vessels that characterize shipping in the GLSLS system are U.S.-flag
lakers, Canadian-flag lakers, and Seaway Max vessels. Although U.S.-flag lakers have a larger
per-trip carrying capacity than Canadian-flag lakers, Canadian-flag lakers are more modern and
efficient. In 2011, U.S.-flag lakers carried approximately 76 percent of iron ore, 73 percent of
coal, 76 percent of limestone, 13 percent of salt, and 70 percent of cement shipped on the Great
Lakes (see Table 2).40
Other ships that transport commodities on the GLSLS include various
tug/barge configurations, as well as liquid bulk tankers that transport chemicals, petroleum, and
other liquids.
Commodity U.S.-Flag Total Total Great Lakes U.S.-Flag Share
of Trade (%)
Iron Ore 47,224,743 61,354,552 76.97
Coal 20,239,327 27,616,116 73.29
Limestone 21,434,839 28,153,642 76.13
Salt 1,452,134 10,879,102 13.35
Cement 2,817,846 4,019,675 70.10
TABLE 2.—2011 U.S.-flag Share of Major Commodities (short tons). (Courtesy of LCA 2012.41
)
U.S.-Flag vs. Canadian-Flag
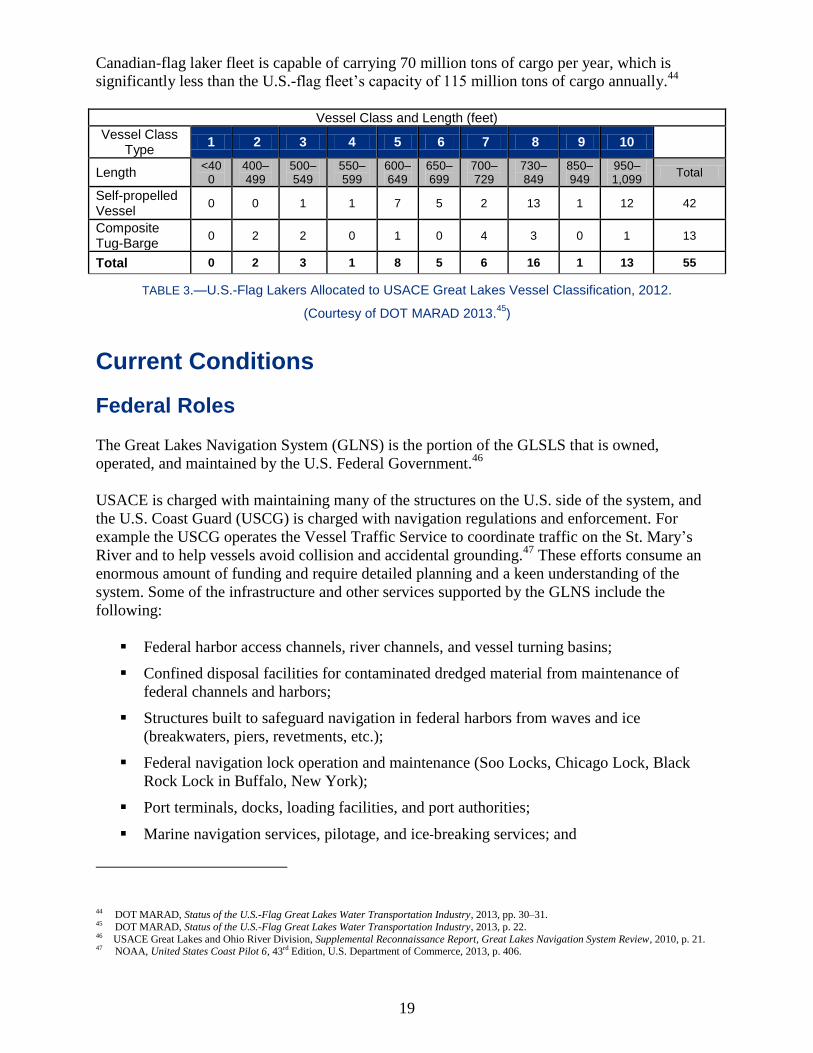
The 55 U.S.-flag lakers used to transport dry-bulk commodities can be classified as self-
propelled and composite tug-barges that the USACE designates with a class number 1 through
10 according to vessel length (see Table 3). All but two of these ships are self-offloading. Fifty-
five percent of the vessels in the dry-bulk fleet are in classes 8 to 10; as a result, they are too
large to transit the Welland Canal and can only operate on the four upper Great Lakes, and the
Poe Lock in St. Mary’s River is the only lock in the Soo Locks system that can accommodate
ships in those classes 8 through 10. Though vessels in Classes 1 to 7 can navigate the Welland
Canal, it is rare for one to transit the St. Lawrence Seaway. This profile defines not only the fleet
but also the infrastructure at the ports that rely on the self-offloading capabilities of U.S.-flag
lakers.42
In comparison to U.S.-flag lakers, Canadian-flag lakers are smaller and usually conform to the
Seaway Max standard, enabling most of the fleet to move freely throughout the GLSLS.43
Foreign vessels that enter the GLSLS, often called “salties,” also must be built to these
dimensions to ensure that they can navigate the Welland Canal and the MLO section. The
40 Lake Carriers’ Association (LCA), 2012 Statistical Annual Report, U.S.-Flag Share of Major Commodities: 1993–2012, 2012, at www.lcaships.com/wp-content/uploads/2013/03/U.S.-Flag-Share-of-Major-Commodities2.pdf, accessed June 4, 2013.
41 Figures extracted from LCA, 2012 Statistical Annual Report, U.S.-Flag Share of Major Commodities: 1993–2012, 2012, at
www.lcaships.com/wp-content/uploads/2013/03/U.S.-Flag-Share-of-Major-Commodities2.pdf, accessed June 4, 2013. 42 DOT MARAD, Status of the U.S.-Flag Great Lakes Water Transportation Industry, 2013, p. 22. 43 Transport Canada, U.S. Army Corps of Engineers, U.S. Department of Transportation, The St. Lawrence Seaway Management Corporation,
Saint Lawrence Seaway Development Corporation, Environment Canada, and U.S. Fish and Wildlife Service. Great Lakes St. Lawrence Seaway Study: Final Report. Fall 2007. www.marad.dot.gov/documents/GLSLs_finalreport_Fall_2007.pdf, p. 23.
19
Canadian-flag laker fleet is capable of carrying 70 million tons of cargo per year, which is
significantly less than the U.S.-flag fleet’s capacity of 115 million tons of cargo annually.44
Vessel Class and Length (feet)
Vessel Class Type
1 2 3 4 5 6 7 8 9 10
Length <40
0 400–499
500–549
550–599
600–649
650–699
700–729
730–849
850–949
950–1,099
Total
Self-propelled Vessel
0 0 1 1 7 5 2 13 1 12 42
Composite Tug-Barge
0 2 2 0 1 0 4 3 0 1 13
Total 0 2 3 1 8 5 6 16 1 13 55
TABLE 3.—U.S.-Flag Lakers Allocated to USACE Great Lakes Vessel Classification, 2012.
(Courtesy of DOT MARAD 2013.45
)
Current Conditions
Federal Roles
The Great Lakes Navigation System (GLNS) is the portion of the GLSLS that is owned,
operated, and maintained by the U.S. Federal Government.46
USACE is charged with maintaining many of the structures on the U.S. side of the system, and
the U.S. Coast Guard (USCG) is charged with navigation regulations and enforcement. For
example the USCG operates the Vessel Traffic Service to coordinate traffic on the St. Mary’s
River and to help vessels avoid collision and accidental grounding.47
These efforts consume an
enormous amount of funding and require detailed planning and a keen understanding of the
system. Some of the infrastructure and other services supported by the GLNS include the
following:
Federal harbor access channels, river channels, and vessel turning basins;
Confined disposal facilities for contaminated dredged material from maintenance of
federal channels and harbors;
Structures built to safeguard navigation in federal harbors from waves and ice
(breakwaters, piers, revetments, etc.);
Federal navigation lock operation and maintenance (Soo Locks, Chicago Lock, Black
Rock Lock in Buffalo, New York);
Port terminals, docks, loading facilities, and port authorities;
Marine navigation services, pilotage, and ice‐breaking services; and
44 DOT MARAD, Status of the U.S.-Flag Great Lakes Water Transportation Industry, 2013, pp. 30–31. 45 DOT MARAD, Status of the U.S.-Flag Great Lakes Water Transportation Industry, 2013, p. 22. 46 USACE Great Lakes and Ohio River Division, Supplemental Reconnaissance Report, Great Lakes Navigation System Review, 2010, p. 21. 47 NOAA, United States Coast Pilot 6, 43rd Edition, U.S. Department of Commerce, 2013, p. 406.

20
Shipping companies and shipping and logistics service providers.48
In 2010, the USACE estimated that 50 percent of the infrastructure in the GLSLS was failing or
had failed.49
Failing/failed in that assessment was described an inability to adequately serve the
navigation needs for which it was designed. Aging infrastructure, decreasing budget, and
sustained low water levels are the reasons given for the inability to properly maintain the system.
In response, USACE developed the GLNS Five Year Development Plan. Funding and resource
allocation issues have delayed or halted progress of the implementation of the plan. The plan
focuses on the following five priorities for reducing risk and improving reliability:
Restoration of locks
Construction of a new lock at the Soo Locks Complex
Removal of dredging backlog
Expansion and construction of dredged material disposal facilities
Repair of breakwaters and structures
Dredging
The lack of dredging in the GLSLS has been a major concern for many years. Dredging is the
physical removal of sediments on the bottom of the waterway in order to increase the overall
depth of the water in a given area. Dredging is most needed in the connecting canals, rivers,
ports, and harbors, where sedimentation tends to build up over time. Currently, the USACE
estimates that it costs approximately $40 million annually to keep up with the dredging needs of
the GLSLS; however, another $200 million will be required to clear the current dredging
backlog.50
The Lake Carriers Association estimates that 17 million cubic yards of sediment needs
to be dredged from waterways and harbors on the Great Lakes.51
Dredging backlogs resulting from reduced funding coupled with a decade of low water levels has
caused significant issues for shippers in the system. Although only 10 percent of the system
needs to be dredged, this remains a critical concern because lack of dredging is a major limiting
factor for navigation of ships carrying cargo through canals, locks, and ports: for example, for a
1,000-foot vessel, the loss of 1 inch of depth equates to a loss of 270 tons of cargo per trip. 52,53
The U.S. Department of Transportation Marine Administration (MARAD) equates this to an
8 percent increase in price per ton for a Class 10 laker and an approximately 9 percent increase
for a Class 8 laker.54
When dredging is not conducted or is conducted poorly, commercial ships “light load” to reduce
the total payload of the ship and reduce the draft. This practice is currently being adopted on a
system-wide basis to avoid grounding. For example, Toledo Harbor typically has problems with
48 USACE Great Lakes and Ohio River Division, Supplemental Reconnaissance Report, Great Lakes Navigation System Review, 2010, p. 22. 49 USACE, Great Lakes and Ohio River Division, Supplemental Reconnaissance Report, Great Lakes Navigation System Review, 2010, p. 31. 50 USACE Great Lakes Navigation Team, Great Lakes Navigation System: Economic Strength to the Nation, 2009, p. 13. 51 LCA, 2012 Annual Report of Lake Carriers’ Association, 2012. 52 USACE Great Lakes Navigation Team, Great Lakes Navigation System: Economic Strength to the Nation, 2009, p. 4. 53 Great Lakes Commission, Great Lakes Dredging Team, Dredging and the Great Lakes, 1999, p. 4. 54 DOT MARAD, Status of the U.S.-Flag Great Lakes Water Transportation Industry, 2013, p. 70.

21
dredging due to river sedimentation and agricultural runoff. According to the USACE, 850,000
cubic yards of material are removed from Toledo Harbor every year. This is necessary because,
according to USACE calculations, a two- to three-foot loss of channel depth would result in an
annual increase in transportation costs of $752,000 to $2 million.55
TABLE 4.—Revenue Losses Due to Draft Restrictions for Classes 8 through 10 Lakers (Courtesy of DOT MARAD, 2013.
56)
Low water levels contribute to the challenges of dredging. The GLSLS has experienced low
water levels for more than a decade; however, 2012 set a new record low for Lakes Michigan
and Huron. Water levels in the Great Lakes depend on many factors, and little can be done to
maintain the levels in years of low runoff into the Great Lakes basin, but as long as dredging
backlogs and low water levels persist, light loading will continue. As an extreme case, the Port of
Dunkirk located on Lake Erie in New York was closed to commercial ship traffic in 2005 due to
lack of dredging and low water levels, which has forced the collocated power plant to receive its
coal by rail only—which increases coal costs and results in increased environmental impacts
associated with rail transportation.57
Because this combination of factors will most likely persist
for some time, future studies are necessary to determine the full effect of low water levels on the
shipping industry in the GLSLS.
In the GLSLS, a large portion of the sediments removed by dredging must be stored safely
because this material is contaminated from decades of industrial chemical use, which increases
the cost of the dredging process. Plans for dredging must be made in conjunction with plans to
handle dredged materials. The method chosen for removal and storage is site-specific and
depends on various factors. For example, the CDF for Cleveland Harbor is near its capacity, and
although plans are in place to build a new one, if this process is delayed, dredging operations will
cease until an alternative can be established.58
55 USACE Buffalo District, Toledo Harbor, OH, fact sheet, 2013, at www.lre.usace.army.mil/
Portals/69/docs/Navigation/FactSheets2013/Toledo_Harbor-OH09.pdf, accessed June 4, 2013. 56 U.S. Environmental Protection Agency, Office of Solid Waste, Extraction and Beneficiation of Ores and Minerals, 1994, Volume 3, Iron,
1994, at www.epa.gov/osw/nonhaz/industrial/special/mining/techdocs/iron.pdf#page=12, accessed June 5, 2013. Table based on 24 inches
of lost depth; 30 other vessels that are affected by draft are not included. Dredging is case specific and may not affect ships system wide; there is also one class 9 laker included in the class 8 figures.
57 Great Lakes Maritime Taskforce, Great Lakes Dredging Crisis, March 18, 2013, at www.glmtf.org/2013/03/18/dredging-crisis/, accessed
May 15, 2013. 58 USACE Great Lakes and Ohio River Division, Supplemental Reconnaissance Report, Great Lakes Navigation System Review, 2010, p. 41.
Vessel Type Number in
Fleet Trips Per Year
Yearly Loss Per
Vessel
Total Yearly
Loss
Class 10
Laker 13
50 Trips Per
Year $2 Million $26 Million
Class 8 Laker 12 50 Trips Per
Year $1.5 Million $18 Million

22
Economic Importance
Revenue and Efficiencies
Portions of the Great Lakes have been used to ship both people and goods for hundreds of years,
and the GLSLS has functioned as a connected system for more than 50 years. As a result,
industries in the region have developed a critical dependence on open shipping throughout the
system, which has significant economic influence within the region. The relative low cost to ship
goods via the GLSLS, expected increases in cargo volume, and excess operating capacity are
likely to lead to increasing reliance on the GLSLS to move international cargo.
Revenue is generated through cargo shipping, recreational use, real estate, and power generation.
In 2010, $33.6 billion in revenue was raised by companies (in both the United States and
Canada) that handled cargo shipped on the GLSLS, $18 billion of which was generated in the
United States.59
According to the USACE, industries save an average of $3.6 billion per year
shipping through the Great Lakes navigation system, compared to other modes of
transportation.60
The ability to move bulk goods over long distances at low prices with fewer emissions makes the
GLSLS system a viable solution for many industries in the United States. A single 1,000-foot-
long U.S.-laker can haul approximately 70,000 tons of cargo, which is equivalent to seven 100-
car trains, each with a total capacity of 10,000 tons, or 3,000 trucks, each with a 25-ton capacity.
Furthermore, a ship on the Great Lakes can travel 607 miles on 1 gallon of fuel per ton of cargo,
significantly farther than freight trains and trucks, which can travel only 202 miles and 59 miles
per gallon of fuel per ton of cargo, respectively.61
Use of the GLSLS system is economically efficient due to economies of scale, primarily
achieved via savings from shipping. Industry capitalizes by moving bulk commodities via
shipping at a fraction of the cost of rail, truck, or aircraft transportation. An estimate completed
in 2007 concluded that an average cost savings of $14.80 per ton in transportation and handling
charges was realized.62
The volume of goods transported internationally grows each year, a trend expected to continue as
economic and trade growth are projected. Traffic bottlenecks in North America’s West Coast
have already led shippers to find alternatives through the Panama and Suez Canals. Roads and
railways have absorbed some of this redirected traffic. However, both modes are already strained
by congestion and tightening capacity, some of which is caused by a small number of transit
points and security requirements that slow border crossings. These conditions are expected to
lead to increased reliance on the on the GLSLS in the future. Over the next 20 to 40 years, traffic
59 Martin Associates, The Economic Impacts of the Great Lakes – St. Lawrence Seaway System, Lancaster, Pennsylvania, 2011, p. 31. 60 USACE, Great Lakes Navigation Team, Great Lakes Navigation System: Economic Strength to the Nation, 2009, p. 1. 61 USACE Great Lakes Navigation Team, Great Lakes Navigation System: Economic Strength to the Nation, 2009, p. 2. 62 Transport Canada, U.S. Army Corps of Engineers, U.S. Department of Transportation, The St. Lawrence Seaway Management Corporation,
Saint Lawrence Seaway Development Corporation, Environment Canada, and U.S. Fish and Wildlife Service. Great Lakes St. Lawrence Seaway Study: Final Report. Fall 2007. www.marad.dot.gov/documents/GLSLs_finalreport_Fall_2007.pdf., p. 50.

23
in the GLSLS lock systems is expected to increase by 0.7 percent annually in the Soo Locks and
the MLO section and by 0.5 percent annually at the Welland Canal.63
Unlike rails and roadways, the GLSLS could handle this increase as it is currently estimated to
be operating at about half its maximum capacity.64
However, backlogs and/or delays could occur
with this increase if low water levels and other conditions continue to impact infrastructure.
Employment Data
Apart from the revenue generated by the trade of commodities, each individual port in the
GLSLS has its own economic input to its respective locality. According to a 2011 study
conducted by Martin Associates, a consulting firm that focuses on transportation-related
economic analyses and strategic planning, more than 226,833 jobs in the United States and
Canada owe their existence to the commodities shipping industry on the Great Lakes. These jobs
are held by workers employed as mariners, port workers, and others who provide support to port
activity. Of these jobs, 128,227, or 57 percent, are in the United States: 44,634 are direct jobs,
44,057 are induced jobs (created from the spending of direct job employees), and 39,585 are
indirect jobs created by companies that support port activities.65
These numbers result directly
from the cargo handling activity at Great Lakes ports.
Iron ore is by far the largest creator of direct jobs and is responsible for more than 37,000 jobs in
the ports and steel mills that ship and receive this commodity. In all, 17,000 of these jobs are in
steel mills in Canada, and 12,000 are in steel mills in the United States.66
Miners, steel workers,
farmers, manufacturers, shippers, port operators, and all of the businesses and services that
support them are directly dependent on the GLSLS system for employment.
Studies that consider more than simply the cargo handled on the GLSLS system estimate that
more than 1.5 million jobs can be directly attributed to industries that are supported by access to
the Great Lakes (defined as industries that rely on the system for for key inputs, e.g., water or
fish, or economic viability, e.g., cheap transportation, or are significantly influenced by the
Lakes, e.g., by attracting visitors). Manufacturing makes up approximately 66 percent of the jobs
that are connected to the GLSLS system. Other major industries include tourism, shipping,
agriculture, and mining. Among the eight Great Lakes states, Michigan, Illinois, Ohio, and
Wisconsin are the top four in terms of jobs attributed to the Great Lakes, making up about
83 percent of the total number of jobs supported by access to the GLSLS system.67
Tables 5 and
6 show jobs attributed to the GLSLS by state and by industry, respectively.
63 Transport Canada, U.S. Army Corps of Engineers, U.S. Department of Transportation, The St. Lawrence Seaway Management Corporation,
Saint Lawrence Seaway Development Corporation, Environment Canada, and U.S. Fish and Wildlife Service. Great Lakes St. Lawrence Seaway Study: Final Report. Fall 2007. www.marad.dot.gov/documents/GLSLs_finalreport_Fall_2007.pdf.
64 Transport Canada, U.S. Army Corps of Engineers, U.S. Department of Transportation, The St. Lawrence Seaway Management Corporation,
Saint Lawrence Seaway Development Corporation, Environment Canada, and U.S. Fish and Wildlife Service. Great Lakes St. Lawrence Seaway Study: Final Report. Fall 2007. www.marad.dot.gov/documents/GLSLs_finalreport_Fall_2007.pdf.
65 Martin Associates, The Economic Impacts of the Great Lakes – St. Lawrence Seaway System, Lancaster, Pennsylvania, 2011, p. 32. 66 Martin Associates, The Economic Impacts of the Great Lakes – St. Lawrence Seaway System, Lancaster, Pennsylvania, 2011, p. 33. 67 Vaccaro, L., Vital to Our Nation’s Economy: Great Lakes Jobs 2011 Report, 2011.

24
State Great Lakes
Jobs
Michigan 525,886
Illinois 380,786
Ohio 178,621
Wisconsin 173,969
New York 157,547
Indiana 54,397
Pennsylvania 25,497
Minnesota 11,877
Total 1,508,580
TABLE 5.—Great Lakes Jobs by State (Courtesy of Vaccaro, 2011).
Industry Great Lakes
Jobs
Manufacturing 994,879
Tourism and Recreation 217,635
Shipping 118,550
Agriculture 118,430
Science and Engineering
38,085
Utilities 10,980
Mining 10,003
Total 1,508,562
TABLE 6.—Great Lakes Jobs by Industry (Courtesy of Vaccaro, 2011).
Key Products and Commodities
The GLSLS system has evolved over time to accommodate dry-bulk cargos. As previously
mentioned, many of the U.S.-flag lakers are self-offloading, and most ports depend on this
capability to receive bulk cargoes. While containerized cargo dominates ocean transport, the
GLSLS sees very little of this type of traffic. Because of the need to move bulk commodities in
the Great Lakes region, the infrastructure in the GLSLS is set up to handle dry-bulk commodities
and some liquid bulk commodities. As an example, the Port of Montreal, located just outside of
the MLO, ranks fifth in handling containerized cargo on the North American Atlantic Coast, but
only a small percentage of that cargo enters the GLSLS; most of the containerized cargo moves
by rail from the port.68
Dry bulk commodities, such as iron ore, coal, and stone, are the most common cargo by volume
shipped in the GLSLS. From 1993 to 2011, 65.5 million tons of iron ore, 37 million tons of coal,
and 34 million tons of limestone, on average, were shipped annually by foreign and domestic
68 Transport Canada, U.S. Army Corps of Engineers, U.S. Department of Transportation, The St. Lawrence Seaway Management Corporation,
Saint Lawrence Seaway Development Corporation, Environment Canada, and U.S. Fish and Wildlife Service. Great Lakes St. Lawrence Seaway Study: Final Report. Fall 2007. www.marad.dot.gov/documents/GLSLs_finalreport_Fall_2007.pdf, p. 43.

25
carriers on the GLSLS.69
Additional dry bulk commodities shipped on the GLSLS include
cement, salt, sand, and grain, as well as chemicals, petroleum, finished products, and
containerized cargo, to a lesser extent. Of the commodities represented in Figure 10, most
volumes have remained relatively stable since 1993 with a small drop-off after the 2007
recession. The one exception is iron ore: shipments decreased during the 2001 recession, and
there was another sharp drop in 2009 because of the 2007–2009 recession; by 2011, shipments
then returned to 2008 levels.70
FIGURE 10.—Dry-Bulk Commodities - GLSLS 1993–2011. (Courtesy of LCA, 2012.71
)
Key Commodities Analysis
Iron Ore
Iron ore is one of the main raw materials used in the steel manufacturing process along with
limestone, and coal. The iron ore mining industry is dependent on the GLSLS for both low-cost
transport of limestone to the mines to produce pelletized iron ore and shipment of pelletized iron
ore from the mines to integrated steel mills. Integrated steel mills account for 40 percent of the
steel production in the United States and utilize the basic oxygen furnace (BOF) or blast furnace
process to make steel.72
BOF mills require a dependable supply of iron ore for operations and as
a result, most BOF mills in the United States are located on or near major navigable waterways
such as the GLSLS which provide low-cost transportation for receiving bulk raw materials used
in the steel manufacturing process.73
69 LCA, 2012 Annual Statistical Report, U.S.-Flag Share of Major Commodities 1993–2012, 2012. 70 NOAA, Great Lakes Water Level Dashboard, 2013, at www.glerl.noaa.gov/data/now/wlevels/dbd/, accessed May 15, 2013. 71 LCA, 2012 Annual Statistical Report, U.S.-Flag Share of Major Commodities 1993–2012, 2012. 72 Steelworks.org, How Steel Is Made, at www.steel.org/Making%20Steel/How%20Its%20Made.aspx, accessed June 5, 2013. 73 American Iron and Steel Institute, undated, Where Steel is Made, Steel Works Web site, at
www.steel.org/Making%20Steel/Where%20Its%20Made.aspx, accessed June 5, 2013.
0
10,000,000
20,000,000
30,000,000
40,000,000
50,000,000
60,000,000
70,000,000
80,000,000
90,000,000
Ton
s
Iron Ore Coal Limestone Salt Cement

26
Iron Ore Mining and Production
In 2011, according to the U.S. Geological Survey (USGS), more than 61.4 million tons of iron
ore were produced in the United States.74
The Mesabi Range in eastern Minnesota and the
Marquette Range in Michigan’s Upper Peninsula are the two primary iron ore–producing areas
in the country. In 2011, about 75 percent of the iron ore shipped on the GLSLS originated in the
Mesabi Range; the Marquette Range accounted for the remaining at 25 percent.75
While called iron ore, the material shipped on the Great Lakes is actually a partially processed
substance called taconite pellets. Taconite pellets are created at the mining site by extracting the
raw minerals from open pits, grinding it into a powder, and mixing it with limestone and
bentonite clay to form pellets. Taconite pellets are shipped by rail to ports on the GLSLS and
then loaded onto ships for transport to integrated steel mills throughout the GLSLS region.
GLSLS Iron Ore Shipping Volume
More iron ore is shipped by volume than any other commodity on the Great Lakes. As shown in
Figure 11, in 2011 more than 61.3 million total tons of iron ore were shipped within the GLSLS
of which 47.2 million tons were shipped by U.S.-flag ships (77 percent). The remaining 14.1
million tons were shipped by either Canadian-flag ships (6.3 million tons representing 10.3
percent), or foreign-flag ships (7.8 million tons representing 12.7 percent).76
As Figure 11 also
shows, iron ore shipments on the GLSLS have decreased by almost 20 million tons since the late
1990s. This development is likely a result of the economic recession in 2001and the recession in
2007–2009. About 80 percent of the iron ore produced in the United States was shipped out of
six ports on the GLSLS, which reside in three States: Minnesota, Michigan, and Wisconsin.
Access to and operation of these ports is critical to the operation of integrated steel mills located
throughout the GLSLS region.
74 U.S. Department of the Interior, U.S. Geological Survey, 2013, Mineral Commodity Summaries, Iron and Steel, pp. 78–79. 75 Data from USACE Waterborne Commerce Statistics, 2011. 76 LCA, undated, 2011 Statistical Annual Reports of Lake Carriers’ Association, 2011 Iron Ore Trade, www.lcaships.com/wp-
content/uploads/2012/07/ore-by-dock-and-narrative.pdf, accessed May 9, 2013.

27
FIGURE 11.—Iron Ore Shipped on the GLSLS 1993–2012. (Courtesy of LCA, 2012.77
)
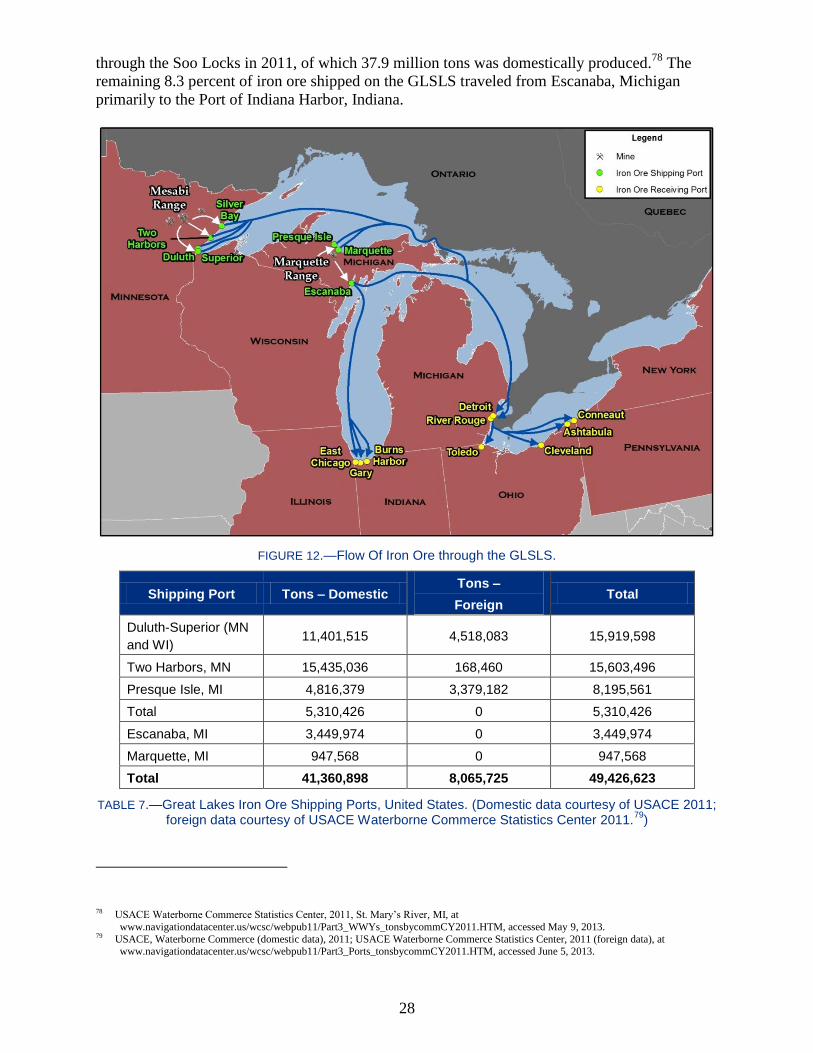
Iron Ore Shipment Flows
When considering ports that handle iron ore, there are generally two types: those that ship iron
ore and those that receive iron ore (see Figure 12). In the United States, iron ore moves generally
from eastern Minnesota and Michigan’s Upper Peninsula to the south and east (down bound) to
ports in Illinois, Indiana, Michigan, and Ohio. Although some receiving ports are involved in
shipping small amounts of iron ore once received, there are primarily six major U.S. ports on the
GLSLS that ship iron ore. These shipping ports are associated with iron ore ranges and mines
that process the raw ore into taconite pellets and ship the pellets to the ports via rail. The Mesabi
Range in Minnesota ships taconite pellets to the ports of Duluth-Superior, Minnesota and
Wisconsin; and Two Harbors and Silver Bay, Minnesota. Mining operations in the Upper
Peninsula of Michigan’s Marquette Range ship taconite pellets to the Michigan ports of Presque
Isle, Escanaba, and Marquette. The biggest U.S. iron ore shipping ports in the GLSLS by far are
Duluth/Superior and Two Harbors. Combined, they ship 63 percent of the iron ore mined from
the region.
The vast majority (91.7 percent) of the U.S. iron ore shipped on the GLSLS must pass through
the Soo Locks. According to the USACE, more than 46 million tons of iron ore were shipped
77 LCA, undated, 2012 Statistical Annual Reports of Lake Carriers’ Association, U.S.-Flag Share of Major Commodities: 1993-–2012, 2012, at www.lcaships.com/wp-content/uploads/2013/03/U.S.-Flag-Share-of-Major-Commodities2.pdf, accessed June 5, 2013.
20,000,000
25,000,000
30,000,000
35,000,000
40,000,000
45,000,000
50,000,000
55,000,000
60,000,000
65,000,000
70,000,000
75,000,000
80,000,000
19
93
19
94
19
95
19
96
19
97
19
98
19
99
20
00
20
01
20
02
20
03
20
04
20
05
20
06
20
07
20
08
20
09
20
10
20
11
20
12
Ne
t To
ns
Year
Total Iron Ore
US-Flag
28
through the Soo Locks in 2011, of which 37.9 million tons was domestically produced.78
The
remaining 8.3 percent of iron ore shipped on the GLSLS traveled from Escanaba, Michigan
primarily to the Port of Indiana Harbor, Indiana.
FIGURE 12.—Flow Of Iron Ore through the GLSLS.
Shipping Port Tons – Domestic Tons –
Foreign Total
Duluth-Superior (MN
and WI) 11,401,515 4,518,083 15,919,598
Two Harbors, MN 15,435,036 168,460 15,603,496
Presque Isle, MI 4,816,379 3,379,182 8,195,561
Total 5,310,426 0 5,310,426
Escanaba, MI 3,449,974 0 3,449,974
Marquette, MI 947,568 0 947,568
Total 41,360,898 8,065,725 49,426,623
TABLE 7.—Great Lakes Iron Ore Shipping Ports, United States. (Domestic data courtesy of USACE 2011; foreign data courtesy of USACE Waterborne Commerce Statistics Center 2011.
79)
78 USACE Waterborne Commerce Statistics Center, 2011, St. Mary’s River, MI, at
www.navigationdatacenter.us/wcsc/webpub11/Part3_WWYs_tonsbycommCY2011.HTM, accessed May 9, 2013. 79 USACE, Waterborne Commerce (domestic data), 2011; USACE Waterborne Commerce Statistics Center, 2011 (foreign data), at
www.navigationdatacenter.us/wcsc/webpub11/Part3_Ports_tonsbycommCY2011.HTM, accessed June 5, 2013.

29
GLSLS iron ore shipments ore move generally from key ports located in eastern Minnesota and
Michigan’s Upper Peninsula to the south and east (down bound) to receiving ports in Illinois,
Indiana, Michigan, and Ohio. The receiving ports are usually associated with one or more steel
production companies/mills that use the iron ore to make steel of various types as an input to
various manufacturing processes.80
As indicated in Table 8, the ports of Gary, Indiana; Indiana
Harbor, Indiana; and Burns Waterway Harbor, Indiana, on Lake Michigan are the top three iron
ore receiving ports by volume in 2011. Iron ore shipments also travel through Lake Huron and
into the St. Clair and Detroit River system to the receiving ports of Rouge River and Detroit
Harbor, Michigan. Other receiving ports include Toledo; Conneaut; Cleveland Harbor; and
Ashtabula, Ohio.
Receiving Port Tons Domestic Tons Foreign Total
Gary, IN 8,660,500 145,157 8,805,657
Indiana Harbor, IN 8,684,078 58,069 8,742,147
Burns Waterway Harbor, IN 5,592,992 312,401 5,905,393
Toledo, OH 2,776,299 1,768,004 4,544,303
Rouge River, MI 4,206,093 34,000 4,240,093
Conneaut Harbor, OH 3,749,160 122,452 3,871,612
Detroit Harbor, MI 3,225,085 8,191 3,233,276
Cleveland Harbor, OH 3,171,548 0 3,171,548
Ashtabula, OH 1,707,450 392,565 2,100,015
Total 41,773,205 2,840,839 44,614,044
TABLE 8.—Great Lakes Iron Ore Receiving Ports, United States. (Domestic data courtesy of USACE 2011; foreign data courtesy of USACE Waterborne Commerce Statistics Center 2011.
81)
Limestone Shipment Flows
Because the mines require limestone for taconite pellet processing, the iron ore shipping ports
depend on limestone shipments. As indicated in Figure 13, limestone shipments flow to iron ore
mining operations from ports located in northern Michigan and Marblehead, Ohio. In 2011, the
top five limestone shipping ports by volume were Marblehead, Ohio, and Stoneport, Calcite, Port
Inland, and Port Dolomite, Michigan. After departing these ports, limestone is shipped through
the GLSLS to the previously mentioned iron ore shipping ports and then via rail for use in iron
ore mining operations in the Mesabi and Marquette ranges.82
80 Pennsylvania Economy League of Southwestern Pennsylvania, LLC, The Economic Impact of the Steel Industry in Pennsylvania, 2011,
prepared for Pennsylvania Steel Alliance. 81 USACE, 2011 (domestic data); USACE Waterborne Commerce Statistics Center, 2011 (foreign data), at
www.navigationdatacenter.us/wcsc/webpub11/Part3_Ports_tonsbycommCY2011.HTM, accessed June 5, 2013. 82 USACE Waterborne Commerce Statistics Center, 2011, St. Mary’s River, MI, at
www.navigationdatacenter.us/wcsc/webpub11/Part3_WWYs_tonsbycommCY2011.HTM, accessed May 9, 2013.

30
FIGURE 13.—Flow of Limestone through the GLSLS to Iron Ore Shipping Ports.
Shipping Port Domestic (Tons) Foreign (Tons) Shipping Port
Stoneport, MI 5,214,479 358,977 5,573,456
Calcite, MI 4,661,467 689,999 5,351,466
Port Inland, MI 4,088,103 166,953 4,255,056
Marble Head, OH 2,602,088 335,659 2,937,747
Port Dolomite, MI 2,356,822 485,977 2,842,799
TABLE 9.—Top Five Limestone Shipping Ports in 2011. (Domestic data courtesy of USACE 2011; foreign data courtesy of USACE Waterborne Commerce Statistics Center 2011.
83)
83 USACE, 2011, Waterborne Commerce (domestic data); USACE Waterborne Commerce Statistics Center, 2011 (foreign data), at
www.navigationdatacenter.us/wcsc/webpub11/Part3_Ports_ tonsbycommCY2011.HTM, accessed June 5, 2013.

31
Receiving Port Tons
Duluth/Superior, MN/WI 2,780,649
Marquette, MI 534,004
Escanaba, MI 496,548
Presque Isle, MI 343,174
Silver Bay, MN 79,012
TABLE 10.—Limestone Received at Top Iron Ore Shipping Ports in 2011. (Courtesy of USACE 2011.84
)
Limestone is used in both electric arc furnaces (EAF) and BOF processes, and many of the steel
mills on the GLSLS receive this commodity via waterborne transport. Limestone shipped to
ports located near steel mills comes from the same regions in Michigan as the limestone used at
the iron ore mines. One major difference is that the limestone does not need to pass through the
Soo Locks in order to reach its destinations. In the case of a Soo Locks closure, integrated steel
mills would still be affected because iron ore would not pass through the locks; however, EAF
mills would still be able to receive scrap iron and likely continue operations, assuming that
enough vessels were available down bound from the Soo Locks to transport limestone.
Table 11 shows the limestone receipts at ports near steel mills and their associated mill types.
The percentage of limestone at each port that would be used in the steel industry versus other
industries is unknown; however, the assumption is that the identified steel mills receive
limestone from their associated limestone receiving port.
TABLE 11.—Limestone Receipts in Ports near Steel Mills in the GLSLS. (Courtesy of USACE 2011 and American Iron and Steel Institute.
85)
84 USACE, 2011, Waterborne Commerce (domestic data); USACE Waterborne Commerce Statistics Center, 2011 (foreign data), at www.navigationdatacenter.us/wcsc/webpub11/Part3_Ports_
tonsbycommCY2011.HTM, accessed June 5, 2013. (for domestic data). 85 USACE, Waterborne Commerce data, calendar year 2011 and; American Iron and Steel Institute, undated, Where Steel is Made, Steel Works
Web site, at www.steel.org/Making%20Steel/Where%20Its%20Made.aspx, accessed June 5, 2013.
Receiving Port Tons Associated Mill
Types
Cleveland, OH 2,546,536 2 BOF, 1 EAF
Burns Waterway Harbor, IN 953,824 1 BOF, 1 EAF
Indiana Harbor, IN 919,416 1 BOF
Rouge River, MI 850,201 1 BOF
Lorain, OH 367,731 1 BOF
Gary, IN 268,377 1 BOF
Ecorse, MI 104,219 1 BOF
Detroit Harbor, MI 69,637 1 BOF
Monroe, MI 809,964 1 EAF
Chicago, IL Unknown 1 EAF

32
Economic Importance
The movement of iron ore from its origin to destination contributes to the revenue of multiple
industries and geographic locations. Each stage of handling this commodity provides revenue
and jobs from the mining process to the sale of a finished product at market. According to a 2012
study conducted at the University of Minnesota Duluth, the iron ore mining industry in
Minnesota supports a total of 11,226 jobs and has a total economic effect of $1.9 billion in
wages, rent, and profits in the State of Minnesota in 2010 (see TABLE 12).86
Direct Effect Indirect Effect Induced Effect Total Effect
Value Added $1,136,832,423 $349,036,421 $435,339,232 $1,921,208,076
Output $1,711,897,209 $602,940,089 $708,088,618 $3,022,925,917
Employment 3,975 2,273 4,978 11,226
TABLE 12.—Economic Impact of Iron Ore Mining on the Minnesota Economy. (Courtesy of Labovitz School of Business and Economics, University of Minnesota Duluth, 2012.
87)
After the iron ore is processed, it must be transported to and handled at the port. At the Port of
Duluth/Superior, the top shipping port in Minnesota, roughly 4,362 jobs are supported by iron
ore moved through the port at $206.8 million in personal income and a total of $564.6 million in
business revenues in 2010.88
Those numbers include jobs and revenue from mining, port
handling, shipping, and steelmaking activity, which are conducted over a vast geographic area.
The effect is similar in the receiving ports. For example, the Port of Toledo, which handled about
3.5 million tons of iron ore in 2010, supported 2,234 jobs with $180.3 million in personal income
and $123.2 million in business revenues.89
Steel Manufacturing Inputs
Introduction
While finished steel is not a major commodity shipped on the GLSLS, steel inputs and raw
materials including iron ore, limestone and coal coke, are major GLSLS commodities shipped to
steel mill locations within the GLSLS region. In 2011, approximately 115 million tons of steel
products were produced in the United States, but only 1 percent of the total was shipped via the
GLSLS.90
Overall, steel made up less than 1 percent of the total volume shipped or received in
86 Labovitz School of Business and Economics, University of Minnesota Duluth, The Economic Impact of Ferrous and Non-Ferrous Mining on
the State of Minnesota and the Arrowhead Region, including Douglas County, Wisconsin, 2012, pp. 10–13. 87 Labovitz School of Business and Economics, University of Minnesota Duluth, The Economic Impact of Ferrous and Non-Ferrous Mining on
the State of Minnesota and the Arrowhead Region, including Douglas County, Wisconsin, 2012, pp. 10–13 using 2010 IMPLAN data. 88 Martin and Associates, The Economic Impacts of the Port of Duluth-Superior, 2011, Lancaster, Pennsylvania. According to the USACE
Waterborne Commerce Statistics Center, 2010, 37.9% of cargo was handled at the Port of Duluth-Superior; that percentage was used for a
rough calculation of the percentage of jobs attributed to iron ore handling. 89 Martin and Associates, The Economic Impacts of the Port of Toledo, 2011, Lancaster, Pennsylvania. According to the USACE Waterborne
Commerce Statistics Center, 2010, 32.3% of cargo was handled at the Port of Toledo; that percentage was used for a rough calculation of
the percentage of jobs attributed to iron ore handling. 90 USGS, 2012, Mineral Commodity Summaries, Iron and Steel, U.S. Department of the Interior, pp. 78–79.

33
the GLSLS by the United States in 2011.91
According to 2011 data from the USACE Waterborne
Commerce Statistics Center, 1.2 million tons of steel products were shipped on the GLSLS,
including pig iron and raw steel and about 460,000 tons of that traffic was shipped domestically.
Table 13 shows the total shipping and receiving for steel in the GLSLS and the Chicago Area
Waterway System (CAWS). Although not counted in the GLSLS, the CAWS is an important
system that includes the Chicago Sanitary and Shipping Canal, the Calumet River, Little
Calumet River, Lake Calumet Calumet-Sag channel, the Chicago River, and the north branch of
the Chicago River. The CAWS acts as a gateway between Lake Michigan and the inland
waterway system which includes the Illinois, Mississippi, and Ohio Rivers. Between 1994 and
2009, iron and steel products ranged between 11 percent (2009) and 20 percent (2005) of the
CAWS traffic.92
The CAWS ports shipped and received approximately 1.8 million tons of steel
products in 2011 (Table 13). Almost all of the steel shipped through the GLSLS domestically
occurs on Lake Michigan and most of that steel traffic travels on the waterways that comprise the
CAWS.93
TABLE 13.—GLSLS and CAWS Steel Shipments and Receipts 2011. (Courtesy of USACE Waterborne Commerce Statistics Center 2011.
94)
Shipments of pig iron through Lake Michigan to Menominee, Michigan, total about 92,000 tons
or approximately 7.6 percent of the total; this is the only steel that passes from the CAWS into
the GLSLS.95
In addition, three Indiana ports—Indiana Harbor, Burns Harbor, and Gary—ship
various steel products through the very southern tip of Lake Michigan to the Calumet River just
south of Chicago and on to the Illinois and Mississippi River systems.96
Unlike iron ore shipping
patterns, steel outputs do not have a distinct signature on the GLSLS. Presumably, the consumers
of semi-finished steel choose locations based on various factors not necessarily related to
waterborne commerce. Available limited detailed information quantifies the movements of
foreign steel via waterborne systems. Approximately 61 percent of all steel shipped on the
91 USACE, 2011, Waterborne Commerce of the United States, Part 3 Waterways and Harbors Great Lakes, calendar year 2011. 92 USACE, Great Lakes and Mississippi River Interbasin Study GLMRIS, Baseline Assessment of Cargo Traffic on the Chicago Area Waterway
System, 2011, p. 11. 93 USACE, Great Lakes and Mississippi River Interbasin Study GLMRIS, Baseline Assessment of Cargo Traffic on the Chicago Area Waterway
System, 2011, p. iii. 94 USACE, 2011, Waterborne Commerce (domestic data); USACE Waterborne Commerce Statistics Center, 2011 (foreign data), at
www.navigationdatacenter.us/wcsc/webpub11/Part3_Ports_tonsbycommCY2011.HTM, accessed June 5, 2013. 95 American Iron and Steel Institute, Where Steel is Made, Steel Works Web site, undated, at
www.steel.org/Making%20Steel/Where%20Its%20Made.aspx, accessed June 5, 2013. 96 USACE, Waterborne Commerce data, 2011.
Domestic Foreign
Domestic and Foreign
Region All Traffic Directions
Receipts Shipments All Traffic Directions
Receipts Shipments All Traffic Directions
Total GLSLS 464,542 135,969 328,573 738,709 738,709 0 1,203,251
Total CAWS 1,393,528 1,202,929 182,966 430,043 407,495 22,548 1,823,571

34
GLSLS is foreign, all of which is imported. Because the CAWS ships more steel domestically, it
only has about 24 percent of foreign traffic.97
Steel Mills and Ports in the GLSLS
As shown in Figure 14, several areas have integrated steel mills along the shores of the Great
Lakes. The Chicago area has three integrated steel mills; the Detroit area has two integrated steel
mills, and in Ohio, there are three integrated steel mills—one in Lorain and two in Cleveland. In
Canada, about 80 percent of steel mills are located along the GLSLS.98
FIGURE 14.—Map of Integrated Steel Mills and Flow of Steel on the GLSLS
Thirteen ports are involved in shipping or receiving pig iron and steel products on the Great
Lakes.99
Table 14 describes the locations of integrated steel mills in the GLSLS, including the
parent company and associated iron ore receiving port.
97 USACE Waterborne Commerce Statistics Center, 2011, at www.navigationdatacenter.us/
wcsc/webpub11/Part3_Ports_tonsbycommCY2011.HTM, accessed June 5, 2013. 98 American Iron and Steel Institute, Where Steel is Made, Steel Works Web site, undated, at
www.steel.org/Making%20Steel/Where%20Its%20Made.aspx, accessed June 5, 2013. 99 USACE Waterborne Commerce Statistics Center, 2011, at
www.navigationdatacenter.us/wcsc/webpub11/Part3_Ports_tonsbycommCY2011.HTM, accessed June 5, 2012.

35
Location Company Iron Ore Receiving Port
Burns Harbor, IN ArcelorMittal Burns Harbor, IN
Indiana Harbor, IN ArcelorMittal Indiana Harbor, IN
Gary, IN U.S. Steel Gary, IN
Riverdale, IL ArcelorMittal Chicago, IL
Dearborn, MI Severstal Rouge River, MI
Ecorse, MI U.S. Steel Detroit Harbor, MI
Lorain, OH Republic Engineered Products UNK
Cleveland, OH ArcelorMittal – two mills Cleveland, OH
Integrated Steel Mills – Canada
Location Company Iron Ore Receiving Port
Hamilton, ON ArcelorMittal Hamilton, ON
Hamilton, ON U.S. Steel Hamilton, ON
Nanticoke, ON U.S. Steel Nanticoke, ON
Sorel Tracy, Quebec QIT-FER et. Titane UNK
Essar Steel Algoma, Inc. Sault Ste. Marie, ON Sault Ste. Marie, ON
TABLE 14.—U.S. Integrated Steel Mills on the Great Lakes. (Courtesy of American Iron and Steel Institute.
100)
In 2011, there were two electric arc furnace (EAF) steel mills along the Great Lakes using scrap
steel as the major input to their processing. The Burns Harbor, Indiana mill received about
17,000 tons of scrap steel, and the Indiana Harbor, Indiana mill received about 15,000 tons of
scrap steel.101
In 2011, the NLMK Indiana Company, located in Portage, Indiana (near Burns
Harbor), produced 672,756 cast tons of steel.102
Based on those values, the plant received only a
small fraction (~0.5 percent) of its scrap steel from the GLSLS, and therefore is not dependent on
the GLSLS for steelmaking raw materials.
Flow of Coke through the GLSLS
Some processed coke is received by ports on the GLSLS, although it appears that some is made
in processing plants near steel mills. Coke derived from the processing of coal is an input to both
major types of steel production processes.103
Locations of coke production tend to coincide with
major steelmaking operations. There are coke processing plants in Indiana Harbor, Gary, and
Burns Harbor, Indiana; Toledo and Cleveland, Ohio; and Detroit, Michigan.104,105
Because much
100 American Iron and Steel Institute, undated, Where Steel is Made, Steel Works Web site, available at www.steel.org/Making%20Steel/Where%20Its%20Made.aspx, accessed June 5, 2013.
101 USACE, Waterborne Commerce data, 2011. 102 Bloomberg Businessweek Web site, 2012, Company Overview of NLMK Indiana Corp. 103 American Iron and Steel Institute, Steel Processing Operations, Steel Works Web site, undated, at
www.steel.org/en/Making%20Steel/How%20Its%20Made/Processes.aspx, accessed June 5, 2013. 104 Mid-Continent Coal and Coke Company, Plant Locations, 2011, at www.midcontinentcoke.com/plant-locations.aspx, accessed June 5, 2013.

36
of the coke processing occurs near the steel plants, it is difficult to quantify how dependent the
steel industry is on the GLSLS for delivery of coal. The coal is first processed into coke and then
shipped to the steel plants, thus this dependency is indirect. A deeper study of the coal industry
and coal shipping on the GLSLS will be needed to quantify the steel industry’s dependency on
the GLSLS for coal shipments. Generally, however, there are two main sources of coal that could
be used for this purpose. One is the Powder River Basin (PRB) in Wyoming, where most of the
coal is transported via rail; some of the PRB coal is transported to ports on Lake Superior for
delivery to other end users, including coal-fired power plants throughout the GLSLS. If coal
from the PRB is used, the Soo Locks once again would be a limiting factor on those shipments.
Alternatively, coal could come from mines in Pennsylvania and Kentucky. In this case, the coal
would most likely be shipped by rail to processing plants. Although both EAF and BOF
steelmaking processes require coal coke input, the degree to which the steel industry depends on
coal coke shipped on the GLSLS could not be determined for this analysis. In order to assess this
dependency with more precision, information on the distribution of coal from the PRB in
Wyoming and a breakdown of how much reaches the coking facilities and steel mills by rail
versus water is needed.
Steel Summary
In 2011, only 1 percent of all U.S. steel was shipped on the GLSLS. Steel mills near the GLSLS
are more dependent on the GLSLS-navigable waterways for their raw material inputs than they
are for their product output. For this steel commodity flow, only steel mills located on the
GLSLS system were analyzed. Steel mills not located on the GLSLS may have partial
dependencies on the GLSLS, but were not considered in this analysis. Future studies are needed
to identify all steel mills receiving materials from GLSLS shippers, and whether or not they
could receive their raw materials via other forms of transportation, in the event of a closure on
the GLSLS. Integrated steel mills are more dependent on waterborne commerce than EAF mills.
Integrated mills located on the GLSLS must receive iron ore from either the Upper Peninsula of
Michigan or northeastern Minnesota in order to operate. Other materials, such as coke and
limestone, are also sometimes received by these mills from the GLSLS. The possibility and cost
differences of receiving these items from other modes of transportation are beyond the scope of
this study but are an important topic to address.
105 DTE Energy, Project Map, DTE Energy Services, 2008, at www.dteenergyservices.com/aboutUs/ projectMap.html?businessLinesDisplay=&aboutUsDisplay=&careersDisplay, accessed June 5, 2013.

37
Refined Petroleum Products
Introduction
Nearly all of the petroleum products shipped on the GLSLS are refined petroleum products
including fuel oils, gasoline, asphalt, tar, and pitch. Crude oil is not shipped on GLSLS because
numerous crude pipelines connect the GLSLS ports. Crude pipelines run from Superior,
Wisconsin, through Chicago, and Detroit, to Buffalo, New York, routed south of Lake Michigan.
Other pipelines connect Superior to Detroit, through the Straights of Mackinac north of Lake
Michigan.106
The presence of these crude oil pipelines means that refineries in the GLSLS region
are not dependent on the waters of the Great Lakes for crude oil which is the major input to the
refineries. As a result, none of the petroleum shipped in the GLSLS was crude oil in 2011.107,108
The GLSLS Petroleum Network
In 2011, about 3.5 million tons of refined (non-crude) petroleum products were shipped and
received from U.S. ports in the GLSLS.109
Most of the petroleum products shipped within the
system are from refineries located near the Indiana Harbor and Rouge River ports.110
Four ports
in the GLSLS shipped nearly 98 percent of all petroleum products (Indiana Harbor, Indiana;
Rouge River, Michigan; Green Bay, Wisconsin; and Toledo, Ohio, in order from highest to
lowest in terms of volume shipped). Domestic shipments totaled about 1.66 million tons from 10
ports within the GLSLS. Asphalt, tar and pitch and fuel oil product categories make up more
than 90 percent of the petroleum products shipped within the GLSLS. About two-thirds of the
products shipped by volume in the GLSLS were in the asphalt, tar, and pitch category and 24
percent of refined petroleum shipments were fuel oils of various weights.
Domestic Foreign Domestic and Foreign
Port Receipts Shipments Total Receipts Shipments Total Total
GLSLS Total 1,139,238 1,662,482 2,808,638 389,268 317,069 706,337 3,514,975
CAWS Total 1,164,308 1,220,235 2,384,543 76,626 722,418 799,044 3,183,587
TABLE 15.—GLSLS and CAWS Petroleum Shipments and Receipts 2011. (Domestic data courtesy of USACE 2011; foreign data courtesy of USACE Waterborne Commerce Statistics Center, 2011.
111)
106 Enbridge.com, undated, Interactive Map, at www.enbridge.com/MediaCentre/
InteractiveMap.aspx, accessed June 5, 2013. 107 USACE, Waterborne Commerce of the United States, 2011. 108 USACE Waterborne Commerce Statistics Center, 2011, at
www.navigationdatacenter.us/wcsc/webpub11/Part3_Ports_tonsbycommCY2011.HTM, accessed June 5, 2013. 109 USACE, Waterborne Commerce of the United States, Calendar year 2011 (domestic data); USACE Waterborne Commerce Statistics Center,
2011 (foreign data). 110 EIA (U.S. Energy Information Administration), U.S. Overview, U.S. States: State Profiles and Energy Estimates, undated, at
www.eia.gov/state/, accessed June 5, 2013. 111 USACE, Waterborne Commerce of the United States, Calendar year 2011 (domestic data); USACE Waterborne Commerce Statistics Center,
2011 (foreign data).

38
Although the CAWS is not part of the GLSLS, it is important to have an understanding of its
shipping patterns and flows for petroleum products from its ports. The CAWS ports near
Chicago shipped almost the same amount of petroleum products as did Indiana Harbor, Indiana,
in 2011 (See Table 16). The Chicago area has two refineries, one in Lemont, Illinois, and one in
Joliet, Illinois.112
About 90 percent of the petroleum products shipped on the GLSLS from
Chicago area are transported south into the inland river system in the United States, which means
that only 10 percent of the petroleum products shipped via water actually enter the GLSLS, with
much of it destined for ports along Lake Michigan.113
112 Enbridge.com, undated, Interactive Map, at www.enbridge.com/MediaCentre/InteractiveMap.aspx, accessed June 5, 2013. 113 USACE, 2011, Waterborne Commerce of the United States, Calendar year 2011.

39
Domestic Foreign All
Port Receipts Shipments Total Receipts Shipments Total Total
Indiana Harbor,
IN 162,305 1,187,712 1,350,017 0 106,427 106,427 1,456,444
Rouge River, MI 6,851 326,744 333,595 103,822 78,483 182,305 515,900
Detroit Harbor,
MI 0 6,265 6,265 206,429 0 206,429 212,694
Toledo, OH 57,363 43,919 101,282 0 65,082 65,082 166,364
Cleveland, OH 139,924 2,286 142,210 15,879 0 15,879 158,089
Burns Waterway
Harbor, IN 105,833 7,667 113,500 0 0 0 113,500
Milwaukee, WI 109,757 0 109,757 0 0 0 109,757
Cheboygan, MI 72,622 0 72,622 27,747 0 27,747 100,369
Buffalo, NY 99,771 0 99,771 0 0 0 99,771
Niagara River,
NY 99,771 0 99,771 0 0 0 99,771
Green Bay, WI 11,353 64,665 76,018 13,534 6,375 19,909 95,927
Alpena, MI 85,318 0 85,318 0 0 0 85,318
Monroe, MI 79,293 0 79,293 0 0 0 79,293
Saginaw River,
MI 61,780 0 61,780 0 0 0 61,780
Gary, IN 0 0 0 0 33,070 33,070 33,070
Duluth Superior
(MN/WI) 0 0 0 0 27,632 27,632 27,632
Oswego, NY 12,374 0 12,374 11,936 0 11,936 24,310
Gladstone, MI 23,821 0 23,821 0 0 0 23,821
Lorain, OH 0 21,666 21,666 0 0 0 21,666
Calcite, MI 0 0 0 9,921 0 9,921 9,921
Chicago Harbor,
IL 0 0 6,918 0 0 0 6,918
Manistee, MI 6,831 0 6,831 0 0 0 6,831
Put-In-Bay, OH 1,720 0 1,720 0 0 0 1,720
Detroit Harbor,
WI 1,507 0 1,507 0 0 0 1,507
Manistique, MI 0 1,044 1,044 0 0 0 1,044
St. James, MI 1,044 0 1,044 0 0 0 1,044
Bayfield, WI 0 514 514 0 0 0 514
Total GLSLS 1,139,238 1,662,482 2,808,638 389,268 317,069 706,337 3,514,975
Chicago, IL 1,159,733 1,188,029 2,347,762 43,855 722,418 766,273 3,114,035
Calumet Harbor,
IL 4,575 32,206 36,781 32,771 0 32,771 69,552
TABLE 16.—Petroleum Shipments and Receipts on the GLSLS and CAWS 2011 (Domestic data courtesy of USACE Waterborne Commerce, 2011; foreign data courtesy of USACE Waterborne Commerce
Statistics Center, 2011.114
)
114 USACE, Waterborne Commerce Statistics Center, Waterborne Commerce of the United States, 2013, at
www.navigationdatacenter.us/wcsc/webpub11/Part3_Ports_ tonsbycommCY2011.HTM, access June 5, 2013.
40
GLSLS Petroleum Flows
There are two petroleum product flows in the GLSLS. The first flow is associated with refined
petroleum product flows from oil refineries for use in other industrial applications. The second
flow concerns shipments of refined petroleum products to islands and communities that depend
on GLSLS shipping to receive these products.
Refined Petroleum Product Flow
The two largest ports for petroleum products on the GLSLS are Indian Harbor, Indiana, and
Rouge River, Michigan, which together ship more than 90 percent of the petroleum in the
GLSLS. These ports are closely associated with refineries operated by British Petroleum (BP) in
Whiting, Indiana and the Marathon Petroleum Company in Detroit, Michigan. Even though these
refineries are located along the GLSLS, they do not ship significant percentages of their product
on the GLSLS.
The Indiana Harbor port ships approximately 71 percent of all domestic GLSLS petroleum
shipments.115
In 2012, the Whiting refinery produced 360,000 barrels per day of refined
petroleum products, or about 19.8 million tons per year.116,117
Refined petroleum products
shipped from this location include pitch and tar (68 percent), and various fuel oil types (27
percent). While these two products make up 95 percent of the petroleum products shipped from
this port, only 6.5 percent of this refinery’s output are shipped on the GLSLS. 118
Almost all of
the petroleum from Indiana Harbor shipped on the GLSLS is shipped through the southern tip of
Lake Michigan into the CAWS to locations on the Illinois and Mississippi Rivers.
The Port of Rouge River, Michigan, ships nearly 15 percent of total petroleum on the GLSLS.
This refinery produces approximately 106,000 barrels per day or about 5.8 million tons annually.
The two main products shipped via the GLSLS from the refinery are similar to those from
Indiana Harbor: pitch and tar (88 percent) and various fuel oils (12 percent).119
Approximately 7
percent of the refined petroleum products from the Marathon refinery were shipped on the
GLSLS.120
Rouge River ships petroleum products to Cleveland and Toledo, Ohio, and Buffalo,
New York.
115 EIA, undated, U.S. Overview, States: State Profiles and Energy Estimates, available at www.eia.gov/state/, accessed June 5, 2013. 116 Barrels to metric tons conversion obtained from www.bp.com/conversionfactors.jsp; metric tons to tons conversion obtained at
www.eia.gov/tools/faqs/faq.cfm?id=7&t=2; calculation used: 360,000 barrels per day × 0.1364 metric tons/barrel × 365 days/year ×
1.10231 metric tons/short tons. 117 EIA, Indiana Refinery Operable Atmospheric Crude oil Distillation Capacity as of January 1, 2012, at
www.eia.gov/dnav/pet/hist/LeafHandler.ashx?n=PET&s=8_NA_8D0_SIN_4&f=A, accessed June 24, 2013. 118 USACE, 2011, Waterborne Commerce of the United States, Calendar year 2011. 119 USACE, 2011, Waterborne Commerce of the United States, Calendar year 2011. 120 EIA, Michigan Refinery Operable Atmospheric Crude oil Distillation Capacity as of January 1, 2012, at
www.eia.gov/dnav/pet/hist/LeafHandler.ashx?n=PET&s=8_NA_8D0_SMI_4&f=A, accessed June 24, 2013.

41
FIGURE 15.—Map of Petroleum Flow on the GLSLS.
GLSLS Island Community Petroleum Product Flow
The second petroleum product flow in the GLSLS involves shipping to island communities that
receive supplies via water. Although these shipments make up less than 1 percent of total
domestic petroleum receipts in the GLSLS, they are significant because of the total dependency
of these communities on GLSLS shipping for these products. These island ports include Put-in-
Bay on South Bass Island, Ohio; Detroit Harbor, on Washington Island, Wisconsin, and St.
James, on Beaver Island, Michigan.121
Petroleum products shipped to these locations include
gasoline and various fuel oils. In the case of Washington and Beaver Islands, the only power
plants on each island are petroleum-fired power plants.122
A major delay in petroleum shipments
to these locations may cause local power outages and fuel shortages.
121 USACE, Waterborne Commerce of the United States, Calendar Year 2011. 122 EIA, undated, U.S. Overview, U.S. States: State Profiles and Energy Estimates, undated, at www.eia.gov/state/, accessed June 5, 2013.
42
The Integrated Analysis Task Force Homeland Infrastructure Threat and Risk Analysis Center (IATF/HITRAC) produces
Regional Studies, which scope the infrastructure protection community’s risk environment from terrorist attacks, natural
hazards, and other events being reviewed and highlight the analytic capabilities required to produce infrastructure protection
related risk analytic products. The information is provided to support the activities of the Office of Infrastructure Protection
and to inform the strategies and capabilities of Federal, State, local, and private sector partners. For more information, contact
[email protected]. For more information about the Office of Infrastructure Protection, visit www.dhs.gov/criticalinfrastructure.
Conclusion
The GLSLS is a vast system that has evolved over time to provide low-cost transportation of raw
materials to critical industries. The system itself has been built to accommodate bulk cargo
within the region. Current conditions of the GLSLS present significant challenges to the shipping
industry. Chokepoints, lock conditions, dredging, water levels, and the state of the economy are
all factors that affect the ability to ship on the GLSLS in any given year. In past decades, low
water levels coupled with dredging backlogs have detrimentally affected ship capacities in the
system. To some degree, this circumstance has been offset by reductions in the demand for bulk
commodities due to market forces over the past 5–10 years. The extent to which water levels in
the GLSLS have affected the shipping industry and whether those levels will restrict industries
operating in the system if economic improvements allow for increased shipment/delivery of
commodities remains unclear. Some estimates assess that the GLSLS is currently operating
significantly below its maximum capacity, and indicate that reliance on the GLSLS for shipping
will increase in future years. If dredging backlogs and low water levels remain the norm for the
unforeseeable future, growth projections may intersect with physical constraints in the system.
Further study is needed, however, to determine whether current conditions will allow industries
to tap into this unused capacity unhindered.
Recommendations for Further Study
Potential areas of focus that would enhance the understanding of the GLSLS include the
following:
All-hazards analysis of the chokepoints and lock systems within the GLSLS.
Coal dependencies for power generation plants that receive coal from the GLSLS.
Effects of long-term future low-water levels on the GLSLS.
More extensive and in-depth economic studies of commodities shipped on the GLSLS to
determine the economic effect on states, ports, and communities.
The effects of dredging shortages on port operations and shipping in the GLSLS.
The economic effects on the steel industry, from a disruption of inputs that currently
travel on the GLSLS, including iron ore, limestone, coal, and metallurgic coke.