great company, great investment revisited gary smith
TRANSCRIPT

!1
Great Company, Great Investment Revisited
Gary Smith
Fletcher Jones Professor
Department of Economics
Pomona College
425 N. College Avenue
Claremont CA 91711

!2
Great Company, Great Investment Revisited
Abstract
Fortune magazine publishes an annual list of America’s most-admired companies. These
companies’ virtues are well known and presumably already factored into stock prices, yet
Anderson and Smith (2006) found that a portfolio of the ten most-admired stocks outperformed
the overall market by a substantial and statistically significant margin over the first 22 years that
the list was compiled. This paper uses 11 additional years of data to see whether this finding is
replicated or refuted.
keywords: efficient market hypothesis, most-admired companies

Great Company, Great Investment Revisited
Since 1983, Fortune magazine has published an annual list of the most-admired companies. The
efficient market hypothesis suggests that investors are well aware of the traits that make these
companies admirable and, therefore, this information should already be embedded in their stock
prices by the time Fortune’s list is published. Even if valuable new information is revealed in the
Fortune rankings, the efficient market hypothesis says that stock prices should incorporate this
information immediately after the list is published.
Surprising, Anderson and Smith (2006) found that a portfolio of the stocks identified
annually as America’s ten most admired companies outperformed the market by a substantial and
statistically significant margin, whether the stocks were purchased on the magazine’s cover date,
or 5, 10, 15, or 20 trading days later.
The performance of many promising investment strategies, such as the Foolish Four and the
Dogs of the Dow, has turned out to be mediocre after their discovery. Perhaps the surprising
success of the most-admired strategy has also self-destructed or was just a coincidence that has
now evaporated. This paper revisits the Anderson/Smith finding by incorporating data for the
eleven years following their study.
Thirty-Three Years of the Fortune Portfolio
Fortune’s rankings are based on a survey of thousands of executives, directors, and securities
analysts who rate companies in various areas of leadership, including innovation, quality of
management, and quality of products/services. The top ten companies (in order) in 2015 were
Apple, Google, Berkshire Hathaway, Amazon, Starbucks, Walt Disney, Southwest Airlines,
American Express, General Electric, and Coca-Cola.

!2
Anderson and Smith looked at the top-ten American companies for 1983 through 2004. I’ve
extended their analysis to 2015. The top-ten companies for these 11 additional years are listed in
Exhibit 1. Toyota made the list from 2006 through 2010, but was excluded from the analysis
because it is not an American company (the results are virtually the same if it is included).
Exhibit 1 The Ten Most Admired Companies, cover date in parentheses
2005 (3/7) 2006 (3/6) 2007 (3/19) 2008 (3/17)
1 Dell General Electric General Electric Apple
2 General Electric FedEx Starbucks Berkshire Hathaway
3 Starbucks Southwest Airlines Berkshire Hathaway General Electric
4 Wal-Mart Procter & Gamble Toyota Google
5 Southwest Airlines Starbucks Southwest Airlines Toyota
6 Fedex Johnson & Johnson FedEx Starbucks
7 Berkshire Hathaway Berkshire Hathaway Apple FedEx
8 Microsoft Dell Google Procter & Gamble
9 Johnson & Johnson Toyota Johnson & Johnson Johnson & Johnson
10 Procter & Gamble Microsoft Procter & Gamble Goldman Sachs
2009 (3/16) 2010 (3/22) 2011 (3/21) 2012 (3/19)
1 Apple Apple Apple Apple
2 Berkshire Hathaway Google Google Google
3 Toyota Berkshire Hathaway Berkshire Hathaway Amazon
4 Google Johnson & Johnson Southwest Airlines Coca-Cola
5 Johnson & Johnson Amazon Procter & Gamble IBM
6 Procter & Gamble Procter & Gamble Coca-Cola FedEx
*7 FedEx Toyota Amazon Berkshire Hathaway
*8 Southwest Airlines Goldman Sachs FedEx Starbucks
9 General Electric Wal-Mart Microsoft Procter & Gamble
10 Microsoft Coca-Cola McDonald's Southwest Airlines

!3
Exhibit 1 (Continued)
2013 (3/18) 2014 (3/17) 2015 (3/1)
1 Apple Apple Apple
2 Google Amazon Google
3 Amazon Google Berkshire Hathaway
4 Coca-Cola Berkshire Hathaway Amazon
5 Starbucks Starbucks Starbucks
6 IBM Coca-Cola Walt Disney
7 Southwest Airlines Walt Disney Southwest Airlines
8 Berkshire Hathaway FedEx American Express
9 Walt Disney Southwest Airlines General Electric
10 FedEx General Electric Coca-Cola
*: tie
The daily returns are from the Center for Research in Security Prices (CRSP) data base. The
Fortune strategy involves investing an equal dollar amount in each of the ten most admired
stocks each year. In one set of calculations, the annual trading day is the cover date; for example,
March 7, 2005, for the 2005 list. (Investors can implement this strategy because the magazine
goes on sale several days before the magazine’s cover date.) I also looked at portfolio trading
days that were 5, 10, 15, or 20 market days (approximately 1 to 4 weeks) after the cover date.
The top-ten stocks each year are held for approximately one year. The initial Fortune
portfolio is formed on the 1983 trading day; each year thereafter, the portfolio is liquidated on
that year’s trading day and the proceeds are reinvested in that year’s ten most admired
companies. For example, the 1983 portfolio is held until the 1984 trading day. The S&P 500
strategy is to be fully invested in the S&P 500 index the entire time. The strategies end on
October 31, 2015, the last day with available data when this analysis was done.

!4
Results
Exhibit 2 compares the average daily returns on the Fortune portfolio and the S&P 500 for the 22
years 1983-2004 studied by Anderson and Smith, the next 11 years 2005-2015, and the entire 33-
year period.
Exhibit 2 Average Daily Percentage Returns From Purchases Made n Days After Fortune’s Cover Date
1983-2004: n Fortune Portfolio S&P 500 Portfolio Difference P-value
0 0.0640 0.0437 0.0204 0.0089
5 0.0653 0.0432 0.0221 0.0045
10 0.0650 0.0433 0.0217 0.0055
15 0.0650 0.0430 0.0220 0.0047
20 0.0646 0.0428 0.0218 0.0049
2005-2015: n Fortune Portfolio S&P 500 Portfolio Difference P-value
0 0.0484 0.0266 0.0218 0.0494
5 0.0480 0.0272 0.0208 0.0605
10 0.0492 0.0282 0.0210 0.0577
15 0.0489 0.0290 0.0199 0.0606
20 0.0500 0.0289 0.0210 0.0560
1983-2015: n Fortune Portfolio S&P 500 Portfolio Difference P-value
0 0.0587 0.0380 0.0207 0.0012
5 0.0594 0.0379 0.0214 0.0007
10 0.0596 0.0383 0.0213 0.0009
15 0.0596 0.0383 0.0212 0.0009
20 0.0596 0.0382 0.0214 0.0007
Regardless of the time period or the delay in implementing the Fortune strategy, the average
difference in daily returns is consistently around 0.02 percentage points. In the remainder of the

!5
paper, I will focus on the results when the strategy is implemented on the cover date since the
results are robust with respect to other trading dates. The two-sided p-values in Exhibit 2 are for
a matched-pair t test comparing the daily returns on the Fortune portfolio and the S&P 500
portfolio. These p-values are less than 1 percent for the longer time periods, but around 5 percent
for the shorter period, 2005 through 2015.
A 0.02 daily percentage-point difference in performance cumulates to a substantial difference
over decades. Exhibit 3 shows that the Fortune portfolio beat the S&P 500 by more than five
percentage points per year during the initial 1983-2004 study, during the next eleven years
2005-2015, and for the entire period 1983-2015.
The annual revision of the ten-stock Fortune portfolio would incur more transaction costs
than a one-time purchase of an S&P index fund; however, these costs should be small for
reasonably large portfolios. For example, selling ten stocks and buying ten stocks at $10 per
transaction is a 0.2 percent cost for a $100,000 portfolio.
Exhibit 3 Fortune Admired Portfolio Versus the S&P 500
Annualized Rate of Return
Fortune S&P 500 Fortune Wealth/S&P 500 Wealth
1983-2004 15.28% 10.15% 2.72
2005-2015 10.65% 4.60% 1.86
1983-2015 13.72% 8.27% 5.06
This five-percentage-point annual differential caused the Fortune portfolio to grow 172 percent
more than the S&P 500 portfolio during the first 22 years, and add another 86 percent during the
next 11 years. After 33 years, the value of the Fortune portfolio is five times the size of the S&P
500 portfolio. Exhibits 4 and 5 show the daily movements in the value of these portfolios and in

!6
the value of the Fortune portfolio relative to the S&P 500 portfolio.
! Exhibit 4 The Fortune Portfolio and S&P 500 Portfolio, 1983 - 2015
! Exhibit 5 The Fortune Portfolio Relative to the S&P 500 Portfolio, 1983 - 2015
0
10
20
30
40
50
60
70
1983 1987 1991 1995 1999 2003 2007 2011 2015
Wealth
Fortune portfolio
S&P 500
0
1
2
3
4
5
6
1983 1987 1991 1995 1999 2003 2007 2011 2015
Fortune portfolio
S&P 500

!7
The superior performance of the Fortune portfolio was not due to a handful of extraordinary
stocks. Overall, 57 percent of the Fortune stocks beat the S&P 500 in the initial study, 61 percent
did so in the subsequent 11 years, and 58 percent did so during the entire period 1983 through
2015 (binomial two-sided p-value = 0.0036).
Nor does the superior performance of the Fortune portfolio appear to be a risk premium. The
most admired companies are large and financially sound and unlikely to be considered riskier
than average. The standard deviations of the daily returns on the Fortune portfolio and the S&P
500 are similar (0.0012 versus 0.0011), and the Fortune portfolio’s beta is 0.96.
I also gauged the riskiness of the Fortune portfolio by estimating the Fama-French (1993)
three-factor model augmented by a momentum factor (Carhart 1997)
! where
R = return on Fortune portfolio minus the return on Treasury bills
MKT = the value-weighted return on all NYSE, AMEX, and NASDAQ stocks (from
CRSP) minus the return on Treasury bills
SMB = average return on three small-stock portfolios minus the average return on three
large-stock portfolios (size factor)
HML = the average return on two value portfolios minus the average return on two growth
portfolios (value factor)
UMD = average return on two high-prior-return portfolios minus the average return on
two low-prior-return portfolios (momentum factor)
The factor data were taken from Ken French's web site (2015).
R =α + β1MKT + β2SMB + β3HML + β4UMD + ε

!8
This model reflects the historical evidence that stock returns are affected by common macro
factors; small stocks tend to outperform large stocks (Banz 1981; Reinganum 1981); value stocks
tend to outperform growth stocks (Rosenberg , Reid and Lanstein, 1985); and stocks that have
been doing well tend to continue doing well (Jegadeesh and Titman 1993).
Chan (1988) and Fama and French (1992) argue that these factors must represent risks that
matter to investors who consequently must be rewarded for bearing these risks. Others,
including Lakonishok, Shliefer, and Vishny (1994) and Smith, Keil, and Smith (2004), argue that
market inefficiencies may be involved—for example, value stocks might generally do well
because investors overreact to news, causing some stocks to be mispriced temporarily. Either
way, the question here is whether the relatively strong performance of the Fortune portfolio can
be explained by these four factors.
Anderson and Smith found that for the years 1983 through 2004, the Fortune portfolio had a
market-factor coefficient below 1 and had negative coefficients for the other three factors.
Exhibit 6 shows that this is also true for the years 2005-2015 and for the period as a whole.
As noted earlier, the single-index model has a beta of 0.96; here the coefficient of the market
factor is a bit less than this. The negative coefficient for the size factor is unsurprising since these
are large companies. The negative coefficient for the value factor is consistent with the
conclusion of Fama and French (1995) that strong firms with consistently strong earnings tend to
have negative value coefficients. Anderson and Smith had no prior expectations about the
momentum factor and the coefficient is small.
Exhibit 6 Estimates of a Daily Four-Factor Model, daily percentage returns
Alpha MKT SMB HML UMD R-squared

!9
1983-2004 0.025 0.94 -0.33 -0.40 -0.08 0.81
(3.34) (88.97) (23.29) (20.84) (6.94)
2005-2015 0.016 0.87 -0.08 -0.14 -0.07 0.85
(1.75) (109.39) (5.24) (7.23) (6.78)
1983-2015 0.020 0.95 -0.25 -0.32 -0.09 0.82
(3.42) (168.70) (25.29) (27.64) (11.13)
( ): t-values
The alpha estimates are roughly consistent, though the alpha estimate is not quite statistically
significant at the 5 percent level for the shorter period, perhaps due to the smaller number of
observations. A daily alpha of 0.02 is comparable to the 0.02 percentage-point difference in daily
returns shown in Exhibit 2.
The bottom line is that, for the period as a whole, the success of the Fortune portfolio is
evidently not due to market, size, value, or momentum factors, leaving the large excess returns
hard to reconcile with the efficient market hypothesis.
Another possibility is that there is an announcement effect that benefits the top-ten stocks
when they are revealed each year. This seems unlikely since the success of the Fortune strategy
does not depend on whether the portfolios are formed 0, 5, 10, 15, or 20 days after the cover
date. Nonetheless, to examine this issue directly, I calculated the average portfolio returns on
each day after the cover date; that is, the average portfolio return the first day after the cover
date, the second day, and so on.
Exhibit 7 shows the ratio of the average Fortune portfolio wealth to the average S&P 500 for
1,250 days (approximately five years) after the cover date. The superior performance of the
Fortune portfolio does not happen on any single day. It is a cumulative process that continues
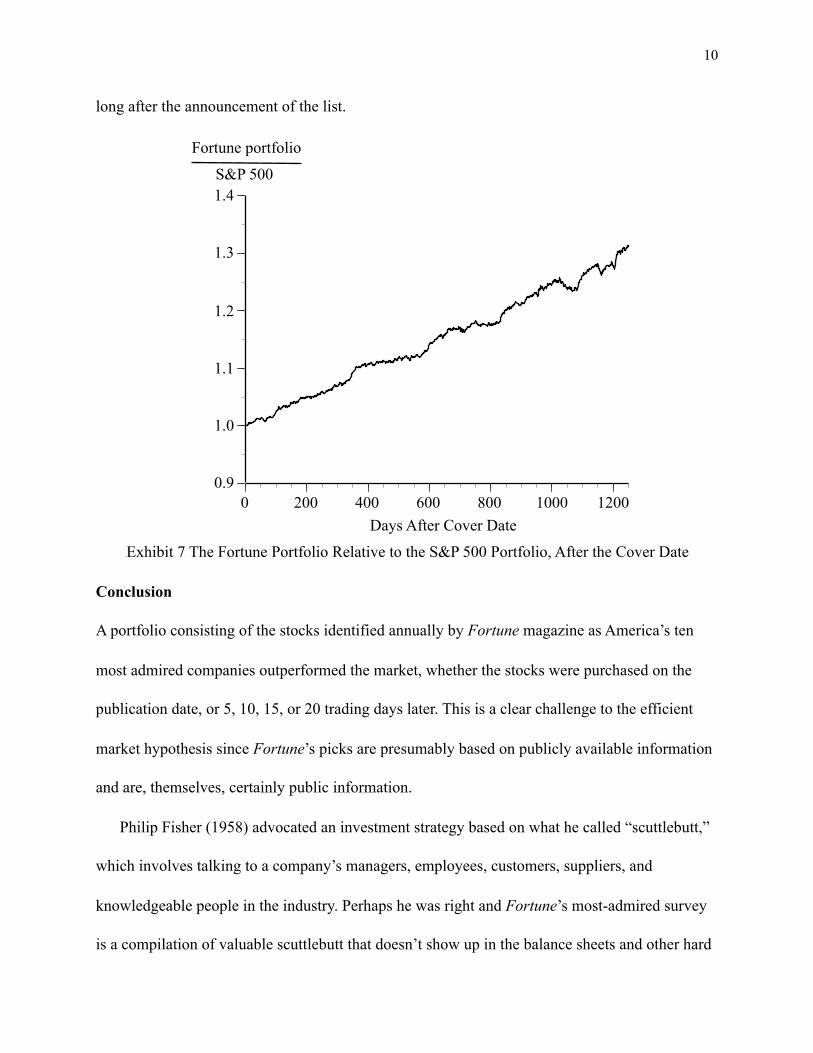
!10
long after the announcement of the list.
! Exhibit 7 The Fortune Portfolio Relative to the S&P 500 Portfolio, After the Cover Date
Conclusion
A portfolio consisting of the stocks identified annually by Fortune magazine as America’s ten
most admired companies outperformed the market, whether the stocks were purchased on the
publication date, or 5, 10, 15, or 20 trading days later. This is a clear challenge to the efficient
market hypothesis since Fortune’s picks are presumably based on publicly available information
and are, themselves, certainly public information.
Philip Fisher (1958) advocated an investment strategy based on what he called “scuttlebutt,”
which involves talking to a company’s managers, employees, customers, suppliers, and
knowledgeable people in the industry. Perhaps he was right and Fortune’s most-admired survey
is a compilation of valuable scuttlebutt that doesn’t show up in the balance sheets and other hard
0.9
1.0
1.1
1.2
1.3
1.4
0 200 400 600 800 1000 1200
Fortune portfolio
S&P 500
Days After Cover Date

!11
data that investors use to value stocks, and is insufficiently appreciated by investors even after
the Fortune list is announced. Perhaps investors should consider the useful information conveyed
by this survey.

!12
References
Anderson, J. and G. Smith, 2006, A Great Company Can Be a Great Investment, Financial
Analysts Journal, 62, 86-93.
Banz, Rolf, 1981, The relationship between return and market value of common stocks, Journal
of Financial Economics, 9, 3–18.
Carhart, Mark M., 1997, On persistence in mutual fund performance, Journal of Finance, 52, 57-
82.
Chan, K., 1988, On the contrarian investment strategy, Journal of Business, 61, 147–163.
Fama, E. F. and K. R. French, 1992, The cross-section of expected stock returns, Journal of
Finance, 47, 427–465.
Fama, E. F. and K. R. French, 1993, Common risk factors in the returns on bonds and stocks,
Journal of Financial Economics, 33, 3-53.
Fama, E. F. and K. R. French, 1995, Size and book-to-market factors in earnings and returns,
Journal of Finance, 50, 131-155.
Fisher, Philip A. Common Stocks and Uncommon Profits. Hoboken, NJ: John Wiley & Sons,
1958; reprinted and updated 2003.
Fortune. http://www.fortune.com/fortune/. Retrieved April 4, 2015.
French, Kenneth R., Data Library; Retrieved April 4, 2015, from http://mba.tuck.dartmouth.edu/
pages/faculty/ken.french/data_library.html.
Jegadeesh, N., and S. Titman, 1993, Returns to buying winners and selling losers: implications
for stock market efficiency, Journal of Finance, 48, 65-91.
Keil, M., Smith, G., and M. H. Smith, 2004, Shrunken earnings predictions are better

!13
predictions, Applied Financial Economics, 14 (13), 937–943.
Lakonishok, J., Shliefer, A. and R. W. Vishny, 1994, Contrarian investment, extrapolation, and
risk, Journal of Finance, 49, 1541–1578.
La Porta, R., 1996, Expectations and the cross-section of stock returns, Journal of Finance, 49,
1715–1742.
Reinganum, Marc 1981, Misspecification of capital asset pricing: Empirical anomalies based on
earnings’ yields and market values, Journal of Financial Economics, 9, 19–46.
Rosenberg, B., Reid, K. and R. Lanstein, 1985, Persuasive evidence of market inefficiency,
Journal of Portfolio Management, 11, 9–17.