grc business value calculators for m7 apps - grc-summit.com · grc business value calculators for...
TRANSCRIPT
GRC Business Value Calculators for M7 AppsYo Delmar, Vice President, Customer Engagement Programs, MetricStream
© 2018 GRC Summit All Rights Reserved.
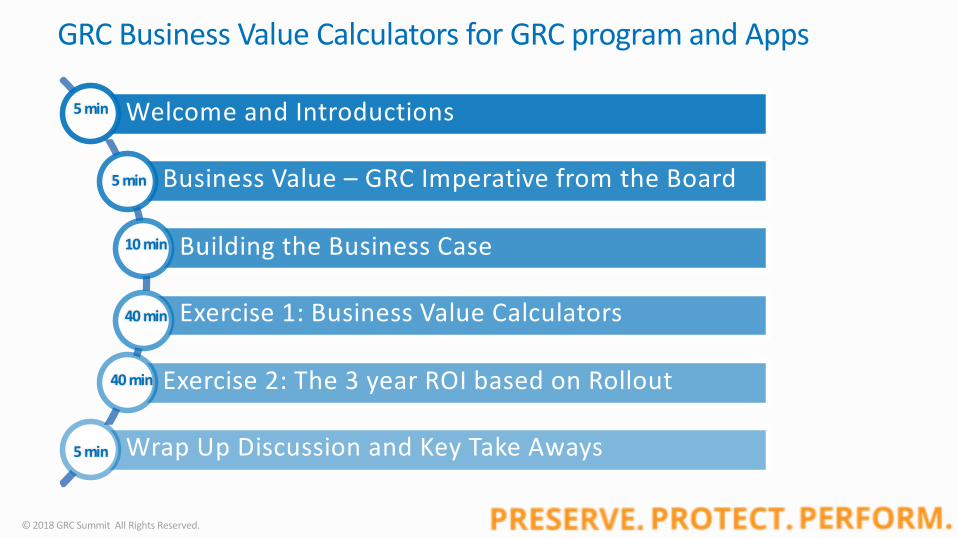
GRC Business Value Calculators for GRC program and Apps
Welcome and Introductions
Business Value – GRC Imperative from the Board
Building the Business Case
Exercise 1: Business Value Calculators
Exercise 2: The 3 year ROI based on Rollout
Wrap Up Discussion and Key Take Aways
5 min
10 min
40 min
5 min
40 min
5 min
© 2018 GRC Summit All Rights Reserved.
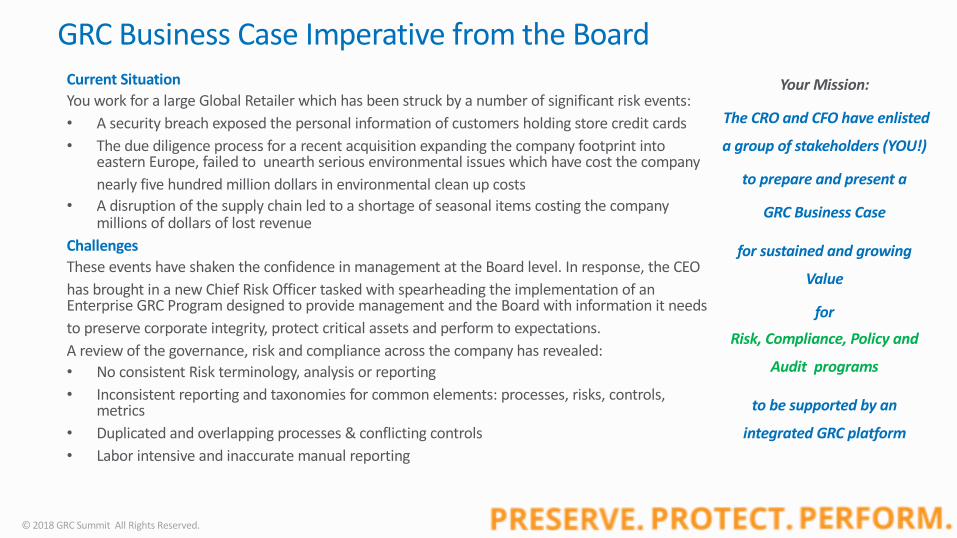
GRC Business Case Imperative from the BoardCurrent SituationYou work for a large Global Retailer which has been struck by a number of significant risk events:• A security breach exposed the personal information of customers holding store credit cards• The due diligence process for a recent acquisition expanding the company footprint into
eastern Europe, failed to unearth serious environmental issues which have cost the company nearly five hundred million dollars in environmental clean up costs
• A disruption of the supply chain led to a shortage of seasonal items costing the company millions of dollars of lost revenue
ChallengesThese events have shaken the confidence in management at the Board level. In response, the CEO has brought in a new Chief Risk Officer tasked with spearheading the implementation of an Enterprise GRC Program designed to provide management and the Board with information it needs to preserve corporate integrity, protect critical assets and perform to expectations.A review of the governance, risk and compliance across the company has revealed:• No consistent Risk terminology, analysis or reporting• Inconsistent reporting and taxonomies for common elements: processes, risks, controls,
metrics• Duplicated and overlapping processes & conflicting controls• Labor intensive and inaccurate manual reporting
Your Mission:
The CRO and CFO have enlisted
a group of stakeholders (YOU!)
to prepare and present a
GRC Business Case
for sustained and growing
Value
for
Risk, Compliance, Policy and
Audit programs
to be supported by an
integrated GRC platform
© 2018 GRC Summit All Rights Reserved.
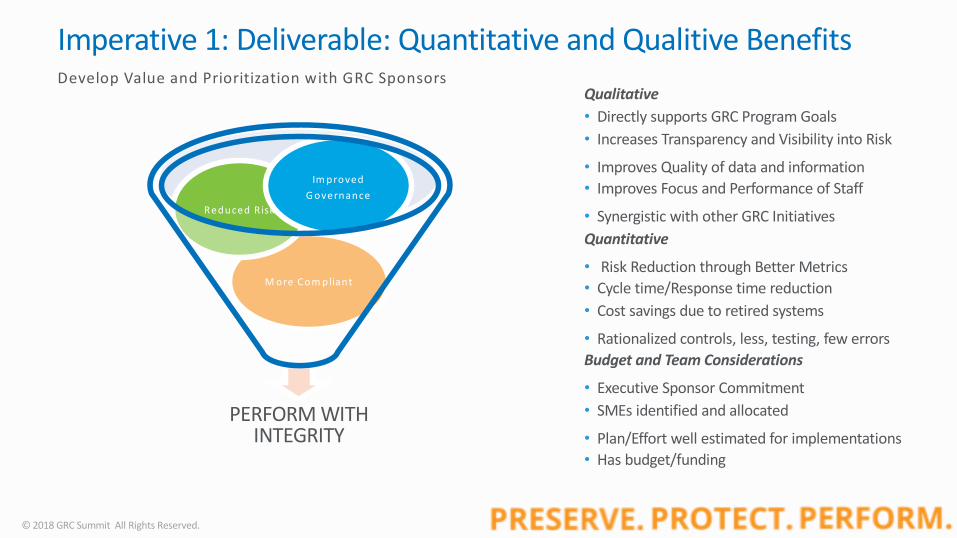
Imperative 1: Deliverable: Quantitative and Qualitive BenefitsDevelop Value and Prioritization with GRC Sponsors
PERFORM WITH INTEGRITY
M ore Com pliant
Reduced R isk
Im proved G overnance
Qualitative• Directly supports GRC Program Goals• Increases Transparency and Visibility into Risk
• Improves Quality of data and information • Improves Focus and Performance of Staff
• Synergistic with other GRC InitiativesQuantitative• Risk Reduction through Better Metrics• Cycle time/Response time reduction • Cost savings due to retired systems
• Rationalized controls, less, testing, few errorsBudget and Team Considerations• Executive Sponsor Commitment• SMEs identified and allocated
• Plan/Effort well estimated for implementations• Has budget/funding
© 2018 GRC Summit All Rights Reserved.
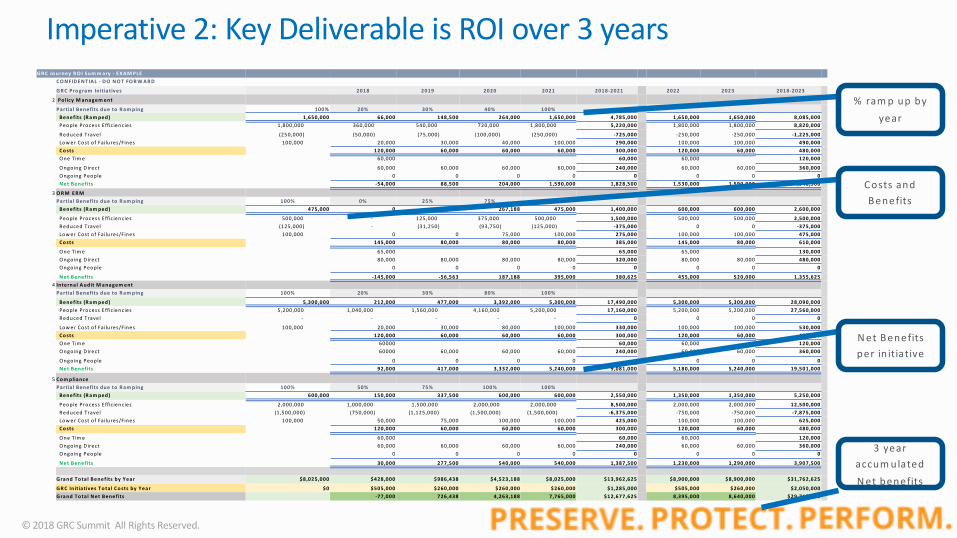
GR C Jo urney R O I Sum m ary - EXA M PLECO N FID EN TIA L - D O N O T FO R W A R D
GR C Pro gram Initiatives 2018 2019 2020 2021 2018-2021 2022 2023 2018-2023
2 Po licy M anagem ent
Partia l Benefits due to R am ping 100% 20% 30% 40% 100%Benefits (R am ped) 1,650,000 66,000 148,500 264,000 1,650,000 4,785,000 1,650,000 1,650,000 8,085,000People Process E fficiencies 1,800,000 360,000 540,000 720,000 1,800,000 5,220,000 1,800,000 1,800,000 8,820,000
R educed Travel (250,000) (50,000) (75,000) (100,000) (250,000) -725,000 -250,000 -250,000 -1,225,000Low er Cost of Failures/Fines 100,000 20,000 30,000 40,000 100,000 290,000 100,000 100,000 490,000Co sts 120,000 60,000 60,000 60,000 300,000 120,000 60,000 480,000O ne Tim e 60,000 60,000 60,000 120,000
O ngoing D irect 60,000 60,000 60,000 60,000 240,000 60,000 60,000 360,000O ngoing People 0 0 0 0 0 0 0 0N et Benefits -54,000 88,500 204,000 1,590,000 1,828,500 1,530,000 1,590,000 4,948,500
3 O R M ER MPartia l Benefits due to R am ping 100% 0% 25% 75% 100%
Benefits (R am ped) 475,000 0 23,438 267,188 475,000 1,400,000 600,000 600,000 2,600,000
People Process E fficiencies 500,000 - 125,000 375,000 500,000 1,500,000 500,000 500,000 2,500,000R educed Travel (125,000) - (31,250) (93,750) (125,000) -375,000 0 0 -375,000Low er Cost of Failures/Fines 100,000 0 0 75,000 100,000 275,000 100,000 100,000 475,000Co sts 145,000 80,000 80,000 80,000 385,000 145,000 80,000 610,000
O ne Tim e 65,000 65,000 65,000 130,000O ngoing D irect 80,000 80,000 80,000 80,000 320,000 80,000 80,000 480,000O ngoing People 0 0 0 0 0 0 0 0
N et Benefits -145,000 -56,563 187,188 395,000 380,625 455,000 520,000 1,355,6254 Internal A udit M anagem ent
Partia l Benefits due to R am ping 100% 20% 30% 80% 100%
Benefits (R am ped) 5,300,000 212,000 477,000 3,392,000 5,300,000 17,490,000 5,300,000 5,300,000 28,090,000People Process E fficiencies 5,200,000 1,040,000 1,560,000 4,160,000 5,200,000 17,160,000 5,200,000 5,200,000 27,560,000R educed Travel - - - - - 0 0 0 0
Low er Cost of Failures/Fines 100,000 20,000 30,000 80,000 100,000 330,000 100,000 100,000 530,000Co sts 120,000 60,000 60,000 60,000 300,000 120,000 60,000 480,000O ne Tim e 60000 60,000 60,000 120,000O ngoing D irect 60000 60,000 60,000 60,000 240,000 60,000 60,000 360,000
O ngoing People 0 0 0 0 0 0 0 0N et Benefits 92,000 417,000 3,332,000 5,240,000 9,081,000 5,180,000 5,240,000 19,501,000
5 Co m pliancePartia l Benefits due to R am ping 100% 50% 75% 100% 100%
Benefits (R am ped) 600,000 150,000 337,500 600,000 600,000 2,550,000 1,350,000 1,350,000 5,250,000
People Process E fficiencies 2,000,000 1,000,000 1,500,000 2,000,000 2,000,000 8,500,000 2,000,000 2,000,000 12,500,000R educed Travel (1,500,000) (750,000) (1,125,000) (1,500,000) (1,500,000) -6,375,000 -750,000 -750,000 -7,875,000Low er Cost of Failures/Fines 100,000 50,000 75,000 100,000 100,000 425,000 100,000 100,000 625,000Co sts 120,000 60,000 60,000 60,000 300,000 120,000 60,000 480,000
O ne Tim e 60,000 60,000 60,000 120,000O ngoing D irect 60,000 60,000 60,000 60,000 240,000 60,000 60,000 360,000O ngoing People 0 0 0 0 0 0 0 0
N et Benefits 30,000 277,500 540,000 540,000 1,387,500 1,230,000 1,290,000 3,907,500
Grand To ta l Benefits by Year $8,025,000 $428,000 $986,438 $4,523,188 $8,025,000 $13,962,625 $8,900,000 $8,900,000 $31,762,625
GR C Initiatives To ta l Co sts by Year $0 $505,000 $260,000 $260,000 $260,000 $1,285,000 $505,000 $260,000 $2,050,000Grand To ta l N et Benefits -77,000 726,438 4,263,188 7,765,000 $12,677,625 8,395,000 8,640,000 $29,712,625
Imperative 2: Key Deliverable is ROI over 3 years
% ram p up by
year
Costs and B enefits
N et B enefits per in itiative
3 year accum ulated
N et benefits
© 2018 GRC Summit All Rights Reserved.
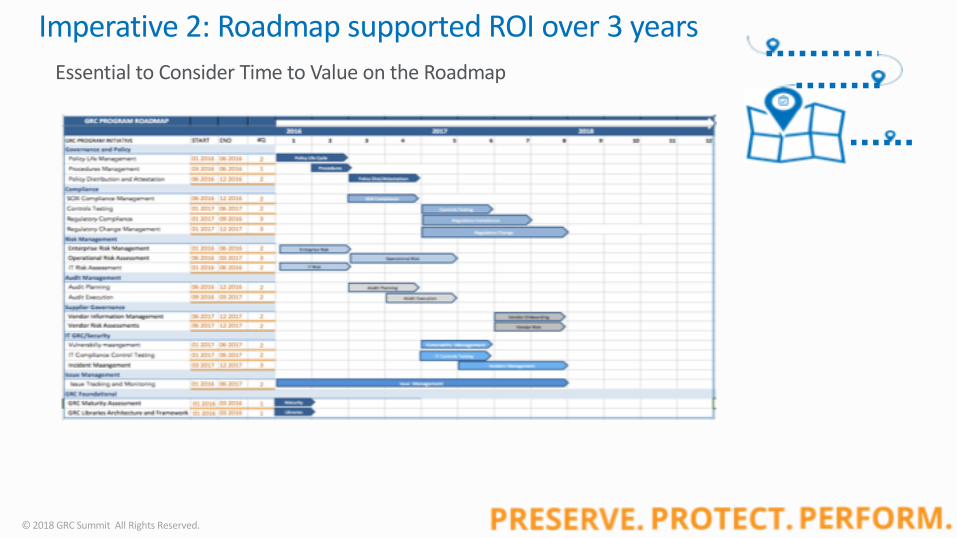
Essential to Consider Time to Value on the Roadmap
Imperative 2: Roadmap supported ROI over 3 years
© 2018 GRC Summit All Rights Reserved.
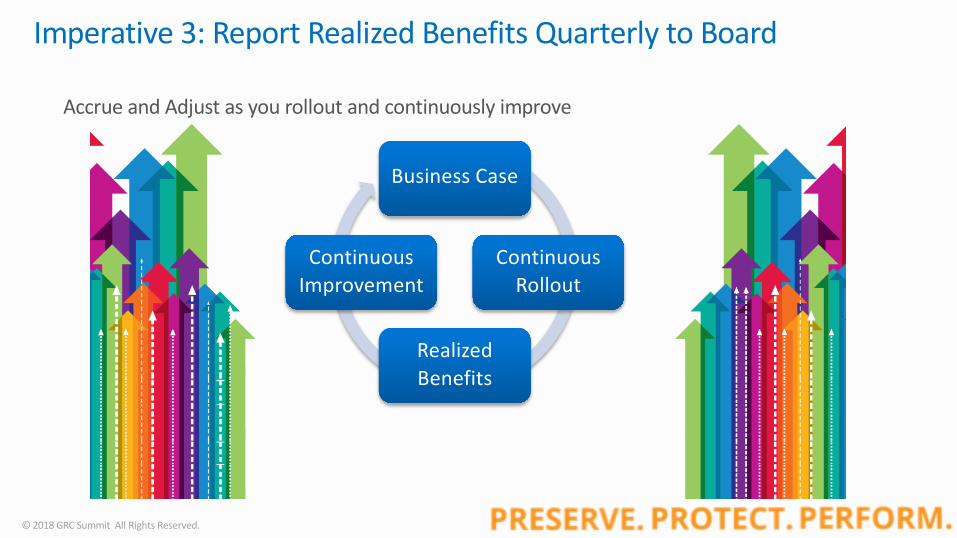
Imperative 3: Report Realized Benefits Quarterly to Board
Business Case
ContinuousRollout
Realized Benefits
Continuous Improvement
Accrue and Adjust as you rollout and continuously improve
© 2018 GRC Summit All Rights Reserved.
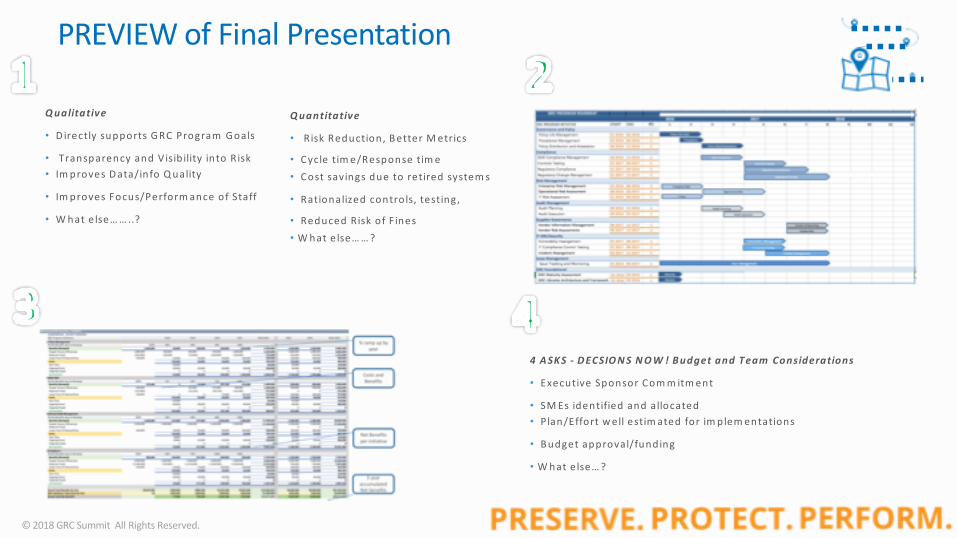
PREVIEW of Final Presentation
4 A SKS - D ECSIO N S N O W ! B udget and Team Considerations
• Executive Sponsor Com m itm ent
• SM Es identified and allocated
• Plan/Effort w ell estim ated for im plem entations
• B udget approval/funding
• W hat e lse… ?
Q ualitative
• D irectly supports G RC Program G oals
• Transparency and V isib ility into R isk
• Im proves D ata/info Q uality
• Im proves Focus/Perform ance of Staff
• W hat e lse… … ..?
Q uantitative
• Risk Reduction, B etter M etrics
• Cycle tim e/Response tim e
• Cost savings due to retired system s
• Rationalized contro ls, testing,
• Reduced Risk of F ines
• W hat e lse… … ?
GRC Program and Project Goals
Assumption: You have scoped the program based on executive and business goals and needs
© 2018 GRC Summit All Rights Reserved.
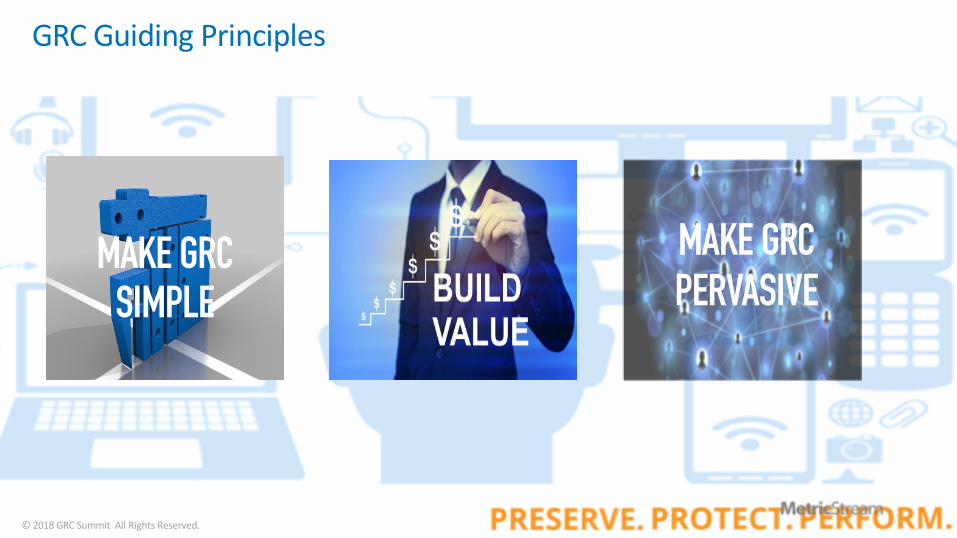
GRC Guiding Principles
MAKE GRC SIMPLE
MAKE GRC PERVASIVE
© 2018 GRC Summit All Rights Reserved.
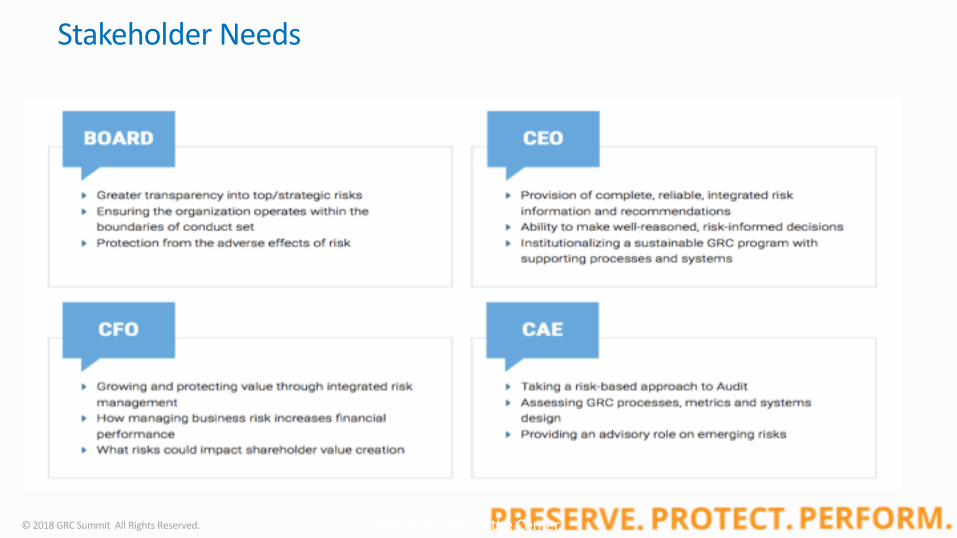
Stakeholder Needs
* See OCEG CRO at the Center
© 2018 GRC Summit All Rights Reserved. * See OCEG CRO at the Center
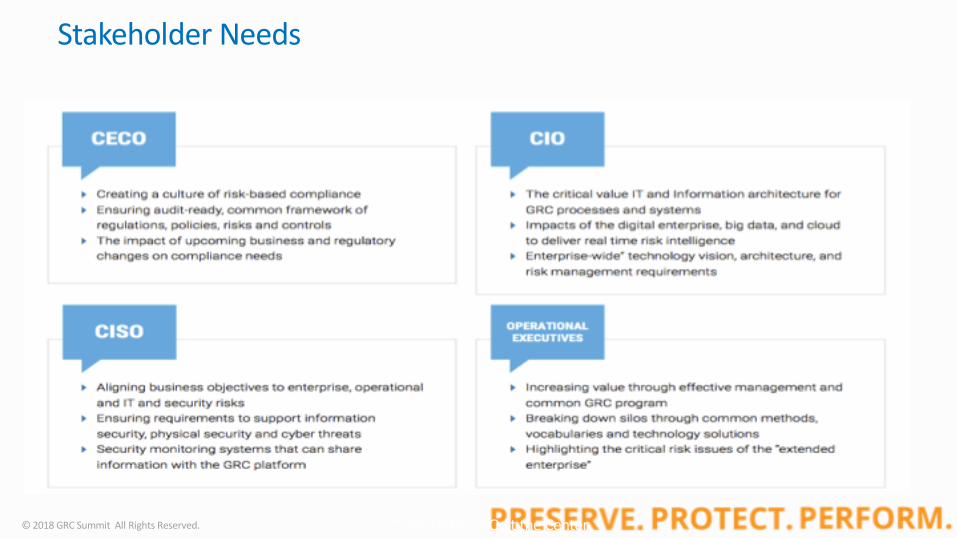
Stakeholder Needs
© 2018 GRC Summit All Rights Reserved.
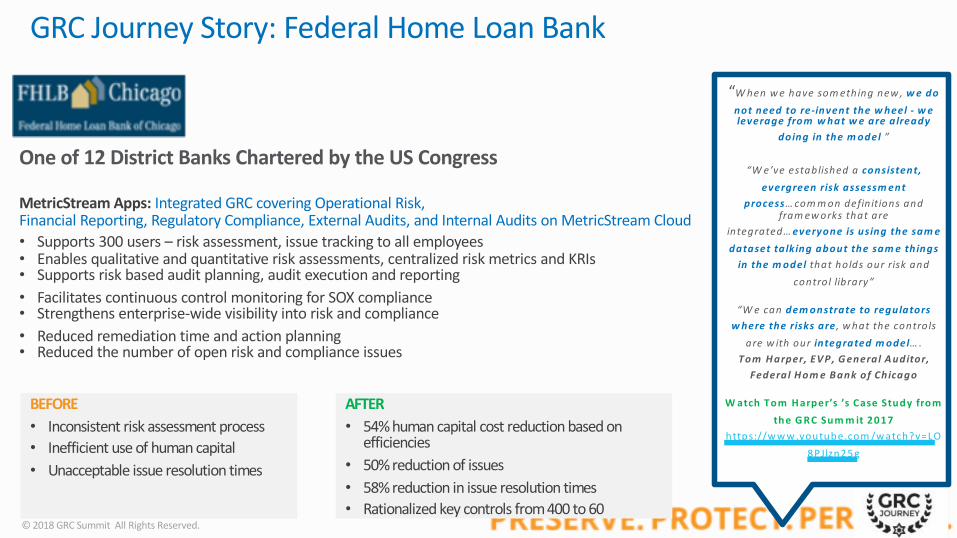
“W hen w e have som ething new , w e do not need to re-invent the w heel - w e leverage from w hat w e are a lready
doing in the m odel ”
“W e’ve established a consistent, evergreen risk assessm ent
process… com m on defin itions and fram ew orks that are
integrated… everyone is using the sam e dataset ta lking about the sam e things
in the m odel that holds our risk and contro l library”
“W e can dem onstrate to regulators w here the risks are , w hat the contro ls
are w ith our integrated m odel… .Tom H arper, EV P, G eneral A uditor,
Federal H om e B ank of Chicago
W atch Tom H arper’s ’s Case Study from the G RC Sum m it 2017
https://w w w .youtube.com /w atch?v=LO8PJlzn25g
GRC Journey Story: Federal Home Loan Bank
BEFORE• Inconsistent risk assessment process• Inefficient use of human capital• Unacceptable issue resolution times
One of 12 District Banks Chartered by the US Congress
MetricStream Apps: Integrated GRC covering Operational Risk, Financial Reporting, Regulatory Compliance, External Audits, and Internal Audits on MetricStream Cloud• Supports 300 users – risk assessment, issue tracking to all employees• Enables qualitative and quantitative risk assessments, centralized risk metrics and KRIs• Supports risk based audit planning, audit execution and reporting• Facilitates continuous control monitoring for SOX compliance• Strengthens enterprise-wide visibility into risk and compliance• Reduced remediation time and action planning • Reduced the number of open risk and compliance issues
AFTER• 54% human capital cost reduction based on
efficiencies• 50% reduction of issues• 58% reduction in issue resolution times• Rationalized key controls from 400 to 60
© 2018 GRC Summit All Rights Reserved.
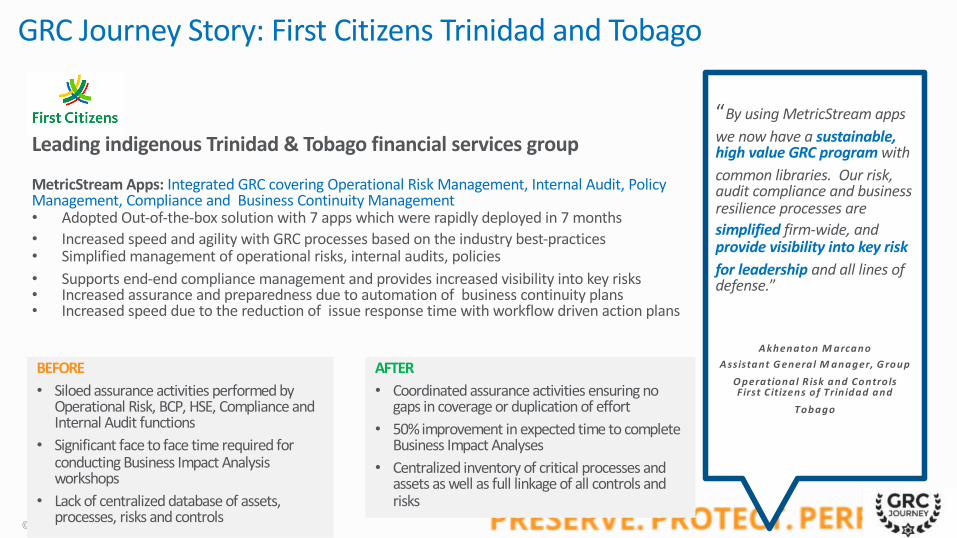
BEFORE• Siloed assurance activities performed by
Operational Risk, BCP, HSE, Compliance and Internal Audit functions
• Significant face to face time required for conducting Business Impact Analysis workshops
• Lack of centralized database of assets, processes, risks and controls
GRC Journey Story: First Citizens Trinidad and Tobago
AFTER• Coordinated assurance activities ensuring no
gaps in coverage or duplication of effort• 50% improvement in expected time to complete
Business Impact Analyses• Centralized inventory of critical processes and
assets as well as full linkage of all controls and risks
Leading indigenous Trinidad & Tobago financial services group
MetricStream Apps: Integrated GRC covering Operational Risk Management, Internal Audit, Policy Management, Compliance and Business Continuity Management• Adopted Out-of-the-box solution with 7 apps which were rapidly deployed in 7 months• Increased speed and agility with GRC processes based on the industry best-practices• Simplified management of operational risks, internal audits, policies• Supports end-end compliance management and provides increased visibility into key risks• Increased assurance and preparedness due to automation of business continuity plans• Increased speed due to the reduction of issue response time with workflow driven action plans
“By using MetricStream apps we now have a sustainable, high value GRC program with common libraries. Our risk, audit compliance and business resilience processes are simplified firm-wide, and provide visibility into key risk for leadership and all lines of defense.”
A khenaton M arcanoA ssistant G eneral M anager, G roup
O perational R isk and ControlsFirst Citizens of Trin idad and
Tobago
© 2018 GRC Summit All Rights Reserved.
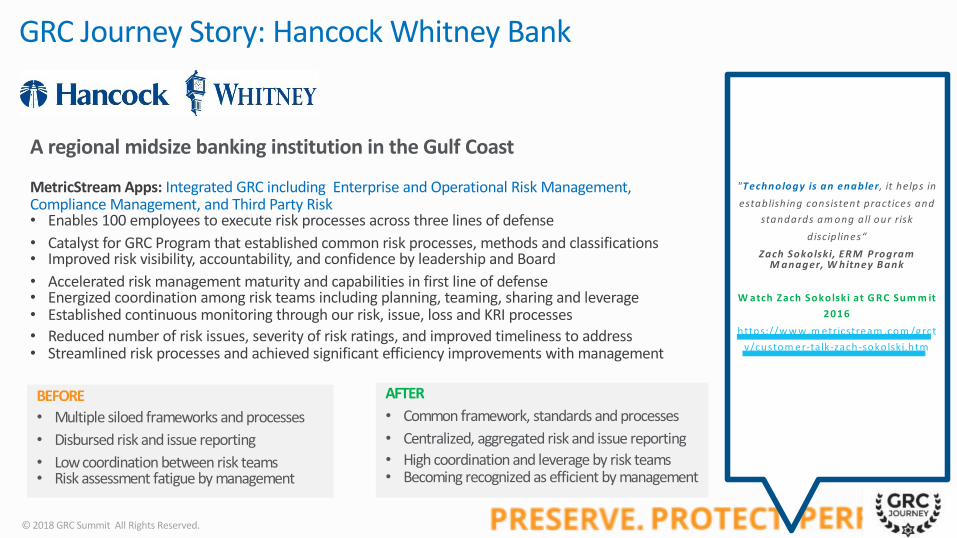
BEFORE• Multiple siloed frameworks and processes• Disbursed risk and issue reporting• Low coordination between risk teams• Risk assessment fatigue by management
GRC Journey Story: Hancock Whitney Bank
AFTER• Common framework, standards and processes• Centralized, aggregated risk and issue reporting• High coordination and leverage by risk teams• Becoming recognized as efficient by management
A regional midsize banking institution in the Gulf Coast
MetricStream Apps: Integrated GRC including Enterprise and Operational Risk Management, Compliance Management, and Third Party Risk• Enables 100 employees to execute risk processes across three lines of defense• Catalyst for GRC Program that established common risk processes, methods and classifications • Improved risk visibility, accountability, and confidence by leadership and Board• Accelerated risk management maturity and capabilities in first line of defense• Energized coordination among risk teams including planning, teaming, sharing and leverage• Established continuous monitoring through our risk, issue, loss and KRI processes• Reduced number of risk issues, severity of risk ratings, and improved timeliness to address• Streamlined risk processes and achieved significant efficiency improvements with management
"Technology is an enabler, it helps in establish ing consistent practices and
standards am ong all our risk d iscip lines“
Zach Sokolski, ERM Program M anager, W hitney B ank
W atch Zach Sokolski at G RC Sum m it 2016
https://w w w .m etricstream .com /grctv/custom er-talk-zach-sokolski.htm
© 2018 GRC Summit All Rights Reserved.
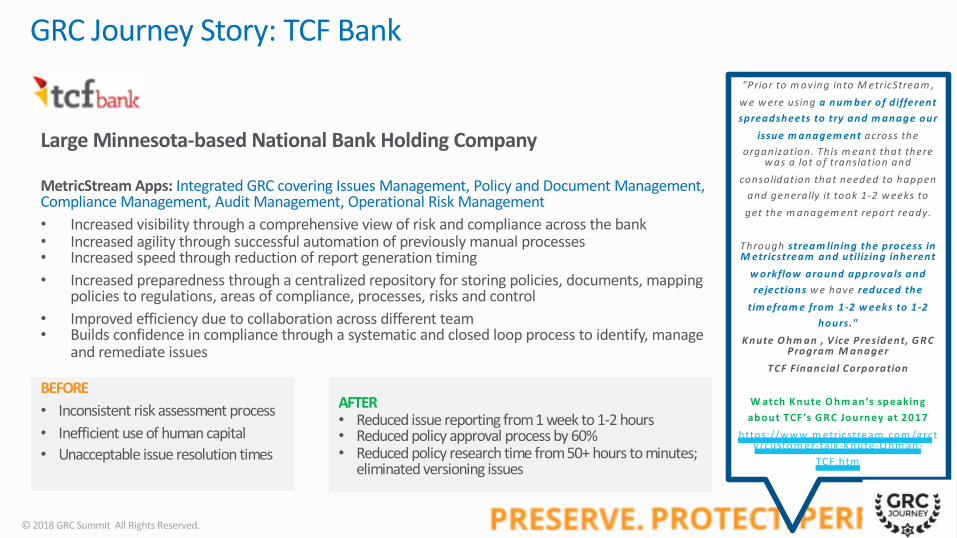
"Prior to m oving into M etricStream , w e w ere using a num ber of d ifferent spreadsheets to try and m anage our
issue m anagem ent across the organization. This m eant that there
w as a lot of translation and consolidation that needed to happen
and generally it took 1-2 w eeks to get the m anagem ent report ready.
Through stream lin ing the process in M etricstream and utilizing inherent
w orkflow around approvals and rejections w e have reduced the
tim efram e from 1-2 w eeks to 1-2 hours."
Knute O hm an , V ice President, G RC Program M anager
TCF Financial Corporation
W atch Knute O hm an’s speaking about TCF’s G RC Journey at 2017
https://w w w .m etricstream .com /grctv/custom er-talk-Knute-O hm an-
TCF.htm
BEFORE• Inconsistent risk assessment process• Inefficient use of human capital• Unacceptable issue resolution times
AFTER• Reduced issue reporting from 1 week to 1-2 hours• Reduced policy approval process by 60%• Reduced policy research time from 50+ hours to minutes;
eliminated versioning issues
Large Minnesota-based National Bank Holding Company
MetricStream Apps: Integrated GRC covering Issues Management, Policy and Document Management, Compliance Management, Audit Management, Operational Risk Management• Increased visibility through a comprehensive view of risk and compliance across the bank• Increased agility through successful automation of previously manual processes• Increased speed through reduction of report generation timing• Increased preparedness through a centralized repository for storing policies, documents, mapping
policies to regulations, areas of compliance, processes, risks and control• Improved efficiency due to collaboration across different team• Builds confidence in compliance through a systematic and closed loop process to identify, manage
and remediate issues
GRC Journey Story: TCF Bank
© 2018 GRC Summit All Rights Reserved.
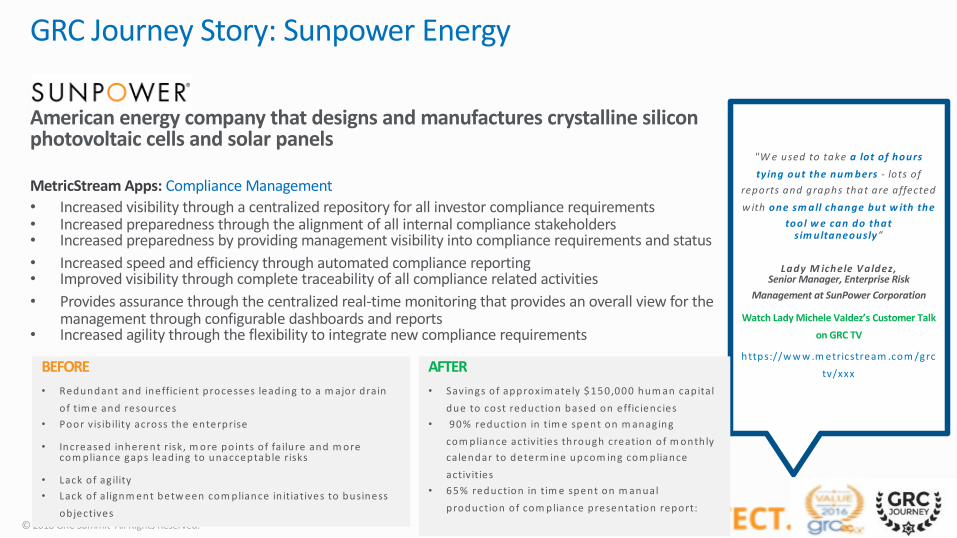
"W e used to take a lot of hours ty ing out the num bers - lots of
reports and graphs that are affected w ith one sm all change but w ith the
tool w e can do that sim ultaneously”
Lady M ichele V aldez,Senior Manager, Enterprise Risk
Management at SunPower Corporation
Watch Lady Michele Valdez’s Customer Talk on GRC TV
https://w w w .m etricstream .com /grctv/xxxBEFORE
• Redundant and inefficient processes leading to a m ajor drain of tim e and resources
• Poor visib ility across the enterprise
• Increased inherent risk, m ore points of failure and m ore com pliance gaps leading to unacceptable risks
• Lack of ag ility • Lack of alignm ent betw een com pliance in itiatives to business
objectives
GRC Journey Story: Sunpower Energy
AFTER• Savings of approxim ately $150,000 hum an capital
due to cost reduction based on efficiencies• 90% reduction in tim e spent on m anaging
com pliance activities through creation of m onthly calendar to determ ine upcom ing com pliance activities
• 65% reduction in tim e spent on m anual production of com pliance presentation report:
American energy company that designs and manufactures crystalline silicon photovoltaic cells and solar panels
MetricStream Apps: Compliance Management• Increased visibility through a centralized repository for all investor compliance requirements• Increased preparedness through the alignment of all internal compliance stakeholders• Increased preparedness by providing management visibility into compliance requirements and status• Increased speed and efficiency through automated compliance reporting• Improved visibility through complete traceability of all compliance related activities• Provides assurance through the centralized real-time monitoring that provides an overall view for the
management through configurable dashboards and reports• Increased agility through the flexibility to integrate new compliance requirements
© 2018 GRC Summit All Rights Reserved.
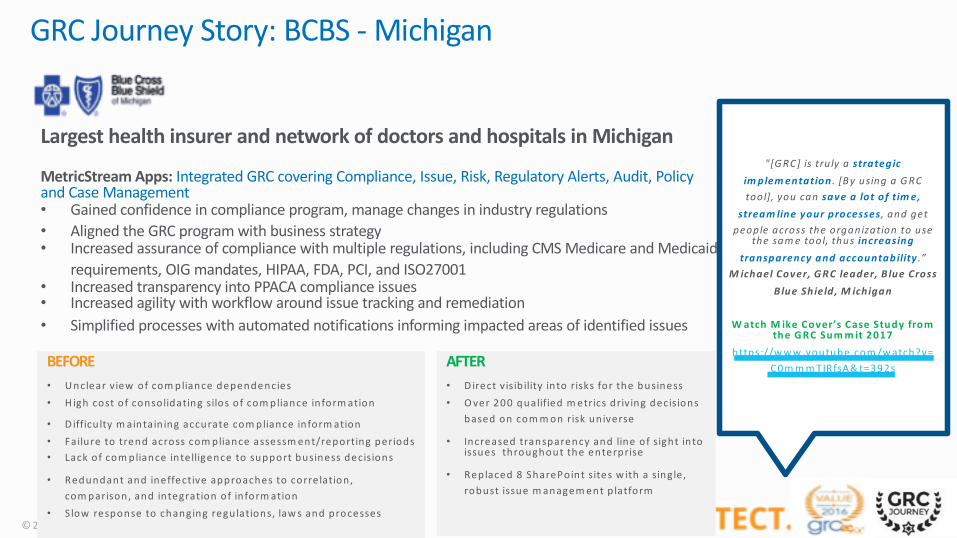
"[G RC] is tru ly a strategic im plem entation . [B y using a G RC tool], you can save a lot of tim e,
stream line your processes , and get people across the organization to use
the sam e tool, thus increasing transparency and accountability .”
M ichael Cover, G RC leader, B lue Cross B lue Shield, M ichigan
W atch M ike Cover’s Case Study from the G RC Sum m it 2017
https://w w w .youtube.com /w atch?v=C0m m m TIRfsA& t=392sBEFORE
• U nclear view of com pliance dependencies• H igh cost of consolidating silos of com pliance inform ation
• D ifficu lty m aintain ing accurate com pliance inform ation• Failure to trend across com pliance assessm ent/reporting periods • Lack of com pliance inte lligence to support business decisions
• Redundant and ineffective approaches to corre lation, com parison, and integration of in form ation
• Slow response to changing regulations, law s and processes
GRC Journey Story: BCBS - Michigan
Largest health insurer and network of doctors and hospitals in Michigan
MetricStream Apps: Integrated GRC covering Compliance, Issue, Risk, Regulatory Alerts, Audit, Policy and Case Management• Gained confidence in compliance program, manage changes in industry regulations• Aligned the GRC program with business strategy• Increased assurance of compliance with multiple regulations, including CMS Medicare and Medicaid
requirements, OIG mandates, HIPAA, FDA, PCI, and ISO27001• Increased transparency into PPACA compliance issues• Increased agility with workflow around issue tracking and remediation• Simplified processes with automated notifications informing impacted areas of identified issues
AFTER• D irect visib ility into risks for the business • O ver 200 qualified m etrics driving decisions
based on com m on risk universe
• Increased transparency and line of sight into issues throughout the enterprise
• Replaced 8 SharePoint sites w ith a single , robust issue m anagem ent p latform
Understanding Business Value
© 2018 GRC Summit All Rights Reserved.
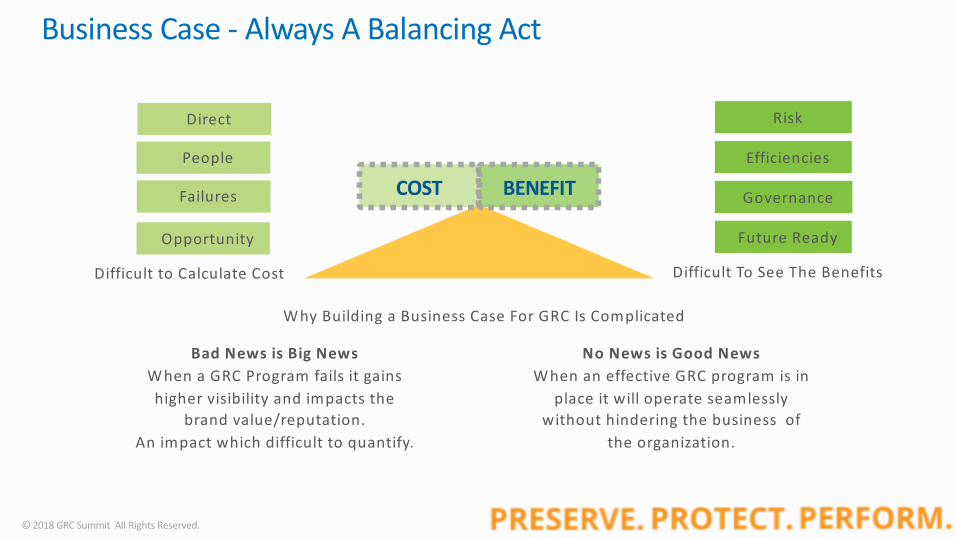
Business Case - Always A Balancing Act
COST BENEFIT
Why Building a Business Case For GRC Is Complicated
No News is Good NewsWhen an effective GRC program is in
place it will operate seamlessly without hindering the business of
the organization.
Bad News is Big NewsWhen a GRC Program fails it gains higher visibility and impacts the
brand value/reputation. An impact which difficult to quantify.
Difficult To See The BenefitsDifficult to Calculate Cost
Efficiencies
Risk
Future Ready
Governance
People
Direct
Opportunity
Failures
© 2018 GRC Summit All Rights Reserved.
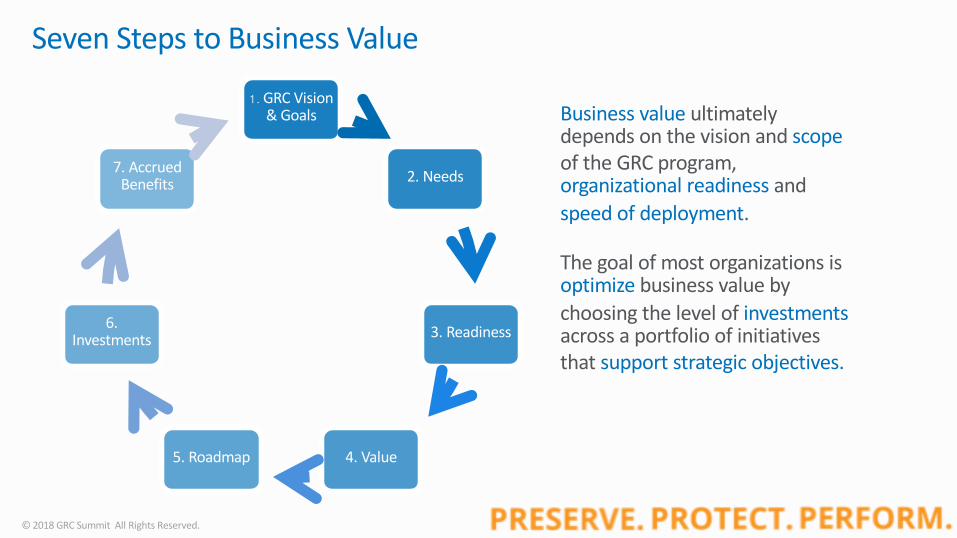
Seven Steps to Business Value1 . GRC Vision
& Goals
2. Needs
3. Readiness
4. Value5. Roadmap
6. Investments
7. Accrued Benefits
Business value ultimately depends on the vision and scopeof the GRC program, organizational readiness and speed of deployment.
The goal of most organizations is optimize business value by choosing the level of investments across a portfolio of initiatives that support strategic objectives.
© 2018 GRC Summit All Rights Reserved.
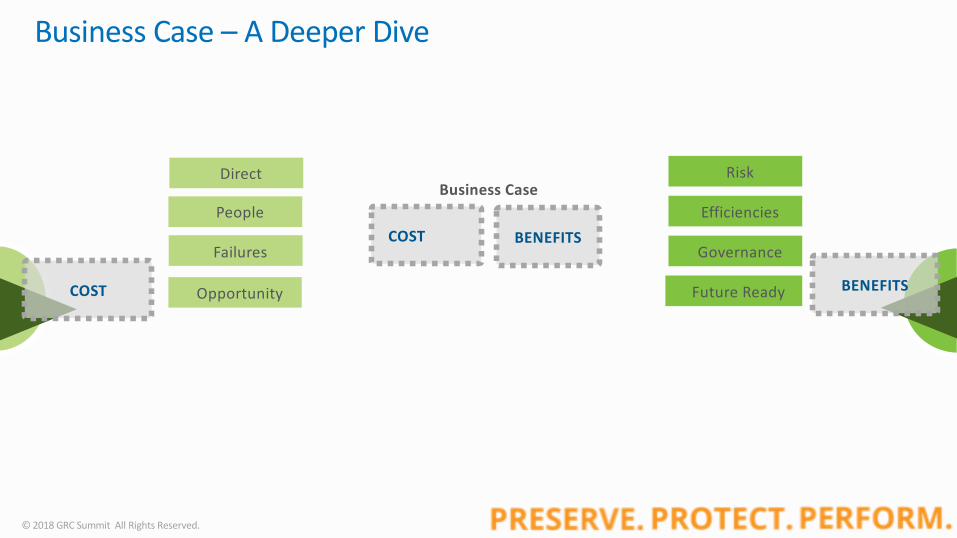
Business Case – A Deeper Dive
Business CaseEfficiencies
Risk
Future Ready
Governance
People
Direct
Opportunity
Failures
BENEFITSCOST
COST BENEFITS
© 2018 GRC Summit All Rights Reserved.
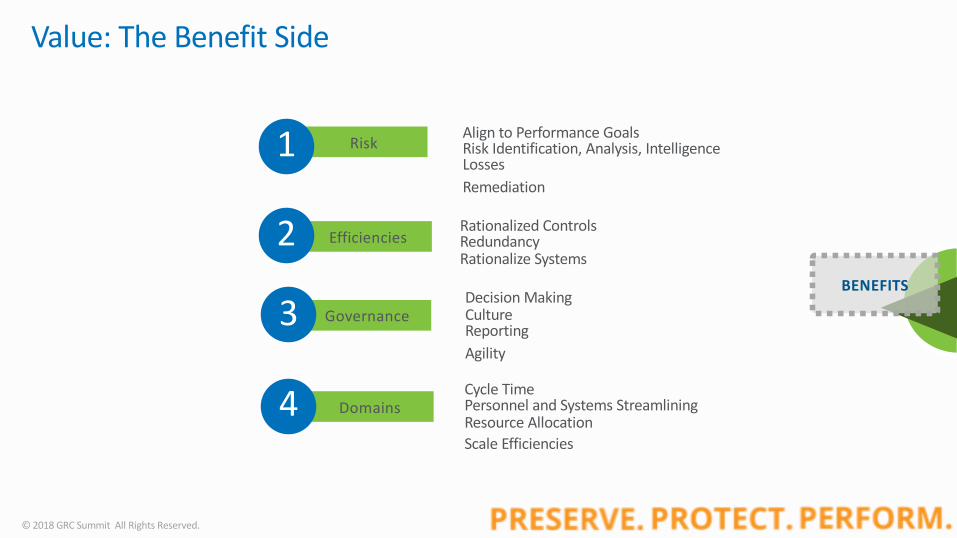
Value: The Benefit Side
Efficiencies
Risk
Domains
Governance
Align to Performance GoalsRisk Identification, Analysis, IntelligenceLossesRemediation
Rationalized Controls RedundancyRationalize Systems
Decision MakingCultureReporting Agility
Cycle TimePersonnel and Systems StreamliningResource AllocationScale Efficiencies
24
1
2
3
4
BENEFITS
© 2018 GRC Summit All Rights Reserved.
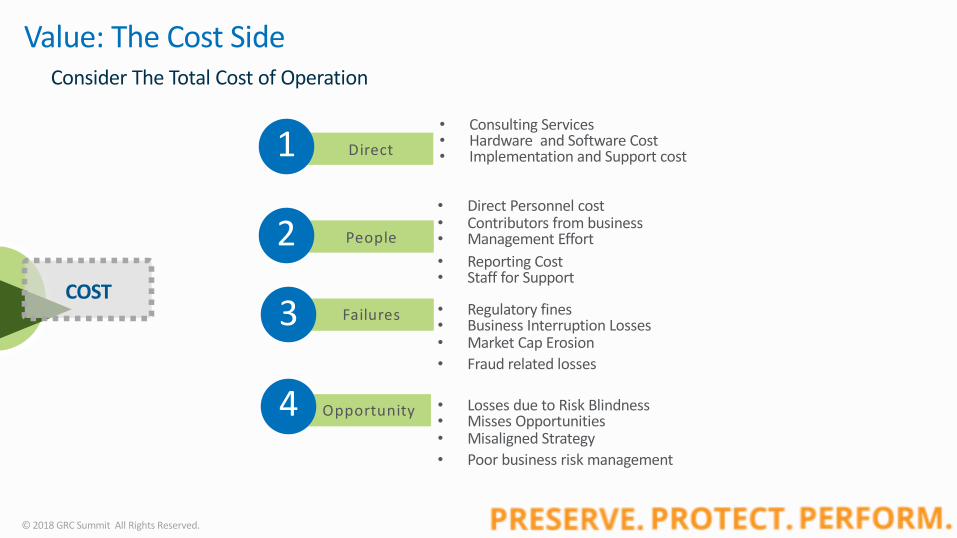
Value: The Cost Side
People
Direct
Opportunity
Failures
• Consulting Services• Hardware and Software Cost• Implementation and Support cost
• Direct Personnel cost• Contributors from business• Management Effort• Reporting Cost• Staff for Support
• Regulatory fines• Business Interruption Losses• Market Cap Erosion• Fraud related losses
• Losses due to Risk Blindness• Misses Opportunities• Misaligned Strategy• Poor business risk management
25
Consider The Total Cost of Operation
1
2
3
4
COST
© 2018 GRC Summit All Rights Reserved.
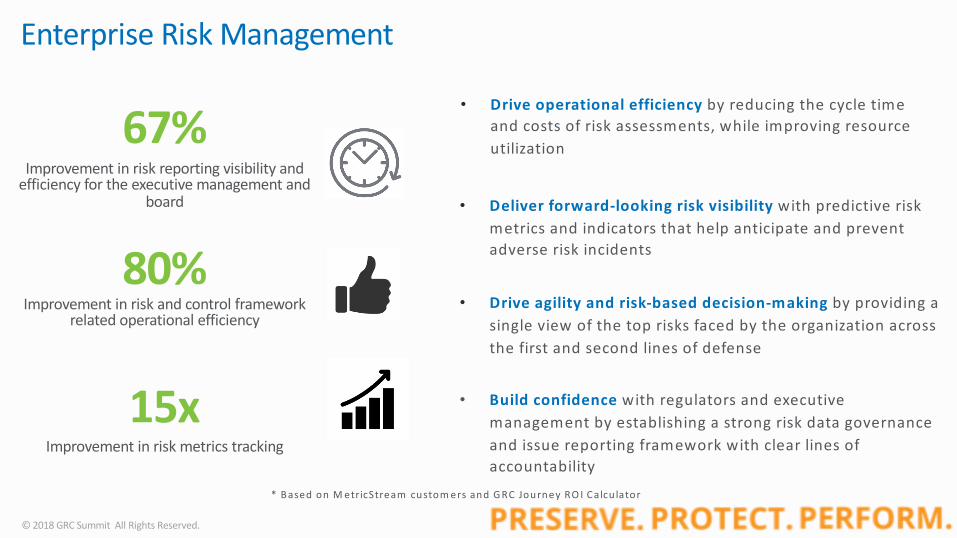
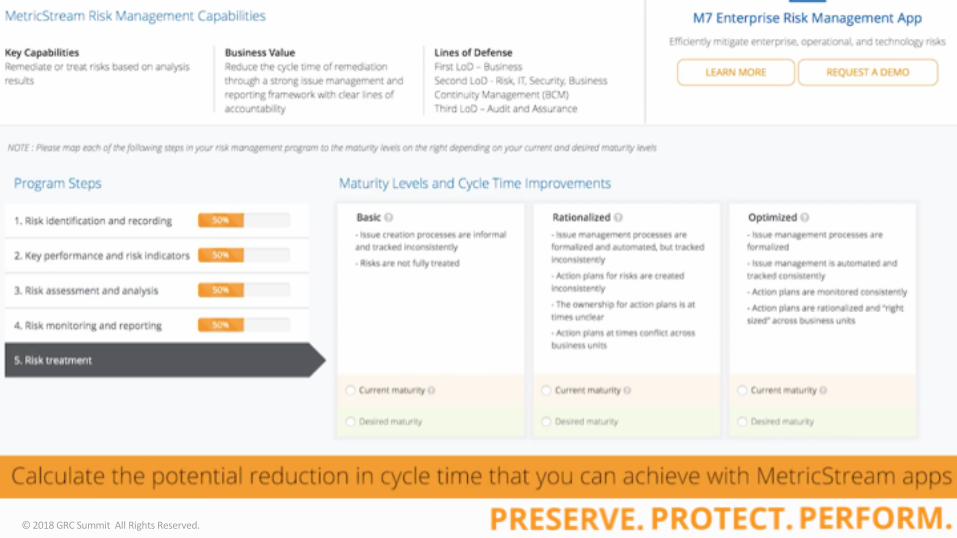
Enterprise Risk Management
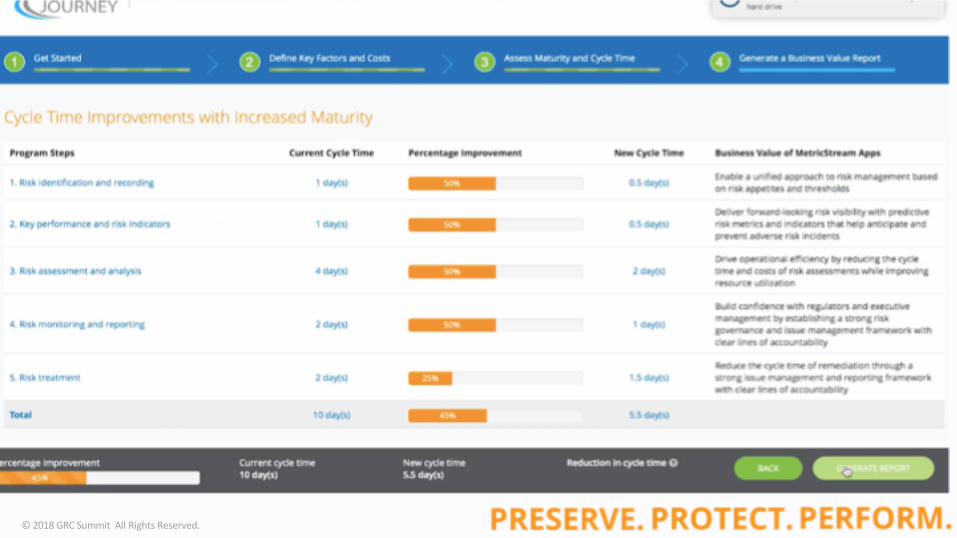
• Drive operational efficiency by reducing the cycle time and costs of risk assessments, while improving resource utilization
• Deliver forward-looking risk visibility with predictive risk metrics and indicators that help anticipate and prevent adverse risk incidents
• Drive agility and risk-based decision-making by providing a single view of the top risks faced by the organization across the first and second lines of defense
• Build confidence with regulators and executive management by establishing a strong risk data governance and issue reporting framework with clear lines of accountability
Improvement in risk and control framework related operational efficiency
80%
15x
Improvement in risk reporting visibility and efficiency for the executive management and
board
67%
Improvement in risk metrics tracking
* B ased on M etricStream custom ers and G RC Journey RO I Calcu lator
© 2018 GRC Summit All Rights Reserved.
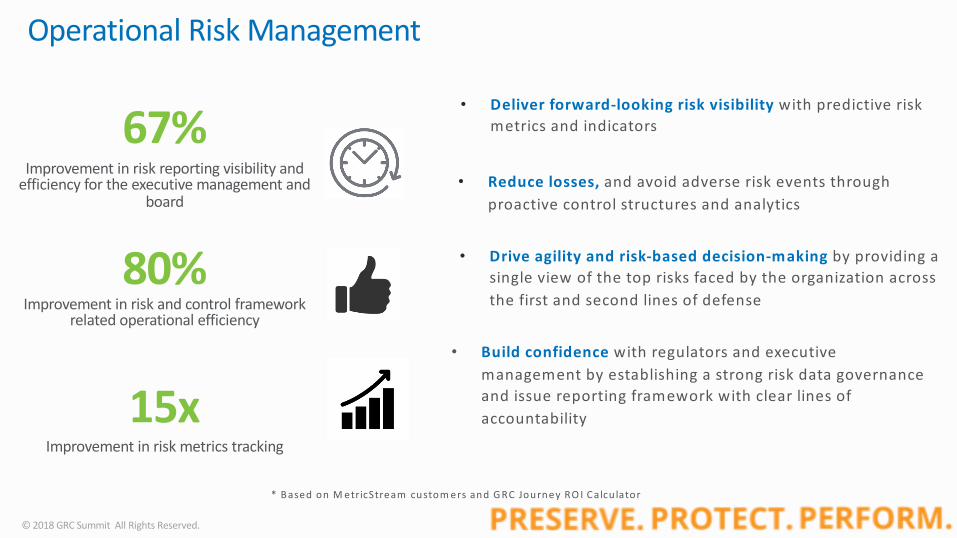
Operational Risk Management
• Deliver forward-looking risk visibility with predictive risk metrics and indicators
• Drive agility and risk-based decision-making by providing a single view of the top risks faced by the organization across the first and second lines of defense
• Build confidence with regulators and executive management by establishing a strong risk data governance and issue reporting framework with clear lines of accountability
Improvement in risk and control framework related operational efficiency
80%
15x
Improvement in risk reporting visibility and efficiency for the executive management and
board
67%
Improvement in risk metrics tracking
• Reduce losses, and avoid adverse risk events through proactive control structures and analytics
* B ased on M etricStream custom ers and G RC Journey RO I Calcu lator
© 2018 GRC Summit All Rights Reserved.
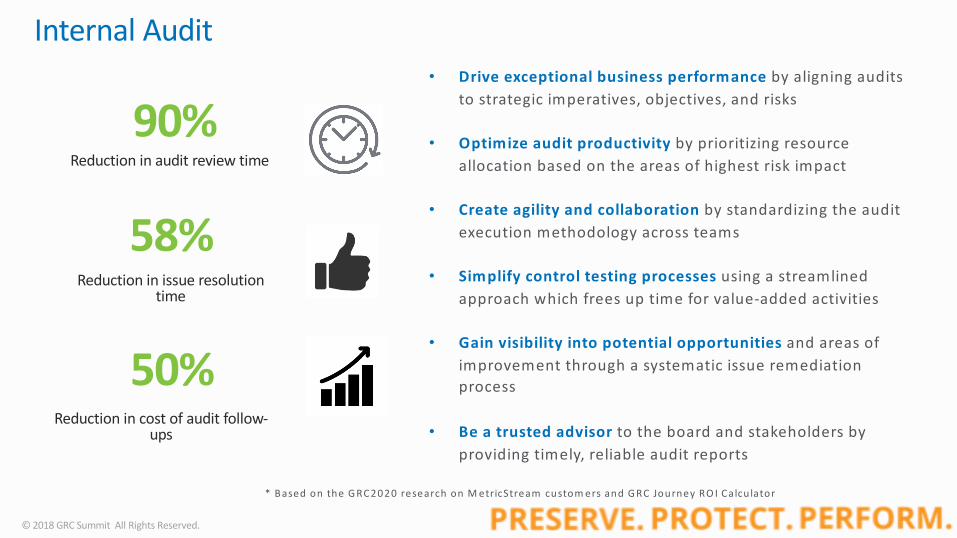
Internal Audit
Reduction in audit review time
90%
Reduction in issue resolution time
58%
• Drive exceptional business performance by aligning audits
to strategic imperatives, objectives, and risks
• Optimize audit productivity by prioritizing resource
allocation based on the areas of highest risk impact
• Create agility and collaboration by standardizing the audit
execution methodology across teams
• Simplify control testing processes using a streamlined
approach which frees up time for value-added activities
• Gain visibility into potential opportunities and areas of
improvement through a systematic issue remediation
process
• Be a trusted advisor to the board and stakeholders by
providing timely, reliable audit reports
Reduction in cost of audit follow-ups
50%
* B ased on the G RC2020 research on M etricStream custom ers and G RC Journey RO I Calcu lator
© 2018 GRC Summit All Rights Reserved.
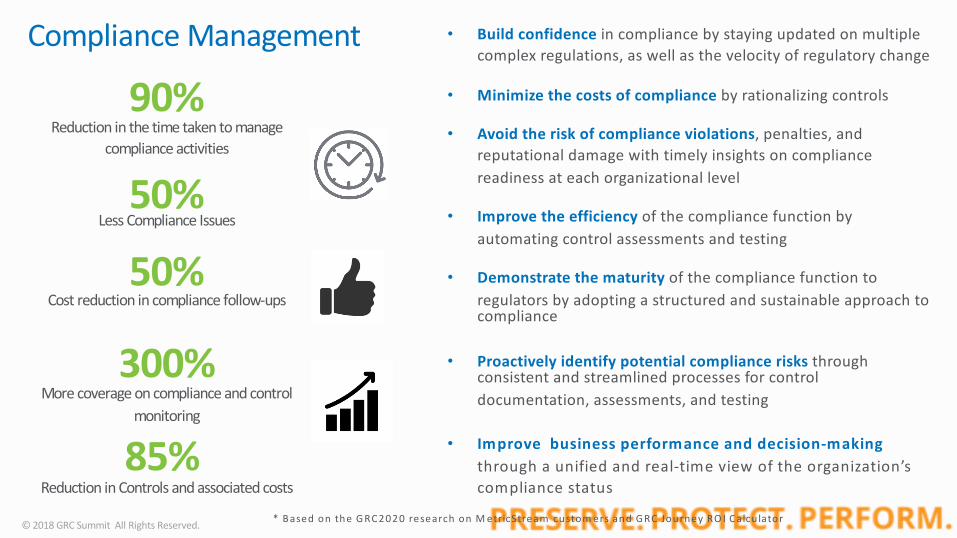
• Build confidence in compliance by staying updated on multiple complex regulations, as well as the velocity of regulatory change
• Minimize the costs of compliance by rationalizing controls
• Avoid the risk of compliance violations, penalties, and reputational damage with timely insights on compliance readiness at each organizational level
• Improve the efficiency of the compliance function by automating control assessments and testing
• Demonstrate the maturity of the compliance function to regulators by adopting a structured and sustainable approach to compliance
• Proactively identify potential compliance risks through consistent and streamlined processes for control documentation, assessments, and testing
• Improve business performance and decision-making through a unified and real-time view of the organization’s compliance status
Reduction in the time taken to manage compliance activities
90%
Less Compliance Issues50%
50%Cost reduction in compliance follow-ups
Compliance Management
300% More coverage on compliance and control
monitoring
85% Reduction in Controls and associated costs
* B ased on the G RC2020 research on M etricStream custom ers and G RC Journey RO I Calcu lator
© 2018 GRC Summit All Rights Reserved.
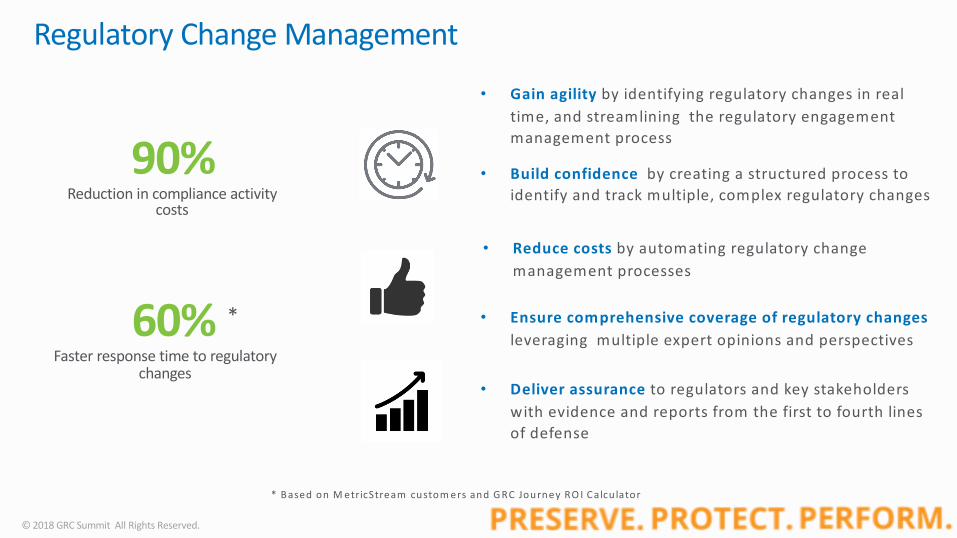
Regulatory Change Management
• Gain agility by identifying regulatory changes in real time, and streamlining the regulatory engagement management process
• Build confidence by creating a structured process to identify and track multiple, complex regulatory changes
• Deliver assurance to regulators and key stakeholders with evidence and reports from the first to fourth lines of defense
• Ensure comprehensive coverage of regulatory changes leveraging multiple expert opinions and perspectives
• Reduce costs by automating regulatory change management processes
Reduction in compliance activity costs
90%
Faster response time to regulatory changes
60% *
* B ased on M etricStream custom ers and G RC Journey RO I Calcu lator
© 2018 GRC Summit All Rights Reserved.
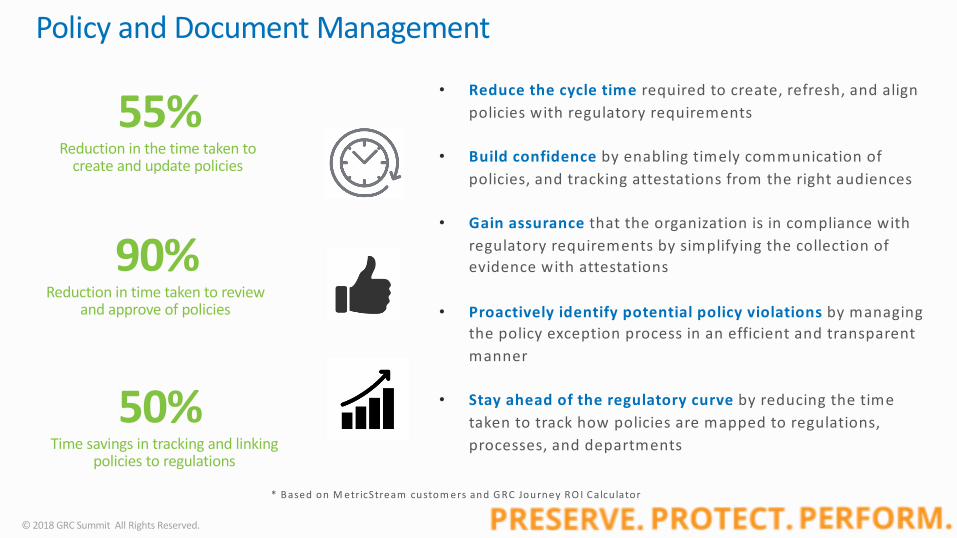
Policy and Document Management
• Reduce the cycle time required to create, refresh, and align policies with regulatory requirements
• Build confidence by enabling timely communication of policies, and tracking attestations from the right audiences
• Gain assurance that the organization is in compliance with regulatory requirements by simplifying the collection of evidence with attestations
• Proactively identify potential policy violations by managing the policy exception process in an efficient and transparent manner
• Stay ahead of the regulatory curve by reducing the time taken to track how policies are mapped to regulations, processes, and departments
Reduction in the time taken to create and update policies
55%
Time savings in tracking and linking policies to regulations
50%* B ased on M etricStream custom ers and G RC Journey RO I Calcu lator
Reduction in time taken to review and approve of policies
90%
© 2018 GRC Summit All Rights Reserved.
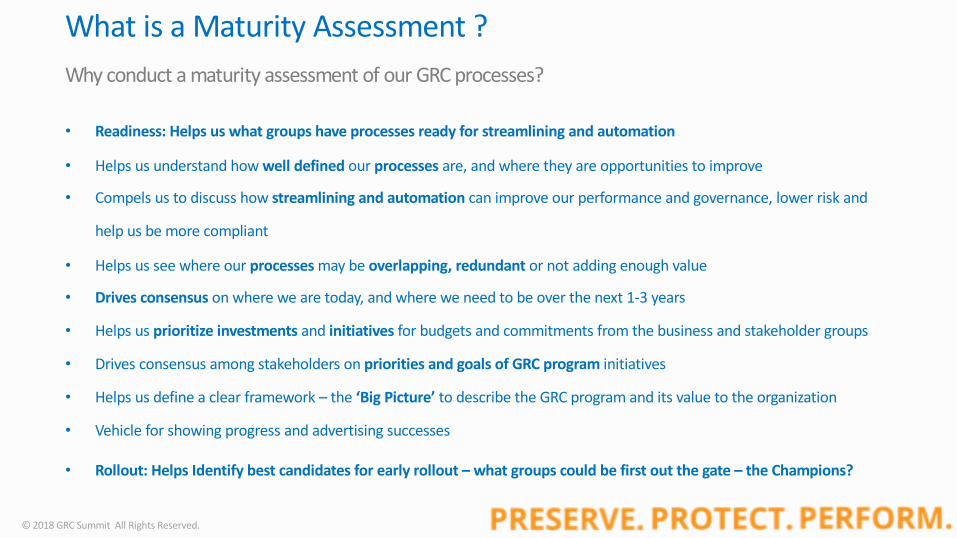
What is a Maturity Assessment ?Why conduct a maturity assessment of our GRC processes?
• Readiness: Helps us what groups have processes ready for streamlining and automation
• Helps us understand how well defined our processes are, and where they are opportunities to improve
• Compels us to discuss how streamlining and automation can improve our performance and governance, lower risk and
help us be more compliant
• Helps us see where our processes may be overlapping, redundant or not adding enough value
• Drives consensus on where we are today, and where we need to be over the next 1-3 years
• Helps us prioritize investments and initiatives for budgets and commitments from the business and stakeholder groups
• Drives consensus among stakeholders on priorities and goals of GRC program initiatives
• Helps us define a clear framework – the ‘Big Picture’ to describe the GRC program and its value to the organization
• Vehicle for showing progress and advertising successes
• Rollout: Helps Identify best candidates for early rollout – what groups could be first out the gate – the Champions?
© 2018 GRC Summit All Rights Reserved.
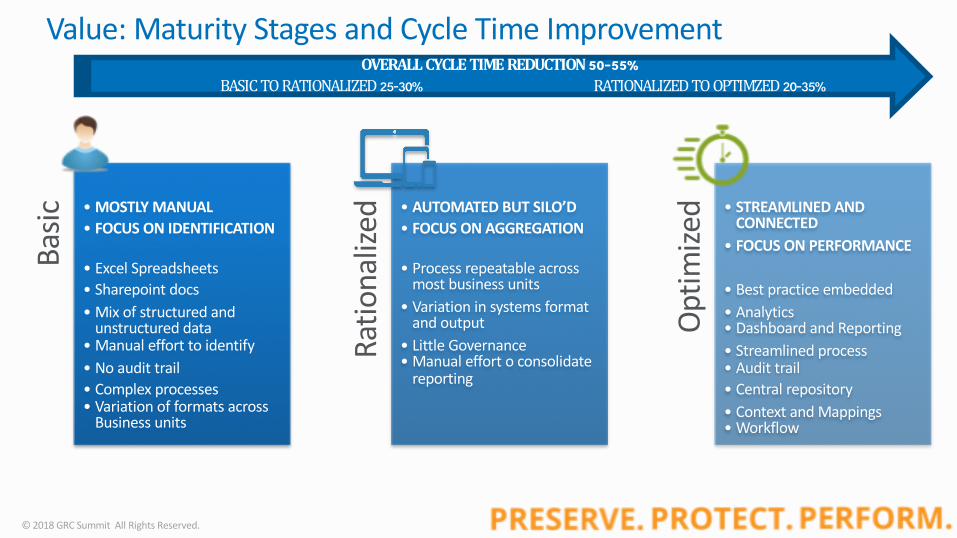
Basi
c • MOSTLY MANUAL• FOCUS ON IDENTIFICATION
• Excel Spreadsheets• Sharepoint docs• Mix of structured and
unstructured data• Manual effort to identify • No audit trail• Complex processes• Variation of formats across
Business units
Ratio
naliz
ed
• AUTOMATED BUT SILO’D• FOCUS ON AGGREGATION
• Process repeatable across most business units
• Variation in systems format and output
• Little Governance• Manual effort o consolidate
reporting
Opt
imiz
ed
• STREAMLINED AND CONNECTED
• FOCUS ON PERFORMANCE
• Best practice embedded• Analytics• Dashboard and Reporting• Streamlined process• Audit trail• Central repository• Context and Mappings• Workflow
Value: Maturity Stages and Cycle Time ImprovementOVERALLCYCLETIMEREDUCTION50-55%
BASICTORATIONALIZED25-30% RATIONALIZEDTOOPTIMZED20-35%
© 2018 GRC Summit All Rights Reserved.
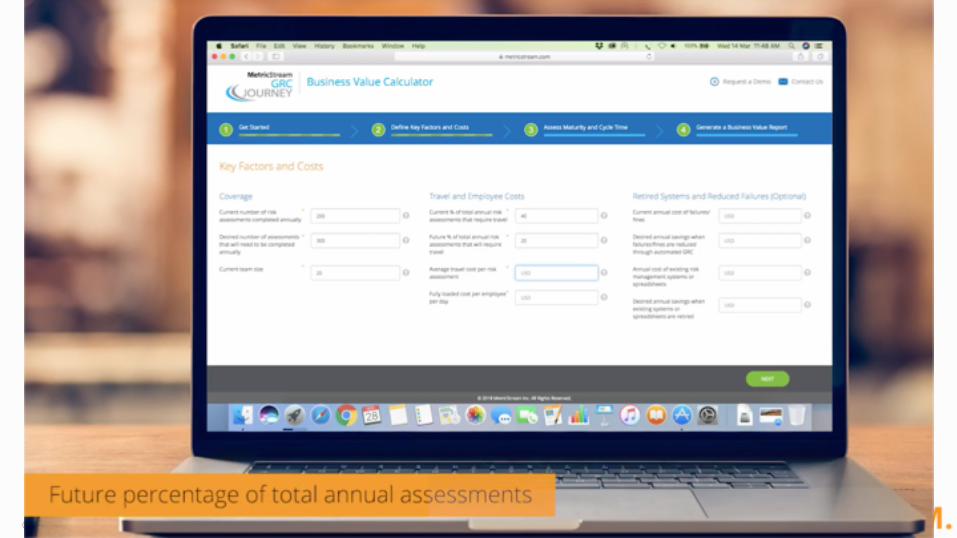
Exercise 1: Business Value Calculators for each initiative
© 2018 GRC Summit All Rights Reserved.
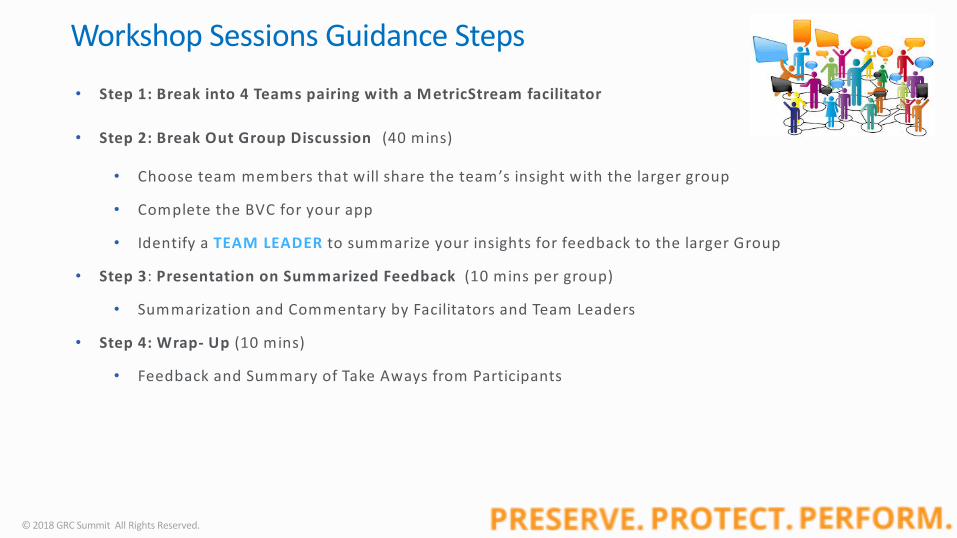
Workshop Sessions Guidance Steps• Step 1: Break into 4 Teams pairing with a MetricStream facilitator
• Step 2: Break Out Group Discussion (40 mins)
• Choose team members that will share the team’s insight with the larger group
• Complete the BVC for your app
• Identify a TEAM LEADER to summarize your insights for feedback to the larger Group
• Step 3: Presentation on Summarized Feedback (10 mins per group)
• Summarization and Commentary by Facilitators and Team Leaders
• Step 4: Wrap- Up (10 mins)
• Feedback and Summary of Take Aways from Participants
© 2018 GRC Summit All Rights Reserved.
© 2018 GRC Summit All Rights Reserved.
© 2018 GRC Summit All Rights Reserved.

Exercise 1: Feedback from Breakout Groups
© 2018 GRC Summit All Rights Reserved.
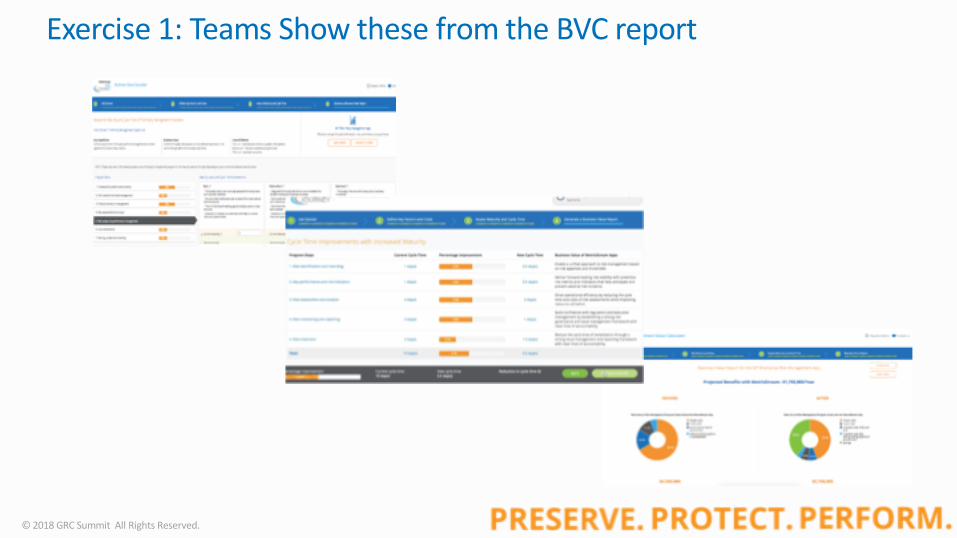
Exercise 1: Teams Show these from the BVC report
Exercise 1 Summary: Building the Multi-Year ROI
© 2018 GRC Summit All Rights Reserved.
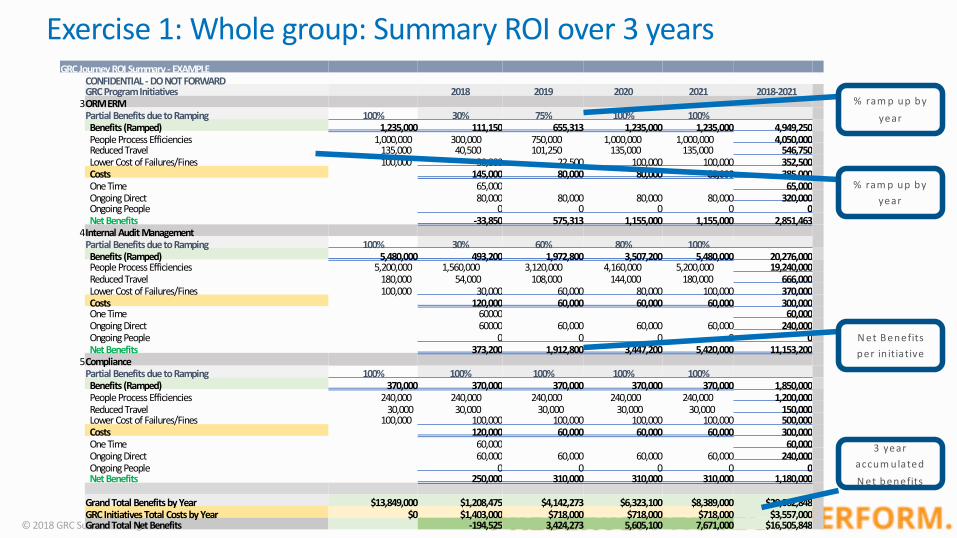
Exercise 1: Whole group: Summary ROI over 3 years
GRC Journey ROI Summary - EXAMPLECONFIDENTIAL - DO NOT FORWARDGRC Program Initiatives 2018 2019 2020 2021 2018-2021
3ORM ERMPartial Benefits due to Ramping 100% 30% 75% 100% 100%Benefits (Ramped) 1,235,000 111,150 655,313 1,235,000 1,235,000 4,949,250People Process Efficiencies 1,000,000 300,000 750,000 1,000,000 1,000,000 4,050,000Reduced Travel 135,000 40,500 101,250 135,000 135,000 546,750Lower Cost of Failures/Fines 100,000 30,000 22,500 100,000 100,000 352,500Costs 145,000 80,000 80,000 80,000 385,000One Time 65,000 65,000Ongoing Direct 80,000 80,000 80,000 80,000 320,000Ongoing People 0 0 0 0 0Net Benefits -33,850 575,313 1,155,000 1,155,000 2,851,463
4Internal Audit ManagementPartial Benefits due to Ramping 100% 30% 60% 80% 100%Benefits (Ramped) 5,480,000 493,200 1,972,800 3,507,200 5,480,000 20,276,000People Process Efficiencies 5,200,000 1,560,000 3,120,000 4,160,000 5,200,000 19,240,000Reduced Travel 180,000 54,000 108,000 144,000 180,000 666,000Lower Cost of Failures/Fines 100,000 30,000 60,000 80,000 100,000 370,000Costs 120,000 60,000 60,000 60,000 300,000One Time 60000 60,000Ongoing Direct 60000 60,000 60,000 60,000 240,000Ongoing People 0 0 0 0 0Net Benefits 373,200 1,912,800 3,447,200 5,420,000 11,153,200
5CompliancePartial Benefits due to Ramping 100% 100% 100% 100% 100%Benefits (Ramped) 370,000 370,000 370,000 370,000 370,000 1,850,000People Process Efficiencies 240,000 240,000 240,000 240,000 240,000 1,200,000Reduced Travel 30,000 30,000 30,000 30,000 30,000 150,000Lower Cost of Failures/Fines 100,000 100,000 100,000 100,000 100,000 500,000Costs 120,000 60,000 60,000 60,000 300,000One Time 60,000 60,000Ongoing Direct 60,000 60,000 60,000 60,000 240,000Ongoing People 0 0 0 0 0Net Benefits 250,000 310,000 310,000 310,000 1,180,000
Grand Total Benefits by Year $13,849,000 $1,208,475 $4,142,273 $6,323,100 $8,389,000 $20,062,848GRC Initiatives Total Costs by Year $0 $1,403,000 $718,000 $718,000 $718,000 $3,557,000Grand Total Net Benefits -194,525 3,424,273 5,605,100 7,671,000 $16,505,848
% ram p up by
year
% ram p up by
year
N et B enefits
per in itiative
3 year
accum ulated
N et benefits

Exercise 2: Final Presentation
© 2018 GRC Summit All Rights Reserved.
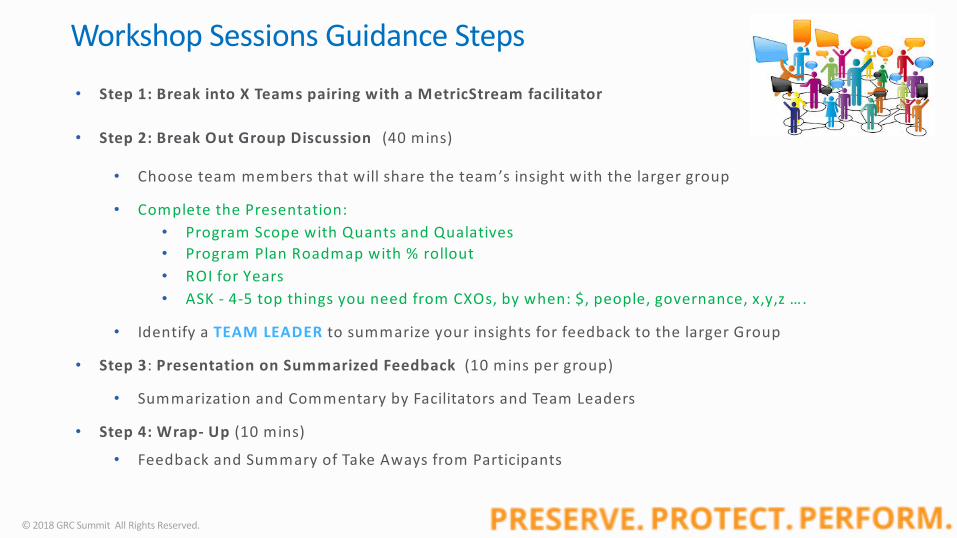
Workshop Sessions Guidance Steps
• Step 1: Break into X Teams pairing with a MetricStream facilitator
• Step 2: Break Out Group Discussion (40 mins)
• Choose team members that will share the team’s insight with the larger group
• Complete the Presentation:
• Program Scope with Quants and Qualatives
• Program Plan Roadmap with % rollout
• ROI for Years
• ASK - 4-5 top things you need from CXOs, by when: $, people, governance, x,y,z ….
• Identify a TEAM LEADER to summarize your insights for feedback to the larger Group
• Step 3: Presentation on Summarized Feedback (10 mins per group)
• Summarization and Commentary by Facilitators and Team Leaders
• Step 4: Wrap- Up (10 mins)
• Feedback and Summary of Take Aways from Participants
© 2018 GRC Summit All Rights Reserved.
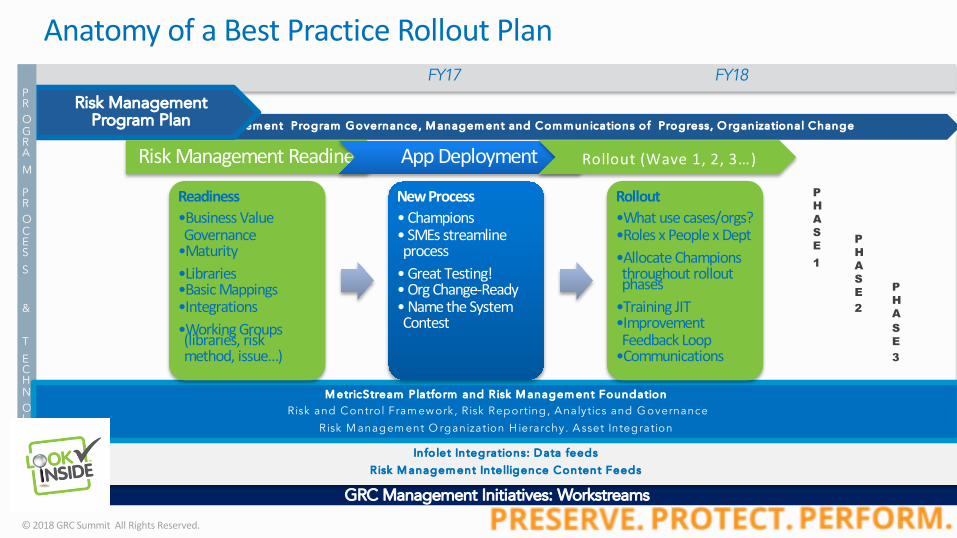
FY17 FY18
PM O – R isk M anagem ent Program G overnance, M anagem ent and Com m unications o f P rogress, O rgan izational Change
Risk Management Program Plan
GRC Management Initiatives: Workstreams
Info let In tegrations: D ata feeds
R isk M anagem ent In te lligence Content Feeds
PROGRA
M
PROCES
S
&
T
ECHNOLOG
Y
M etricStream P latfo rm and R isk M anagem ent FoundationRisk and Contro l Fram ew ork, R isk Reporting , Analytics and G overnance
Risk M anagem ent O rganization H ierarchy. A sset Integration
Risk Management Readiness App Deployment Rollout (Wave 1, 2, 3…)
PHASE1
PHASE2
PHASE3
Anatomy of a Best Practice Rollout Plan
Readiness•Business Value Governance
•Maturity•Libraries•Basic Mappings•Integrations•Working Groups (libraries, risk method, issue…)
New Process• Champions• SMEs streamline process
• Great Testing!• Org Change-Ready• Name the System Contest
Rollout•What use cases/orgs?•Roles x People x Dept•Allocate Champions throughout rollout phases
•Training JIT•Improvement Feedback Loop
•Communications
© 2018 GRC Summit All Rights Reserved.
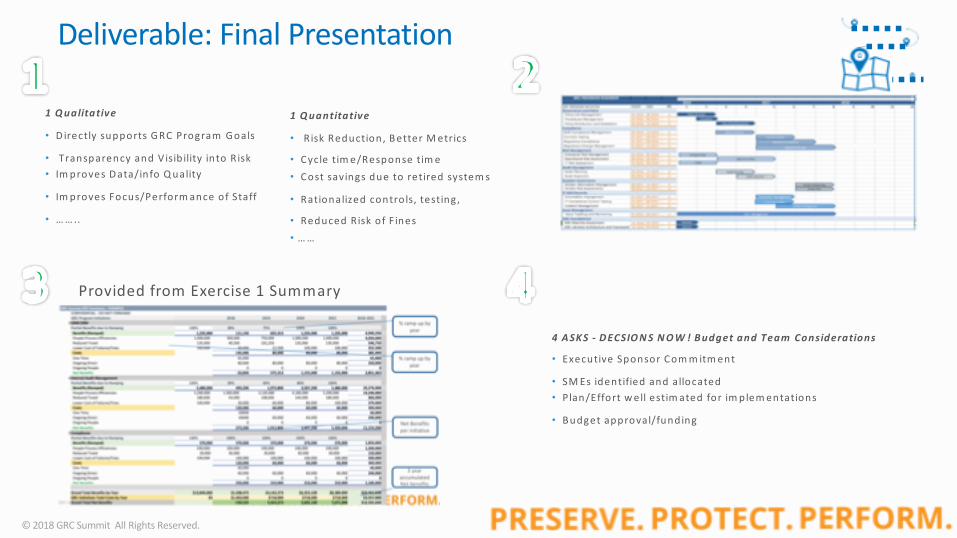
Deliverable: Final Presentation
4 A SKS - D ECSIO N S N O W ! B udget and Team Considerations
• Executive Sponsor Com m itm ent
• SM Es identified and allocated
• Plan/Effort w ell estim ated for im plem entations
• B udget approval/funding
1 Q ualitative
• D irectly supports G RC Program G oals
• Transparency and V isib ility into R isk
• Im proves D ata/info Q uality
• Im proves Focus/Perform ance of Staff
• … … ..
1 Q uantitative
• Risk Reduction, B etter M etrics
• Cycle tim e/Response tim e
• Cost savings due to retired system s
• Rationalized contro ls, testing,
• Reduced Risk of F ines
• … …
Provided from Exercise 1 Summary
Exercise 2: Feedback from Breakout Groups
Summary and Learnings From Breakout Groups
Thank YouContinue the conversation on #GRCSummit