grating coupling of surface plasmon ...newton.ex.ac.uk/research/emag/pubs/aph_thesis.pdfdemonstrates...
TRANSCRIPT

GRATING COUPLING OF SURFACE PLASMON
POLARITONS AT VISIBLE AND MICROWAVE
FREQUENCIES
Submitted by
ALASTAIR PAUL HIBBINS
To the University of Exeter
as a thesis for the degree of
Doctor of Philosophy in Physics
NOVEMBER 1999
This thesis is available for library use on the understanding that it is
copyright material and that no quotation from this thesis may be
published without proper acknowledgement.
I certify that all material in this thesis which is not my own work has been identified
and that no material is included for which a degree has previously been conferred
upon me.
__________________________________________

ABSTRACT
2
ABSTRACT
The work presented here concerns the electromagnetic response of diffraction
gratings, and the rôle they play in the excitation of surface plasmon polaritons (SPPs)
at the interface between a metal and a dielectric. The underlying aim of this thesis is
to build on the current understanding of the excitation of SPPs in the visible regime,
and extend and develop these ideas to microwave wavelengths.
The position and shape of the resonance of the SPP is extremely sensitive to both the
interface profile and the properties of the surrounding media and hence, by using a
suitable grating modelling theory, this dependence can be utilised to parameterise the
profile and optical properties of the media. Indeed, the first two experimental
chapters of this thesis present the first characterisations of the dielectric function of
titanium nitride, and non-oxidised indium using such a grating-coupled SPP
technique.
Experimental reflectivities measured at visible frequencies are normally recorded as a
function of the angle measured from the normal to the average plane of the grating
surface, however this data becomes cumbersome to record at microwave wavelengths.
Hence, a new technique is developed which requires no moving detector and records
the reflectivities as a function of the angle between the plane of incidence and the
normal to the grating grooves. These reflectivities are initially recorded from a silver-
coated grating at visible wavelengths, but are also recorded from non-lossy metallic
gratings in the microwave regime. A large amount of beam spread is inherent in
microwave experiments, and therefore the apparatus is further developed to collimate
the incident beam. Finally, two samples are considered where a dielectric grating is
deposited onto a planar metal substrate. The data recorded from the first sample
demonstrates that it is possible to couple microwave radiation to SPPs that propagate
along the planar metal-dielectric interface. Furthermore, it demonstrates that if the
dielectric is lossy, the absorption on resonance of the modes is greatly enhanced. The
second study illustrates the novel result that with near-grazing incident radiation and
with the dielectric-grating grooves orientated such that they are parallel to the plane of
incidence, coupling is possible to SPPs at three different energies.

3
"He who asks a question is a fool for five minutes; he who
does not ask a question remains a fool forever."
Chinese Proverb

TABLE OF CONTENTS
4
TABLE OF CONTENTS
ABSTRACT __________________________________________________________ 2
TABLE OF CONTENTS _______________________________________________ 4
LIST OF FIGURES AND TABLES _______________________________________ 8
ABBREVIATIONS ___________________________________________________ 22
ACKNOWLEDGEMENTS _____________________________________________ 23
CHAPTER 1:
Introduction _________________________________________________________ 25
CHAPTER 2:
A review of the properties of radiatively coupled surface plasmon polaritons.
2.1. Introduction_________________________________________________________ 28
2.2. Historical Overview __________________________________________________ 28
2.3. Surface Plasmon Polaritons at the Interface of Semi-infinite Media___________ 33
2.3.1. The Dispersion Relation ___________________________________________________ 33
2.3.2. Brewster and Fano Modes __________________________________________________ 37
2.3.3. Spatial Extent of the Surface-plasmon Fields ___________________________________ 41
2.4. Excitation of Surface Plasmons _________________________________________ 44
2.4.1. Prism Coupling __________________________________________________________ 45
2.4.2. Grating Coupling _________________________________________________________ 47
2.5. Polarisation Conversion _______________________________________________ 51
2.6. Photonic Energy Gaps in the Propagation of SPPs on Gratings ______________ 52
2.6.1. False Momentum Gaps ____________________________________________________ 55
2.6.2. Coupling to the high and low energy branches__________________________________ 55
2.7. Summary ___________________________________________________________ 58
CHAPTER 3:
The influence of the interface profile and properties of the surrounding media on the
reflectivity from a grating sample.
3.1. Introduction_________________________________________________________ 59
TABLE OF CONTENTS
5
3.2. Grating modelling theories_____________________________________________ 60
3.3. The Differential Formalism of Chandezon et al.____________________________ 63
3.4. Representation of the surface profile ____________________________________ 64
3.5. The reflectivity features and the Littrow angle ____________________________ 68
3.6. The profile of the grating ______________________________________________ 72
3.6.1. Variation of ,1a the fundamental amplitude ___________________________________ 73
3.6.2. Variation of ,2a the first harmonic __________________________________________ 75
3.6.3. Variation of ,3a the second harmonic ________________________________________ 77
3.7. The permittivity of the grating substrate _________________________________ 79
3.8. The use of overlayers _________________________________________________ 84
3.9. Summary ___________________________________________________________ 87
CHAPTER 4:
Surface plasmon polariton study of the optical dielectric function of titanium nitride.
4.1. Introduction_________________________________________________________ 88
4.2. TiNx properties and applications________________________________________ 89
4.3. Previous measurements of ( )ωε of TiNx._________________________________ 89
4.4. Experimental ________________________________________________________ 91
4.4.1. Sample preparation _______________________________________________________ 91
4.4.2. Reflectivity Measurements _________________________________________________ 93
4.4.3. Using the grating modelling theory___________________________________________ 96
4.5. Results _____________________________________________________________ 97
4.6. Discussion _________________________________________________________ 100
4.6.1. The free-electron behaviour of TiN, and its interband transitions __________________ 101
4.6.2. The Drude-Lorentz model _________________________________________________ 103
4.7. Summary __________________________________________________________ 106
CHAPTER 5:
The plasmon study of the optical dielectric function of indium
5.1. Introduction________________________________________________________ 107
5.2. Background ________________________________________________________ 107
TABLE OF CONTENTS
6
5.3. Experimental _______________________________________________________ 109
5.4. Results ____________________________________________________________ 112
5.5. Discussion _________________________________________________________ 113
5.6. Summary __________________________________________________________ 118
CHAPTER 6:
Azimuthal dependent reflectivity data from metallic gratings
6.1. Introduction________________________________________________________ 119
6.2. Experimental _______________________________________________________ 120
6.2.1. Experimental Geometry___________________________________________________ 120
6.2.2. Experimental Procedure___________________________________________________ 121
6.3. Results ____________________________________________________________ 125
6.4. Summary __________________________________________________________ 128
CHAPTER 7:
An experimental study of grating-coupled surface plasmon polaritons at microwave
frequencies.
7.1. Introduction________________________________________________________ 129
7.2. Background ________________________________________________________ 131
7.3. Experimental _______________________________________________________ 133
7.4. Results ____________________________________________________________ 139
7.4.1. Sample #1 (mono-grating)_________________________________________________ 139
7.4.2. Sample #2 (bi-grating) ____________________________________________________ 141
7.5. Discussion _________________________________________________________ 143
7.5.1. Sample #1 (mono-grating)_________________________________________________ 143
7.5.2. Sample #2 (bi-grating) ____________________________________________________ 148
7.6. Summary __________________________________________________________ 150
CHAPTER 8:
The coupling of microwave radiation to surface plasmon polaritons and guided
modes via dielectric gratings.
8.1. Introduction________________________________________________________ 151
8.2. Background ________________________________________________________ 151
TABLE OF CONTENTS
7
8.3. Experimental _______________________________________________________ 158
8.4. Results ____________________________________________________________ 160
8.5. Discussion _________________________________________________________ 168
8.6. Summary __________________________________________________________ 170
CHAPTER 9:
The coupling of near-grazing microwave photons to surface plasmon polaritons via a
dielectric grating.
9.1. Introduction________________________________________________________ 172
9.2. Background ________________________________________________________ 172
9.3. Experimental _______________________________________________________ 175
9.4. Results ____________________________________________________________ 177
9.5. Discussion _________________________________________________________ 181
9.6. Summary __________________________________________________________ 187
CHAPTER 10:
Conclusions
10.1. Summary of Thesis ________________________________________________ 188
10.2. Future Work _____________________________________________________ 190
10.3. List of Publications________________________________________________ 194
REFERENCES _____________________________________________________ 196

LIST OF FIGURES AND TABLES
8
LIST OF FIGURES AND TABLES
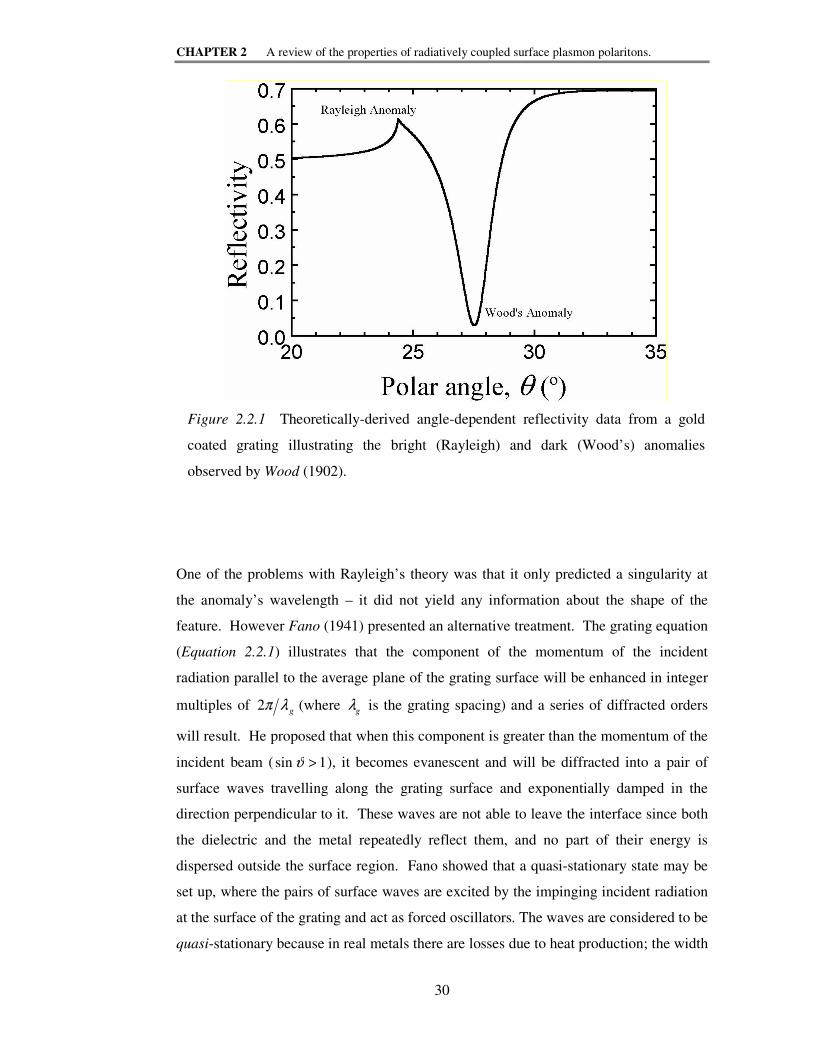
Figure 2.2.1 Theoretically-derived angle-dependent reflectivity data from a gold
coated grating illustrating the bright (Rayleigh) and dark (Wood’s) anomalies
observed by Wood (1902). __________________________________________ 30
Figure 2.3.1. The coordinate system used to describe the planar interface system,
where the z-direction is into the page. The situation shown is when p-polarised
radiation is incident. _______________________________________________ 34
Figure 2.3.2 The dispersion curve for a non-lossy planar metal-dielectric interface
The radiative (Brewster) and non-radiaive (Fano) branches are depicted along
with their asymptotic limits. Coupling is only possible to modes in the high-
frequency side of the light line, 1εω xck= (shaded). ___________________ 41
Figure 2.3.3. The charges and electromagnetic field of surface plasmons propagating
in the x-direction. The exponential dependence Ey away from the interface is
seen on the left. ___________________________________________________ 42
Figure 2.4.1 Two methods of prism-coupling radiation to SPPs; (a) Otto
configuration, and (b) Kretschmann-Raether configuration. ________________ 45
Figure 2.4.2 Dispersion of a SPP at a metal-dielectric interface (schematic). Lines
(a) and (b) illustrate the dispersion of plane waves in the spacer layer (S) and the
high index prism (P) respectively where sn is the refractive index of the
medium. Only photons (polaritons) with momenta that lie between lines (a) and
(b) may couple to SPPs. ____________________________________________ 47
Figure 2.4.3 The dispersion curve for grating coupled SPPs which has been reflected
at the Brillouin zone boundaries. Parts of the scattered dispersion curves that fall
between the light lines (shaded) can be radiatively coupled. A number of the
crossing points of the dispersion relations within the shaded area are labelled in
units of kg according to the coupling mechanisms involved. _______________ 48
Figure 2.4.4 Grating geometry and coordinate system used throughout this thesis. The
direction of the electric field vector (E) is illustrated for the situation when p-
polarised (TM) radiation is incident. __________________________________ 49
LIST OF FIGURES AND TABLES
9
Figure 2.4.5. A k-space representation of a grating with wavelength-to-pitch ratio,
68.010 =gn λλ . The circle with a thick-dashed radius represents the maximum
possible momentum in the plane available from a photon propagating above the
grating. The circle with the thick solid radius represents the momentum of the
zero-order SPP mode; the arcs of the diffracted SPP modes that fall within the
shaded are also shown (thin solid radii). Hence, coupling to SPPs is only
possible in the shaded area. The arrows indicate the coupling between a photon
at angle of incidence θ, to a SPP via a grating vector of 2kg at an azimuthal angle
of ϕ, where the mode propagates at an angle φ with respect to the grating
grooves._________________________________________________________ 50
Figure 2.6.1 Numerically modelled ppR response of a periodically modulating surface
with two Fourier components. The second grating component allows an energy
gap to open up at the intersection of the two dispersion relation branches (-1,1).
The parameters used in the modelling were λg = 634 nm , a1 5= nm ,
a2 2= nm , 021 =Φ=Φ , 5.172 −=′ε and .7.02 =′′ε ______________________ 53
Figure 2.6.2 The E-field and surface charge distribution for the two standing wave
solutions. The field lines in the lower sketch are more distorted hence this is the
higher energy mode. _______________________________________________ 54
Figure 2.6.3 Numerically modelled reflectivity plots showing the influence of the
phase component 2Φ between the fundamental and first harmonic. __________ 56
Figure 2.6.4 The kg (solid) and 2kg (dotted) components of a distorted sinusoidal
grating with relative phases 90 ,902 °+°−=Φ and °0 . ____________________ 57
Figure 3.4.1 The distortion arising from the introduction of a first harmonic, a2 (- - -)
compared to an undistorted sinusoid (——). The distortion caused by the addition
of a further harmonic, a3, is also shown (•••). The relative amplitudes of the
Fourier coefficients are 321 5.01.0 aaa == , with 2321π=Φ=Φ=Φ (using
Equation 3.4.2).___________________________________________________ 66
Figure 3.4.2 Illustration of the effect of changing the relative phases of the
fundamental and first harmonic with 12 2.0 aa = , 3a and higher harmonics set to
zero, 01 =Φ and (a) 02 =Φ (b) 22π=Φ (c) π=Φ 2 and (d)
2
32
π=Φ (using
Equation 3.4.2).___________________________________________________ 66

LIST OF FIGURES AND TABLES
10
Figure 3.4.3 (a): Fourier series representation using fourteen coefficients of the
profile shown in (b). _______________________________________________ 67
Figure 3.4.4 (a): Fourier representation using fourteen coefficients of a square wave
grating (b)._______________________________________________________ 68
Figure 3.5.1 (top) The k-space diagram for a grating with 575.00 =gkk . The white
arrow corresponds to a momenta scan 100
<<kk in the direction of
xk ( 0=ϕ ).
The theoretically modelled ppR response of the zeroth, minus 1, plus 2 and plus
3 orders are shown beneath the k-space diagram. The respective Littrow angles
(black dashed lines) and Rayleigh anomalies (white dashed lines) are also
illustrated. _______________________________________________________ 70
Figure 3.6.1 The effect of varying the fundamental amplitude on the ppR specular
response in the region of the +1 SPR. The grating parameters used in the
modelling are 575.00 =gkk and i7.08.172 +−=ε , and 1a is varied from
gλ01.0 to gλ07.0 _________________________________________________ 74
Figure 3.6.2 The effect of varying the fundamental amplitude on the ppR specular
response from the same grating as studied in Figure 3.6.1 in the region of the –2
SPR. ___________________________________________________________ 74
Figure 3.6.3 Graphs illustrating the linear relationship between the square of the
fundamental grating amplitude and, (a) the distance of the –2 SPR from its
associated pseudo-critical edge and, (b) the resonance half-width. The data has
been extracted from Figure 3.6.2 (�), and the best fit line plotted.___________ 75
Figure 3.6.4 The effect on the specular ppR response from the grating
( )i7.08.172 +−=ε of increasing the magnitude of the first harmonic ( 2a ) of the
surface profile. The solid line illustrates the undistorted sinusoidal profile
( )050.01 =ga λ where .575.00 =gλλ The dashed line is the predicted
response from a profile with the addition of 12 1.0 aa = and the dotted line shows
the modelled reflectivity when 12 2.0 aa = . _____________________________ 76

LIST OF FIGURES AND TABLES
11
Figure 3.6.5 The effect on the specular ppR response from the metallic grating
( )i7.0 ,8.172 −=ε in the region of the –3 SPR of varying the magnitude of the
second harmonic ( )3a of the grating profile. The solid line illustrates the profile
with 050.01 =ga λ , 12 1.0 aa = , 03 =a where 575.00 =gλλ . The other lines
show the predicted responses when 13 02.0 aa = (dashed), 13 04.0 aa = (dotted),
13 06.0 aa = (dot-dash) and 13 08.0 aa = (dot-dot-dash). ____________________ 78
Figure 3.6.6 The effect on the specular ppR response from the grating
( )i7.0 ,8.172 −=ε in the region of the –2 and +1 SPRs of varying the magnitude
of the second harmonic ( )3a of the grating profile. The solid line illustrates the
profile with 050.01 =ga λ , 12 1.0 aa = , 03 =a where 575.00 =gλλ . The
other lines show the predicted responses when 13 04.0 aa = (dotted) and
13 08.0 aa = (dot-dot-dash). __________________________________________ 79
Figure 3.7.1 k-space diagram of the grating modelled in this study ( )707.00 =gλλ .
The white arrow represents an azimuthal angle scan ( )°→= 900ϕ at a fixed
polar angle of incidence °= 30θ ._____________________________________ 80
Figure 3.7.2 The predicted ppR reflectivity as a function of azimuthal angle (ϕ) from
a grating with the following parameters: 707.00 =gλλ , 033.01 =ga λ ,
°= 30θ , and (a) i7.08.172 +−=ε , (b) i96
2 1010 +−=ε . The dotted lines show
the angular positions of the Rayleigh anomalies. _________________________ 81
Figure 3.7.3 The effect on the specular ppR response of the sample of increasing the
amplitude of the profile formed in a near-perfectly-conducting substrate where
707.00 =gλλ , °= 30θ and i96
2 1010 +−=ε . _________________________ 82
Figure 3.7.4 Theoretically modelled reflectivity data from the grating discussed in
Figure 3.7.1 with 033.01 =ga λ and 6
2 10−=′ε around the (a) +2 and (b) –1
SPR. The solid line represents the electromagnetic response of the surface when
9
2 10=′′ε (also shown in Figure 3.7.2(b)). Similarly, the squares represent the
response when 0
2 10=′′ε and the triangles when 12
2 10=′′ε . _________________ 83
LIST OF FIGURES AND TABLES
12
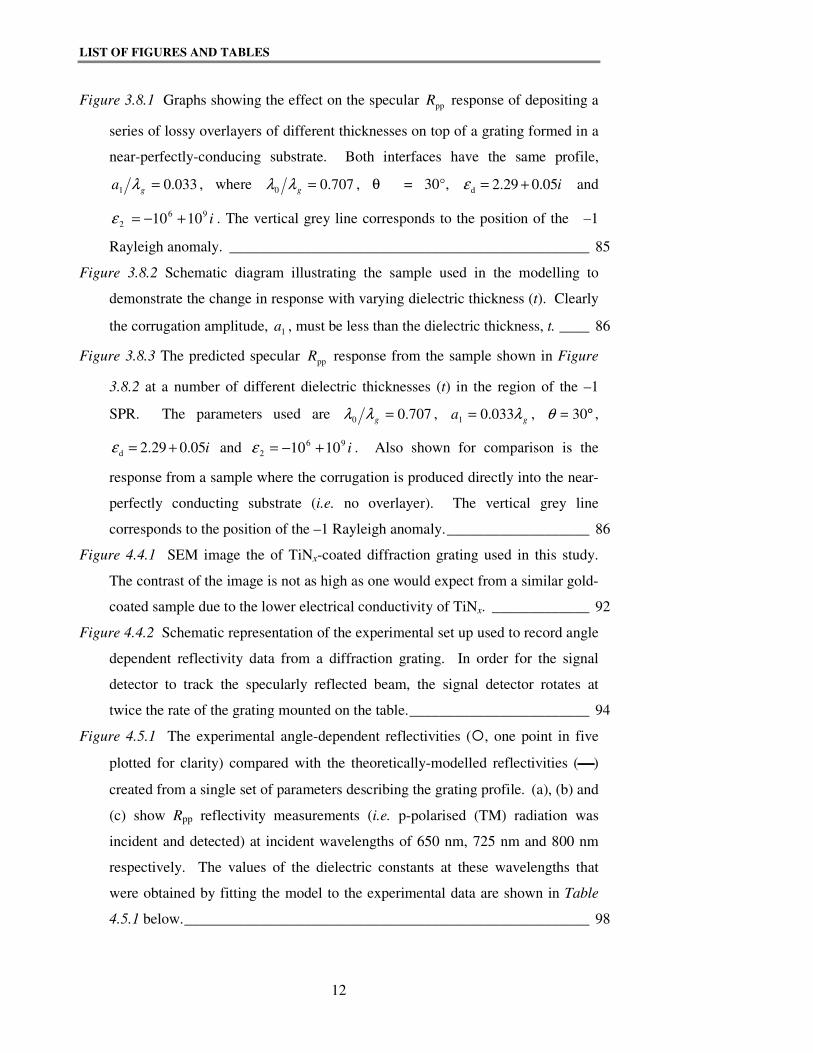
Figure 3.8.1 Graphs showing the effect on the specular ppR response of depositing a
series of lossy overlayers of different thicknesses on top of a grating formed in a
near-perfectly-conducing substrate. Both interfaces have the same profile,
033.01 =ga λ , where 707.00 =gλλ , θ = 30°, i05.029.2d +=ε and
i96
2 1010 +−=ε . The vertical grey line corresponds to the position of the –1
Rayleigh anomaly. ________________________________________________ 85
Figure 3.8.2 Schematic diagram illustrating the sample used in the modelling to
demonstrate the change in response with varying dielectric thickness (t). Clearly
the corrugation amplitude, 1a , must be less than the dielectric thickness, t. ____ 86
Figure 3.8.3 The predicted specular ppR response from the sample shown in Figure
3.8.2 at a number of different dielectric thicknesses (t) in the region of the –1
SPR. The parameters used are 707.00 =gλλ , ga λ033.01 = , °= 30θ ,
i05.029.2d +=ε and i96
2 1010 +−=ε . Also shown for comparison is the
response from a sample where the corrugation is produced directly into the near-
perfectly conducting substrate (i.e. no overlayer). The vertical grey line
corresponds to the position of the –1 Rayleigh anomaly.___________________ 86
Figure 4.4.1 SEM image the of TiNx-coated diffraction grating used in this study.
The contrast of the image is not as high as one would expect from a similar gold-
coated sample due to the lower electrical conductivity of TiNx. _____________ 92
Figure 4.4.2 Schematic representation of the experimental set up used to record angle
dependent reflectivity data from a diffraction grating. In order for the signal
detector to track the specularly reflected beam, the signal detector rotates at
twice the rate of the grating mounted on the table.________________________ 94
Figure 4.5.1 The experimental angle-dependent reflectivities (�, one point in five
plotted for clarity) compared with the theoretically-modelled reflectivities ()
created from a single set of parameters describing the grating profile. (a), (b) and
(c) show Rpp reflectivity measurements (i.e. p-polarised (TM) radiation was
incident and detected) at incident wavelengths of 650 nm, 725 nm and 800 nm
respectively. The values of the dielectric constants at these wavelengths that
were obtained by fitting the model to the experimental data are shown in Table
4.5.1 below.______________________________________________________ 98

LIST OF FIGURES AND TABLES
13
Figure 4.5.2 A comparison of the values of the dielectric function of TiNx determined
in this work (○), with the results of Karlsson et al. (1982) (+), Rivory et al.
(1981) (�), Szczyrbowski et al. (1988) (- - -), Pascual et al. (1991) (◊), Valkonen
et al. (1986) (×) and Steinmüller-Nethl et al. (1994) (—). _________________ 99
Figure 4.6.1 A plot of (a)ε ′ against λ0
2 and (b) ε ′′ against λ0
3 for the data presented
in this work. A high degree of linearity suggests that the TiNx sample is free-
electron like. However the y-intercept of (a) is greater than ε0 1= , attributable
to a positive contribution toε ′ from the occurrence of interband transitions. The
errors illustrated in the values of the dielectric constants are dominated by an
uncertainty in the grating profile. ____________________________________ 102
Figure 4.6.2 By assuming a one-resonance Drude-Lorentz model, a function relating
the two parts of the complex dielectric function is obtained, dependent only on
0 ,ωω and τ (Equation 4.6.7). Values of this function calculated using the
experimentally determined dielectric constants and uncertainties (error bars) are
compared with the fitted theoretical function (solid line). Thus, it is possible to
determine the values of 0ω and τ.____________________________________ 104
Figure 4.6.3 The (a) real part, (b) imaginary part, and the associated uncertainties in
the dielectric function of TiNx determined in the present work. The experimental
data (error bars) has been modelled using Equation 4.6.5 and Equation 4.6.6 in
order to obtain the plasma frequency,ω p . The resulting fit is shown as a solid
line. ___________________________________________________________ 105
Figure 5.3.1 Schematic diagram illustrating the sample used in this study. To allow
access to a wide range of in-plane momenta a 45o, 45o, 90o silica prism is
attached to the flat face of the silica grating substrate by means of a fluid of
matching index. Light incident upon the prism passes through the matching fluid
and silica substrate and arrives undeflected at the buried silica/indium grating
interface. A thin lacquer layer deposited on top of the indium prevents
progressive oxidisation through the film. ______________________________ 110
LIST OF FIGURES AND TABLES
14
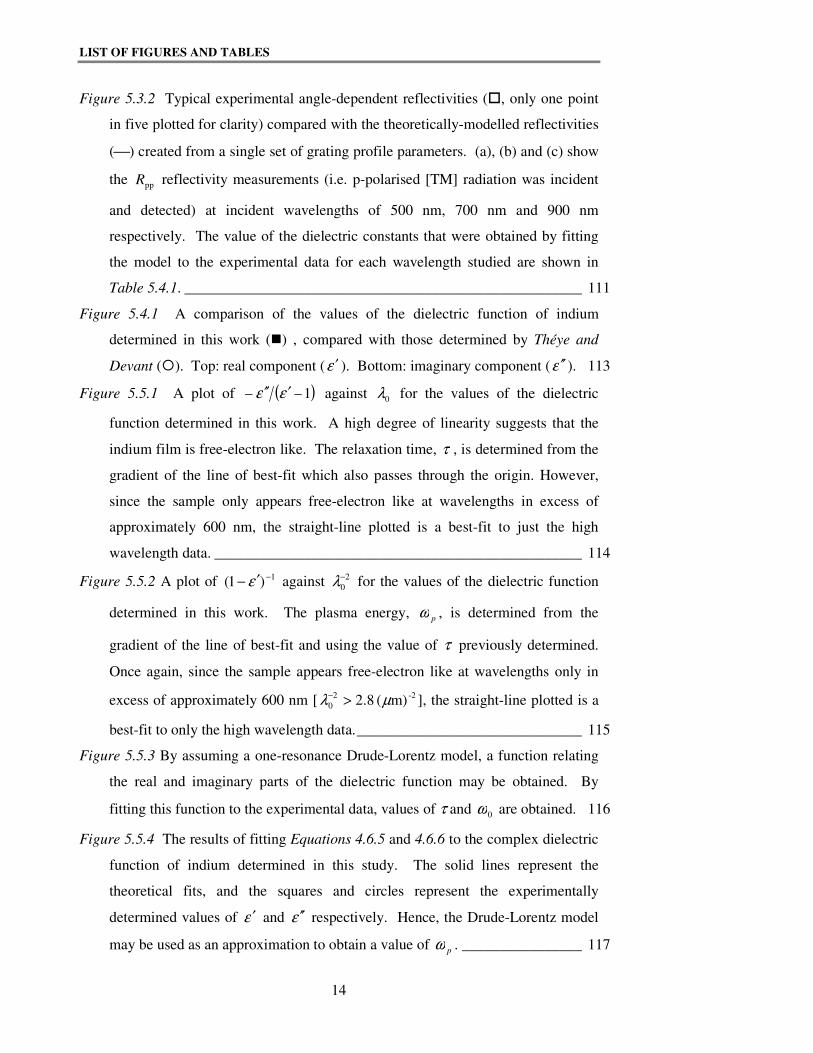
Figure 5.3.2 Typical experimental angle-dependent reflectivities (�, only one point
in five plotted for clarity) compared with the theoretically-modelled reflectivities
() created from a single set of grating profile parameters. (a), (b) and (c) show
the ppR reflectivity measurements (i.e. p-polarised [TM] radiation was incident
and detected) at incident wavelengths of 500 nm, 700 nm and 900 nm
respectively. The value of the dielectric constants that were obtained by fitting
the model to the experimental data for each wavelength studied are shown in
Table 5.4.1. _____________________________________________________ 111
Figure 5.4.1 A comparison of the values of the dielectric function of indium
determined in this work (�) , compared with those determined by Théye and
Devant (�). Top: real component (ε ′ ). Bottom: imaginary component (ε ′′ ). 113
Figure 5.5.1 A plot of ( )1–– εε ′′′ against 0λ for the values of the dielectric
function determined in this work. A high degree of linearity suggests that the
indium film is free-electron like. The relaxation time, τ , is determined from the
gradient of the line of best-fit which also passes through the origin. However,
since the sample only appears free-electron like at wavelengths in excess of
approximately 600 nm, the straight-line plotted is a best-fit to just the high
wavelength data. _________________________________________________ 114
Figure 5.5.2 A plot of 1)1( −′− ε against 2
0
−λ for the values of the dielectric function
determined in this work. The plasma energy, pω , is determined from the
gradient of the line of best-fit and using the value of τ previously determined.
Once again, since the sample appears free-electron like at wavelengths only in
excess of approximately 600 nm [ -22
0 m)( 8.2 µλ >− ], the straight-line plotted is a
best-fit to only the high wavelength data.______________________________ 115
Figure 5.5.3 By assuming a one-resonance Drude-Lorentz model, a function relating
the real and imaginary parts of the dielectric function may be obtained. By
fitting this function to the experimental data, values of τ and 0ω are obtained. 116
Figure 5.5.4 The results of fitting Equations 4.6.5 and 4.6.6 to the complex dielectric
function of indium determined in this study. The solid lines represent the
theoretical fits, and the squares and circles represent the experimentally
determined values of ε ′ and ε ′′ respectively. Hence, the Drude-Lorentz model
may be used as an approximation to obtain a value of pω . ________________ 117

LIST OF FIGURES AND TABLES
15
Figure 6.2.1 Schematic representation of the experimental set up used to record
azimuthal-angle dependent reflectivity data from a diffraction grating. The
grating is placed on the rotating table with the radiation incident at a fixed polar
angle.__________________________________________________________ 123
Figure 6.2.2 Reciprocal space map of the grating studied in this work with 632.8 nm
radiation incident. The dotted arc represents the locus of momentum values
traversed during a 0° to 90° azimuthal scan at a fixed polar angle. The points
labelled � and � correspond to the –1 and +2 SPRs respectively that will be
observed in the azimuthal-angle scan illustrated (dotted line).______________ 124
Figure 6.3.1 The experimental angle-dependent reflectivities () compared with the
theoretically-modelled reflectivities (+) created from a single set of fitting
parameters. (a), (b) and (c) illustrate the fits to azimuthal angle-dependent scans
at θ = °30 , °= 45θ and θ = °75 for Rsp (polarisation conversion), Rss and Rpp
reflectivities respectively. (d) shows a fit to a polar angle-dependent Rpp
reflectivity at a fixed azimuthal angle of ϕ = °50 . _______________________ 126
Figure 6.3.2 (a) 2µm 10 AFM image (computer-reconstructed) of the surface of the
grating. (b) Fourier analysis of this data yields an average grating profile (•••)
and a comparison is made with that deduced from the fitting of optical data ().127
Figure 7.3.1 Photograph of sample #1 studied in this chapter where mm 15=gλ and
mm 0.2=a . ____________________________________________________ 133
Figure 7.3.2 Photograph of sample #2 (bi-grating) studied in this chapter.
( mm, 0.15=gλ mm 5.111 == zx aa ) __________________________________ 134
Figure 7.3.3 Schematic representation of the interconnecting components used to
record reflectivitites in the 26.5 – 40 GHz frequency range. _______________ 135
Figure 7.3.4 Diagram of original apparatus based on the NRL arch that was used to
record the wavelength- and azimuthal-angle-dependent reflectivities from the
sample. ________________________________________________________ 135
Figure 7.3.5 Schematic diagram illustrating the apparatus used to measure the
wavelength-dependent response from a sample at fixed polar (θ) and azimuthal
(ϕ) angles of incidence.____________________________________________ 137
Figure 7.3.6 Diagram illustrating the manufacture of the spherical mirrors used
throughout the microwave work presented in this thesis.__________________ 137
LIST OF FIGURES AND TABLES
16
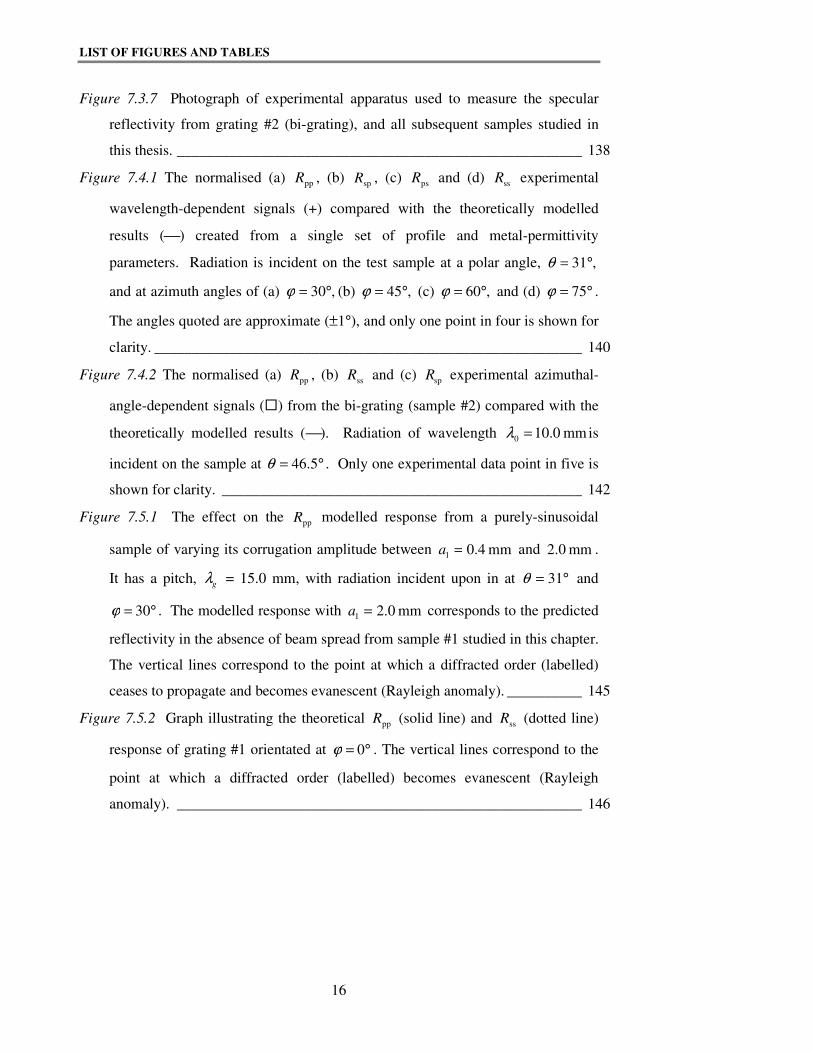
Figure 7.3.7 Photograph of experimental apparatus used to measure the specular
reflectivity from grating #2 (bi-grating), and all subsequent samples studied in
this thesis. ______________________________________________________ 138
Figure 7.4.1 The normalised (a) ppR , (b) spR , (c) psR and (d) ssR experimental
wavelength-dependent signals (+) compared with the theoretically modelled
results () created from a single set of profile and metal-permittivity
parameters. Radiation is incident on the test sample at a polar angle, ,31°=θ
and at azimuth angles of (a) ,30°=ϕ (b) ,45°=ϕ (c) ,60°=ϕ and (d) °= 75ϕ .
The angles quoted are approximate (±1°), and only one point in four is shown for
clarity. _________________________________________________________ 140
Figure 7.4.2 The normalised (a) ppR , (b) ssR and (c) spR experimental azimuthal-
angle-dependent signals (�) from the bi-grating (sample #2) compared with the
theoretically modelled results (). Radiation of wavelength mm 0.100 =λ is
incident on the sample at °= 5.46θ . Only one experimental data point in five is
shown for clarity. ________________________________________________ 142
Figure 7.5.1 The effect on the ppR modelled response from a purely-sinusoidal
sample of varying its corrugation amplitude between mm 4.01 =a and mm 0.2 .
It has a pitch, λg = 15.0 mm, with radiation incident upon in at °= 31θ and
°= 30ϕ . The modelled response with mm 0.21 =a corresponds to the predicted
reflectivity in the absence of beam spread from sample #1 studied in this chapter.
The vertical lines correspond to the point at which a diffracted order (labelled)
ceases to propagate and becomes evanescent (Rayleigh anomaly). __________ 145
Figure 7.5.2 Graph illustrating the theoretical ppR (solid line) and ssR (dotted line)
response of grating #1 orientated at °= 0ϕ . The vertical lines correspond to the
point at which a diffracted order (labelled) becomes evanescent (Rayleigh
anomaly). ______________________________________________________ 146

LIST OF FIGURES AND TABLES
17
Figure 7.5.3 The predicted xyE instantaneous vector fields above a purely-sinusoidal
sample with mm 0.15=gλ and mm 0.21 =a with radiation incident at °= 31θ .
The three diagrams correspond to (a) ,0°=ϕ mm 4.110 =λ [+2 SPR in Figure
7.5.2], (b) ,30°=ϕ mm 6.100 =λ [+2 SPR in Figure 7.4.1(a)] and (c)
,30°=ϕ mm 4.90 =λ [off-resonance]. ________________________________ 147
Figure 7.5.4 k-space diagram of the bi-grating studied in this chapter. The shaded
circle represents the incident light circle of radius 0k . The diffracted light circles
that fall within this shaded area represent the positions of the Rayleigh
anomalies. Only SPPs, which may be represented by similar circles of slightly
greater radius (not shown) that fall within this area, may be coupled to with
incident radiation. The dashed arc represents the azimuthal angle scan at a fixed
polar angle of incidence ( °= 5.46θ ) undertaken here.____________________ 148
Figure 8.2.1 Schematic diagram illustrating the sample, co-ordinate system and
experimental geometry used in this study. The direction of the electric field
vector E is illustrated for the situation when p-polarised (transverse magnetic,
TM) radiation is incident. Here, t is the average thickness of the wax overlayer,
λ0 is the wavelength of the incident radiation, λg is the grating pitch, and a is
the grating amplitude. _____________________________________________ 153
Figure 8.2.2 A planar dielectric slab waveguide, clad asymmetrically with air and
metal. The metal and air regions are considered to extend to infinity away from
the slab in the y-direction.__________________________________________ 154
Figure 8.2.3 (a)-(c) Schematic representation of the electric field (Hz) profiles of the
SPP (TM0 mode) propagating in a asymmetric, free-electron-metal clad
waveguide with increasing frequency. The frequency of the mode shown in (c)
is so great that the system behaves effectively like a one-interface system. Also
shown for comparison, is the field profile (Ez) of the lowest order TE guided
mode (TE0) supported by a system with a perfectly-conducting metal substrate
(d).____________________________________________________________ 156
Figure 8.2.4 Reciprocal space map of a grating of pitch mm 15=gλ with radiation
incident of wavelength mm 110 =λ . The shaded region indicates the values of
momentum accessible to incident photons for which no diffracted orders
propagate in the system. ___________________________________________ 157

LIST OF FIGURES AND TABLES
18
Figure 8.3.1 Production of interference fringes used to determine the permittivity of
the petroleum wax used in this study _________________________________ 159
Figure 8.3.2 Schematic diagram illustrating the apparatus used to measure the
wavelength- and azimuthal-angle-dependent response from the sample studied in
this work._______________________________________________________ 160
Figure 8.4.1 Normalised (a) ppR , (b) psR and (c) ssR response of the sample as a
function of frequency between 26.5 and 40 GHz (11.3 and 7.5 mm), and
azimuthal angle of incidence with °≈ 47θ . Data has been recorded between
°= 0ϕ and °= 90ϕ , and reflected to produce full 360° polar maps._________ 161
Figure 8.4.2 A schematic reciprocal space map of a sample similar to that studied in
this work, but with mm 6.3=t and with incident radiation of wavelength
11.0 mm [corresponding to Figure 8.4.4 (d)]. The solid circle centred upon the
origin (of radius 01kn ) is the incident light circle where the area it bounds
contains all the modes accessible to a photon incident on the grating. Also
centred upon the origin are dashed and dot-dot-dashed circles representing the
momenta of the undiffracted guided mode and SPP respectively. The sections of
these that fall with the incident light circle and hence which may be coupled to,
together with the positions of the Rayleigh anomalies are also shown. _______ 163
Figure 8.4.3 Schematic diagram illustrating the diffraction grating considered in this
multi-wavelength study. For clarity, only the incident light cone, of radius 01kn
is shown (thick lines); the cones representing the guided mode and SPP exist at a
greater radius. Also shown is the light cone representing the experimental multi-
wavelength, azimuthal-angle scan at °= 47θ (dotted lines). The series of light
circles labelled (a) and (b) are cross-sections through the series of scattered
incident light cones with radiation of wavelength 11.3 mm (26.5 GHz) and 7.5
mm (40.0 GHz) incident respectively. The numbered points at the bottom of the
diagram illustrate the lattice points about which each light cone is centred. ___ 164
LIST OF FIGURES AND TABLES
19
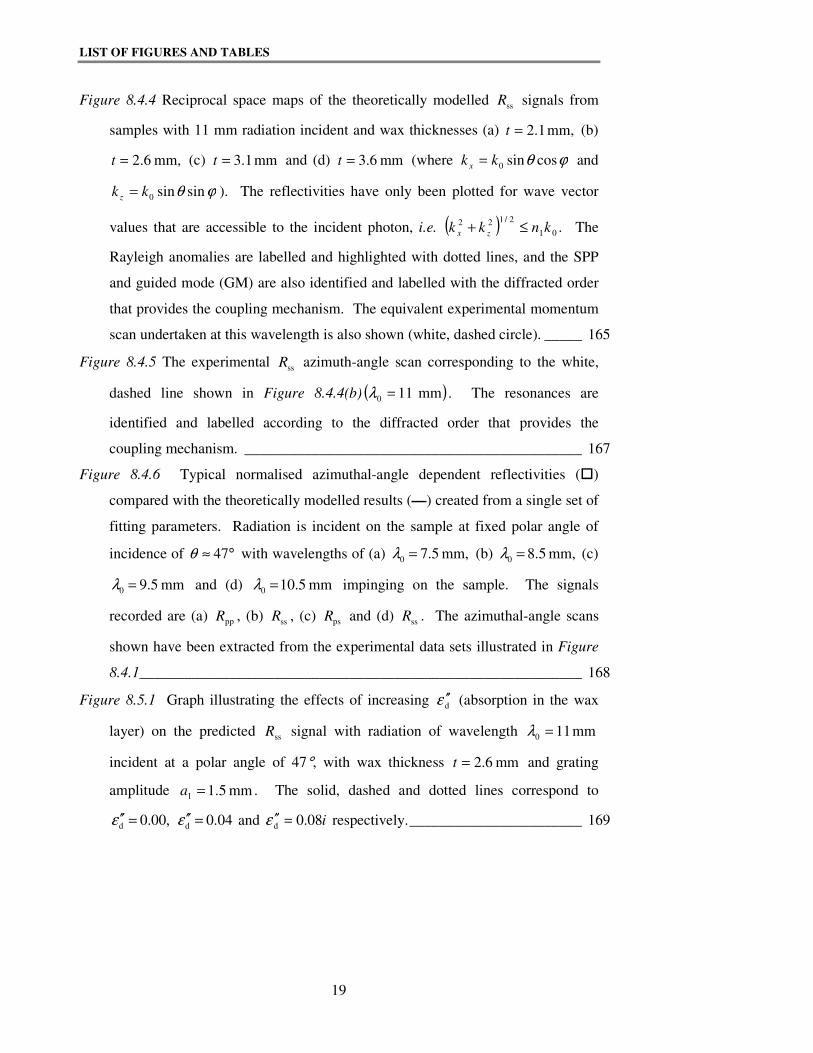
Figure 8.4.4 Reciprocal space maps of the theoretically modelled ssR signals from
samples with 11 mm radiation incident and wax thicknesses (a) mm, 1.2=t (b)
mm, 6.2=t (c) mm 1.3=t and (d) mm 6.3=t (where ϕθ cossin0kk x = and
ϕθ sinsin0kk z = ). The reflectivities have only been plotted for wave vector
values that are accessible to the incident photon, i.e. ( ) .01
2/122knkk zx ≤+ The
Rayleigh anomalies are labelled and highlighted with dotted lines, and the SPP
and guided mode (GM) are also identified and labelled with the diffracted order
that provides the coupling mechanism. The equivalent experimental momentum
scan undertaken at this wavelength is also shown (white, dashed circle). _____ 165
Figure 8.4.5 The experimental ssR azimuth-angle scan corresponding to the white,
dashed line shown in Figure 8.4.4(b) ( )mm 110 =λ . The resonances are
identified and labelled according to the diffracted order that provides the
coupling mechanism. _____________________________________________ 167
Figure 8.4.6 Typical normalised azimuthal-angle dependent reflectivities (�)
compared with the theoretically modelled results (—) created from a single set of
fitting parameters. Radiation is incident on the sample at fixed polar angle of
incidence of °≈ 47θ with wavelengths of (a) mm, 5.70 =λ (b) mm, 5.80 =λ (c)
mm 5.90 =λ and (d) mm 5.100 =λ impinging on the sample. The signals
recorded are (a) ppR , (b) ssR , (c) psR and (d) ssR . The azimuthal-angle scans
shown have been extracted from the experimental data sets illustrated in Figure
8.4.1___________________________________________________________ 168
Figure 8.5.1 Graph illustrating the effects of increasing dε ′′ (absorption in the wax
layer) on the predicted ssR signal with radiation of wavelength mm 110 =λ
incident at a polar angle of 47°, with wax thickness mm 6.2=t and grating
amplitude mm 5.11 =a . The solid, dashed and dotted lines correspond to
,00.0d =′′ε 04.0d =′′ε and i08.0d =′′ε respectively._______________________ 169
LIST OF FIGURES AND TABLES
20
Figure 8.5.2 Graph illustrating the effects of increasing dε ′′ of the corrugated wax
layer on the absorption due to Joule heating in the sample. The sample is
illuminated with incident s-polarised radiation of wavelength 11 mm at a polar
incident angle of 47° with wax thickness mm 6.2=t and grating amplitude
mm 5.11 =a . Illustrated are the theoretically modelled results with 00.0d =′′ε
(thick solid line), 04.0d =′′ε (dashed line) and 08.0d =′′ε (dotted line). Also
shown is the absorption due to a planar wax layer of the same mean thickness
(fine solid line).__________________________________________________ 170
Figure 9.3.1 Photograph of sample used in this chapter, also illustrating the co-
ordinate system and experimental geometry, where λg is the grating pitch. The
direction of the electric field vector E is illustrated for the situation when p-
polarised (transverse magnetic, TM) radiation is incident. The two lower corners
of the sample were damaged after the experimental results had been obtained. 176
Figure 9.4.1 Normalised ssR and ppR response of the sample as a function of
frequency and azimuthal angle of incidence. Data has been recorded between
°= 0ϕ and °= 90ϕ , and reflected about the axes to produce full 360° polar
maps. The band labelled � corresponds to the ±2 SPP, and the bands labelled �, �
and � all correspond to the ±1 SPP. The arrow on the upper diagram
identifies the corresponding ±1 Rayleigh anomaly. ______________________ 178
Figure 9.4.2 The normalised ssR and ppR frequency-dependent response (�) of the
sample orientated at °= 90ϕ . The solid lines on each of the graphs correspond
to the theoretically modelled results that have been created from the same set of
fitting parameters. The two experimental data sets shown have been extracted
from the data shown in Figure 9.4.1. _________________________________ 180
Figure 9.5.1 The predicted Exy vector fields corresponding to each of the three
resonances shown in Figure 9.4.2 at the instant in time of strongest coupling.
Diagram (a) corresponds to the low frequency s-coupled mode, �; (b) the high
energy s-coupled mode; �, and (c) the p-coupled mode, �. _______________ 182
LIST OF FIGURES AND TABLES
21
Figure 9.5.2 Theoretical prediction of the ssR and ppR response of the sample
illustrating the dispersion of the SPP mode as a function of incident momentum
( θsin0 =kk z ) and frequency. The data has been calculated using the fitting
parameters derived earlier in the work where the vertical black dashed lines
represents the experimental scans undertaken. __________________________ 185
Figure 9.5.3 Theoretical predictions of the ssR response of a similar sample to that
used in this study but with thicker wax overlayers: (a) mm 10.2=t and (b)
mm 50.2=t .____________________________________________________ 186
Figure 10.2.1 A dielectric filled grating sample.____________________________ 190
Figure 10.2.2 Example of a doubly-corrugated grating formed in the dielectric
overlayer. ______________________________________________________ 192
Figure 10.2.3 Example of a double-corrugated sample where the two corrugations are
separated. ______________________________________________________ 192
Figure 10.2.4 Modified microwave-experiment apparatus to record the change in
phase of the reflected signal from the sample in the region of surface plasmon
resonances. _____________________________________________________ 193
Figure 10.2.5 Examples of (a) an interface profile with a defect, and (b) an interface
profile with a finite number of grooves. _______________________________ 194
Table 4.5.1 The optical dielectric function of titanium nitride experimentally
determined in this work, together with estimated errors. ___________________ 99
Table 4.6.1 A comparison of the values of �ω p and � τ of TiNx experimentally
determined in this work, along with the values obtained by a number of previous
workers. The nitrogen/titanium ratio (x) and deposition method is also listed for
comparison._____________________________________________________ 104
Table 5.4.1 The optical dielectric function of indium experimentally determined in
this work, together with the results determined by Théye and Devant (1969). _ 112
ABBREVIATIONS
22
ABBREVIATIONS
ATR Attenuated Total Reflection
CVD Chemical Vapour Deposition
GM Guided Mode
PSD Phase Sensitive Detector
PACVD Plasma-Assisted Chemical Vapour Deposition
SNA Scalar Network Analyser
SPP Surface Plasmon Polariton
SPR Surface Plasmon Resonance
TM Transverse Magnetic
TE Transverse Electric

ACKNOWLEDGMENTS
23
ACKNOWLEDGMENTS
As a member of the Thin Film Photonics Group, a helping hand is never far away. I
would like to take this opportunity to thank the many people, all of whom I can also
call friends, who have assisted, encouraged and supported me throughout my PhD.
The biggest thank you of all must go to my supervisor for the last three-and-a-bit
years, Professor Roy Sambles. His enthusiasm for science and its understanding, and
his enormous wealth of ideas never ceases to amaze me. Being called a “drongo” took
a bit of getting used to, but then I realised that everyone, including academics, are
“drongos” from time to time! Another huge thank you must go to my external
supervisor at DERA (Farnborough), Dr Chris Lawrence, who secured the funding and
provided the necessary equipment in order to undertake the experiments. Well, all the
equipment apart from the metallic underpants I’m still waiting for! By the way, if you
ever go bowling with him, make sure he plays with normal balls – apparently his have
target-seeking mechanisms! Thanks also to Dr Bill Barnes, who acts as an excellent
Roy substitute when the Big Man is away. I am also indebted to the work and
suggestions of the team of “technicians” who have designed, built, modified and re-
modified so many bits and pieces of equipment on my behalf. Particular thanks to Pete
Cann (The Man) and Steve Tuckett, but also to Kevin White, Phil Vossler, Melvyn
Gear, Dave Jarvis and Ron Clarke. Also thanks to John Meakin for chasing after me
when I fill in a form incorrectly, and to Barry “in stores” Elston for the glue that
doesn’t stick and the permanent pens that aren’t! The secretarial staff deserve a big
acknowledgement too, that’s Margaret, Jennifer, Denise, Shirely and Val. Thanks also
to Dr Jefferey Jones (University of Exeter), Hrant Azizbekyan (Engineering Center of
the Armenian National Academy of Sciences) and Alex Smout (DERA Malvern) who
have helped me with the titanium nitride, indium and azimuthal-angle studies
respectively.
But how can I forgive… sorry - forget(!) all the friends I have made within the Thin
Film Photonics group. Thanks to old-boy Mikey J (the man with a worse hair-cut than
me, but I’ve never told him that!). Your stories never fail to make me chuckle… no
matter how many times I hear them! Sorry if I’ve ever annoyed you with all my
questions – you really have been a great help. From one veteran to another, Pete “now

ACKNOWLEDGMENTS
24
with wings” Vukusic, for setting Mike J straight on many of his stories. To my
colleagues in that strangely uncivilised end of the lab they call “Group 13”. That’s
Piers “Ovinus Worrius” Andrew and Phil “I love JS too” Worthing for helping me to
understand what I’m supposed to be doing. Also thanks Martin “its not a race” Salt,
John “scary but nice” Wasey, and Pete “small but nice” Hobson. May you each flood
the basement at least once a year forever more! Moving back into Group 20 land, I
would like to say thanks Benny “sandwich boy” Hallam, who when he joined the
group was polite and sensible, by lunchtime he was as bad as the rest of us. To
Dominic “Quick shot” Mikulin who put up with me sitting opposite him for the first
year, and Nathan “XS” Smith for serving time for the last two years. To the Man from
Japan, Nobuharu Okazaki, for providing hours of entertainment and to Alan Brady for
putting up with his antics! To Mike “the sensible Scotsman” Linehan, and to Ben
“nice jumper” Hodder. (Ben, if you ever need someone with good musical tastes in
your band then let me know!) To Richard Watts, who, when he wasn’t writing papers
found time to teach me how to do an angle scan, again and again and again! To
housemate “H” (no, not the one from Steps, but Hazel Went) for putting up with my
bad habits, and to Ian Hooper and his many friends! To Nick “the cardboard soldier”
Wanstall for helping me with bits of computer code, and to the other theoreticians, the
“odd couple” (although now divorced), Binoy Sobnack and Weichao Tan.
To my science teachers at Wells Cathedral School for teaching it so well, and to all my
non-physics friends for paying an interest in what I do (and no, I don’t want to go into
medicine!)
Also, to the Defence Evaluation and Research Agency (DERA), Farnborough for their
financial support of this work, which has been carried out as part of Technology Group
08 of the MoD Corporate Research Programme.
To my girlfriend Helen for her support and love, and for helping me to put everything
into perspective. Our six 6 years together have been so enjoyable – long may they
continue!
Finally, to my Mum and Dad for financing my education. A huge thank you to them
both and my sister for all their love, encouragement and support.
CHAPTER 1 Introduction
25
CHAPTER 1
Introduction
The work presented in this thesis concerns the coupling of incident radiation to the
surface mode that propagates along the interface between a metal and a dielectric.
This mode is known as the surface plasmon polariton (SPP) and its excitation was
first experimentally observed in the spectra from ruled diffraction gratings by Wood in
1902. Chapter 2 presents a brief historical overview of the developments in the
understanding of the physics describing the SPP. A derivation of the planar-interface
dispersion relation of the SPP is presented, and the spatial extent of the fields
associated with the mode are examined. This demonstrates that the mode is non-
radiative, and consists of longitudinal oscillations of surface charge whose fields are
well confined to the interface. Methods for coupling radiation into the mode are
described, with particular emphasis on grating-coupling (since this is the method
employed in experiments presented here). In addition, the phenomena of SPP
mediated polarisation conversion and grating-induced band gaps are discussed.
Chapter 3 describes the influence of the interface profile and properties of the
surrounding media on the reflectivity from grating samples. This is achieved by
introducing the theoretical model based on the formalism of Chandezon et al. (1982)
that is used herein. By modelling the electromagnetic response of gratings samples, it
is demonstrated that the propagation of the mode and the shape and position of its
resonances are extremely sensitive to the properties of the interface and its
surroundings. Since three of the experimental chapters presented here consider the
response of metallic samples at very low (microwave) frequencies, particular attention
is made to the properties of near-perfectly conducting samples.
Chapters 4 and 5 demonstrate how the sensitivity of the SPP to its surroundings may
be exploited to determine the optical properties of metals. By fitting the zero-order,
polar-angle dependent reflectivities from metal-coated diffraction gratings (of suitable
pitch and depth) to the predictions from the modelling theory described in Chapter 3,
the complex dielectric functions of titanium nitride (Chapter 4) and indium (Chapter
5) are determined throughout the visible regime. Since indium is easily oxidised in

CHAPTER 1 Introduction
26
air, a sample geometry is used in which the SPPs are excited at a protected silica-
indium boundary. The experimentally determined complex dielectric functions for
both materials are compared with a simple Drude model, and a more sophisticated
Drude-Lorentz model, in order to obtain approximate values for the metals’ relaxation
times and plasma frequencies.
Chapter 6 presents a new technique for recording the zero-order reflectivity from a
sample as a function of the angle of azimuth. This is a generally useful technique
since, unlike the more conventional polar angle of incidence scans used in Chapters 4
and 5, it involves no moving signal detector. The technique is used to record the
response of a silver-coated diffraction grating at a range of polar angles of incidence,
and the data are successfully fitted to the grating modelling theory. The work
presented in the chapter tests the validity of the conical diffraction theory [Elston et
al. (1991 a,b)], and provides an accurate characterisation of the grating profile.
Chapters 7, 8 and 9 each represent work undertaken in the microwave regime at
frequencies between 26.5 and 40 GHz, and use a scaled up version of the apparatus
developed in Chapter 6. This technique is particularly advantageous at these much
longer wavelengths since polar angle scans are particularly cumbersome due to the
large area swept out by the signal detector. In Chapter 7, the reflectivities from both
singularly and doubly corrugated samples are presented, where the corrugation is
milled directly into a near-perfectly conducting metal substrate. By developing an
apparatus that provides a well-collimated incident beam, excellent agreement is
achieved between the experimentally recorded data and the predictions from the
grating modelling theory.
The responses of corrugated dielectric overlayers deposited upon planar metal
substrates are considered in Chapters 8 and 9. With such samples, the interface that
provides the coupling mechanism, and the interface along which the SPP propagates
are separated. The dielectric material used is petroleum wax, which, in the available
frequency range, is found to have a similar refractive index to glass at visible
frequencies. Due to the ease with which the grating profiles can be cut into the wax
compared to milling them directly into the metal substrate, this coupling technique
presents an advantage over the more conventional geometry. The average thickness

CHAPTER 1 Introduction
27
of the dielectric layer studied in Chapter 9 is too small to be able to support guided
modes, however such modes, in addition to the SPP, are supported by the thicker
sample studied in Chapter 8. The effects of non-zero ε ′′ (where εεε ′′+′= i ) in the
dielectric are theoretically investigated for the sample used in Chapter 8, and the
degree of absorption is shown to be greatly enhanced on resonance of well-coupled
modes. Chapter 9 presents the novel result that when a near-grazing beam is incident
on the sample with its grooves orientated such that they are parallel to the plane of
incidence, coupling to the SPP is possible with both p- and s-polarised radiation at
three different energies. The identity of each of the modes excited at the three
energies are confirmed as the resonant excitation of the SPP and an explanation is
provided for their coupling conditions by modelling their electric field profiles and
their dispersion with frequency and in-plane momentum. In both these chapters, good
agreement is obtained between the experimentally recorded reflectivities, and the
theoretically modelled results.
Finally, Chapter 10 contains a summary of the work presented in this thesis, possible
ideas for future work, and a list of publications arising from the studies presented
here.

CHAPTER 2 A review of the properties of radiatively coupled surface plasmon polaritons.
28
CHAPTER 2
A review of the properties of radiatively coupled
surface plasmon polaritons.
2.1. Introduction
In this chapter some of the physics and properties of surface plasmon polaritons (SPPs)
propagating on planar and corrugated surfaces are briefly described. The dispersion
relation for the propagation of the SPP on a planar metal-dielectric interface is derived
and the spatial extent of the electric fields associated with the mode is explored. This
demonstrates that the mode is non-radiative in the planar-interface limit, and consists of
a longitudinal oscillation of surface charge whose fields are well confined to the
interface. An historical overview of the understanding of the Wood’s (SPP) and
Rayleigh anomalies (pseudo-critical edge), which were first observed around the turn of
the 20th century, is presented and optical coupling to the SPP is discussed with particular
emphasis on grating coupling. Finally, the phenomenon of SPP mediated polarisation
conversion is discussed, and the creation of grating induced gaps in the SPP dispersion
curve is explained.
2.2. Historical Overview
The electromagnetic surface waves discussed throughout this thesis may propagate
along a planar interface between two dissimilar media without radiation losses. Surface
waves [Barlow and Cullen (1953), and Goubau (1959)] have attracted much scientific
attention over the last one hundred years. For example, Zenneck in 1909 realised the
possibility of propagation of radio waves around the Earth when one considers the
upper half space as a pure dielectric and the lower as a conductor. A similar wave of
radiation coupled to oscillating charge density may propagate along a metal-dielectric
interface. Today, we often refer to this mode as a surface plasmon polariton (SPP) and
it may be considered as a “sound” wave propagating through the free-electron gas of the
metal.

CHAPTER 2 A review of the properties of radiatively coupled surface plasmon polaritons.
29
The work presented in this thesis is concerned with the excitation of the SPP within
systems that involve diffraction gratings, and it is perhaps Joseph von Fraunhofer who
deserves the credit for the invention of the diffraction grating in 1821 in the form that it
is known today. He produced finely ruled reflection gratings with a diamond point in
mirrored surfaces which enabled him to conduct a thorough study of their performance
and, for the first time, to calculate the wavelength of light. He explained the
phenomenon of diffracted orders and verified the grating equation:
0)sin(sin λθϑλ NNg =− Equation 2.2.1
where θ and Nϑ are the angles of incidence and diffraction of the Nth order
respectively, and λg is the grating period.
Wood studied the spectra of similar ruled metallic diffraction gratings in 1902. He
viewed the spectra of an incandescent lamp reflected from a grating, and observed an
uneven and unexpected distribution of light. Dark and bright bands were seen in the
spectra of transverse magnetic (TM) light and between these bands the intensity
changed over a very narrow spectral region. The theory of diffraction gratings at the
time was unable to explain the two anomalies, which are now known to be the result of
two different physical processes. The features that he observed are illustrated in Figure
2.2.1, where the reflected intensity has been recorded as a function of the angle of
incidence (θ ), measured from the normal to the average plane of the grating.
Lord Rayleigh correctly predicted the positions of the bright anomalies in the TM
spectra in 1907 as part of his Dynamical Theory of Gratings (an extension to his earlier
Theory of Sound). He found that the scattered field is singular at wavelengths at which
one of the diffracted orders emerges from the grating at grazing angle, which results in a
sudden redistribution of the available energy. Hence, the sharp change in reflectivity
observed by Wood is generally referred to as the Rayleigh anomaly. His theory also
suggested that the anomalies only appear when the incident electric field is polarised
perpendicular to the grating grooves – it predicted no anomalies for the orthogonal
polarisation. Further experiments over the next three decades again by Wood (1912 and
1935), and also by Ingersoll (1920) and Strong (1935) verified these initial
observations.
CHAPTER 2 A review of the properties of radiatively coupled surface plasmon polaritons.
30
One of the problems with Rayleigh’s theory was that it only predicted a singularity at
the anomaly’s wavelength – it did not yield any information about the shape of the
feature. However Fano (1941) presented an alternative treatment. The grating equation
(Equation 2.2.1) illustrates that the component of the momentum of the incident
radiation parallel to the average plane of the grating surface will be enhanced in integer
multiples of gλπ2 (where λg is the grating spacing) and a series of diffracted orders
will result. He proposed that when this component is greater than the momentum of the
incident beam ( 1sin >ϑ ), it becomes evanescent and will be diffracted into a pair of
surface waves travelling along the grating surface and exponentially damped in the
direction perpendicular to it. These waves are not able to leave the interface since both
the dielectric and the metal repeatedly reflect them, and no part of their energy is
dispersed outside the surface region. Fano showed that a quasi-stationary state may be
set up, where the pairs of surface waves are excited by the impinging incident radiation
at the surface of the grating and act as forced oscillators. The waves are considered to be
quasi-stationary because in real metals there are losses due to heat production; the width
Figure 2.2.1 Theoretically-derived angle-dependent reflectivity data from a gold
coated grating illustrating the bright (Rayleigh) and dark (Wood’s) anomalies
observed by Wood (1902).

CHAPTER 2 A review of the properties of radiatively coupled surface plasmon polaritons.
31
of the interval in which the resonance is felt being proportional to the magnitude of this
damping.
However, the electrons associated with the surface waves can only be excited at the
interface if there is a component of the incident wave polarised with its electric vector
perpendicular to the surface. In addition, the electrons will oscillate resonantly only if
the tangential momentum of the oscillations approaches a permissible value determined
by the real part of the permittivity of the metal (ε ′ ). It is the negative sign of ε ′ that
inverts the direction of the normal component of the electric field at the interface and
allows the possibility of coupling to this quasi-stationary state due to the charge density
variations induced on the metallic surface. Since for most materials there is no
analogous magnetic property, the correct polarisation of incident radiation is vital.
Wood’s initial publications reported that the anomalies appeared only in the component
of the incident light which was polarised with its electric vector perpendicular to the
rulings (p-polarised, TM). It was not for another 50 years that “Parallel Diffraction
Grating Anomalies” were generally accepted when Palmer (1952) observed them in the
s-polarised spectra from gratings with much deeper grooves. He illustrated that with s-
polarised incident radiation sharp, bright anomalies occurred at the same angles as the
anomalies previously predicted by Rayleigh and observed in the p-polarised spectra by
Wood. Rayleigh’s theory did not predict these TE anomalies and neither did Fano’s
classical treatment. It eventually became clear that Rayleigh’s Dynamical Theory of
Gratings was only valid for shallow grooves (an issue that will be discussed in detail in
the following chapter). Hence his theory was unable to predict the bright bands in the s-
polarised spectra observed by Palmer, and the dark bands in the p-polarised spectra
observed by Wood.
During the mid- and late-1950s, much progress was made in attempting to explain the
Wood’s anomaly. The resonance effect proposed by Fano, in conjunction with the
developments of treating the electrons in a metal as a plasma [Pines and Bohm (1952)]
led Ferrell (1958) to confirm that the density oscillations of these electrons occurred in
multiples of a basic quantum of energy, �ωp. It was therefore interpreted that this
plasma oscillation was associated with a basic unit of energy that was termed the
CHAPTER 2 A review of the properties of radiatively coupled surface plasmon polaritons.
32
plasmon. When excited by a high-energy incident beam of electrons, these plasma
oscillations should emit radiation at the plasma frequency. The experimental evidence
for the existence of bulk plasmons was provided by Steinmann (1960), who bombarded
metal films with keV 25 electrons. Ferrell also predicted that image forces at the
surfaces of a thin metal film should constrain the electrons. This would contribute an
uncertainty to the momentum normal to the foil and allow these surface plasmons to
radiate transversally. Powell (1958,1960) detected the decay by radiative emission of
both excited surface and bulk plasmons, which were found to have the characteristic
energies (ω p 2 and pω respectively) that had been earlier predicted by Ritchie
(1957) and Ferrell (1958).
Fano (1941) realised that the surface waves that he proposed that propagate along the
boundary between a dielectric and a metal were simply a special case of the waves first
suggested by Zenneck (1909) and Sommerfeld (1909). Since these waves propagate
along the metal boundary with a momentum greater than that of the incident radiation in
the dielectric (air) medium, it is impossible for them to radiate or to couple to them on a
planar interface. However Teng and Stern (1967) used an optical grating that could
impart some additional momentum to the surface plasmon, so that it could couple to a
radiating electromagnetic field. The experiment consisted of bombarding the grating
with a high-energy electron beam and observing peaks in the out-coupled TM radiation.
To verify that the surface plasmon was the cause of these peaks, an additional
experiment was carried out. Electromagnetic radiation incident at the emission angle,
and of the same frequency as the peaks, should be absorbed as it excites the surface
plasmon. This was the case, and as the angle of incidence with respect to the grating
normal was varied, troughs appeared at the same position as the peaks in the electron-
beam experiment. Using the angular positions of these peaks, the authors were able to
determine the wave vector parallel to the surface of the grating of the surface plasmon
and hence the dispersion curve could be mapped out. This confirmed the excitation of
surface plasmons unequivocally and presaged their direct optical coupling with the use
of a grating - confirming Wood’s observations.
Fano’s theory was further verified experimentally by Ritchie et al. (1968), and
Beaglehole (1969). They each provided one of first comprehensive experimental

CHAPTER 2 A review of the properties of radiatively coupled surface plasmon polaritons.
33
studies of optically excited surface plasmons (known as surface plasmon polaritons,
SPPs) on metal gratings. Ritchie et al. were able to experimentally derive the dispersion
curve of the SPP by plotting the positions of the peaks in the p-polarised spectra from
their grating. Meanwhile Beaglehole was able to illustrate that coupling to the mode is
possible for both p- and s-polarised light if the grating grooves are twisted with respect
to the plane of incidence, and provided that there is a component of the electric field
along the direction of surface plasmon propagation.
2.3. Surface Plasmon Polaritons at the Interface of Semi-infinite Media
The term polariton has evolved to denote the coupling of the electromagnetic photon
field to the polar excitations in a solid. Bulk polaritons propagate in an unbounded
medium, while surface polaritons may be defined as the coupling of the incident field to
surface dipole excitations that propagate along the interface between two dissimilar
media. In this section, the dispersion of the polariton that may propagate at the interface
of a metal and a dielectric is derived, and the spatial extent of its fields is discussed.
2.3.1. The Dispersion Relation
We restrict ourselves to considering the interface of two semi-infinite, optically
isotropic, homogeneous media that are characterised by frequency dependent, complex
dielectric constants )()() ωεωεωε ′′+′=( i . For simplicity both media assumed to be
non-magnetic ( )µ = 1 and the interface is planar. In addition, it is convenient, at least
initially, to consider media that are loss-free.

CHAPTER 2 A review of the properties of radiatively coupled surface plasmon polaritons.
34
First consider the configuration shown in Figure 2.3.1 with electromagnetic modes
propagating in the x-direction along an interface in the xz-plane at y = 0. The surface
polariton for this configuration will correspond to solutions of Maxwell’s equations
which satisfy the boundary conditions at the interface and whose field magnitude varies
in a wave-like manner in the x-direction, but vanishes exponentially in the y-direction.
In other words, there exists evanescent, interface modes in both media. The electric
fields of these interface modes in each medium take the form,
( )[ ] ( ) 0 ; expexp 111
0
11 >−= yyiktxki yx ωEE Equation 2.3.1
( )[ ] ( ) 0 ; expexp 222
0
22 <−= yyiktxki yx ωEE Equation 2.3.2
where ( )0
1
0
1
0
1
0
1 ,, zyx EEE=E and ( )0
2
0
2
0
2
0
2 ,, zyx EEE=E are the vector fields at the interface
in medium 1 and 2 respectively; 111 yyy kikk ′′+′= and 222 yyy kikk ′′+′= are the
Incident beam
Reflected beam
Medium 2,
(semi-infinite)
ε2
Medium 1,
(semi-infinite)
ε1
Transmittedbeam
θθ
β
x
y
z
Figure 2.3.1. The co-ordinate system used to describe the planar interface system,
where the z-direction is into the page. The situation shown is when p-polarised
radiation is incident.

CHAPTER 2 A review of the properties of radiatively coupled surface plasmon polaritons.
35
components of the wave vectors perpendicular to the interface; and
xxxxx kikkkk ′′+′=== 21 and ωωω == 21 are the components of the wave vectors
parallel to the interface and the frequency respectively (which are common to both
media).
By deriving the wave equation for 1E and 2E ( 22
0
2t∂∂=∇ EE εµ ), one finds the
following expressions for k y1
2 and k y2
2 :
2
2
22
12
22
1 )()( xxy knc
kc
k −=−= 21 ω
ωωε
ω Equation 2.3.3
2
2
22
22
22
2 )()( xxy knc
kc
k −=−= 22 ω
ωωε
ω Equation 2.3.4
where ( ) ( )2
1
ωεω =n is the frequency dependent refractive index for the corresponding
media. Since the two media are neutral, and therefore 0=⋅∇ D in each medium, we
obtain the following relation between the x and y-components of E1 and E2:
0;1
1
1 ≥−= yEk
kE x
y
x
y Equation 2.3.5
0;2
2
2 ≤−= yEk
kE x
y
x
y Equation 2.3.6
On applying the boundary conditions for the normal components of D ( )D Dy y1
0
2
0= , and
also for the tangential components of E ( )E Ex x1
0
2
0= the following expression is
obtained:
k
k
y
y
1
2
=ε ω
ε ω1
2
( )
( ) Equation 2.3.7

CHAPTER 2 A review of the properties of radiatively coupled surface plasmon polaritons.
36
By combining Equation 2.3.3, Equation 2.3.4 and Equation 2.3.7, the following
equation for the dispersion relation for the interface modes is obtained:
2
2
22
SPPx kc
k =)(+)(
)()(=
21
21
ωεωε
ωεωεω Equation 2.3.8
or
( )ωω 2
= sSPP nc
k2
22 Equation 2.3.9
where sn is the “refractive index” of the interface mode which is a function of the
dielectric constants of both media.
In addition, by using the expressions for E1 and E2, and similar expressions for H1 and
H2 in Maxwell’s equation for H×∇ and applying the boundary conditions for B, H, E
and D, the results H Hx y= = 0 and Ez = 0 are obtained for both media. Also, the
following expression for the z-component of H may be derived:
[ ] )exp()(exp 1
0
11 yiktxkiHH yxzz ω−= Equation 2.3.10
[ ] )exp()(exp 2
0
22 yiktxkiHH yxzz ω−= Equation 2.3.11
where
( )( )
H Hc k
E Hz z
y
x z1
0
2
0
1
0 0= = =ω ε ω
ω12
Equation 2.3.12.
Thus, the electric field in each medium lies in the xy-plane, with the magnetic field
normal to this plane. Therefore the interface modes are TM in nature.
CHAPTER 2 A review of the properties of radiatively coupled surface plasmon polaritons.
37
2.3.2. Brewster and Fano Modes
By combining Equation 2.3.3, Equation 2.3.4 and Equation 2.3.8, the following
expressions may be obtained:
( )( )
k ky x1
2 2 1=ε ω
ε ω2
Equation 2.3.13
and
( )( )
k ky x2
2 2 2=ε ω
ε ω1
Equation 2.3.14.
These equations illustrate that in frequency regions where ( )ε ω1 and ( )ε ω2
are both
purely real and positive, ky1 and k y2 are also real. Whereas when ( )ε ω1 and ( )ε ω2
have opposite signs, ky1 and k y2 are imaginary. It is therefore not surprising that
different frequency (wave vector) regions support different types of interface modes.
The interface modes that occur when ( )ε ω1 and ( )ε ω2 are purely real and have
opposite signs correspond to surface electromagnetic modes that propagate without
radiation loss along the interface and whose fields decay exponentially to zero in the y-
direction. These modes are known as Fano modes (Section 2.1) and are equivalent to
the propagation of the SPP along a planar, non-lossy metal-dielectric interface.
The interface modes that occur when ( )ε ω1 and ( )ε ω2
are both positive correspond to
Brewster modes, and since ky1 and k y2 are both real and have the same signs, it is clear
that the surface mode generated is in fact not bound to the interface. By inspection of
Equation 2.3.13 and Equation 2.3.14, we can appreciate that this mode is generated
when
Bn
nθ
βωε
ωε
ω
ωθ tan
tan
1
)(
)(
)(
)(tan
1
2
1
2 ==== Equation 2.3.15
which occurs when
CHAPTER 2 A review of the properties of radiatively coupled surface plasmon polaritons.
38
°=+ 90βθ Equation 2.3.16.
At Bθθ = (the Brewster angle) there is no re-radiation of p-polarised radiation from
medium 2 since there is no component of motion of the induced interface charge in this
direction. Note that, although Brewster modes are not bound to the surface (i.e. they do
not attenuate with distance from the interface like the Fano modes discussed above),
they do satisfy the criterion for interface modes that there be only one electromagnetic
wave in each medium (i.e. they involve an incident wave but no reflected wave in one
medium, and a refracted wave in the other).
To demonstrate that the expression derived in Equation 2.3.8 and the Brewster mode
dispersion relation are equivalent, the dispersion relation for the Brewster mode is
derived separately below.
2
1
2
1
)()(
)(
)]()(
)(sin 22
+=
+[=
2122
21
ωεωε
ωε
ωω
ωθ
nn
nB Equation 2.3.17
( )
( )
2
1
2
1
)(
)(
)(
)(sin 11
00
+)(
)(
=
+)(==∴
21
2
22
21
21
ωεωε
ωεωεω
ωω
ωωθ
cnn
nnkknk Bx Equation 2.3.18
where ck ω=0 is the is the wave vector of the incident radiation in free space.
The equivalence of Equation 2.3.8 and Equation 2.3.18 demonstrates that the SPP is a
manifestation of the Brewster mode for which the media have purely real permittivities
of opposite signs (e.g. a non-lossy metal-dielectric system). It is clear that Brewster
modes have values of kx that are smaller than the wave vector of the bulk polaritons in
either medium. However, the opposite is true for Fano modes, which therefore cannot
directly couple to bulk polaritons in the dielectric, i.e. the SPP is described as non-
radiative.
It is also important to note that, in the case of the Brewster modes, the x- and y-
components of the electric fields are in phase with each other and the y-components in
the two media have the same signs. For Fano modes, the x- and y- components are one
CHAPTER 2 A review of the properties of radiatively coupled surface plasmon polaritons.
39
quarter of a cycle out of phase with one another, and the y-components of the field in
the upper and lower media have opposite signs. Furthermore when )()( 12 ωεωε −→
and in the absence of damping, it is clear that ∞→xk ( 0→xλ ) and 00
1
0
2 xyy iEEE =−=
(Equations 2.3.5, 2.3.6, 2.3.13 and 2.3.14). Hence, at this frequency, the magnitudes of
the x- and y- electric field components are equal. This frequency corresponds to that of
the uncoupled (or unretarded) surface electric dipole excitation.
Conversely, as −∞→)(2 ωε (i.e. a perfectly conducting metal) we find that 01knkx →
(Equation 2.3.8), i.e. the mode becomes more photon-like. In addition, from Equations
2.3.5, 2.3.6, 2.3.13, and 2.3.14 it is apparent that 01 →′′yk , ∞→′′
2yk and 000
2 →xy EE ,
i.e. the Fano modes reside entirely in medium 1 and are polarised only in the y-
direction. Therefore the modes are essentially bulk polaritons propagating in the
dielectric (medium 1) along the x-axis.
If one of the media is now allowed to become lossy, then clearly from Equation 2.3.8,
Equation 2.3.13 and Equation 2.3.14, xk , 1yk and 2yk all become complex. It can be
shown that in this system, a surface mode may propagate along the interface which has
attenuated fields in both media [Burstein et al (1972)]. These types of modes are
generally referred to as Zenneck modes [Zenneck (1909)], and have phase velocities
greater than that of bulk polaritons at the same frequency in the loss-free medium.
When 02 <′ε , the Zenneck mode corresponds to lossy Fano mode that is equivalent to
the SPP that propagates along the boundary of a real (lossy) metal and a dielectric.
Let us continue with the previous example of the metal-dielectric interface, where the
metallic media is again assumed to be perfectly conducting. Hence, the electron system
in the metal will behave as a free electron gas where the real part of the metal’s
dielectric constant varies as
2
2
2 1)(ω
ωωε p
−= Equation 2.3.19
where
CHAPTER 2 A review of the properties of radiatively coupled surface plasmon polaritons.
40
m
ee
p
0
2
2
ε
ρω = Equation 2.3.20
defines its plasma frequency, eρ is the free electron density, e is the electronic charge,
m is the electronic mass and 22 εε ′= is the relative permittivity of medium 2.
Substituting the dielectric function for the metal into the dispersion relation (Equation
2.3.18) gives
−+
−
=
2
2
1
2
2
1
2
0
2
1
1
ω
ωε
ω
ωε
p
p
x kk Equation 2.3.21
where 11 εε ′= is the relative permittivity of medium 1 which is independent of
frequency and ck ω=0 . Solving this equation for xk as a function of ω yields two
solutions, one for the positive root and one for the negative root (Figure 2.3.2). The
positive root leads to mode solutions of the Brewster type, whose dispersion curve is
asymptotic to 1
11 −+= εω xck . Since this mode exists within the light-line
( 1εω xck= ) they can be coupled to at any frequency, given θ is correctly chosen,
and are hence termed radiative modes. Conversely, the negative solution leads to
solutions of the Fano (SPP) type. This mode is clearly seen to asymptotically approach
the light-line in the limit pωω << confirming the previous result. This means that since
xk for the Fano mode is always less than the momentum of the incident beam in the
dielectric, at no frequency can it be directly excited by an incident photon, i.e. it is non-
radiative. As predicted by Ferrell (1958), the frequency of the uncoupled electric
dipole oscillation is asymptotic to 2pωω = (when 0006.1air1 == εε ).
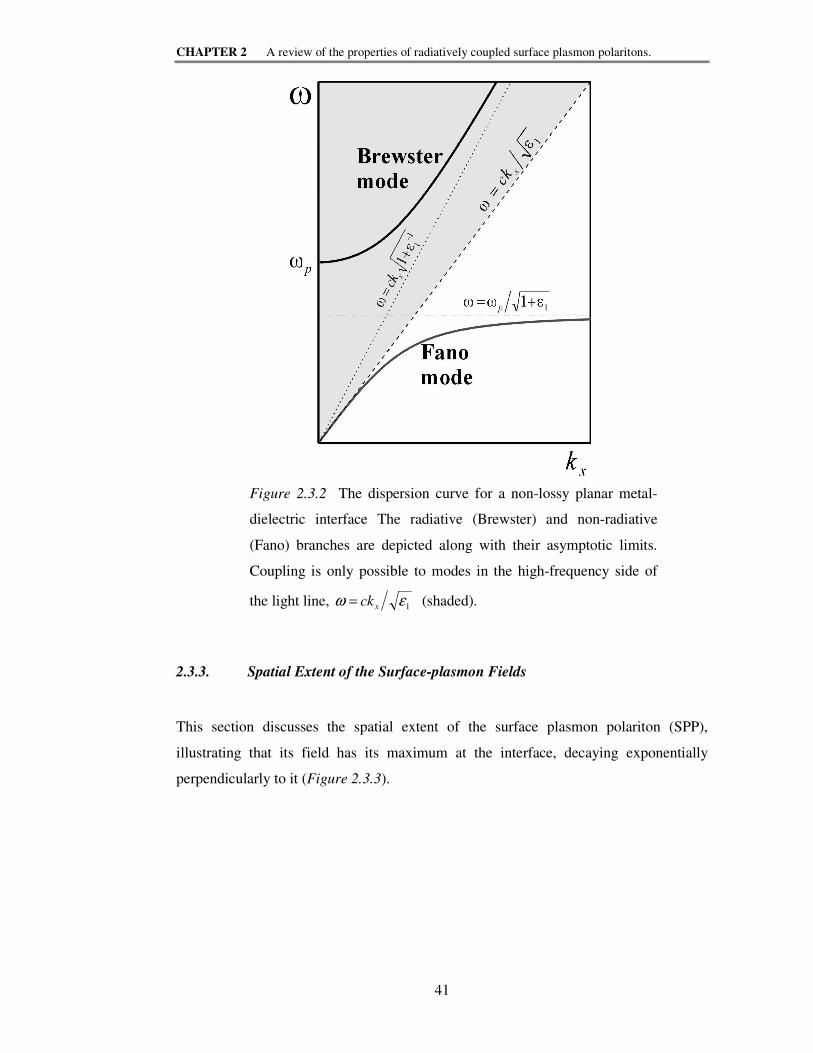
CHAPTER 2 A review of the properties of radiatively coupled surface plasmon polaritons.
41
2.3.3. Spatial Extent of the Surface-plasmon Fields
This section discusses the spatial extent of the surface plasmon polariton (SPP),
illustrating that its field has its maximum at the interface, decaying exponentially
perpendicularly to it (Figure 2.3.3).
Figure 2.3.2 The dispersion curve for a non-lossy planar metal-
dielectric interface The radiative (Brewster) and non-radiative
(Fano) branches are depicted along with their asymptotic limits.
Coupling is only possible to modes in the high-frequency side of
the light line, 1εω xck= (shaded).
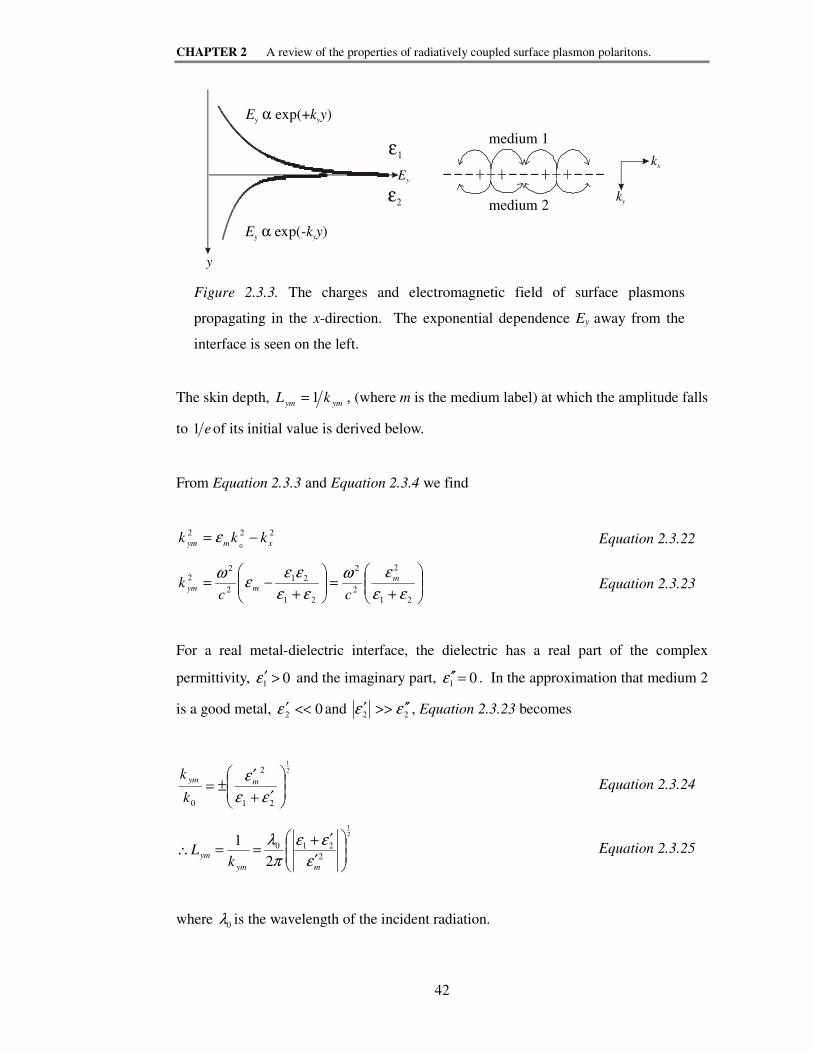
CHAPTER 2 A review of the properties of radiatively coupled surface plasmon polaritons.
42
E k yy exp(+ )α y
E k yy exp(- )α y
medium 1
medium 2
ε1
ε2
kx
ky
Ey
y
Figure 2.3.3. The charges and electromagnetic field of surface plasmons
propagating in the x-direction. The exponential dependence Ey away from the
interface is seen on the left.
The skin depth, ymym kL 1= , (where m is the medium label) at which the amplitude falls
to 1 e of its initial value is derived below.
From Equation 2.3.3 and Equation 2.3.4 we find
222
0 xmym kkk −= ε Equation 2.3.22
+=
+−=
21
2
21
21
εε
εω
εε
εεε
ω m
mymcc
k2
2
2
22
Equation 2.3.23
For a real metal-dielectric interface, the dielectric has a real part of the complex
permittivity, 01 >′ε and the imaginary part, 01 =′′ε . In the approximation that medium 2
is a good metal, 02 <<′ε and 22 εε ′′>>′ , Equation 2.3.23 becomes
2
1
2
0
′+
′±=
21 εε
ε mym
k
k Equation 2.3.24
2
1
2
0
2
1
′
′+==∴ 21
mym
ymk
Lε
εε
π
λ Equation 2.3.25
where λ0 is the wavelength of the incident radiation.

CHAPTER 2 A review of the properties of radiatively coupled surface plasmon polaritons.
43
For example, gold at a wavelength of 630 nm gives Ly1 314= nm, and Ly2 29= nm,
while silver gives 4081 =yL nm and 232 =yL nm [ εAu = − +10 8 147. . i ,
i67.06.17Ag +−=ε , Schröder (1981)].
It is clear that when medium 2 is an ideal metal ( −∞→′2ε ), then, as expected there is
no penetration of the electric field into the metal ( Ly2 = 0). In addition, perhaps
surprisingly, 1yL becomes infinite as −∞→′2ε . However this is sensible because as
−∞→′2ε , the dispersion relation (Equation 2.3.8) tends to ck=ω and becomes more
light-like. This confirms the result discussed in the previous section (2.3.2) that the
mode is no longer confined to the interface, but behaves more like a bulk polariton
propagating in the dielectric.
The absorption of the metal causes the intensity of the SPP propagating along the
interface to decay as )2exp( xk x′′− , where
xk ′′ is the imaginary part of the wave vector
along the interface. Hence the length Lx at which the intensity decreases by a factor
1 e is given by
x
xk
L′′
=2
1 Equation 2.3.26.
By substituting 222 for εεε ′′+′ i in Equation 2.3.8, we have
( ) 2
1
221
221
0
′′+′+
′′+′=
εεε
εεε
i
ikk x Equation 2.3.27
where xxx kikk ′′+′= and k0
2
0= π
λ .
The imaginary part of kx is given by
CHAPTER 2 A review of the properties of radiatively coupled surface plasmon polaritons.
44
2
2
23
12
0 ε
εε
λ
π
′
′′=′′
xk Equation 2.3.28
23
12
2
20
εε
ε
π
λ
′′
′
2=∴ xL Equation 2.3.29
Using the values of the permittivity of gold and silver at a wavelength of 630 nm
[determined by Schröder (1981)] we have Lx = 8 µm and 46=xL µm respectively.
2.4. Excitation of Surface Plasmons
The excitation and the subsequent possible detection of surface plasmons was first
predicted to occur in the characteristic energy loss experiments of fast electrons
reflecting from the surface of metals [Pines and Bohm (1952)]. Electrons passing
through a solid will transfer some of their momentum and energy to the electrons of the
solid. The component of this momentum along the surface of a metal film may be used
to excite a surface plasmon at the interface if the amplitude of the momentum available
is large enough. As discussed previously, Powell et al. (1958 & 1960) detected the
decay of excited surface plasmons after having bombarded a metal film with high-
energy electrons. Teng and Stern (1967) used a grating to impart additional momentum
to the surface plasmon and mapped the dispersion curve. However, because of the
difficulty in obtaining a sufficiently small aperture of the electron beam, it was only
possible to determine the dispersion curve for high values of kx. However, Ritchie et
al.(1968) successfully managed to obtain a complete map of the dispersion curve by
using a grating surface to couple optically into the surface plasmon mode.
As discussed in Section 2.3.2, a photon cannot transform into a SPP without some form
of momentum enhancement. There are two ways in which this may be achieved and
they as discussed in the following subsections.
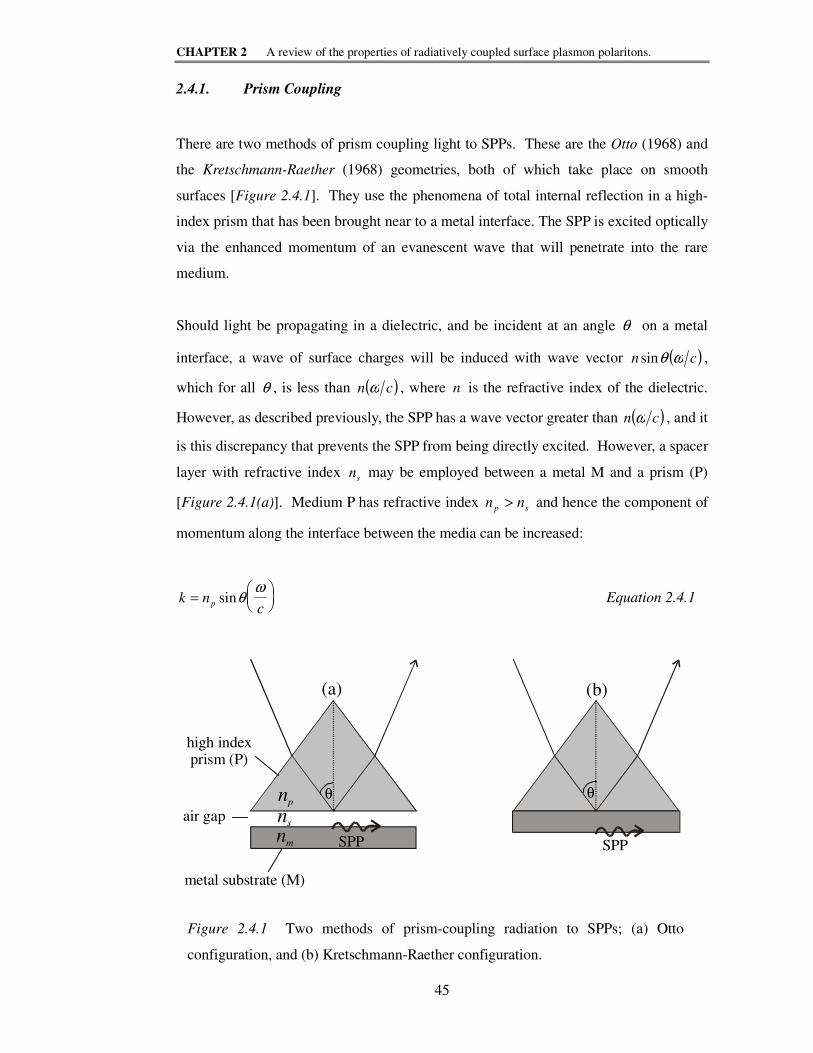
CHAPTER 2 A review of the properties of radiatively coupled surface plasmon polaritons.
45
2.4.1. Prism Coupling
There are two methods of prism coupling light to SPPs. These are the Otto (1968) and
the Kretschmann-Raether (1968) geometries, both of which take place on smooth
surfaces [Figure 2.4.1]. They use the phenomena of total internal reflection in a high-
index prism that has been brought near to a metal interface. The SPP is excited optically
via the enhanced momentum of an evanescent wave that will penetrate into the rare
medium.
Should light be propagating in a dielectric, and be incident at an angle θ on a metal
interface, a wave of surface charges will be induced with wave vector ( )cn ωθsin ,
which for all θ , is less than ( )cn ω , where n is the refractive index of the dielectric.
However, as described previously, the SPP has a wave vector greater than ( )cn ω , and it
is this discrepancy that prevents the SPP from being directly excited. However, a spacer
layer with refractive index ns may be employed between a metal M and a prism (P)
[Figure 2.4.1(a)]. Medium P has refractive index sp nn > and hence the component of
momentum along the interface between the media can be increased:
k nc
p=
sinθ
ω Equation 2.4.1
θ
SPP
θ
SPP
metal substrate (M)
high indexprism (P)
air gap
(a) (b)
np
ns
nm
Figure 2.4.1 Two methods of prism-coupling radiation to SPPs; (a) Otto
configuration, and (b) Kretschmann-Raether configuration.
CHAPTER 2 A review of the properties of radiatively coupled surface plasmon polaritons.
46
If the angle of incidence, θ, at the prism/dielectric(air) interface is greater than the
critical angle, such that only an evanescent field penetrates into the spacer layer, the
electromagnetic field will be able to couple to the SPP at the metal interface if the
increased momentum of the evanescent field is equal to kSPP . This is an attenuated total
reflection (ATR) technique and was first utilised by Otto (1968). The coupling strength
is determined by the width of the air gap and optimum coupling is achieved for a gap
width of the order of the incident wavelength. This is difficult to achieve for
experiments at visible wavelengths since the dimensions of dust particles are much
larger than the width of the spacer layer. However, in the infra-red, the optimum gap
width required becomes more practical (Bradberry et al, 1988).
The configuration shown in Figure 2.4.1(b) was first demonstrated by Kretschmann and
Raether (1968) and involves evaporating a thin metal film directly on to the surface of
the prism. The low index gap is now provided by the metal layer itself. The evanescent
fields pass through the film and excite a SPP on the bottom surface of the metal. Since
the metal has a much higher optical impedance than air, optimum coupling at visible
wavelengths may be achieved for a film thickness of approximately 45 nm.
To summarise, the ATR-coupling technique utilises the higher pseudo-momentum
obtainable in a prism, to couple to a SPP on a metal surface via the evanescent wave in a
low-index layer. Coupling to the SPP via the ATR technique is therefore only possible
in the frequency region that lie between lines (a) and (b) in Figure 2.4.2 below.

CHAPTER 2 A review of the properties of radiatively coupled surface plasmon polaritons.
47
2.4.2. Grating Coupling
As discussed previously, SPPs are non-radiative, however coupling between surface and
bulk polaritons can take place when the surface is rough. Since a rough surface
corresponds to a superposition of a number of different gratings, the physics underlying
the coupling of SPPs to bulk polaritons at a rough interface is essentially the same as
that via a single corrugation. Therefore only the phenomenon of grating-induced SPP
coupling will be discussed.
Wood first observed coupled SPPs using the grating configuration in 1902. Incident
radiation at an angle θ with respect to the normal of the average plane of the surface can
scatter from the grating, increasing or decreasing the component of its wave vector by
integer multiples of the grating wave vector gk ( kg g= 2π λ ). This gives rise to
diffracted orders. When a diffracted order has a wave vector greater than that of the
incident grazing radiation in medium 1 )]([ 101 ckn ωε= it will not propagate and will
become evanescent. It is the enhanced momentum of these evanescent fields that may
couple radiation to the SPP according to the coupling condition
k
ω
a.
= ( /c)k ns ωkSPP
b.
= ( /c)k np ω
Figure 2.4.2 Dispersion of a SPP at a metal-dielectric interface (schematic). Lines
(a) and (b) illustrate the dispersion of plane waves in the spacer layer (S) and the high
index prism (P) respectively where sn is the refractive index of the medium. Only
photons (polaritons) with momenta that lie between lines (a) and (b) may couple to
SPPs.

CHAPTER 2 A review of the properties of radiatively coupled surface plasmon polaritons.
48
gSPP Nn kkk ±= θsin01 Equation 2.4.2
where N is an integer and 11 ε=n is the refractive index of medium 1. Hence it is
conventional to label the SPP with the diffracted order that provides the coupling
mechanism. When the grating is mounted such that the grating wave vector is parallel
with the plane of incidence, all three vectors are collinear. For this situation, Figure
2.4.3 illustrates schematically the effect that corrugating the surface has on the
dispersion relation. The periodicity of the surface is represented as a 1-D lattice with
spacing kg , the grating wave vector. The lattice points are scattering centres which may
add or subtract momentum from the incident photon in integer multiples of kg .
Radiative coupling using p-polarised (TM) incident light to the SPP can now be
achieved since there exists diffracted regions of the dispersion curve within the light
lines (shaded). (Note that by corrugating the surface, strictly the planar dispersion
relation can no longer be used. However, in the small amplitude limit, Equation 2.3.8 is
a good approximation.)
3/2kg- /32kg
1/2kg- /12kg kg-kg 2kg
-2kg
light line
( / )k = cx 1ε ω1/2
kx
ω
(-1,1)
(-1,2)
(-1,3)
(-2,1)
(1,-3) (-2,2)
(-2,3)(-3,2)(-3,3)
Figure 2.4.3 The dispersion curve for grating coupled SPPs which has been
reflected at the Brillouin zone boundaries. Parts of the scattered dispersion curves
that fall between the light lines (shaded) can be radiatively coupled. A number of
the crossing points of the dispersion relations within the shaded area are labelled
in units of kg according to the coupling mechanisms involved.

CHAPTER 2 A review of the properties of radiatively coupled surface plasmon polaritons.
49
If the azimuthal angle, (ϕ) defined as the angle between the plane of incidence and the
grating wave vector, is not equal to zero, then 0 , kk SPP and gk are no longer collinear
and the scalar equivalent of Equation 2.4.2 becomes
ϕθθ cossin2sin 01
2222
0
2
1
2 kNknkNknk ggSPP ±+= Equation 2.4.3.
The coordinate system used throughout this thesis to describe the orientation of the
grating is illustrated in Figure 2.4.4 below. The polar angle, θ, is used to describe the
angle of incidence measured from the normal to the average plane of the grating; the
azimuthal angle, ϕ, describes the rotation of the plane of incidence from the positive x-
axis. The x-axis runs perpendicularly to the direction of the grating grooves (parallel to
the grating wave vector), and ϕ is measured in the x-z plane. The polarisation is defined
with respect to the plane of incidence, i.e. p-polarised radiation (TM: transverse
magnetic) has its electric vector in the plane of incidence, s-polarised radiation (TE:
transverse electric) has its electric vector orthogonal to it.
Figure 2.4.4 Grating geometry and coordinate system used
throughout this thesis. The direction of the electric field vector (E) is
illustrated for the situation when p-polarised (TM) radiation is
incident.
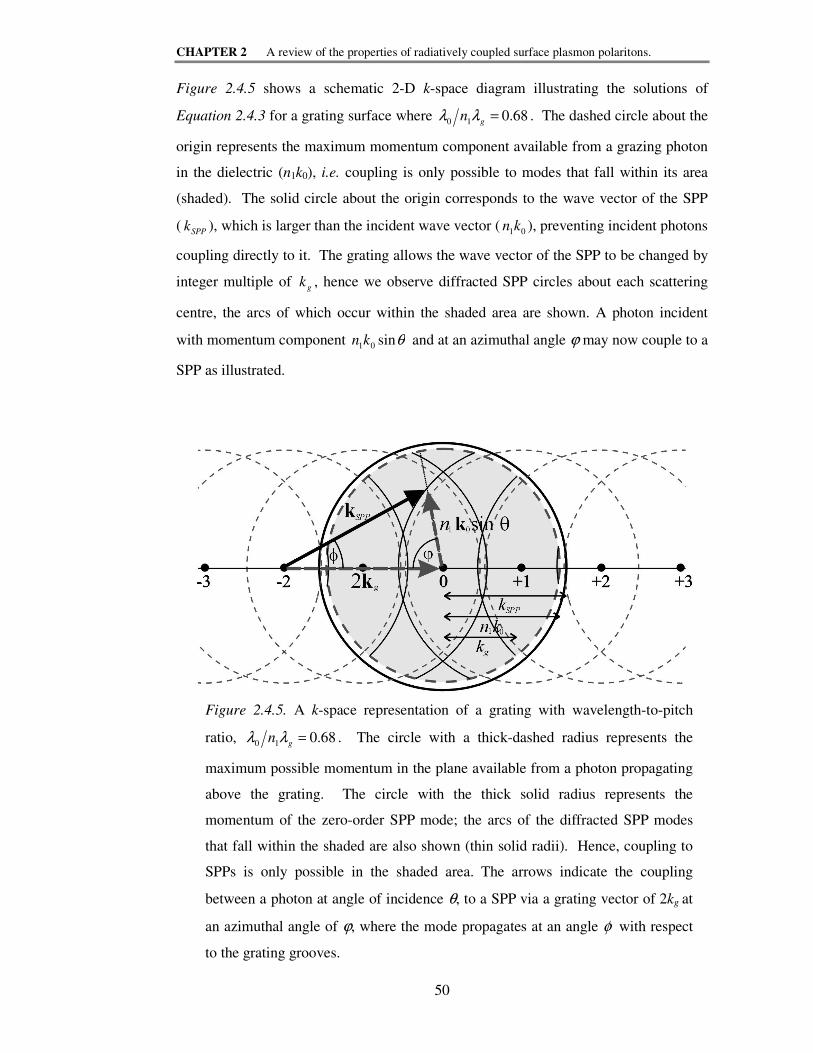
CHAPTER 2 A review of the properties of radiatively coupled surface plasmon polaritons.
50
Figure 2.4.5 shows a schematic 2-D k-space diagram illustrating the solutions of
Equation 2.4.3 for a grating surface where 68.010 =gn λλ . The dashed circle about the
origin represents the maximum momentum component available from a grazing photon
in the dielectric (n1k0), i.e. coupling is only possible to modes that fall within its area
(shaded). The solid circle about the origin corresponds to the wave vector of the SPP
( kSPP ), which is larger than the incident wave vector ( 01kn ), preventing incident photons
coupling directly to it. The grating allows the wave vector of the SPP to be changed by
integer multiple of kg , hence we observe diffracted SPP circles about each scattering
centre, the arcs of which occur within the shaded area are shown. A photon incident
with momentum component θsin01kn and at an azimuthal angle ϕ may now couple to a
SPP as illustrated.
Figure 2.4.5. A k-space representation of a grating with wavelength-to-pitch
ratio, 68.010 =gn λλ . The circle with a thick-dashed radius represents the
maximum possible momentum in the plane available from a photon propagating
above the grating. The circle with the thick solid radius represents the
momentum of the zero-order SPP mode; the arcs of the diffracted SPP modes
that fall within the shaded are also shown (thin solid radii). Hence, coupling to
SPPs is only possible in the shaded area. The arrows indicate the coupling
between a photon at angle of incidence θ, to a SPP via a grating vector of 2kg at
an azimuthal angle of ϕ, where the mode propagates at an angle φ with respect
to the grating grooves.
CHAPTER 2 A review of the properties of radiatively coupled surface plasmon polaritons.
51
2.5. Polarisation Conversion
Since Wood’s first experimental observations of the dark bands in the reflected spectra
from ruled gratings in 1902, it has been known that the “anomalies” may only be
recorded when the direction of the electric-field vector is perpendicular to the direction
of the grating grooves. However, this is only true when the grating grooves are
perpendicular to the plane of incidence ( )°±= 1800ϕ [Beaglehole (1968)]. Recent
advances in the modelling techniques (to be discussed in the next chapter) have
permitted the exploration of polarisation conversion in geometries where the grating has
been rotated. When orientated in this way, the grating is said to be in the conical
mount.
Unlike other optical coupling mechanisms, diffraction gratings may couple both
orthogonal polarisations to SPPs. Bryan-Brown et al. (1990) demonstrated that for
small amplitude, non-blazed gratings, an increase in the azimuthal angle from °= 0ϕ to
°= 90ϕ , results in the coupling efficiency to p-polarised radiation being reduced, while
at the same time producing some s-polarisation component in the reflected beam. When
the grating grooves are at 45° to the plane of incidence, maximum p-to-s conversion is
obtained and if the grating is rotated by a further 45° in azimuth, they observed coupling
to the SPP via only s-polarised radiation. Generally, the coupling of each polarisation
to the SPP follows a ϕ2sin dependence, varying between zero and a maximum over an
azimuthal angle range of 90°. These results have been reproduced theoretically by
Elston et al. (1991a and b). However, the work of Bryan-Brown et al. (1990)
considered only a small amplitude grating. Although it has generally been considered
that coupling to the SPP with p-polarised radiation at °= 90ϕ is not possible, a recent
study by Watts et al. (1997c) has shown this to be untrue for sufficiently deep gratings.
In addition, Chapter 9 illustrates that coupling to a SPP mode using p-polarised
radiation via a grating orientated at °= 90ϕ is also possible by using a dielectric grating
on a metal substrate.
Polarisation conversion is achieved as a result of breaking the symmetry of the system
in which the electric fields of the SPP mode supported at the surface of the grating do
not lie in the plane of incidence. In propagating across the grooves, a tilted component

CHAPTER 2 A review of the properties of radiatively coupled surface plasmon polaritons.
52
of the surface plasmon electric vector will exist on rising up or dropping down the side
of a groove. This component cannot be in the incident plane and hence, although the
SPP is always transverse magnetic in character (if excited in isotropic media), we have
created ‘s’ character in its radiation field. Hence, in the conical mount, when SPPk is no
longer collinear with gk the out-coupled SPP will consist of both p- and s-polarised
components.
2.6. Photonic Energy Gaps in the Propagation of SPPs on Gratings
In a similar way to the electrons in a crystal, energy gaps open up in the dispersion
relation of surface plasmon polaritons propagating along a corrugated metal-dielectric
interface. Work by Yablonovitch (1987 and 1993) predicted and demonstrated, in the
microwave regime, the existence of photonic band gaps in a three-dimensional structure
with refractive index modulations that are periodic on the scale of the wavelength of the
incident radiation. Such a material is called a photonic crystal. Likewise, the surface of
a diffraction grating may also be regarded as a 1-D (single-grating) or 2-D (bi-grating)
photonic crystal. Grating induced photonic bandgaps were first reported by Ritchie et
al. in 1968, and later by Chen et al. (1983) who recorded their magnitudes. Photonic
crystals are currently attracting much interest due to the potential they offer to control
spontaneous emission, for example in laser diodes and light-emitting diodes. [e.g.
Kitson et al. (1998)].
Consider a SPP propagating perpendicular to the grooves on a metallic grating with
pitch ggk λπ2= and profile given by
…
…
+Φ++
+Φ++Φ+=
)sin(
)2sin()sin()( 2211
NgN
gg
xNka
xkaxkaxA Equation 2.6.1
where Naaa ,... , 21 are the amplitudes of the harmonic components of the corrugation,
and N21 ,... , ΦΦΦ are the relative phases (this presentation will be discussed in more
detail in Chapter 3). When radiation is incident upon such a distorted grating with a
finite first harmonic component, the gk2 wave vector will result in the forward and
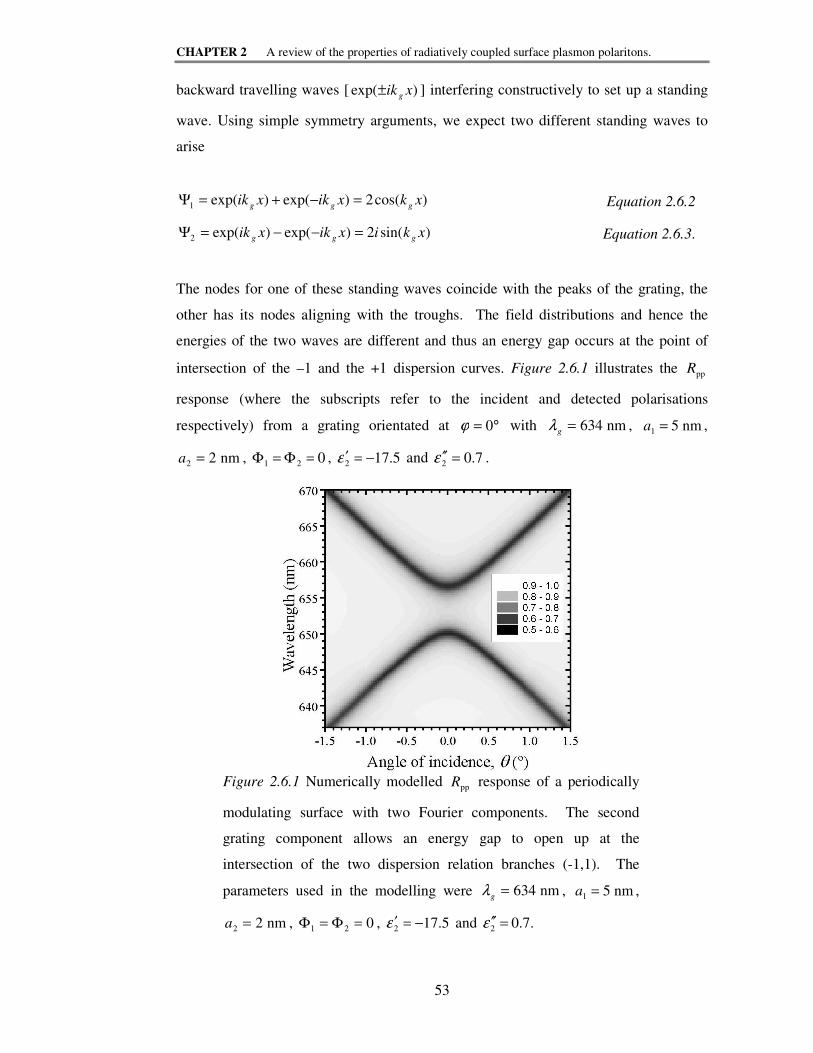
CHAPTER 2 A review of the properties of radiatively coupled surface plasmon polaritons.
53
backward travelling waves [ )exp( xik g± ] interfering constructively to set up a standing
wave. Using simple symmetry arguments, we expect two different standing waves to
arise
)cos(2)exp()exp(1 xkxikxik ggg =−+=Ψ Equation 2.6.2
)sin(2)exp()exp(2 xkixikxik ggg =−−=Ψ Equation 2.6.3.
The nodes for one of these standing waves coincide with the peaks of the grating, the
other has its nodes aligning with the troughs. The field distributions and hence the
energies of the two waves are different and thus an energy gap occurs at the point of
intersection of the –1 and the +1 dispersion curves. Figure 2.6.1 illustrates the ppR
response (where the subscripts refer to the incident and detected polarisations
respectively) from a grating orientated at °= 0ϕ with λg = 634 nm , a1 5= nm ,
a2 2= nm , 021 =Φ=Φ , 5.172 −=′ε and 7.02 =′′ε .
Figure 2.6.1 Numerically modelled ppR response of a periodically
modulating surface with two Fourier components. The second
grating component allows an energy gap to open up at the
intersection of the two dispersion relation branches (-1,1). The
parameters used in the modelling were λg = 634 nm , a1 5= nm ,
a2 2= nm , 021 =Φ=Φ , 5.172 −=′ε and .7.02 =′′ε
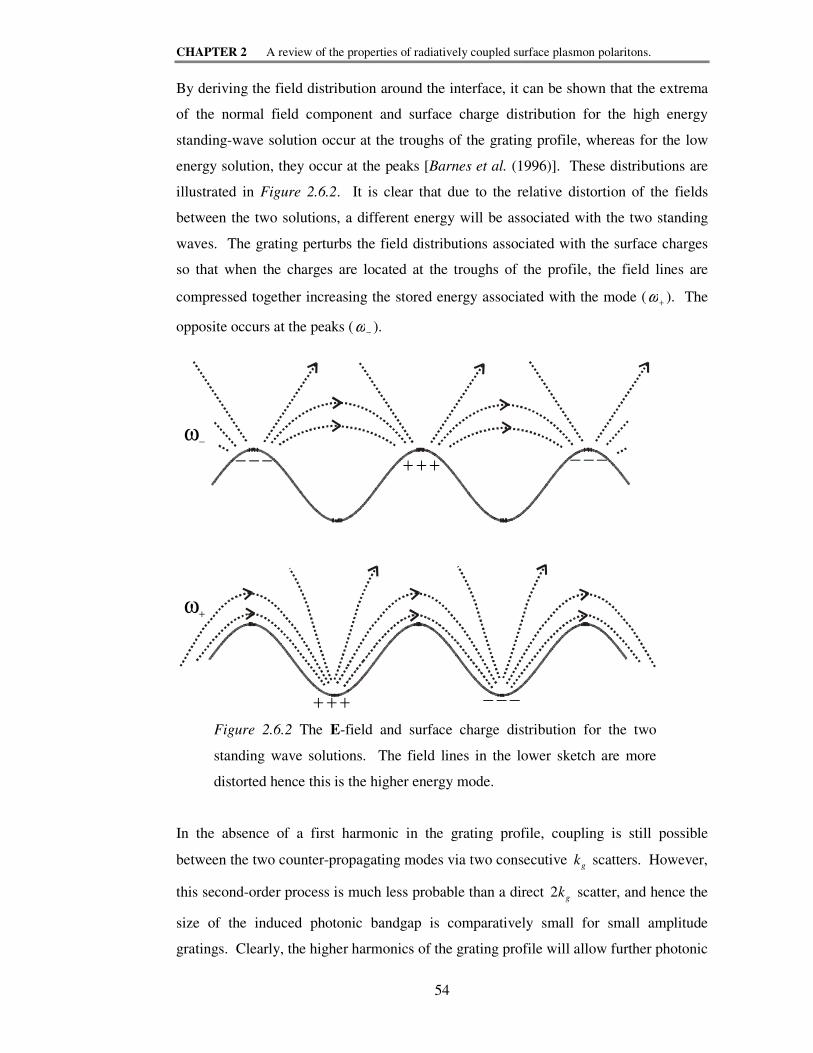
CHAPTER 2 A review of the properties of radiatively coupled surface plasmon polaritons.
54
By deriving the field distribution around the interface, it can be shown that the extrema
of the normal field component and surface charge distribution for the high energy
standing-wave solution occur at the troughs of the grating profile, whereas for the low
energy solution, they occur at the peaks [Barnes et al. (1996)]. These distributions are
illustrated in Figure 2.6.2. It is clear that due to the relative distortion of the fields
between the two solutions, a different energy will be associated with the two standing
waves. The grating perturbs the field distributions associated with the surface charges
so that when the charges are located at the troughs of the profile, the field lines are
compressed together increasing the stored energy associated with the mode ( +ω ). The
opposite occurs at the peaks ( −ω ).
In the absence of a first harmonic in the grating profile, coupling is still possible
between the two counter-propagating modes via two consecutive kg scatters. However,
this second-order process is much less probable than a direct gk2 scatter, and hence the
size of the induced photonic bandgap is comparatively small for small amplitude
gratings. Clearly, the higher harmonics of the grating profile will allow further photonic
+++--- ---
ω−
+++ ---
ω+
Figure 2.6.2 The E-field and surface charge distribution for the two
standing wave solutions. The field lines in the lower sketch are more
distorted hence this is the higher energy mode.

CHAPTER 2 A review of the properties of radiatively coupled surface plasmon polaritons.
55
band gaps to open up. For example Chen et al, (1983) studied the gaps that open up at
the crossing of the (-1,2), (-2,2), (-1,3), (-2,3) and (-1,4) diffracted dispersion curves
requiring scatters of up to 5 kg .
2.6.1. False Momentum Gaps
Work by Heitmann et al., (1987) and Celli et al. (1988) amongst others suggested the
existence of momentum gaps in addition to the energy gaps described above. However
it has since been established that there are no momentum gaps for the propagation of
SPPs and the false k-gaps are actually due to an over-coupled mode [Weber and Mills
(1996)]. The zeroth order reflected beam from a grating comprises a component due to
specular reflection and one due to re-radiated SPP emission. When the SPP is optimally
coupled, the reflected and re-radiated components are equal in magnitude and exactly in
anti-phase, hence they interfere resulting in a zero in the net reflectivity. Suppose that
an experimental geometry is chosen such that two perfectly coupled modes exist on
either side of a crossing point. As they are brought closer together in frequency the two
100% coupled modes will overlap. Clearly in the region where they coalesce, the
reflectivity minimum cannot become deeper, and instead the re-radiated SPP component
becomes greater than the specularly reflected component, and the reflectivity is seen to
rise. There now appears to be a reflectivity maximum between the two weaker minima
and a “momentum gap” has appeared.
2.6.2. Coupling to the high and low energy branches
The strength of coupling to the SPP modes at the centre of the band gap (i.e. at the
Brillouin zone edge) is determined by the relative phase, compared with the
fundamental, of the Fourier coefficient involved in setting up the standing wave. For
example, in the region of the (1,-1) gap, the relative phase of the first harmonic
component ( 2Φ ) is important. When the surface is blazed (i.e. 02 =Φ ) there is equal
coupling between the two SPP branches. However when the surface profile is non-
blazed ( °±=Φ 902 ) the coupling strengths of one of the branches is reduced to zero in
the proximity of the centre of the gap (Weber and Mills, 1985; Nash et al., 1995; Barnes
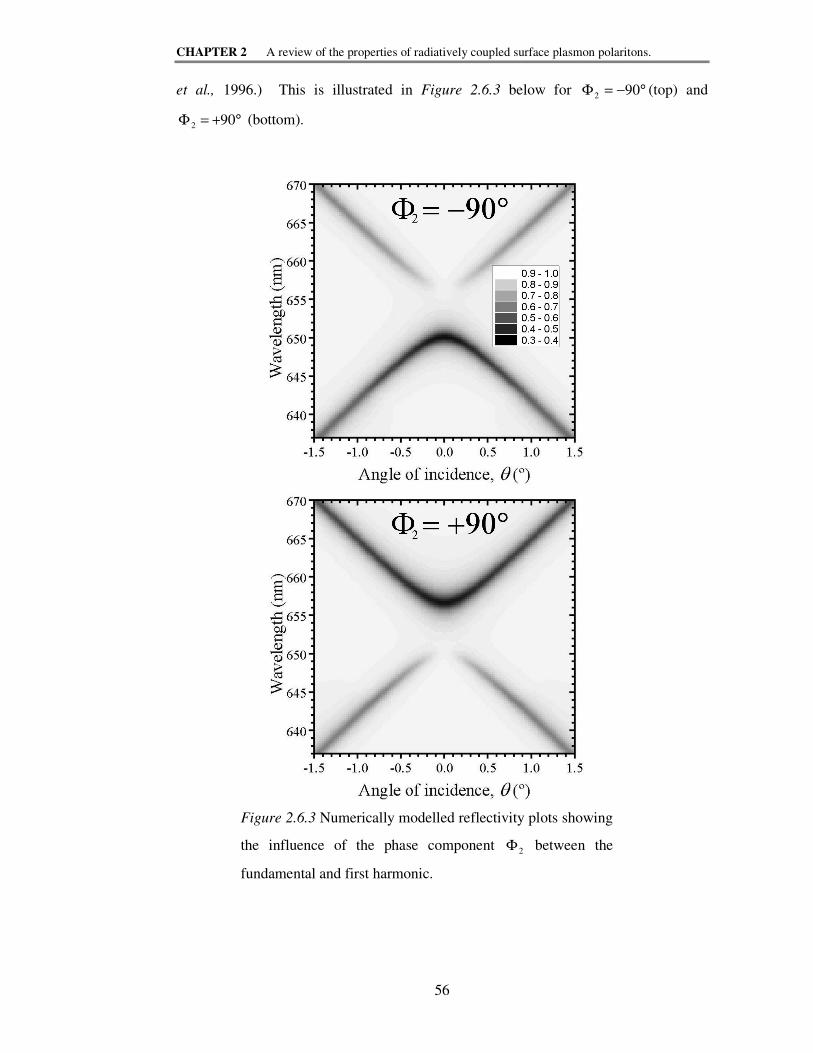
CHAPTER 2 A review of the properties of radiatively coupled surface plasmon polaritons.
56
et al., 1996.) This is illustrated in Figure 2.6.3 below for °−=Φ 902 (top) and
°+=Φ 902 (bottom).
Figure 2.6.3 Numerically modelled reflectivity plots showing
the influence of the phase component 2Φ between the
fundamental and first harmonic.

CHAPTER 2 A review of the properties of radiatively coupled surface plasmon polaritons.
57
In order to experimentally demonstrate these results, Nash et al., (1995) manufactured a
non-blazed, distorted sinusoid, 800 nm pitch, gold coated grating and recorded angle
dependent data at a number of different wavelengths. The symmetry of the surface
( °+=Φ 902 ) resulted in the high-energy branch of the dispersion curve exhibiting zero
coupling in the gap region. A replica of this grating was made by pressing the warmed
original substrate into Perspex, producing a profile with °−=Φ 902 . The replica was
shown to have the opposite response, showing no coupling to the low energy branch of
the split dispersion curve.
For coupling to occur at the (1,-1) crossing point between incident photons at θ = 0º,
and the standing wave, there must be a component of the incident E-field normal to the
surface at the required points of the profile to generate the necessary surface charge.
When °−=Φ 902 , [Figure 2.6.4(a)] the peaks of the gk2 component (dashed line) of
the Fourier series correspond to flat regions of the grating profile and hence coupling to
the branch whose field maxima occur at the peaks of the profile of the first harmonic is
impossible. Similarly, when °+=Φ 902 , it will be the branch with field maxima at the
troughs that is uncoupled [Figure 2.6.4(b)]. However, when ϕ2 0= ° the peaks and
troughs of the 2 kg component occur at equivalent points with respect to the grating
profile and hence the coupling is the same for both branches [Figure 2.6.4(c)]
Φ = 90°2 -
Φ =+90°2
(a)
Φ =0°2(c)
(b)
Figure 2.6.4 The kg (solid) and 2kg (dotted) components of a distorted sinusoidal
grating with relative phases 90 ,902 °+°−=Φ and °0 .
CHAPTER 2 A review of the properties of radiatively coupled surface plasmon polaritons.
58
2.7. Summary
The work presented in this chapter has introduced the surface plasmon polariton (SPP)
as a longitudinal oscillation of surface charge density at the interface of a metal and a
dielectric. By deriving the dispersion of the mode on a planar interface, it is shown that
the mode is non-radiative with exponentially decaying fields into the surrounding
media. Methods of enhancing the momentum of the incident field in order to achieve
radiative coupling to the SPP have been discussed, with particular attention to grating
coupling. This strong confinement of the mode at the interface results in the dispersion
of the mode being extremely sensitive to the boundary along which it propagates and
the media surrounding it; this characteristic will be discussed in the following chapter.
Finally, the phenomenon of SPP induced polarisation conversion has been briefly
discussed and the existence of energy gaps in the dispersion of grating coupled SPPs
has been explained.

CHAPTER 3 The influence of the interface profile and properties of the surrounding media on the
reflectivity from a grating sample.
59
CHAPTER 3
The influence of the interface profile and
properties of the surrounding media on the
reflectivity from a grating sample.
3.1. Introduction
The strong confinement of the SPP at the interface of a metal and a dielectric has been
discussed in the previous chapter. The propagation of the mode, and therefore the
shape and position of its resonance, are extremely sensitive to the properties of the
interface and its surroundings, and it is for this reason that over the last 30 years this has
been exploited for uses in many applications. These have included gas and bio-sensing
[e.g. Nylander et al. (1982) and Jory et al. (1994)], optical switching and more
generally, the characterisation of media, overlayers and the functional form of the
grating profile [e.g. Rosengart and Pockrand (1977), Bryan Brown et al. (1993) and
Watts et al. (1997a)]. In general, these parameters may be obtained by recording the
reflectivity from the sample as a function of angle of incidence and/or wavelength, and
“fitting” the data to a suitable modelling theory.
The work presented in this thesis describes experiments undertaken both at visible
frequencies and in the microwave regime. Surface relief gratings for use at visible
frequencies (including those used in the studies presented in Chapters 4, 5 and 6) are
commonly manufactured by the interferographic exposure of photoresist [Hutley
(1982)]. The chemical is spun down onto a glass substrate and the grating is written by
exposing the layer to two expanded, collimated beams of coherent ultra-violet radiation.
As a result of the exposure, the chemical composition of the photoactive compound
changes. Regions of the layer illuminated by the beam are rendered more soluble in a
developer and hence the variation may be converted into a spatial profile on the
substrate. Exposing the developed sample to 254 nm radiation cross-links the polymer,
and baking of the substrate completes the hardening process. A more robust sample
may then be prepared by ion- or atom-beam etching the profile through from the

CHAPTER 3 The influence of the interface profile and properties of the surrounding media on the
reflectivity from a grating sample.
60
photoresist into the silica-glass beneath. Finally, in order to actually excite the SPP
with incident electromagnetic radiation, and observe its resonance, it is necessary to
coat the grating with a metal.
Although the interfering beams create a perfect sinusoidal image in the photoresist, the
final gratings are significantly distorted from this ideal profile. This is associated with
the non-linear response of photoresist to exposure as a function of time, and the
difficulty in fully removing the exposed photoresist at the bottom and sides of the
grooves in the development process. In addition, the etching rate of photoresist is
known to vary with the angle of incidence and therefore the grating’s profile, and the
sputtering or thermal evaporation of metal onto the grating will introduce further
deviations. It is therefore vital, that in order to accurately predict the reflectivity from a
grating, any modelling theory must be able to represent the deviation from the purely
sinusoidal case. A significant part of this chapter is therefore dedicated to the
discussion of such distortions of the surface profile.
The experiments described in this thesis are not only undertaken at visible wavelengths,
but also in the microwave regime. For these wavelengths, it is much easier to
manufacture a perfect sample via computer-aided design techniques. However, metals
become much more ideal in the microwave regime, and hence the response from a near-
perfectly-conducting sample is considered. Such modelling experiments illustrate the
need to increase the depth-to-pitch ratio of the grating to observe the resonance of the
SPP, and hence the effects of increasing the fundamental amplitude of the corrugation
are described. In addition the use of dielectric overlayers are discussed.
3.2. Grating modelling theories
In Chapter 2, a historical overview of experimental observations of the SPP is provided.
Here, we briefly discuss some of the developments made in theoretically reproducing
these “anomalous” results. However, it should be appreciated that, even today,
predicting the reflectivity from gratings often requires much computing time. Hence the
rigorous fitting of the theory to the experimental data in order to obtain the surface
parameters has only really become practical within the last ten years.

CHAPTER 3 The influence of the interface profile and properties of the surrounding media on the
reflectivity from a grating sample.
61
In order to rigorously model the electromagnetic response of an interface Maxwell’s
equations must be solved in both the upper and lower media, and the appropriate
boundary conditions must be satisfied. These are:
1. The continuity of the tangential E- and H-fields at any interface.
2. The outgoing wave equation, i.e. all fields remain finite as ∞→y .
The modelling theory used to predict the electromagnetic response from the sample in
this work is based on an approach developed by Chandezon et al. in 1982. However it
was Lord Rayleigh (1907) who proposed the first rigorous approach. He assumed that
the various diffracted orders were coupled together by a boundary condition on the
surface of a perfectly conducting grating. Rayleigh expresses the field far away from
the grating as a series of outgoing plane waves of constant amplitude, while close to the
surface he also takes account of evanescent waves whose amplitudes decrease
exponentially with distance away from the interface.
Rayleigh’s theory was able to correctly predict the point at which a diffracted order
passes from being real and propagating in the dielectric, to being evanescent in the
metal. However, it fails to predict the surface plasmon resonances observed by Wood
and the Rayleigh anomalies observed in the reflected TE-spectra from deep metallic
diffraction gratings by Palmer (1952). This is because his method is only valid for
shallow gratings with pitch-to-depth ratios of up to 0.07 [Petit and Cadilhac (1966)].
His theory does not take into account the effect of the incident field in the space within
the grating grooves. This will act as to induce circulating currents at the surface of the
grating and these in turn generate travelling electromagnetic waves. Clearly this
problem becomes more significant as the grating grooves are made deeper. In addition,
since his theory makes the assumption that the metal is perfectly conducting, the surface
plasmon resonances would have been very difficult to observe since they will occur at
the same angular position as the Rayleigh anomaly (Section 3.7). Restricting the system
to shallow grooves will result in modes that are under-coupled and extremely narrow. It
was perhaps for this reason that the two anomalies were often considered to be artefacts
of the same physical phenomenon at this time.
CHAPTER 3 The influence of the interface profile and properties of the surrounding media on the
reflectivity from a grating sample.
62
In fact, up until the mid-1960s all grating theories generally assumed the metal to be
perfectly conducting. In order to correct the results for the effects of finite conductivity,
the theoretical results were simply multiplied by the reflectance from a planar slab of
the same material. Of course, this assumption is not always valid, as indicated by
Häglund and Sellberg in 1966 who showed that in the region of the resonance of a SPP,
a significant proportion of the radiation incident upon a metallic grating does not leave
the surface. Hence the dark bands, similar to those first observed in the TM reflectivity
spectrum from ruled speculum metal gratings by Wood in 1902, were not obviously
apparent in theories up to this time.
However, in 1965 Hessel and Oliner presented the first theory that confirmed that there
are in fact two distinct types of anomaly. They successfully predicted the Wood’s
anomaly by describing it as a resonance effect where a guided wave propagates along
the surface. In addition, their theory predicted the existence of the Rayleigh anomaly
(pseudo-critical edge - due to the passing off of higher diffracted orders) for both
incident polarisations. Since it employs a surface reactance boundary condition that
takes into account the standing waves within the grooves, it is valid for all types of
media, and for shallow and deep gratings alike.
The results of Häglund and Sellberg described above were later reproduced in a new
integral formalism developed by Maystre (1973), based on the Rayleigh expansion and
also taking into account forward scattering within the grooves and the finite
conductivity of the metal. In addition, Hutley and Bird (1973) and McPhedran and
Maystre (1974) confirmed the results in comprehensive experimental and theoretical
studies. However, in the microwave regime, it is adequate to assume the metal is ideal
and a discussion of the propagation of SPPs on perfectly conducting gratings and the
possible observation of the surface plasmon resonance will be presented later in this
chapter. Regardless of whether lossy, or perfectly conducting gratings are being
considered, a theory based on the formalism of Chandezon et al. (1982) is utilised
throughout this thesis, and is outlined in the section below.

CHAPTER 3 The influence of the interface profile and properties of the surrounding media on the
reflectivity from a grating sample.
63
3.3. The Differential Formalism of Chandezon et al.
The limitation imposed by Rayleigh’s theory is not encountered in the Chandezon
method as this approach uses a co-ordinate transformation to effectively flatten the
surface, thus allowing the exact matching of the boundary conditions at the interface.
The translation used is
.
)(
zw
xAyu
xv
=
−=
=
where A(x) represents the interface profile. Despite easing the application of the
boundary conditions, the expression of Maxwell’s equations in this non-orthogonal co-
ordinate system (u, v, w) is more complex. Hence Fourier expansions are used to
describe Maxwell’s equations and the incident and scattered fields. Clearly, in order to
solve the problem numerically, it is necessary that these infinite series are truncated and
therefore a limit must be placed on the number of scattered orders in the system. Hence
a compromise must be reached between adequately describing the system and obtaining
convergence in the routine, and minimising the necessary computation time. For most
of the modelling work undertaken in this thesis, the number of scattered orders was
limited to 6, however an increase in the pitch-to-depth ratio would require this
truncation parameter to be suitably increased.
Chandezon’s original theory is able to model several interfaces each of the same
singularly periodic relief profile, with the plane of incidence parallel to the grating
vector ( °= 0ϕ ). However there have been a number of recent advances made which
permit the modelling of:
• Gratings in the conical mount ( 0≠ϕ i.e. the plane of incidence is not parallel to the
grating wave vector, kg .) [Elston et al. (1991a,b)].
• Conical diffraction from corrugated multilayered isotropic media [Li (1994)].
• Multlilayer gratings of arbitrary shape. [Preist et al. (1995) and Granet et al.
(1995a)].
• Improvement of numerical stability (Scattering matrix technique) [Cotter et al.
(1995)].

CHAPTER 3 The influence of the interface profile and properties of the surrounding media on the
reflectivity from a grating sample.
64
• Conical diffraction from corrugated multilayered uniaxial media [Harris et al.
(1996a)].
• Response of bi-grating structures (an interface corrugated in two different
directions) [Granet et al. (1995b), Harris et al (1996b)]
• Response of blazed (non-symmetric) and overhanging gratings by using an oblique
transformation. [Granet et al. (1997) and Preist et al. (1997)].
A useful overview of the original formalism of Chandezon et al. and its recent
developments is provided in the PhD thesis of Wantall (1999).
As discussed above, all calculations based on the differential formalism of Chandezon
et al. give only approximate solutions to the problem as they rely on an infinite Fourier
series that must be truncated. However the most rigorous method for modelling
gratings is perhaps that of Maystre (1978) who uses an integral technique and which
permits the modelling of multi-layered and multi-shaped gratings of any depth-to-pitch
ratio. The downfall of this technique is its numerical and conceptual complexity
compared to the differential formalism described above.
3.4. Representation of the surface profile
As previously discussed, the excitation of the SPP on a metal-dielectric interface allows
one to characterise the surrounding media. However to achieve this accurately, the
profile of the surface must first be correctly quantified since it is usually impossible to
manufacture a purely sinusoidal interface. Many workers have approached this
representation in a number of different ways. For example, Bryan Brown et al. (1993)
proposed to distort the sine wave by raising it to a power:
−
+=
2
1
2
1)sin()(
γxk
hxAg
Equation 3.4.1
where kg is the grating wave vector and h is the grating groove depth.
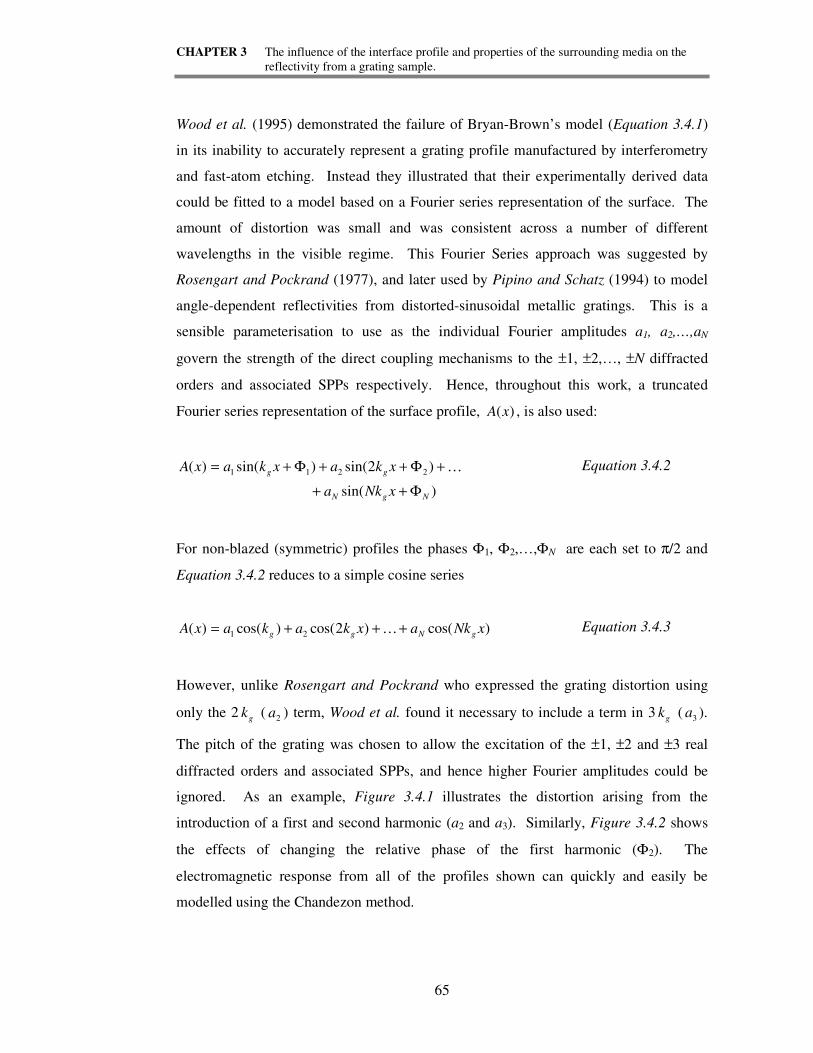
CHAPTER 3 The influence of the interface profile and properties of the surrounding media on the
reflectivity from a grating sample.
65
Wood et al. (1995) demonstrated the failure of Bryan-Brown’s model (Equation 3.4.1)
in its inability to accurately represent a grating profile manufactured by interferometry
and fast-atom etching. Instead they illustrated that their experimentally derived data
could be fitted to a model based on a Fourier series representation of the surface. The
amount of distortion was small and was consistent across a number of different
wavelengths in the visible regime. This Fourier Series approach was suggested by
Rosengart and Pockrand (1977), and later used by Pipino and Schatz (1994) to model
angle-dependent reflectivities from distorted-sinusoidal metallic gratings. This is a
sensible parameterisation to use as the individual Fourier amplitudes a1, a2,…,aN
govern the strength of the direct coupling mechanisms to the ±1, ±2,…, ±N diffracted
orders and associated SPPs respectively. Hence, throughout this work, a truncated
Fourier series representation of the surface profile, )(xA , is also used:
)sin(
)2sin()sin()( 2211
NgN
gg
xNka
xkaxkaxA
Φ++
+Φ++Φ+= …
Equation 3.4.2
For non-blazed (symmetric) profiles the phases Φ1, Φ2,…,ΦN are each set to π/2 and
Equation 3.4.2 reduces to a simple cosine series
)cos()2cos()cos()( 21 xNkaxkakaxA gNgg +++= … Equation 3.4.3
However, unlike Rosengart and Pockrand who expressed the grating distortion using
only the 2 kg ( 2a ) term, Wood et al. found it necessary to include a term in 3 kg ( 3a ).
The pitch of the grating was chosen to allow the excitation of the ±1, ±2 and ±3 real
diffracted orders and associated SPPs, and hence higher Fourier amplitudes could be
ignored. As an example, Figure 3.4.1 illustrates the distortion arising from the
introduction of a first and second harmonic (a2 and a3). Similarly, Figure 3.4.2 shows
the effects of changing the relative phase of the first harmonic (Φ2). The
electromagnetic response from all of the profiles shown can quickly and easily be
modelled using the Chandezon method.
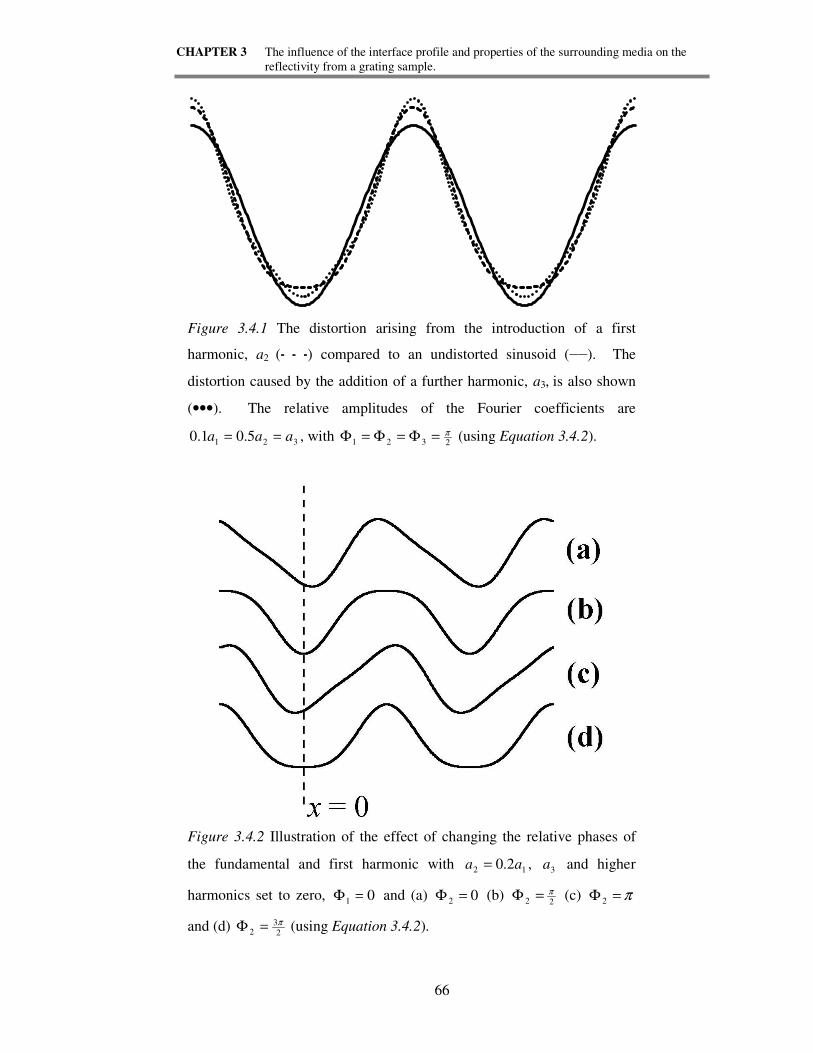
CHAPTER 3 The influence of the interface profile and properties of the surrounding media on the
reflectivity from a grating sample.
66
Figure 3.4.1 The distortion arising from the introduction of a first
harmonic, a2 (- - -) compared to an undistorted sinusoid (——). The
distortion caused by the addition of a further harmonic, a3, is also shown
(•••). The relative amplitudes of the Fourier coefficients are
321 5.01.0 aaa == , with 2321π=Φ=Φ=Φ (using Equation 3.4.2).
Figure 3.4.2 Illustration of the effect of changing the relative phases of
the fundamental and first harmonic with 12 2.0 aa = , 3a and higher
harmonics set to zero, 01 =Φ and (a) 02 =Φ (b) 22π=Φ (c) π=Φ 2
and (d) 2
32
π=Φ (using Equation 3.4.2).

CHAPTER 3 The influence of the interface profile and properties of the surrounding media on the
reflectivity from a grating sample.
67
The addition of a first harmonic, 2a with a suitable phase with respect to the
fundamental (i.e. either use 221 π=Φ=Φ [Figure 3.4.1], or 23 ,0 21 π=Φ=Φ
[Figure 3.4.2]) clearly flattens the bottom of the trough and sharpens the peaks
compared to the undistorted sinusoidal profile. Gratings manufactured using the
interferographic technique often demonstrate profiles of this form due to the non-linear
response of the exposed photoresist.
Note the symmetry of the profiles in Figure 3.4.2. Profiles (b) and (d) with 01 =Φ and
22 πp=Φ (where p is an integer) possess the symmetry )()( xAxA −= . On the other
hand, profiles (b) and (d) with πp=Φ 2 are not symmetric about 0=x and are said to
be blazed and begin to resemble a sawtooth structure.
By increasing the number of Fourier coefficients, it is possible to accurately represent
more complicated profiles. For example the profile shown in Figure 3.4.3 has been
represented using fourteen Fourier coefficients. Figure 3.4.4 shows a square grating
represented with the same number of Fourier coefficients and the undesirable oscillation
illustrates the difficulty in modelling a profile with vertical edges using this technique.
Figure 3.4.3 (a): Fourier series representation using fourteen coefficients of the profile
shown in (b).
(a)
(b)

CHAPTER 3 The influence of the interface profile and properties of the surrounding media on the
reflectivity from a grating sample.
68
Figure 3.4.4 (a): Fourier representation using fourteen coefficients of a square wave
grating (b).
3.5. The reflectivity features and the Littrow angle
It is often helpful to use the concept of k-space to predict the number and position of
reflectivity features in an angle scan. This representation is particularly useful when
choosing the optimum angle of incidence and wavelength at which to carry out an
experiment. Clearly, before attempting to construct a k-space diagram, or produce fits
to experimental data, the pitch of the grating ( gλ ) must be accurately determined. The
point at which Equation 3.5.1 is satisfied provides an excellent method for doing this.
A Rayleigh anomaly is observed when a real diffracted order ceases to propagate in the
dielectric and becomes evanescent in the metallic media (or vice-versa). The resulting
redistribution of energy is experimentally observed as a sharp step in the detected
reflectivity.
gNn kkk ±= θsin010 Equation 3.5.1
The height of the step depends only on the amount of radiation diffracted into the order
in question, and hence the shape of the feature is dependent on the grating depth.
(a)
(b)

CHAPTER 3 The influence of the interface profile and properties of the surrounding media on the
reflectivity from a grating sample.
69
However there is a large degree of degeneracy associated with fitting only to this
feature, and no information about the dielectric properties of the media surrounding the
interface can be extracted.
As described in Section 2.4.2, it is possible to resonantly excite SPPs at a metal-
dielectric interface for a number of different angles of incidence and wavelengths when
the following coupling condition is satisfied,
gNn kkk ±= θsin01SPP Equation 3.5.2.
Since SPPk is strongly dependent on the interface profile and the media surrounding the
boundary, one may successfully parameterise the profile and dielectric properties by
fitting the theoretical model to the shape and position of the surface plasmon resonances
(SPRs). However, more than one resonance condition is often observed in a typical
momentum scan, therefore it is convenient to label the SPRs with the sign and number
of the diffracted order which is providing the coupling via its evanescent field.
Figure 3.5.1 (top) illustrates the reciprocal space for a non-blazed metallic grating
( i7.05.17 +−=ε ) with 050.01 =ga λ , 12 1.0 aa = , 13 02.0 aa = and 575.00 =gλλ .
The light circles have radius 0k and are spaced by the grating wave vector ggk λπ2= .
For clarity, the SPP circles have not been shown, but as discussed in Section 2.4.2, they
exist at a slightly higher momentum than the incident photon (for example, Equation
2.3.8 gives 003.1 kkSPP ≈ for a planar silver interface at 632.8 nm). The white arrow
represents a momentum scan along the direction perpendicular to the orientation of the
grating grooves ( 0=ϕ ), and hence one may predict the order of features that may be
observed in the specular beam (zeroth order): +2 SPP, +2 Rayleigh anomaly, -1 SPP, -1
Rayleigh anomaly, +3 SPP, +3 Rayleigh anomaly.
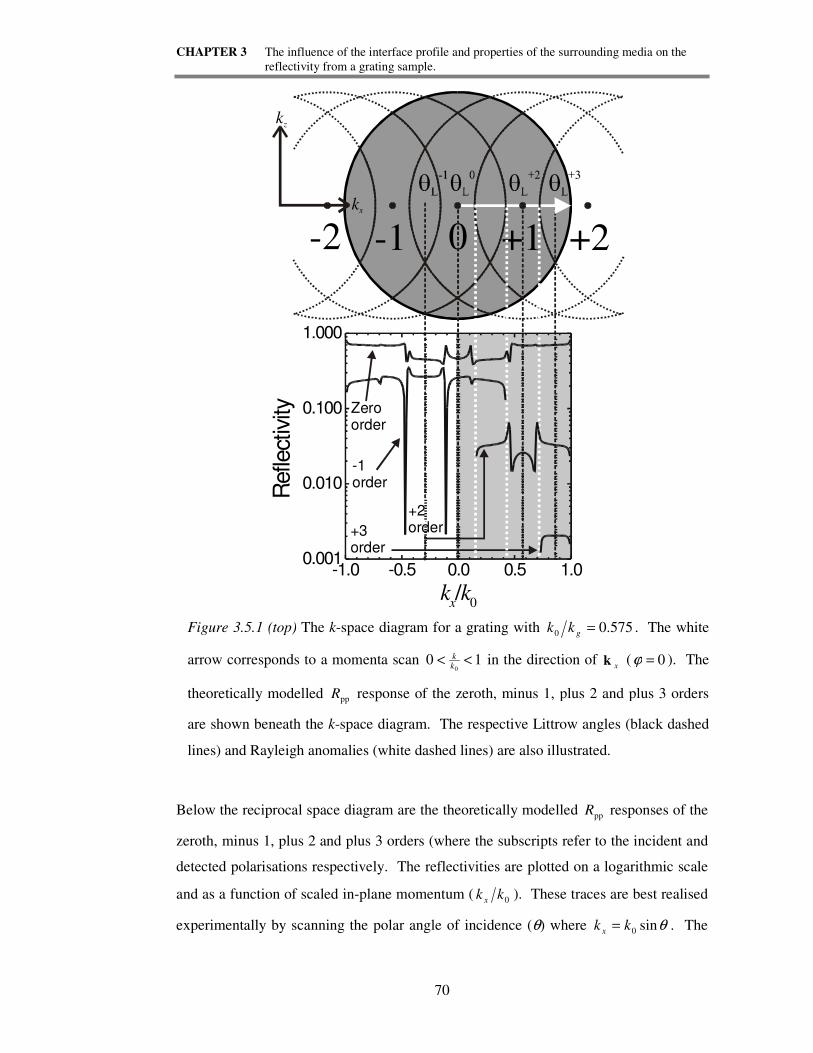
CHAPTER 3 The influence of the interface profile and properties of the surrounding media on the
reflectivity from a grating sample.
70
Below the reciprocal space diagram are the theoretically modelled ppR responses of the
zeroth, minus 1, plus 2 and plus 3 orders (where the subscripts refer to the incident and
detected polarisations respectively. The reflectivities are plotted on a logarithmic scale
and as a function of scaled in-plane momentum (0kk x
). These traces are best realised
experimentally by scanning the polar angle of incidence (θ) where θsin0kk x = . The
+10 +2-1-2
Zeroorder
-1order
+2order+3
order
kz
kx
-1.0 -0.5 0.0 0.5 1.00.001
0.010
0.100
1.000
Refle
ctiv
ity
kx/k
0
Figure 3.5.1 (top) The k-space diagram for a grating with 575.00 =gkk . The white
arrow corresponds to a momenta scan 100
<<kk in the direction of
xk ( 0=ϕ ). The
theoretically modelled ppR response of the zeroth, minus 1, plus 2 and plus 3 orders
are shown beneath the k-space diagram. The respective Littrow angles (black dashed
lines) and Rayleigh anomalies (white dashed lines) are also illustrated.

CHAPTER 3 The influence of the interface profile and properties of the surrounding media on the
reflectivity from a grating sample.
71
white dashed lines indicate the positions of the Rayleigh anomalies, and the black
dashed lines show the symmetry lines for each of the orders illustrated. These
symmetry points correspond to their Littrow mounting angle, defined as the angle of
incidence that coincides with the relevant diffracted order having exactly the reversed
momentum of the incident beam. Hence, the Littrow condition is satisfied when
N
Lg
N
Lx kNkkk θθ sinsin 00 −== Equation 3.5.3
and so
00 2sin
k
Nk
k
k gxN
L ==θ Equation 3.5.4
where 0k is the momentum of the incident photon, kg is the grating wave vector and
N
Lθ is the Littrow mounting angle for the Nth diffracted order. Hence, for the system
described above, 0sin 0 =Lθ , 288.0sin 1 −=−Lθ , 575.0sin 2 =+
Lθ and 863.0sin 3 =+Lθ .
Notice how the two SPRs in the +2 order trace (i.e. the resonances associated with the –
1 and +3 diffracted orders) are symmetric in both position and coupling strength about
their Littrow angle. Note that the –1 and +3 SPRs do not share the same symmetry in
the zeroth order trace, since this order must be symmetric about 0sin 0 =Lθ . These and
other similar symmetries must be present in order for reciprocity to be satisfied.
The theoretically predicted response from the grating shown in Figure 3.5.1 is
illustrated as a function of in-plane scaled momentum. Clearly it is not possible to
experimentally record data in this way directly, instead the reflectivity from the grating
may be recorded as a function of angle of incidence (polar, θ or azimuthal, ϕ) or
incident wavelength. If the data in Figure 3.5.1 is instead plotted as a function of angle
of incidence, the width of the resonances would vary depending on the angle at which
they occur. Hence, it is often useful to plot the predicted reflectivities as a function of
incident momentum so that the symmetry of the diffracted orders about their respective
Littrow angles may be observed.

CHAPTER 3 The influence of the interface profile and properties of the surrounding media on the
reflectivity from a grating sample.
72
Generally all metals behave as near-perfect conductors in the microwave regime since
the electrons in the metal may respond almost perfectly to the incident-oscillating field.
Therefore the effect of any small variation in the frequency-dependent dielectric
function of the metal is insignificant. An apparatus has been developed that allows the
response of such a sample to be recorded as a function of both wavelength and azimuth
angle-of-incidence simultaneously. This is achieved in the microwave regime using a
rotating table and continuous-wave source (Chapter 7). However when the reflectivity
is recorded from a similar, scaled-down sample in the visible regime, the dielectric
response of the metal is no longer wavelength-independent and hence it becomes more
difficult to characterise the profile. In addition, only at the frequency of SPP resonance
is it possible to gather enough information to determine the dielectric response of the
substrate and hence the accurate measurement of a metal’s dielectric function across a
range of wavelengths is very difficult. Therefore, the dielectric functions of metals in
the visible regime are normally determined by fitting to a number of angle-scans (θ or
ϕ) each at a different incident wavelength. Traditionally scans are carried out as a
function of the polar angle (θ) (Chapters 4 and 5), however an azimuthal angle (ϕ) scan
has a number of advantages, principally that it involves no moving detectors (Chapter
6).
3.6. The profile of the grating
The grating modelled in the previous section has a distorted profile of the form of
Equation 3.4.2. For the remainder of this chapter, the studies are limited to similar non-
blazed surfaces, where the cosine series may be used to represent the profile.
As was briefly discussed earlier in this chapter, the use of a Fourier Series
representation of the interface is convenient since it effectively allows one to introduce
extra low amplitude periodicities into the grating profile. This introduces the grating
wave vectors 2 kg , 3 kg etc into the system, where the wave vector, N kg , is responsible
for the direct coupling mechanism to the ±N SPP. Thus the size and relative phase of
each of the Fourier amplitudes has a profound effect on the width, depth and position of
the associated SPR. It is this sensitivity that allows the functional form of the grating

CHAPTER 3 The influence of the interface profile and properties of the surrounding media on the
reflectivity from a grating sample.
73
profile to be accurately determined by fitting the predictions from the grating modelling
theory to the experimental results.
3.6.1. Variation of ,1a the fundamental amplitude
Figure 3.6.1 shows the effect on the ppR specular response of the grating similar to that
studied in Section 3.5, in the region of the +1 SPR of varying the fundamental amplitude
of the profile. The off-resonance signal decreases as the fundamental amplitude is
increased and more energy is channelled into diffracted orders. Notice also that the
depth of the resonance initially increases with increasing amplitude and reaches a
maximum, where the reflectivity falls to zero, at approximately ga λ02.01 = . At this
point, the radiation reflected directly from the surface (the zeroth diffracted order) and
the radiation out-coupled from the SPP are equal and exactly out of phase. With values
of 1a less than approximately gλ02.0 , the two components do not sum to zero, and the
resonance is said to be under-coupled. As 1a is increased above the optimal coupling
condition, again the phase and magnitude of the components will vary, and the depth of
the resonance will decrease. Eventually the resonance minimum becomes a peak for
ga λ06.01 > (approximately) since the sum of the two components of the specular beam
is now greater than the fraction of energy remaining in the specular order. It is also
clear that the width of the resonance and the distance of the SPR from its corresponding
Rayleigh anomaly both increase as the grating grooves are deepened. This perturbation
of the SPR dispersion has been discussed by McPhedran and Waterworth (1972),
Pockrand (1976) and Raether (1988). They illustrated that the half-width and distance
of the resonance from its associated Rayleigh anomaly both increase linearly, to a first-
order approximation, with the square of the grating amplitude. Similar phenomena can
be observed in the region of the –2 SPR (Figure 3.6.2), where the mode is excited via
two successive kg scatters. These relationships are illustrated in Figure 3.6.3 for the
theoretical data presented here.
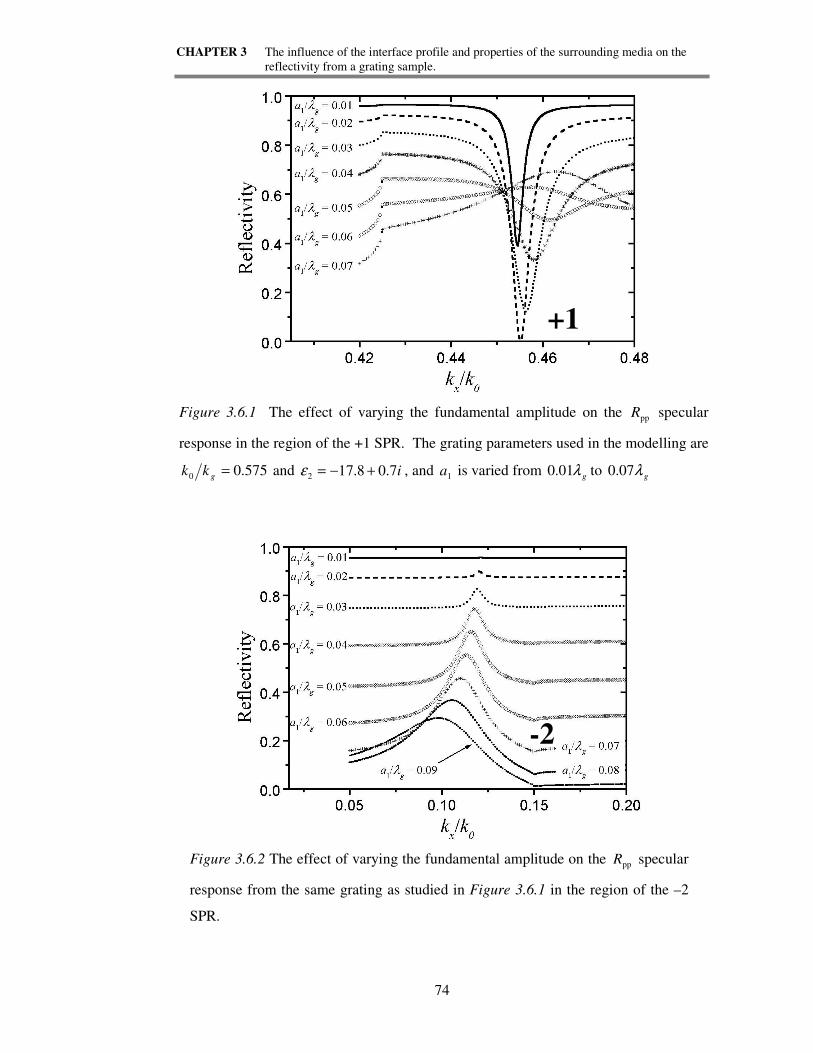
CHAPTER 3 The influence of the interface profile and properties of the surrounding media on the
reflectivity from a grating sample.
74
Figure 3.6.1 The effect of varying the fundamental amplitude on the ppR specular
response in the region of the +1 SPR. The grating parameters used in the modelling are
575.00 =gkk and i7.08.172 +−=ε , and 1a is varied from gλ01.0 to gλ07.0
Figure 3.6.2 The effect of varying the fundamental amplitude on the ppR specular
response from the same grating as studied in Figure 3.6.1 in the region of the –2
SPR.
+1
-2
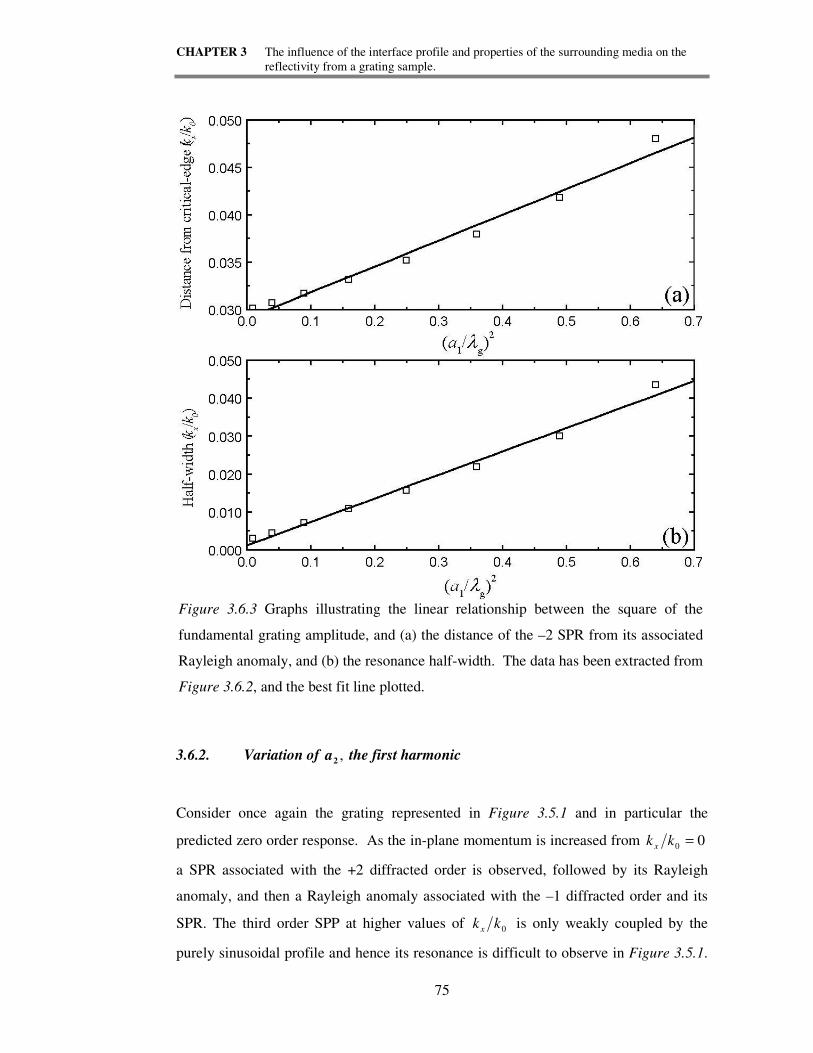
CHAPTER 3 The influence of the interface profile and properties of the surrounding media on the
reflectivity from a grating sample.
75
3.6.2. Variation of ,2a the first harmonic
Consider once again the grating represented in Figure 3.5.1 and in particular the
predicted zero order response. As the in-plane momentum is increased from 00 =kk x
a SPR associated with the +2 diffracted order is observed, followed by its Rayleigh
anomaly, and then a Rayleigh anomaly associated with the –1 diffracted order and its
SPR. The third order SPP at higher values of 0kk x is only weakly coupled by the
purely sinusoidal profile and hence its resonance is difficult to observe in Figure 3.5.1.
Figure 3.6.3 Graphs illustrating the linear relationship between the square of the
fundamental grating amplitude, and (a) the distance of the –2 SPR from its associated
Rayleigh anomaly, and (b) the resonance half-width. The data has been extracted from
Figure 3.6.2, and the best fit line plotted.
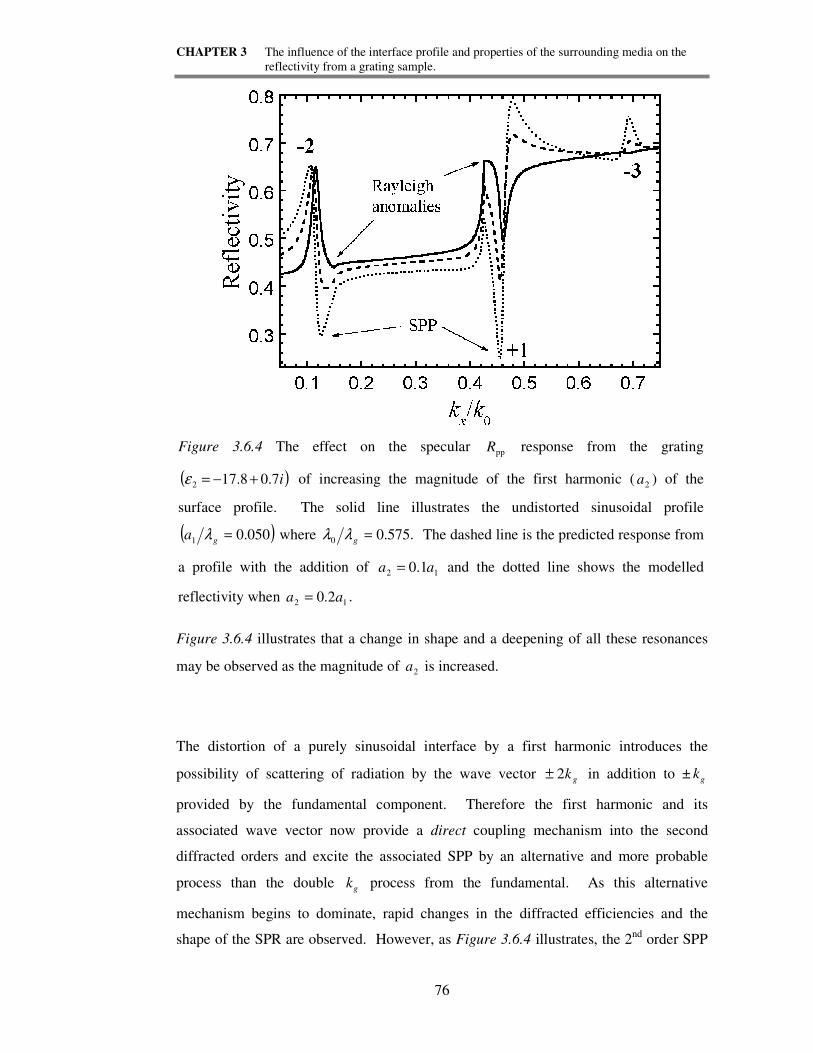
CHAPTER 3 The influence of the interface profile and properties of the surrounding media on the
reflectivity from a grating sample.
76
Figure 3.6.4 illustrates that a change in shape and a deepening of all these resonances
may be observed as the magnitude of 2a is increased.
The distortion of a purely sinusoidal interface by a first harmonic introduces the
possibility of scattering of radiation by the wave vector gk2± in addition to ± kg
provided by the fundamental component. Therefore the first harmonic and its
associated wave vector now provide a direct coupling mechanism into the second
diffracted orders and excite the associated SPP by an alternative and more probable
process than the double kg process from the fundamental. As this alternative
mechanism begins to dominate, rapid changes in the diffracted efficiencies and the
shape of the SPR are observed. However, as Figure 3.6.4 illustrates, the 2nd
order SPP
Figure 3.6.4 The effect on the specular ppR response from the grating
( )i7.08.172 +−=ε of increasing the magnitude of the first harmonic ( 2a ) of the
surface profile. The solid line illustrates the undistorted sinusoidal profile
( )050.01 =ga λ where .575.00 =gλλ The dashed line is the predicted response from
a profile with the addition of 12 1.0 aa = and the dotted line shows the modelled
reflectivity when 12 2.0 aa = .
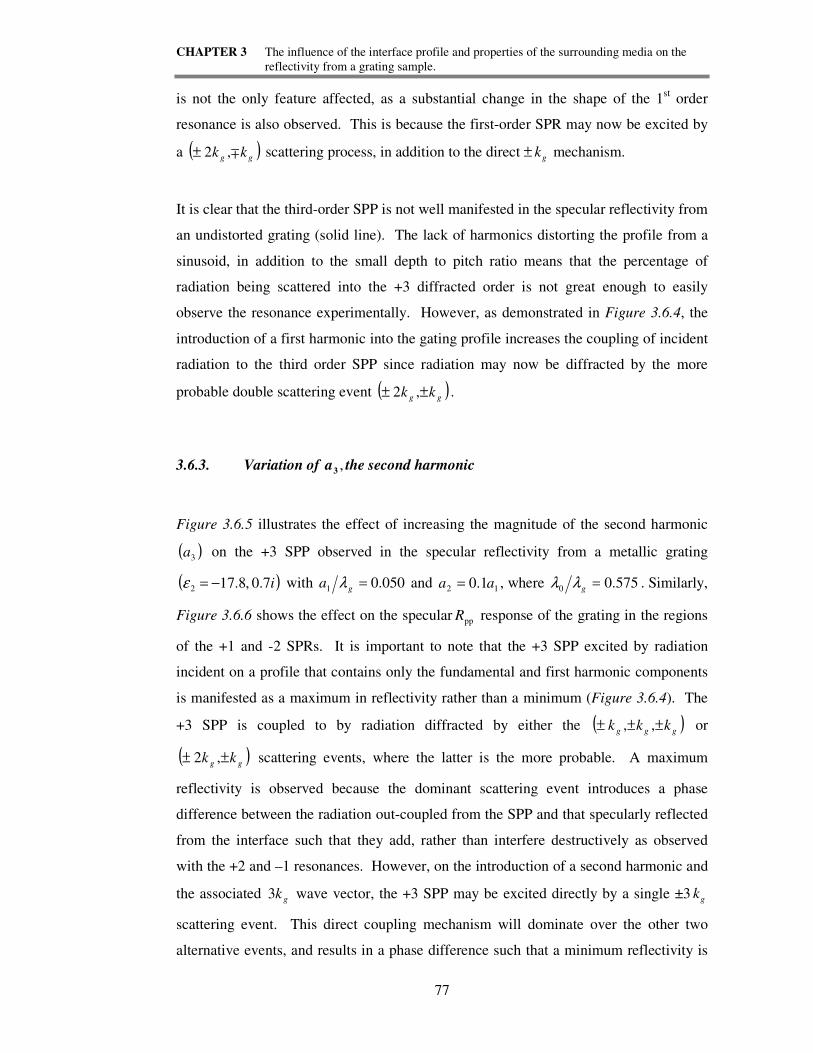
CHAPTER 3 The influence of the interface profile and properties of the surrounding media on the
reflectivity from a grating sample.
77
is not the only feature affected, as a substantial change in the shape of the 1st order
resonance is also observed. This is because the first-order SPR may now be excited by
a ( )gg kk ∓,2± scattering process, in addition to the direct ± kg mechanism.
It is clear that the third-order SPP is not well manifested in the specular reflectivity from
an undistorted grating (solid line). The lack of harmonics distorting the profile from a
sinusoid, in addition to the small depth to pitch ratio means that the percentage of
radiation being scattered into the +3 diffracted order is not great enough to easily
observe the resonance experimentally. However, as demonstrated in Figure 3.6.4, the
introduction of a first harmonic into the gating profile increases the coupling of incident
radiation to the third order SPP since radiation may now be diffracted by the more
probable double scattering event ( )gg kk ±± ,2 .
3.6.3. Variation of ,3a the second harmonic
Figure 3.6.5 illustrates the effect of increasing the magnitude of the second harmonic
( )3a on the +3 SPP observed in the specular reflectivity from a metallic grating
( )i7.0 ,8.172 −=ε with 050.01 =ga λ and 12 1.0 aa = , where 575.00 =gλλ . Similarly,
Figure 3.6.6 shows the effect on the specular ppR response of the grating in the regions
of the +1 and -2 SPRs. It is important to note that the +3 SPP excited by radiation
incident on a profile that contains only the fundamental and first harmonic components
is manifested as a maximum in reflectivity rather than a minimum (Figure 3.6.4). The
+3 SPP is coupled to by radiation diffracted by either the ( )ggg kkk ±±± ,, or
( )gg kk ±± ,2 scattering events, where the latter is the more probable. A maximum
reflectivity is observed because the dominant scattering event introduces a phase
difference between the radiation out-coupled from the SPP and that specularly reflected
from the interface such that they add, rather than interfere destructively as observed
with the +2 and –1 resonances. However, on the introduction of a second harmonic and
the associated gk3 wave vector, the +3 SPP may be excited directly by a single ±3 kg
scattering event. This direct coupling mechanism will dominate over the other two
alternative events, and results in a phase difference such that a minimum reflectivity is

CHAPTER 3 The influence of the interface profile and properties of the surrounding media on the
reflectivity from a grating sample.
78
observed. Therefore as the magnitude of 3a is increased, the resonance anomaly
changes from a maximum to a minimum (Figure 3.6.5).
The significant change in shape and position of the SPRs in Figure 3.6.4, Figure 3.6.5
and Figure 3.6.6 clearly illustrates the serious problems that may be encountered in the
fitting of experimental data to the theoretical model if the grating profile is not
represented by a sufficient number of Fourier components. Clearly, such a restriction
on the surface parameters may lead to an incorrect characterisation of the dielectric
functions of the surrounding media. However the flexibility of the grating modelling
procedure used in this thesis allows, in theory, for an infinite number of Fourier profile
components to be introduced. Since it is sensible to keep computation times to a
minimum, the series is truncated at the point at which the reflectivity from the sample
Figure 3.6.5 The effect on the specular ppR response from the metallic
grating ( )i7.0 ,8.172 −=ε in the region of the –3 SPR of varying the
magnitude of the second harmonic ( )3a of the grating profile. The solid line
illustrates the profile with 050.01 =ga λ , 12 1.0 aa = , 03 =a where
575.00 =gλλ . The other lines show the predicted responses when
13 02.0 aa = (dashed), 13 04.0 aa = (dotted), 13 06.0 aa = (dot-dash) and
13 08.0 aa = (dot-dot-dash).
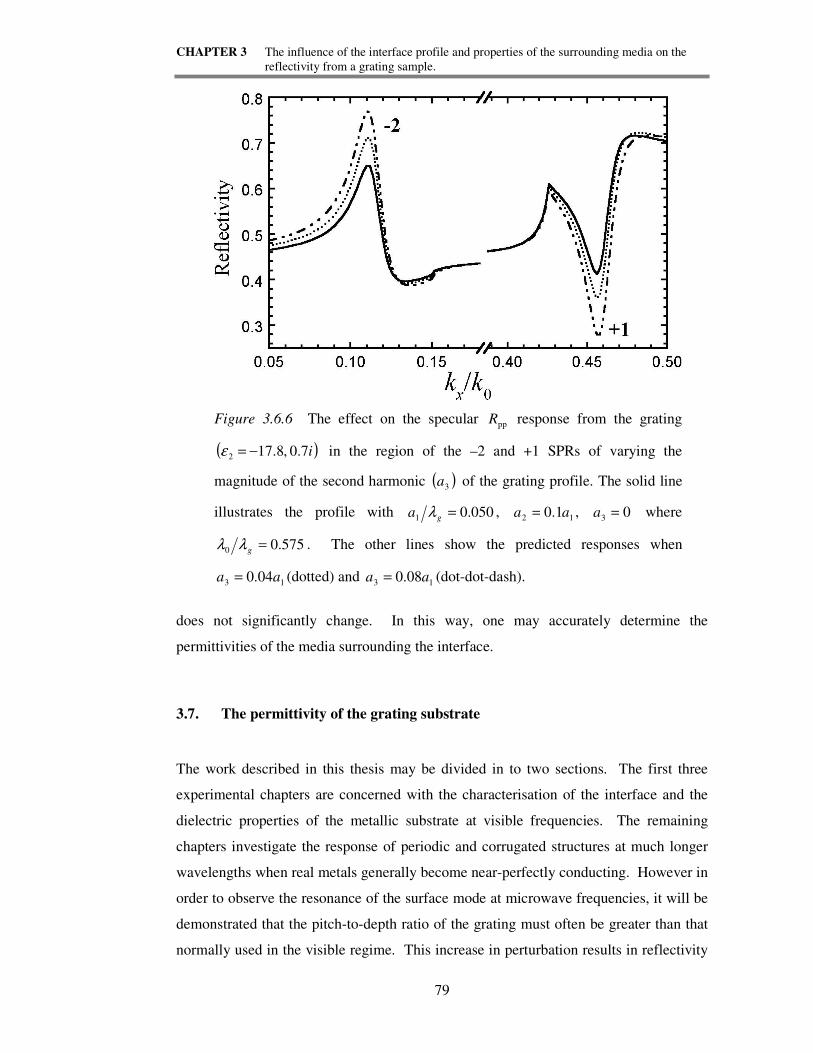
CHAPTER 3 The influence of the interface profile and properties of the surrounding media on the
reflectivity from a grating sample.
79
does not significantly change. In this way, one may accurately determine the
permittivities of the media surrounding the interface.
3.7. The permittivity of the grating substrate
The work described in this thesis may be divided in to two sections. The first three
experimental chapters are concerned with the characterisation of the interface and the
dielectric properties of the metallic substrate at visible frequencies. The remaining
chapters investigate the response of periodic and corrugated structures at much longer
wavelengths when real metals generally become near-perfectly conducting. However in
order to observe the resonance of the surface mode at microwave frequencies, it will be
demonstrated that the pitch-to-depth ratio of the grating must often be greater than that
normally used in the visible regime. This increase in perturbation results in reflectivity
Figure 3.6.6 The effect on the specular ppR response from the grating
( )i7.0 ,8.172 −=ε in the region of the –2 and +1 SPRs of varying the
magnitude of the second harmonic ( )3a of the grating profile. The solid line
illustrates the profile with 050.01 =ga λ , 12 1.0 aa = , 03 =a where
575.00 =gλλ . The other lines show the predicted responses when
13 04.0 aa = (dotted) and 13 08.0 aa = (dot-dot-dash).

CHAPTER 3 The influence of the interface profile and properties of the surrounding media on the
reflectivity from a grating sample.
80
features that are quite different to those normally associated with SPPs. Therefore this
section considers a series of gratings of varying depth and illustrates the change in
reflectivity as the metal is made near-perfectly conducting. Hence, by using a rigorous
grating modelling theory, it is possible to design a surface from which the resonance of
a SPP may be observed in the reflected intensity.
First consider a diffraction grating that is able to diffract radiation into the ±1 and ±2
orders, and excite the corresponding SPPs. For the sake of simplicity, only purely
sinusoidal gratings will be considered in this section, however it is important to realise
that it is generally difficult to manufacture such an ideal profile. In addition, the
predicted responses are plotted as a function of angle of azimuth since such a study is
easily undertaken at microwave frequencies. Clearly there is no need to examine more
than 90° of azimuthal dependent data unless the grating is non-symmetric (blazed).
Each of the reflectivity scans has been modelled at a fixed polar angle of incidence
°= 30θ , with a wavelength-to-pitch ratio, 707.00 =gλλ . The white arrow on the k-
space diagram below (Figure 3.7.1) represents this system, and hence first- and second-
order Rayleigh anomalies and SPRs are expected.
+1-2 -1 0 +2
Figure 3.7.1 k-space diagram of the grating modelled in this study ( )707.00 =gλλ .
The white arrow represents an azimuthal angle scan ( )°→= 900ϕ at a fixed polar
angle of incidence °= 30θ .
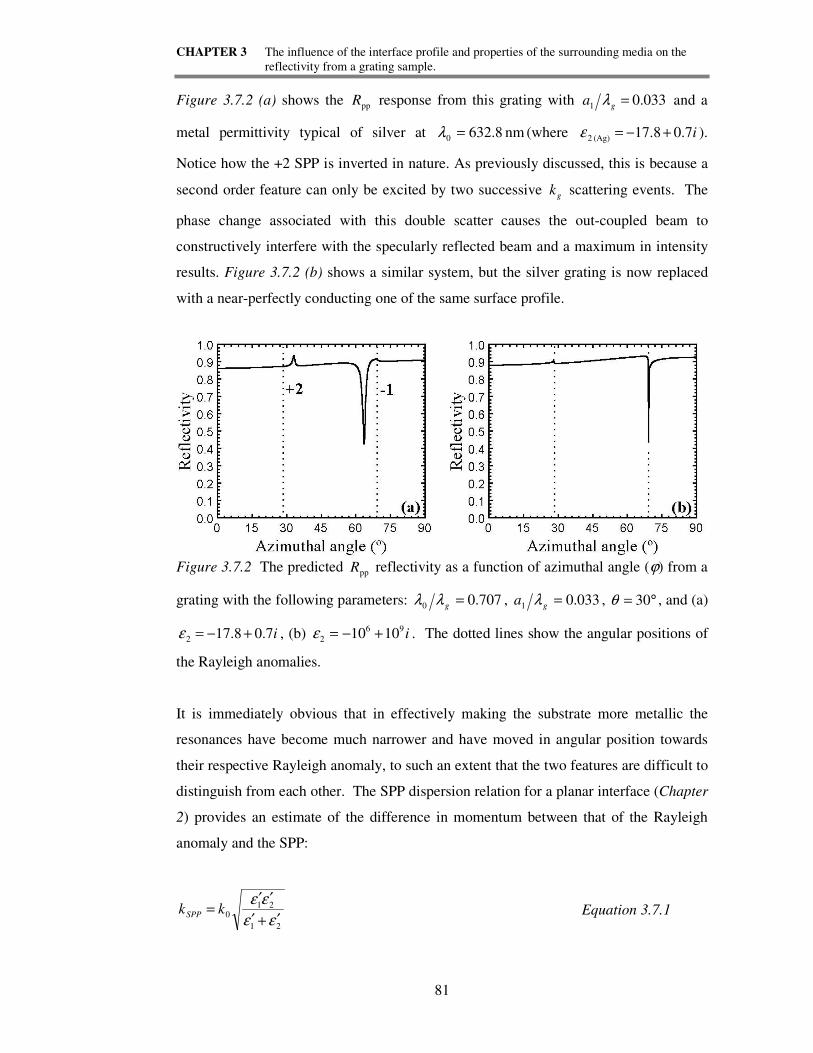
CHAPTER 3 The influence of the interface profile and properties of the surrounding media on the
reflectivity from a grating sample.
81
Figure 3.7.2 (a) shows the ppR response from this grating with 033.01 =ga λ and a
metal permittivity typical of silver at nm 8.6320 =λ (where i7.08.17(Ag) 2 +−=ε ).
Notice how the +2 SPP is inverted in nature. As previously discussed, this is because a
second order feature can only be excited by two successive kg scattering events. The
phase change associated with this double scatter causes the out-coupled beam to
constructively interfere with the specularly reflected beam and a maximum in intensity
results. Figure 3.7.2 (b) shows a similar system, but the silver grating is now replaced
with a near-perfectly conducting one of the same surface profile.
Figure 3.7.2 The predicted ppR reflectivity as a function of azimuthal angle (ϕ) from a
grating with the following parameters: 707.00 =gλλ , 033.01 =ga λ , °= 30θ , and (a)
i7.08.172 +−=ε , (b) i96
2 1010 +−=ε . The dotted lines show the angular positions of
the Rayleigh anomalies.
It is immediately obvious that in effectively making the substrate more metallic the
resonances have become much narrower and have moved in angular position towards
their respective Rayleigh anomaly, to such an extent that the two features are difficult to
distinguish from each other. The SPP dispersion relation for a planar interface (Chapter
2) provides an estimate of the difference in momentum between that of the Rayleigh
anomaly and the SPP:
21
210
εε
εε
′+′
′′= kkSPP Equation 3.7.1

CHAPTER 3 The influence of the interface profile and properties of the surrounding media on the
reflectivity from a grating sample.
82
where 0k and SPPk are the momenta of the incident photon and SPP, and 1ε ′ and 2ε ′ are
the real parts of the permittivity of the dielectric and metal respectively. Hence, it is
clear that ( ) 00 →− kkSPP as −∞→′
2ε .
Clearly, it would be difficult to experimentally observe the reflectivity features shown
in Figure 3.7.2(b), particularly at microwave frequencies where at least a 1° beam
spread is inherent in the system. Therefore it is necessary to manufacture a grating
profile that supports the SPP over a wider range of momentum. As previously
discussed (Section 3.6) this may be achieved by increasing the amplitude of the grating,
the effects of which are illustrated for this near-perfectly-conducting substrate in Figure
3.7.3
Figure 3.7.3 The effect on the specular ppR response of the sample of increasing the
amplitude of the profile formed in a near-perfectly-conducting substrate where
707.00 =gλλ , °= 30θ and i96
2 1010 +−=ε .
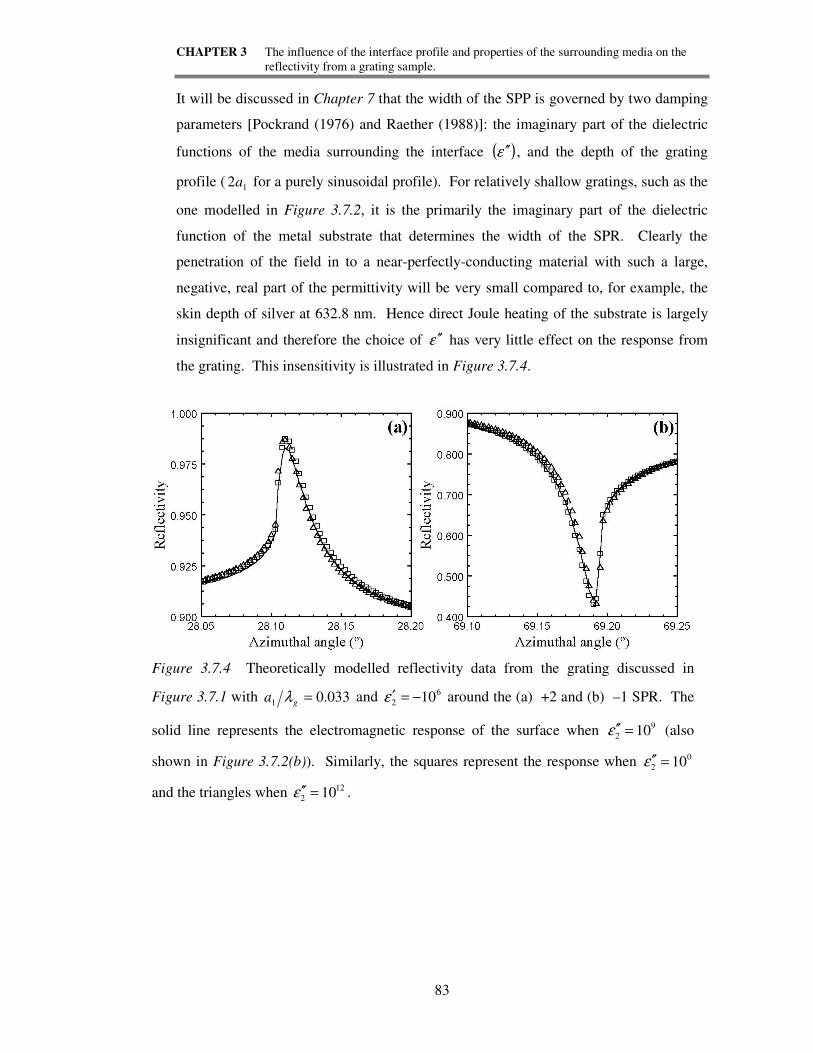
CHAPTER 3 The influence of the interface profile and properties of the surrounding media on the
reflectivity from a grating sample.
83
It will be discussed in Chapter 7 that the width of the SPP is governed by two damping
parameters [Pockrand (1976) and Raether (1988)]: the imaginary part of the dielectric
functions of the media surrounding the interface ( )ε ′′ , and the depth of the grating
profile ( 12a for a purely sinusoidal profile). For relatively shallow gratings, such as the
one modelled in Figure 3.7.2, it is the primarily the imaginary part of the dielectric
function of the metal substrate that determines the width of the SPR. Clearly the
penetration of the field in to a near-perfectly-conducting material with such a large,
negative, real part of the permittivity will be very small compared to, for example, the
skin depth of silver at 632.8 nm. Hence direct Joule heating of the substrate is largely
insignificant and therefore the choice of ε ′′ has very little effect on the response from
the grating. This insensitivity is illustrated in Figure 3.7.4.
Figure 3.7.4 Theoretically modelled reflectivity data from the grating discussed in
Figure 3.7.1 with 033.01 =ga λ and 6
2 10−=′ε around the (a) +2 and (b) –1 SPR. The
solid line represents the electromagnetic response of the surface when 9
2 10=′′ε (also
shown in Figure 3.7.2(b)). Similarly, the squares represent the response when 0
2 10=′′ε
and the triangles when 12
2 10=′′ε .

CHAPTER 3 The influence of the interface profile and properties of the surrounding media on the
reflectivity from a grating sample.
84
3.8. The use of overlayers
Since SPPs are surface modes, their fields are strongly localised at the surface of the
metal, and therefore they are sensitive to any changes that may occur around the
interface. Hence deposition of a dielectric overlayer increases the momentum of the
surface mode and shifts the position of the resonant angle, where the size of the shift
depends on the thickness and refractive index of the overlayer [Raether (1988)]. In
addition, if the overlayer is lossy, then the width of the resonance is also increased. The
sensitivity of the SPP to changes in its surrounding environment can therefore be used
to characterise the properties of an overlayer. An obvious application of this sensitivity
is to employ SPPs as sensors. Molecules can be designed that absorb a particular
chemical species from their environment and as they do so, their optical constants
change. If a thin layer of such a molecule is deposited on to the surface of a metallic
grating, then the SPP resonance position can be used to monitor these small changes
[e.g. Jory et al. (1994)]
Figure 3.7.2(b) illustrates the specular ppR response from a grating with 033.01 =ga λ
formed in a near-perfectly-conducing substrate. This resonance of the SPP may be
widened by either increasing the corrugation amplitude (as previously discussed), or by
depositing an absorbing overlayer. Figure 3.8.1 illustrates the effect on the –1 SPR of
depositing a slightly absorbing dielectric overlayer ( i05.029.2d +=ε ) on top of a near-
perfectly-conducting grating such that both the air-dielectric and dielectric-metal
interfaces have the same profiles. As expected, the half-width of the resonance
increases, and the resonant condition moves away from its associated Rayleigh
anomaly.

CHAPTER 3 The influence of the interface profile and properties of the surrounding media on the
reflectivity from a grating sample.
85
Figure 3.8.1 Graphs showing the effect on the specular ppR response of depositing a
series of lossy overlayers of different thicknesses on top of a grating formed in a near-
perfectly-conducing substrate. Both interfaces have the same profile, 033.01 =ga λ ,
where 707.00 =gλλ , θ = 30°, i05.029.2d +=ε and i96
2 1010 +−=ε . The vertical
grey line corresponds to the position of the –1 Rayleigh anomaly.
The use of overlayers in this thesis is restricted to the microwave regime (Chapters 7, 8
and 9), where a corrugated dielectric overlayer is deposited on top of a planar metal
substrate (Figure 3.8.2). Figure 3.8.3 illustrates the predicted response from a similar
sample for each of the cases where the average thickness of the dielectric overlayer is
varied between 11 5.2 ata << in steps of 125.0 a . The corrugation amplitude used is
ga λ033.01 = where 707.00 =gλλ (i.e. the same profile as used in the previous
figures), the dielectric and metal permittivities are i05.029.2d +=ε and
i96
2 1010 +−=ε respectively. Also shown for comparison purposes is the predicted
response from a grating formed directly into a near-perfectly conducting metal substrate
of the same surface profile.
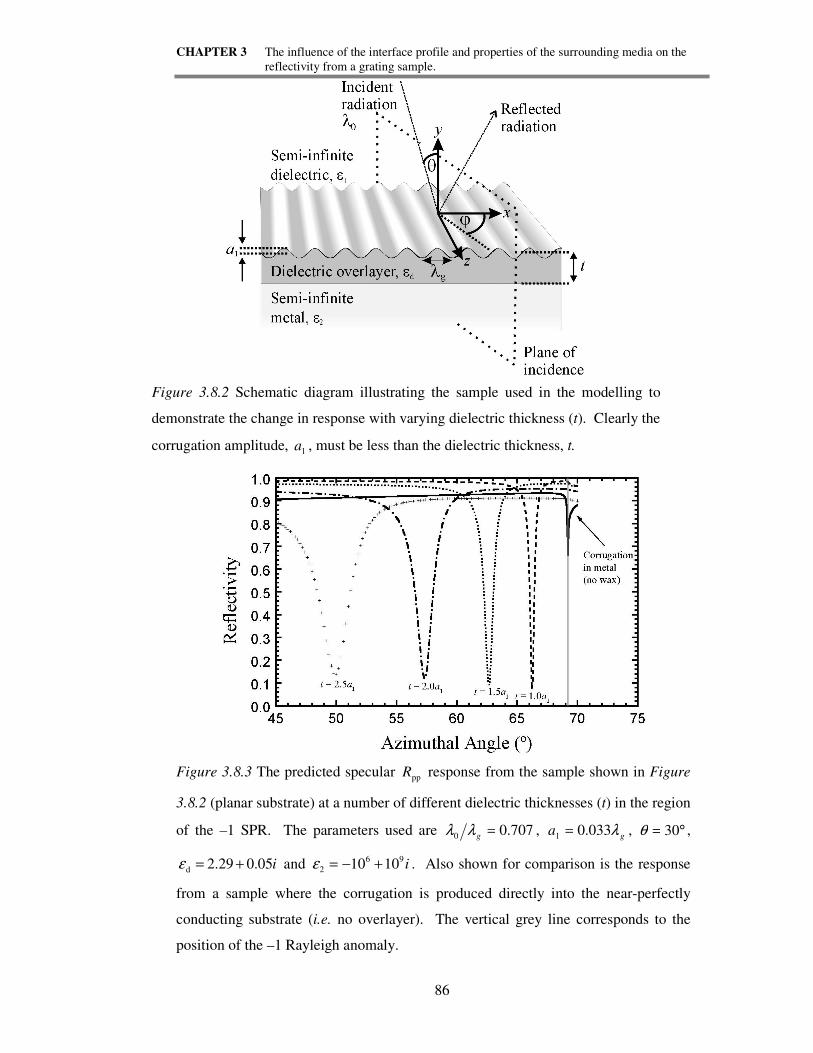
CHAPTER 3 The influence of the interface profile and properties of the surrounding media on the
reflectivity from a grating sample.
86
Figure 3.8.2 Schematic diagram illustrating the sample used in the modelling to
demonstrate the change in response with varying dielectric thickness (t). Clearly the
corrugation amplitude, 1a , must be less than the dielectric thickness, t.
Figure 3.8.3 The predicted specular ppR response from the sample shown in Figure
3.8.2 (planar substrate) at a number of different dielectric thicknesses (t) in the region
of the –1 SPR. The parameters used are 707.00 =gλλ , ga λ033.01 = , °= 30θ ,
i05.029.2d +=ε and i96
2 1010 +−=ε . Also shown for comparison is the response
from a sample where the corrugation is produced directly into the near-perfectly
conducting substrate (i.e. no overlayer). The vertical grey line corresponds to the
position of the –1 Rayleigh anomaly.
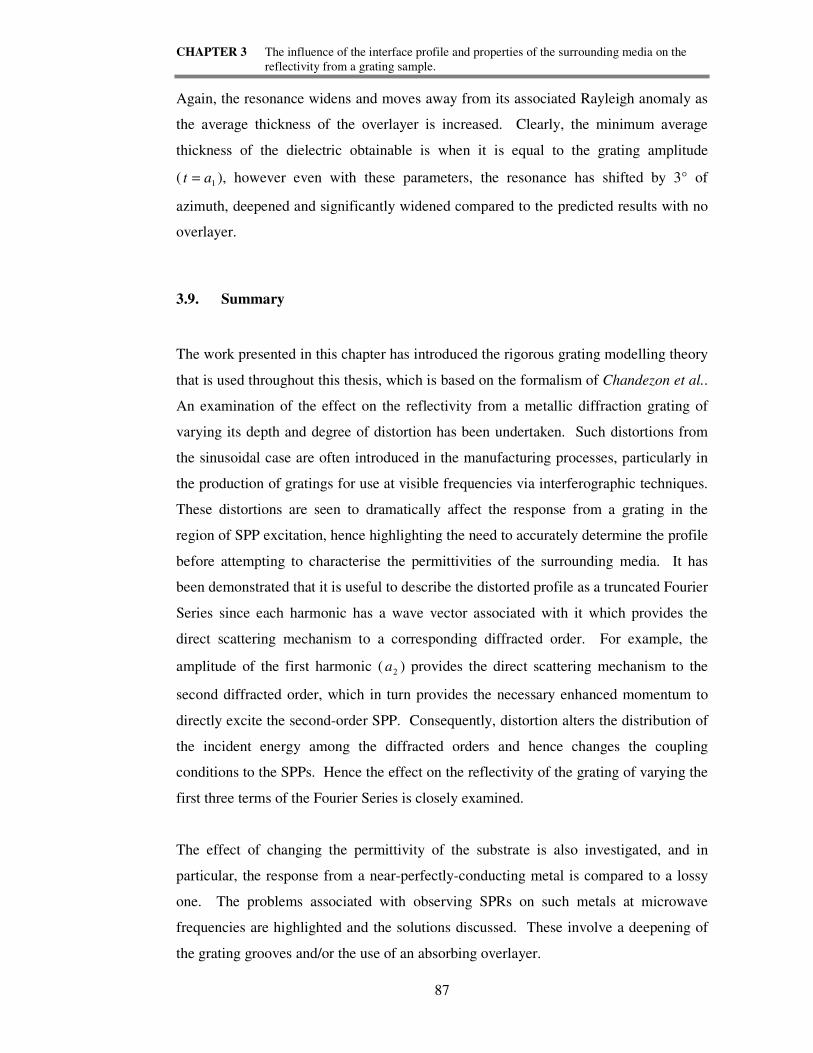
CHAPTER 3 The influence of the interface profile and properties of the surrounding media on the
reflectivity from a grating sample.
87
Again, the resonance widens and moves away from its associated Rayleigh anomaly as
the average thickness of the overlayer is increased. Clearly, the minimum average
thickness of the dielectric obtainable is when it is equal to the grating amplitude
( 1at = ), however even with these parameters, the resonance has shifted by 3° of
azimuth, deepened and significantly widened compared to the predicted results with no
overlayer.
3.9. Summary
The work presented in this chapter has introduced the rigorous grating modelling theory
that is used throughout this thesis, which is based on the formalism of Chandezon et al..
An examination of the effect on the reflectivity from a metallic diffraction grating of
varying its depth and degree of distortion has been undertaken. Such distortions from
the sinusoidal case are often introduced in the manufacturing processes, particularly in
the production of gratings for use at visible frequencies via interferographic techniques.
These distortions are seen to dramatically affect the response from a grating in the
region of SPP excitation, hence highlighting the need to accurately determine the profile
before attempting to characterise the permittivities of the surrounding media. It has
been demonstrated that it is useful to describe the distorted profile as a truncated Fourier
Series since each harmonic has a wave vector associated with it which provides the
direct scattering mechanism to a corresponding diffracted order. For example, the
amplitude of the first harmonic ( 2a ) provides the direct scattering mechanism to the
second diffracted order, which in turn provides the necessary enhanced momentum to
directly excite the second-order SPP. Consequently, distortion alters the distribution of
the incident energy among the diffracted orders and hence changes the coupling
conditions to the SPPs. Hence the effect on the reflectivity of the grating of varying the
first three terms of the Fourier Series is closely examined.
The effect of changing the permittivity of the substrate is also investigated, and in
particular, the response from a near-perfectly-conducting metal is compared to a lossy
one. The problems associated with observing SPRs on such metals at microwave
frequencies are highlighted and the solutions discussed. These involve a deepening of
the grating grooves and/or the use of an absorbing overlayer.
CHAPTER 4 Surface plasmon polariton study of the optical dielectric function of titanium nitride.
88
CHAPTER 4
Surface plasmon polariton study of the optical
dielectric function of titanium nitride.
4.1. Introduction
The first experimental study in this thesis provides a practical example of the way in
which grating-coupled surface plasmon polaritons (SPP) may be used to characterise the
dielectric properties of metallic materials. It presents the first detailed study of the
coupling of incident visible radiation to the SPP that propagates along a corrugated air-
TiNx interface. Some of the useful properties of TiNx are initially listed, and a few of its
many potential applications are described. It is for this reason that many previous
workers have already determined its optical properties using other characterisation
techniques (e.g. ellipsometry), and these are discussed in Section 4.3. The grating-
coupled SPP technique provides an alternative to traditional characterisation techniques
(e.g. Kramers–Kronig analysis) that may require additional information about film
thickness, or the sample’s optical properties in other parts of the electromagnetic
spectrum. The experimental apparatus required to record the angle-dependent
reflectivities from a diffraction grating at visible frequencies, and hence observe the
resonances, is introduced in Section 4.4. Angle-dependent reflectivities are obtained in
the wavelength range 500–875 nm and by comparison with the grating modelling
theory, both the imaginary and real parts of the dielectric function have been
determined. The dielectric function derived is fitted to a model based on a combination
of interband absorptions and free-electron response evaluating both the plasma energy
and relaxation time (Section 4.6).
CHAPTER 4 Surface plasmon polariton study of the optical dielectric function of titanium nitride.
89
4.2. TiNx properties and applications
Titanium nitride (TiNx) belongs to a group of transition metal compounds that are of
considerable interest because they have a variety of properties that lend themselves to
many potential applications. For example, TiNx has become widely used as a wear-
resistant coating on tools because of its mechanical resistance, low friction coefficient
and high melting point [Munz et al. (1986)]. Its high chemical stability and low
resistivity also make it a good candidate as a diffusion barrier in semiconductor
metallization systems [Kanamori (1986), and Gagnon et al. (1996)]. TiNx is also
fascinating in that it appears gold in colour owing to the displacement of the plasma
edge into the visible range by the onset of interband transitions [Karlsson et al. (1982),
and Schlegel et al. (1977)]. Hence it is often used as a scratch-resistant alternative to
gold on decorative jewellery. Its high Drude-like reflectance in the infra-red and high
absorptivity in the visible and near infra-red have encouraged its use as a selective
absorber and heat mirror. Unfortunately the plasma edge is located at too high an
energy to make it an efficient solar absorber in its stoichiometric form [Karlsson et al.
(1982), Rivory et al. (1981), and François et al. (1985)]. However it is well known that
the plasma energy and the optical and electrical properties of TiNx films are strongly
dependent on the deposition conditions, film thickness and titanium-nitrogen ratio
[Rivory et al. (1981), François et al. (1985), Böhm et al. (1972), Kurtz et al. (1986),
Szczyrbowski et al. (1988), Pascual et al. (1991) and Valkonen et al. (1986)]. This
present study is concerned with exploring these interesting optical characteristics in the
visible part of the spectrum using the optical excitation of surface plasmons.
4.3. Previous measurements of ( )ωε of TiNx.
The first multi-wavelength study of the optical constants of TiNx appears to have been
carried out by Böhm et al. (1972). They calculated the optical dispersion and absorption
parameters of Ti(C,N) solid solutions by means of ellipsometric measurements between
energies of 0.6 and 5.5 eV. Their results illustrate the Drude-like response of TiN0.94 at
low energies and its disturbance by the onset of interband transitions as the photon
energy is increased. Schlegel et al. (1977) characterised TiNx samples using Kramers-
Kronig analysis [Wooten (1972)] of reflectivity measurements carried out between 0.3

CHAPTER 4 Surface plasmon polariton study of the optical dielectric function of titanium nitride.
90
and 12 eV. Their samples were prepared by chemical vapour deposition (CVD) on to
heated crystals of TiNx. Karlsson et al. (1982) and Rivory et al. (1981) both obtained
the dielectric function of opaque (thickness, nm 100>d ), stoichiometric TiNx samples
prepared by reactive sputtering on to fused-silica and glass substrates respectively.
Kramers-Kronig analysis was again used to determine the optical permittivities between
0.02 and 6.2 eV (Karlsson) and 0.5 and 6 eV (Rivory). Szczyrbowski et al. (1988) and
Valkonen et al. (1986) determined the optical constants of sputtered TiNx films in the
visible and near infrared spectral regions from measurements of transmission,
reflectance and film thickness (d < 31 nm). Pascual et al. (1991) deposited opaque
TiNx films by plasma-assisted chemical vapour deposition (PACVD) and determined its
dielectric function by means of spectroscopic ellipsometry in the UV–visible range.
The use of grating-coupled surface plasmon polaritons (SPP) in the study of the profile
and permittivity of metal surfaces provides an alternative method to the techniques
described above. As described in Chapter 2, the reversal of the normal component of
the electric field at the surface results in the SPP being very strongly localised at the
interface and so it is extremely sensitive to the dielectric properties of the media either
side of the boundary. However, on a flat surface the SPP can neither be directly
coupled to, nor can it radiate. The enhanced wave vector required to couple into the
mode may be provided by using an optical diffraction grating, where the in-plane wave
vector enhancement is in multiples of the grating wave vector kg . By varying the
magnitude of the incident wave vector in the plane of the grating, wave vector values
are found at which incident radiation may couple resonantly to the SPP mode.
Experimentally, the excitation of a SPP is observed as a dip in the angle-dependent
reflectivity.
Previously, the grating-coupled SPP method has successfully been used to characterise
metals including copper [Nash et al. (1995)] and silver [Nash et al. (1996)], and
Steinmüller–Nethl et al. (1994) have reported the excitation of SPPs on a thin TiNx film
sputtered onto an approximately sinusoidally-modulated substrate. They recorded
angle-dependent reflectivities at four incident wavelengths in the visible regime and
compared them with those predicted from a rather simplistic treatment of the interaction
of radiation with the surface. This allowed them to estimate the dielectric function of

CHAPTER 4 Surface plasmon polariton study of the optical dielectric function of titanium nitride.
91
TiNx at these discrete wavelengths. The grating-coupled SPP method presents many
advantages over the other techniques described previously. For example, it does not
require transmittivity data or the determination of film thickness, hence permitting the
use of optically opaque metallic films. It can also be used to calculate the permittivity
of a material over a limited wavelength range without the knowledge of its optical
response elsewhere in the electromagnetic spectrum - there is no Kramers-Kronig based
interpretation.
This present study uses grating coupling of radiation to SPPs on a TiNx surface to obtain
the dispersion relation of the TiNx film. Values of the complex dielectric function are
determined at visible wavelengths by comparison of the in-plane reflectance from the
corrugated TiNx-air interface as a function of the angle of incidence, to the predictions
from a rigorous grating theory model which uses the differential formalism of
Chandezon et al. (1982). By varying the grating parameters used to generate a
theoretical reflectivity trace in the way demonstrated in the previous chapter, it is
possible to obtain a good quality fit to the experimental data and hence determine the
shape [Wood et al. (1995)] and optical permittivity [Nash et al. (1995 and 1996)] of the
TiNx surface.
4.4. Experimental
4.4.1. Sample preparation
The corrugated surface used in this work was prepared in silica by standard
interferographic techniques [Hutley (1982)]. The method of preparation involves the
exposure of spin-coated photoresist on a silica disc to the interference pattern produced
by first splitting and then recombining an argon-ion laser beam. After exposure, the
photoresist is chemically developed and the resulting profile transferred into the silica
by fast atom etching. This produces a robust and large area diffraction grating with a
well-defined pitch (in this case λg = 930 nm) and a uniform surface profile that is
somewhat distorted from a pure sinusoid. Subsequent deposition of an optically thick
( )d ≈ 600 nm layer of titanium nitride produces a metallic-air interface that may
support SPPs (Figure 4.4.1).

CHAPTER 4 Surface plasmon polariton study of the optical dielectric function of titanium nitride.
92
The TiNx film was deposited by TEER Coatings Ltd (Kidderminster, UK) using the
closed field unbalanced magnetron sputter ion plating system [Monaghan et al. (1993)].
The substrate is ion-cleaned before deposition that ensures a high degree of adherence
to the silica surface. Initial sputtering is from a pure titanium target which is
“poisoned” by bleeding nitrogen into the coating chamber. In order to attempt to
control the titanium/nitrogen ratio of the sputtered sample, the intensity of 501 nm
radiation emitted from the target is monitored. From past experience, it is thought that
approximately stoichiometric TiNx may be deposited on the substrate when the intensity
of radiation falls to 60% of the original value. The coating pressure in the chamber,
back filled with Ar gas, was 4 10 3× − Torr and the substrate bias voltage and
temperature were 30 V and approximately 150 °C respectively.
Figure 4.4.1 SEM image the of TiNx-coated diffraction grating used in this study.
The contrast of the image is not as high as one would expect from a similar gold-
coated sample due to the lower electrical conductivity of TiNx.
CHAPTER 4 Surface plasmon polariton study of the optical dielectric function of titanium nitride.
93
4.4.2. Reflectivity Measurements
Previous workers, for example Pascual et al. (1991), have shown the real part of the
dielectric function of TiNx to be negative, and therefore able to support interface modes,
at wavelengths in excess of approximately 500 nm. The wave vector of the incident
radiation in the dielectric is 01kn (where k c0 02= =ω π λ and 0003.11 =n is the
refractive index of air) and it is only possible to couple to the SPP when the in-plane
component of this has been suitably enhanced. As previously discussed in Chapter 2,
this mechanism is provided by the grating’s periodicity, which may increase or decrease
the in-plane component of 01kn by integer multiples of the grating wave vector, gk
( k g = 2π λg ). Hence, the enhanced wave vector of evanescent fields associated with
non-propagating diffracted orders allows incident radiation to couple to the SPP when
the following condition is satisfied
gSPP Nn kkk ±= θsin01 Equation 4.4.1.
Here N is an integer, SPPk is the wave vector of the SPP and θsin01kn is the projection
of the wave vector of the incident radiation parallel to kg .
The SPP resonances were monitored by recording the specularly reflected intensity
from the TiNx–air interface as a function of the angle of incidence using the apparatus
shown in Figure 4.4.2.

CHAPTER 4 Surface plasmon polariton study of the optical dielectric function of titanium nitride.
94
A monochromator is used to illuminate the sample, which has a working range of
approximately nm 900450 0 << λ . Passing the beam through two apertures produces a
well collimated beam with an area of ∼1 mm2. The incident light is mechanically
chopped with a frequency of approximately 1200 Hz and a graduated polariser sets the
polarisation of the beam to an accuracy of °± 1.0 . The beam splitter is used to reflect
about 4% of the incident radiation into a reference detector, the output from which is
later used to normalise the main signal to correct for small changes in beam intensity.
The detectors are large area silicon photomultipliers that have had their casings removed
so that the beam is incident directly on the silicon wafer. This minimises the problems
associated with detector function should the beam move a small distance across the
detector during an experiment.
The sample is mounted on a x-z stage that is fixed to a rotating table, allowing the
accurate positioning of the grating over the centre of rotation. The signal detector is
mounted on the table such that it rotates at twice the speed of the sample allowing it to
Figure 4.4.2 Schematic representation of the experimental set up used to
record angle dependent reflectivity data from a diffraction grating. In order
for the signal detector to track the specularly reflected beam, the signal
detector rotates at twice the rate of the grating mounted on the table.

CHAPTER 4 Surface plasmon polariton study of the optical dielectric function of titanium nitride.
95
accurately track the zeroth-order-reflected beam. The outputs from both the signal and
reference detectors are fed into individual phase sensitive detectors (PSDs) which
extract the component of the signal that is modulated at the chopper frequency. The
outputs from the PSDs are connected to a computer that also controls the rotating table.
It divides the main signal by the reference signal and stores the result as a function of
angle on the hard disk. The angular scan rate is carefully set so that it is always
significantly slower than the PSD time constant.
In order to obtain absolute reflectivity data, a normalisation scan is taken by removing
the sample and directly measuring the signal from the light source (with appropriate
filters added in its path). When the signal is divided by the reference, this yields the
normalisation constant by which the reflectivity data from the grating is divided.
In order to calibrate the angular position of the table, the zero angle is set by sending the
reflected beam from the grating back down the incident beam path and through both
apertures. Although the table may be rotated with a precision of °± 01.0 , normal
incidence can be set to an accuracy of °± 03.0 . The azimuthal angle (ϕ) of the grating
is set to zero with an accuracy of °± 05.0 by ensuring all the diffracted orders lie in the
plane of incidence. This may be achieved by ensuring that at the Littrow angles, the
respective diffracted beams pass back down the incident path and through both the
apertures.
In this study, a number of angle-dependent scans have been undertaken using
monochromatic, p-polarised (TM) radiation. The incident wavelengths range from 500
to 875 nm in 25 nm steps and are incident upon the sample in a plane parallel to the
grating wave vector ( )ϕ = °0 .

CHAPTER 4 Surface plasmon polariton study of the optical dielectric function of titanium nitride.
96
4.4.3. Using the grating modelling theory
Each of the normalised experimental angle-dependent reflectivity scans were fitted by a
least-squares procedure using the scattering matrix [Cotter et al. (1995)] technique
based on the differential formalism of Chandezon et al. (1982) which was discussed in
Chapter 3. The grating profile is described by a Fourier series
( ) ( ) ( )A x a k x a k x a Nk xg g N g( ) cos cos cos= + + + +1 2 2 … … Equation 4.4.2
Hence by fitting the reflectivity data to the modelling theory, it is possible to
parameterise the grating profile and characterise the dielectric function of the metallic
material.
In order to provide an accurate description of the complex dielectric function of TiNx, it
is first necessary to be confident of the surface profile. In the visible regime, it is well
documented [for example, Nash et al. (1996)] that the real part of the dielectric function
of silver is more negative, and the imaginary part much smaller than the corresponding
values for TiNx. Hence the surface plasmon resonances on a silver/air interface are far
better defined, consequently giving more sensitivity to the grating profile. Therefore, in
order to obtain a good first approximation to the profile of the TiNx-coated surface, an
optically thick layer of silver is thermally evaporated on top of the TiNx. The pitch of
the grating was chosen so that when ϕ = °0 , incident light of wavelength, λ0 590= nm
will excite first, second and third order SPP resonances (N = 1,2,3) which may be
observed as resonant features in an angle of incidence scan. By fitting the optical data
from the silver surface to the predicted optical response using the theory described
previously, it is possible to obtain a good estimate of the three Fourier amplitudes of the
corrugated surface that provide the direct coupling mechanism for the three SPP
resonances. This truncated Fourier series can then be used in the fitting of data obtained
from the TiNx-coated surface over the whole spectral regime. Subsequently, after
further fitting, allowing all the surface parameters to vary, a new profile for the TiNx
surface is obtained by averaging the Fourier components over all wavelengths. This
new average profile is then held constant at all wavelengths and the data finally refitted
in order to obtain the complex dielectric constant at each of the wavelengths studied.

CHAPTER 4 Surface plasmon polariton study of the optical dielectric function of titanium nitride.
97
4.5. Results
Figure 4.5.1 shows three sets of typical reflectivity data at incident wavelengths of
nm 650 , nm 725 and nm 800 . The solid lines are the theoretical fits, which are in very
good agreement with the data (circles). The optical properties of TiNx are often likened
to those of gold, but the off-resonance reflectivity of less than 50% is clearly less than
the ~90% to be expected from gold [Watts et al. (1997a)]. In addition, the resonances
themselves are broad and shallow. This indicates that TiNx, compared to gold, has an
increased ε ′′ and probably a less negative ε ′ .
As indicated above, the profile of the grating is initially estimated from the optical
characterisation of the silver surface, and then improved by fitting to the TiNx data. The
pitch, as defined by the angular positions of the Rayleigh anomalies in the experimental
reflectivity data was calculated to be λg = ±9301 05. . nm with the permittivity of the
dielectric (air) set as 0006.12
11 == nε . The grating profile used in the final fits to
determine the dielectric function of TiNx at each of the wavelengths studied is
nm 4.341 =a , nm 2.92 =a and nm 0.13 =a , and the values of the complex dielectric
constants of the TiNx determined from these fits are listed in Table
4.5.1 ( )εεε ′′+′= iTiN . The errors in these values are dominated by an uncertainty in the
Fourier coefficients of the grating profile. This is attributed to the low sensitivity of the
broad and shallow resonance features to the various Fourier coefficients. There is also a
variation in the uncertainty over the wavelength range due to a change in the number of
SPP resonances observable at different wavelengths in the angle of incidence scans. In
addition, there is an increase in the uncertainty when two reflectivity minima overlap,
and also as the coupling strength to the resonances decrease as the limit 0=′ε is
approached . The results presented in this work, along with those of Karlsson et al.
(1982), Rivory et al. (1981), Szczyrbowski et al. (1988), Pascual et al. (1981), Valkonen
et al. (1986) and Steinmüller-Nethl et al. (1994) are illustrated in Figure 4.5.2.

CHAPTER 4 Surface plasmon polariton study of the optical dielectric function of titanium nitride.
98
Figure 4.5.1 The experimental angle-dependent reflectivities (�, one point in five
plotted for clarity) compared with the theoretically-modelled reflectivities ()
created from a single set of parameters describing the grating profile. (a), (b) and
(c) show Rpp reflectivity measurements (i.e. p-polarised (TM) radiation was incident
and detected) at incident wavelengths of 650 nm, 725 nm and 800 nm respectively.
The values of the dielectric constants at these wavelengths that were obtained by
fitting the model to the experimental data are shown in Table 4.5.1 below.
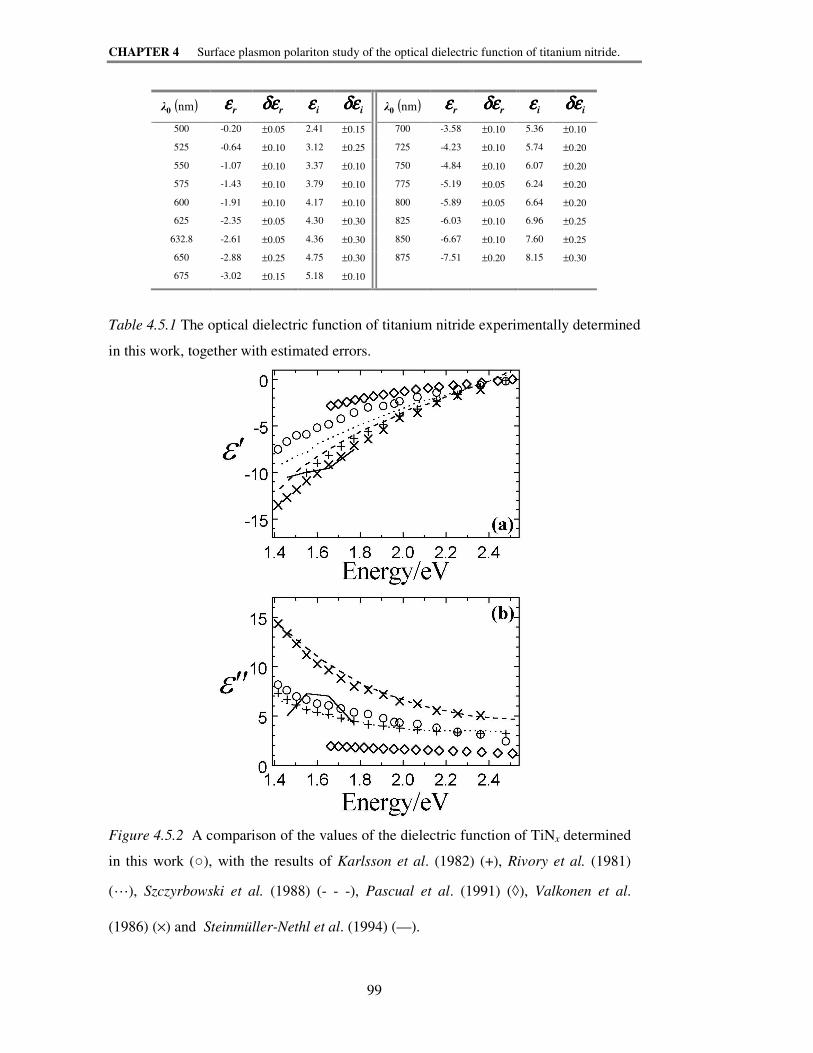
CHAPTER 4 Surface plasmon polariton study of the optical dielectric function of titanium nitride.
99
( )nm 0λ εεεεr δεδεδεδεr εεεε i δεδεδεδε i ( )nm 0λ εεεεr δεδεδεδεr εεεε i δεδεδεδε i
500 -0.20 ±0.05 2.41 ±0.15 700 -3.58 ±0.10 5.36 ±0.10
525 -0.64 ±0.10 3.12 ±0.25 725 -4.23 ±0.10 5.74 ±0.20
550 -1.07 ±0.10 3.37 ±0.10 750 -4.84 ±0.10 6.07 ±0.20
575 -1.43 ±0.10 3.79 ±0.10 775 -5.19 ±0.05 6.24 ±0.20
600 -1.91 ±0.10 4.17 ±0.10 800 -5.89 ±0.05 6.64 ±0.20
625 -2.35 ±0.05 4.30 ±0.30 825 -6.03 ±0.10 6.96 ±0.25
632.8 -2.61 ±0.05 4.36 ±0.30 850 -6.67 ±0.10 7.60 ±0.25
650 -2.88 ±0.25 4.75 ±0.30 875 -7.51 ±0.20 8.15 ±0.30
675 -3.02 ±0.15 5.18 ±0.10
Table 4.5.1 The optical dielectric function of titanium nitride experimentally determined
in this work, together with estimated errors.
Figure 4.5.2 A comparison of the values of the dielectric function of TiNx determined
in this work (○), with the results of Karlsson et al. (1982) (+), Rivory et al. (1981)
(�), Szczyrbowski et al. (1988) (- - -), Pascual et al. (1991) (◊), Valkonen et al.
(1986) (×) and Steinmüller-Nethl et al. (1994) (—).

CHAPTER 4 Surface plasmon polariton study of the optical dielectric function of titanium nitride.
100
4.6. Discussion
It is well known that the optical properties of TiNx films are strongly dependent on the
deposition conditions, film thickness and the titanium-to-nitrogen ratio. Therefore, the
variation in the values of ε ′ and ε ′′ , as illustrated in Figure 4.5.2 is not surprising. The
works of Karlsson et al. (1982) and Rivory et al. (1981) both consider opaque samples
(d > 100 nm) of similar stoichiometries ( )x = 1 , and use identical characterisation
techniques in order to obtain the optical constants. As a result, the dielectric function of
their respective samples compare favourably. Szczyrbowski et al. (1988) and Valkonen
et al. (1986) have both sputtered much thinner films ( d < 31 nm) and although their
values of ε ′ are comparable to those of other workers, their values of ε ′′ are
considerably higher due to increased electron scattering. The “thin” films obtained by
PACVD and investigated over visible wavelengths by Pascual et al. (1981) show the
most anomalous results. It is not clear why their results give values for both parts of the
complex dielectric function which are smaller in magnitude than other studies.
Steinmüller-Nethl et al. (1994) used a grating-coupled SPP technique to characterise the
optical properties of their magnetron-sputtered film at four wavelengths. They appear
to have been the first to record SPP excitation on TiNx. Their films were of comparable
thickness to those of Szczyrbowski et al. (1988) and Valkonen et al. (1986) [ ]nm 50=d ,
however they do not show the associated increase in ε ′′ . It should be noted that their
data fitting technique is based on a pertubative approach to Fresnel equations, and they
assume shallow ( 0.07 pitchdepth < ), purely sinusoidal gratings. In view of the fact
that their grating is produced by interferographic exposure, followed by ion-etching,
then the profile is likely to be distorted significantly from the assumed shape. This
results in poor quality fits and the errors associated with their deduced values of ε ′ and
ε ′′ will be large.
To summarise, this chapter has provided a comprehensive study of the SPP on a TiNx
sample using a rigorous model of the optical response of metallic gratings to fit the
experimental reflectivity data from an optically thick (d ≈ 600 nm) sputtered film. The
grating profile is accurately modelled as a distorted sinusoidal surface by representing it
as a truncated Fourier Series and using the theoretical model described previously.
From this, fits may be produced that show excellent agreement with the experimental

CHAPTER 4 Surface plasmon polariton study of the optical dielectric function of titanium nitride.
101
reflectivities (Figure 4.5.1). The experimentally determined dielectric function (Figure
4.5.2) illustrates that ε ′ is slightly smaller in magnitude than deduced by other workers
for similar films [Karlsson et al. (1982) and Rivory et al. (1981)] however ε ′′ shows
good agreement with these other studies.
4.6.1. The free-electron behaviour of TiN, and its interband transitions
If the dielectric function of TiNx is dominated by a free-electron behaviour at the
wavelengths studied in this work, the data presented here would be expected to conform
to the Drude model, i.e.
( ) ( )22
22
1 τω
τωεωε
+−∞=′ p
Equation 4.6.1
( )( )22
2
1 τωω
τωωε
+=′′ p
Equation 4.6.2
where τ is the relaxation time, ωp is the plasma frequency and ( )∞ε is the residual
dielectric constant (conventionally assumed to be unity). Therefore, as a first-order
approximation, linear relationships should be expected by plotting ε ′ against λ2 and ε ′′
against λ3 . Plotting the data in this way gives the curves of Figure 4.6.1(a) and (b)
respectively.
Figure 4.6.1 (a) shows a high degree of linearity, the y-intercept indicating a residual
dielectric constant greater than unity. This can be attributed to a positive contribution to
ε ′ from the occurrence of interband transitions as predicted by a number of previous
workers [Karlsson et al. (1982), Schlegel et al. (1977), Rivory et al. (1981), François et
al. (1985) and Böhm et al. (1972)]. The linear fit toε ′′ is less convincing and hence also
suggests that the optical response of TiNx is not purely Drude-like in nature. In
addition, previous workers have illustrated that the point at which 0=′ε is situated at a
much lower energy than the predicted plasma resonance. The crossing of the 0=′ε
axis is associated with a screened plasma resonance which has been shifted to lower
energies by the onset of interband transitions at photon energies above 2.5 eV
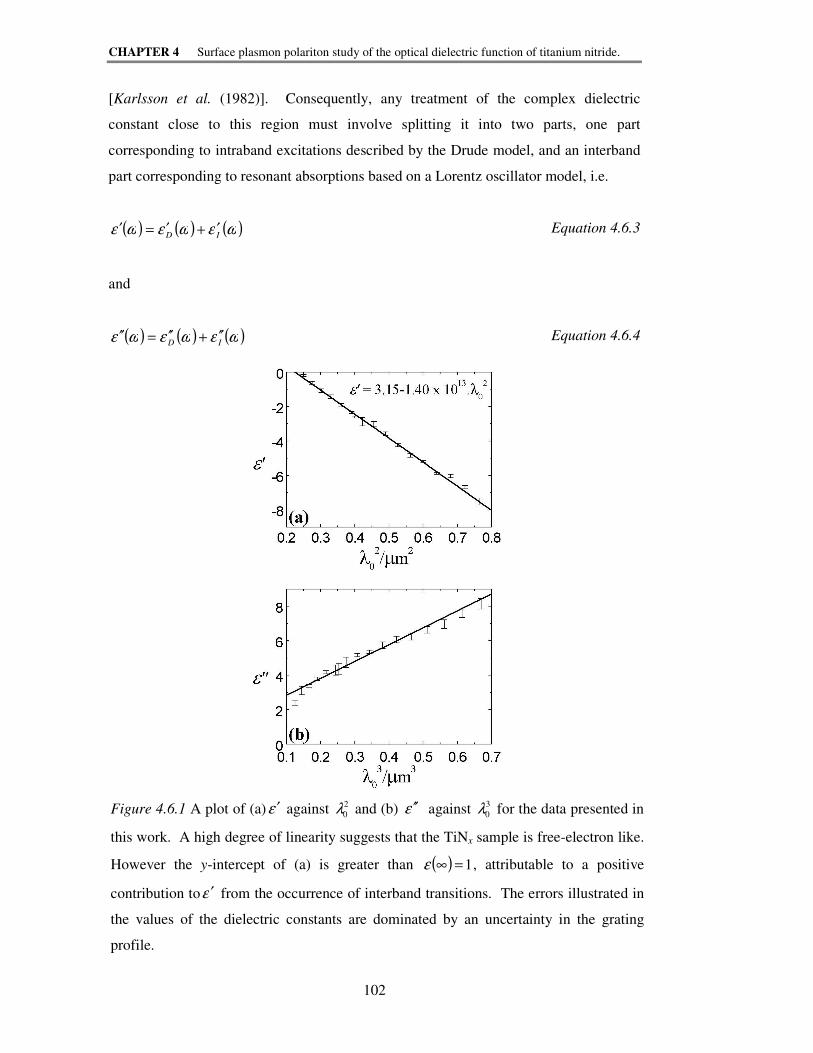
CHAPTER 4 Surface plasmon polariton study of the optical dielectric function of titanium nitride.
102
[Karlsson et al. (1982)]. Consequently, any treatment of the complex dielectric
constant close to this region must involve splitting it into two parts, one part
corresponding to intraband excitations described by the Drude model, and an interband
part corresponding to resonant absorptions based on a Lorentz oscillator model, i.e.
( ) ( ) ( )ωεωεωε ID′+′=′ Equation 4.6.3
and
( ) ( ) ( )ωεωεωε ID′′+′′=′′ Equation 4.6.4
Figure 4.6.1 A plot of (a)ε ′ against λ0
2 and (b) ε ′′ against λ0
3 for the data presented in
this work. A high degree of linearity suggests that the TiNx sample is free-electron like.
However the y-intercept of (a) is greater than ( ) 1=∞ε , attributable to a positive
contribution toε ′ from the occurrence of interband transitions. The errors illustrated in
the values of the dielectric constants are dominated by an uncertainty in the grating
profile.
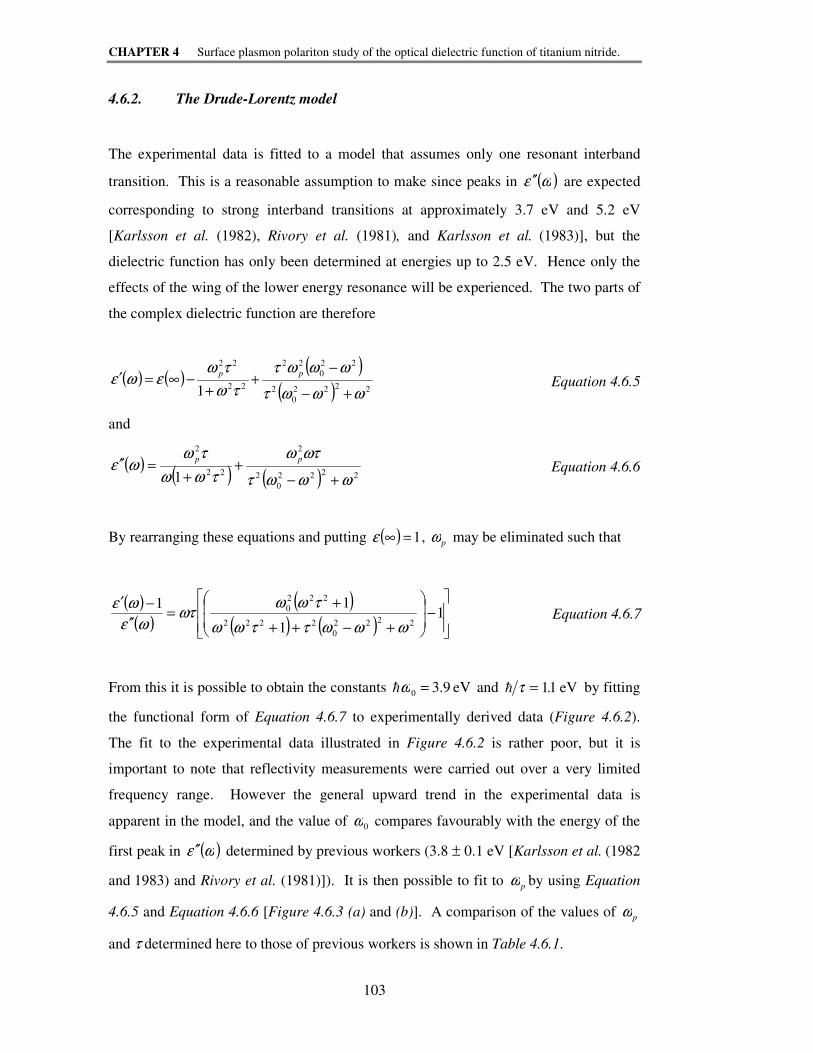
CHAPTER 4 Surface plasmon polariton study of the optical dielectric function of titanium nitride.
103
4.6.2. The Drude-Lorentz model
The experimental data is fitted to a model that assumes only one resonant interband
transition. This is a reasonable assumption to make since peaks in ( )ωε ′′ are expected
corresponding to strong interband transitions at approximately 3.7 eV and 5.2 eV
[Karlsson et al. (1982), Rivory et al. (1981), and Karlsson et al. (1983)], but the
dielectric function has only been determined at energies up to 2.5 eV. Hence only the
effects of the wing of the lower energy resonance will be experienced. The two parts of
the complex dielectric function are therefore
( ) ( )( )
( ) 2222
0
2
22
0
22
22
22
1 ωωωτ
ωωωτ
τω
τωεωε
+−
−+
+−∞=′ pp
Equation 4.6.5
and
( )( ) ( ) 2222
0
2
2
22
2
1 ωωωτ
ωτω
τωω
τωωε
+−+
+=′′ pp
Equation 4.6.6
By rearranging these equations and putting ( ) 1=∞ε , ωp may be eliminated such that
( )( )
( )( ) ( )
−
+−++
+=
′′
−′1
1
11
2222
0
2222
222
0
ωωωττωω
τωωωτ
ωε
ωε Equation 4.6.7
From this it is possible to obtain the constants eV 9.30 =ω� and � τ = 11. eV by fitting
the functional form of Equation 4.6.7 to experimentally derived data (Figure 4.6.2).
The fit to the experimental data illustrated in Figure 4.6.2 is rather poor, but it is
important to note that reflectivity measurements were carried out over a very limited
frequency range. However the general upward trend in the experimental data is
apparent in the model, and the value of ω0 compares favourably with the energy of the
first peak in ( )ωε ′′ determined by previous workers (3.8 ± 0.1 eV [Karlsson et al. (1982
and 1983) and Rivory et al. (1981)]). It is then possible to fit to ωp by using Equation
4.6.5 and Equation 4.6.6 [Figure 4.6.3 (a) and (b)]. A comparison of the values of ωp
and τ determined here to those of previous workers is shown in Table 4.6.1.

CHAPTER 4 Surface plasmon polariton study of the optical dielectric function of titanium nitride.
104
Study Sample preparation method x pω� (eV) τ� (eV)
Karlsson et al. (1982) CVD 1 6.29 0.30
Schlegel et al. (1977) CVD - 6.9-7.0 0.6-0.8
Rivory et al. (1981) Reactive sputtering ≈1 8.7 1.3
Böhm et al. (1972) Solid solution 0.94 8.9 1.22
Kurtz et al. (1986) CVD - 5.62-6.25 0.93-1.27
Szczyrbowski et al. (1988) Reactive sputtering 1.16 7.5 1.1
Valkonen et al. (1986) Reactive sputtering - 7.0-7.1 0.4-0.6
Present Reactive sputtering >1 5.8 1.1
Table 4.6.1 A comparison of the values of �ω p and � τ of TiNx
experimentally determined in this work, along with the values obtained by a
number of previous workers. The nitrogen/titanium ratio (x) and deposition
method is also listed for comparison.
Figure 4.6.2 By assuming a one-resonance Drude-Lorentz model, a function
relating the two parts of the complex dielectric function is obtained, dependent
only on 0 ,ωω and τ (Equation 4.6.7). Values of this function calculated using
the experimentally determined dielectric constants and uncertainties (error
bars) are compared with the fitted theoretical function (solid line). Thus, it is
possible to determine the values of 0ω and τ.

CHAPTER 4 Surface plasmon polariton study of the optical dielectric function of titanium nitride.
105
Figure 4.6.3 The (a) real part, (b) imaginary part, and the associated
uncertainties in the dielectric function of TiNx determined in the
present work. The experimental data (error bars) has been modelled
using Equation 4.6.5 and Equation 4.6.6 in order to obtain the
plasma frequency,ω p . The resulting fit is shown as a solid line.
On examination of Table 4.6.1, it is apparent that there is a large spread of values of
both ωp and τ, dependent on the deposition conditions and stoichiometry of the sample.
The plasma frequency and relaxation time calculated in the present study are among the
lowest observed, indicating a sample of reduced metallic nature which can at least in
part be attributed to a large nitrogen/titanium ratio (x). Indeed, this is confirmed by
electron energy dispersive spectroscopy measurements which indicate that x is well in
excess of unity.
CHAPTER 4 Surface plasmon polariton study of the optical dielectric function of titanium nitride.
106
4.7. Summary
In this chapter the dielectric function of TiNx has been determined throughout the
visible regime using a grating-coupled SPP resonance technique. This technique
presents a number of advantages over more conventional characterisation methods. For
it is only necessary to take reflectivity data at the individual wavelengths at which one
wishes to calculate the dielectric function, and no measurement of the film thickness is
required. An excellent agreement between the differential formalism of Chandezon et
al. (1982) and experimental reflectivities has been obtained, and the resulting dielectric
function compares favourably with that determined by previous workers. By making
the assumption that TiNx is only free-electron like in its optical response, it has been
demonstrated that the Drude model alone is too simplistic. Instead, a Drude-Lorentz
model is more appropriate that assumes a single resonant interband transition, in order
to obtain the plasma frequency and relaxation time. A comparison of constants
determined from this work and previous studies shows a large spread of results,
illustrating the dependence on the stoichiometry and deposition conditions of the
sample.

CHAPTER 5 The plasmon study of the optical dielectric function of indium
107
CHAPTER 5
The plasmon study of the optical dielectric
function of indium
5.1. Introduction
The last chapter demonstrated how the optical excitation of SPPs may be used to
characterise the complex dielectric function of titanium nitride. In this chapter, a
similar technique is used to optically characterise indium for a range of wavelengths in
the visible region of the spectrum. By exciting the SPPs at a buried indium/grating
interface, the indium surface that supports the SPP is kept free from oxidation.
Comparison of angle-dependent reflectivities with a grating modelling theory gives both
the real and imaginary parts of the dielectric function of indium. These results are
compared with free-electron models to obtain an estimate of the plasma frequency and
relaxation time.
5.2. Background
Metals that have negative real parts to their dielectric response function in the visible
region of the spectrum are able to support optically excited surface plasmon polaritons
(SPPs). The best known, and most commonly utilised, are silver [e.g. Pockrand (1974)
and Nash et al. (1996)] and gold [e.g. Ritchie et al. (1968) and Nash et al. (1995)] with
which a variety of experimental studies have been undertaken. These two metals have
received considerable attention for three primary reasons. Firstly they are considered
relatively inert and so are not rapidly contaminated allowing 'free' surfaces to be
explored in air. Secondly they are quite readily deposited by vacuum evaporation as thin
films, which is advantageous for many studies. Thirdly, they have optical permittivities
( )εεε ′′+′= i that for silver for the whole visible spectrum, and for gold above 550 nm,
satisfy εε ′′>>′ and 1<<′ε . This leads to relatively narrow surface plasmon

CHAPTER 5 The plasmon study of the optical dielectric function of indium
108
resonances that may be readily observed optically. Other materials that are more easily
oxidised have been studied using SPPs at buried interfaces using prism coupling. These
include aluminium [Tillin and Sambles (1988)], magnesium [Tillin and Sambles (1989)]
and recently zinc [Nash and Sambles (1998)]. This last study also employs grating
coupling to a buried interface, a technique previously used by Nash and Sambles to
characterise silver (1996). Here this optical excitation of SPPs at a buried grating
interface is extended to an exploration of the dielectric response function of indium.
There are good reasons for supposing that indium will support SPRs since its optical
response function, as deduced from Théye and Devant's work (1969), is such as to
satisfy 1<<′ε although ε ′ is only just larger than ε ′′ . This latter fact suggests rather
broad resonances. In addition Kovacs (1969) recorded surface plasmon resonances
from indium films encapsulated by MgF2 layers. He explored nm 19 , nm 27 and
nm 42 thick indium layers and obtained data with 540 nm light, which gave results
consistent with the permittivity given by Théye and Devant ( i773.9011.29 +−=ε ).
Examination of the literature reveals that the values given by Théye and Devant,
deduced from optical reflectance and transmittance of thin films of indium, are probably
the most reliable since they have carefully taken into account the oxide layer which
inevitably forms when the films are exposed to air. Other results [Ageev and
Shklyarevskii (1968), Golvashkim et al. (1967) and Burtin (1964)], presented also by
Théye and Devant for the real, n, and imaginary, k, parts of the refractive index of
thicker indium, are substantially different. For example, at eV 2 , while Théye and
Devant give i3.144.38 +−=ε , Ageev and Shklyarevskii find i0.54.20 +−=ε and
Glovashkia et al. find i0.92.27 +−=ε [A further study by Oker et al. (1982) on thin
films shows disturbing variations of ε with wavelength, having unreasonably small
values of ε ′ , and should be discounted]. It is in view of these differences, which may
in part be due to the lack of correct treatment of the indium oxidation, but may also be
associated with the difference in film character, that this study has been undertaken. It
presents an exploration of the dielectric response function of indium over the visible
spectrum by resonant excitation of the SPP at a buried grating interface of a very thick,
effectively bulk film.
CHAPTER 5 The plasmon study of the optical dielectric function of indium
109
5.3. Experimental
There are two essential requirements for optically exciting SPPs at a clean indium
interface. Firstly the interface needs to be protected from oxidation - it needs to be a
buried interface. Secondly, and as described in Chapter 2, there has to be a method for
providing sufficient in-plane additional momentum to allow coupling of incident
photons to the SPP. Both of these requirements are met by depositing, in vacuum, the
indium film on to a silica grating.
A grating of pitch of order 800 nm is fabricated in silica by interferographic exposure of
a suitable photoresist on a flat silica substrate, followed by chemical development and
atom etching. This produces a high quality grating with well-defined, uniform, pitch
having a profile which is slightly distorted from a pure sinusoid. On this cleaned silica
grating was deposited, by thermal evaporation in a vacuum of Pa 10 4−< , a layer of
99.99% pure indium, to a thickness of order 500 nm (fully optically opaque). On
removal from the vacuum this layer was overcoated with a thin lacquer layer to limit
progressive oxidation of the indium.
The excitation of the SPPs were recorded as minima in the angle dependent reflectivity
of p-polarised (transverse magnetic) light incident in a plane normal to the grating
groove direction. To allow access to a wide range of in-plane momenta, a 45o, 45o, 90o
silica prism was attached to the flat face of the silica grating substrate by means of a
fluid of matching index (Figure 5.3.1). Light incident upon the prism passes through
the matching fluid and silica substrate arriving undeflected at the silica/indium grating
interface. Angle dependent reflectivities were corrected for reflections at the air/prism
entrance face and the prism/air exit face, and normalised to the incident beam intensity
before being fitted by modelling theory.

CHAPTER 5 The plasmon study of the optical dielectric function of indium
110
Data, which were recorded over the wavelength range 400 to 900 nm, in 25 nm steps
were fitted by an iterative least-squares minimisation procedure using rigorous grating
modelling theory based on the formalism of Chandezon et al. (1982) described in
Chapter 3. By use of the most noise-free data taken at the centre of the wavelength
range studied it is possible to obtain in detail the grating pitch and the first three Fourier
coefficients of its amplitude profile. With this information established, all the remaining
data is fitted using these profile parameters to yield ε ′ and ε ′′ of the indium layer.
Typical fitted data are shown in Figure 5.3.2.
Figure 5.3.1 Schematic diagram illustrating the sample used in this study. To allow
access to a wide range of in-plane momenta a 45o, 45o, 90o silica prism is attached to
the flat face of the silica grating substrate by means of a fluid of matching index. Light
incident upon the prism passes through the matching fluid and silica substrate and
arrives undeflected at the buried silica/indium grating interface. A thin lacquer layer
deposited on top of the indium prevents progressive oxidisation through the film.

CHAPTER 5 The plasmon study of the optical dielectric function of indium
111
Figure 5.3.2 Typical experimental angle-dependent reflectivities (�, only one point in
five plotted for clarity) compared with the theoretically-modelled reflectivities ()
created from a single set of grating profile parameters. (a), (b) and (c) show the ppR
reflectivity measurements (i.e. p-polarised [TM] radiation was incident and detected) at
incident wavelengths of 500 nm, 700 nm and 900 nm respectively. The values of the
dielectric constants that were obtained by fitting the model to the experimental data for
each wavelength studied are shown in Table 5.4.1.

CHAPTER 5 The plasmon study of the optical dielectric function of indium
112
5.4. Results
The optical permittivity values found from the fits to the angle-dependent reflectivity
data are listed in Table 5.4.1 and presented graphically in Figure 5.4.1. Also given for
comparison are some of the results of Théye and Devant over the same region of the
spectrum. There are clearly systematic discrepancies between the two sets of data with
the real permittivities deduced here being less negative and the imaginary permittivities
being less positive. However the data show similar overall trends with ε ′ becoming
more negative in an almost linear fashion with wavelength while ε ′′ rises more rapidly.
The simplest explanation for the differences between the data rests with the form of the
sample. The sample used here is much thicker, it is protected from oxidation and will
correspondingly have a different grain structure and a different relaxation time.
Wavelength
(nm) ε ′ ε ′′ Reference Wavelength
(nm) ε ′ ε ′′ Reference
400 -15.9 4.3 Théye & Devant 600 -26.8 9.4 this work
400 -11.8 3.6 this work 625 -30.0 10.5 this work
420 -17.4 4.9 Théye & Devant 650 -39.0 15.7 Théye & Devant 425 -13.4 4.1 this work 650 -31.1 11.3 this work
440 -19.1 5.6 Théye & Devant 675 -33.2 12.3 this work
450 -15.9 4.8 this work 700 -45.7 18.4 Théye & Devant 460 -21.1 6.3 Théye & Devant 700 -35.6 13.2 this work
475 -17.6 5.6 this work 725 -36.7 14.3 this work
480 -22.9 7.1 Théye & Devant 750 -51.8 22.6 Théye & Devant 500 -25.5 8.2 Théye & Devant 750 -39.2 15.4 this work
500 -19.6 6.7 this work 775 -41.0 16.9 this work
520 -26.7 8.8 Théye & Devant 800 -56.2 26.8 Théye & Devant 525 -21.9 7.1 this work 800 -41.7 17.6 this work
540 -28.8 10.0 Théye & Devant 825 -43.7 19.4 this work
550 -23.3 7.9 this work 850 -62.8 31.6 Théye & Devant 560 -30.4 10.8 Théye & Devant 850 -45.3 20.7 this work
575 -24.8 8.3 this work 875 -46.9 21.9 this work
580 -32.5 11.7 Théye & Devant 900 -64.6 35.2 Théye & Devant 600 -34.0 12.6 Théye & Devant 900 -47.5 23.8 this work
Table 5.4.1 The optical dielectric function of indium experimentally determined in this
work, together with the results determined by Théye and Devant (1969).

CHAPTER 5 The plasmon study of the optical dielectric function of indium
113
5.5. Discussion
Because of the simple functional dependence of ε ′ on wavelength seen in Figure
5.4.1(a), it is tempting to use a Drude model to interpret the data. From Equations 4.6.1
and 4.6.2, note that ( )1–– εε ′′′ should vary linearly with 0λ , with a slope of τπc21 .
Such a plot is shown in Figure 5.5.1 giving a straight line from 625 to nm 900 ,
indicating that indium illustrates free-electron-like behaviour in this range. The gradient
from this figure gives a relaxation time of s 100.04)01.1( -15×± . In addition, Figure
5.5.2 shows a graph of 1)1( −′− ε plotted against 2–λ (from Equation 4.6.1) , the gradient
of such a plot yields a pω� value of eV 0.18.12 ± . The errors in all of the above values
have been calculated by making a comparison between a straight-line fit to all the data
Figure 5.4.1 A comparison of the values of the dielectric function of indium
determined in this work (�) , compared with those determined by Théye and Devant
(�). Top: real component (ε ′ ). Bottom: imaginary component (ε ′′ ).
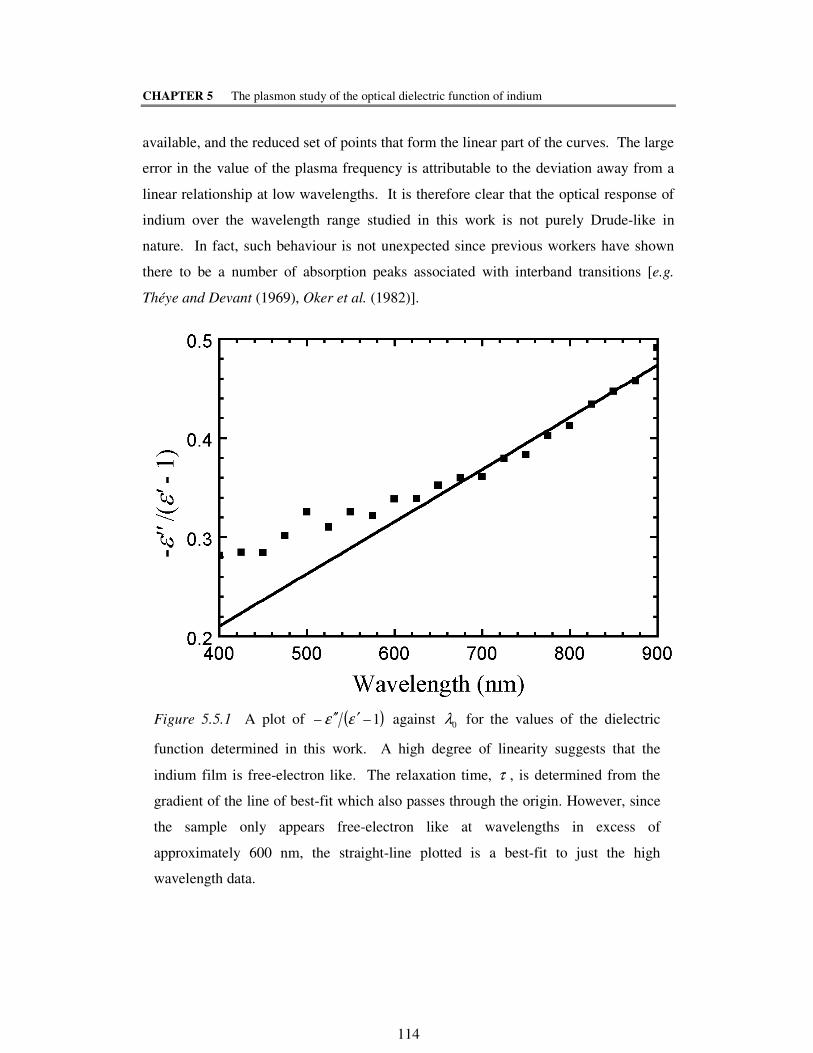
CHAPTER 5 The plasmon study of the optical dielectric function of indium
114
available, and the reduced set of points that form the linear part of the curves. The large
error in the value of the plasma frequency is attributable to the deviation away from a
linear relationship at low wavelengths. It is therefore clear that the optical response of
indium over the wavelength range studied in this work is not purely Drude-like in
nature. In fact, such behaviour is not unexpected since previous workers have shown
there to be a number of absorption peaks associated with interband transitions [e.g.
Théye and Devant (1969), Oker et al. (1982)].
Figure 5.5.1 A plot of ( )1–– εε ′′′ against 0λ for the values of the dielectric
function determined in this work. A high degree of linearity suggests that the
indium film is free-electron like. The relaxation time, τ , is determined from the
gradient of the line of best-fit which also passes through the origin. However, since
the sample only appears free-electron like at wavelengths in excess of
approximately 600 nm, the straight-line plotted is a best-fit to just the high
wavelength data.
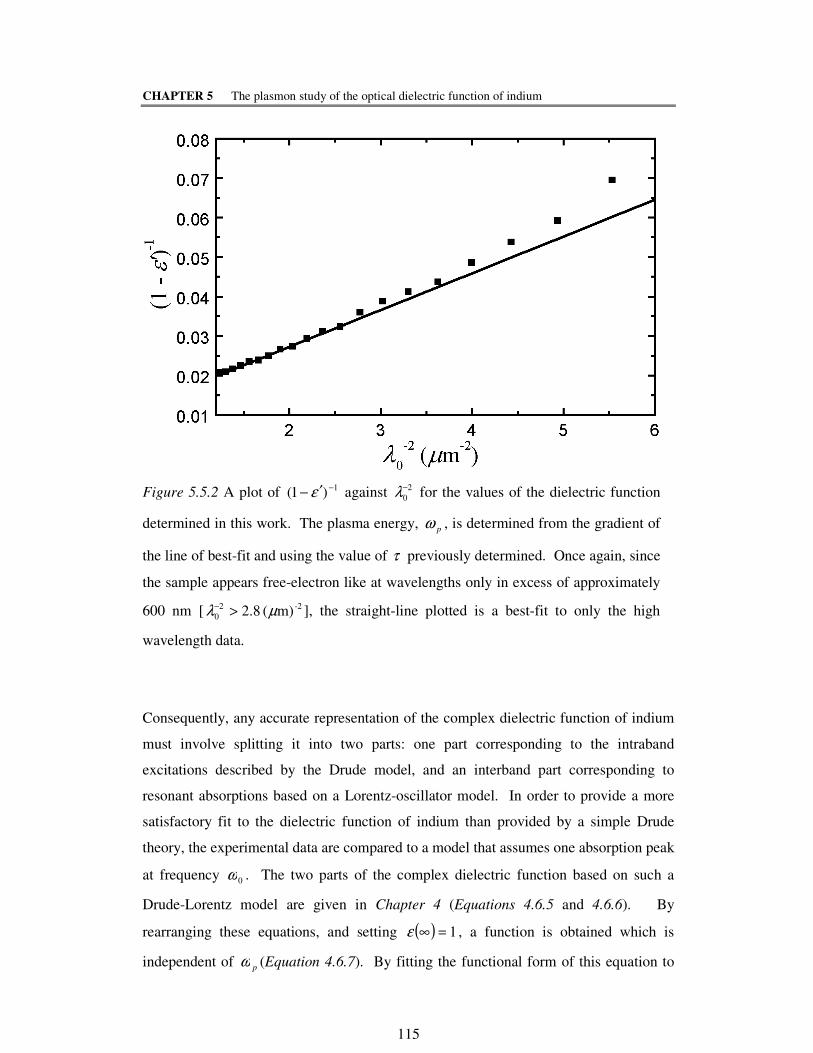
CHAPTER 5 The plasmon study of the optical dielectric function of indium
115
Consequently, any accurate representation of the complex dielectric function of indium
must involve splitting it into two parts: one part corresponding to the intraband
excitations described by the Drude model, and an interband part corresponding to
resonant absorptions based on a Lorentz-oscillator model. In order to provide a more
satisfactory fit to the dielectric function of indium than provided by a simple Drude
theory, the experimental data are compared to a model that assumes one absorption peak
at frequency 0ω . The two parts of the complex dielectric function based on such a
Drude-Lorentz model are given in Chapter 4 (Equations 4.6.5 and 4.6.6). By
rearranging these equations, and setting ( ) 1=∞ε , a function is obtained which is
independent of pω (Equation 4.6.7). By fitting the functional form of this equation to
Figure 5.5.2 A plot of 1)1( −′− ε against 2
0
−λ for the values of the dielectric function
determined in this work. The plasma energy, pω , is determined from the gradient of
the line of best-fit and using the value of τ previously determined. Once again, since
the sample appears free-electron like at wavelengths only in excess of approximately
600 nm [ -22
0 m)( 8.2 µλ >− ], the straight-line plotted is a best-fit to only the high
wavelength data.

CHAPTER 5 The plasmon study of the optical dielectric function of indium
116
the experimental data, the constants s10)02.008.1( 15−×±=τ and eV 14.082.60 ±=ω�
are obtained (Figure 5.5.3). Both the real and imaginary parts of the experimentally
determined dielectric function may then be fitted to Equations 4.6.5 and 4.6.6, and by
using the values of τ and 0ω determined above to give eV 2.04.11 ±=pω� (Figure
5.5.4).
There are clear systematic discrepancies between the theoretical fits and the
experimental data shown in Figure 5.5.4. It should be noted that even though the
reflectivity measurements were carried out over a very limited frequency range, the
general trends in the model are clear in the experimentally determined results.
Furthermore, the two values of pω� determined by fitting the real and imaginary parts
of the dielectric function individually differ only by eV 1.0 . The discrepancy at low
Figure 5.5.3 By assuming a one-resonance Drude-Lorentz model, a function relating
the real and imaginary parts of the dielectric function may be obtained. By fitting
this function to the experimental data, values of τ and 0ω are obtained.

CHAPTER 5 The plasmon study of the optical dielectric function of indium
117
frequencies, particularly in the ε ′ data, may be due to the effect of a second absorption
band. In fact, an interband transition in the region of eV) 3.1(s rad 100.2 -115× has been
previously experimentally observed [Théye and Devant (1969)], and would agree with
the results presented here.
However, it is clear, that neither the simple Drude model, nor the one-resonance Drude-
Lorentz model describe indium accurately over the frequency range studied. A more
sophisticated model is therefore required, but such a multiple-resonance model would
have many degenerate solutions to the limited range of experimental data presented
here.
Figure 5.5.4 The results of fitting Equations 4.6.5 and 4.6.6 to the complex dielectric
function of indium determined in this study. The solid lines represent the theoretical
fits, and the squares and circles represent the experimentally determined values of ε ′
and ε ′′ respectively. Hence, the Drude-Lorentz model may be used as an
approximation to obtain a value of pω .

CHAPTER 5 The plasmon study of the optical dielectric function of indium
118
5.6. Summary
The complex dielectric function of non-oxidised indium has been experimentally
determined throughout the visible regime using a grating-coupled SPP technique. This
has been achieved by fitting the reflectivity measurements from a metal-dielectric
interface to the predictions from a rigorous grating-modelling theory, using the grating
profile, and the complex dielectric constants of indium as fitting parameters. A
comparison of the constants determined from this work, with those from a previous
study suggests a strong dependence of the dielectric function on the film thickness and
deposition conditions.
The plasma frequency and relaxation time have been calculated by fitting the measured
dielectric function to a simple Drude model. However, the free-electron model has been
demonstrated to be inadequate, and a more sophisticated one-resonance model has also
been used. Systematic discrepancies between the modelled and measured dielectric
functions illustrate that this model is also mostly too simplistic. However, the values of
the relaxation time determined from both models are consistent, and the values of the
plasma frequency obtained by fitting the second model to both ε ′ and ε ′′ show
excellent agreement.

CHAPTER 6 Azimuthal dependent reflectivity data from metallic gratings.
119
CHAPTER 6
Azimuthal dependent reflectivity data from
metallic gratings
6.1. Introduction
In the previous two chapters, the reflectivity from corrugated metal interfaces were
recorded as a function of the polar angle of incidence (θ). The complex dielectric
functions of the metallic films were derived by making a comparison between the
predictions of the theoretical model, and the response of the sample in the regions of
coupling to surface plasmon polaritons (SPPs). However, one does not have to be
constrained to this in-plane geometry that is often used. Recent developments to
Chandezon’s original theory have permitted the modelling of systems in the conical
mount, when the Bragg vector of the grating ( gk ) is not in the plane of incidence
)0( ≠ϕ [Elston et al. (1991a,b)]. In this geometry, polarisation conversion is induced
[Bryan-Brown et al. (1990)] and as a result, the reflectivity features have an increased
sensitivity to the profile of the grating surface. Watts et al. (1997a) have successfully
demonstrated that a surface may be confidently characterised using polar angle-
dependent fits to reflectivity recorded for different azimuths. Therefore, in this chapter
a new technique is presented that instead involves the measurement of the azimuthal-
dependent specular reflectivity to optically characterise a periodically modulated metal-
dielectric interface. This method presents advantages over the conventional polar angle
scan experiment since it requires no moving signal detector. The data recorded has
been fitted to a conical version of Chandezon’s differential formalism using a single set
of parameters describing the grating profile and metal permittivity.
The system chosen to study this new technique and to test the conical diffraction model
is a periodically modulated gold-air interface. Experimental reflectivities have been
recorded from the same grating surface for both s- (TE) and p- (TM) polarised incident

CHAPTER 6 Azimuthal dependent reflectivity data from metallic gratings.
120
light, and for in-plane and conical geometries. We test the conical diffraction theory by
showing that one set of parameters representing the grating profile and dielectric
function of the two media at a constant wavelength may produce theoretically modelled
reflectivities which agree with all the experimental data sets. In addition, the surface
profile obtained by this optical characterisation method is verified by comparison with
the profile obtained from an atomic force microscope (AFM) scan of the surface.
6.2. Experimental
6.2.1. Experimental Geometry
Figure 2.4.4 illustrates the experimental geometry and the co-ordinate system being
considered in this chapter.
As previously discussed, the grating’s periodicity provides a mechanism via which the
incident radiation may increase or decrease the component of its wave vector by integer
multiples of the grating wave vector, gk . This gives rise to diffracted orders that
become evanescent when their in-plane momentum is increased such that the magnitude
of their wave vector, k, becomes greater than that of the wave vector of the incident
radiation, 01kn . It is the enhanced wave vector of these evanescent fields that allows
incident radiation to couple to the SPP according to the condition
gSPP Nn kkk ±= θsin01 Equation 6.2.1
If the azimuthal angle is equal to zero then all the diffracted beams lie in the plane of
measurement and Equation 6.2.1 reduces to a scalar equation.
However, it was shown in Section 2.4.2, that for a particular grating, all the solutions of
Equation 6.2.1 can be illustrated using a reciprocal space map and the schematic
diagram presented there (Figure 2.4.5) also represents the grating studied here. The
dashed circle about the origin represents the maximum wave vector available to the
incident photon ( 01kn ) and the fainter dashed circles within this radius represent the

CHAPTER 6 Azimuthal dependent reflectivity data from metallic gratings.
121
positions of the observable Rayleigh anomalies that have been scattered by the grating.
This illustrates that coupling to the SPPs (solid lines) that exist at a slightly higher
momentum is only possible via scattering by ±1, ±2 or ±3 grating wave vectors. The
diagram also shows that a photon with wave vector component θsin01kn at an
azimuthal angle ϕ may couple directly to a SPP, and that θ must vary as ϕ changes for
coupling to be maintained. When ϕ ≠ 0 , by simple geometry, we find the scalar
equivalent of Equation 6.2.1 is
ϕθθ cossin2sin 01
2222
0
2
1
2 kNknkNknk ggSPP ±+= Equation 6.2.2.
6.2.2. Experimental Procedure
The grating studied in this work was prepared in a silica substrate by standard
interferographic techniques discussed in Section 3.1, which resulted in a grating of
pitch, λg = 930 nm . An optically thick gold layer was evaporated onto the surface to
produce an interface that supports SPPs in the visible region of the spectrum. Gold was
chosen in preference to silver because its optical properties will not vary over the time
scale of the experiment. Incident radiation of wavelength 632.8 nm on a grating of this
pitch permits momentum enhancement such that coupling to six surface plasmon
resonances (SPRs) is possible. These are the ±1, ±2 and ±3 resonances (Figure 2.4.5),
where the number and sign refer to the diffracted order that provides the resonant
coupling to the SPP.
With conventional studies previously undertaken (e.g. Chapters 4 and 5), the intensity
of the specularly reflected beam from the grating is recorded as a function of the polar
angle of incidence, generally at fixed wavelength. A schematic diagram illustrating the
apparatus required to record such data is shown in Figure 4.4.2. The grating is rotated
about the z-axis and the signal detector moves such that it tracks the specularly-reflected
beam. If the grating grooves are orientated at the azimuthal angle ϕ depicted in Figure
2.4.5, the order of features for the 930 nm grating with increasing θ (black dotted line)

CHAPTER 6 Azimuthal dependent reflectivity data from metallic gratings.
122
would be: Rayleigh anomaly associated with the point at which the -1 diffracted order
becomes evanescent, SPP (±1), SPP (∓2) and Rayleigh anomaly (∓2).
Previous workers have also recorded reflectivity scans as a function of the incident
wavelength λ0. This method has been used to directly observe the SPP dispersion curve
both on a planar metal-air interface [Swalen et al. (1980)], and on a corrugated interface
where an energy gap may open up [Weber et al. (1986) and Kitson et al. (1996)]. This
method is not particularly suitable for the characterisation of metallic gratings since the
optical properties of metallic films vary strongly with wavelength, which makes the
fitting of data increasingly difficult.
In the present work, the majority of experimental data is recorded as a function of the
azimuthal angle, ϕ. Figure 6.2.1 illustrates the experimental arrangement used to record
the azimuthal-dependent data. Unlike the apparatus shown in Figure 4.4.2 for deriving
the polar-dependent data, this method does not require a moving detector. The polar
angle, θ, is set using the mirror and the grating placed directly on the rotating table. It is
apparent from Equation 6.2.2 and Figure 6.2.2 that if θ is fixed and ϕ varied, a circle in
k-space inside the light circle will be mapped out which will cut the SPP and Rayleigh
anomaly arcs that are associated with the diffracted orders. Clearly from Figure 6.2.2,
if θ is too small then there will be no reflectivity features, and hence a suitable choice of
θ is required to produce useful data. With the polar angle of incidence chosen in Figure
6.2.2, the order of reflectivity features will be SPP (±1), Rayleigh anomaly (∓2), SPP
(∓2) and Rayleigh anomaly (±1).

CHAPTER 6 Azimuthal dependent reflectivity data from metallic gratings.
123
In both polar- and azimuthal-angle scans undertaken in this study, polarisers are used to
set the polarisation of the incident and detected beams. This permits the measurement
of the ppR , ssR , spR and psR reflectivities, where the subscripts refer to the setting of
the incident and detector polarisers respectively. The latter two reflectivities allow the
polarisation conversion signal found when the grating is in the conical mount to be
monitored. However, it should be noted that they are identical for non-blazed profiles.
It is critically important to ensure that the polarisers are set correctly with respect to the
true plane of incidence as p-to-s conversion is acutely sensitive to errors in this
alignment.
Polar-angle scans are undertaken with °= 0ϕ and °= 50ϕ , and azimuthal-dependent
data are recorded at =θ 20, 30, 45, 60 and 75º. For each scan, 632.8 nm He-Ne
radiation is incident on the sample and the ppR and ssR responses are measured. In
addition, the polarisation signal ( psR or spR ) is also recorded.
Figure 6.2.1 Schematic representation of the experimental set up used to
record azimuthal-angle dependent reflectivity data from a diffraction
grating. The grating is placed on the rotating table with the radiation
incident at a fixed polar angle.

CHAPTER 6 Azimuthal dependent reflectivity data from metallic gratings.
124
It is clear that the choice of an azimuthal-angle scan and the more traditional polar-angle
scan allows the experimentalist to sample different widths of the reflectivity features.
For example, at the crossing point of the azimuthal scan and the -1 SPP coupling
condition shown in Figure 6.2.2 (�), the angle between the two curves is much smaller
than the angle between the trajectory of the polar-angle scan (not shown) and the -1 SPP
coupling condition curve at the same point. Hence, the “width” of the mode recorded in
an azimuthal-angle scan will be significantly larger than that perceived in a polar angle
scan. This effective widening of the resonances may be useful especially when
experimenting with metals with 0<<′ε (e.g. aluminium), whose modes may otherwise
be too narrow from which to deduce the optical parameters of the media.
ϕ 0→90= °
n k1 0sin θ
n k1 0
kSPP
�
Figure 6.2.2 Reciprocal space map of the grating studied in this
work with 632.8 nm radiation incident. The dotted arc represents
the locus of momentum values traversed during a 0° to 90°
azimuthal scan at a fixed polar angle. The points labelled � and
� correspond to the –1 and +2 SPRs respectively that will be
observed in the azimuthal-angle scan illustrated (dotted line).

CHAPTER 6 Azimuthal dependent reflectivity data from metallic gratings.
125
6.3. Results
In order to deduce the grating profile and optical properties of the metal-dielectric
interface, the reflectivities obtained from a conical version of Chandezon’s original
differential formalism [Elston et al. (1991b)] have been matched with those recorded
experimentally. The theoretical model, described in Chapter 3, uses a truncated Fourier
sum of sine waves to represent the shape of the interface,
xkaxkaxkax ggg 3cos2coscos)A( 321 ++= Equation 6.3.1
where a a a1 2 3, and are the fundamental, first and second Fourier harmonics which
provide the first order scattering mechanisms to the ±1, ±2 and ±3 SPPs respectively.
The series is truncated at the second harmonic because the components that provide the
4 kg and higher scattering vectors are found to be insignificant and have little effect on
the reflectivity from the grating used in this study.
Experimental reflectivities were recorded as functions of both the polar and azimuthal
incident angles. The predictions from the theoretical model were then fitted to the
experimental data by using an iterative least squares fitting routine which used the
functional form of the grating profile (Equation 6.3.1) and the optical permittivity of the
metal layer as fitting parameters. The parameters obtained from the optical
characterisation were: a1 310 0 4= ±. . nm, a2 8 0 0 5= ±. . nm , and a3 3 0 0 4= ±. . nm .
The pitch, as defined by the angular position of the Rayleigh anomalies in the
experimental reflectivity data, was calculated to be λg = ±9301 0 5. . nm with the
permittivity of the dielectric (air) set as 1.0006==12
1nε . The permittivity of the metal
(gold) which provided the most accurate fits was i25.162.92 +−=ε . Figure 6.3.1(a), (b)
and (c) show a selection of fits to the experimental azimuthal angle-dependent
reflectivities, and for comparison, Figure 6.3.1(d) shows a fit to the conventional polar
angle-dependent reflectivity. Figure 6.3.1(a) illustrates the polarisation conversion that
is induced when the grating is in the conical mount. Clearly, the above parameters
provide good fits to the experimental data, although the real part of 2ε is slightly
smaller in magnitude than expected for gold at this wavelength
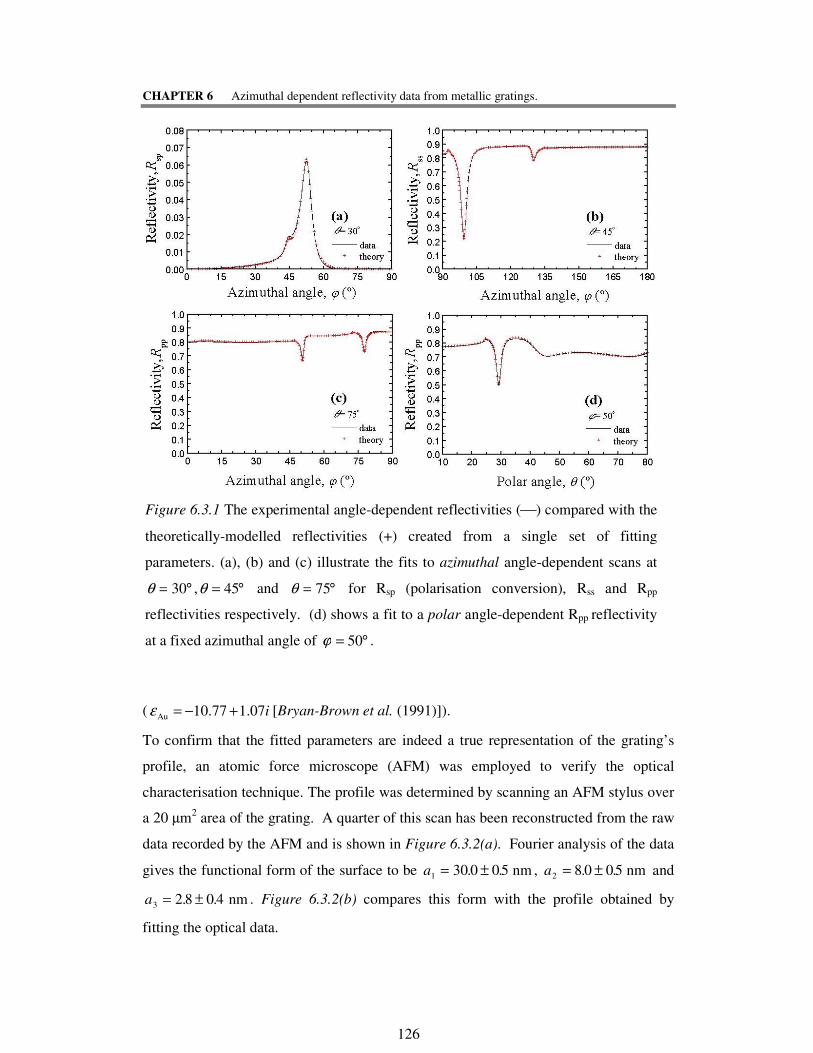
CHAPTER 6 Azimuthal dependent reflectivity data from metallic gratings.
126
( i07.177.10Au +−=ε [Bryan-Brown et al. (1991)]).
To confirm that the fitted parameters are indeed a true representation of the grating’s
profile, an atomic force microscope (AFM) was employed to verify the optical
characterisation technique. The profile was determined by scanning an AFM stylus over
a 20 µm2 area of the grating. A quarter of this scan has been reconstructed from the raw
data recorded by the AFM and is shown in Figure 6.3.2(a). Fourier analysis of the data
gives the functional form of the surface to be a1 30 0 05= ±. . nm , a2 8 0 05= ±. . nm and
a3 2 8 0 4= ±. . nm . Figure 6.3.2(b) compares this form with the profile obtained by
fitting the optical data.
Figure 6.3.1 The experimental angle-dependent reflectivities () compared with the
theoretically-modelled reflectivities (+) created from a single set of fitting
parameters. (a), (b) and (c) illustrate the fits to azimuthal angle-dependent scans at
θ = °30 ,θ = °45 and θ = °75 for Rsp (polarisation conversion), Rss and Rpp
reflectivities respectively. (d) shows a fit to a polar angle-dependent Rpp reflectivity
at a fixed azimuthal angle of ϕ = °50 .

CHAPTER 6 Azimuthal dependent reflectivity data from metallic gratings.
127
The profile recorded by the AFM stylus shows an apparent reduction in the grating
depth. This may be attributed to the stylus being unable to probe the bottom of the
troughs due to its finite width, however with this relatively shallow grating this is
unlikely. More simply the difference is due to a calibration error in the height scale of
the AFM since scaling by a factor of 1.05 gives an almost perfect agreement.
Figure 6.3.2 (a) 2µm 10 AFM image (computer-reconstructed) of the surface of the
grating. (b) Fourier analysis of this data yields an average grating profile profile (•••)
and a comparison is made with that deduced from the fitting of optical data ().
(a)
(b)

CHAPTER 6 Azimuthal dependent reflectivity data from metallic gratings.
128
6.4. Summary
This chapter has illustrated that the new technique of experimentally recording the
azimuthally-dependent reflectivities can be successfully used for the characterisation of
the surface profile and optical permittivities of metallic diffraction gratings.
The experimental procedure to monitor azimuthally-dependent reflectivity data presents
a number of advantages over the conventional method of monitoring polar angle-
dependent reflectivities, primarily because the technique does not involve a moving
signal detector. This simplifies the apparatus required for such an experiment (Figure
6.2.1), and eliminates the possibility of experimental errors arising from detector
function. In addition, the azimuth scanning method is more favourable for studying
gratings at longer incident wavelengths when the conventional polar angle scans
become cumbersome due to the large area swept out by the signal detector. Hence, we
employ this technique for use in the experiments carried out in the microwave regime
detailed in the next three chapters. Furthermore the level of background noise remains
constant throughout the experimental scan since only the sample is moving and hence
the use of this technique improves the quality of the resulting fits. An azimuthal-angle
dependent scan will also allow the experimentalist to record resonance widths that are
different to those perceived in a polar-angle scan. This may be useful, for example,
when studying a metal with an ε ′ which is highly negative so that the SPR may be
prohibitively narrow to allow accurate parameterisation of the optical constants of the
media either side of the interface.
In addition, this work provides a convincing test of conical diffraction theory producing
excellent agreement between the differential formalism of Chandezon and azimuthal
angle-dependent reflectivity experiments (Figure 6.3.1). The shape of the surface
derived from the fitting process has been shown to be representative of the true profile
by comparison with that determined from AFM measurements (Figure 6.3.2)

CHAPTER 7 An experimental study of grating-coupled surface plasmon polaritons at microwave
frequencies.
129
CHAPTER 7
An experimental study of grating-coupled
surface plasmon polaritons at
microwave frequencies.
7.1. Introduction
Microwaves belong to the intermediate range of the electromagnetic spectrum that have
frequencies lying between 1 GHz and 300 GHz with corresponding free-space
wavelengths ranging between 300 mm and 1 mm. It is interesting to note that the initial
search for the electromagnetic waves predicted from Maxwell’s equations were carried
out using waves of these wavelengths.
The development of microwaves during the war for communications and radar uses led
to resurgence in their popularity during the 1950s and 1960s. Radar was initially
developed as a passive sensor (i.e. it emits its own energy and does not rely on the
illumination of the target by other sources) to replace visual target detection. Work at
these frequencies was particularly popular as a number of the experimental problems of
optical diffraction could be investigated more easily at much longer wavelengths.
Tremblay and Boivin (1966), or more recently the book by Knott, Scheffer and Tuley
(1993) provide a useful summary of the concepts and techniques used in radar
applications and experiments undertaken in the microwave regime.
Much work in the literature is concerned with structures that reduce reflections from an
interface. The earliest form of absorber was the Salisbury screen, a narrow-band device
which consists of a sheet of porous material impregnated with graphite and spaced a
CHAPTER 7 An experimental study of grating-coupled surface plasmon polaritons at microwave
frequencies.
130
quarter of a wavelength from a metallic backing plate. This effectively creates an “open
circuit”, and the incident wave “sees” free space and there is no reflection (all the power
is delivered to the resistive sheet). An anti-reflection surface may also be achieved by
producing a material that avoids any sudden changes in the refractive index of the media
surrounding the interface. Such an impedance transformer was discovered in parts of
the eyes of nocturnal insects and was investigated in a much scaled-up system by
Bernhard in 1967. These anti-reflection surfaces are further discussed by Raguin et al.
(1993). Research into radar absorbing materials has also been very active over the last
40 years, and it is summarised by Vinoy and Jha (1994).
Another way in which incident radiation on a surface may be absorbed is by coupling it
into a wave that propagates along an interface, and dissipates its energy via Joule
heating of the surrounding media. A surface plasmon polariton (SPP) is an example of
such a mode and a detailed investigation of electromagnetic coupling to it at microwave
frequencies is discussed in this and the following two chapters.
The work undertaken in this chapter illustrates the resonant coupling to the SPP on
metallic diffraction gratings using wavelengths of the order of 10 mm. The wavelength-
and angle-dependent reflectivities have been recorded from purely sinusoidal mono- and
bi-gratings each of pitch 15 mm where the periodicity of the corrugation provides the
necessary momentum enhancement to couple to the surface mode. In order to minimise
the problems associated with non-planar incident wavefronts, an apparatus that
collimates the incident beam has been developed. The experimentally recorded
reflectivities have been successfully fitted to the predictions from the grating modelling
theory described in Chapter 3 with a single set of grating parameters describing the
grating profile and metal permittivity.

CHAPTER 7 An experimental study of grating-coupled surface plasmon polaritons at microwave
frequencies.
131
7.2. Background
Many workers have studied extensively the grating-coupled SPP mode at visible [e.g.
Raether (1988), Watts et al. (1997a) and Nash et al. (1996)] and infra-red (e.g. Zhizhin
et al. (1982)] wavelengths on corrugated surfaces produced by standard interferographic
techniques [Hutley (1982)]. Before this method of grating manufacture was established,
gratings had to be manufactured by ruling [Wood (1902)], hence experimentalists often
made use of the larger scale of systems available in the microwave regime. For
example, Meecham and Peters (1957) studied the reflection of radiation of wavelength
λ0 32= mm from a grating with the electric field of the radiation parallel to the
grooves. As they scanned the angle of incidence, they observed a redistribution of
energy among the diffracted beams at the point at which an order begins, or ceases to
propagate - the Rayleigh anomaly. They compared their experimental reflectivities
from a finite grating (15 grooves) to a theory based on a formalism which, like many
other diffraction theories developed around this time, assumed the surface to be of
infinite extent and perfectly conducting ( )−∞=′2ε . As discussed in Chapter 3, this is a
reasonably valid assumption to make since the frequency of the impinging microwave
radiation is many orders of magnitude less than the plasma frequency, and the effect of
any absorption in the metal will be insignificant due to the negligible skin-depth. Hence
at these wavelengths, all metals may be treated as near-perfectly conducting.
It is well known that the propagation length of the SPP along the interface, and hence
the width of the resonance is governed by two damping processes [Raether (1988) and
Pockrand (1976)]: the absorption of energy in the metal substrate (which is
proportional to the imaginary part of the dielectric function of the metal, ε ′′ for a given
ε´, and therefore frequency) and scattered radiative losses into the dielectric media
(which is proportional to a2 to first order, where a is the amplitude of the grating
[McPhedran et al. (1972)]). Note that the existence of this radiation loss does not
invalidate the previous definition of the surface wave (Section 2.2) since it is dependent
only on the surface profile and not the properties of the adjacent media. Hence, for
shallow gratings with almost no scattering of radiation into diffracted orders,
experimental observation of the SPR is only possible if the metallic medium is lossy
CHAPTER 7 An experimental study of grating-coupled surface plasmon polaritons at microwave
frequencies.
132
(e.g. a corrugated gold surface [Watts et al. (1997a)], a gλ ≈ 0 05. ,
i3.18.10nm 8.6320+−==λε ). As previously discussed, at microwave freqencies, all metals
behave as near-perfect conductors and hence the direct Joule-heating loss is
insignificant. However, as the amplitude of the corrugation is increased, the probability
of the surface wave being scattered into a diffracted order also grows. In other words,
the propagation length of the SPP on a highly corrugated surface will be less than that
on a shallow grating. Hence, a propagating surface wave on a highly perturbed surface
will not sample an infinite number of grooves, instead it will be scattered by a range of
grating wave vectors determined by the Fourier transform of such a finite set of
corrugations. This will introduce a range of angles over which the SPP may reradiate
into the specular or one of the diffracted orders, and hence an angular width will be
associated with the resonance as measured by the loss of reflectivity in the zero order
beam. In addition to the widening of the SPR, one also expects the momentum of the
resonance to increase due to perturbation of the surface away from the planar case
[Raether (1988), Pockrand (1974 and 1976) and McPhedran et al. (1972 and 1973)].
The work of Palmer et al. (1965) shows such a change in the shape of a resonance, and
we believe that that work provided the first experimental evidence of the propagation of
an electromagnetic surface mode, the SPP, on a near-perfectly conducting surface. They
reported measurements for the spectral distribution of radiation of wavelength 4 mm
from metal gratings of rectangular profile. When the wave propagation vector is lying
in a plane normal to the grating grooves, with the electric field vector perpendicular to
the grooves, they observe dark anomalies that become wider as the groove depth is
increased. An attempt is made to explain this phenomenon using a theory based on
“surface wave modes which are supported by the rectangular periodic structure of the
grating”, however no illustration of these results is presented.
It is important to note, however, that the resonance of the mode may only be observed
when there is another channel into which energy may be transferred. There are up to
three ways in which this may occur. Firstly, Joule heating of any absorbing media in
the system will take place. Secondly, energy from the mode may be re-radiated into any
propagating diffracted orders in the system. This is a similar effect to that modelled by
Kitson et al. (1995) who observed an increase in the width of the resonance when the
SPP mode is able to couple to a propagating diffracted order. The diffracted order

CHAPTER 7 An experimental study of grating-coupled surface plasmon polaritons at microwave
frequencies.
133
provides a strong radiative decay channel for the mode which contributes to its
damping, and hence width. Finally, re-radiation of energy from the mode back into the
specular beam may occur. If the grating grooves are neither parallel nor perpendicular
to the plane of incidence ( )°≠ 90,0ϕ , the polarisation of this radiation will be rotated
with respect to the incident beam and a polarisation conversion signal may be detected
[Bryan-Brown et al. (1990) and Watts et al. (1997b)].
7.3. Experimental
The two gratings studied in this work have been manufactured from approximately 500
mm square aluminium alloy sheets, using a computer-aided design and manufacture
technique with a 6 mm diameter ball-ended slot drill. The mill was programmed to
produce a purely sinusoidal profile, with a pitch of mm 15=gλ . The first grating
(sample #1) has an amplitude of mm 21 =a and is shown in Figure 7.3.1 below.
Figure 7.3.1 Photograph of sample #1 studied in this chapter where mm 15=gλ
and mm 0.2=a .

CHAPTER 7 An experimental study of grating-coupled surface plasmon polaritons at microwave
frequencies.
134
The second grating studied is corrugated in both the x- and z-directions (Figure 7.3.2)
and its surface profile is represented by the following Fourier Series:
……
……
+++
++++=
zMkazkazka
xNkaxkaxkazxA
z
g
z
M
z
g
zz
g
z
x
g
x
N
x
g
xx
g
x
cos2coscos
cos2coscos),(
21
21 Equation 7.3.1.
where mm 5.111 == zxaa and -1mm 152π== z
g
x
g kk .
Figure 7.3.2 Photograph of sample #2 (bi-grating) studied in this chapter.
( mm, 0.15=gλ mm 5.111 == zx aa )
Undertaking reflectivity measurements in the microwave regime clearly requires a
completely different apparatus to the experiments carried out at visible frequencies that
were discussed in previous chapters. The equipment used in this, and the following two
chapters for use in the 26.5 – 40 GHz frequency range is illustrated schematically in
Figure 7.3.3 below.
Originally, the experimental technique used to record the reflectivity from the samples
was based on the NRL arch method of absorber testing. It is a vertical semicircular
framework that allows the transmitting and receiving antennae to be aimed at a test

CHAPTER 7 An experimental study of grating-coupled surface plasmon polaritons at microwave
frequencies.
135
panel at constant distance (Figure 7.3.4). This allows the reflectivity from the test panel
to be measured at virtually any angle of incidence. The addition of a rotating grating
(ϕ) allows the measurement of any non-isotropic response of the sample.
Figure 7.3.3 Schematic representation of the interconnecting components used to record
reflectivitites in the 26.5 – 40 GHz frequency range.
θ
ϕ
Metallicdagger board.
Source andreference detector.Signal
Detector.
Microwaveabsorber.
Sample.
Computer-controlledRotating table.Lab jack.
Arch.
1 m
(app
rox)
500 mm
Figure 7.3.4 Diagram of original apparatus based on the NRL arch that was used to
record the wavelength- and azimuthal-angle-dependent reflectivities from the
sample.
CHAPTER 7 An experimental study of grating-coupled surface plasmon polaritons at microwave
frequencies.
136
However, after a number of initial experiments were carried out, it became clear that the
NRL arrangement is not suitable for the measurement of reflectivities from diffraction
gratings. This is due to a number of reasons. Firstly, the standard gain horns emit
spherical wavefronts that will introduce the possibility of excitation of the SPP even
without the grating. In addition, since the beam divergence of the horns is some 20º, the
incident beam will be larger than the sample and the system will suffer from a degree of
cross talk between the transmitting and receiving antennae. The introduction of metallic
apertures and a dagger board may improve the situation, but these create further
spurious artefacts in the measured signal due to diffraction effects at their edges. It is
not convenient to use dagger boards or apertures made from microwave absorbing
materials since these are typically 9 cm thick, and are therefore cumbersome to use.
The arrangement shown in Figure 7.3.5 is similar to that of the Czerny-Turner
spectrometer [James et al. (1969)] and has been developed in order to reduce the
aforementioned beam spread and the associated effects of spherical wavefronts and
cross talk. By placing the transmitting horn at the focus of a 2 m focal length mirror
(with a diameter greater than that of the beam incident upon it), the beam is well
collimated. An identical mirror is positioned to collect the specularly reflected beam
from the grating and focus it into the detector. In addition, a circular, metallic aperture
may also be used to align, and reduce the width of the beam. Clearly, in order to avoid
the introduction of aberrations in to the reflected beam, these mirrors should be
parabolic, but these are difficult to manufacture. However, spherical mirrors can be
manufactured relatively easily, and provide a good approximation to a parabolic mirror
for beams of radius much less than the mirror’s radius of curvature.
The spherical mirrors are manufactured by mounting the slab of metal to be worked on
a rotary table in a vertical mill (Figure 7.3.6). A flycutter of diameter D, which must be
larger than that of the work diameter, and tip radius r are mounted on the head of the
mill tilted at an angle, Θ, determined by the formula
)(2sin
rR
D
+=Θ Equation 7.3.2.

CHAPTER 7 An experimental study of grating-coupled surface plasmon polaritons at microwave
frequencies.
137
The arrangement shown in Figure 7.3.5 was used to record the specular reflectivity
from sample #1 as a function of wavelength between 7.5 and 11.3 mm at a polar angle
of incidence of approximately θ = 31°, and a series of azimuthal angles (ϕ) every 1w5°
between 0 and 90°. These angles are set to a precision of ±1°. The apparatus is
Grating whichrotates on spindle
to set ϕ
θ
Figure 7.3.5 Schematic diagram illustrating the apparatus used to measure the
wavelength-dependent response from a sample at fixed polar (θ) and azimuthal (ϕ)
angles of incidence.
Θ
r
D
R
Figure 7.3.6 Diagram illustrating the manufacture of the spherical mirrors used
throughout the microwave work presented in this thesis.
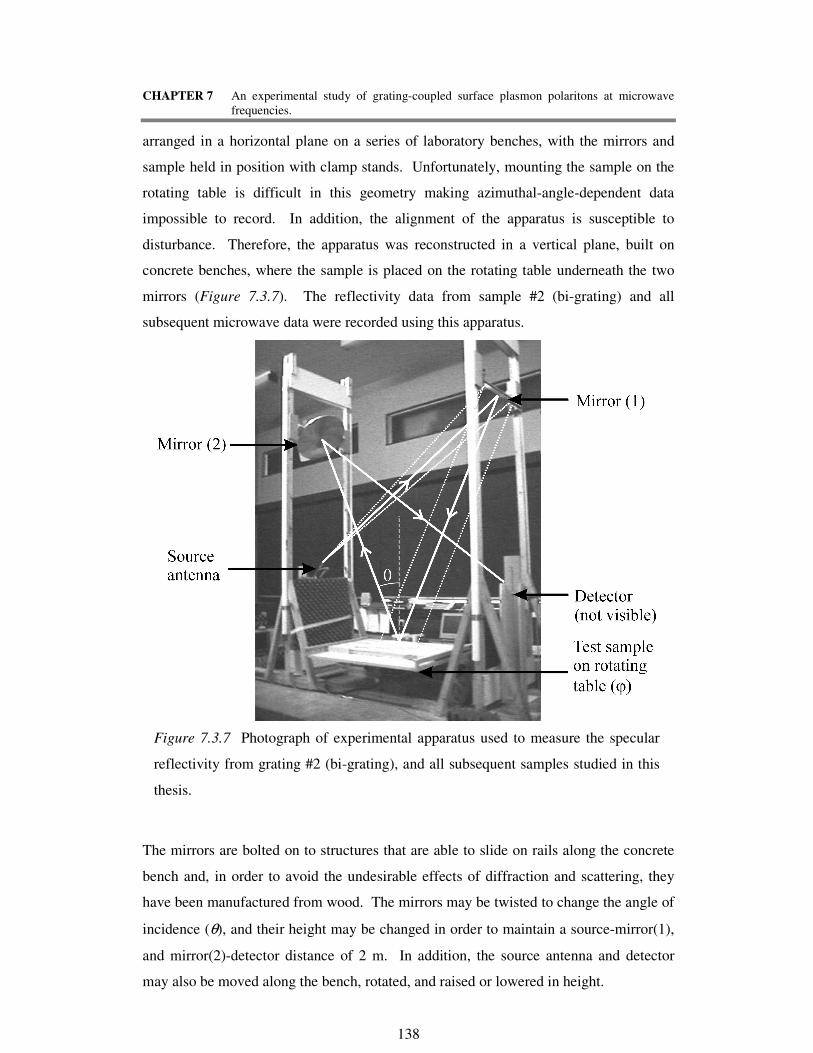
CHAPTER 7 An experimental study of grating-coupled surface plasmon polaritons at microwave
frequencies.
138
arranged in a horizontal plane on a series of laboratory benches, with the mirrors and
sample held in position with clamp stands. Unfortunately, mounting the sample on the
rotating table is difficult in this geometry making azimuthal-angle-dependent data
impossible to record. In addition, the alignment of the apparatus is susceptible to
disturbance. Therefore, the apparatus was reconstructed in a vertical plane, built on
concrete benches, where the sample is placed on the rotating table underneath the two
mirrors (Figure 7.3.7). The reflectivity data from sample #2 (bi-grating) and all
subsequent microwave data were recorded using this apparatus.
The mirrors are bolted on to structures that are able to slide on rails along the concrete
bench and, in order to avoid the undesirable effects of diffraction and scattering, they
have been manufactured from wood. The mirrors may be twisted to change the angle of
incidence (θ), and their height may be changed in order to maintain a source-mirror(1),
and mirror(2)-detector distance of 2 m. In addition, the source antenna and detector
may also be moved along the bench, rotated, and raised or lowered in height.
Figure 7.3.7 Photograph of experimental apparatus used to measure the specular
reflectivity from grating #2 (bi-grating), and all subsequent samples studied in this
thesis.
CHAPTER 7 An experimental study of grating-coupled surface plasmon polaritons at microwave
frequencies.
139
For both experimental arrangements described above, the source antenna and detector
may be set to pass either p- (transverse magnetic, TM), or s- (transverse electric, TE)
polarisations, defined with respect to the plane of incidence. This enables the
measurement of Rpp, and Rss, and polarisation conversion Rsp, and Rps reflectivities
where the subscripts refer to the incident and detected polarisations in that order. To
account for any fluctuations in the power of the source, the output from the signal
detector is divided by that of the reference, and the resulting wavelength- and azimuthal
angle-dependent data were normalised by comparison with the reflected intensity from a
flat metal plate.
Variation of the magnitude of the incident wave vector in the plane of the grating may
generally be achieved by scanning either wavelength ( λ0 ), or angle of incidence (θ or
ϕ). The technique described above keeps the polar angle of incidence constant, in
contrast to the conventional method of polar angle scans that are often used for
experiments at visible and infra-red wavelengths. It therefore avoids the difficulty of
scanning the detector and focusing mirror. In addition, by keeping the system fixed,
and only rotating the sample, the possibility of experimental errors arising from detector
function is eliminated.
7.4. Results
7.4.1. Sample #1 (mono-grating)
Figure 7.4.1 shows four typical sets of experimental data (+) at azimuthal angles of
ϕ = ° ° ° °30 45 60 75, , and showing the selected reflectivities Rpp, Rsp, Rps and Rss
respectively. The solid curves are the theoretical fits, which are in excellent agreement
with the experimental data.
In an ideal system the wavefronts incident on the sample using the collimated beam
apparatus would be completely planar. However, the radiation source is finite and the
source antenna and aperture diffract the beam. Hence, in order to achieve this quality of
fits, a degree of Gaussian beam spread has to be introduced into the theoretical

CHAPTER 7 An experimental study of grating-coupled surface plasmon polaritons at microwave
frequencies.
140
modelling. A simple linear relationship is assumed between wavelength and incident-
angle spread since the diffraction effects will clearly increase with wavelength. It is
also found that the angle spread is dependent on the orientation, (i.e. polarisation) of the
rectangular transmitting and receiving antennae. Typically, at the centre of the
wavelength range, the standard deviation of Gaussian angle spread is ( )σ θ ≈ °0 9. . This
represents a dramatic improvement over the uncollimated system ∆θ ~ 20° , but it is
still large enough to significantly affect the measured reflectivities.
Figure 7.4.1 The normalised (a) ppR , (b) spR , (c) psR and (d) ssR experimental
wavelength-dependent signals (+) compared with the theoretically modelled results ()
created from a single set of profile and metal-permittivity parameters. Radiation is
incident on the test sample at a polar angle, ,31°=θ and at azimuth angles of (a)
,30°=ϕ (b) ,45°=ϕ (c) ,60°=ϕ and (d) °= 75ϕ . The angles quoted are approximate
(±1°), and only one point in four is shown for clarity.

CHAPTER 7 An experimental study of grating-coupled surface plasmon polaritons at microwave
frequencies.
141
The theoretically modelled data were fitted to the experimental reflectivities using the
angles of incidence (θ and ϕ), the above linear variation of beam spread ( ( )σ θ ), and the
grating profile ( a a a a1 2 3 4, , and ) as fitting parameters. The profile of the grating is
initially assumed to be purely sinusoidal, and the angles of incidence are allowed to
vary in each scan by up to 1° from their measured values. A small amount of distortion
is introduced in the profile to further improve the fits, finally adjusting the degree of
beam spread to account for the finite source size and diffraction in the system. The
grating profiles determined for each wavelength scan are averaged and the error about
the mean calculated. The final fits shown are then all generated from this averaged set
of profile parameters: a1 2 01 0 01= ±. . mm, a2 0 02 0 02= − ±. . mm,
a3 0 02 0 01= ±. . mm, and a4 0 01 0 01= − ±. . mm with a grating pitch of λg = 14 95. mm.
The permittivities were assumed to be 0.12
11 == nε and ii 96
222 1010 +−=′′+′= εεε for
the air and metal respectively.
7.4.2. Sample #2 (bi-grating)
Figure 7.4.2 shows the specular ppR , ssR and spR signals (�) from sample #2 (Figure
7.3.2) recorded using the apparatus illustrated in Figure 7.3.7. They have been
measured as a function of azimuthal angle of incidence (ϕ) between 0º and 90º. The
wavelength and polar angle of incidence have been fixed at mm .0 100 =λ and
°= 5.46θ respectively. The solid lines illustrate the predictions from a bi-grating
version of Chandezon’s theory [Harris et al. (1996b)], the predictions from which were
first experimentally verified in a study partly undertaken by the author, and published
by Watts et al. (1996). In order to represent the periodicity in two directions, the
surface profile is parameterised by using a sum of two Fourier Series, one in the x-
direction and the other in the z-direction (Equation 7.3.1). The theoretical predictions
shown in Figure 7.4.2, have been calculated using the following parameters:
mm 5.111 == zx aa (with all higher Fourier coefficients set to zero), g
z
g
x
g kk λπ2==
where mm 0.15=gλ , 0.11 =ε and ii 96
222 1010 +−=′′+′= εεε .

CHAPTER 7 An experimental study of grating-coupled surface plasmon polaritons at microwave
frequencies.
142
Figure 7.4.2 The normalised (a) ppR , (b) ssR and (c) spR experimental azimuthal-angle-
dependent signals (�) from the bi-grating (sample #2) compared with the theoretically
modelled results (). Radiation of wavelength mm 0.100 =λ is incident on the sample
at °= 5.46θ . Only one experimental data point in five is shown for clarity.

CHAPTER 7 An experimental study of grating-coupled surface plasmon polaritons at microwave
frequencies.
143
Each corrugation is assumed to be purely sinusoidal since computation times are at least
an order of magnitude longer for a doubly corrugated interface, and become longer still
on the introduction of higher harmonics. For the same reason, beam spread is not
accounted for in the modelled data due to the multiple calculations this requires.
7.5. Discussion
7.5.1. Sample #1 (mono-grating)
Figure 7.4.1 illustrates that by using the rigorous diffraction modelling theory it is
possible to produce high-quality fits to the experimental data allowing the grating
profile to be characterised. The grating profile is also determined by scanning a dial-
gauge, sensitive to mm 025.0 , across the metallic surface. The profile is fitted to the
function ( )gaxA λπ2sin)( 1= , where mm 99.14=gλ and mm 01.21 =a provided the
best fit. Clearly these values compare favourably with those determined via reflectivity
measurements ( a1 2 01 0 01= ±. . mm, a2 0 02 0 02= − ±. . mm, a3 0 02 0 01= ±. . mm, and
a4 0 01 0 01= − ±. . mm , λg = 14 95. mm. ). During the process of fitting the reflectivity
measurements, in addition to the surface profile parameters, both the grating pitch and
incident polar angle were used as fitting parameters. Since degeneracy exists between θ
and λg , the small deviation between the values of the pitch is not surprising.
Virtually all of the previous experimental studies of SPPs propagating along metal–
dielectric interfaces have been undertaken at visible or infrared wavelengths [e.g.
Raether (1988) and Watts et al. (1997a)]. At these frequencies the electromagnetic
response of the metallic sample is dependent on both the real and imaginary parts of the
dielectric function of the substrate, in addition to the interface profile. However, at
microwave wavelengths, all metals behave as near-perfect conductors and hence the
penetration of the electric field into the substrate is small compared to the radiation
wavelength. In effect, the electromagnetic response of metal gratings at microwave
frequencies is largely independent of the imaginary part of their permittivities ( 2ε ′′ ).
CHAPTER 7 An experimental study of grating-coupled surface plasmon polaritons at microwave
frequencies.
144
The reflectivity is only dependent on the surface profile of the sample, defined in the
modelling theory as the sum of a truncated Fourier series, A(x) (Equation 6.3.1)
The resonant coupling to the SPP is clearly illustrated in Figure 7.4.1. Consider, for
example, graph (a). The two peaks correspond to two different coupling mechanisms to
the surface mode. The peak at just over 10.5 mm corresponds to a first order coupling to
the -1 SPP (via one grating wave vector, kg ), whilst the peak at around mm 8
represents a second order coupling to the +2 SPP via two successive gk scatterings.
Coupling to the +2 SPP is also possible via a single +2 kg interaction. However since
the profile of the interface has been milled, and shown above, to be very closely
sinusoidal, (i.e. the magnitude of the surface profile Fourier coefficients a2 and higher,
are small compared to the fundamental amplitude, a1 ), the aforementioned second order
interaction dominates. As the azimuthal angle is increased the resonances move
towards each other and coalesce at ϕ = 60°, having separated again at ϕ = 75°. Note
also the corresponding Rayleigh anomalies, normally visible in momentum scans
undertaken on real metals at visible frequencies (-∞ « 0<′ε ), are not visible in these
results. This is attributed to two differences between these microwave experiments and
those conducted in the visible regime. Firstly, as the frequency is reduced, the SPP
dispersion approaches the light-line (Figure 2.3.2) and hence the momentum difference
between the critical edge and the resonance condition is much less than for the visible,
making the critical edge difficult to experimentally separate from the SPR. One also
suffers from a reduced resolution in momentum due the angle of incidence spread that is
associated with the nature of the source and distances involved in the experiment.
It is important to verify that the resonances shown in Figure 7.4.1 are indeed those
associated with the SPP. It has been demonstrated in the modelling presented in
Chapter 3 that the SPR position moves away from its associated Rayleigh anomaly with
increasing grating depth (Figures 3.6.1-3.6.3). A similar behaviour is exhibited when
the ppR signal from a grating similar to sample #1 is modelled with radiation incident at
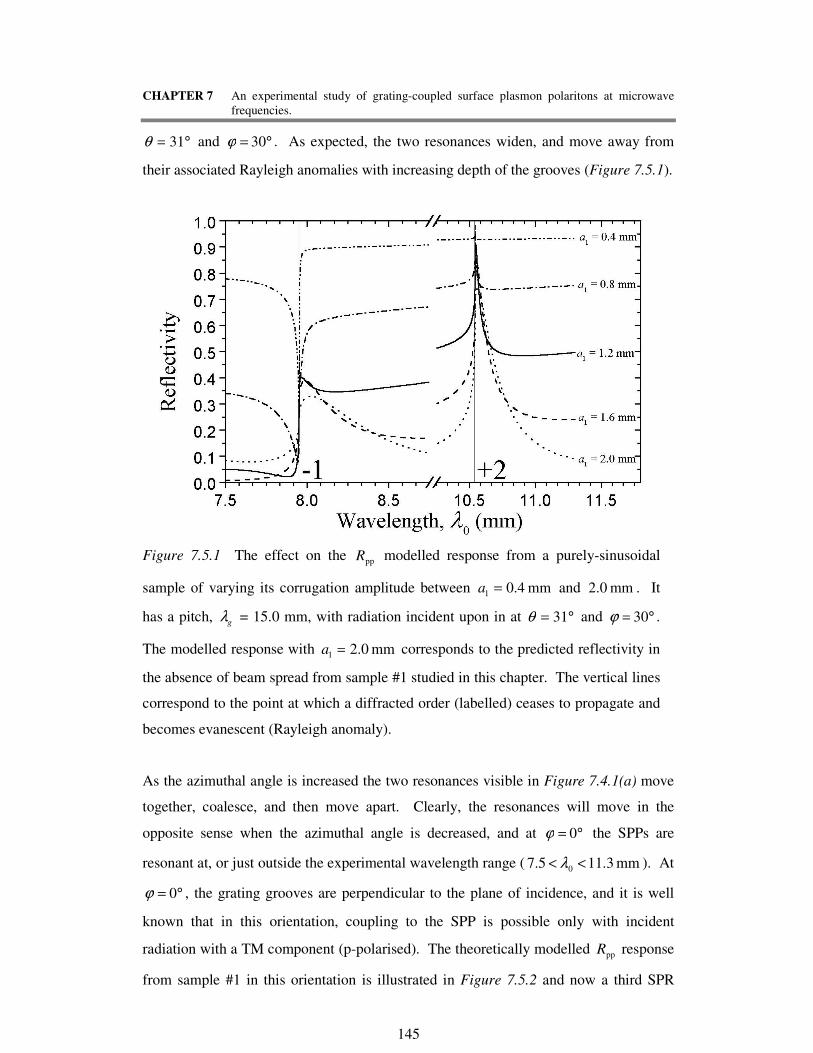
CHAPTER 7 An experimental study of grating-coupled surface plasmon polaritons at microwave
frequencies.
145
°= 31θ and °= 30ϕ . As expected, the two resonances widen, and move away from
their associated Rayleigh anomalies with increasing depth of the grooves (Figure 7.5.1).
As the azimuthal angle is increased the two resonances visible in Figure 7.4.1(a) move
together, coalesce, and then move apart. Clearly, the resonances will move in the
opposite sense when the azimuthal angle is decreased, and at °= 0ϕ the SPPs are
resonant at, or just outside the experimental wavelength range ( mm 3.115.7 0 << λ ). At
°= 0ϕ , the grating grooves are perpendicular to the plane of incidence, and it is well
known that in this orientation, coupling to the SPP is possible only with incident
radiation with a TM component (p-polarised). The theoretically modelled ppR response
from sample #1 in this orientation is illustrated in Figure 7.5.2 and now a third SPR
Figure 7.5.1 The effect on the ppR modelled response from a purely-sinusoidal
sample of varying its corrugation amplitude between mm 4.01 =a and mm 0.2 . It
has a pitch, λg = 15.0 mm, with radiation incident upon in at °= 31θ and °= 30ϕ .
The modelled response with mm 0.21 =a corresponds to the predicted reflectivity in
the absence of beam spread from sample #1 studied in this chapter. The vertical lines
correspond to the point at which a diffracted order (labelled) ceases to propagate and
becomes evanescent (Rayleigh anomaly).
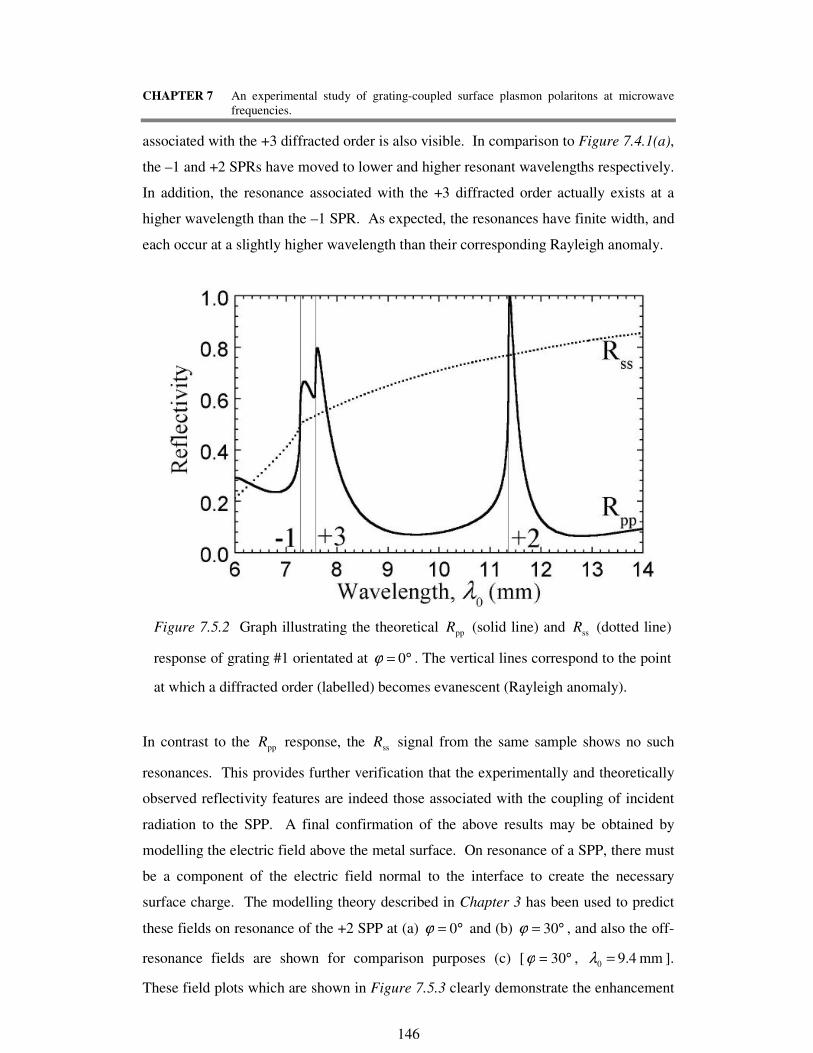
CHAPTER 7 An experimental study of grating-coupled surface plasmon polaritons at microwave
frequencies.
146
associated with the +3 diffracted order is also visible. In comparison to Figure 7.4.1(a),
the –1 and +2 SPRs have moved to lower and higher resonant wavelengths respectively.
In addition, the resonance associated with the +3 diffracted order actually exists at a
higher wavelength than the –1 SPR. As expected, the resonances have finite width, and
each occur at a slightly higher wavelength than their corresponding Rayleigh anomaly.
In contrast to the ppR response, the ssR signal from the same sample shows no such
resonances. This provides further verification that the experimentally and theoretically
observed reflectivity features are indeed those associated with the coupling of incident
radiation to the SPP. A final confirmation of the above results may be obtained by
modelling the electric field above the metal surface. On resonance of a SPP, there must
be a component of the electric field normal to the interface to create the necessary
surface charge. The modelling theory described in Chapter 3 has been used to predict
these fields on resonance of the +2 SPP at (a) °= 0ϕ and (b) °= 30ϕ , and also the off-
resonance fields are shown for comparison purposes (c) [ °= 30ϕ , mm 4.90 =λ ].
These field plots which are shown in Figure 7.5.3 clearly demonstrate the enhancement
Figure 7.5.2 Graph illustrating the theoretical ppR (solid line) and ssR (dotted line)
response of grating #1 orientated at °= 0ϕ . The vertical lines correspond to the point
at which a diffracted order (labelled) becomes evanescent (Rayleigh anomaly).

CHAPTER 7 An experimental study of grating-coupled surface plasmon polaritons at microwave
frequencies.
147
of the electric field close to the interface on resonance of the SPP (a and b) compared to
the off-resonance system (c). Note that the fields are not symmetric with the grating
surface since the SPP is a travelling wave propagating at an angle of φ with respect to
gk (Figure 2.4.5).
Figure 7.5.3 The predicted xyE instantaneous vector fields above a purely-
sinusoidal sample with mm 0.15=gλ and mm 0.21 =a with radiation incident at
°= 31θ . The three diagrams correspond to (a) ,0°=ϕ mm 4.110 =λ [+2 SPR in
Figure 7.5.2], (b) ,30°=ϕ mm 6.100 =λ [+2 SPR in Figure 7.4.1(a)] and (c)
,30°=ϕ mm 4.90 =λ [off-resonance].
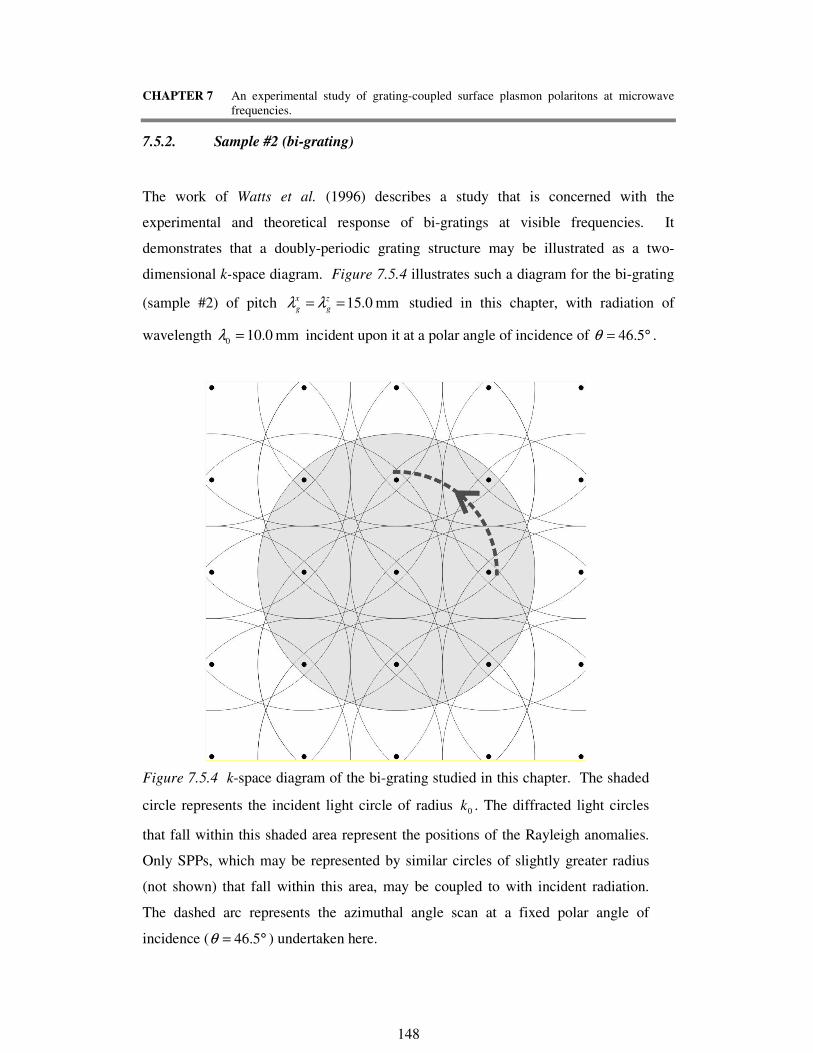
CHAPTER 7 An experimental study of grating-coupled surface plasmon polaritons at microwave
frequencies.
148
7.5.2. Sample #2 (bi-grating)
The work of Watts et al. (1996) describes a study that is concerned with the
experimental and theoretical response of bi-gratings at visible frequencies. It
demonstrates that a doubly-periodic grating structure may be illustrated as a two-
dimensional k-space diagram. Figure 7.5.4 illustrates such a diagram for the bi-grating
(sample #2) of pitch mm 0.15== z
g
x
g λλ studied in this chapter, with radiation of
wavelength mm 0.100 =λ incident upon it at a polar angle of incidence of °= 5.46θ .
Figure 7.5.4 k-space diagram of the bi-grating studied in this chapter. The shaded
circle represents the incident light circle of radius 0k . The diffracted light circles
that fall within this shaded area represent the positions of the Rayleigh anomalies.
Only SPPs, which may be represented by similar circles of slightly greater radius
(not shown) that fall within this area, may be coupled to with incident radiation.
The dashed arc represents the azimuthal angle scan at a fixed polar angle of
incidence ( °= 5.46θ ) undertaken here.
CHAPTER 7 An experimental study of grating-coupled surface plasmon polaritons at microwave
frequencies.
149
A comparison of Figure 7.5.4 with Figure 7.4.2 allows one to label the reflectivity
features observed in the azimuthal-angle scan (dotted line) shown. The order of the
features expected in the reflectivity scan as ϕ is increased from 0 to 45º is therefore:
(0,-1), (2,-1), (1,-1), (1,2), (0,2), (2,0), (2,1), (-1,1), (-1,2), (-1,0).
Here, the Rayleigh anomalies, and associated SPRs, are labelled according to the
scattering event(s) they experience, i.e. the (1,-2) diffracted order has been scattered by
kg in the x-direction and -2 kg in the z-direction.
Since the grating possesses four-fold rotation symmetry, the reflectivity scans are
expected to be symmetrical about ϕ = 45º. This is clearly illustrated in the experimental
data shown in Figure 7.4.2 above. However, it is important to not that since there are so
many diffracted orders propagating in the system at any chosen angle, only a small
proportion of the incident energy is available to be transferred between the orders. It is
for this reason that the reflectivity features are much less pronounced in the response
from this grating compared to the mono-grating studied above.
Note that the theoretical predictions shown in Figure 7.4.2 have not been “fitted” to the
experimental data since this would require unreasonable periods of computation time.
Instead, the predicted reflectivities have been calculated by using the pitch and
amplitude parameters stated in the original design of the sample. For the same reason,
beam spread has not been included in the model. However, the theoretical model agrees
well with the experimental data, although the result of neglecting beam spread in the
region of sharp features leads to obvious discrepancies.

CHAPTER 7 An experimental study of grating-coupled surface plasmon polaritons at microwave
frequencies.
150
7.6. Summary
In this chapter, a thorough experimental investigation of the coupling of microwave
energy to a surface mode propagating on a corrugated metal-dielectric interface has
been presented. This surface wave has been identified as the surface plasmon polariton,
the dispersion of which is determined by the surface profile and the dielectric
characteristics of the media either side of the interface. Many previous workers have
investigated the experimental excitation of the mode on lossy-metallic gratings at
visible and infrared wavelengths. However there is little experimental evidence in the
literature regarding the resonant coupling to the SPPs that propagate on near-perfectly
conducting metals using radiation of microwave wavelengths. At these frequencies, it
is only possible to experimentally observe the resonance of the mode if the corrugation
is made sufficiently deep such that the mode’s propagation length is reduced.
Experiments at microwave frequencies often suffer from a large amount of beam spread
[Khan et al. (1993)]. Here an experimental arrangement has been devised that reduces
this problem by collimating the incident beam. By placing the sample on a rotating
table, data may be recorded as a function of azimuthal angle of incidence and
wavelength. Reflectivities from both a mono- and a bi-grating have been recorded, and
a comparison of the experimental results with the predictions from the grating
modelling theory shows very good agreement. However, it is clear that a degree of
beam spread is still present even in a collimated beam system.

CHAPTER 8 The coupling of microwave radiation to surface plasmon polaritons and guided modes
via dielectric gratings.
151
CHAPTER 8
The coupling of microwave radiation to surface
plasmon polaritons and guided modes via
dielectric gratings.
8.1. Introduction
In the previous chapter, the coupling of incident microwave radiation to a SPP that
propagates along the surface of a near-perfectly conducting corrugated metal substrate
was demonstrated. In such a system, the incident energy is simply redistributed into
propagating diffracted orders, or undergoes polarisation conversion, i.e. no power is
absorbed by the sample. However, in the work presented in this chapter, it is shown that
excitation of the SPP is also possible by depositing an absorbing dielectric layer,
sinusoidally-modulated in height, on top of a planar metal substrate. The study is
carried out using paraffin wax as the dielectric material on an aluminium-alloy plate, the
wax being sufficiently thick to also support a guided mode. Once again, the
redistribution of energy is recorded by monitoring the specular beam reflectivity as a
function of wavelength ( mm 3.115.7 0 << λ ) and azimuthal angle of incidence
( °<<° 900 ϕ ). The azimuthal-angle-dependent reflectivity scans are fitted to the
grating modelling theory described in Section 3.3, with a single set of parameters
describing the grating profile, and the permittivity and thickness of the wax layer.
8.2. Background
In previous chapters the coupling of incident energy into SPPs by using corrugated
metal surfaces has been discussed, where the grating periodicity provides the required
CHAPTER 8 The coupling of microwave radiation to surface plasmon polaritons and guided modes
via dielectric gratings.
152
in-plane wave vector enhancement. This “classical” grating coupling geometry uses a
single corrugated interface, and when grating-coupled in this way, the SPP propagates
along the corrugated boundary. Since the periodic surface may diffract energy
associated with the mode into diffracted orders, the propagation length of the mode is
reduced. Other workers have shown that the radiative damping of the mode is
proportional to the square of the grating amplitude [McPhedran and Waterworth (1972),
Pockrand (1976) and Raether (1988)].
In this, and the following chapter, an alternative grating geometry is utilised (Figure
8.2.1), where the metallic surface is planar. Deposited on top of the metallic substrate is
a corrugated dielectric overlayer of mean thickness, t. The dielectric overlayer used is
petroleum wax, which has a refractive index at the microwave wavelengths studied here
similar to that of glass at visible frequencies (~ 1.5). The upper, semi-infinite dielectric
is air and it is the corrugated air-dielectric boundary that excites diffracted orders and
provides the required enhanced momentum to couple the incident radiation to the
surface mode. This geometry is similar in some respects to the Otto (1968) arrangement
(Section 2.4.1) that uses a high-index prism to create an evanescent field across an air
gap and couple the field to a SPP on the planar metal-air interface. Here, the prism is
replaced by a corrugated overlayer. This coupling geometry for the excitation of SPPs
appears to have been first utilised by Müller et al.(1997) who successfully coupled
632.8 nm radiation to the SPP mode. Their sample consisted of an evaporated silver
substrate, on top of which was a 5 nm layer of gold and a photoresist layer containing an
interferographically produced grating.

CHAPTER 8 The coupling of microwave radiation to surface plasmon polaritons and guided modes
via dielectric gratings.
153
It is important to note that if the thickness of the overlayer is great enough, the film may
support TM and TE-polarised “leaky” guided modes in addition to the SPP. Consider,
for example, the planar asymmetrically clad waveguide shown in Figure 8.2.2. The
sample may support a series of guided modes, where the minimum thickness, t, required
to support the mth order mode is given by the following inequalities [Yariv (1991)].
Figure 8.2.1 Schematic diagram illustrating the sample, co-ordinate system
and experimental geometry used in this study. The direction of the electric
field vector E is illustrated for the situation when p-polarised (transverse
magnetic, TM) radiation is incident. Here, t is the average thickness of the
wax overlayer, λ0 is the wavelength of the incident radiation, λg is the
grating pitch, and a is the grating amplitude.

CHAPTER 8 The coupling of microwave radiation to surface plasmon polaritons and guided modes
via dielectric gratings.
154
For TEm modes,
4
12 0
2
1
2
d
λ
nn
mtm
−
+≥ Equation 8.2.1
and for TMm modes,
2
0
2
1
2
d
λ
nn
mtm
−≥ Equation 8.2.2.
Here, the integer m is known as the order of the mode, and denotes the number of nodes
in the Ez or Hz field profiles within the guide for the TEm or TMm modes respectively.
Also 0λ is the vacuum wavelength of the radiation impinging from the air side and, nd
and n1 are the refractive indices of the guiding material and air respectively.
air, n1
high indexdielectricoverlayer, nd
metal, n2
x
y
z
t
Figure 8.2.2 A planar dielectric slab waveguide, clad asymmetrically with air and
metal. The metal and air regions are considered to extend to infinity away from the
slab in the y-direction.

CHAPTER 8 The coupling of microwave radiation to surface plasmon polaritons and guided modes
via dielectric gratings.
155
From Equation 8.2.1, it is clear that every TEm mode has a thickness cut-off below
which it cannot propagate. Furthermore, in the limit 0→t , the structure will support
no TE guided modes at all. In contrast, the asymmetric waveguide will always support
the zero-order TMm mode even with vanishing thickness of the high index overlayer.
The TM0 mode is in fact identical to the SPP that is guided along the interface of a
metal and a dielectric. Hence, the SPP may also be considered as the lowest order mode
of a metal-clad waveguide. It has no nodes in its Hz-field within the high index
dielectric and, as described in Chapter 2, its fields decay exponentially away into the
metal and air semi-infinite media. Figure 8.2.3 schematically illustrates the fields
associated with the SPP (TM0 mode) associated with a free-electron metal surface at
three different frequencies, together with those associated with the first truly guided
mode (TE0). In the low frequency limit the metal behaves like a perfect conductor and
the optical electric field is excluded from the substrate with an infinite decay length into
the media above (Equation 2.3.25). Effectively, the mode is a grazing photon, “guided”
along the boundary between the air and overlayer. As the frequency of the mode is
increased the mode becomes less photon like with exponentially decaying fields both
into the metal and air [Figure 8.2.3(a,b)]. Eventually, the mode becomes localised at the
overlayer-metal interface, with exponentially decaying fields into each medium (c) and
the system effectively reduces to a one-interface problem (i.e semi-infinite metal and
dielectric, nd). However, regardless of frequency, the TM0 mode is always associated
with the resonant excitation of the polarisation charge induced at the surface of a metal.
Therefore, in this thesis, the mode will continue to be referred to as the surface plasmon
polariton (SPP) – even in the two-interface geometry.
The simple description of the system provided above assumes that the waveguide is
planar, however in the work presented in this chapter the upper interface of the sample
is sinusoidally modulated in height. A demonstration of the change in the dispersion of
the modes propagating in a similar sample at visible frequencies on corrugating the top
interface is provided by Salt and Barnes (1999).

CHAPTER 8 The coupling of microwave radiation to surface plasmon polaritons and guided modes
via dielectric gratings.
156
It has previously been discussed that, in contrast to the optical wavelengths where
absorption in the metal damps the SPP, metals at microwave frequencies behave as
near-perfect conductors. Hence the surface mode that is launched directly along a
simple planar interface between semi-infinite air and a metal substrate will have an
almost infinite propagation distance. However in the grating geometry studied in this
chapter, there are two independent damping processes that may act on the SPP. Firstly,
the mechanism that allows radiation to couple into the SPP (i.e. the grating) will also
allow the mode to radiatively decay. This damping process was exploited in Chapter 7
to sufficiently widen the resonances so that they may be experimentally observed.
Secondly, although the top and bottom semi-infinite media (air and metal respectively)
are effectively non-absorbing at these frequencies, this may not be true for the wax.
Since the fields associated with the SPP mode penetrate the overlayer, any loss
mechanisms within it ( dε ′′ ) will contribute a term to the damping of the mode. Both of
these damping terms will contribute to the width of the surface plasmon resonance
(SPR) and will also have a similar effect on any guided modes propagating in the
system.
metal
overlayer
air
(a) (b) (c) (d)
yyyy
Hz Hz Hz Ez
x
z
Figure 8.2.3 (a)-(c) Schematic representation of the electric field (Hz) profiles of the
SPP (TM0 mode) propagating in a asymmetric, free-electron-metal clad waveguide
with increasing frequency. The frequency of the mode shown in (c) is so great that
the system behaves effectively like a one-interface system. Also shown for
comparison, is the field profile (Ez) of the lowest order TE guided mode (TE0)
supported by a system with a perfectly-conducting metal substrate (d).

CHAPTER 8 The coupling of microwave radiation to surface plasmon polaritons and guided modes
via dielectric gratings.
157
However, it should be appreciated that a grating may be effectively “zero-order” at
certain wavelengths and angles of incidence, i.e. there are no propagating diffracted
orders in the system. For example, the shaded areas in the reciprocal space diagram
representing a grating with 733.00 =gλλ shown in Figure 8.2.4 highlight the
momentum space in which the only order propagating is the zero-order beam. Hence,
the energy associated with surface or guided modes that exist at values of momentum
within these regions can only be radiated back into the specular beam, or absorbed by
the wax. In the absence of the latter loss mechanism, re-radiation of energy from the
mode back into the specular beam will not give an observable resonance in the reflected
signal, unless the grating is orientated such that the grooves are neither parallel nor
perpendicular to the plane of incidence ( )°±≠ 180,90 ,0ϕ . In this twisted geometry, the
polarisation of the reradiated signal will be different to that of the incident beam, and a
polarisation conversion signal may be detected [Bryan-Brown et al. (1990)]. A dip
(peak) in the specular ppR and ssR reflectivities will be observed around the resonance
condition, together with an associated peak (dip) in the psR and spR responses. Clearly,
if a non-absorbing grating sample is orientated at 0=ϕ , ±90º or 180º, modes
propagating in the “zero-order” region, although having a finite width (associated with
their radiative decay α a2), will not be experimentally observed in the reflected signal.
Figure 8.2.4 Reciprocal space map of a grating of pitch mm 15=gλ with radiation
incident of wavelength mm 110 =λ . The shaded region indicates the values of
momentum accessible to incident photons for which no diffracted orders propagate in
the system.
CHAPTER 8 The coupling of microwave radiation to surface plasmon polaritons and guided modes
via dielectric gratings.
158
8.3. Experimental
By utilising the grating modelling theory introduced in Chapter 3, it is possible to
design a sample with wax-grating pitch, amplitude, and thickness to give easily
identified and experimentally observed SPRs in the available wavelength range
( )mm 3.115.7 0 << λ . The system chosen for this study has a purely sinusoidal top
interface profile gxaxA λπ2cos)( 1= , where mm, 6.2≈t mm 5.11 ≈a and
mm 15 g =λ (Figure 8.2.1).
First it is necessary to determine the permittivity of petroleum wax in the 26.5-40.0 GHz
frequency range. This is achieved by completely filling a metallic tray of depth h with
wax and recording its wavelength-dependent response at a fixed angle of incidence
(Figure 8.3.1). Since the dimensions of the tray are of the same order as the diameter of
the incident beam, reflections may take place from the top of the metallic sides of the
tray, in addition to the metallic base. The position of the resulting interference fringes
allow the permittivity of the wax to be calculated according to the equation
( ) 212
dmin sin2 θελ −′= hmm Equation 8.3.1.
where m
minλ is the wavelength corresponding to the mth order interference maximum.
The permittivity of the petroleum wax was determined to be 29.2d =′ε and constant
over the wavelength range studied in this chapter. However the imaginary (damping)
term is difficult to determine accurately by this method and is therefore used as a fitting
parameter in the subsequent theoretical modelling.

CHAPTER 8 The coupling of microwave radiation to surface plasmon polaritons and guided modes
via dielectric gratings.
159
The grating sample itself is prepared by filling a metallic, square tray of side
approximately 400 mm and depth 5 mm with hot wax and allowing it to cool. A
metallic “comb” of the desired sinusoidal interface profile is manufactured using a
computer-aided design and manufacture technique. It is used to remove unwanted wax
from the sample by carefully dragging it across the surface until the required grating
profile is obtained. The sides of the tray are then removed.
Figure 8.3.2 illustrates schematically the experimental arrangement used to record the
reflectivity from the sample, which is identical to that used to measure the response of
the bi-grating in the last chapter. The reflectivity data are recorded as a function of
wavelength between 7.5 and mm 3.11 , over the azimuthal angle (ϕ) range from 0 to
90° at a fixed polar angle of incidence, °≈ 47θ . The source and receiving horn
antennae are set to pass either p- (transverse magnetic, TM), or s- (transverse electric,
TE) polarisations, defined with respect to the plane of incidence. This enables the
Figure 8.3.1 Production of interference fringes used to determine the permittivity
of the petroleum wax used in this study

CHAPTER 8 The coupling of microwave radiation to surface plasmon polaritons and guided modes
via dielectric gratings.
160
measurement of Rpp, Rps, Rss and Rsp reflectivities. To account for any fluctuations in
the emitted power from the source, the output from the signal detector is divided by that
from the reference. The normalised reflectivities over the entire frequency range are
downloaded from a scalar network analyser to a computer and are saved to disk. The
resulting wavelength- and angle-dependent reflectivities from the sample are normalised
by comparison with the reflected signal from a flat metal plate.
8.4. Results
Figure 8.4.1 illustrates a series of polar grey-scale maps of the normalised Rpp, Rps and
Rss signals from the sample as a function of frequency and azimuthal angle of incidence.
Since the profile of the grating is non-blazed, the Rsp response (which will be identical
to the psR response) is not illustrated.
ϕ
θ
Source antennaand reference detector
Receiving antennaand signaldetector
Sample on rotating table
Sphericalmirror
Figure 8.3.2 Schematic diagram illustrating the apparatus used to measure the
wavelength- and azimuthal-angle-dependent response from the sample studied in this
work.

CHAPTER 8 The coupling of microwave radiation to surface plasmon polaritons and guided modes
via dielectric gratings.
161

CHAPTER 8 The coupling of microwave radiation to surface plasmon polaritons and guided modes
via dielectric gratings.
162
Figure 8.4.1 Normalised (a) ppR , (b) psR and (c) ssR response of the sample as a
function of frequency between 26.5 and 40 GHz (11.3 and 7.5 mm), and azimuthal
angle of incidence with °≈ 47θ . Data has been recorded between °= 0ϕ and
°= 90ϕ , and reflected to produce full 360° polar maps.
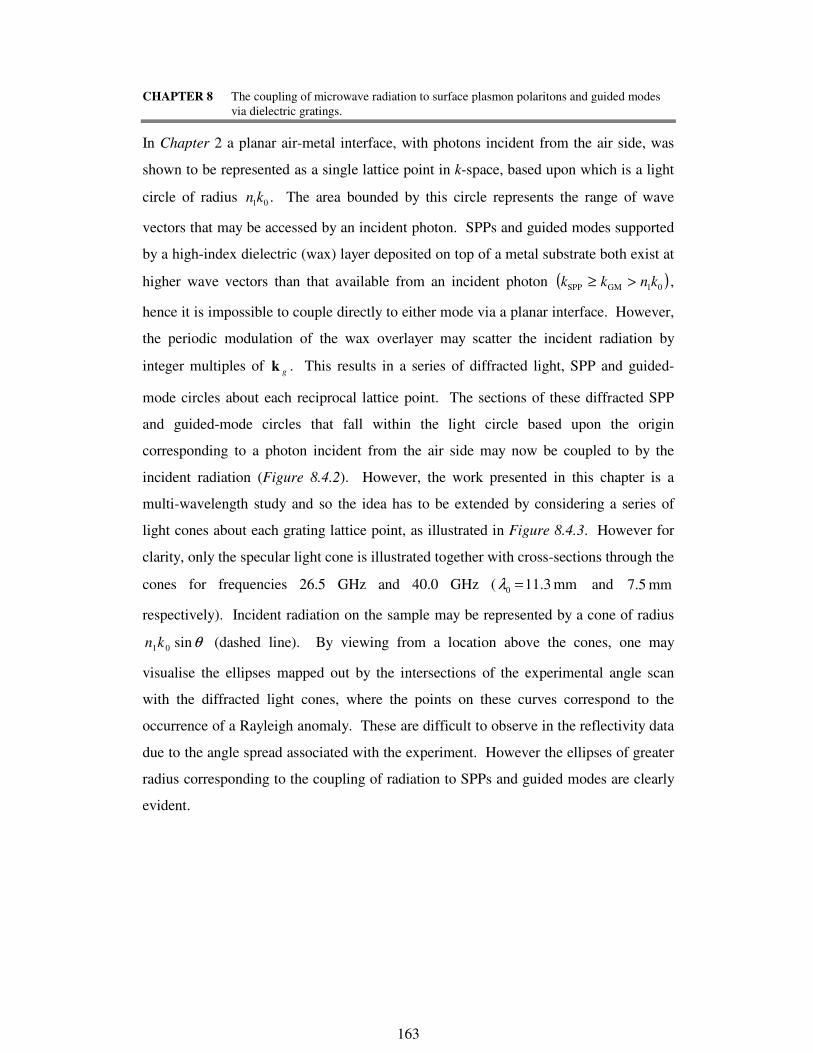
CHAPTER 8 The coupling of microwave radiation to surface plasmon polaritons and guided modes
via dielectric gratings.
163
In Chapter 2 a planar air-metal interface, with photons incident from the air side, was
shown to be represented as a single lattice point in k-space, based upon which is a light
circle of radius 01kn . The area bounded by this circle represents the range of wave
vectors that may be accessed by an incident photon. SPPs and guided modes supported
by a high-index dielectric (wax) layer deposited on top of a metal substrate both exist at
higher wave vectors than that available from an incident photon ( )01GMSPP knkk >≥ ,
hence it is impossible to couple directly to either mode via a planar interface. However,
the periodic modulation of the wax overlayer may scatter the incident radiation by
integer multiples of gk . This results in a series of diffracted light, SPP and guided-
mode circles about each reciprocal lattice point. The sections of these diffracted SPP
and guided-mode circles that fall within the light circle based upon the origin
corresponding to a photon incident from the air side may now be coupled to by the
incident radiation (Figure 8.4.2). However, the work presented in this chapter is a
multi-wavelength study and so the idea has to be extended by considering a series of
light cones about each grating lattice point, as illustrated in Figure 8.4.3. However for
clarity, only the specular light cone is illustrated together with cross-sections through the
cones for frequencies 26.5 GHz and 40.0 GHz ( mm 3.110 =λ and mm 5.7
respectively). Incident radiation on the sample may be represented by a cone of radius
θsin01kn (dashed line). By viewing from a location above the cones, one may
visualise the ellipses mapped out by the intersections of the experimental angle scan
with the diffracted light cones, where the points on these curves correspond to the
occurrence of a Rayleigh anomaly. These are difficult to observe in the reflectivity data
due to the angle spread associated with the experiment. However the ellipses of greater
radius corresponding to the coupling of radiation to SPPs and guided modes are clearly
evident.

CHAPTER 8 The coupling of microwave radiation to surface plasmon polaritons and guided modes
via dielectric gratings.
164
During the fitting process, it is useful to be able to differentiate SPPs from guided
modes, and recognise which diffracted order provides the coupling mechanism to each
mode. However, from the data illustrated in this study so far, this is not immediately
obvious. One way in which each of the modes may be identified is to use the rigorous
grating theory described in Chapter 3 to model their dependence on the thickness of the
wax overlayer.
Figure 8.4.2 A schematic reciprocal space map of a sample similar to
that studied in this work, but with mm 6.3=t and with incident
radiation of wavelength 11.0 mm [corresponding to Figure 8.4.4 (d)].
The solid circle centred upon the origin (of radius 01kn ) is the incident
light circle where the area it bounds contains all the modes accessible
to a photon incident on the grating. Also centred upon the origin are
dashed and dot-dot-dashed circles representing the momenta of the
undiffracted guided mode and SPP respectively. The sections of these
that fall with the incident light circle and hence which may be coupled
to, together with the positions of the Rayleigh anomalies are also
shown.

CHAPTER 8 The coupling of microwave radiation to surface plasmon polaritons and guided modes
via dielectric gratings.
165
Figure 8.4.4 illustrates, at mm, 110 =λ the predicted Rss reflectivities from samples
with wax thicknesses (a) mm, 1.2=t (b) mm, 6.2=t (c) mm 1.3=t and (d)
mm, 6.3=t and mm, 5.1=a mm, 15=gλ i00.029.2d +=ε and i96
2 1010 +−=ε .
The theoretical data is plotted in the form of a series of reciprocal space maps where
ϕθ cossin0kk x = and .sinsin0 ϕθkk z = The imaginary component of permittivity of
the wax overlayer ( dε ′′ ) has been set to zero in order to provide maximum contrast in the
diagrams. (An illustration that a variation of dε ′′ does not affect the position of the
modes in k-space will be provided later.)
Figure 8.4.3 Schematic diagram illustrating the diffraction grating considered in this
multi-wavelength study. For clarity, only the incident light cone, of radius 01kn is
shown (thick lines); the cones representing the guided mode and SPP exist at a
greater radius. Also shown is the light cone representing the experimental multi-
wavelength, azimuthal-angle scan at °= 47θ (dotted lines). The series of light circles
labelled (a) and (b) are cross-sections through the series of scattered incident light
cones with radiation of wavelength 11.3 mm (26.5 GHz) and 7.5 mm (40.0 GHz)
incident respectively. The numbered points at the bottom of the diagram illustrate
the lattice points about which each light cone is centred.

CHAPTER 8 The coupling of microwave radiation to surface plasmon polaritons and guided modes
via dielectric gratings.
166
It is interesting to note that the coupling strengths of all the modes appear to fall to zero
as °→ 90ϕ . This is because there are no diffracted orders propagating, polarisation
conversion is not possible and there is no absorption in the system (Section 8.2). Hence,
although coupling to the mode is still possible and its resonance has finite wide, it
cannot be experimentally observed, as there is no channel into which energy may be
transferred.
Figure 8.4.4 Reciprocal space maps of the theoretically modelled ssR signals
from samples with 11 mm radiation incident and wax thicknesses (a)
mm, 1.2=t (b) mm, 6.2=t (c) mm 1.3=t and (d) mm 6.3=t (where
ϕθ cossin0kk x = and ϕθ sinsin0kk z = ). The reflectivities have only been
plotted for wave vector values that are accessible to the incident photon, i.e.
( ) .01
2/122knkk zx ≤+ The Rayleigh anomalies are labelled and highlighted with
dotted lines, and the SPP and guided mode (GM) are also identified and
labelled with the diffracted order that provides the coupling mechanism. The
equivalent experimental momentum scan undertaken at this wavelength is also
shown (white, dashed circle).

CHAPTER 8 The coupling of microwave radiation to surface plasmon polaritons and guided modes
via dielectric gratings.
167
The modes visible in Figure 8.4.4(a) are the diffracted SPP (TM0) modes which
propagate along the metal-wax interface. Note that the coupling strength to the SPP
also decreases to zero as °= 0ϕ is approached. This is because the incident TE field
has no component perpendicular to the grating surface and hence cannot create the
necessary surface charge. Clearly, the fields associated with the SPP will sample the
wax layer and will penetrate into the air half-space, as shown in Figure 8.2.3.
Therefore, the dispersion of the SPP will be dependent on an effective refractive index
( )effnd since the degree of penetration into the air is governed by the thickness of the wax
overlayer. Hence 0dSPP )( ktnkeff> , where dd1 )( ntnn
eff ≤≤ with the SPP moving to
higher momentum values with increasing thickness, as is clear in Figure 8.4.4. In
addition the excitation of guided modes also becomes possible if the dielectric overlayer
is sufficiently thick (Equation 8.2.1 and Equation 8.2.2). The lowest order guided mode
may be observed in Figure 8.4.4 (b), (c) and (d), however at mm 6.2=t the mode is
almost coincident with the Rayleigh anomaly. In a similar manner to the SPP, the
guided mode also moves away from the Rayleigh anomaly as the wax thickness is
increased.
The white dashed circle superimposed on Figure 8.4.4(b) illustrates the equivalent
momentum scan undertaken in this study with radiation of wavelength mm 0.110 =λ
incident at °= 47θ . Hence, by comparison of Figure 8.4.4(b) with the experimental
study at this fixed wavelength it is possible to identify the guided mode (GM) and SPP,
and label the modes according to the diffracted order which provides the coupling
mechanism (Figure 8.4.5). Having identified the modes supported by the sample, the
reflectivity data are fitted to the grating modelling theory for a series of different
wavelengths. By fitting the reflectivity data using a single set of parameters, it is
possible to accurately parameterise the grating profile, thickness and permittivity of
the wax overlayer. Figure 8.4.6 shows a series of experimental data sets (�) at
wavelengths of (a) 7.5 mm, (b) 8.5 mm, (c) 9.5 mm and (d) 10.5 mm, showing the
ppR , ssR , psR and ssR signals respectively. The solid curves are the theoretical fits,
which are in good agreement with the experimental data. During the fitting process,
the amplitude of the corrugation, thickness and real part of the permittivity of the wax,
and the polar angle of incidence are all allowed to vary within uncertainty bounds
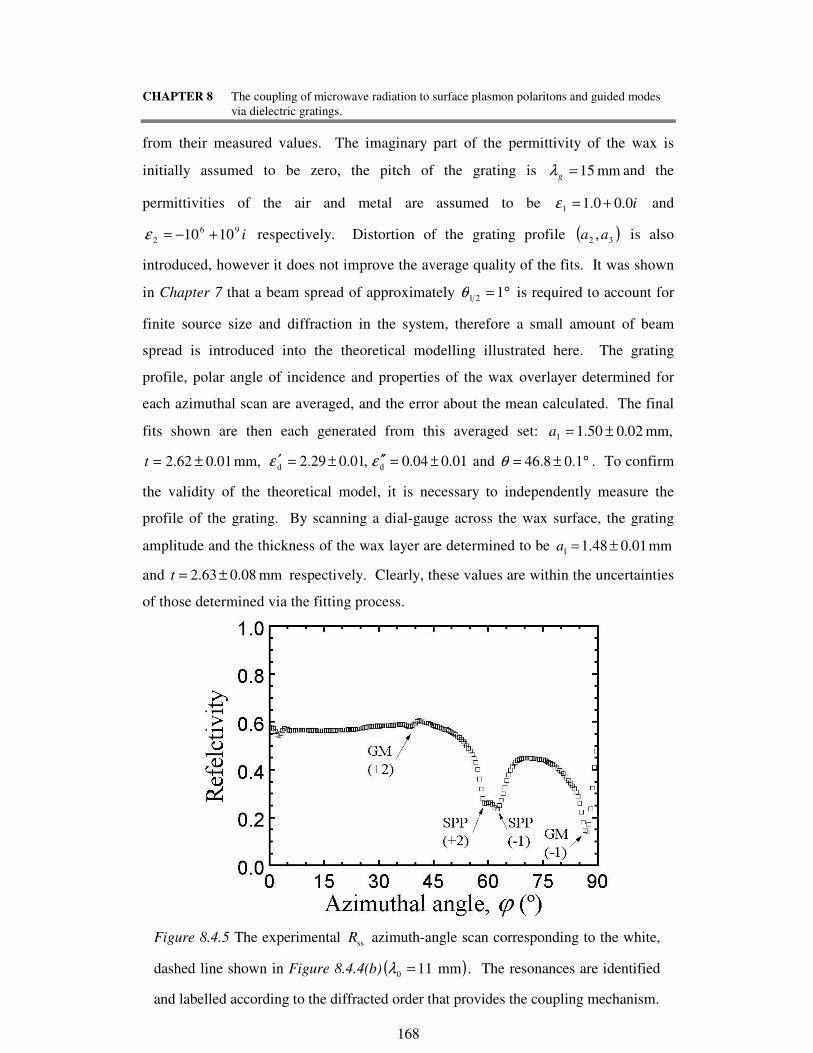
CHAPTER 8 The coupling of microwave radiation to surface plasmon polaritons and guided modes
via dielectric gratings.
168
from their measured values. The imaginary part of the permittivity of the wax is
initially assumed to be zero, the pitch of the grating is mm 15=gλ and the
permittivities of the air and metal are assumed to be i0.00.11 +=ε and
i96
2 1010 +−=ε respectively. Distortion of the grating profile ( )32 ,aa is also
introduced, however it does not improve the average quality of the fits. It was shown
in Chapter 7 that a beam spread of approximately °= 121θ is required to account for
finite source size and diffraction in the system, therefore a small amount of beam
spread is introduced into the theoretical modelling illustrated here. The grating
profile, polar angle of incidence and properties of the wax overlayer determined for
each azimuthal scan are averaged, and the error about the mean calculated. The final
fits shown are then each generated from this averaged set: mm, 02.050.11 ±=a
mm, 01.062.2 ±=t ,01.029.2d ±=′ε 01.004.0d ±=′′ε and °±= 1.08.46θ . To confirm
the validity of the theoretical model, it is necessary to independently measure the
profile of the grating. By scanning a dial-gauge across the wax surface, the grating
amplitude and the thickness of the wax layer are determined to be mm 01.048.11 ±=a
and mm 08.063.2 ±=t respectively. Clearly, these values are within the uncertainties
of those determined via the fitting process.
Figure 8.4.5 The experimental ssR azimuth-angle scan corresponding to the white,
dashed line shown in Figure 8.4.4(b) ( )mm 110 =λ . The resonances are identified
and labelled according to the diffracted order that provides the coupling mechanism.

CHAPTER 8 The coupling of microwave radiation to surface plasmon polaritons and guided modes
via dielectric gratings.
169
8.5. Discussion
This work has demonstrated that it is possible to couple incident microwave radiation to
guided and SPP modes via an alternative geometry that does not require forming the
grating profile directly in to the metal substrate. Coupling to the SPP in this way is
advantageous over the “classical” one-interface grating-coupling geometry since
complicated shapes can easily be carved into a wax layer, rather than using expensive
machine time to mill the shape directly into a metal. In addition, the SPP that
propagates in the single-interface system may only be radiatively damped since the
media either side of the boundary are usually non-absorbing. Therefore, a sufficiently
Figure 8.4.6 Typical normalised azimuthal-angle dependent reflectivities (�)
compared with the theoretically modelled results (—) created from a single set of
fitting parameters. Radiation is incident on the sample at fixed polar angle of
incidence of °≈ 47θ with wavelengths of (a) mm, 5.70 =λ (b) mm, 5.80 =λ (c)
mm 5.90 =λ and (d) mm 5.100 =λ impinging on the sample. The signals recorded
are (a) ppR , (b) ssR , (c) psR and (d) ssR . The azimuthal-angle scans shown have
been extracted from the experimental data sets illustrated in Figure 8.4.1
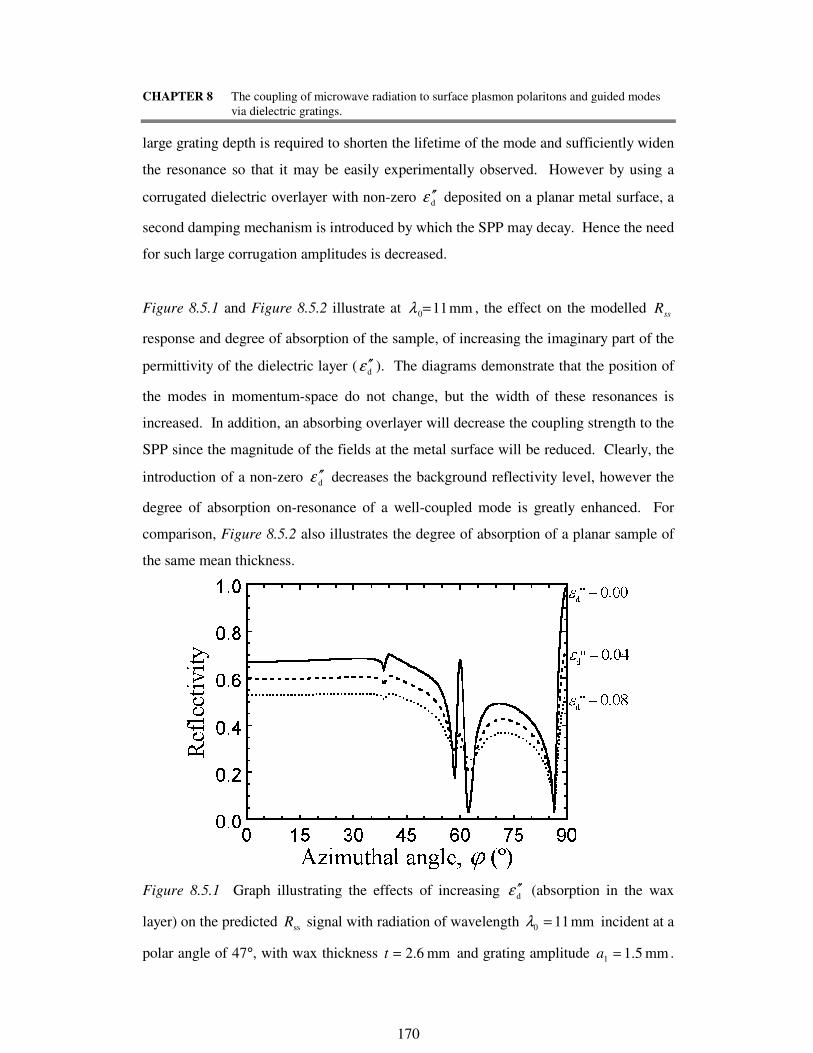
CHAPTER 8 The coupling of microwave radiation to surface plasmon polaritons and guided modes
via dielectric gratings.
170
large grating depth is required to shorten the lifetime of the mode and sufficiently widen
the resonance so that it may be easily experimentally observed. However by using a
corrugated dielectric overlayer with non-zero dε ′′ deposited on a planar metal surface, a
second damping mechanism is introduced by which the SPP may decay. Hence the need
for such large corrugation amplitudes is decreased.
Figure 8.5.1 and Figure 8.5.2 illustrate at mm 110=λ , the effect on the modelled ssR
response and degree of absorption of the sample, of increasing the imaginary part of the
permittivity of the dielectric layer (dε ′′ ). The diagrams demonstrate that the position of
the modes in momentum-space do not change, but the width of these resonances is
increased. In addition, an absorbing overlayer will decrease the coupling strength to the
SPP since the magnitude of the fields at the metal surface will be reduced. Clearly, the
introduction of a non-zero dε ′′ decreases the background reflectivity level, however the
degree of absorption on-resonance of a well-coupled mode is greatly enhanced. For
comparison, Figure 8.5.2 also illustrates the degree of absorption of a planar sample of
the same mean thickness.
Figure 8.5.1 Graph illustrating the effects of increasing dε ′′ (absorption in the wax
layer) on the predicted ssR signal with radiation of wavelength mm 110 =λ incident at a
polar angle of 47°, with wax thickness mm 6.2=t and grating amplitude mm 5.11 =a .
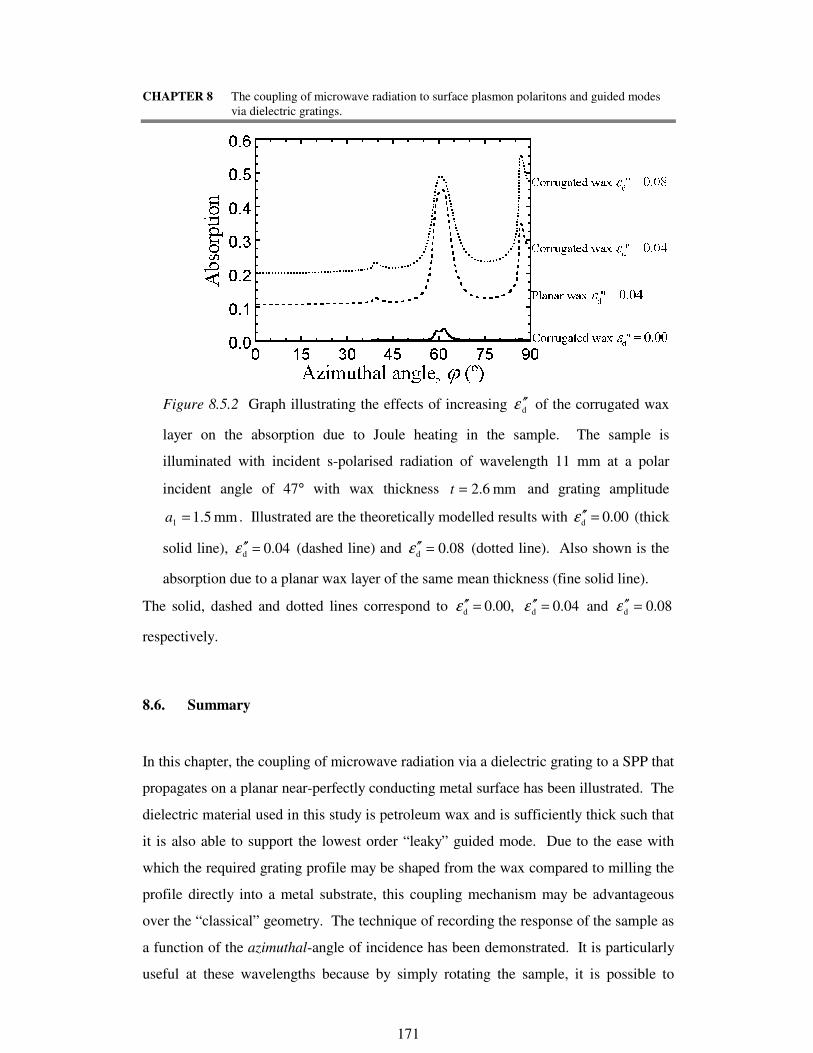
CHAPTER 8 The coupling of microwave radiation to surface plasmon polaritons and guided modes
via dielectric gratings.
171
The solid, dashed and dotted lines correspond to ,00.0d =′′ε 04.0d =′′ε and 08.0d =′′ε
respectively.
8.6. Summary
In this chapter, the coupling of microwave radiation via a dielectric grating to a SPP that
propagates on a planar near-perfectly conducting metal surface has been illustrated. The
dielectric material used in this study is petroleum wax and is sufficiently thick such that
it is also able to support the lowest order “leaky” guided mode. Due to the ease with
which the required grating profile may be shaped from the wax compared to milling the
profile directly into a metal substrate, this coupling mechanism may be advantageous
over the “classical” geometry. The technique of recording the response of the sample as
a function of the azimuthal-angle of incidence has been demonstrated. It is particularly
useful at these wavelengths because by simply rotating the sample, it is possible to
Figure 8.5.2 Graph illustrating the effects of increasing dε ′′ of the corrugated wax
layer on the absorption due to Joule heating in the sample. The sample is
illuminated with incident s-polarised radiation of wavelength 11 mm at a polar
incident angle of 47° with wax thickness mm 6.2=t and grating amplitude
mm 5.11 =a . Illustrated are the theoretically modelled results with 00.0d =′′ε (thick
solid line), 04.0d =′′ε (dashed line) and 08.0d =′′ε (dotted line). Also shown is the
absorption due to a planar wax layer of the same mean thickness (fine solid line).
CHAPTER 8 The coupling of microwave radiation to surface plasmon polaritons and guided modes
via dielectric gratings.
172
quickly gather large amounts of data by simultaneously scanning the incident
wavelength. Futhermore, the incident beam has been collimated to reduce the
undesirable effects of beam spread. Hence good agreement theoretical models based on
the differential formalism of Chandezon et al. and the experimental reflectivities have
been obtained. The fitting process has enabled the characterisation of the dielectric
constants of the wax, which has shown it to be slightly absorbing at these frequencies
( )i04.0d =′′ε . In addition, the real part of the wax permittivity derived in the fitting
process agrees with the value obtained via interferographic measurements. The effect of
a non-zero dε ′′ is to change the coupling strengths of the diffracted SPP and guided
mode resonances, and increase the range of momentum values over which energy may
be coupled into the modes. The degree of absorption of the sample is also greatly
enhanced on resonance of a well-coupled mode.

CHAPTER 9 The coupling of near-grazing microwave photons to surface plasmon polaritons via a
dielectric grating.
172
CHAPTER 9
The coupling of near-grazing microwave photons
to surface plasmon polaritons via a dielectric
grating.
9.1. Introduction
In this study, a dielectric grating, similar to that discussed in the last chapter, is used to
couple near-grazing microwave photons to surface plasmon polaritons (SPPs). The
novel result presented here is that when the grating grooves are orientated such that they
are parallel to the plane of incidence ( °±= 90ϕ ), coupling to SPPs with both s- and p-
polarised photons is possible at three different energies. It is demonstrated that one
mode is coupled to via p-polarised radiation, the other two modes are both coupled to
via s-polarised radiation. The multi-layer, multi-shape differential grating theory
discussed in Chapter 3 allows the identities of each of the modes to be confirmed by
modelling the electromagnetic fields above the metal substrate. In addition, a
comparison between the experimentally derived reflectivity scans and the theoretical
model is made.
9.2. Background
Of the two orthogonal linear polarisations, it has generally been considered possible to
couple only incident s-polarised (TE) radiation to the SPP when the grating grooves are
orientated such that they are parallel to the plane of incidence ( °±= 90ϕ ). However
recent work [Watts et al. (1997)] has shown that for sufficiently deep grooves, coupling
is also possible with incident p-polarised (TM) radiation. Here, a similar mechanism for
coupling p-polarised radiation to the SPP when the grating grooves are orientated in this
way is established. A two-interface geometry is utilised where the corrugated boundary,
which provides the coupling mechanism to the SPP, is separated from the planar one

CHAPTER 9 The coupling of near-grazing microwave photons to surface plasmon polaritons via a
dielectric grating.
173
along which the mode propagates. A similar geometry appears to have been first used
by Müller et al. (1997) who successfully coupled visible (632.8 nm) radiation to the
SPP mode. Their sample consisted of an evaporated silver substrate, overcoated with a
5 nm layer of gold and a photoresist layer containing an interferographically produced
grating. Other recent studies involving dielectric grating samples include that of
Salakhutdinov et al. (1998). They provided a theoretical and experimental study of a
metal-dielectric grating that shows increased diffraction efficiency over a conventional
metallic grating due to the excitation of “leaky” guided modes in the dielectric layer. In
addition, Seshadri (1999) have theoretically investigated the reflection of radiation from
a dielectric grating sample with a metallic substrate as a function of the angle of
incidence. On excitation of SPPs and guided modes in the dielectric film, they observe
peaks in the calculated absorption spectra, and they illustrate that the angular response
of the experimentally-determined reflection coefficient may be used to obtain estimates
of the average thickness of the film and amplitude of the grating.
In previous chapters, it has been shown that one may couple incident microwave
radiation into a SPP (TM0 mode) propagating along a metal-dielectric interface by using
a diffraction grating of suitable pitch. If this grating profile is formed in the metal
substrate (Chapter 7) then the width of the observed resonances will depend only on the
radiative decay of the mode and hence the amplitude of the grating [McPhedran and
Waterworth (1972), and Pockrand (1976)]. This is because no energy may be
dissipated into the substrate since metals behave as near-perfect conductors at
microwave frequencies. However it has been shown in Chapter 8 that it is also possible
to couple radiation into the SPP by depositing a corrugated wax overlayer on top of a
planar metal substrate. The grating again provides the mechanism for radiative decay,
but as the wax is slightly absorbing, the SPP may also decay via loss into the wax. In
this situation, both damping terms will contribute to the width of the surface plasmon
resonance (SPR). In addition, if the grating grooves are neither parallel nor
perpendicular to the plane of incidence )180 ,90 ,0( °±≠ϕ , then the polarisation of the
reradiated signal will be different to that of the incident beam and a polarisation
conversion [Bryan-Brown and Sambles (1990)] signal may be detected. If one chooses
to detect linearly polarised radiation, then this mechanism provides a third channel into

CHAPTER 9 The coupling of near-grazing microwave photons to surface plasmon polaritons via a
dielectric grating.
174
which energy may be transferred from the detected beam – it is “absorbed” by the
polarisation setting of the detector.
In this study, the reflectivity of near-grazing microwave radiation is recorded as a
function of wavelength and azimuthal angle of incidence from a sample consisting of a
slightly absorbing, thin dielectric (wax) grating on top of a near-perfectly conducting
metallic (aluminium-alloy) substrate. Such a sample enables the coupling of both p-
(TM) and s- (TE) polarised incident photons to the SPP at all orientations other than
°= 0ϕ , and according to the condition
( ) ϕθεθε cossin2sin 0
21
d
2222
0d
2kNkkNkk g
eff
g
eff
SPP ±+= Equation 9.2.1
(With incident s-polarised radiation at °= 0ϕ there is no local normal component of
electric field at either the flat or corrugated interfaces to create the necessary surface
charge). In Equation 9.2.1, )(d teffε is an effective complex permittivity of the dielectric
that is dependent on the thickness of the overlayer ( dd εε →eff as ∞→t ). The grating
pitch and wavelength-range are chosen so that at °±= 90ϕ the grating is effectively
“zero-order”, i.e. the only order propagating is the specularly reflected beam (see
Section 8.2). Hence any detected losses on excitation of any modes propagating in the
system recorded at °±= 90ϕ are solely due to absorption of energy into the dielectric
layer (since there is no polarisation conversion at this angle). Wavelength dependent
reflectivity scans are fitted to the rigorous grating modelling theory using the
corrugation amplitude, wax thickness, polar angle of incidence and the absorption of the
wax )( dε ′′ as fitting parameters. As grazing incidence is approached, one observes an
evolution of the s-coupled SPP into two different modes. Utilisation of the modelling
theory to predict the field distribution throughout the sample provides an explanation of
this phenomenon.
CHAPTER 9 The coupling of near-grazing microwave photons to surface plasmon polaritons via a
dielectric grating.
175
9.3. Experimental
It is necessary to design a sample whose grating pitch ( λg ), amplitude ( 1a ) and wax
thickness (t) will permit the resonant coupling to the SPP using near-grazing photons
within the available wavelength range ( )mm 3.11mm 5.7 0 << λ . By utilising the
grating modelling theory, the optimum parameters required in order to achieve these
results are deduced. The sample chosen has a purely sinusoidal top interface profile,
gxaxA λπ2cos)( 1= where mm 50.11 =a and mm 00.15=gλ , with mean thickness of
wax, mm 60.1=t . The real part of the complex permittivity of the wax has been
determined in the last chapter via interferographic reflectivity measurements from a
planar slab of known thickness, and the imaginary part has been measured by fitting the
predictions from the grating modelling theory to reflectivity measurements.
The sample is prepared by filling a metallic, square tray of side approximately 400 mm
and depth 5 mm with hot wax and allowing it to cool. A sinusoidal template is
manufactured with a pitch of mm 00.15=gλ and fundamental amplitude of
mm 50.11 =a . It is used to remove unwanted wax from the sample by carefully
dragging it across the surface until the required grating profile is obtained (Figure
9.3.1).
The experimental arrangement described in the last chapter was again used to record the
reflectivity from the sample in order to reduce the undesirable effects of spherical
wavefronts (Figure 8.3.2). Variation of the magnitude of the incident wave-vector in
the plane of the grating may be achieved by scanning either wavelength ( λ0 ), or angle
of incidence (θ or ϕ). In this study the reflectivity data are taken both as a function of
wavelength ( )mm 3.11mm 5.7 0 << λ and azimuthal angle of incidence ( )°<< 900 ϕ ,
fixing the polar angle of incidence at °≈ 80θ . Figure 9.3.1 illustrates the co-ordinate
system used to describe the geometry of the sample.
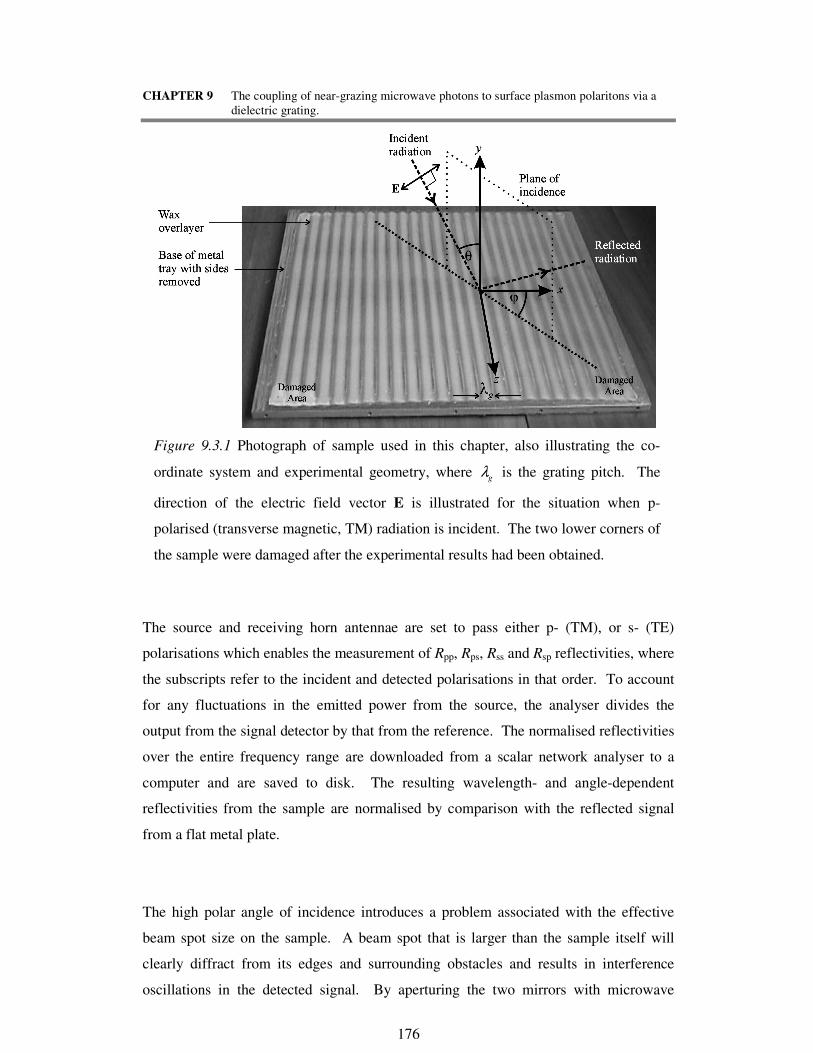
CHAPTER 9 The coupling of near-grazing microwave photons to surface plasmon polaritons via a
dielectric grating.
176
The source and receiving horn antennae are set to pass either p- (TM), or s- (TE)
polarisations which enables the measurement of Rpp, Rps, Rss and Rsp reflectivities, where
the subscripts refer to the incident and detected polarisations in that order. To account
for any fluctuations in the emitted power from the source, the analyser divides the
output from the signal detector by that from the reference. The normalised reflectivities
over the entire frequency range are downloaded from a scalar network analyser to a
computer and are saved to disk. The resulting wavelength- and angle-dependent
reflectivities from the sample are normalised by comparison with the reflected signal
from a flat metal plate.
The high polar angle of incidence introduces a problem associated with the effective
beam spot size on the sample. A beam spot that is larger than the sample itself will
clearly diffract from its edges and surrounding obstacles and results in interference
oscillations in the detected signal. By aperturing the two mirrors with microwave
Figure 9.3.1 Photograph of sample used in this chapter, also illustrating the co-
ordinate system and experimental geometry, where λg is the grating pitch. The
direction of the electric field vector E is illustrated for the situation when p-
polarised (transverse magnetic, TM) radiation is incident. The two lower corners of
the sample were damaged after the experimental results had been obtained.
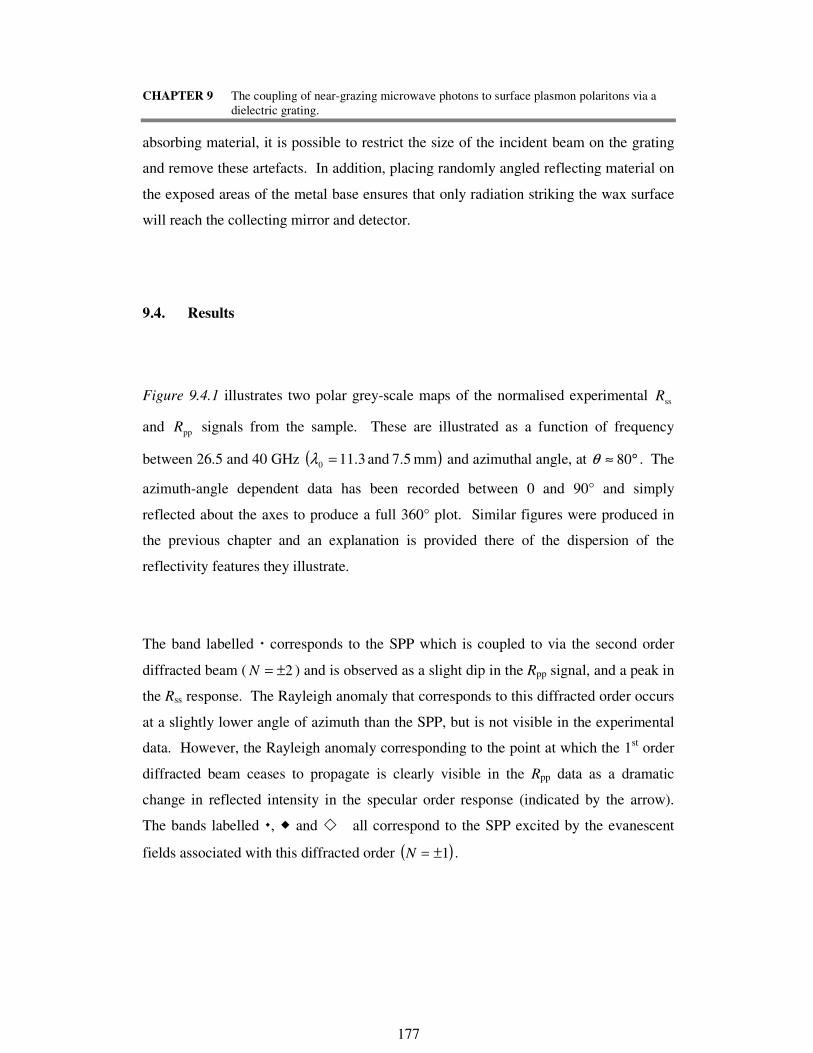
CHAPTER 9 The coupling of near-grazing microwave photons to surface plasmon polaritons via a
dielectric grating.
177
absorbing material, it is possible to restrict the size of the incident beam on the grating
and remove these artefacts. In addition, placing randomly angled reflecting material on
the exposed areas of the metal base ensures that only radiation striking the wax surface
will reach the collecting mirror and detector.
9.4. Results
Figure 9.4.1 illustrates two polar grey-scale maps of the normalised experimental ssR
and ppR signals from the sample. These are illustrated as a function of frequency
between 26.5 and 40 GHz ( )mm 5.7 and 3.110 =λ and azimuthal angle, at °≈ 80θ . The
azimuth-angle dependent data has been recorded between 0 and 90° and simply
reflected about the axes to produce a full 360° plot. Similar figures were produced in
the previous chapter and an explanation is provided there of the dispersion of the
reflectivity features they illustrate.
The band labelled � corresponds to the SPP which is coupled to via the second order
diffracted beam ( 2±=N ) and is observed as a slight dip in the Rpp signal, and a peak in
the Rss response. The Rayleigh anomaly that corresponds to this diffracted order occurs
at a slightly lower angle of azimuth than the SPP, but is not visible in the experimental
data. However, the Rayleigh anomaly corresponding to the point at which the 1st order
diffracted beam ceases to propagate is clearly visible in the Rpp data as a dramatic
change in reflected intensity in the specular order response (indicated by the arrow).
The bands labelled �, � and � all correspond to the SPP excited by the evanescent
fields associated with this diffracted order ( )1±=N .

CHAPTER 9 The coupling of near-grazing microwave photons to surface plasmon polaritons via a
dielectric grating.
178
Figure 9.4.1 Normalised ssR and ppR response of the sample as a function of
frequency and azimuthal angle of incidence. Data has been recorded between
°= 0ϕ and °= 90ϕ , and reflected about the axes to produce full 360° polar maps.
The band labelled � corresponds to the ±2 SPP, and the bands labelled �, � and
� all correspond to the ±1 SPP. The arrow on the upper diagram identifies the
corresponding ±1 Rayleigh anomaly.
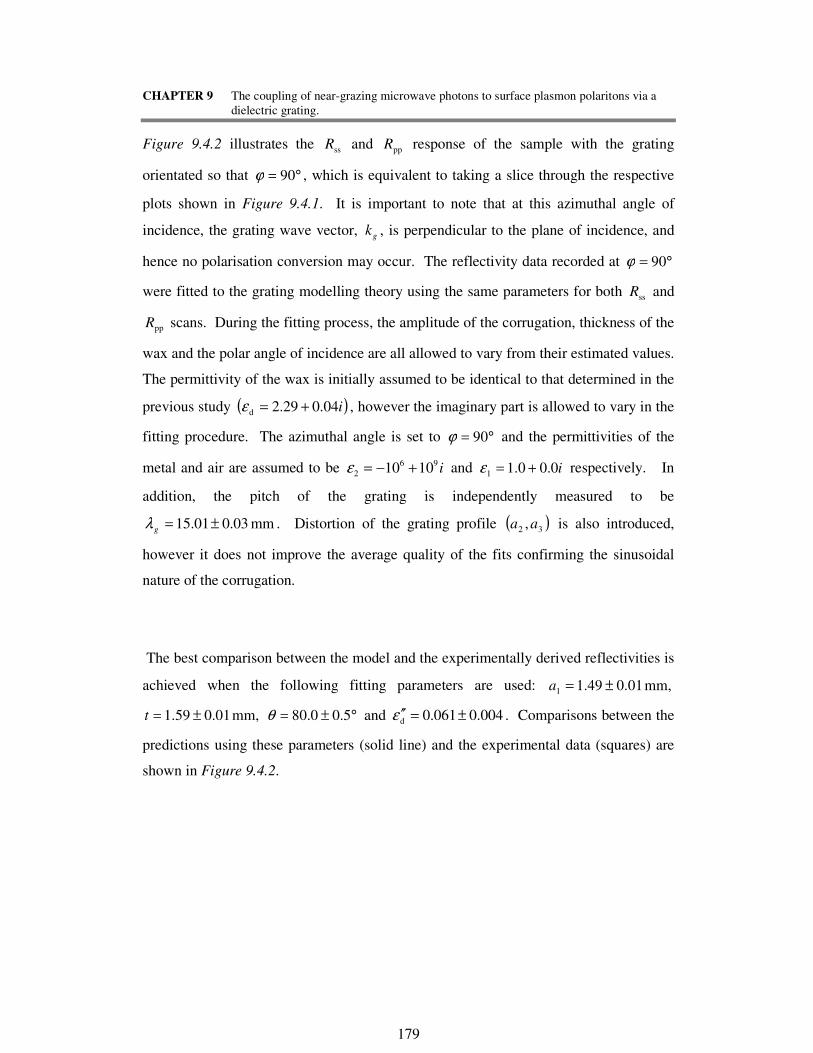
CHAPTER 9 The coupling of near-grazing microwave photons to surface plasmon polaritons via a
dielectric grating.
179
Figure 9.4.2 illustrates the ssR and ppR response of the sample with the grating
orientated so that °= 90ϕ , which is equivalent to taking a slice through the respective
plots shown in Figure 9.4.1. It is important to note that at this azimuthal angle of
incidence, the grating wave vector, kg , is perpendicular to the plane of incidence, and
hence no polarisation conversion may occur. The reflectivity data recorded at °= 90ϕ
were fitted to the grating modelling theory using the same parameters for both ssR and
ppR scans. During the fitting process, the amplitude of the corrugation, thickness of the
wax and the polar angle of incidence are all allowed to vary from their estimated values.
The permittivity of the wax is initially assumed to be identical to that determined in the
previous study ( )i04.029.2d +=ε , however the imaginary part is allowed to vary in the
fitting procedure. The azimuthal angle is set to °= 90ϕ and the permittivities of the
metal and air are assumed to be i96
2 1010 +−=ε and i0.00.11 +=ε respectively. In
addition, the pitch of the grating is independently measured to be
mm 03.001.15 ±=gλ . Distortion of the grating profile ( )32 ,aa is also introduced,
however it does not improve the average quality of the fits confirming the sinusoidal
nature of the corrugation.
The best comparison between the model and the experimentally derived reflectivities is
achieved when the following fitting parameters are used: mm, 01.049.11 ±=a
mm, 01.059.1 ±=t °±= 5.00.80θ and 004.0061.0d ±=′′ε . Comparisons between the
predictions using these parameters (solid line) and the experimental data (squares) are
shown in Figure 9.4.2.

CHAPTER 9 The coupling of near-grazing microwave photons to surface plasmon polaritons via a
dielectric grating.
180
Figure 9.4.2 The normalised ssR and ppR frequency-dependent response (�) of the
sample orientated at °= 90ϕ . The solid lines on each of the graphs correspond to
the theoretically modelled results that have been created from the same set of fitting
parameters. The two experimental data sets shown have been extracted from the
data shown in Figure 9.4.1.

CHAPTER 9 The coupling of near-grazing microwave photons to surface plasmon polaritons via a
dielectric grating.
181
9.5. Discussion
The fitted ppR and ssR reflectivity data recorded at °= 90ϕ and shown above illustrates
good agreement between the theory and the experimental results. The reflectivity data
appears more “noisy” than the microwave data presented in earlier chapters at least in
part due the large beam spot size associated with the high polar angle used in this study.
Clearly the known amplitude of the grating template agrees with the amplitude
determined via the fitting procedure. However, the value of the imaginary part of the
dielectric constant of the wax determined here ( 004.0061.0d ±=′′ε ) is slightly greater
than that measured in the previous chapter ( 01.004.0d ±=′′ε ) when a thicker layer was
used. The may be attributed to a difference in deposition conditions of the wax and
impurities on the surface of the metal.
Figure 9.4.1 illustrates the dispersion of modes that are supported by the sample and are
excited using near-grazing microwave radiation in the 26.5 to 40 GHz frequency range
( )mm 5.7mm 3.11 0 >> λ . This section will demonstrate that these modes correspond
to the resonance condition of the SPP.
The experimentally measured response of the sample in the special case when the
grooves are orientated so that they are parallel to the plane of incidence ( )°±= 90ϕ is
shown in Figure 9.4.2. In this situation, polarisation conversion is not possible, and
since no orders are propagating in the system other than the specular beam, any energy
loss in the reflected signal on resonance of the SPP can only be lost into the media
surrounding the interface. It is possible to verify the resonance condition of the SPP by
using the grating modelling theory to plot the vector electric fields in the xy-plane. A
strong local component of the electric field vector normal to the metal-wax interface
(Ey) induces a periodic oscillation of polarisation charge along the boundary showing
the coupling of incident radiation to a surface mode. Figure 9.5.1 illustrates the
predicted Exy instantaneous vector fields at °±= 90ϕ for the three resonance
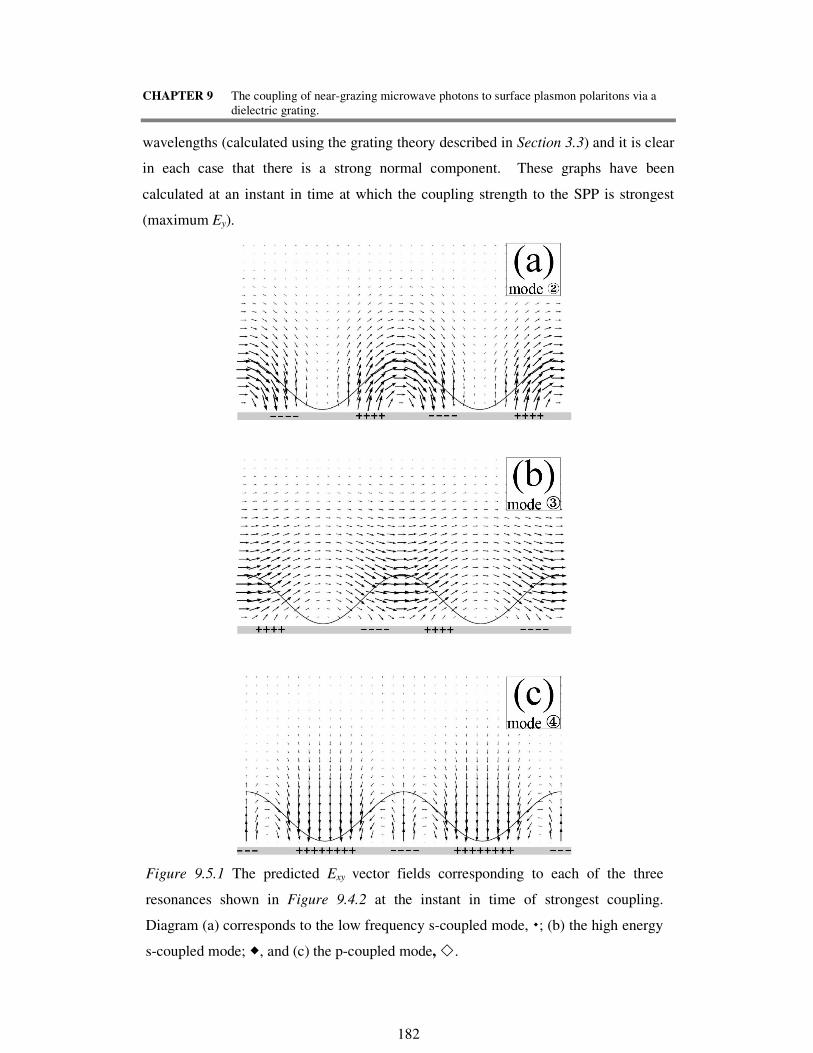
CHAPTER 9 The coupling of near-grazing microwave photons to surface plasmon polaritons via a
dielectric grating.
182
wavelengths (calculated using the grating theory described in Section 3.3) and it is clear
in each case that there is a strong normal component. These graphs have been
calculated at an instant in time at which the coupling strength to the SPP is strongest
(maximum Ey).
Figure 9.5.1 The predicted Exy vector fields corresponding to each of the three
resonances shown in Figure 9.4.2 at the instant in time of strongest coupling.
Diagram (a) corresponds to the low frequency s-coupled mode, �; (b) the high energy
s-coupled mode; �, and (c) the p-coupled mode, �.

CHAPTER 9 The coupling of near-grazing microwave photons to surface plasmon polaritons via a
dielectric grating.
183
It is important to consider how the SPP is created along the metal boundary in each of
the resonance conditions described above, remembering that it is only the local normal
component of the electric field which induces surface charge and thus couples to a SPP.
When s-polarised radiation at near-grazing incidence impinges on the sample, there is
no component of the electric field vector normal to the metal interface to directly create
the required surface charge. However, there is always a component of E normal to the
profile of the dielectric grating, which is at a maximum at the point of steepest gradient.
Hence polarisation charge is induced at these points on the wax-air boundary, which in
turn induces charge at points on the metal surface below (approximately at
( )1221 += pxk g π , where p is an integer). In the p-polarised case, there is clearly a
component of E normal to the metal-wax interface. However since it is a plane wave,
one may initially think that all the charges induced should be in phase, yet a surface
charge density oscillation at the metal boundary is induced. This is because of the
difference in path length experienced by a photon striking the top of the high-index wax
groove compared with one impinging near the trough. Hence we find that the charge
centres are located symmetrically along the metal boundary with respect to the grating
profile (at πpxk g = ), immediately below the peaks and troughs of the dielectric
grating.
Of course at °±= 90ϕ , and on excitation of the SPP, there will be two surface waves
propagating in opposite directions along the metal surface. These two counter-
propagating eigenmodes may be coupled together via two successive kg scattering
events, setting up a standing wave in the x-direction, where the period of the standing
wave is the same as the grating pitch ( )gSPP λλ = . The standing wave associated with
the p-coupled mode will have a different charge distribution on the surface of the metal
to the charge distribution associated with the s-coupled mode, and hence two quite
distinct field profiles will result. One field profile has maxima in Ey below the peaks
and troughs of the grating surface (coupled to via p-polarised incident radiation), the
other with its extrema underneath the points of steepest gradient (coupled to via s-
polarised radiation). These correspond to a low and a high energy mode respectively,
and hence an energy gap is seen to open up at °±= 90ϕ .
CHAPTER 9 The coupling of near-grazing microwave photons to surface plasmon polaritons via a
dielectric grating.
184
The situation described above is further complicated since at the polar angle of
incidence studied in this work ( °= 80θ ), there may be coupling to the s-coupled SPP at
two different energies (Figure 9.4.1), both of which exist at lower energies than that
needed to coupled to the p-mode. Therefore, it is interesting to theoretically model the
dispersion of the SPP mode as a function of frequency and polar angle of incidence
(Figure 9.5.2). The boundary between the areas of low and high reflectivity which
forms an arc in the top left corner of Figure 9.5.2 is associated with the ±2 Rayleigh
anomaly, and the dark band that extends from the bottom left corner of both the graphs
corresponds to the excitation of the ±2 SPP. This figure illustrates that one may only
couple s-polarised radiation to SPP mode at two different energies when
9.0sin 0 >= kk zθ (approximately). Notice also that an equivalent “splitting” of the p-
coupled mode at high polar angles does not occur. To explain this result, it is useful to
refer back to the vector field illustrations of Figure 9.5.1.
First consider the p-coupled mode, where the standing wave in the x-direction has its
charge centres on the metal surface beneath the peaks and troughs of the dielectric
grating. For °≠ 0θ , there are two loops of Exy within each grating period where
neighbouring loops are in anti-phase. Now consider the s-polarised case. When
75.0sin ≈θ , there is only one coupling condition to the SPP and again two loops of Exy
are seen in Figure 9.5.1(c). However since the standing wave at the metal interface is
out of phase by 4gλ with respect to the grating profile, one loop exists primarily
within the wax, the other samples the air. As grazing incidence is approached
( )0kk z → , one of the field loops becomes dominant at the expense of the other.
Eventually one of the loops almost disappears and now neighbouring loops of E are in
phase with each other and two quite distinct bands are observed. Band � corresponds to
the mode whose loops of Exy are almost entirely contained within the wax of the grating,
and by contrast the field loops associated with band � are concentrated within the air.
Since a mode whose field loops are concentrated in the wax samples a higher effective
refractive index than one whose fields may penetrate into the air, modes associated with
band � exist at a lower energy than those of band �. This is also clear from the
experimental scan shown in Figure 9.4.2 which corresponds to the black dashed line
superimposed on Figure 9.5.2. Also evident from these figures is that band � appears
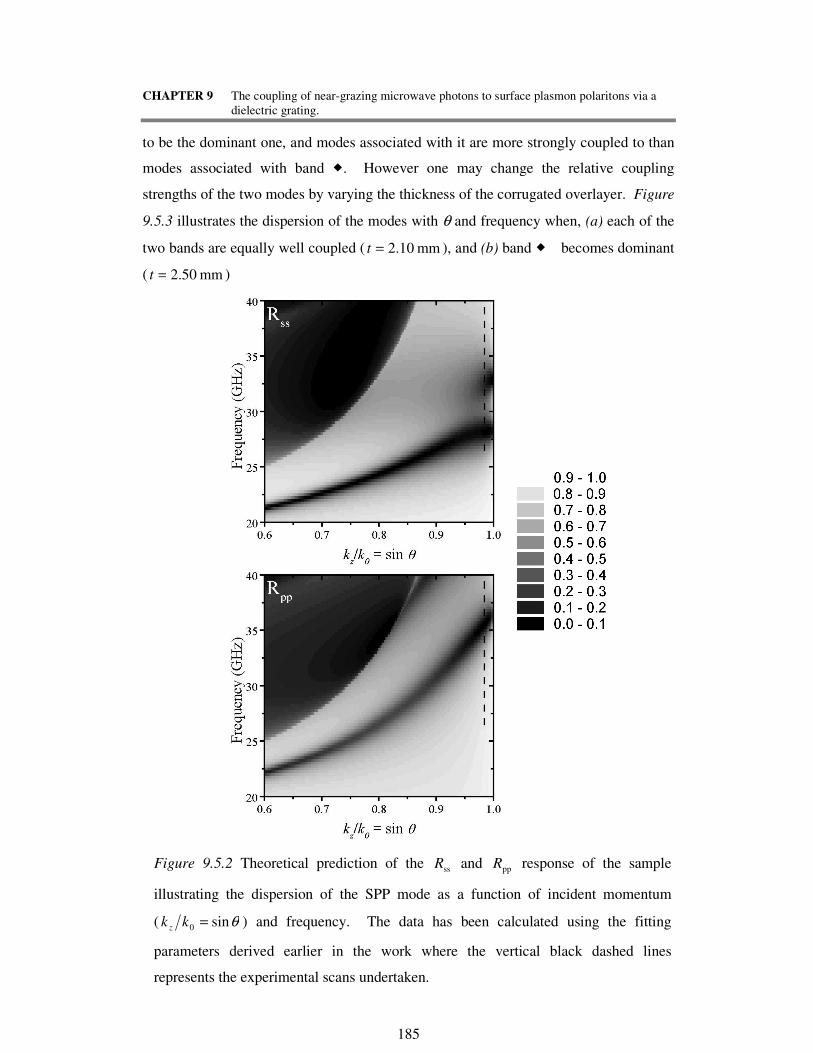
CHAPTER 9 The coupling of near-grazing microwave photons to surface plasmon polaritons via a
dielectric grating.
185
to be the dominant one, and modes associated with it are more strongly coupled to than
modes associated with band �. However one may change the relative coupling
strengths of the two modes by varying the thickness of the corrugated overlayer. Figure
9.5.3 illustrates the dispersion of the modes with θ and frequency when, (a) each of the
two bands are equally well coupled ( mm 10.2=t ), and (b) band � becomes dominant
( mm 50.2=t )
Figure 9.5.2 Theoretical prediction of the ssR and ppR response of the sample
illustrating the dispersion of the SPP mode as a function of incident momentum
( θsin0 =kk z ) and frequency. The data has been calculated using the fitting
parameters derived earlier in the work where the vertical black dashed lines
represents the experimental scans undertaken.
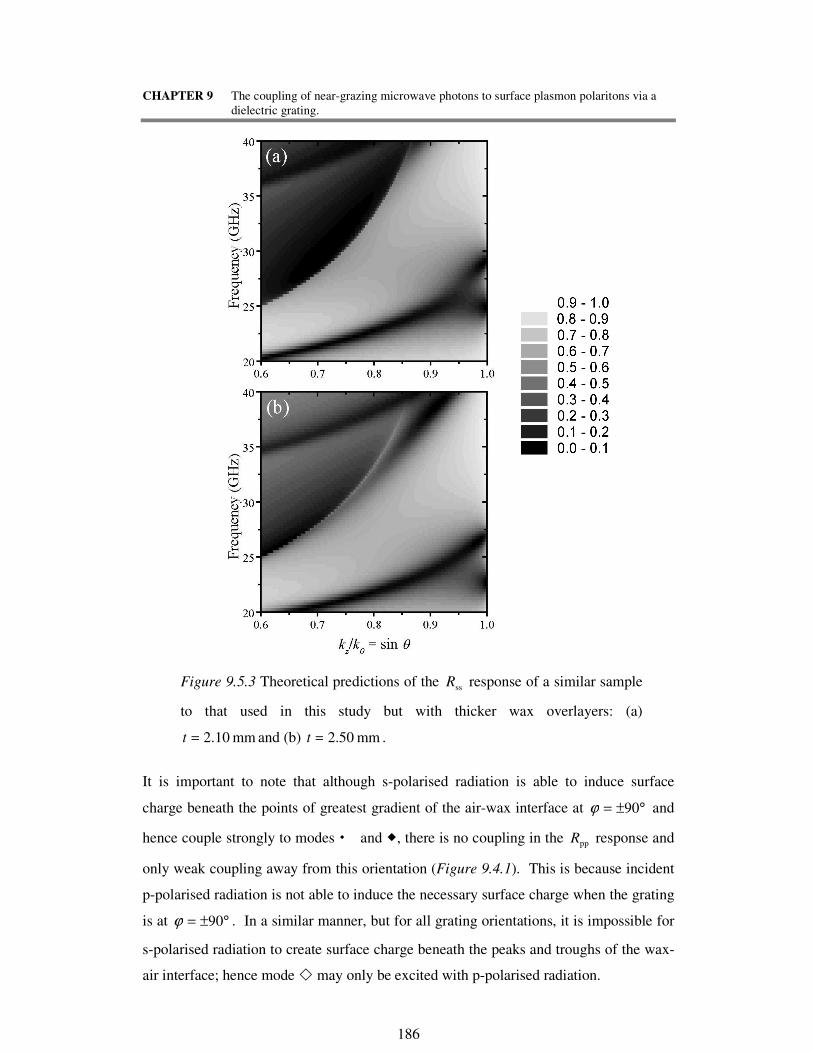
CHAPTER 9 The coupling of near-grazing microwave photons to surface plasmon polaritons via a
dielectric grating.
186
It is important to note that although s-polarised radiation is able to induce surface
charge beneath the points of greatest gradient of the air-wax interface at °±= 90ϕ and
hence couple strongly to modes � and �, there is no coupling in the ppR response and
only weak coupling away from this orientation (Figure 9.4.1). This is because incident
p-polarised radiation is not able to induce the necessary surface charge when the grating
is at °±= 90ϕ . In a similar manner, but for all grating orientations, it is impossible for
s-polarised radiation to create surface charge beneath the peaks and troughs of the wax-
air interface; hence mode � may only be excited with p-polarised radiation.
Figure 9.5.3 Theoretical predictions of the ssR response of a similar sample
to that used in this study but with thicker wax overlayers: (a)
mm 10.2=t and (b) mm 50.2=t .
CHAPTER 9 The coupling of near-grazing microwave photons to surface plasmon polaritons via a
dielectric grating.
187
9.6. Summary
In this work near-grazing microwave radiation has been coupled via a dielectric grating,
to SPPs that propagate along a planar metal surface. The reflectivity of the sample is
recorded as a function of azimuthal angle and incident wavelength in the microwave
regime, using petroleum wax as the high-index dielectric. Good agreement between the
predictions from a rigorous grating modelling theory and the experimental reflectivities
has been obtained, and the fitting process enables the verification of the profile of the
grating and the dielectric constants of the wax at these frequencies.
It is shown that when the grating is orientated with its grooves parallel to the plane of
incidence, coupling to a SPP via both incident p- and s-polarised radiation is observed
with an energy gap appearing between the two modes. Furthermore, at high polar
angles of incidence, the s-coupled mode splits into two bands with different energies.
The identity of each of the modes is confirmed as the excitation of the SPP, and an
explanation is provided for their coupling conditions by modelling their resonant
electric field profiles and their dispersion with frequency and in-plane momentum.

CHAPTER 10 Conclusions
188
CHAPTER 10
Conclusions
10.1. Summary of Thesis
The work presented in this thesis concerns the coupling of incident radiation to the
surface plasmon polariton (SPP) at visible and microwave frequencies. In Chapters 2
and 3, an introduction to the SPP is presented. Chapter 2 provides a brief historical
overview of the principal developments in the understanding of the physics of the mode
over the past 100 years. By deriving its dispersion relation and exploring the spatial
extent of its electric fields, the properties of the SPP are described. In addition, the
methods for coupling radiation into the mode are discussed, with particular emphasis on
the technique of corrugating a metal-dielectric interface.
Chapter 3 concerns the grating modelling theory used throughout the thesis.
Considerations are presented of the effects on the specular reflectivity from the sample
of changing the profile of the metal-dielectric interface. The influence of lossy
overlayers deposited on top of the metal substrate is also theoretically studied.
The experimental section of this thesis may be divided into two subsections. Chapters
4,5 and 6 are concerned with work conducted in the visible regime, while Chapters 7,8
and 9 present studies undertaken at microwave frequencies. More specifically,
Chapters 4 and 5 show how the surface plasmon resonance (SPR) technique may be
used to characterise the complex dielectric function of metallic materials at visible
wavelengths by depositing the metal onto a sinusoidally height-modulated substrate.
Chapter 4 provides an optical characterisation of titanium nitride – an extremely hard-
wearing material that appears gold-like in colour. Similarly, Chapter 5 presents a study
of the optical dielectric function of pure indium. Since indium is easily oxidised in air,
the interface along which the surface modes are excited is protected from the
atmosphere. In both experiments, excellent agreements are obtained between the results
from the grating modelling theory and the experimental reflectivities. In addition, the
experimentally determined dielectric functions are compared with a simple Drude, free-
CHAPTER 10 Conclusions
189
electron model, and then a more sophisticated Drude-Lorentz model, in order to obtain
an approximate value of each of the metal’s relaxation times and plasma frequencies.
Chapter 6 illustrates a new technique for recording the angle-dependent reflectivities
from grating samples at visible frequencies. The response from a silver-coated grating
is recorded as a function of the angle of azimuth, at a number of different polar angles.
The data is then successfully fitted to the grating modelling theory in order to
characterise the optical permittivities of the silver and accurately determine the profile
of the surface. It is shown that this is generally a useful technique since, unlike the
more conventional polar angle of incidence scans, it involves no moving signal detector.
The apparatus described in Chapter 6 is scaled up and developed for use at microwave
frequencies. In Chapter 7 it is shown how this technique is particularly advantageous
since polar-angle scans become cumbersome at these longer wavelengths. It presents a
thorough investigation of the coupling of microwave radiation to the SPP that
propagates along a corrugated, near-perfectly conducting metal substrate. Both
singularly and doubly corrugated (bi-grating) substrates are considered, and the
experimental reflectivities show excellent agreement with the predictions from the
grating modelling theory. However, it is clearly shown that high quality fits could only
be achieved by collimating the incident beam to reduce the effects of beam-spread.
Chapters 8 and 9 are concerned with dielectric gratings that are deposited on near-
perfectly conducting, planar metal substrates. With such samples, the interface that
provides the coupling mechanism, and the interface along which the SPP propagates are
separated. The dielectric material used is petroleum wax, which in the available
frequency range, is found to have a similar refractive index to glass at visible
frequencies. Due to the ease in which the profiles can be shaped into the wax,
compared to milling them directly into the metal substrate, this coupling technique
presents an advantage over the more conventional geometry. While the average
thickness of the dielectric layer studied in Chapter 9 is always less than one-fifth of the
wavelength, the sample studied in Chapter 8 is thick enough to be able to support not
just SPPs, but also the first guided mode. The effects of non-zero ε ′′ in the dielectric
are theoretically investigated for the sample used in Chapter 8, and the degree of
absorption is shown to be greatly enhanced on resonance of a well-coupled mode.

CHAPTER 10 Conclusions
190
Chapter 9 presents the novel result that when a near-grazing beam is incident on the
sample with its grooves orientated such that they are parallel to the plane of incidence,
coupling to the SPP is possible with both p- and s-polarised radiation at three different
energies. The identity of each of the modes are confirmed as the resonant excitation of
the SPP and an explanation is provided for their coupling conditions by modelling their
electric field profiles and their dispersion with frequency and in-plane momentum. In
both these chapters, good agreement is obtained between the experimentally recorded
reflectivities, and the theoretically modelled results.
10.2. Future Work
The Thin Film Photonics research group, of which the author is a member, has amassed
over 15 years of scientific experience in the area of diffractive optics. Without such a
knowledge base, many of the results presented here would have been very difficult to
achieve. The microwave studies carried out as part of this thesis represent the group’s
first steps into a completely different region of the electromagnetic spectrum. The
possibility of undertaking experiments at much longer wavelengths has allowed us to
consider an enormous range of studies that are impractical, or simply much harder to
investigate in the visible regime. Hence the list of potentially interesting future work is
huge, and just a small selection of ideas are listed here.
In Chapters 7 and 8, a dielectric grating was deposited on top of a planar metal
substrate, which at microwave frequencies, behaves like a near-perfect conductor. On
excitation of SPPs that propagate along the dielectric-metal interface, energy is lost into
the dielectric if it is lossy (i.e. 0>′′ε ). A thorough investigation of lossy dielectrics
should be undertaken, with the aim of finding a material, which, when combined with a
suitably shaped grating, will absorb a large proportion of the microwave radiation
incident upon it. It may be advantageous, certainly for practical applications, to form
the diffraction grating in the metallic substrate, and fill the grooves with the dielectric,
so that the upper surface is planar (Figure 10.2.1).
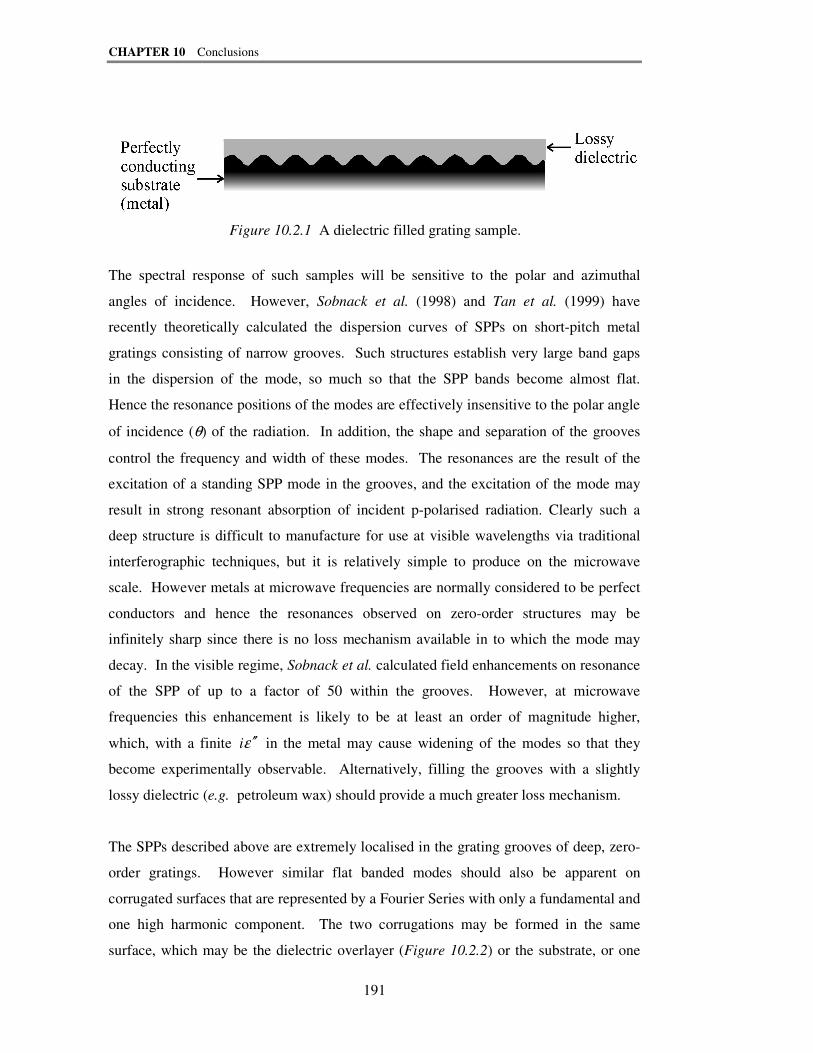
CHAPTER 10 Conclusions
191
The spectral response of such samples will be sensitive to the polar and azimuthal
angles of incidence. However, Sobnack et al. (1998) and Tan et al. (1999) have
recently theoretically calculated the dispersion curves of SPPs on short-pitch metal
gratings consisting of narrow grooves. Such structures establish very large band gaps
in the dispersion of the mode, so much so that the SPP bands become almost flat.
Hence the resonance positions of the modes are effectively insensitive to the polar angle
of incidence (θ) of the radiation. In addition, the shape and separation of the grooves
control the frequency and width of these modes. The resonances are the result of the
excitation of a standing SPP mode in the grooves, and the excitation of the mode may
result in strong resonant absorption of incident p-polarised radiation. Clearly such a
deep structure is difficult to manufacture for use at visible wavelengths via traditional
interferographic techniques, but it is relatively simple to produce on the microwave
scale. However metals at microwave frequencies are normally considered to be perfect
conductors and hence the resonances observed on zero-order structures may be
infinitely sharp since there is no loss mechanism available in to which the mode may
decay. In the visible regime, Sobnack et al. calculated field enhancements on resonance
of the SPP of up to a factor of 50 within the grooves. However, at microwave
frequencies this enhancement is likely to be at least an order of magnitude higher,
which, with a finite ε ′′i in the metal may cause widening of the modes so that they
become experimentally observable. Alternatively, filling the grooves with a slightly
lossy dielectric (e.g. petroleum wax) should provide a much greater loss mechanism.
The SPPs described above are extremely localised in the grating grooves of deep, zero-
order gratings. However similar flat banded modes should also be apparent on
corrugated surfaces that are represented by a Fourier Series with only a fundamental and
one high harmonic component. The two corrugations may be formed in the same
surface, which may be the dielectric overlayer (Figure 10.2.2) or the substrate, or one
Figure 10.2.1 A dielectric filled grating sample.

CHAPTER 10 Conclusions
192
may be formed at each interface (Figure 10.2.3). The fundamental (long pitch)
component provides the coupling mechanism to the SPP that propagates along the
dielectric-metal interface. The high harmonic (zero-order) component repeatedly folds
the dispersion curve and induces the band gaps at the Bruilloin zone edges. Hence with
a sufficiently short-pitch grating, the bands will become almost flat within the incident
light cone.
Figure 10.2.3 Example of a double-corrugated sample where the two corrugations are
separated.
As discussed in Section 2.5 and illustrated in Chapter 8, a sample corrugated in just one
direction is unable to support modes for all angles of azimuth and incident polarisations.
However, bigrating structures [where a second corrugation is formed either at 60º or 90º
to the original, see Chapter 6 and Watts et al. (1996)] could yield samples that support
modes that are insensitive to both the polar (θ) and azimuthal (ϕ) angles of incidence.
Additionally, the use of random, pseudo-random or mosaic grating structures should be
investigated, perhaps combined with a zero order corrugation in the way described
above. Such “random” profiles may permit the coupling of incident radiation to SPP
modes over a large range of angles and wavelengths due to the range of scattering wave
vectors available.
Another structure that should be investigated is one similar to that shown in Figure
10.2.1, but with an additional corrugation formed in the upper interface which is in a
Figure 10.2.2 Example of a doubly-corrugated grating formed in the dielectric
overlayer.

CHAPTER 10 Conclusions
193
different direction to the original. If the dielectric is sufficiently thick, then one of the
corrugations will permit coupling to guided modes within the layer. Due to the effect of
the second corrugation, these modes will sample a range of dielectric thicknesses and if
the dielectric is slightly lossy, multi-frequency absorption may result.
Another area of interest is the enhanced transmission of microwave radiation through
non-diffracting hole arrays, similar to the very recent work presented by Ebbesen et al.
(1999) and Porto et al. (1999). The explanation of the response of such structures is
still not fully developed. However, it is thought to be similar to that previously
discussed for the zero-order narrow-groove gratings [Sobnack et al. (1998) and Tan et
al. (1999)], with the SPP standing waves now established within the holes.
A series of new experiments could be undertaken to monitor the phase change of the
reflected radiation in the region of the resonance of the SPP. Figure 10.2.4 shows a
modified experimental set up that could be used to study this effect, where the reflected
signal from the sample is combined with the reflection from a perfect mirror. Other
areas of interesting research include the use of focussed incident beams, whereby the
SPP will be excited on a planar interface without the need of a corrugation at all, and the
use of samples that contain defects [e.g. Figure 10.3.1(a)], or consist of only a finite
number of grooves [e.g Figure 10.3.1(b)]. Finally, the possibility of excitation of
surface magneto-plasmons in the microwave regime should be considered.
Figure 10.2.4 Modified microwave-experiment apparatus to record the change in phase
of the reflected signal from the sample in the region of surface plasmon resonances.
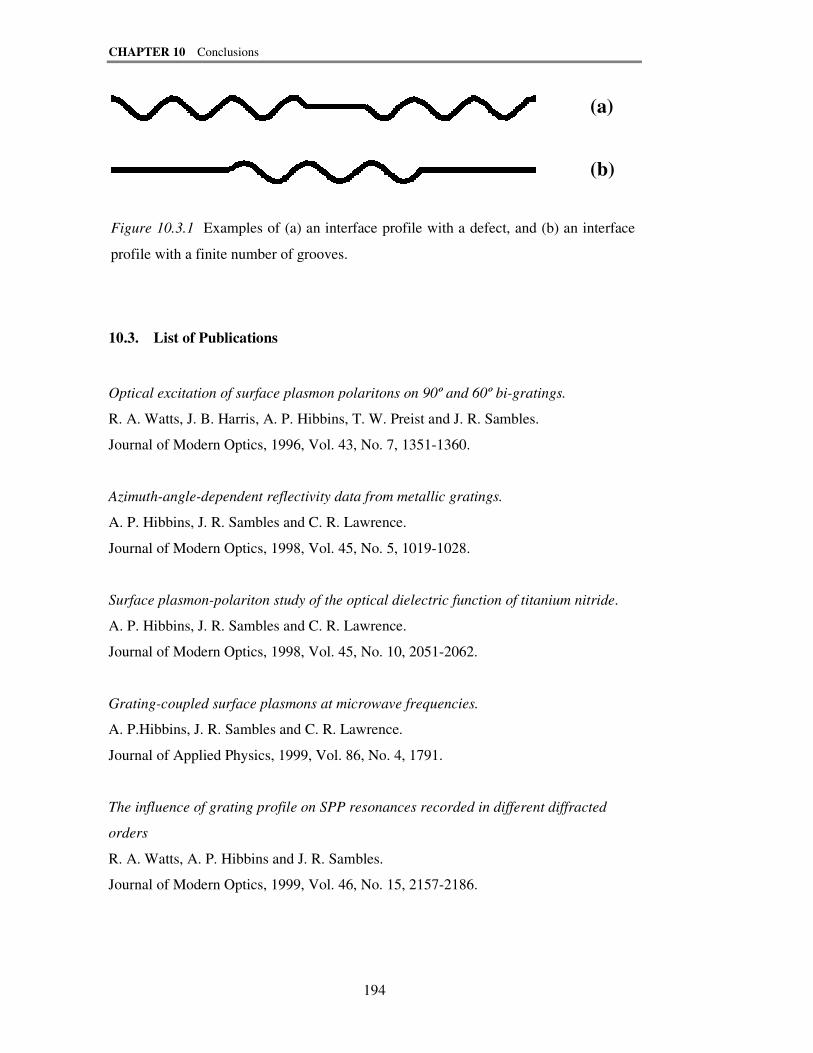
CHAPTER 10 Conclusions
194
10.3. List of Publications
Optical excitation of surface plasmon polaritons on 90º and 60º bi-gratings.
R. A. Watts, J. B. Harris, A. P. Hibbins, T. W. Preist and J. R. Sambles.
Journal of Modern Optics, 1996, Vol. 43, No. 7, 1351-1360.
Azimuth-angle-dependent reflectivity data from metallic gratings.
A. P. Hibbins, J. R. Sambles and C. R. Lawrence.
Journal of Modern Optics, 1998, Vol. 45, No. 5, 1019-1028.
Surface plasmon-polariton study of the optical dielectric function of titanium nitride.
A. P. Hibbins, J. R. Sambles and C. R. Lawrence.
Journal of Modern Optics, 1998, Vol. 45, No. 10, 2051-2062.
Grating-coupled surface plasmons at microwave frequencies.
A. P.Hibbins, J. R. Sambles and C. R. Lawrence.
Journal of Applied Physics, 1999, Vol. 86, No. 4, 1791.
The influence of grating profile on SPP resonances recorded in different diffracted
orders
R. A. Watts, A. P. Hibbins and J. R. Sambles.
Journal of Modern Optics, 1999, Vol. 46, No. 15, 2157-2186.
Figure 10.3.1 Examples of (a) an interface profile with a defect, and (b) an interface
profile with a finite number of grooves.
(a)
(b)

CHAPTER 10 Conclusions
195
The coupling of microwave radiation to surface plasmon polaritons and guided modes
via dielectric gratings.
A. P. Hibbins, J. R. Sambles and C. R. Lawrence
Accepted for publication in Journal of Applied Physics, 14th
December 1999.
Scheduled for publication in the 15th
March 2000 issue (JR99-2335)
The coupling of near-grazing microwave photons to surface plasmon polaritons via a
dielectric grating.
A. P. Hibbins, J. R. Sambles and C. R. Lawrence
Recommended for publication in Physical Review E, 14th
January 2000 (EL7142).
The plasmon study of the optical dielectric function of indium.
J. R. Sambles, A. P. Hibbins, M. J. Jory and H. Azizbekyan
Accepted for publication in Journal of Modern Optics 8th
December 1999 (9.11/25)

REFERENCES
196
REFERENCES
Ageev, L. A. and Shklyarevskii, I. N. 1968 Sov. Phys. Sol. St. 9, 2324.
Barlow H. M. and Cullen, A. L. 1953 Proc. IEE 100, 329.
Barnes, W. L., Preist, T. W., Kitson, S. C.
and Sambles, J. R.
1996 Phys. Rev. B 54, 6227
Beaglehole, D. 1969 Phys. Rev. Lett. 22, 708.
Bernhard, C. G. 1967 Endeavour 26, 79.
Boardman, A. D. 1978 Electromagnetic Surface Modes
(Wiley).
Böhm, G., and Goretzki, H. 1972 J. Less-Common Metals, 27, 311.
Bryan-Brown, G. P. and Sambles, J. R. 1990 J. Mod, Opt., 37, 1227.
Bryan Brown, G. P., Elston, S. J. and
Sambles J. R
1991 J. Mod. Opt., 38, 1181.
Bryan-Brown G. P., Jory M. C., Elston S.
J., Sambles, J.R.
1993 J. Mod. Opt. 40, 959
Burstein, E., Harstein, A., Schoenwald,
J., Maradudin, A. A., Mills, D. L. and
Wallis, R. F.
1972 Proceedings of the First
Taormina Research Conference
on the Structure of Matter p89.
Burtin, R. 1964 Rev. Opt. 43, 463 and 618.
Chandezon, J., Dupuis, M. T., Cornet, G.,
and Maystre, D.
1982 J. Opt. Soc. Am., 72, 839.
Celli, V., Tran, P., Maradudin, A. A. and
Mills, D. L.
1988 Phys. Rev. B 37, 9089.
Chen, Y. J., Koteles, E. S. and Seymour,
R. J.
1983 Solid State Comm. 46, 95.
Cotter, N. P. K., Preist, T. W. and
Sambles, J. R.
1995 J. Opt. Soc. Am., 12, 1097.
Elston, S. J., Bryan-Brown G. P., Preist,
T. W. and Sambles, J. R.
1991a Phys. Rev. B 44, 3483.
Elston, S. J., Bryan-Brown G. P. and
Sambles, J. R.
1991b Phys. Rev. B 44, 6393.
Fano, U. 1941 J. Opt. Soc. Am. 31, 213.
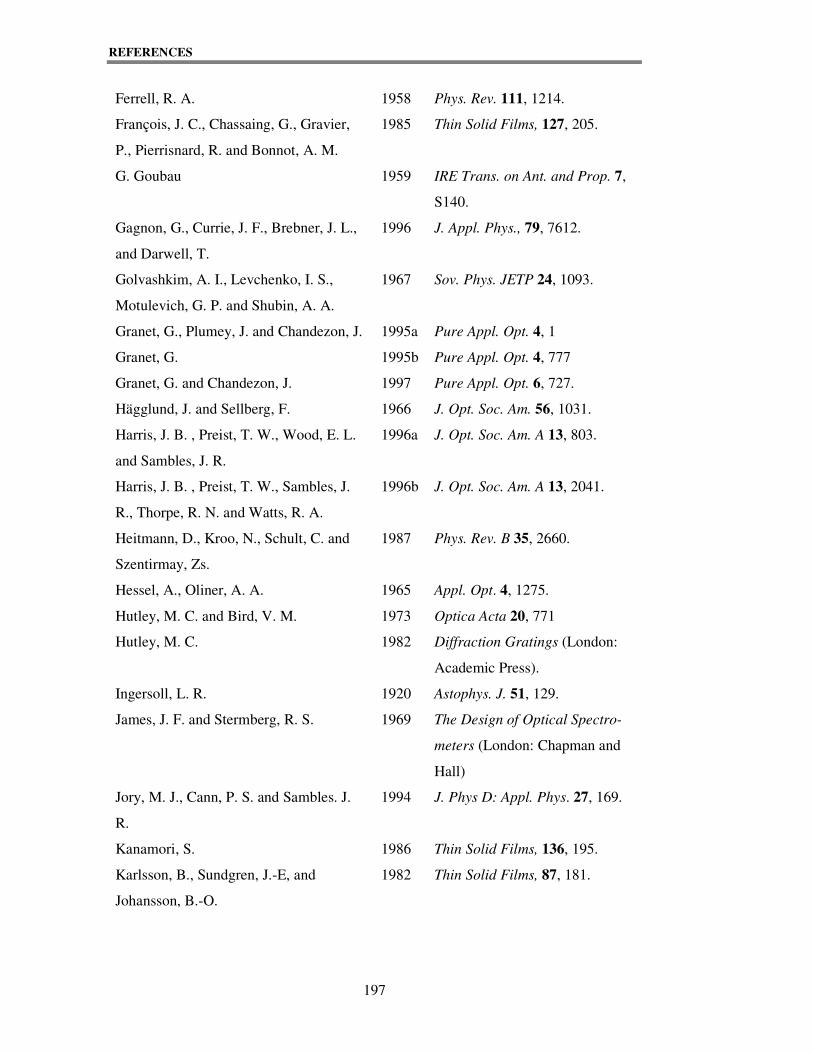
REFERENCES
197
Ferrell, R. A. 1958 Phys. Rev. 111, 1214.
François, J. C., Chassaing, G., Gravier,
P., Pierrisnard, R. and Bonnot, A. M.
1985 Thin Solid Films, 127, 205.
G. Goubau 1959 IRE Trans. on Ant. and Prop. 7,
S140.
Gagnon, G., Currie, J. F., Brebner, J. L.,
and Darwell, T.
1996 J. Appl. Phys., 79, 7612.
Golvashkim, A. I., Levchenko, I. S.,
Motulevich, G. P. and Shubin, A. A.
1967 Sov. Phys. JETP 24, 1093.
Granet, G., Plumey, J. and Chandezon, J. 1995a Pure Appl. Opt. 4, 1
Granet, G. 1995b Pure Appl. Opt. 4, 777
Granet, G. and Chandezon, J. 1997 Pure Appl. Opt. 6, 727.
Hägglund, J. and Sellberg, F. 1966 J. Opt. Soc. Am. 56, 1031.
Harris, J. B. , Preist, T. W., Wood, E. L.
and Sambles, J. R.
1996a J. Opt. Soc. Am. A 13, 803.
Harris, J. B. , Preist, T. W., Sambles, J.
R., Thorpe, R. N. and Watts, R. A.
1996b J. Opt. Soc. Am. A 13, 2041.
Heitmann, D., Kroo, N., Schult, C. and
Szentirmay, Zs.
1987 Phys. Rev. B 35, 2660.
Hessel, A., Oliner, A. A. 1965 Appl. Opt. 4, 1275.
Hutley, M. C. and Bird, V. M. 1973 Optica Acta 20, 771
Hutley, M. C. 1982 Diffraction Gratings (London:
Academic Press).
Ingersoll, L. R. 1920 Astophys. J. 51, 129.
James, J. F. and Stermberg, R. S. 1969 The Design of Optical Spectro-
meters (London: Chapman and
Hall)
Jory, M. J., Cann, P. S. and Sambles. J.
R.
1994 J. Phys D: Appl. Phys. 27, 169.
Kanamori, S. 1986 Thin Solid Films, 136, 195.
Karlsson, B., Sundgren, J.-E, and
Johansson, B.-O.
1982 Thin Solid Films, 87, 181.

REFERENCES
198
Karlsson, B., Shimshock, R. P., Seraphin,
B. O., and Haygarth, J. C.
1983 Sol. Energy Mater., 7, 401.
Khan, S. A., Dong, N. Q. and Burge, R.
E.
1993 Opt. Eng. (Bellingham) 32, 3249.
Kitson, S. C., Barnes, W. L. and Sambles,
J. R.
1988 J. Appl. Phys. 14, 2399.
Kitson, S. C., Barnes, W. L. and Sambles,
J. R.
1995 Phys. Rev. B 52, 11441.
Kitson, S. C., Barnes, W. L., Sambles, J.
R. and Cotter, N. P. K.
1996 J. Mod. Opt., 43, 573.
Kovacs, G. J. 1979 Thin Solid Films, 60, 33.
Kretschmann E. and Raether H. 1968 Z. Natur. 23a, 2135.
Kurtz, S. R., and Gordon, R. G 1986 Thin Solid Films, 140, 277.
Li, Lifeng 1994 J. Opt. Soc. Am. A 11, 2829.
Maystre, D. 1973 Opt. Commun. 8, 216.
Maystre, D. 1978 J. Opt. Soc. Am. 68, 490
McPhedran, R. C. and Waterworth, M. D. 1972 Optica Acta 19, 877.
McPhedran, R. C. and Maystre, D. 1974 Optica Acta 21, 413
Meecham, W. C. 1956 J. Appl. Phys. 27, 361.
Meecham, W. C. and Peters, C. W. 1957 J. Appl. Phys. 28, 216.
Monaghan, D. P., Teer, D. G., Laing, K.
C., Efeoglu, I., and Arnell, R. D.
1993 Surf. And Coatings Technol., 59,
21.
Müller, K. G., Veith, M., Mittler-Neher,
S. and Knoll, W.
1997 J. Appl. Phys. 82, 4172.
Munz, W. D., Hofmann, D. and Hartig,
K.
1986 Thin Sold Films 96, 79.
Nash, D. J. and Sambles, J. R. 1995 J. Mod. Opt. 42, 1639.
Nash, D. J. and Sambles, J. R. 1996 J. Mod. Opt. 43, 81.
Nash, D. J. and Sambles, J. R. 1998 J. Mod. Opt., 45, 2585.
Nylander, C., Liedberg, B. and Lind, T. 1982 Sensors and Actuators 3, 79.
Oker, M. M. El, Abou-Saif, E. A.,
Sahhar, S. A. El and Mohamed, A. A.
1982 Phys St. Sol.a. 73, 389.
Otto, A. 1968 Z. Phys. 216, 398.

REFERENCES
199
Özbay, E., Temelkuran, B., Sigalas, M.,
Tuttle, G., Soukoulis, C. M. and Ho, K.
M.
1996 Appl. Phys. Lett. 69, 3797.
Palmer, C. H. 1952 J. Opt. Soc. Am. 42, 269.
Palmer, C. H., Evering, F. C. and Nelson,
F. M.
1965 Appl. Opt. 4, 1271.
Pascual, E., Polo, M. C., Esteve, J., and
Bertran, E.
1991 Surface Science 251-252, 200.
Petit, R. and Cadilhac, M. 1966 C. R. Acad. Sci. Paris 257, 2018.
Pines, D. and Bohm, D. 1952 Phys. Rev. 85, 338.
Pipino, A. C. and Schatz, G. C. 1994 J. Opt. Soc. Am. B. 11, 2036.
Pockrand, I. 1974 Phys. Lett. 49A, 259.
Pockrand, I. 1976 J. Phys. D 9, 2423.
Powell, C. J., Robin, J. L. and Swan, J. B. 1958 Phys. Rev. 110, 657.
Powell, C. J. 1960 Proc. Phys. Soc. (London) 76,
593.
Preist, T. W., Cotter, N. P. K. and
Sambles, J. R.
1995 J. Opt. Soc. Am. A 12, 1740.
Preist, T. W., Harris, J. B., Wanstall, N.P.
and Sambles, J. R.
1997 J. Mod. Opt. 44 (6), 1073.
Raether, H.
1988 Surface Plasmons on Smooth and
Rough Surfaces and on Gratings,
(Berlin: Springer).
Raguin, D. H., Norton, S. and Morris, G.
M.
1993 Critical Reviews of Optical
Science and Technology:
Diffractive and Miniaturized
Optics CR49, 234
Rayleigh, Lord 1907 Phil. Mag. 14, 213.
Ritchie, R. H. 1957 Phys. Rev. 106, 874.
Ritchie, R. H., Arakawa, E. T., Cowan, J.
J. and Hamm, R. N.
1968 Phys. Rev. Lett. 21, 1530.
Rivory, J., Behaghel, J. M., Berthier, S.,
and Lafait, J.
1981 Thin Solid Films 78, 161.

REFERENCES
200
Rosengart, E. H., and Pockrand, I. 1977 Optics Letters 1, 194.
Rothenhäusler, B. and Knoll, W. 1987 Opt. Commun. 63, 301.
Salakhutdinov, I. F., Sychugov, V. A. and
Parriaux, O.
1998 Quantum Electronics 28, 983.
Salt, M. G. and Barnes, W. L. 1999 Opt. Comms. 166, 151.
Schlegel, A., Wachter, P., Nickl, J. J., and
Lingg, H.
1977 J. Phys. C 10, 4889.
Schröder, U. 1981 Surface Science 102, 118.
Seshadri, S. R. 1999 J. Opt. Soc. Am. A 16, 922.
Sommerfeld, A. 1909 Ann. Physik 28, 665.
Steinmann, W. 1960 Phys. Rev. Lett. 5, 470.
Steinmüller-Nethl, D., Kovacs, R.,
Gornik, E., and Rödhammer, P.
1994 Thin Solid Films 237, 277.
Strong, J. 1935 Phys. Rev. 48, 480.
Swalen, J. D., Gordon, II, J. G., Philpott,
M. R., Brillante, A., Pockrand, I. and
Santo, R.
1980 Am. J. Phys. 48, 669.
Szczyrbowski, Von J., Rögels, S.,
Kastner, A., Dietrich, A., and Hartig, K.
1988 Vakuum-Technik 37, 14.
Tan, W. –C., Preist, T. W., Sambles, J. R.
and Wanstall, N. P.
1999 Phys. Rev. B 59, 12661.
Teng, Y.-Y., and Stern, E. A. 1967 Phys. Rev. Lett. 19, 511.
Théye, M. L. and Devant, G. 1969 Thin Solid Films 4, 205.
Tillin, M. D. and Sambles, J. R. 1988 Thin Solid Films 167, 73.
Tillin, M. D. and Sambles, J. R. 1989 Thin Solid Films 172, 27.
Tremblay, R. and Boivin, A. 1966 Appl. Opt. 5, 249.
Vukusic, P., Sambles, J. R., Lawrence, C.
R. and Wootton, R. J.
1999 Proc. R. Soc. Lond. B 266, 1403.
Valkonen, E., Ribbing, C.-G., and
Sundgren, J.-E.
1986 Proc. SPIE 652, 235.
Vinoy, K. J. and Jha, R. M. 1994 Sadhana 20, 815.

REFERENCES
201
Wanstall, N. P. 1999 Ph. D. Thesis “Modelling the
electromagnetic response of deep,
blazed and overhanging
gratings”, Chapter 2.
Watts. R. A., Harris, J. B., Hibbins, A. P.,
Preist, T. W. and Sambles, J. R.
1996 J. Mod. Opt. 43, 1351.
Watts, R. A., Sambles, J. R., and Harris,
J. B.
1997a Optics Commun. 135, 189
Watts, R. A. and Sambles, J. R. 1997b Opt. Commun. 140, 179.
Watts, R. A., Preist, T. W. and Sambles,
J. R.
1997c Phys. Rev. Lett. 79, 3978.
Weber, M. G., and Mills, D. L. 1986 Phys. Rev. B 34, 2893.
Wood, E. L., Sambles, J. R., Cotter, N.
P., and Kitson S. C.
1995 J. Mod. Opt. 42, 1343.
Wood, R. W. 1902 Phil. Mag. 4, 396.
Wood, R. W. 1912 Phil. Mag. 23, 310.
Wood, R. W. 1935 Phys. Rev. 48, 928.
Wooten, F. 1972 Optical Properties of Solids
(New York: Academic Press),
chapter 6.
Yariv, A. 1991 Quantum Electronics, 4th
edition
(New York: Saunders).
Zenneck, J. 1909 Ann. Phys. 28, 665.
Zhizhin, G. N., Moskalova, M. A.,
Shomina, E. V. and Yakovlev, V. A.
1982 Surface Polaritons: Electro-
magnetic Waves at Surfaces and
Interfaces (North-Holland,
Amsterdam)