graphs of “capability traps” for bertelsmann transformation index for each country of bottom 40...
TRANSCRIPT
Graphs of “Capability Traps”for Bertelsmann Transformation Index for each country of bottom
40 plus countries
Lant Pritchett
November 2010
Description of data
• Each country has four indicators: • KKM (World Governance Indicators)
“Government Effectiveness”• Failed States Index component
“progressive deterioration of services”• Bertelsmann Transformation Index (BTI)
indicator of “Resource Efficiency”• Indicator of “Quality of Government” based
on ICRG indicators
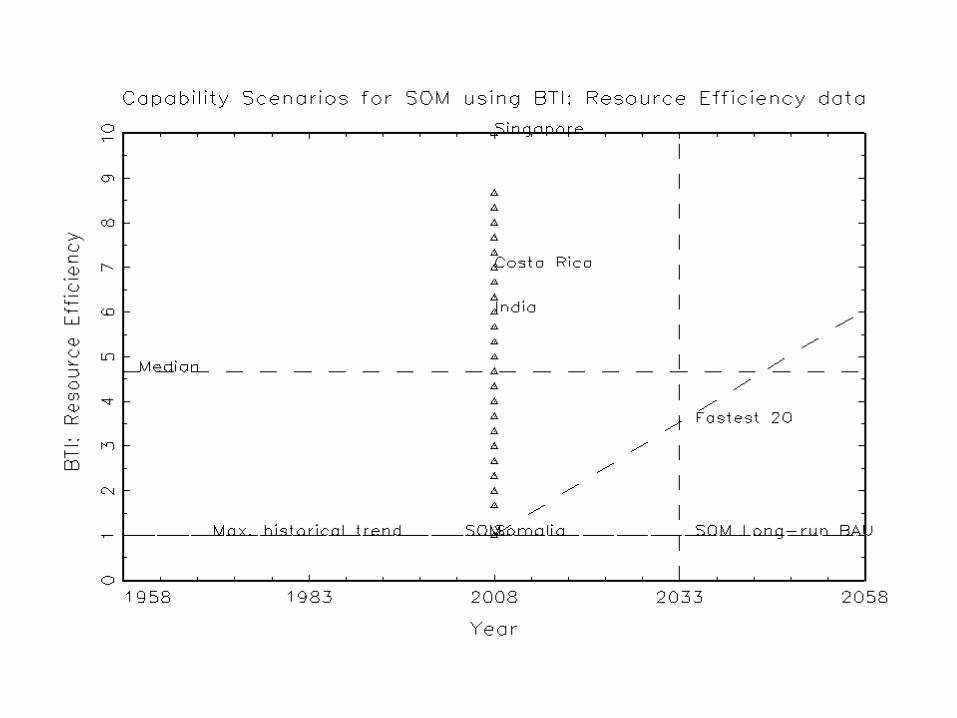
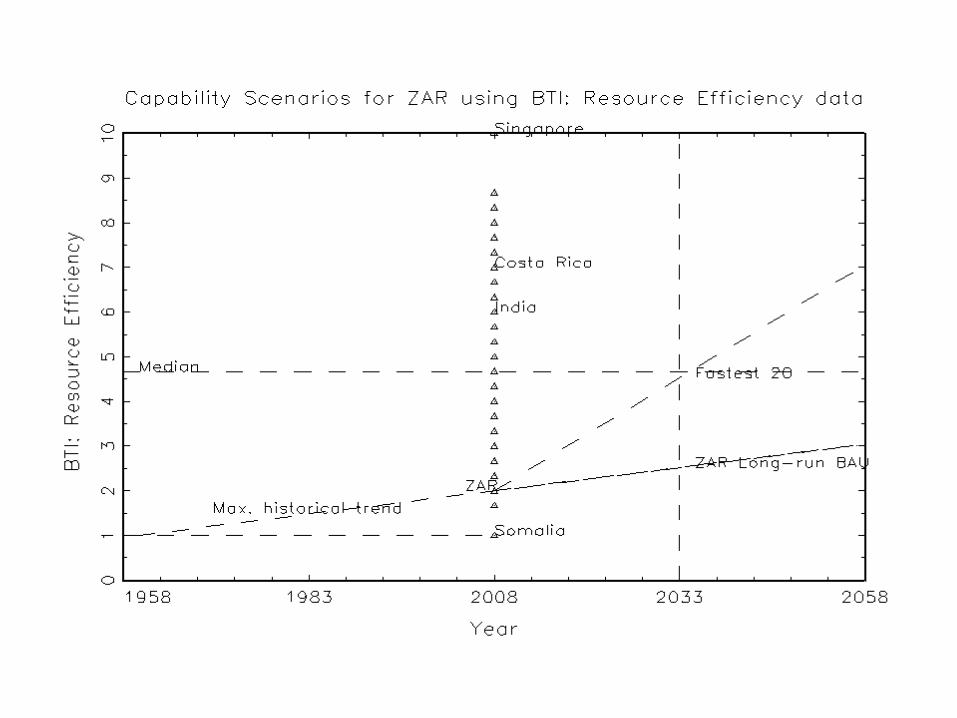
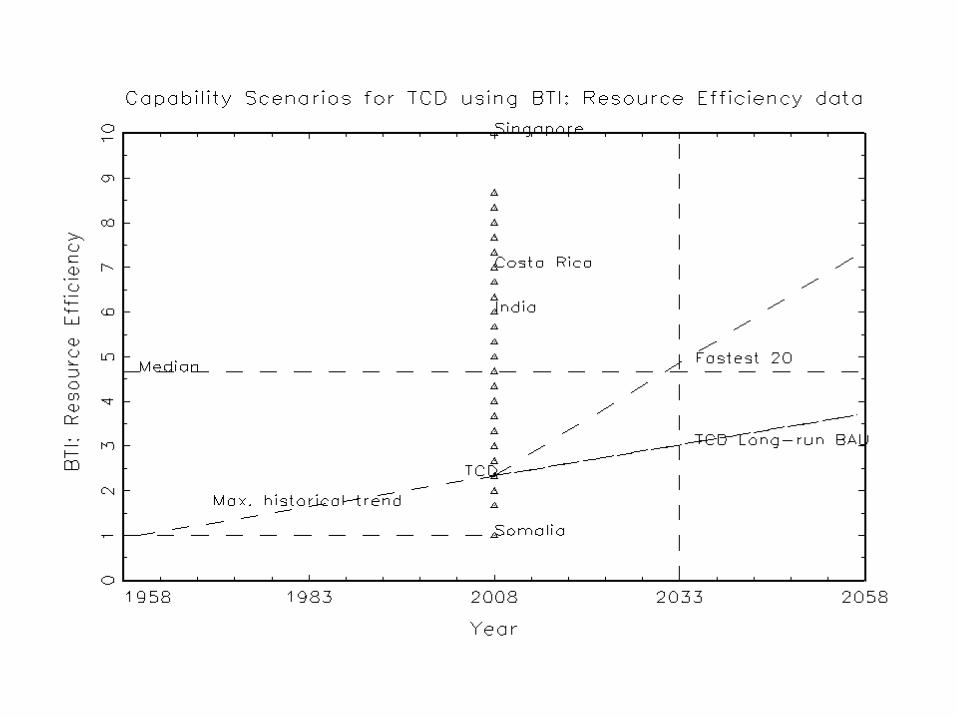
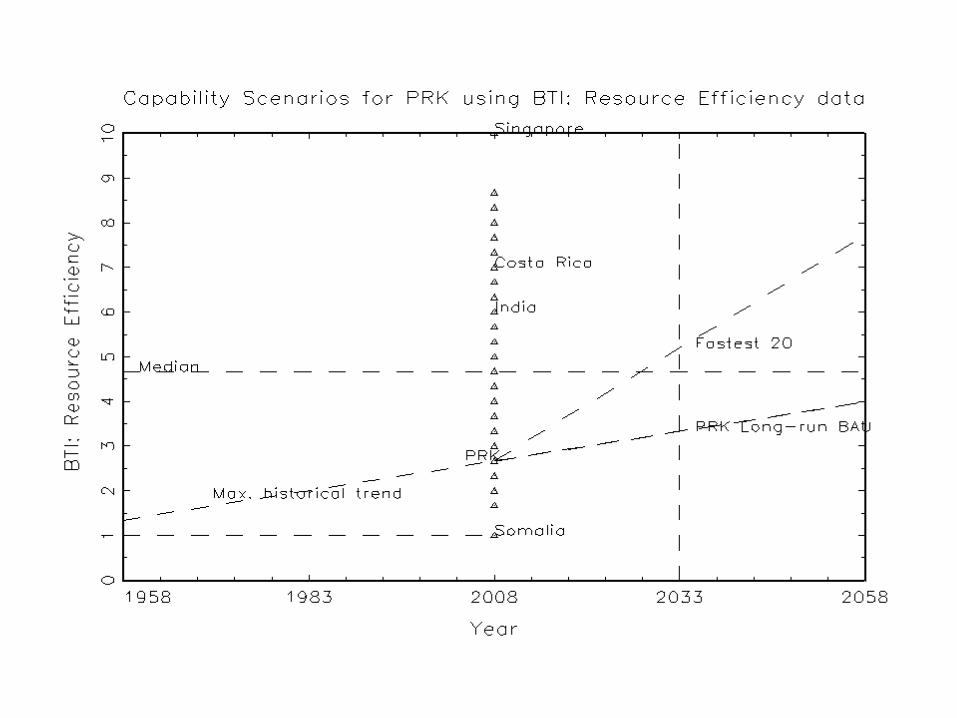
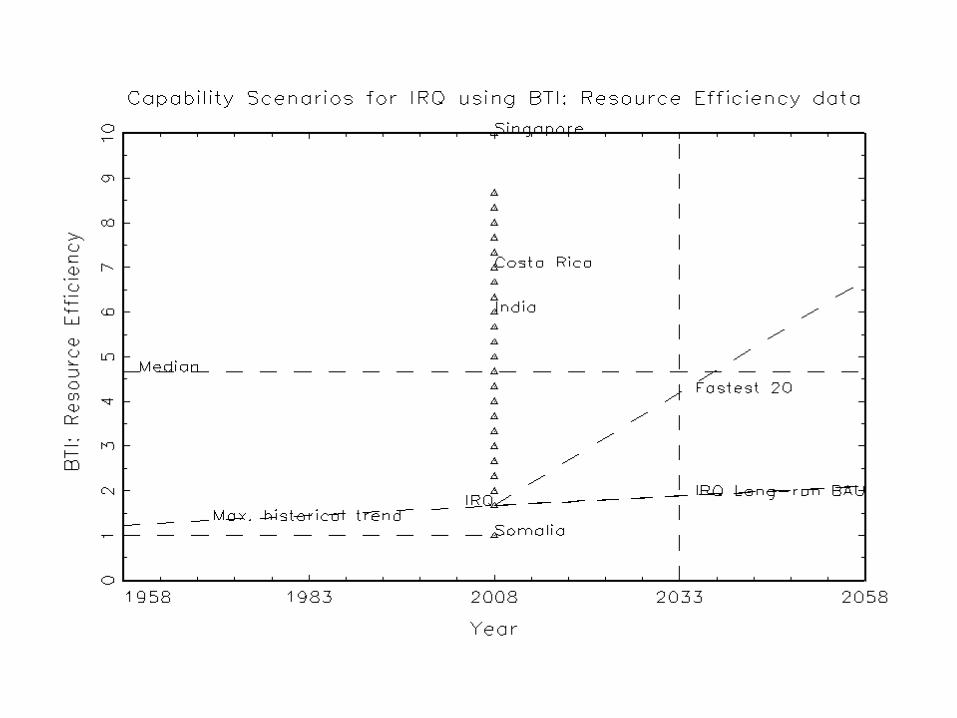
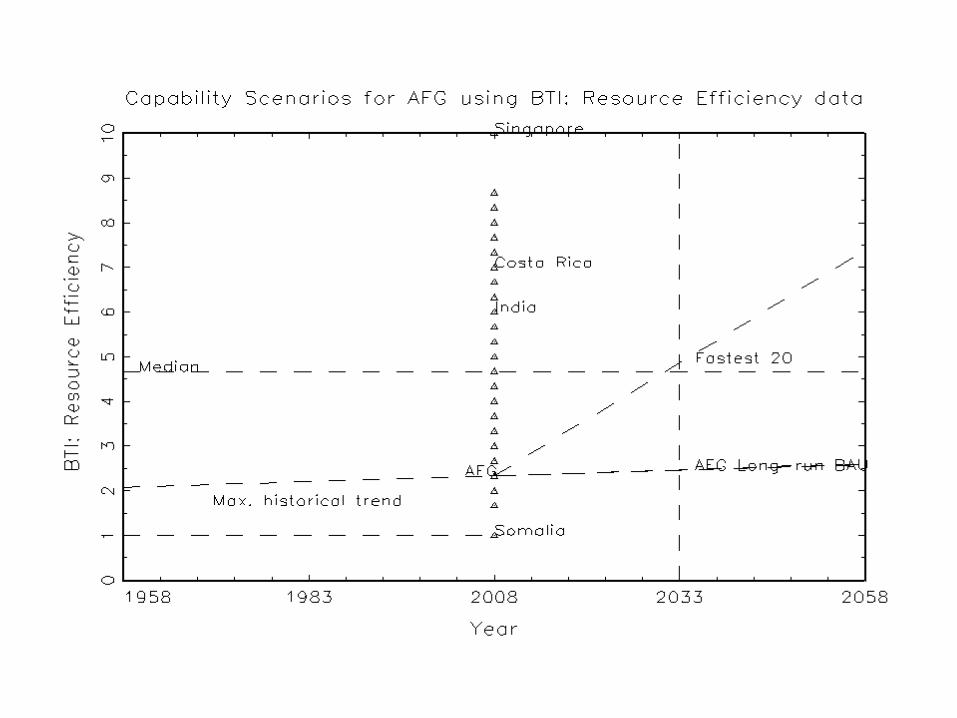
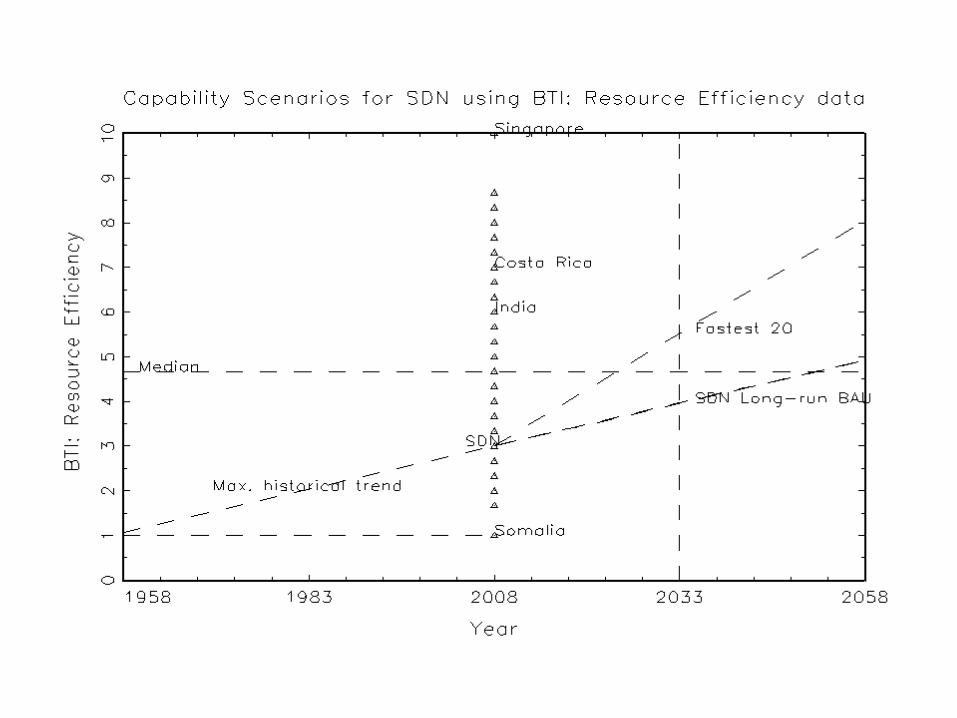
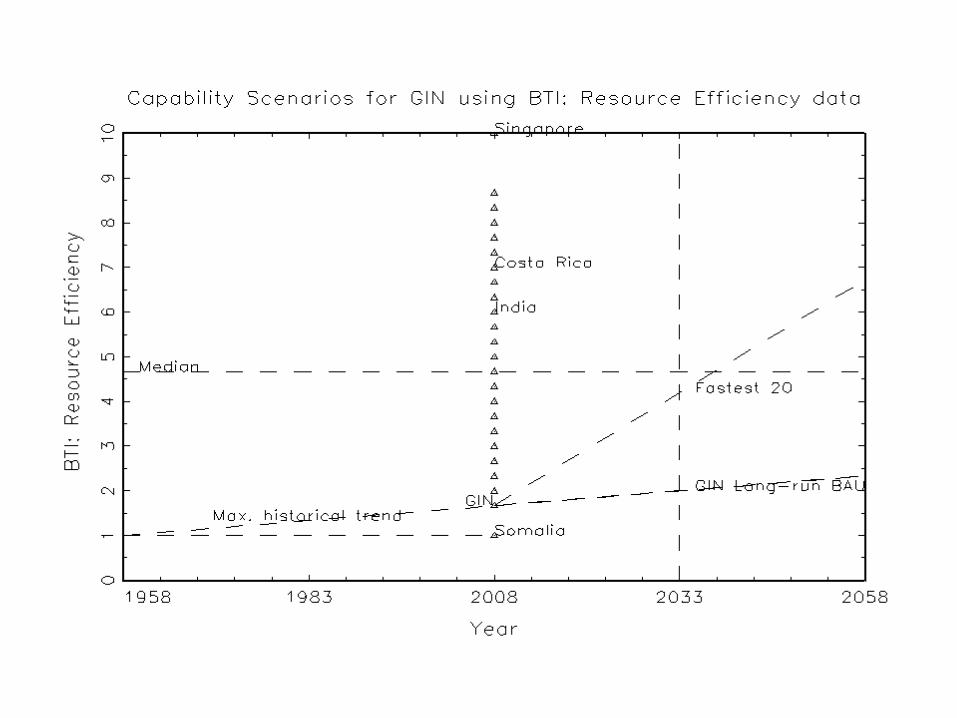
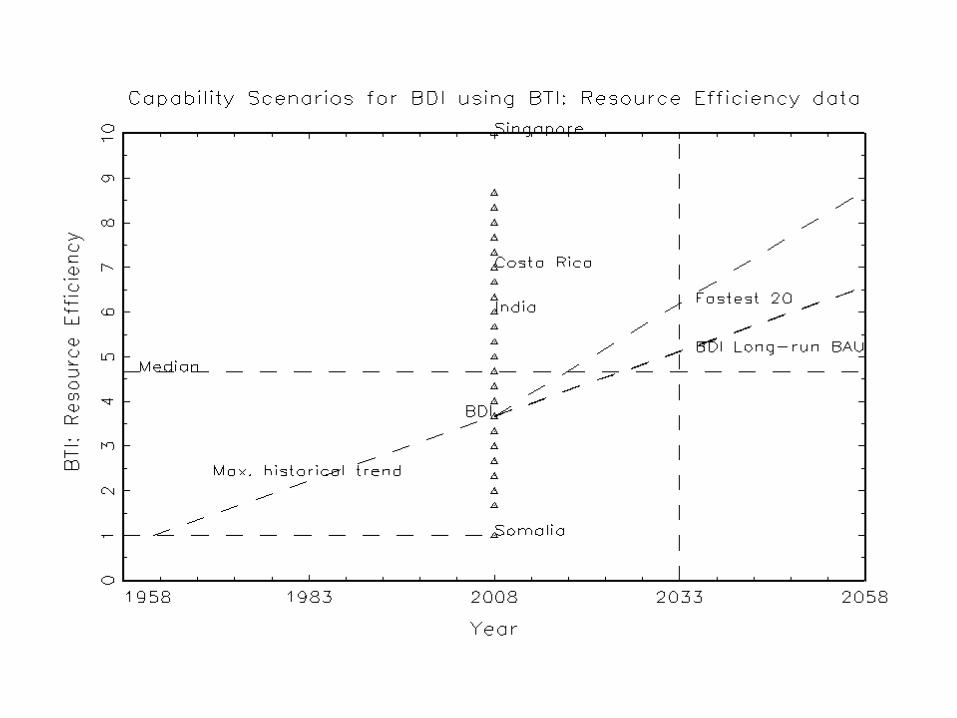
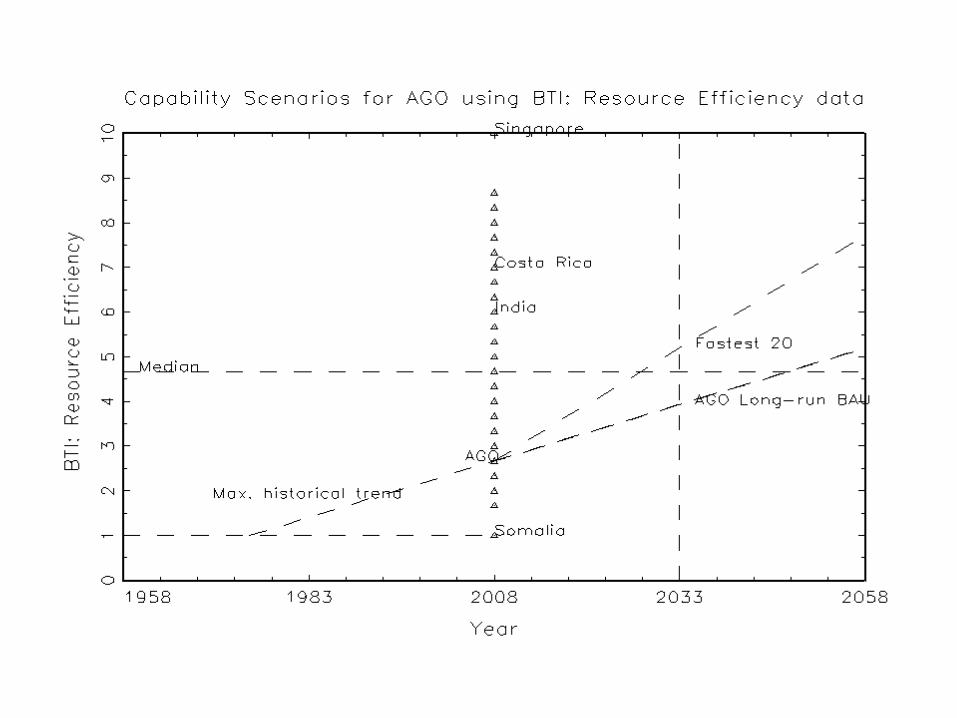
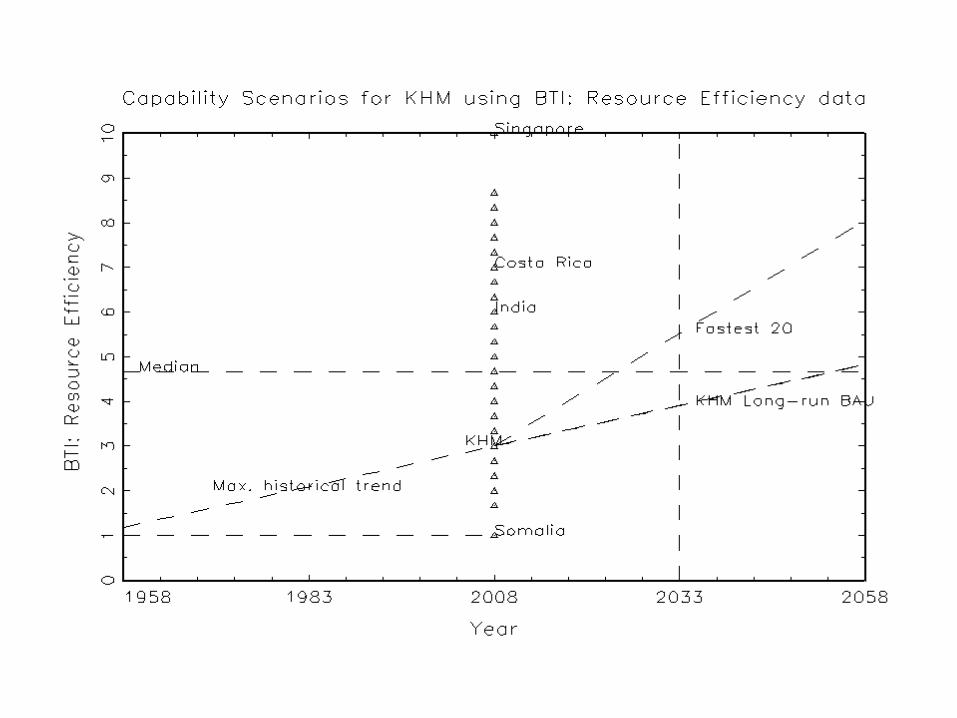
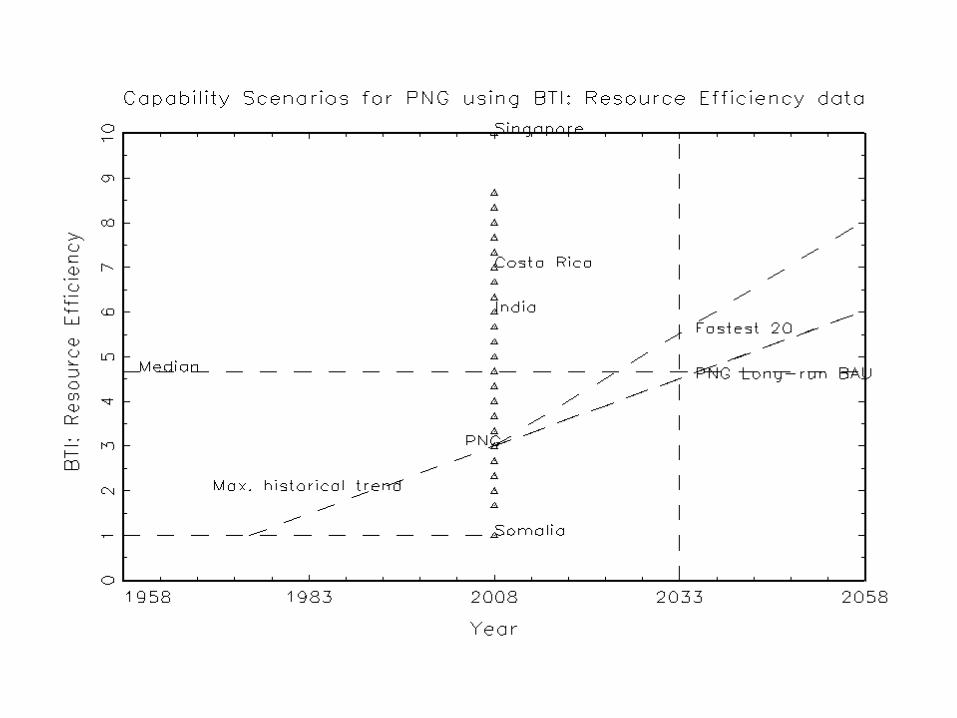
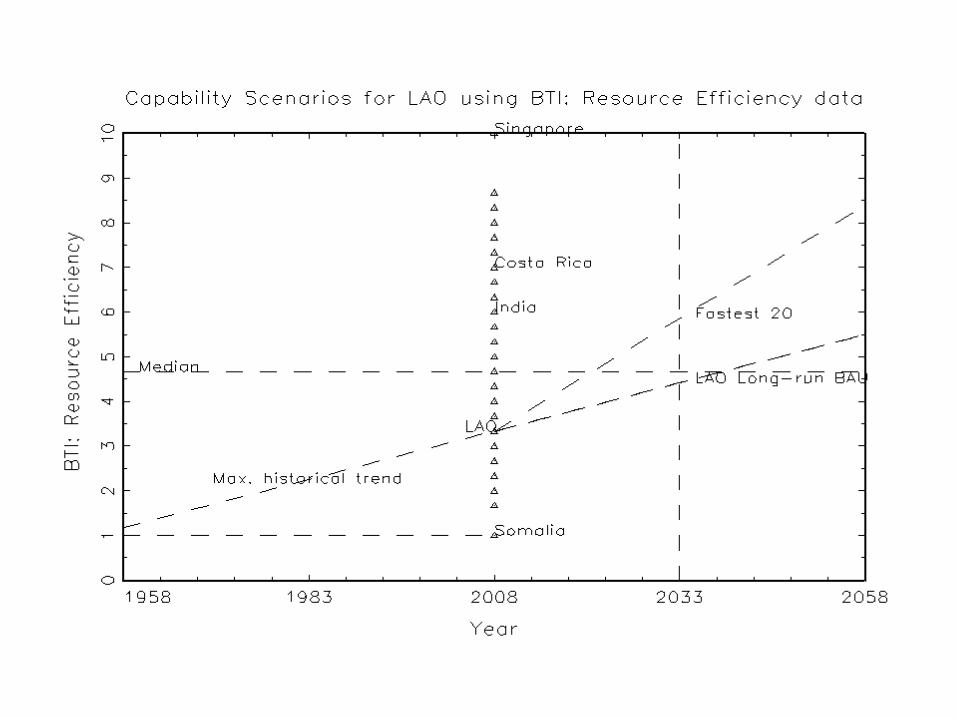
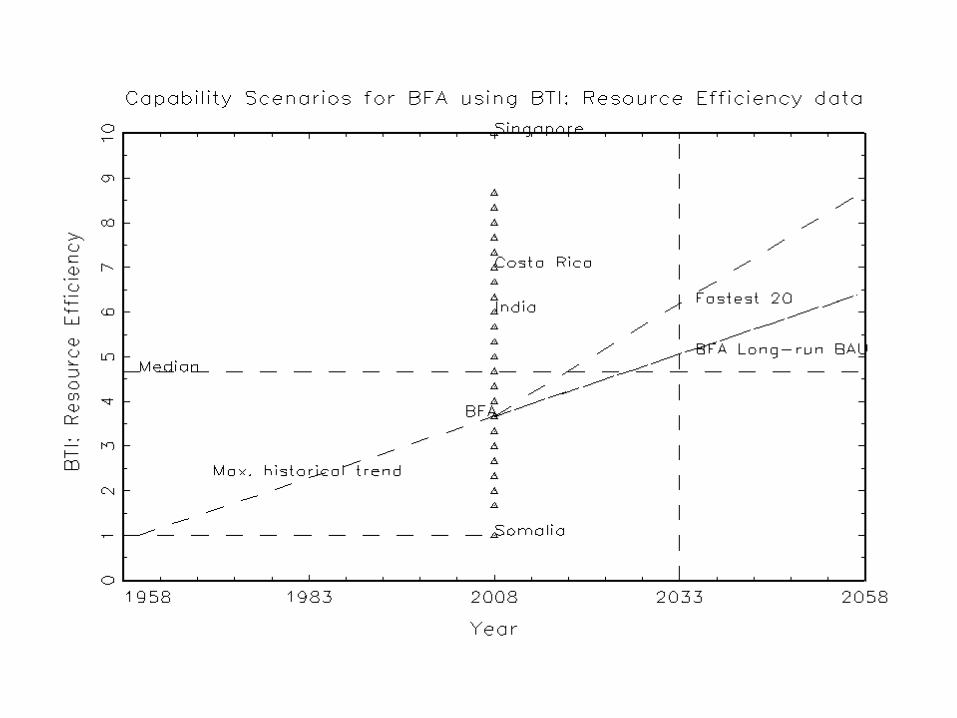
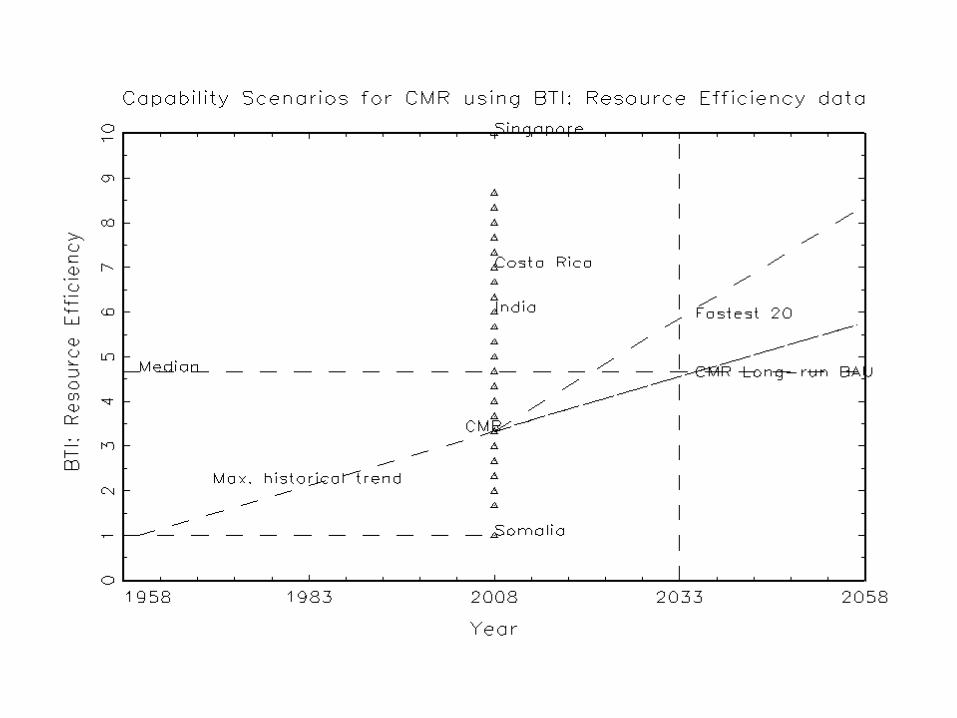
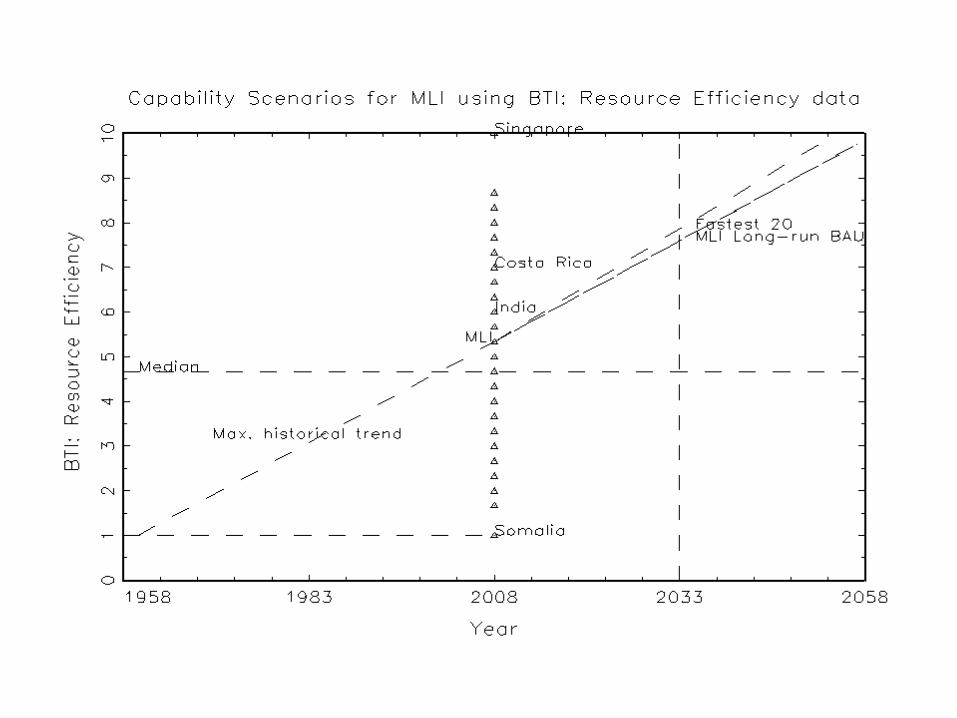
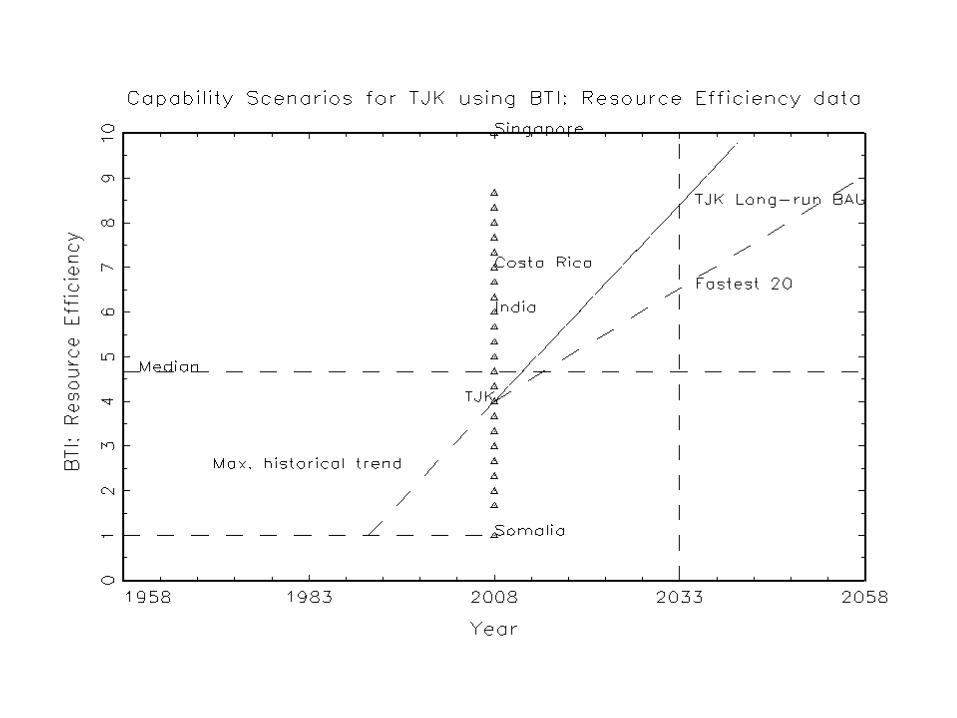
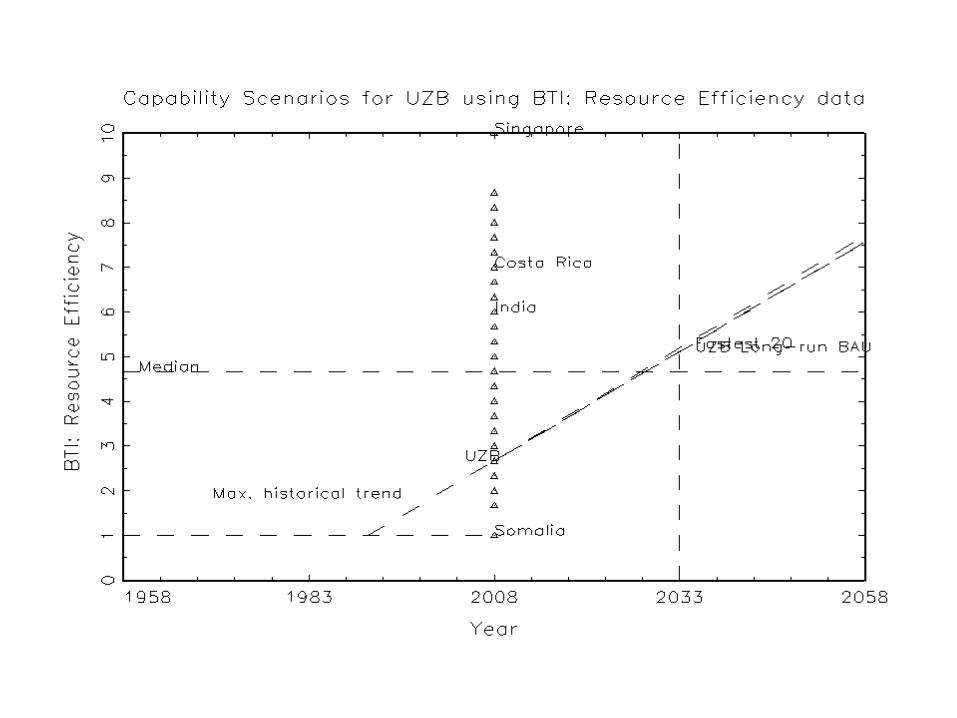
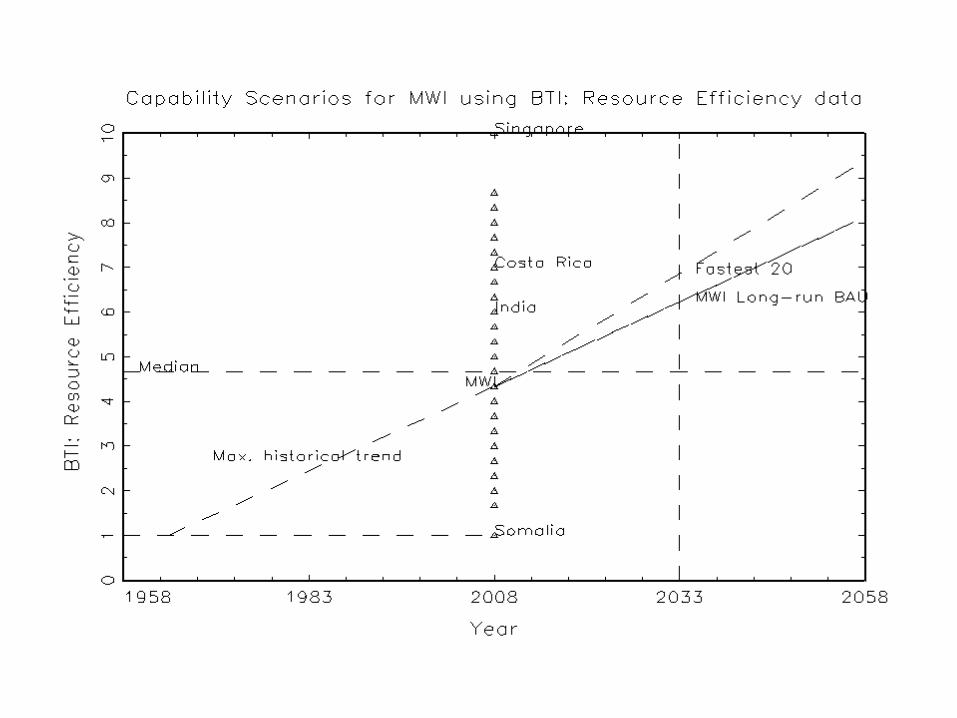
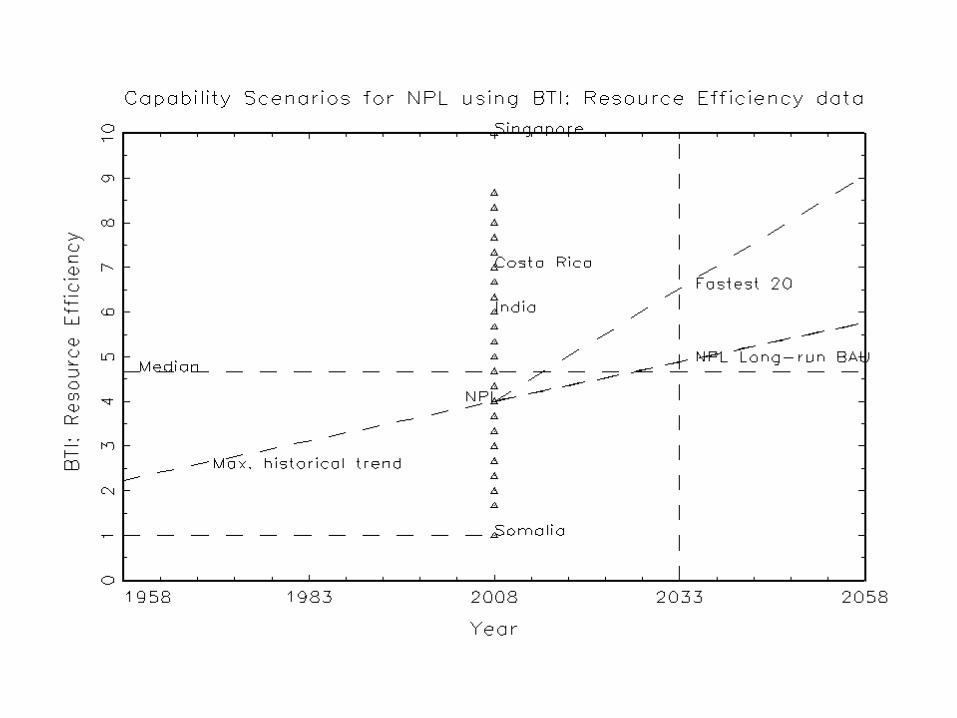
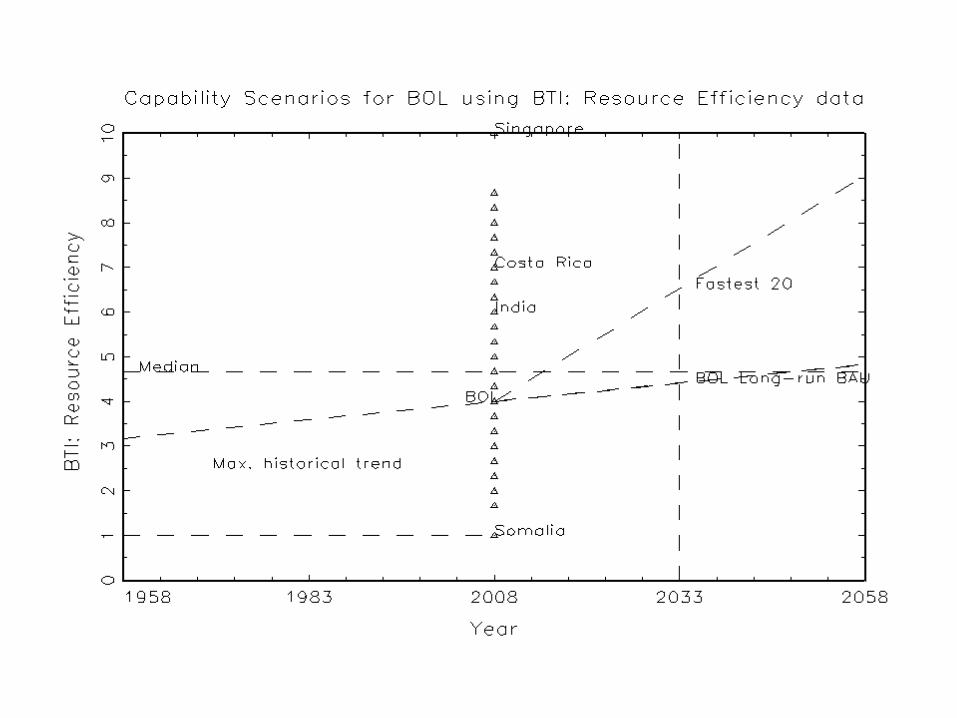
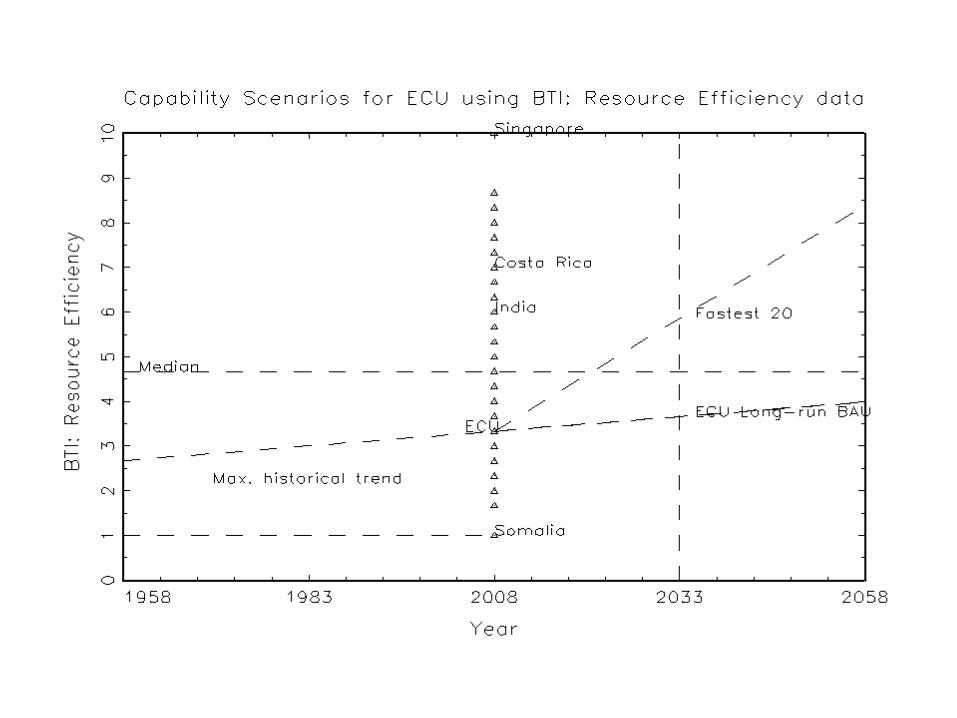
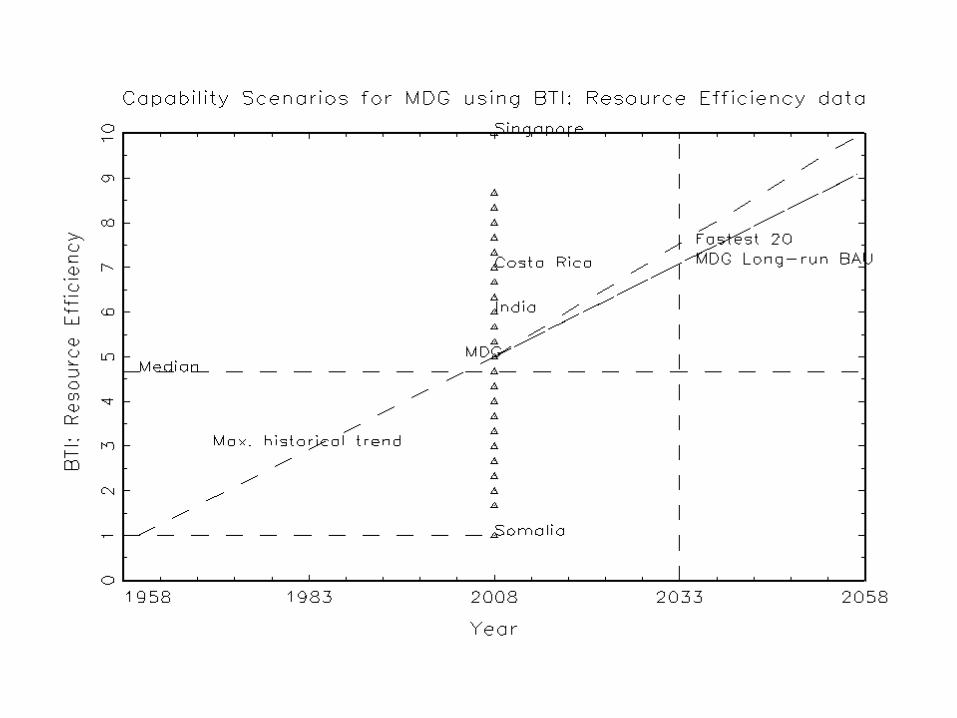
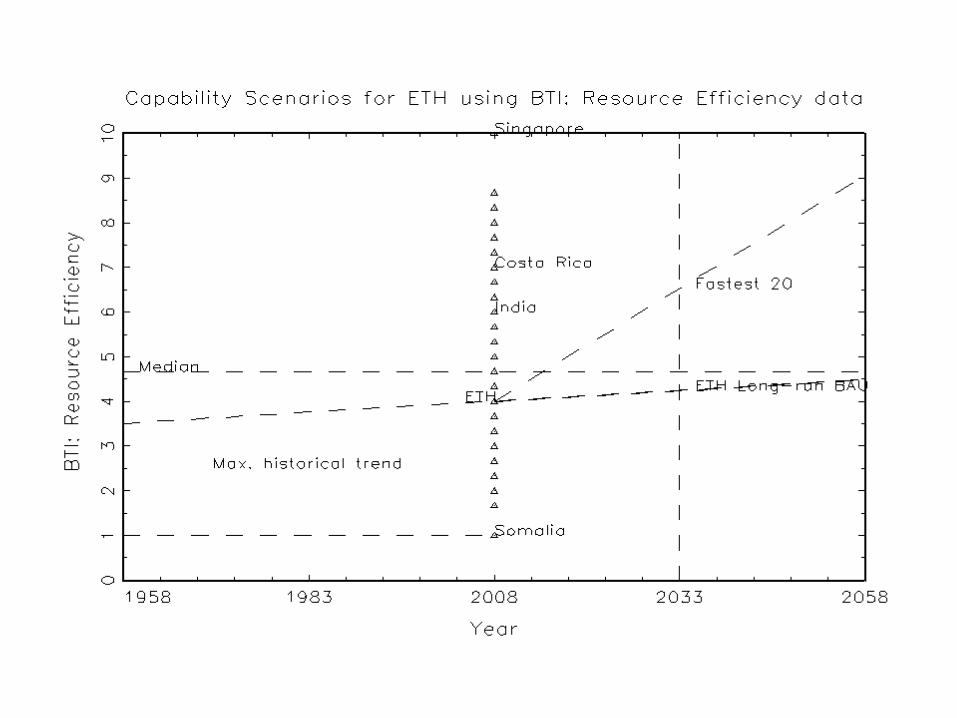
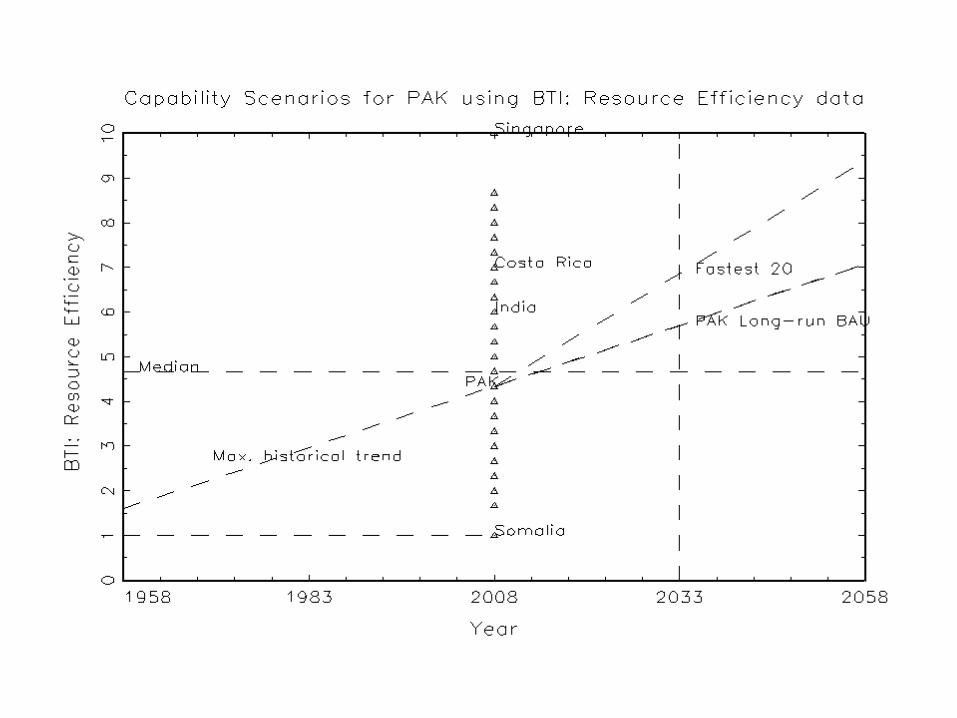
Description of Graphs• The data are for the most recent year of the indicator from
the previous sources (each green dot is a country observation, the chosen country is labeled at its observation and four countries are highlighted: Somalia, Singapore, India and Costa Rica.
• There are horizontal lines at each indicator going backward for Somalia (the minimum) and forward from Singapore (the maximum) and across the graph at the overall cross-national median and a vertical line at 2033 (25 years from the data).
• The “maximum historical trend” is the linear extrapolation back from the current level to Somalia’s level of the indicator (the minimum possible) at the country’s date of independence.
• In addition there are various scenarios illustrated, depending on the available data.
Scenarios
• For all four variables (including FSI and BTI which have no time series) there are two scenarios:– Optimistic “BAU” which is extrapolation of the
“maximum historical trend”– “Fastest 20”—the average of the fastest 20 of the
“maximum historical trend” for each indicator• The KKM and ICRG based indicators have some
time series for each country. For those countries there are two additional scenarios:– “Actual” BAU based on available data– “Actual” Fastest 20 based on the fastest 20 observed