graphing calculator keystroke guide -...
TRANSCRIPT
GRAPHING CALCULATOR KEYSTROKE GUIDE
to accompany
ELEMENTARY ALGEBRA: DISCOVERY ANDVISUALIZATION
2nd Edition
Karl M. ZilmLewis & Clark Community College
HOUGHTON MIFFLIN COMPANY BOSTON NEW YORK

Editor in Chief: Charles HartfordAssociate Editor: Mary BeckwithSenior Manufacturing Coordinator: Sally CullerMarketing Manager: Ros Kane
Copyright © 1999 by Houghton Mifflin Company. All rights reserved.
No part of this work may be reproduced or transmitted in any form or by any means, electronic ormechanical, including photocopying and recording, or by any information storage or retrieval systemwithout prior written permission of Houghton Mifflin Company unless such copying is expresslypermitted by federal copyright law. Address inquiries to College Permissions, Houghton MifflinCompany, 222 Berkeley Street, Boston, MA 02116-3764.
Printed in the U.S.A.
ISBN: 0-395-937736
123456789-HS-03 02 01 00 99

iii
Preface
This Guide is designed for students using a Texas Instruments TI-82 or TI-83 graphing calculator inconjunction with the textbook Elementary Algebra: Discovery and Visualization, 2nd edition, byHubbard and Robinson. There is a separate section of the Guide for each calculator model. The TI-82section begins on page 1; the TI-83 section begins on page 27. The following description of the Guideand how to use it applies to both sections.
The Guide assumes no prior experience in using a graphing calculator. Therefore, it begins withan Introduction chapter dealing with the basics: how to turn the calculator on, how to turn it off, howto adjust the screen contrast, and how to enter and edit basic arithmetic expressions. You shouldprobably go through the Introduction chapter of this Guide as soon as you get your calculator. TheIntroduction chapter will give you an opportunity to familiarize yourself with the basic operation ofyour calculator so that you will be ready to learn the other features described later in the Guide.
The Introduction chapter is followed by the Graphing Calculator Keystroke Guide, which iskeyed to the textbook. As you look at the pages in the textbook, you will notice that in the left marginof some pages a book icon & appears next to a key word or phrase, with a brief reference to a relatedfeature on the graphing calculator appearing in the body of the text. Corresponding to each of thesekey words or phrases in the textbook, this Guide provides a detailed description of how to use therelated feature on your particular graphing calculator model. In the Guide each key word or phrase isprinted as it appears in the textbook, and on the line above it is the number of the page on which itappears in the textbook. Each key word or phrase will also have its own number (in boldface type)for easy future reference. For example, on page 14 in the textbook you will find a book icon in the leftmargin with the key words “Absolute Value” next to it and a brief reference in the body of the text tothe calculator notation ABS. If you are using a TI-82 graphing calculator, look on page 9 in thisGuide. If you are using a TI-83, look on page 35 in this Guide. You will see a reference to theabsolute value feature:
page 14 10 Absolute Value,
followed by a description of how to enter expressions involving absolute values on your calculator.The boldface number 10 is a reference number which may be used later in the Guide to refer youquickly to this description of the absolute value feature.
As you begin to use the Guide to read about the key words and phrases, you may want to keep abookmark in the Guide at the most recently examined key word or phrase. If you go through thechapters of the textbook in the order they are printed, you will encounter the new key words andphrases in the order they are printed in this Guide. Thus, your bookmark will usually be at or near thenext key word or phrase you will want to read about, and you will be able to refer to it quickly whenneeded.
I would like to thank the authors of the textbook, Elaine Hubbard and Ronald D. Robinson, andthe staff of Houghton Mifflin, particularly Charles Hartford, Editor in Chief; and Kathy Yoon,Editorial Assistant, for their support and assistance in the production of this Guide.
Karl M. Zilm

iv
Contents
TI-82
INTRODUCTION: On/Off, Contrast, Mode, and Editing Expressions 1Turning the Calculator On 1Adjusting the Display Contrast (Making the Screen Lighter or Darker) 1Turning the Calculator Off 2Second Functions for Keys—Notation 2Mode 2Editing Expressions 3
TI-82 GRAPHING CALCULATOR KEYSTROKE GUIDE 5Items highlighted with bullets • only direct you to earlier references on the same subject.
1 Divide 52 Decimal 53 Square Root 64 Add 65 Negative and Subtract 76 Multiply 87 • Divide 88 Exponent 89 • Square Root 9
10 Absolute Value 911 Reciprocal 912 • Negative 1013 Fraction 1014 Store 1015 Alpha 1016 Window and Default 1117 Integer 1218 Graph 1319 Cursor 1320 Enter Function 1421 Evaluate Y 1422 Table 1623 Trace 1724 Test 1825 Zoom In 1926 Square 2027 Shade 2028 Solve 2229 Evaluate Y 2630 Scientific 26

Contents v
TI-83INTRODUCTION: On/Off, Contrast, Mode, and Editing Expressions 27Turning the Calculator On 27Adjusting the Display Contrast (Making the Screen Lighter or Darker) 27Turning the Calculator Off 28Second Functions for Keys—Notation 28Mode 28Editing Expressions 29
TI-83 GRAPHING CALCULATOR KEYSTROKE GUIDE 31Items highlighted with bullets • only direct you to earlier references on the same subject.
1 Divide 312 Decimal 313 Square Root 324 Add 325 Negative and Subtract 336 Multiply 347 • Divide 348 Exponent 349 • Square Root 35
10 Absolute Value 3511 Reciprocal 3612 • Negative 3613 Fraction 3614 Store 3615 Alpha 3716 Window and Default 3717 Integer 3918 Graph 4019 Cursor 4020 Enter Function 4021 Evaluate Y 4122 Table 4223 Trace 4424 Test 4525 Zoom In 4526 Square 4727 Shade 4728 Solve 5029 Evaluate Y 5530 Scientific 56
INDEX 57

1
TI-82 INTRODUCTION
On/Off, Contrast, Mode, and EditingExpressions
TURNING THE CALCULATOR ON
When the ON button is pressed, you should see a blinking dark rectangle (called the cursor) in theupper left-hand corner of the screen. The screen you are looking at is called the Home screen, wherebasic computations are performed. If you do not see the blinking cursor, you may need to adjust thedisplay contrast. How that is done will be described next.
ADJUSTING THE DISPLAY CONTRAST (MAKING THE SCREEN LIGHTER ORDARKER)
Even if your display is presently easy to view, you may find that under different lighting conditions youmay need to adjust the display contrast. Also, as the batteries in your calculator become weaker withuse, you will have to make occasional adjustments in display contrast.
If you wish to make the display darker, press the light blue 2nd key and then hold down the UpArrow (∆ ) key until the desired level of darkness is obtained. If you wish to make the display lighter,press the light blue 2nd key and then hold down the Down Arrow (∇ ) key until the desired level ofdarkness is obtained. As soon as you release the Up Arrow or Down Arrow key, the arrow keys nolonger affect contrast, and you must press the 2nd key again to make the arrow keys affect thecontrast.
Note that when the 2nd key is pressed, an arrow pointing upward appears inside the cursor to letyou know that the 2nd key has been pressed. (Why the arrow pointing upward denotes the 2nd key willbe explained a bit later.) The Up, Down, Left, and Right Arrow keys are the blue-gray keys located inthe upper right-hand portion of the keyboard. In many of the other uses we will have for them, they willfunction in the same way as the arrow keys on a computer keyboard.
Experiment with the contrast setting a bit. You will find that when you press 2nd and hold down ∆or press 2nd and hold down ∇ , a cursor with a number in it will appear in the upper right-hand corner
2 TI-82 Introduction
of the Home screen as long as you hold down the Up Arrow or Down Arrow key. Try to adjust thecontrast, and as you do, be looking in the upper right-hand corner of the screen for the contrastnumber. This number indicates how dark, on a scale of 0 to 9, you have made your screen, with 9representing the darkest possible contrast setting. As the batteries in your calculator become weaker,the contrast setting usually needs to be increased to provide the same level of contrast you may haveobtained at a lower setting with fresh batteries. When you need to set the contrast setting to 8 or 9 on aregular basis to see the display clearly, it is time to change batteries.
When is the contrast set appropriately? To some extent it is a matter of personal preference, butthere are some contrast qualities which most people find suitable. The screen is composed of tinysquares, called pixels, which darken to form the cursor, numbers, letters, etc., on the screen. Mostpeople find that the contrast is set about right when the cursor is clearly visible and you can see that itis composed of 7 rows and 5 columns of pixels. You should also just barely be able to see where theother pixels are on the screen, but they should by no means be dark, just barely visible if you lookclosely.
TURNING THE CALCULATOR OFF
Pressing the 2nd key before pressing the ON key activates the ON key's second function, which isprinted in light blue print above the ON key. Notice the word OFF written on the keyboard above the ONkey. Thus, pressing the 2nd key and then the ON key turns the calculator off.
If you forget to turn the calculator off, it will turn itself off after a few minutes of non-use, usingthe Automatic Power Down (APD™) feature. Pressing the ON key turns the calculator back on, andthe screen will appear exactly as it was before the (APD™) feature turned the calculator off.
SECOND FUNCTIONS FOR KEYS—NOTATION
To simplify matters in the future when referring to second functions served by keys, this KeystrokeGuide will simply show 2nd followed by the name of the second function, enclosed in brackets. Forexample the keystroke sequence for turning the calculator off will be denoted 2nd [OFF]. Thus, the wordin brackets is not on the key itself, but it is written above the key in light blue print as the key's secondfunction. This is why, when you press the 2nd key, the arrow pointing upward appears inside thecursor. It is to remind you to look for the light blue print above a key, rather than what is written onthe key, to determine what that key will do when you press it.
MODE
Before doing some basic computations, it would be a good idea to check the mode settings on thecalculator which determine how results are displayed. Press the MODE key. The display should appearas shown at the top of the next page.

TI-82 On/Off, Contrast, Mode, and Editing Expressions 3
For now, it would be best to have all of the settings on each line highlighted (black background) asshown. If any of the highlighted settings on your calculator are not the ones shown above, use yourArrow keys to move the blinking cursor over the setting desired and press ENTER. Continue in a likemanner until all of the settings on the left side are highlighted as shown. Press 2nd [QUIT] to return tothe Home screen.
EDITING EXPRESSIONS
Turn on your calculator and type in 3 2 7+ × . (Don't worry just yet about calculating the value of theexpression.) The calculator displays 3+2*7. Note that the calculator displays multiplication with anasterisk (*). This is a common computer notation for multiplication.
Entering an expression and editing it before evaluationAs you can already see, the TI-82 differs from ordinary scientific calculators in more ways than justbeing able to draw graphs. One of its major advantages as a calculator is that it enables you to see anentire arithmetic expression as you enter it. The TI-82 also lets you easily edit the expression bothbefore and after you evaluate it. To see how to edit, we will change the expression above, replacing the2 with a 4. Use the Left Arrow key (<) to move the cursor until it is over the 2. Type a 4. Theexpression should now look like this: 3+4*7. We will now evaluate the expression. The cursor is stillin the middle of the expression, but that doesn't matter. To evaluate the expression press the ENTER keyin the lower right-hand corner of the keyboard. On the right-hand side of the calculator screen youshould see 31 displayed, which is the value of the expression. Note that the calculator uses standardalgebraic order of operations rules, performing the multiplication before the addition.
Editing an expression after evaluationSuppose you wanted to evaluate 3 5 7+ × . Since this expression differs from the previous one in onlyone character (5 instead of 4), there is a way we can quickly obtain the new expression from the old.Rather than enter the entire expression again, just press 2nd [ENTRY]. An exact copy of the lastexpression entered is reproduced on the screen. Now use the arrow keys as before to change the 4 to a5, and press ENTER to obtain the value of the new expression, 38.
INS (Insert) and DEL (Delete)Suppose we want to evaluate 3 4 85 7 6+ ×. . by editing the last expression. If we press 2nd [ENTRY], weget 3+5*7 on the display. Move the cursor over the 5. We have one problem here that we mustrecognize: if we type in 4.85, we will type over part of the expression we want to keep. To avoid that,type the 4 over the 5, and then press 2nd [INS], which puts the calculator in Insert mode. Note that thecursor becomes a blinking underline. That means that the character at the cursor position and all thoseto the right of it will be moved to the right to make room for some inserted symbols. Type in theremaining .85 to complete the 4.85 and see how the other characters are moved to the right to make
4 TI-82 Introduction
room. Now use the arrow keys to put the cursor at the end of the expression. Note that as soon as youmove the cursor with an arrow key, the calculator leaves Insert mode. We are now going to change 7 to7.6. Since the cursor is at the end of the expression, the calculator need not be in Insert mode to makethis change (though it would make the change just the same if it were in Insert mode). After the 7 typein .6, and press ENTER to display the value of the new expression, 39.86.
Now suppose we want to evaluate 3 5 2 7 6+ ×. . by editing the last expression. Press 2nd [ENTRY] toreproduce the last expression, and use the arrow keys to place the cursor over the 4. Type in 5.2. Since5.2 contains one less character than 4.85, the last digit of the 4.85 is still on the screen and must beeliminated. The cursor should now be resting on this last digit (5) of the old 4.85. Press the DEL key todelete this character. (Each time the DEL key is pressed, it deletes the character at the cursor position.)Press ENTER to display the value of the expression, 42.52.
Next, suppose we want to evaluate 3 5 8+ × . Notice that this expression could be produced byediting the last expression we evaluated, but it really looks more like the expression 3+5*7 that weevaluated some time earlier. One of the nice features of the TI-82 is that it stores as many previousentries as it can. Press 2nd [ENTRY] once to produce the last expression. Now press 2nd [ENTRY] again.Note that you now see the next-to-last expression we evaluated. If you press 2nd [ENTRY] one moretime, you will see the expression we evaluated before that, which was 3+5*7. You may now edit thisexpression as before to produce 3+5*8. Press ENTER to evaluate it. If you continue to press 2nd[ENTRY] beyond the calculator's ability to recall previous entries, it will return you to the most recentlyevaluated expression.
Clearing the Home screenBy now your Home screen may look pretty full, and the original expressions you entered may havescrolled off the top of the screen. Any time you want to erase everything on the Home screen, just pressthe CLEAR key, located below the arrow keys. If you want to retrieve these erased expressions, you maystill do so by pressing 2nd [ENTRY] as often as needed.

5
TI-82 GRAPHING CALCULATORKEYSTROKE GUIDEAs you look at the pages in your textbook, you will notice that on some pages a book icon & appearswith a brief description of a feature on your TI-82 graphing calculator. In this guide the page numberin the textbook on which each of these book icons occurs is shown, as well as the key word or phrasewhich appears next to the icon, followed by a detailed description of how to use this feature on yourTI-82. Each feature is also given its own number for easy reference.
page 31 Divide
The symbol ÷ appears on the division key of the TI-82, but on the screen division is indicated bythe diagonal slash /. Do the division 24 divided by 6 by pressing 24 ÷ 6 ENTER. Note that on thehome screen the division appears as 24/6, which means the same thing, and the result is still 4.
Fractions may also be entered as divisions. For example, the fraction 43 may be interpreted as
3 divided by 4. You may enter the fraction that way on your calculator. On the screen you will see3/4. When you press ENTER, you will see the decimal equivalent of .75. (See also 13 Fraction.)
page 42 Decimal
Press the MODE key. Notice that on the second line of mode settings the word Float is probablyhighlighted. If not, move the blinking cursor over the word Float and press ENTER. Press 2nd[QUIT] to return to the Home screen. Unless the computation comes out exactly using fewer digits,when the calculator is set to Float mode, the calculator displays 10 digits, and the decimal pointoccurs at its appropriate place in the 10-digit display. As a result, sometimes more digits aredisplayed to the right of the decimal point on some computations than on others. The decimalpoint "floats" to wherever it should be in the 10-digit display for a given computation. Forexample, perform the following three divisions: 17÷8, 368÷7, and 9543÷7. Since the computationof 17÷8 comes out exactly at the third decimal place, the calculator displays only the number ofdecimal places needed to show the result: 2.125. The other two computations do not come outexactly, no matter how many decimal places are used, so the calculator displays ten digits andlocates the decimal point where it should occur in the 10-digit display: 368÷7 = 52.57142857 and

6 Calculator Keystroke Guide
9543÷7 = 1363.285714. Notice how in these last two computations the first displays ten digitswith eight of them to the right of the decimal point, while the last also displays ten digits but withonly six of them to the right of the decimal point.
Suppose instead that you want your calculator to automatically round computations to a fixednumber of decimal places. Press the MODE key again. The second line on the Mode screen readsFloat 0123456789. To make the calculator automatically round all calculations to twodecimal places, on the second line of the MODE screen use the arrow keys to move the blinkingcursor over the number 2 and press ENTER. Press 2nd [QUIT] to return to the Home screen. Now ifyou do the same three computations above again, the calculator will display the results roundedwith only two digits to the right of the decimal point (that is, rounded to the nearest hundredth):17÷8 = 2.13, 368÷7 = 52.57, and 9543÷7 = 1363.29. When you are through making thecalculator round to two decimal places, it would probably be best to return to the MODE menu andchange the setting back to Float.
page 43 Square Root
The square root is the second function on the x2 key. (Note the square root sign ð printed abovethe x2 key in light blue print.) To produce a square root sign on the Home screen display, firstpress the light blue 2nd key and then press the x2 key to produce its second function, the squareroot sign. In the future, this key sequence will be denoted 2nd [ ð ] , where the second function ofthe key is enclosed in brackets. Other keystrokes involving the 2nd key will be denoted in a similarfashion. The expression in the brackets should be found printed above one of the keys on thekeyboard.
Unlike with most scientific calculators, with the graphing calculator you enter the square rootsign first. To find the square root of 324, use the following keystrokes: 2nd [ ð ] 324 ENTER. On theHome screen you will see ð324. The value of this square root, 18, should have appeared on theright of the screen after you pressed ENTER.
Note that the calculator only does the square root of the number immediately following the
square root sign. If you want to compute 187 + , you must group the sum in parentheses,ð(7+18), to assure that the sum is computed before the square root is taken. (The correct valueof this expression is 5.)
page 114 Add
The addition key + is on the right-hand side of the keyboard with the other basic operation keys(subtraction, multiplication, and division). Basic addition is done as it is on most other kinds ofcalculators: the expression containing addition may be entered just as it appears in print or whenwritten by hand. To evaluate the expression once you have typed it in, press ENTER. For example,to evaluate 7 + 15, type this expression just as it appears and press ENTER to display the value22.
To add expressions involving negative numbers, such as 5 + (−8), you may type thisexpression just as it appears, using the parenthesis keys, and pressing ENTER to obtain the value−3. Be sure you use the gray negative key—not the blue-gray subtraction key—when you type in

TI-82 7
the −8. (See 5 Negative and Subtract.) It turns out that you could also type in this expression
without using the parentheses, and it will still work: 5 + −8 will still produce the value –3.
page 115 Negative and Subtract
You may have noticed that the calculator has two keys with a minus sign on them. The gray (–)key in the bottom row of keys is actually the negative key. The negative key is used only towrite the negative of a number. The following numbers and expressions would be entered usingthe gray negative key:
)6/(54146*75 −+−−−
The blue-gray key in the right-hand column on the keyboard is the subtraction key. It isgrouped with the other keys used to perform the basic four arithmetic operations (addition,subtraction, multiplication, and division). The subtraction key is used between two numbers toindicate that a subtraction is to be done. The following expressions would be entered using theblue subtraction key:
)43(6527*13817 +−−−
You can tell which of these keys has been used from the screen display, if you look closely.The negative sign produced by the negative key is one pixel (dot) shorter and placed one pixel rowhigher than the subtraction sign produced by the subtraction key.
Be aware that it is a common mistake among new users of the TI-82 to press the wrong one ofthese two keys. Sometimes you will get an error message on the calculator screen when you pressENTER to evaluate an expression. Other times the calculator will do something different fromwhat you intend.
For example, suppose you wanted to do the subtraction 8−5 on the calculator. First do it thecorrect way with the blue-gray subtraction key and press ENTER to evaluate it. Of course, youshould get 3 as the answer. Now enter it the wrong way by using the gray negative key betweenthe 8 and the 5 and press ENTER to evaluate it. You get an error message (ERR: SYNTAX, whichyou can read more about some other time in the Error Conditions portion in the back of themanual which came with your calculator). What happened? The calculator does not interpret thenegative key as meaning to subtract. The calculator sees this last expression as two numberswritten side by side, 8 and −5, with no indication of which operation you wanted to perform onthem. Therefore, the calculator doesn't know what you want done with these numbers. That's whyit gave you an error message. The calculator is smart enough, however to know where theproblem probably lies. Notice that with the error message you have two choices: Goto (go to theerror) and Quit. Choose Goto by pressing 1 or by pressing ENTER (since choice 1 is alreadyhighlighted). The calculator returns to the Home screen with the cursor blinking on the negativesign which should have been a subtraction sign. While the cursor is there, type a subtraction sign,which will replace the incorrect negative sign, and then press ENTER to evaluate the expression.Now the problem has been fixed.

8 Calculator Keystroke Guide
page 116 Multiply
The TI-82 interprets the following as indicating multiplication: the multiplication key ×, numbersor expressions written side by side in parentheses, numbers and letters written side by side, andletters written side by side. If you type 63 × , the calculator will display it as 3*6. The asterisk *is a common computer notation for multiplication. When you press ENTER, the calculator willdisplay the value 18. If you place one or both of the numbers in a multiplication in parentheseswithout using the multiplication key, the calculator still knows that you mean to multiply. Thus,the calculator will also produce 18 if you enter 63 × as 3(6), (3)6, or (3)(6). Parenthesesmay also be used for grouping calculations to be done in a certain order. Thus, the calculatorinterprets 5(3+4) as meaning to add 3 + 4 first to get 7, and then to multiply 5 times the 7 to get35.
As an example of placing numbers and letters side by side, the calculator interprets 3X asmeaning "3 times X." (How to enter letters will be discussed later.) To see how this way ofwriting multiplication works, try typing in 2π, where π (the Greek letter pi) represents that specialnumber having to do with circles. The value of π is approximately 3.141592654. Your calculatorhas this special number as the second function on the caret key ^. (You should see the symbol πprinted above the caret key in light blue type.) To type in 2π, type the 2 and then press the lightblue 2nd key and then the caret key. (In the future we will denote these last two keystrokes as 2nd[π].) Your calculator should display 2π. Press ENTER to see the value 6.283185307, which is twotimes the value of π.
page 117 Divide
See 1 Divide.
page 128 Exponent
The caret key ^ is used to enter most exponents. For example, the expression 52 , is entered intothe calculator as 2^5. Thus, the base is entered first, then the caret, and then the exponent. PressENTER to produce this expression’s value, 32. To raise a negative number to a power, it isnecessary to enclose the negative number base in parentheses. For example, to raise the number
−3 to the fourth power the expression must be written as 4)3(− . Likewise, we must enter this
expression into the calculator as (-3)^4. The result is 81. Without the parentheses, -3^4
would (and should) be interpreted as taking the negative of 43 . That is, -3^4 is interpreted as
81)81()3(3 44 −=−=−=− .
Two special exponents that can be produced on screen as raised exponents are the exponents
2 and 3. To enter the expression 25 you could use the standard approach of typing 5^2, or you
could instead type the 5 and then press the 2x key. The 2x key produces only the raised exponent2 on the screen, not the x. Either way, the calculator produces the result of 25 when you press
ENTER. To produce a raised exponent 3, as in the expression 34 , first type 4 and then press theMATH key. The calculator will display the MATH menu. Choice 3 on the MATH menu is the raisedexponent 3. Select it by pressing 3 (or by using the Down Arrow key to highlight the number 3

TI-82 9
and pressing ENTER). The MATH menu will then disappear, and the calculator will display 43.Press ENTER to display the value of the expression, 64.
page 129 Square Root
See 3 Square Root.
page 1410 Absolute Value
The absolute value of a number is the number's distance from zero on the number line. Theabsolute value key is the second function on the x−1 key. It is denoted ABS. Thus, the keystrokesneeded to get the absolute value would be 2nd [ABS]. When we write the absolute value of −7 withpencil and paper, we enclose the number within two vertical bars: 7− . On the calculator the
absolute value of −7 is denoted abs(-7). Produce this expression on your Home screen by firstpressing 2nd [ABS]. Then open a set of parentheses, type in −7 (being sure to use the gray negativekey), and close the parentheses. Press ENTER to find the absolute value of −7, which is 7. Trydoing this problem again, only don't use the parentheses. You will find that when you take theabsolute value of a single number, the parentheses are optional.
As was the case with square roots, the calculator only takes the absolute value of the numberimmediately to the right of the abs symbol. To evaluate 517 +− we may not just enter
abs–17+5, because the calculator would do the absolute value of the −17 only. We want it to dothe absolute value of the entire expression contained within the absolute value bars. To do this, wemust put the expression inside a set of parentheses: abs(–17+5). The result is 12, since
1212517 =−=+− . To evaluate 25 +− you would type in abs(-5)+abs(2)and
press ENTER to obtain the value 7.
To multiply the absolute value of −4 by the absolute value of 10, 104 ⋅− , you could use
the multiplication key to type in abs(-4)*abs(10), or you could just put the two absolutevalues side-by-side with no symbol in between: abs(-4)abs(10). The calculator still knowsyou mean that these two absolute values are to be multiplied. The value of this expression is 40,since 40104104 =⋅=⋅− .
page 2111 Reciprocal
Since the reciprocal of an integer, such as 5, may be written as 51 , it may be entered into the
calculator as we would enter any fraction of this type: 1/5, using the division key ÷ to produce
the diagonal slash / on the screen. Similarly, the reciprocal of a fraction, such as 85 , may be
written by interchanging the numerator and denominator: 58 , appearing as 8/5 on screen.
Another way to enter the reciprocal of a number is to use the 1−x key. For reasons that will
be explained later, the reciprocal of 4 may be written as 14− . To produce this expression on
10 Calculator Keystroke Guide
screen, press 4; then the 1−x key, which produces only the exponent −1, not the x. Press ENTER todisplay the value of the expression, .25, which of course is the decimal equivalent of 4
1 .
page 2712 Negative
See 5 Negative and Subtract.
page 3513 Fraction
Fractions may be entered into the calculator by using the division key ÷ to produce a diagonalslash fraction bar. The TI-82 can perform operations on fractions and give answers in either
decimal or fraction form. Enter the expression 2
1
6
5− by typing 2165 ÷−÷ . The expression will
appear on the Home screen as 5/6-1/2. Press ENTER to get the decimal form of the value ofthis expression (approximately .3333333333). If you prefer to get your answer in fractional form,you must do one extra thing before pressing ENTER. To see how to get a fractional answer, eithertype in the original expression again or use 2nd [ENTRY] to reproduce it on the Home screen. Withthe cursor at the end of the expression, press the MATH key. Choice 1, which is alreadyhighlighted, is ∑Frac, which converts the preceding expression to fractional form, if it can. Press 1or ENTER (since choice 1 is already highlighted). The display will return to the Home screen,where the fraction conversion symbol will appear after the expression: 5/6-1/2∑Frac. Nowpress ENTER to see the fractional value of the expression (one-third).
page 7314 Store
The STO> key is used to store a particular number value in a variable (letter). That is, it assignsa specific numerical value to a letter. If you wish to make the letter B represent the value 7, thenyou must store the value 7 in the letter B. To do this, first type the number 7 and then press theSTO> key. Notice that an arrow appears on screen next to the number 7. To type the letter B (orany other letter) first press the ALPHA key. Note that the cursor has changed: there is a letter Ainside the cursor, which indicates that the calculator is in Alpha mode. You may have noticed thatletters of the alphabet appear above many of the keys on your calculator. When the calculator isin Alpha mode, as it is now, and you press one of these keys, it produces on screen the letter of thealphabet shown above the key, rather than performing its usual function. Since you want to storethe value 7 in the letter B, press the key that has the letter B printed above it: the MATRX key.Your screen should now show 7→→B. The calculator doesn't actually store 7 in the letter B untilyou press ENTER, which you should do now. From now on, until you change the value stored inB, the calculator assigns the value 7 to the letter B. Even turning the calculator off won't erasethis result. To type in 3B, type 3 and then press the ALPHA key to put the calculator into Alphamode. (When you do, the letter A should appear inside the cursor.) Then press the MATRX key,which has the letter B printed above it. Press ENTER to display the value of 3B (3 times B), whichis 21, since 3B = 3(7) = 21.
page 8215 Alpha
To type letters of the alphabet, which are printed above many of the keys, the calculator must bein Alpha mode. To put the calculator in Alpha mode for one keystroke only, press the ALPHA key
TI-82 11
and then press the key that has the desired letter printed above it. When you press the ALPHA key,the calculator lets you know it is in Alpha mode by displaying the letter A inside the cursor. (If thecalculator is also in Insert mode because 2nd [INS] was pressed first, the Insert mode underlinecursor will have an A printed above the underline.) For example, to produce the letter P on screen,press the ALPHA key to put the calculator in Alpha mode and then press the 8 key, which has theletter P printed above it. Notice that after you press the 8 key, the calculator is no longer in Alphamode.
If you wish to type several letters in succession, the calculator may be locked in Alpha modeby pressing 2nd [A-LOCK]. Try using this feature to spell the word CAVE. Press 2nd [A-LOCK] andthen type in the four letters as they are found above the keys. Notice that the calculator stays inAlpha mode the entire time. To escape from Alpha mode, press the ALPHA key again. The Ashould disappear from inside the cursor. (If you had pressed the ENTER key, the calculator wouldalso have left Alpha mode.) You may have noted the unusual Alpha character written above thezero key: ς . It represents the spacebar. This character does not show up on screen, but rather thisAlpha character produces a blank space on screen.
page 8616 Window and Default
The WINDOW screen lets us determine which part of the coordinate plane will be displayed on thecalculator when a graph is drawn. The part that is displayed is sometimes called the viewingrectangle or graphing window. The default viewing rectangle, which on your calculator is calledthe Standard window, is a graphing window in which the displayed values of x and of y varyfrom −10 to 10, with tick marks (little scale markings on the axes) occurring one unit apart onboth axes. There are two ways of setting your calculator to this Standard (default) viewingwindow. The first is to set it manually. Press the WINDOW key. The Window settings displayedmay be changed by using the arrow keys to move the cursor to the proper line and by typing overthe existing values. The first number, denoted Xmin, represents the smallest value of x to bedisplayed on the graphing window. Xmin indicates the value of x at the extreme left edge of thegraphing window when it is displayed. On the Standard (default) viewing window Xmin = −10.Xmax represents the largest value of x to be displayed on the graphing window. Xmax indicatesthe value of x at the extreme right edge of the graphing window. On the Standard (default)viewing window Xmax = 10. Xscl indicates the distance between tick marks on the x-axis. On theStandard (default) viewing window Xscl = 1. Ymin represents the smallest value of y to bedisplayed on the graphing window. Ymin indicates the value of y at the very bottom of thegraphing window when it is displayed. On the Standard (default) viewing window Ymin = −10.Ymax represents the largest value of y to be displayed on the graphing window. Ymax indicatesthe value of y at the very top of the graphing window when it is displayed. On the Standard(default) viewing window Ymax = 10. Yscl indicates the distance between tick marks on the y-axis. On the Standard (default) viewing window Yscl = 1.
In summary, when you have set the Window settings to the Standard (default) values, thescreen should display the following:Xmin=-10Xmax=10Xscl=1Ymin=-10Ymax=10Yscl=1

12 Calculator Keystroke Guide
To see this Standard (default) viewing window for graphs, display the Graph screen bypressing GRAPH. Your screen should display a graphing window like the one shown in Figure2.10 on page 86 of your text.
To see another graphing window, press the WINDOW key, change the settings as shown below,and then press GRAPH again to see this different graphing window:
Xmin=-4Xmax=12Xscl=2
Ymin=-50Ymax=80Yscl=25
The left edge of the screen is at x = −4, and the tick marks on the x-axis are 2 units apart, so thefirst tick mark to the right of the origin on the x-axis represents 2, the next one to the right of itrepresents 4, the one after that 6, etc. On the y-axis the mark at the very bottom of the screenrepresents −50, and the tick marks on the y-axis are 25 units apart, so the first mark above theorigin on the y-axis represents 25, the next one above it represents 50, and the next represents 75.Since the value of y at the very top of the screen is 80 (Ymax), notice that the y-axis extends just abit above the tick mark representing 75.
There is a second way to produce the Standard (default) viewing window on your calculator.Any time you wish to return the Window settings to the Standard (default) settings, just press theZOOM key and press 6 to select the Standard viewing window (ZStandard). (From now on, thiskeystroke sequence will be denoted ZOOM 6.) The graphing window will then be displayed withthe Standard (default) settings. To verify that the calculator has changed the Window settings tothe Standard (default) values, press the WINDOW key to view the settings. Any time you wish toreturn to the Home screen from any of these other screens, just press 2nd [QUIT].
page 8617 Integer
Sometimes we want to have a graphing window that will display integer coordinates, rather thanthe lengthy decimal coordinates that often arise with other graphing windows. Such a viewingrectangle is called an Integer graphing window. Although an Integer graphing window may beproduced beginning from any set of Window settings, press ZOOM 6 to display the Standard(default) viewing window. Press the ZOOM key once more. Notice the arrow pointing downward atthe bottom of the screen next to choice 7. That arrow indicates that the Zoom menu has moreitems in it which may be viewed by pressing the Down Arrow key to scroll the menu downward.Press the Down Arrow key several times (or hold it down) until the highlight is on 7. Now pressthe Down Arrow key once more. Notice that the menu has scrolled downward to reveal a choice 8,which is ZInteger. Choose ZInteger either by pressing 8 or by moving the highlight to 8 andpressing ENTER. The calculator will display the as-yet-unchanged graphing window, and therewill be a set of coordinates displayed at the bottom of the screen which represent the coordinatesof a small free-moving cursor, which may be a bit hard to see, since it is at the origin. (You maysee a blinking pixel at the origin.) Press the Up Arrow and Right Arrow keys a few times so that

TI-82 13
you get a better look at this free-moving cursor. This cursor should be moved to approximatelythe coordinates of the point you want to have in the center of the screen after the calculator createsthe Integer graphing window. If you wish to have the point (7,5) at the center of the Integergraphing window, then move this free-moving cursor to a point as close to (7,5) as possible. Thatis, move the cursor with the arrow keys until the coordinates displayed at the bottom of the screenare as close as you can get them to x = 7 and y = 5. (From the Standard graphing window, theclosest you can come is probably x = 7.0212766 and y = 4.8387097.) Press ENTER to produce theInteger graphing window centered at (7,5). Press the Right Arrow key to produce a larger free-moving cursor one pixel to the right of the center of the screen. (See 19 Cursor for more detailsabout this cursor.) Note that the coordinates of the cursor are (8,5). Press the Left Arrow key toreturn to the center of the screen, which is at (7,5). Press other arrow keys and note that everytime you press the Left Arrow key or the Right Arrow key, the value of x remains an integer andchanges by 1. Likewise, every time you press the Down Arrow key or the Up Arrow key, thevalue of y remains an integer and changes by 1. You may want to look at the Window settings tosee how things have been changed.
Press the GRAPH key again to display the graphing window. If you want to change thecoordinates of the center to some other point, such as the origin (0,0), press ZOOM 8, move thecursor to (0,0), and press ENTER. A new Integer graphing window will be produced, this timecentered at the origin. Use the arrow keys to verify that this change has taken place.
page 8618 Graph
See 16 Window and Default first to learn how to set the left, right, bottom, and top of thegraphing window with the Window settings. To see the graphing window you have selected, pressGRAPH.
page 8719 Cursor
Press the GRAPH key to display the graphing window. (It doesn't matter which graphing windowyou are using, nor does it matter if graphs are displayed.) Press one of the arrow keys. (It doesn'tmatter which one.) You will notice that near the center of the screen there is a cross hair, and atthe bottom of the screen there are values for x and y which represent the coordinates of the crosshair. If you cannot see the cross hair clearly because it lies on one of the axes, press the Up Arrowkey a few times and the Right Arrow key a few times to get the cross hair away from the axes.You may notice that when you do this, the coordinates displayed at the bottom of the screenchange to reflect the changed position of the cross hair. This cross hair may be moved to any partof the graphing window by using the arrow keys. The cross hair is sometimes called the generalcursor or free-moving cursor. To turn this general cursor off, just press the GRAPH key.

14 Calculator Keystroke Guide
page 9220 Enter Function
See also 16 Window and Default and 18 Graph. To graph an equation, to use an expressionrepeatedly for computations, or to generate a table of values of an expression (See 22 Table.)such as 2 3x − , the expression first needs to be entered in the Y= screen. First press the Y= keyand erase any old expressions by placing the cursor on the expression to be erased and pressingCLEAR. Then type 2X−3 to the right of the equal sign next to Y1. The easiest way to produce theletter X on the screen is to press the X,T,θ key. To see the graph of this equation, just press theGRAPH key. The graph will be displayed on the graphing window with the Window settings youselected. (Refer to 16 Window and Default.) Using the Standard viewing window, you should seethe graph of a straight line as shown below.
Xmin=-10Xmax=10Xscl=1
Ymin=-10Ymax=10Yscl=1
You may graph up to ten equations on the same graphing window, using the Y= screen todefine the equations to be graphed. (There are ways to produce more than ten graphs on thegraphing window, but we won't discuss that here.) For example, press the Y= key, keepY1=2X−3, and move the cursor down to the right of the equal sign for Y2 and type X2. (Use the x2
key to produce the exponent 2.) Thus, you are defining Y2 to represent y in the equation y x= 2 .
To graph both of these equations, press the GRAPH key. You should see the same straight line asbefore, representing the graph of Y1, and you should also then see the graph of Y2, which is acurve that lies almost entirely above the x-axis. It just touches the x-axis at the origin.
Xmin=-10Xmax=10Xscl=1
Ymin=-10Ymax=10Yscl=1
If you return to the Home screen or turn the calculator off and then back on, the graphs willstill be there to view by pressing the GRAPH key. The graphs will also automatically be displayedif you press ZOOM 6 to display the Standard (default) viewing window.
page 9221 Evaluate Y
You can use the Store command to help you evaluate an algebraic expression involving thevariable x. (See 14 Store.) All you need to do is enter the expression on the Y= screen as Y1 (or

TI-82 15
any one of the ten y's in the Y= screen), store the desired value in X, and ask for the value of thevariable Y1. How to do all of this is perhaps explained better by looking at the following example.
On the Y= screen enter 4+= xy as Y1, that is, Y1=X+4. Press 2nd [QUIT] to return to the
Home screen. To get the value of this y when x is −6, store −6 in X (see 14 Store) by pressing −6STO> X and then ENTER. Now all you need to do is ask the calculator for the value of Y1. To dothis, first press 2nd [Y-VARS]. Next press ENTER to choose the Function... menu. Choose Y1 fromthis menu by pressing 1 (or ENTER, since Y1's number is already highlighted).
Y-VARS menu Function… menu
The calculator returns to the Home screen, and the variable Y1 will be displayed on thescreen. Press ENTER to find the value of Y1 when x = −6. The calculator should display the value−2. (Check the result with pencil and paper.) To find the value of Y1 when x = −4, store −4 in X,display the variable Y1 (Try pressing 2nd [ENTRY] a couple times to bring Y1 back on the screeninstead of going through VARS again.), and press ENTER. Try this same approach to find thevalue of Y1 when x is 0, 2, and 5. The answers may be found in Example 1 on page 93 of yourtext.
On the TI-82 there are other ways to evaluate an expression. One way relates the results tothe graph. Graph the equation 4+= xy mentioned above, using the Standard viewing window
(Zoom 6).
Press 2nd [CALC] to display the Calculate menu. Press 1 or ENTER to choose the valuecommand. The Graph screen is displayed, and at the bottom of the screen appears Eval X=,followed by a cursor. Type in the value of x you want, such as −6 in the example above. Whenyou press ENTER, the coordinates of the point on the graph where x = −6 appear at the bottom ofthe screen: X=-6 Y=-2, and a cross cursor appears on the graph to indicate where that point is.If you have more than one graph drawn, press the Down Arrow key to see the values of y for theother equations at the given value of x. See 22 Table for still another way to evaluate a Y variablefor any desired values of x.
16 Calculator Keystroke Guide
page 9222 Table
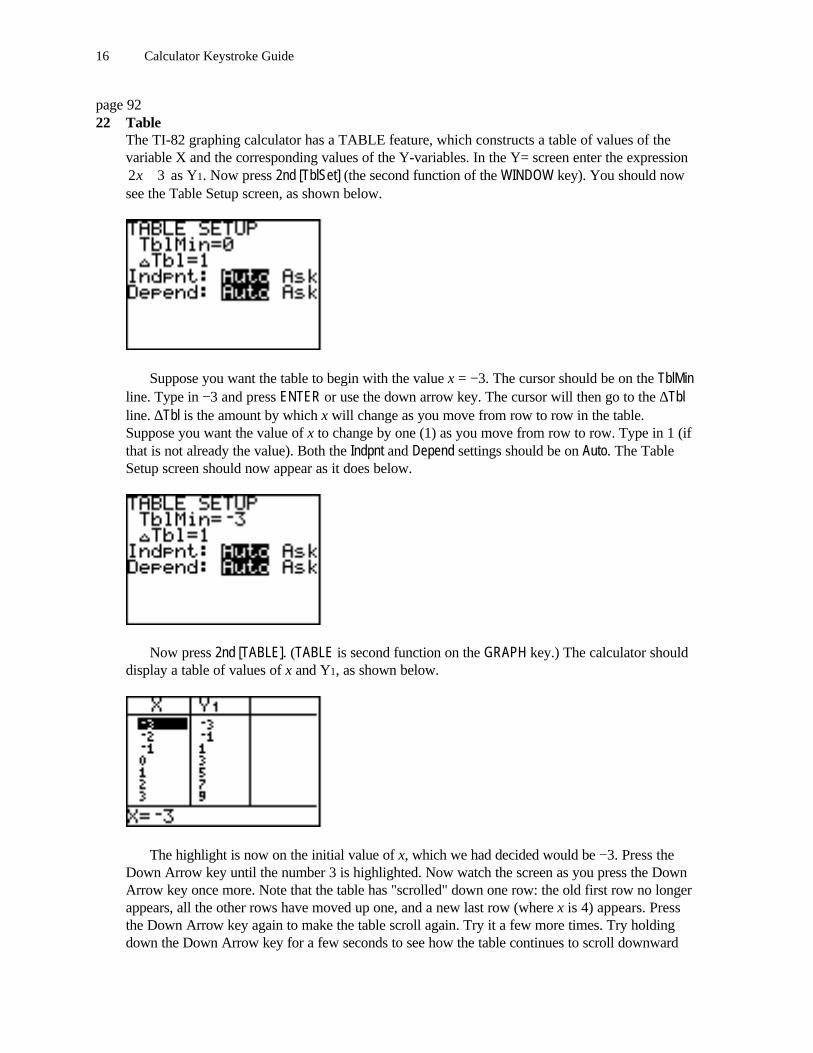
The TI-82 graphing calculator has a TABLE feature, which constructs a table of values of thevariable X and the corresponding values of the Y-variables. In the Y= screen enter the expression
32 +x as Y1. Now press 2nd [TblSet] (the second function of the WINDOW key). You should nowsee the Table Setup screen, as shown below.
Suppose you want the table to begin with the value x = −3. The cursor should be on the TblMinline. Type in −3 and press ENTER or use the down arrow key. The cursor will then go to the ∆Tblline. ∆Tbl is the amount by which x will change as you move from row to row in the table.Suppose you want the value of x to change by one (1) as you move from row to row. Type in 1 (ifthat is not already the value). Both the Indpnt and Depend settings should be on Auto. The TableSetup screen should now appear as it does below.
Now press 2nd [TABLE]. (TABLE is second function on the GRAPH key.) The calculator shoulddisplay a table of values of x and Y1, as shown below.
The highlight is now on the initial value of x, which we had decided would be −3. Press theDown Arrow key until the number 3 is highlighted. Now watch the screen as you press the DownArrow key once more. Note that the table has "scrolled" down one row: the old first row no longerappears, all the other rows have moved up one, and a new last row (where x is 4) appears. Pressthe Down Arrow key again to make the table scroll again. Try it a few more times. Try holdingdown the Down Arrow key for a few seconds to see how the table continues to scroll downward

TI-82 17
through larger values of x. Press the Up Arrow key until the top number is highlighted. Nowwatch the screen as you press the Up Arrow key once more. Note that the table has scrolled upone row. Press the Up Arrow key again to make the table scroll up again. Try it a few more times.Try holding down the Up Arrow key for a few seconds. Note that the screen scrolls upward. Thefirst value of x we used was −3. You can scroll back to that starting point by using the Up Arrowkey. Note that if you get −3 to be the top number in the X column, you can continue to press theUp Arrow key and have the table scroll up, showing more negative values of x. Any time youwant to leave the table and return to the Home screen, just press 2nd [QUIT].
There is yet another way to evaluate an expression on the TI-82 for your own list of values ofx, using the Table feature. Press 2nd [TblSet ] (the second function on the WINDOW key). Ignore thevalues of TblMin and ∆Tbl for now, and use the arrow keys to move the blinking cursor to the lineheaded Indpnt. Move the cursor over the word Ask and press ENTER. On the line headed Dependmove the cursor over the word Auto and press ENTER.
Now press 2nd [TABLE] (the second function on the GRAPH key) to display a table. Type in anyvalue of x you want, such as 3 in the example above. Press ENTER to see the value of Y1 (and anyother Y's you may have) displayed in the table. Choose any other values of x you want and use thesame procedure to evaluate your Y-variables.
page 9423 Trace
When you have displayed a graph of an equation, you may trace along points on the graph byusing the Trace cursor. For example, clear out any old equations from the Y= screen and enter asY1 the expression 4+x . To get an Integer graphing window (see 17 Integer) on your calculatorwhich corresponds most closely to the graphing window shown in Figure 2.18 on page 94 in thetext, first press ZOOM 6 to get the Standard (default) viewing window. Then press ZOOM 8, andwith the cross-hair cursor still near the origin, press ENTER to create the desired Integer graphingwindow. (You may want to look at the Window settings to see that they are similar to—but notexactly the same as—those shown in Figure 2.18, which are for a different calculator model.)
To activate the Trace cursor, press the TRACE key. A cursor will appear on the graph of theequation, and the coordinates of the cursor will appear at the bottom of the screen. To move thecursor along the graph and display the coordinates of other points on the graph, use the Left andRight Arrow keys. Unlike the general cursor (see 19 Cursor), the Trace cursor always stays onthe graph and displays only coordinates of points which are on the graph. To turn the Tracecursor off, press GRAPH.
If more than one graph is displayed, the Trace cursor may be made to trace along each graphlisted on the Y= screen. For example, go to the Y= screen. Keep the expression already entered as

18 Calculator Keystroke Guide
Y1. Enter as Y2 the expression 112 −− x . Enter as Y3 the expression 185
2
−x
. Press GRAPH to
see all three graphs displayed. Press the TRACE key to activate the Trace cursor. The Trace cursorwill appear on the graph of Y1, as it did before. To make the Trace cursor move to the otherstraight-line graph, the graph of Y2, press the Down Arrow key. Move the Left and Right Arrowkeys to trace along the graph of Y2. To make the Trace cursor move to the curved graph of Y3,press the Down Arrow key again. Move the Left and Right Arrow keys to trace along the graph ofY3. If you press the Down Arrow key once more, the Trace cursor will cycle back to the graph ofY1. (If four graphs were displayed, the Trace cursor would have moved to the graph of the fourthequation.) Pressing the Up Arrow key makes the Trace cursor move from graph to graph inreverse order. While the Trace cursor is on, try pressing the Up Arrow key a few times to see howthe Trace cursor moves from graph to graph.
page 10324 Test
The items on the TEST menu may be used to tell whether a relationship between two numbers orexpressions is true or false. To see how it works, let's let the calculator verify something youalready know: 7 is less than 8. At the Home screen type a 7 and then press 2nd [TEST] (the secondfunction on the MATH key) to produce the TEST menu. The "less than" symbol < is choice 5 on themenu. Either press 5 or use the Down Arrow key to highlight the 5 and press ENTER. The <symbol will appear on the Home screen after the 7. Then type an 8, so that the Home screen nowshows 7<8. You want to know if this statement is true. The calculator will tell you when youpress ENTER. The calculator will display a 1 if the statement is true or a 0 if the statement is false.In this case, of course, the calculator displays a 1, since 7 is less than 8.
Now let's enter a false statement: 4 > 11. Type a 4 and then press 2nd [TEST] to produce theTEST menu. The "greater than" symbol > is choice 3 on the menu, so press 3 to produce the >symbol on the Home screen after the 4. Now type 11 and press ENTER. The calculator displays a0 to tell you that the statement is false.
Next let's try one that perhaps isn't so obvious. Is 9359
85 > ? Type in 5/8 > 59/93 (using the
division key ÷ to produce the diagonal slash division sign /) and press ENTER to find out. Thestatement is false, since the calculator responds with a 0.
The TEST menu may also be used to test proposed solutions of equations. For example, to testwhether 2 is a solution of the equation 531 −=− x , first store 2 as the value of x. (See 14 Store.)Then type in the equation 531 −=− x and press ENTER. (Note that “=” is choice 1 on the TESTmenu.) Since the calculator displays the value 1 (true), 2 is a solution of the equation. Using thesame method, test whether –2 is a solution of the equation xx −=+ 152 . After you store –2 asthe value of x and then type in the equation, the calculator should display the value 0 (false) whenyou press ENTER, indicating that –2 is not a solution of the equation. Note: This approach totesting solutions of equations is reliable only for exact solutions. Rounded solutions or otherapproximate solutions usually do not test as correct.
TI-82 19
page 10525 Zoom In
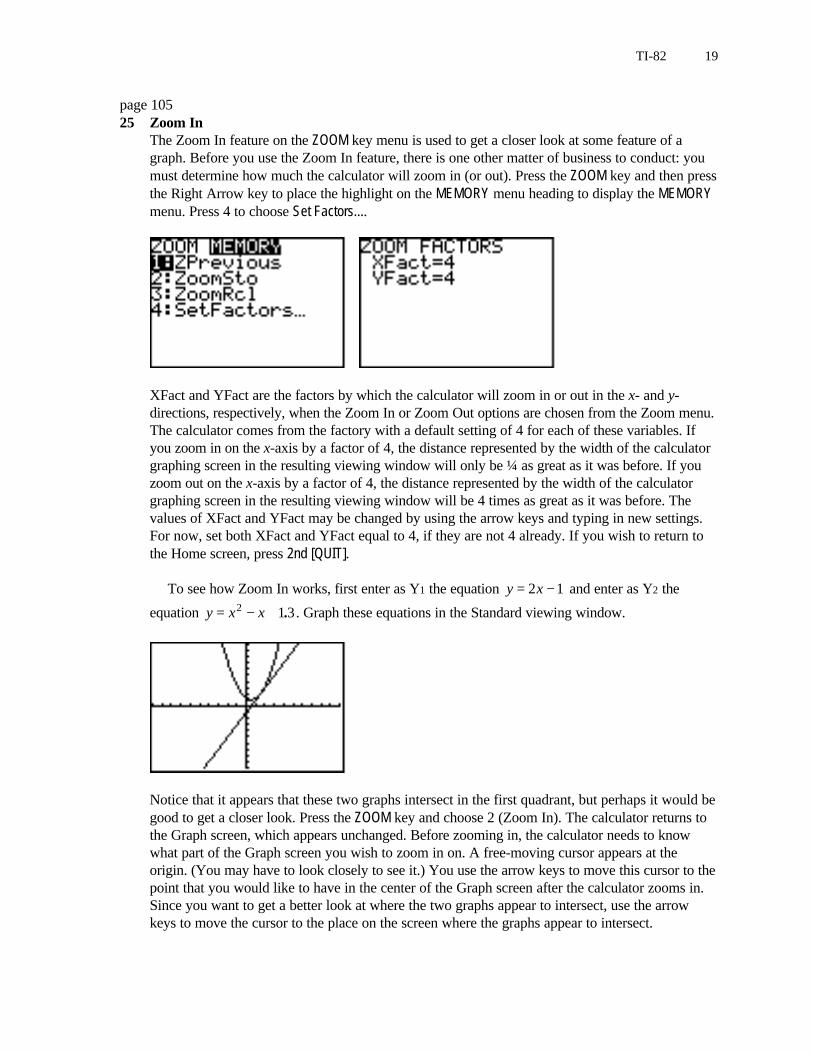
The Zoom In feature on the ZOOM key menu is used to get a closer look at some feature of agraph. Before you use the Zoom In feature, there is one other matter of business to conduct: youmust determine how much the calculator will zoom in (or out). Press the ZOOM key and then pressthe Right Arrow key to place the highlight on the MEMORY menu heading to display the MEMORYmenu. Press 4 to choose Set Factors....
XFact and YFact are the factors by which the calculator will zoom in or out in the x- and y-directions, respectively, when the Zoom In or Zoom Out options are chosen from the Zoom menu.The calculator comes from the factory with a default setting of 4 for each of these variables. Ifyou zoom in on the x-axis by a factor of 4, the distance represented by the width of the calculatorgraphing screen in the resulting viewing window will only be ¼ as great as it was before. If youzoom out on the x-axis by a factor of 4, the distance represented by the width of the calculatorgraphing screen in the resulting viewing window will be 4 times as great as it was before. Thevalues of XFact and YFact may be changed by using the arrow keys and typing in new settings.For now, set both XFact and YFact equal to 4, if they are not 4 already. If you wish to return tothe Home screen, press 2nd [QUIT].
To see how Zoom In works, first enter as Y1 the equation y x= −2 1 and enter as Y2 the
equation y x x= − +2 1 3. . Graph these equations in the Standard viewing window.
Notice that it appears that these two graphs intersect in the first quadrant, but perhaps it would begood to get a closer look. Press the ZOOM key and choose 2 (Zoom In). The calculator returns tothe Graph screen, which appears unchanged. Before zooming in, the calculator needs to knowwhat part of the Graph screen you wish to zoom in on. A free-moving cursor appears at theorigin. (You may have to look closely to see it.) You use the arrow keys to move this cursor to thepoint that you would like to have in the center of the Graph screen after the calculator zooms in.Since you want to get a better look at where the two graphs appear to intersect, use the arrowkeys to move the cursor to the place on the screen where the graphs appear to intersect.

20 Calculator Keystroke Guide
To make the zoom in occur, press ENTER. The graphs are redrawn, zoomed in on the point ofinterest. The graphs still appear as though they may intersect. Notice that the Zoom In cursor stillappears on the screen. To zoom in again on the place where the graphs appear to intersect, use thearrow keys again to move the cursor over the place where the graphs appear to intersect and pressENTER. From the resulting zoomed in view, it seems that these two graphs don't intersect after all!If you want to zoom in again, just to be sure, follow the same procedure.
page 24526 Square
A set of Window settings is said to be a square setting if a one-pixel change in the x direction(horizontal) represents the same distance as a one-pixel change in the y direction (vertical). Asquare setting can eliminate distortions in the shapes of certain geometric figures. For example, inmost graphing windows a circle will appear more like an ellipse or oval shape, but in a squaresetting a circle looks like a true circle. Also, perpendicular lines look truly perpendicular only in asquare setting.
To produce a square setting, just press the ZOOM key and then press 5 (ZSquare). Thegraphing window you had before will be converted to a square setting. For example, enter as Y1
the expression 32
1+x . (Enter it as Y1=(1/2)X+3.) Enter as Y2 the expression 42 −− x . Graph
these two perpendicular lines in the Standard viewing window (ZOOM 6). In the Standard viewingwindow these two lines certainly don't look perpendicular. Now press ZOOM 5 to produce a squareviewing window. The lines should now look much more like they are perpendicular.
page 26527 Shade
The Shade command shades a part of the graphing window between two graphs, or between agraph and a given constant value of y. The density of the shading can be specified, and theshading can also be restricted to appear between two given values of x. The Shade command asksfor at least 2 and up to 5 pieces of information to produce the kind of shading you want. Theinformation is entered in the following form. First, there is the Shade command itself, followed bythe five pieces of information enclosed in parentheses and separated by commas:Shade(lower function, upper function, shading density, beginning x, ending x)
↑ ↑ ↑ ↑ ↑required required optional optional optional
lower function = function or constant value of y you want at the bottom of the shaded regionupper function = function or constant value of y you want at the top of the shaded regionshading density = (optional) how densely you want the shading to occur (solid = 1 to least = 8)beginning x = (optional) smallest value of x for which you want to have shadingending x = (optional) largest value of x for which you want to have shading

TI-82 21
All of this may look rather complicated, but perhaps an example or two will help you see howit works. As a beginning example, suppose you want to shade the solutions of the inequality
43
2−≤ xy . One way to do this is first to enter the corresponding equation 4
3
2−= xy as Y1 on
the Y= screen. (Enter the equation as Y1=(2/3)X-4.) You may want to graph this equation inthe Standard viewing window, just to see what it looks like and to see if the Window settings givea good view of the graph. Press 2nd [QUIT] to return to the Home screen. The solution of theinequality consists of all points on or below the graph of the equation, since for each value of x,the values of y must be less than (below) or equal to (on) the values of y on the graph. Therefore,the graph of the equation will form the top of the shaded region indicating the solution of theinequality. Thus, Y1 will be your upper function on the Shade command. All points below the graphof Y1 are part of the solution of the inequality, so there really is no bottom to the shaded region.For the purposes of the Shade command, you want the shading to go to the bottom of the graphingwindow, so you can use the any number below lowest value of y displayed, Ymin, as the lowerfunction. Really, lower function and upper function are the only two quantities needed to do a basicshading. At the Home screen press 2nd [DRAW] to display the general DRAW menu. Press 7 todisplay the Shade( command on the Home screen. Note that the Shade( command automaticallydisplays an open parenthesis to save you a bit of typing. The first thing you must enter is the lowerfunction. Since the lowest value of y in the Standard viewing window (Ymin) is −10, type inanything less, such as −11. At the Home screen you should now see Shade(-11. Before youenter the upper function, you must type in a comma to separate it from the lower function. (Thecomma key is just above the 7 key.) The upper function is Y1, so press 2nd [Y-VARS], press ENTERto choose the Function... menu, and then press 1 or ENTER to choose Y1. Type a close parenthesisat the end to complete the command. At the Home screen you should now see Shade(-11,Y1).Press ENTER to execute the Shade command. The calculator should display the graph with solidshading below the line.
If you want to erase this shading, press 2nd [DRAW] and then choose 1 (ClrDraw). If you selectthis command from the Home screen, the command ClrDraw (Clear Drawing) will be displayed atthe Home screen. Press ENTER to execute the command. The calculator will respond with theword Done. Press GRAPH to verify that the shading has been erased. If you have done someshading and are viewing the Graph screen when you select the ClrDraw command (2nd [DRAW], 1),the calculator will immediately return to the Graph screen and redraw the graphs without theshading.
To graph the solutions of the inequality xy 2> , enter as Y1 the equation xy 2= . Graph it in
the Standard viewing window (or any other convenient graphing window). This time, all pointsabove the line xy 2= are solutions of the inequality. Thus, the graph of the line forms the bottom

22 Calculator Keystroke Guide
of the shaded region. The inequality has no upper boundary, so any number greater than Ymaxwill do as the upper function. To do the shading, at the Home screen press 2nd [DRAW] and selectthe Shade command as before. This time, Y1 is the lower function. You may either produce the Y1
character as before or just type in 2X. Type a comma, and then type in 11 or any other numberlarger than Ymax (which is 10 in the Standard viewing window) as the upper function. To see howshading density works, type in another comma, followed by a 3. Type a close parenthesis tocomplete the command, which should look like Shade(Y1,11,3) or Shade(2X,11,3).Press ENTER to graph the solution of the inequality. Notice that with the shading density set at 3,only every 3rd column of pixels is shaded.
Use the ClrDraw command as mentioned earlier to erase the shading. Leave xy 2= as Y1 and
enter as Y2 the equation 3−−= xy . (Be sure to use the negative key (−) in front of the x and the
subtraction key in front of the 3.) Suppose you want to solidly shade all points between x = 2 andx = 5 which lie above Y2 and below Y1. At the Home screen enter the Shade command in thisway: Shade(Y2,Y1,1,2,5). Press ENTER to see the results. To solidly shade all points thatlie above Y2 and below Y1, just enter Shade(Y2,Y1). You can find more discussion of theShade command in the TI-82 Graphics Calculator Guidebook that came with your calculator.
page 29528 Solve
Your calculator has the ability to solve systems of linear equations by using two matrix conceptswhose full development is beyond the scope of the course you are now taking: matrixmultiplication and the inverse of a matrix. You don’t need to worry about how these conceptswork at this point, since the calculator knows how to do the computations. All you need to be ableto do is to set up two matrices associated with the system of equations and have the calculatormultiply the inverse of one by the other, all of which will be explained by working through thefollowing example.

TI-82 23
Suppose you want to solve the system of linear equations below.
253
642
−=+=−
yx
yx
The first matrix, denoted A, which will be needed is called the coefficient matrix, since its rowsconsist of the coefficients of x and y in the first and second equations, respectively.
−=
53
42A
The second matrix needed, denoted B, is called the constant matrix. This matrix consists of thecolumn of constants found to the right of the equal signs in the system of equations.
−
=2
6B
To enter matrix A into your calculator first press the MATRX (matrix) key. Choice 1, whichcorresponds to matrix A (displayed on screen as [A]), should already be highlighted. Use theLeft or Right Arrow key to highlight the EDIT menu at the top of the screen. Press ENTER todisplay the screen used to edit matrix A. Your screens may not look exactly like the ones below,particularly if matrices have been entered into your calculator before, but they should be similar.
MATRX Screen Editing Screen for Matrix A
In the editing screen for matrix A the cursor should be blinking on the first of two numbers at theright part of the screen that indicate the dimensions of the matrix. In the above right illustrationthe dimensions are shown as 11× . The first number indicates the number of rows in the matrix.(A row is a line of numbers going left and right.) The second number indicates the number ofcolumns. (A column is a line of numbers going up and down). The matrix shown above has onlyone row and one column, and thus, only one number in it, in this case 0. Since the matrix A weneed has two rows, with the cursor blinking on the first 1, type a 2 and press ENTER. Thecalculator now displays a 12 × matrix, that is, one with two rows and one column, as shown onthe left at the top of the next page, and the cursor is now in the second dimension number position(blinking on the second 1 in our illustration). Since our desired matrix A has two columns, type a2 and press ENTER. The calculator now displays a 22 × matrix, that is, one with two rows andtwo columns, as shown on the right at the top of the next page.
24 Calculator Keystroke Guide
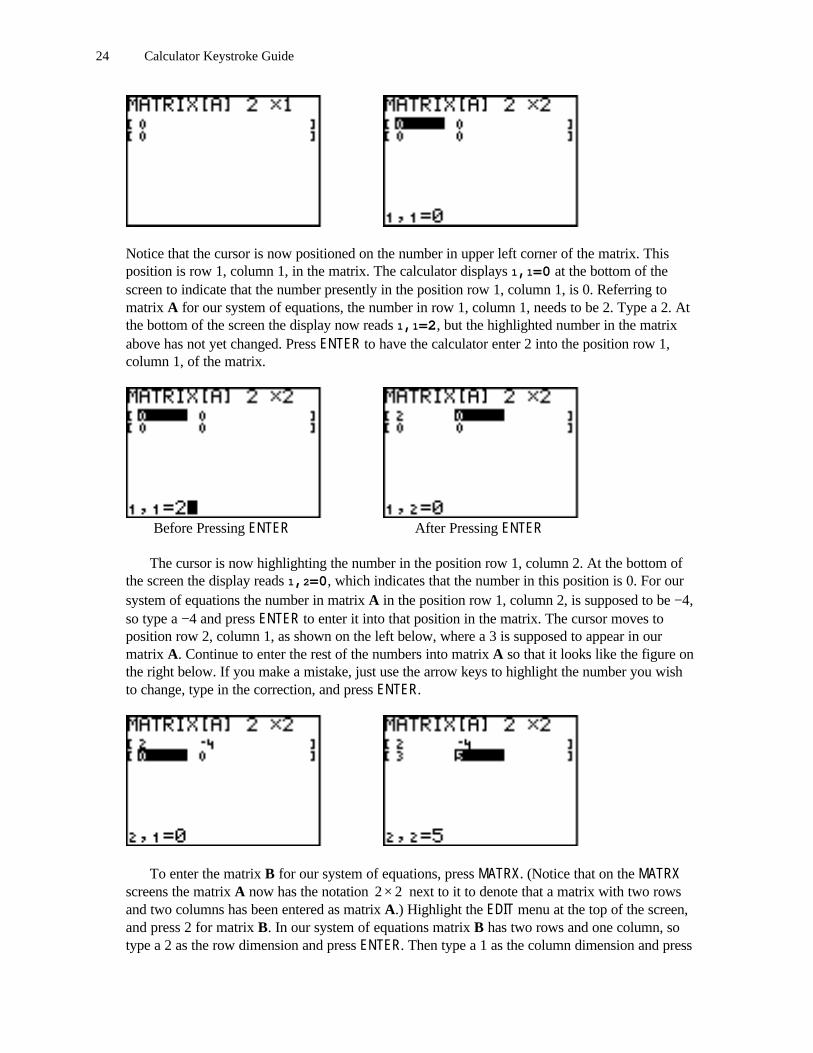
Notice that the cursor is now positioned on the number in upper left corner of the matrix. Thisposition is row 1, column 1, in the matrix. The calculator displays 1,1=0 at the bottom of thescreen to indicate that the number presently in the position row 1, column 1, is 0. Referring tomatrix A for our system of equations, the number in row 1, column 1, needs to be 2. Type a 2. Atthe bottom of the screen the display now reads 1,1=2, but the highlighted number in the matrixabove has not yet changed. Press ENTER to have the calculator enter 2 into the position row 1,column 1, of the matrix.
Before Pressing ENTER After Pressing ENTER
The cursor is now highlighting the number in the position row 1, column 2. At the bottom ofthe screen the display reads 1,2=0, which indicates that the number in this position is 0. For oursystem of equations the number in matrix A in the position row 1, column 2, is supposed to be −4,so type a −4 and press ENTER to enter it into that position in the matrix. The cursor moves toposition row 2, column 1, as shown on the left below, where a 3 is supposed to appear in ourmatrix A. Continue to enter the rest of the numbers into matrix A so that it looks like the figure onthe right below. If you make a mistake, just use the arrow keys to highlight the number you wishto change, type in the correction, and press ENTER.
To enter the matrix B for our system of equations, press MATRX. (Notice that on the MATRXscreens the matrix A now has the notation 22 × next to it to denote that a matrix with two rowsand two columns has been entered as matrix A.) Highlight the EDIT menu at the top of the screen,and press 2 for matrix B. In our system of equations matrix B has two rows and one column, sotype a 2 as the row dimension and press ENTER. Then type a 1 as the column dimension and press

TI-82 25
ENTER (or just press ENTER if the column dimension is already 1), so that the display appears ason the left below. Enter the numbers into the matrix as before until the display appears as on theright below.
Now that the matrices have been entered, press 2nd [QUIT] to return to the Home screen. If youwould like to see matrix A displayed on the Home screen, press MATRX, and with the NAMESmenu highlighted at the top of the screen, press ENTER or 1. The character [A] will be displayedon the Home screen. Press ENTER to have the calculator display matrix A as shown on the leftbelow. Press MATRX 2 to display the character [B] on the Home screen. Press ENTER to seematrix B as shown on the right below. Although you don’t really have to display these matricesbefore solving the system of equations, it isn’t a bad idea to look at them on the Home screen justto be sure that you have entered the numbers correctly. If you notice a mistake, you can still goback and make corrections at the matrix editing screen. After selecting the matrix you want, usethe arrow keys to go to the part that needs to be corrected and type and enter the corrections.
To solve the system we need to find the matrix product BA 1− , where 1A − denotes the inverseof matrix A. (You don’t have to worry about what that inverse is.) On the Home screen thismatrix product will appear as [A]-1[B]. To produce this expression on screen, press MATRX 1to produce the [A]. Then press the 1−x key to produce the exponent 1− . (Do not use ^-1instead.) Finally, press MATRX 2 to produce the [B]. With the screen displaying [A]-1[B],press ENTER to display a 12 × matrix showing, from top to bottom, the values for x and y,respectively, which form the solution of the system of equations.

26 Calculator Keystroke Guide
The value of x in the solution of the system is the top number shown, and the bottom numbershown is the value of y in the solution of the system. Thus, the solution of the system is )1,1( − ;
that is, 1 ,1 −== yx .
page 33829 Evaluate Y
The TI-82 interprets function notation. Just as for a function xxxR −= 24)( the value of the
function when x = −1 can be denoted )1(−R , with the TI-82 the value of Y1 when x = −1 can be
denoted Y1(−1). In the Y= screen enter as Y1 the equation xxy −= 24 . Then press 2nd [QUIT] toreturn to the Home screen. Press 2nd [Y-VARS] and press ENTER to choose the Function... menu.Choose Y1 from this menu by pressing ENTER. The calculator returns to the Home screen, and thevariable Y1 will be displayed on the screen. Now type the number −1 in parentheses so that theexpression Y1(-1) is displayed on screen. Press ENTER to see 5, the value of Y1 when x is −1.To find the value of Y1 when x = 3, press 2nd [ENTRY] to reproduce a copy of Y1(-1), move thecursor over the -, type a 3, and then press DEL so that the expression reads Y1(3). Press ENTERto get the value 33. See also 21 Evaluate Y and 22 Table.
page 38030 Scientific
The TI-82 automatically displays some answers in scientific notation. For example, if youmultiply 658,000 by 240,000, the result is displayed as 1.5792E11. The number following theE is the exponent of the 10 in scientific notation. Thus, the display should be interpreted as1.5792·1011 = 157,920,000,000. Similarly, if you divide 32 by 256,000, the result is displayed as1.25E-4, which means 1.25·10−4 = .000125.
You may also enter numbers into your calculator in scientific notation. For example, if youwant to enter 3.4·107 into your calculator, you would first type in the 3.4. Now press 2nd [EE]. (EEis the second function on the comma key.) Notice that pressing 2nd [EE] produces the letter E onthe screen to indicate that you are about to enter the power of 10 in scientific notation, which inthis case is 7. After typing the 7, press ENTER, and you will see the number displayed as34,000,000. It is displayed in standard numeral form, since the number is small enough for thecalculator to display it that way. If you type in a larger number, such as 2.78·1021, and pressENTER, the calculator will still display the number in scientific notation, since the standardnumeral form is too large for the calculator's maximum 10-digit display.
You can also make your calculator display all results in scientific notation, if you wish, byputting the calculator into Scientific Notation mode. Press the MODE key. There are severalsettings that can be changed in the MODE menu, but the first line is our concern here. The wordNormal is probably highlighted in the first line. Use the Right Arrow key to move the blinkingcursor over the word Sci, and press ENTER. The highlight should now disappear from the wordNormal and be on the word Sci. Return to the Home screen by pressing 2nd [QUIT]. Now type thesum 3 + 9 on the calculator and press ENTER. The result is displayed as 1.2E1, which isscientific notation for 12. As long as the calculator is in Sci mode, all computation results will bedisplayed in scientific notation. To return to the normal display of calculated results, press theMODE key, and with the blinking cursor on the word Normal, press ENTER. Then press 2nd [QUIT]to return to the Home screen.

27
TI-83 INTRODUCTION
On/Off, Contrast, Mode, and EditingExpressions
TURNING THE CALCULATOR ON
When the ON button is pressed, you should see a blinking dark rectangle (called the cursor) in theupper left-hand corner of the screen. The screen you are looking at is called the Home screen, wherebasic computations are performed. If you do not see the blinking cursor, you may need to adjust thedisplay contrast. How that is done will be described next.
ADJUSTING THE DISPLAY CONTRAST (MAKING THE SCREEN LIGHTER ORDARKER)
Even if your display is presently easy to view, you may find that under different lighting conditions youmay need to adjust the display contrast. Also, as the batteries in your calculator become weaker withuse, you will have to make occasional adjustments in display contrast.
If you wish to make the display darker, press the yellow 2nd key and then hold down the Up Arrow(∆ ) key until the desired level of darkness is obtained. If you wish to make the display lighter, press theyellow 2nd key and then hold down the Down Arrow (∇ ) key until the desired level of darkness isobtained. As soon as you release the Up Arrow or Down Arrow key, the arrow keys no longeraffect contrast, and you must press the 2nd key again to make the arrow keys affect the contrast.
Note that when the 2nd key is pressed, an arrow pointing upward appears inside the cursor to let youknow that the 2nd key has been pressed. (Why the arrow pointing upward denotes the 2nd key will beexplained a bit later.) The Up, Down, Left, and Right Arrow keys are the blue keys located in theupper right-hand portion of the keyboard. In many of the other uses we will have for them, they willfunction in the same way as the arrow keys on a computer keyboard.
Experiment with the contrast setting a bit. You will find that when you press 2nd and hold down ∆or press 2nd and hold down ∇ , a cursor with a number in it will appear in the upper right-hand cornerof the Home screen as long as you hold down the Up Arrow or Down Arrow key. Try to adjust the

28 TI-83 Introduction
contrast, and as you do, be looking in the upper right-hand corner of the screen for the contrastnumber. This number indicates how dark, on a scale of 0 to 9, you have made your screen, with 9representing the darkest possible contrast setting. As the batteries in your calculator become weaker,the contrast setting usually needs to be increased to provide the same level of contrast you may haveobtained at a lower setting with fresh batteries. When you need to set the contrast setting to 8 or 9 on aregular basis to see the display clearly, it is time to change batteries.
When is the contrast set appropriately? To some extent it is a matter of personal preference, butthere are some contrast qualities which most people find suitable. The screen is composed of tinysquares, called pixels, which darken to form the cursor, numbers, letters, etc., on the screen. Mostpeople find that the contrast is set about right when the cursor is clearly visible and you can see that itis composed of 7 rows and 5 columns of pixels. You should also just barely be able to see where theother pixels are on the screen, but they should by no means be dark, just barely visible if you lookclosely.
TURNING THE CALCULATOR OFF
Pressing the 2nd key before pressing the ON key activates the ON key's second function, which isprinted in yellow print above the ON key. Notice the word OFF written on the keyboard above the ONkey. Thus, pressing the 2nd key and then the ON key turns the calculator off.
If you forget to turn the calculator off, it will turn itself off after a few minutes of non-use, usingthe Automatic Power Down (APD™) feature. Pressing the ON key turns the calculator back on, andthe screen will appear exactly as it was before the (APD™) feature turned the calculator off.
SECOND FUNCTIONS FOR KEYS—NOTATION
To simplify matters in the future when referring to second functions served by keys, this KeystrokeGuide will simply show 2nd followed by the name of the second function, enclosed in brackets. Forexample, the keystroke sequence for turning the calculator off will be denoted 2nd [OFF]. Thus, theword in brackets is not on the key itself, but it is written above the key in yellow print as the key'ssecond function. This is why, when you press the 2nd key, the arrow pointing upward appears insidethe cursor. It is to remind you to look for the yellow print above a key, rather than what is written onthe key, to determine what that key will do when you press it.
MODE
Before doing some basic computations, it would be a good idea to check the mode settings on thecalculator, which determine how results are displayed. Press the MODE key. The display should appearas shown below.

TI-83 On/Off, Contrast, Mode, and Editing Expressions 29
For now, it would be best to have all of the settings on each line highlighted (black background) asshown. If any of the highlighted settings on your calculator are not the ones shown above, use yourArrow keys to move the blinking cursor over the setting desired and press ENTER. Continue in a likemanner until all of the settings on the left side are highlighted as shown. Press 2nd [QUIT] to return tothe Home screen.
EDITING EXPRESSIONS
Turn on your calculator and type in 723 ×+ . (Don't worry just yet about calculating the value of theexpression.) The calculator displays 3+2*7. Note that the calculator displays multiplication with anasterisk (*). This is a common computer notation for multiplication.
Entering an expression and editing it before evaluationAs you can already see, the TI-83 differs from ordinary scientific calculators in more ways than justbeing able to draw graphs. One of its major advantages as a calculator is that it enables you to see anentire arithmetic expression as you enter it. The TI-83 also lets you easily edit the expression bothbefore and after you evaluate it. To see how to edit, we will change the expression above, replacing the2 with a 4. Use the Left Arrow key (<) to move the cursor until it is over the 2. Type a 4. Theexpression should now look like this: 3+4*7. We will now evaluate the expression. The cursor is stillin the middle of the expression, but that doesn't matter. To evaluate the expression press the ENTER keyin the lower right-hand corner of the keyboard. On the right-hand side of the calculator screen youshould see 31 displayed, which is the value of the expression. Note that the calculator uses standardalgebraic order of operations rules, performing the multiplication before the addition.
Editing an expression after evaluationSuppose you wanted to evaluate 753 ×+ . Since this expression differs from the previous one in onlyone character (5 instead of 4), there is a way we can quickly obtain the new expression from the old.Rather than enter the entire expression again, just press 2nd [ENTRY]. An exact copy of the lastexpression entered is reproduced on the screen. Now use the arrow keys as before to change the 4 to a5, and press ENTER to obtain the value of the new expression, 38.
INS (Insert) and DEL (Delete)Suppose we want to evaluate 6.785.43 ×+ by editing the last expression. If we press 2nd [ENTRY], weget 3+5*7 on the display. Move the cursor over the 5. We have one problem here that we mustrecognize: if we type in 4.85, we will type over part of the expression we want to keep. To avoid that,type the 4 over the 5, and then press 2nd [INS], which puts the calculator in Insert mode. Note that thecursor becomes a blinking underline. That means that the character at the cursor position and all thoseto the right of it will be moved to the right to make room for some inserted symbols. Type in theremaining .85 to complete the 4.85 and see how the other characters are moved to the right to makeroom. Now use the arrow keys to put the cursor at the end of the expression. Note that as soon as youmove the cursor with an arrow key, the calculator leaves Insert mode. We are now going to change 7 to7.6. Since the cursor is at the end of the expression, the calculator need not be in Insert mode to makethis change (though it would make the change just the same if it were in Insert mode). After the 7 typein .6, and press ENTER to display the value of the new expression, 39.86.
Now suppose we want to evaluate 6.72.53 ×+ by editing the last expression. Press 2nd [ENTRY] toreproduce the last expression, and use the arrow keys to place the cursor over the 4. Type in 5.2. Since5.2 contains one less character than 4.85, the last digit of the 4.85 is still on the screen and must be

30 TI-83 Introduction
eliminated. The cursor should now be resting on this last digit (5) of the old 4.85. Press the DEL key todelete this character. (Each time the DEL key is pressed, it deletes the character at the cursor position.)Press ENTER to display the value of the expression, 42.52.
Next, suppose we want to evaluate 853 ×+ . Notice that we could produce this expression byediting the last expression we evaluated, but it really looks more like the expression 3+5*7, which weevaluated some time earlier. One of the nice features of the TI-83 is that it stores as many previousentries as it can. Press 2nd [ENTRY] once to produce the last expression. Now press 2nd [ENTRY] again.Note that you now see the next-to-last expression we evaluated. If you press 2nd [ENTRY] one moretime, you will see the expression we evaluated before that, which was 3+5*7. You may now edit thisexpression as before to produce 3+5*8. Press ENTER to evaluate it. If you continue to press 2nd[ENTRY] beyond the calculator's ability to recall previous entries, it will return you to the most recentlyevaluated expression.
Clearing the Home screenBy now your Home screen may look pretty full, and the original expressions you entered may havescrolled off the top of the screen. Any time you want to erase everything on the Home screen, just pressthe CLEAR key, located below the arrow keys. If you want to retrieve these erased expressions, you maystill do so by pressing 2nd [ENTRY] as often as needed.

31
TI-83 GRAPHING CALCULATORKEYSTROKE GUIDEAs you look at the pages in your textbook, you will notice that on some pages a book icon & appearswith a brief description of a feature on your TI-83 graphing calculator. In this guide the page numberin the textbook on which each of these book icons occurs is shown, as well as the key word or phrasewhich appears next to the icon, followed by a detailed description of how to use this feature on yourTI-83. Each feature is also given its own number for easy reference.
page 31 Divide
The symbol ÷ appears on the division key of the TI-83, but on the screen division is indicated bythe diagonal slash /. Do the division 24 divided by 6 by pressing 24 ÷ 6 ENTER. Note that on theHome screen the division appears as 24/6, which means the same thing, and the result is still 4.
Fractions may also be entered as divisions. For example, the fraction 43 may be interpreted as
3 divided by 4. You may enter the fraction that way on your calculator. On the screen you will see3/4. When you press ENTER, you will see the decimal equivalent of .75. (See also 13 Fraction.)
page 42 Decimal
Press the MODE key. Notice that on the second line of mode settings the word Float is probablyhighlighted. If not, move the blinking cursor over the word Float and press ENTER. Press 2nd[QUIT] to return to the Home screen. Unless the computation comes out exactly using fewer digits,when the calculator is set to Float mode, the calculator displays 10 digits, and the decimal pointoccurs at its appropriate place in the 10-digit display. As a result, sometimes more digits aredisplayed to the right of the decimal point on some computations than others. The decimal point"floats" to wherever it should be in the 10-digit display for a given computation. For example,perform the following three divisions: 17÷8, 368÷7, and 9543÷7. Since the computation of 17÷8comes out exactly at the third decimal place, the calculator displays only the number of decimalplaces needed to show the result: 2.125. The other two computations do not come out exactly, nomatter how many decimal places are used, so the calculator displays ten digits and locates thedecimal point where it should occur in the 10-digit display: 368÷7 = 52.57142857 and9543÷7 = 1363.285714. Notice how in these last two computations the first displays ten digitswith eight of them to the right of the decimal point, while the last also displays ten digits but withonly six of them to the right of the decimal point.

32 Calculator Keystroke Guide
Suppose instead that you want your calculator to automatically round computations to a fixednumber of decimal places. Press the MODE key again. The second line of the Mode screen readsFloat 0123456789. To make the calculator automatically round all calculations to twodecimal places, on the second line of the MODE screen use the arrow keys to move the blinkingcursor over the number 2 and press ENTER. Press 2nd [QUIT] to return to the Home screen. Now ifyou do the same three computations above again, the calculator will display the results roundedwith only two digits to the right of the decimal point (that is, rounded to the nearest hundredth):17÷8 = 2.13, 368÷7 = 52.57, and 9543÷7 = 1363.29. When you are through making thecalculator round to two decimal places, it would probably be best to return to the MODE menu andchange the setting back to Float.
page 43 Square Root
The square root is the second function on the x2 key. (Note the square root sign ð printed abovethe x2 key in yellow print.) To produce a square root sign on the Home screen display, first pressthe yellow 2nd key and then press the x2 key to produce its second function, the square root sign.In the future, this key sequence will be denoted 2nd [ ð ] , where the second function of the key isenclosed in brackets. Other keystrokes involving the 2nd key will be denoted in a similar fashion.The expression in the brackets should be found printed above one of the keys on the keyboard.Note that what actually appears on the screen is the square root sign, followed by an openparenthesis: ð(. The number or mathematical expression whose square root you wish to evaluateis called the argument of the square root. The TI-83 requires that the argument of the square rootbe enclosed in parentheses. The calculator does you the favor of typing the open parenthesis foryou. After you have typed in the number or expression, you should end it with a close parenthesis:).
Unlike with most scientific calculators, with the graphing calculator you enter the square rootsign first. To find the square root of 324, use the following keystrokes: 2nd [ ð ] 324) ENTER. Onthe Home screen you will see ð(324). The value of this square root, 18, should have appearedon the right of the screen after you pressed ENTER.
Note that the calculator does the square root of the number or expression enclosed in
parentheses immediately following the square root sign. If you want to compute 187 + , youshould group the sum in parentheses, ð(7+18), to indicate that the sum is to be computed beforethe square root is taken. (The correct value of this expression is 5.) If you want to compute the
value of 79 + , where the square root is to apply only to the number 9, you must be sure to puta close parenthesis after the 9 when you enter this expression into the calculator: ð(9)+7. Thevalue of this expression is 10. If you forget to type the close parenthesis, the calculator willassume that you wanted a close parenthesis at the end of the expression. Thus, in the lastexample the calculator would interpret ð(9+7 as being the same as ð(9+7), which is the squareroot of 16, or 4.
page 114 Add
The addition key + is on the right-hand side of the keyboard with the other basic operation keys(subtraction, multiplication, and division). Basic addition is done as it is on most other kinds of

TI-83 33
calculators: the expression containing addition may be entered just as it appears in print or whenwritten by hand. To evaluate the expression once you have typed it in, press ENTER. For example,to evaluate 7 + 15, type this expression just as it appears and press ENTER to display the value22.
To add expressions involving negative numbers, such as 5 + (−8), you may type thisexpression just as it appears, using the parenthesis keys, and pressing ENTER to obtain the value−3. Be sure you use the gray negative key—not the blue subtraction key—when you type in the−8. (See 5 Negative and Subtract.) It turns out that you could also type in this expression
without using the parentheses, and it will still work: 5 + −8 will still produce the value −3.
page 115 Negative and Subtract
You may have noticed that the calculator has two keys with a minus sign on them. The gray (–)key in the bottom row of keys is actually the negative key. The negative key is used only towrite the negative of a number. The following numbers and expressions would be entered usingthe gray negative key:
)6/(54146*75 −+−−−
The blue key in the right-hand column on the keyboard is the subtraction key. It is groupedwith the other keys used to perform the basic four arithmetic operations (addition, subtraction,multiplication, and division). The subtraction key is used between two numbers to indicatethat a subtraction is to be done. The following expressions would be entered using the bluesubtraction key:
)43(6527*13817 +−−−
You can tell which of these keys has been used from the screen display, if you look closely.The negative sign produced by the negative key is one pixel (dot) shorter and placed one pixel rowhigher than the subtraction sign produced by the subtraction key.
Be aware that it is a common mistake among new users of the TI-83 to press the wrong one ofthese two keys. Sometimes you will get an error message on the calculator screen when you pressENTER to evaluate an expression. Other times the calculator will do something different fromwhat you intend.
For example, suppose you wanted to do the subtraction 8−5 on the calculator. First do it thecorrect way with the blue subtraction key and press ENTER to evaluate it. Of course, you shouldget 3 as the answer. Now enter it the wrong way by using the gray negative key between the 8 andthe 5 and press ENTER to evaluate it. You get an error message (ERR: SYNTAX, which you canread more about some other time in the Error Conditions portion in the back of the manual whichcame with your calculator). What happened? The calculator does not interpret the negative key asmeaning to subtract. The calculator sees this last expression as two numbers written side by side,8 and −5, with no indication of which operation you wanted to perform on them. Therefore, thecalculator doesn't know what you want done with these numbers. That's why it gave you an errormessage. The calculator is smart enough, however to know where the problem probably lies.
34 Calculator Keystroke Guide
Notice that with the error message you have two choices: Goto (go to the error) and Quit. ChooseGoto by pressing 1 or by pressing ENTER (since choice 1 is already highlighted). The calculatorreturns to the Home screen with the cursor blinking on the negative sign that should have been asubtraction sign. While the cursor is there, type a subtraction sign, which will replace theincorrect negative sign, and then press ENTER to evaluate the expression. Now the problem hasbeen fixed.
page 116 Multiply
The TI-83 interprets the following as indicating multiplication: the multiplication key ×, numbersor expressions written in side by side in parentheses, numbers and letters written side by side, andletters written side by side. If you type 63 × , the calculator will display it as 3*6. The asterisk *is a common computer notation for multiplication. When you press ENTER, the calculator willdisplay the value 18. If you place one or both of the numbers in a multiplication in parentheseswithout using the multiplication key, the calculator still knows that you mean to multiply. Thus,the calculator will also produce 18 if you enter 63 × as 3(6), (3)6, or (3)(6). Parenthesesmay also be used for grouping calculations to be done in a certain order. Thus, the calculatorinterprets 5(3+4) as meaning to add 3 + 4 first to get 7, and then to multiply 5 times the 7 to get35.
As an example of placing numbers and letters side by side, the calculator interprets 3X asmeaning "3 times X." (How to enter letters will be discussed later.) To see how this way ofwriting multiplication works, try typing in 2π, where π (the Greek letter pi) represents that specialnumber having to do with circles. The value of π is approximately 3.141592654. Your calculatorhas this special number as the second function on the caret key ^. (You should see the symbol πprinted above the caret key in yellow type.) To type in 2π, type the 2 and then press the yellow2nd key and then the caret key. (In the future we will denote these last two keystrokes as 2nd [π].)Your calculator should display 2π. Press ENTER to see the value 6.283185307, which is twotimes the value of π.
page 117 Divide
See 1 Divide.
page 128 Exponent
The caret key ^ is used to enter most exponents. For example, the expression 52 , is entered intothe calculator as 2^5. Thus, the base is entered first, then the caret, and then the exponent. PressENTER to produce this expression’s value, 32. To raise a negative number to a power, it isnecessary to enclose the negative number base in parentheses. For example, to raise the number
−3 to the fourth power the expression must be written as 4)3(− . Likewise, we must enter this
expression into the calculator as (-3)^4. The result is 81. Without the parentheses, -3^4
would (and should) be interpreted as taking the negative of 43 . That is, -3^4 is interpreted as
81)81()3(3 44 −=−=−=− .

TI-83 35
Two special exponents that can be produced on screen as raised exponents are the exponents
2 and 3. To enter the expression 25 you could use the standard approach of typing 5^2, or you
could instead type the 5 and then press the 2x key. The 2x key produces only the raised exponent2 on the screen, not the x. Either way, the calculator produces the result of 25 when you press
ENTER. To produce a raised exponent 3, as in the expression 34 , first type 4 and then press theMATH key. The calculator will display the MATH menu. Choice 3 on the MATH menu is the raisedexponent 3. Select it by pressing 3 (or by using the Down Arrow key to highlight the number 3and pressing ENTER). The MATH menu will then disappear, and the calculator will display 43.Press ENTER to display the value of the expression, 64.
page 129 Square Root
See 3 Square Root.
page 1410 Absolute Value
The absolute value of a number is the number's distance from zero on the number line. On the TI-83 the absolute value is denoted abs. To produce the absolute value character, first press MATH.Then use the Right Arrow key to highlight the NUM menu heading at the top of the screen. Choice1 on the NUM menu is abs( . Either press ENTER, since choice 1 is already highlighted or press 1to produce abs( on the screen. When we write the absolute value of −7 with pencil and paper,we enclose the number within two vertical bars: 7− . On the calculator the absolute value of −7
is denoted abs(-7). As was the case with the square root, on the TI-83 the number orexpression (called the argument) whose absolute value is to be evaluated must be enclosed withinparentheses. The calculator again saves you a bit of typing by producing the open parenthesiswith the abs. To produce abs(-7)on your Home screen, first use the keystrokes describedabove to produce abs( on screen. Then type in −7 (being sure to use the gray negative key), andclose the parentheses. Press ENTER to find the absolute value of −7, which is 7.
As was the case with square roots, the calculator takes the absolute value of the number orexpression enclosed in parentheses immediately to the right of the abs symbol. To evaluate
517 +− put the expression 517 +− inside the parentheses, since the addition is to be done
first: abs(–17+5). The result is 12, since 1212517 =−=+− . If you want to compute the
value of 517 +− , where the absolute value is to apply only to the number 17− , you must be
sure to put a close parenthesis after the 17− when you enter this expression into the calculator:abs(-17)+5. The value of this expression is 22, since 22517517 =+=+− . If you forget
to type the close parenthesis, the calculator will assume that you wanted a close parenthesisat the end of the expression. Thus, the calculator would interpret abs(-17+5 as being thesame as abs(–17+5), which is 12, as noted earlier. To evaluate 25 +− you would type in
abs(-5)+abs(2)and press ENTER to obtain the value 7.
To multiply the absolute value of −4 by the absolute value of 10, 104 ⋅− , you could use
the multiplication key to type in abs(-4)*abs(10), or you could just put the two absolutevalues side-by-side with no symbol in between: abs(-4)abs(10). The calculator still knows

36 Calculator Keystroke Guide
you mean that these two absolute values are to be multiplied. The value of this expression is 40,since 40104104 =⋅=⋅− .
page 2111 Reciprocal
Since the reciprocal of an integer, such as 5, may be written as 51 , it may be entered into the
calculator as we would enter any fraction of this type: 1/5, using the division key ÷ to producethe diagonal slash / on the screen. Similarly, the reciprocal of a fraction, such as 8
5 , may be
written by interchanging the numerator and denominator: 58 , appearing as 8/5 on screen.
Another way to enter the reciprocal of a number is to use the 1−x key. For reasons that will
be explained later, the reciprocal of 4 may be written as 14− . To produce this expression on
screen, press 4; then the 1−x key, which produces only the exponent −1, not the x. Press ENTER todisplay the value of the expression, .25, which of course is the decimal equivalent of 4
1 .
page 2712 Negative
See 5 Negative and Subtract.
page 3513 Fraction
Fractions may be entered into the calculator by using the division key ÷ to produce a diagonalslash fraction bar. The TI-83 can perform operations on fractions and give answers in either
decimal or fraction form. Enter the expression 2
1
6
5− by typing 2165 ÷−÷ . The expression will
appear on the Home screen as 5/6-1/2. Press ENTER to get the decimal form of the value ofthis expression (approximately .3333333333). If you prefer to get your answer in fractional form,you must do one extra thing before pressing ENTER. To see how to get a fractional answer, eithertype in the original expression again or use 2nd [ENTRY] to reproduce it on the Home screen. Withthe cursor at the end of the expression, press the MATH key. Choice 1, which is alreadyhighlighted, is ∑Frac, which converts the preceding expression to fractional form, if it can. Press 1or ENTER (since choice 1 is already highlighted). The display will return to the Home screen,where the fraction conversion symbol will appear after the expression: 5/6-1/2∑Frac. Nowpress ENTER to see the fractional value of the expression (one-third).
page 7314 Store
The STO> key is used to store a particular number value in a variable (letter). That is, it assignsa specific numerical value to a letter. If you wish to make the letter B represent the value 7, thenyou must store the value 7 in the letter B. To do this, first type the number 7 and then press theSTO> key. Notice that an arrow appears on screen next to the number 7. To type the letter B (orany other letter) first press the green ALPHA key. Note that the cursor has changed: there is a letterA inside the cursor, which indicates that the calculator is in Alpha mode. You may have noticedthat letters of the alphabet appear in green above many of the keys on your calculator. When thecalculator is in Alpha mode, as it is now, and you press one of these keys, it produces on screen

TI-83 37
the letter of the alphabet shown above the key, rather than performing its usual function. Sinceyou want to store the value 7 in the letter B, press the key that has the letter B printed above it: theMATRX key. Your screen should now show 7→→B. The calculator doesn't actually store 7 in theletter B until you press ENTER, which you should do now. From now on, until you change thevalue stored in B, the calculator assigns the value 7 to the letter B. Even turning the calculator offwon't erase this result. To type in 3B, type 3 and then press the green ALPHA key to put thecalculator into Alpha mode. (When you do, the letter A should appear inside the cursor.) Thenpress the MATRX key, which has the letter B printed above it. Press ENTER to display the value of3B (3 times B), which is 21, since 3B = 3(7) = 21.
page 8215 Alpha
To type letters of the alphabet, which are printed above many of the keys, the calculator must bein Alpha mode. To put the calculator in Alpha mode for one keystroke only, press the greenALPHA key and then press the key that has the desired letter printed in green above it. When youpress the ALPHA key, the calculator lets you know it is in Alpha mode by displaying the letter Ainside the cursor. (If the calculator is also in Insert mode because 2nd [INS] was pressed first, theInsert mode underline cursor will have an A printed above the underline.) For example, to producethe letter P on screen, press the ALPHA key to put the calculator in Alpha mode and then press the8 key, which has the letter P printed above it. Notice that after you press the 8 key, the calculatoris no longer in Alpha mode.
If you wish to type several letters in succession, the calculator may be locked in Alpha modeby pressing 2nd [A-LOCK]. Try using this feature to spell the word CAVE. Press 2nd [A-LOCK] andthen type in the four letters as they are found above the keys. Notice that the calculator stays inAlpha mode the entire time. To escape from Alpha mode, press the ALPHA key again. The Ashould disappear from inside the cursor. (If you had pressed the ENTER key, the calculator wouldalso have left Alpha mode.) You may have noted the unusual Alpha character written above thezero key: ς . It represents the spacebar. This character does not show up on screen, but rather thisAlpha character produces a blank space on screen.
page 8616 Window and Default
The WINDOW screen lets us determine which part of the coordinate plane will be displayed on thecalculator when a graph is drawn. The part that is displayed is sometimes called the viewingrectangle or graphing window. The default viewing rectangle, which on your calculator is calledthe Standard window, is a graphing window in which the displayed values of x and of y varyfrom −10 to 10, with tick marks (little scale markings on the axes) occurring one unit apart onboth axes. There are two ways of setting your calculator to this Standard (default) viewingwindow. The first is to set it manually. Press the WINDOW key. The Window settings displayedmay be changed by using the arrow keys to move the cursor to the proper line and by typing overthe existing values. The first number, denoted Xmin, represents the smallest value of x to bedisplayed on the graphing window. Xmin indicates the value of x at the extreme left edge of thegraphing window when it is displayed. On the Standard (default) viewing window Xmin = −10.Xmax represents the largest value of x to be displayed on the graphing window. Xmax indicatesthe value of x at the extreme right edge of the graphing window. On the Standard (default)viewing window Xmax = 10. Xscl indicates the distance between tick marks on the x-axis. On theStandard (default) viewing window Xscl = 1. Ymin represents the smallest value of y to be

38 Calculator Keystroke Guide
displayed on the graphing window. Ymin indicates the value of y at the very bottom of thegraphing window when it is displayed. On the Standard (default) viewing window Ymin = −10.Ymax represents the largest value of y to be displayed on the graphing window. Ymax indicatesthe value of y at the very top of the graphing window when it is displayed. On the Standard(default) viewing window Ymax = 10. Yscl indicates the distance between tick marks on the y-axis. On the Standard (default) viewing window Yscl = 1. Xres indicates how often the calculatorwill compute and plot a point on the graph. Generally, Xres should be set at the value 1 and leftthat way. Unless a specific situation calls for Xres to be changed, you should assume fromnow on that the value of Xres should be 1.
In summary, when you have set the Window settings to the Standard (default) values, thescreen should display the following:
Xmin=-10Xmax=10Xscl=1Ymin=-10Ymax=10Yscl=1Xres=1
To see this Standard (default) viewing window for graphs, display the Graph screen bypressing GRAPH. Your screen should display a graphing window like the one shown in Figure2.10 on page 86 of your text.
To see another graphing window, press the WINDOW key, change the settings as shown below,and then press GRAPH again to see this different graphing window:
Xmin=-4Xmax=12Xscl=2
Ymin=-50Ymax=80Yscl=25
The left edge of the screen is at x = −4, and the tick marks on the x-axis are 2 units apart, so thefirst tick mark to the right of the origin on the x-axis represents 2, the next one to the right of itrepresents 4, the one after that 6, etc. On the y-axis the mark at the very bottom of the screenrepresents −50, and the tick marks on the y-axis are 25 units apart, so the first mark above theorigin on the y-axis represents 25, the next one above it represents 50, and the next represents 75.Since the value of y at the very top of the screen is 80 (Ymax), notice that the y-axis extends just abit above the tick mark representing 75.
There is a second way to produce the Standard (default) viewing window on your calculator.Any time you wish to return the Window settings to the Standard (default) settings, just press theZOOM key and press 6 to select the Standard viewing window (ZStandard). (From now on, this

TI-83 39
keystroke sequence will be denoted ZOOM 6.) The graphing window will then be displayed withthe Standard (default) settings. To verify that the calculator has changed the Window settings tothe Standard (default) values, press the WINDOW key to view the settings. Any time you wish toreturn to the Home screen from any of these other screens, just press 2nd [QUIT].
page 8617 Integer
Sometimes we want to have a graphing window that will display integer coordinates, rather thanthe lengthy decimal coordinates that often arise with other graphing windows. Such a viewingrectangle is called an Integer graphing window. Although an Integer graphing window may beproduced beginning from any set of Window settings, press ZOOM 6 to display the Standard(default) viewing window. Press the ZOOM key once more. Notice the arrow pointing downward atthe bottom of the screen next to choice 7. That arrow indicates that the Zoom menu has moreitems in it which may be viewed by pressing the Down Arrow key to scroll the menu downward.Press the Down Arrow key several times (or hold it down) until the highlight is on 7. Now pressthe Down Arrow key once more. Notice that the menu has scrolled downward to reveal a choice 8,which is ZInteger. Choose ZInteger either by pressing 8 or by moving the highlight to 8 andpressing ENTER. The calculator will display the as-yet-unchanged graphing window, and therewill be a set of coordinates displayed at the bottom of the screen which represent the coordinatesof a small free-moving cursor, which may be a bit hard to see, since it is at the origin. (You maysee a blinking pixel at the origin.) Press the Up Arrow and Right Arrow keys a few times so thatyou get a better look at this free-moving cursor. This cursor should be moved to approximatelythe coordinates of the point you want to have in the center of the screen after the calculator createsthe Integer graphing window. If you wish to have the point (7,5) at the center of the Integergraphing window, then move this free-moving cursor to a point as close to (7,5) as possible. Thatis, move the cursor with the arrow keys until the coordinates displayed at the bottom of the screenare as close as you can get them to x = 7 and y = 5. (From the Standard graphing window, theclosest you can come is probably x = 7.0212766 and y = 4.8387097.) Press ENTER to produce theInteger graphing window centered at (7,5). Press the Right Arrow key to produce a larger free-moving cursor one pixel to the right of the center of the screen. (See 19 Cursor for more detailsabout this cursor.) Note that the coordinates of the cursor are (8,5). Press the Left Arrow key toreturn to the center of the screen, which is at (7,5). Press other arrow keys and note that everytime you press the Left Arrow key or the Right Arrow key, the value of x remains an integer andchanges by 1. Likewise, every time you press the Down Arrow key or the Up Arrow key, thevalue of y remains an integer and changes by 1. You may want to look at the Window settings tosee how things have been changed.
Press the GRAPH key again to display the graphing window. If you want to change thecoordinates of the center to some other point, such as the origin (0,0), press ZOOM 8, move the

40 Calculator Keystroke Guide
cursor to (0,0), and press ENTER. A new Integer graphing window will be produced, this timecentered at the origin. Use the arrow keys to verify that this change has taken place.
page 8618 Graph
See 16 Window and Default first to learn how to set the left, right, bottom, and top of thegraphing window with the Window settings. To see the graphing window you have selected, pressGRAPH.
page 8719 Cursor
Press the GRAPH key to display the graphing window. (It doesn't matter which graphing windowyou are using, nor does it matter if graphs are displayed.) Press one of the arrow keys. (It doesn'tmatter which one.) You will notice that near the center of the screen there is a cross hair, and atthe bottom of the screen there are values for x and y which represent the coordinates of the crosshair. If you cannot see the cross hair clearly because it lies on one of the axes, press the Up Arrowkey a few times and the Right Arrow key a few times to get the cross hair away from the axes.You may notice that when you do this, the coordinates displayed at the bottom of the screenchange to reflect the changed position of the cross hair. This cross hair may be moved to any partof the graphing window by using the arrow keys. The cross hair is sometimes called the generalcursor or free-moving cursor. To turn this general cursor off, just press the GRAPH key.
page 9220 Enter Function
See also 16 Window and Default and 18 Graph. To graph an equation, to use an expressionrepeatedly for computations, or to generate a table of values of an expression (See 22 Table.)such as 2 3x − , the expression first needs to be entered in the Y= screen. First press the Y= keyand erase any old expressions by placing the cursor on the expression to be erased and pressingCLEAR. Then type 2X−3 to the right of the equal sign next to Y1. The easiest way to produce theletter X on the screen is to press the X,T,θ,n key. To see the graph of this equation, just press theGRAPH key. The graph will be displayed on the graphing window with the Window settings youselected. (Refer to 16 Window and Default.) Using the Standard viewing window, you should seethe graph of a straight line as shown below.
Xmin=-10Xmax=10Xscl=1
Ymin=-10Ymax=10Yscl=1
You may graph up to ten equations on the same graphing window, using the Y= screen todefine the equations to be graphed. (There are ways to produce more than ten graphs on thegraphing window, but we won't discuss that here.) For example, press the Y= key, keepY1=2X−3, and move the cursor down to the right of the equal sign for Y2 and type X2. (Use the x2
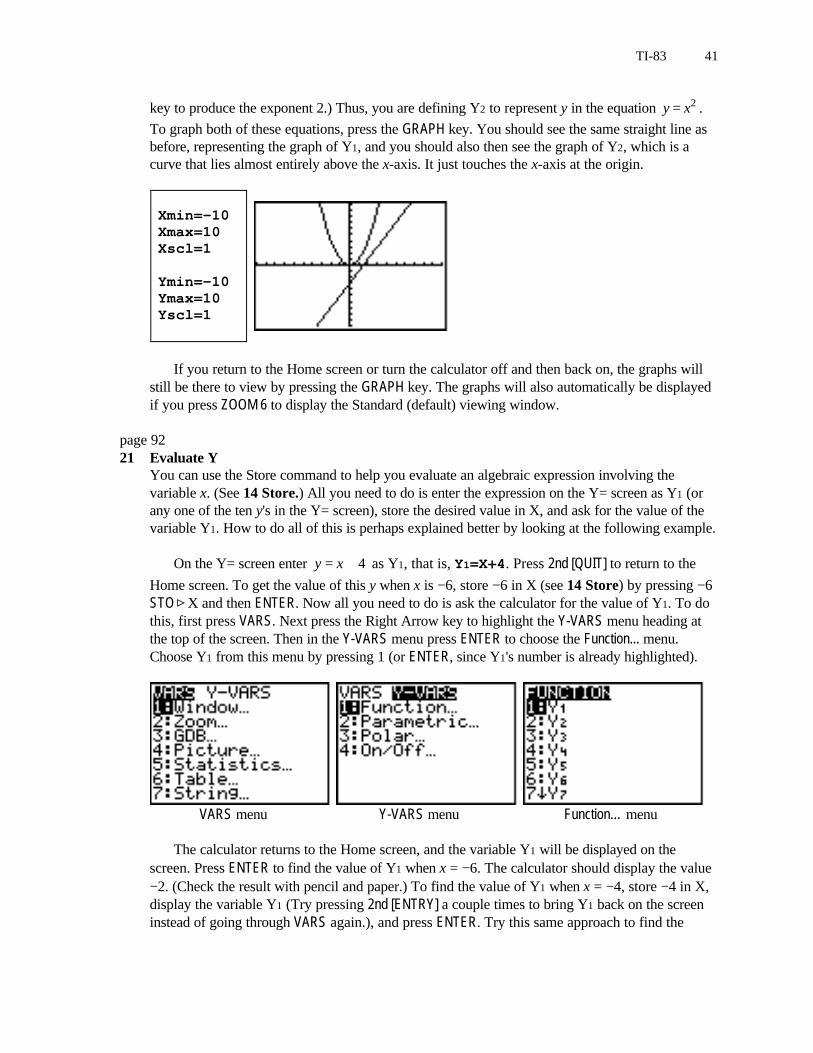
TI-83 41
key to produce the exponent 2.) Thus, you are defining Y2 to represent y in the equation y x= 2 .
To graph both of these equations, press the GRAPH key. You should see the same straight line asbefore, representing the graph of Y1, and you should also then see the graph of Y2, which is acurve that lies almost entirely above the x-axis. It just touches the x-axis at the origin.
Xmin=-10Xmax=10Xscl=1
Ymin=-10Ymax=10Yscl=1
If you return to the Home screen or turn the calculator off and then back on, the graphs willstill be there to view by pressing the GRAPH key. The graphs will also automatically be displayedif you press ZOOM 6 to display the Standard (default) viewing window.
page 9221 Evaluate Y
You can use the Store command to help you evaluate an algebraic expression involving thevariable x. (See 14 Store.) All you need to do is enter the expression on the Y= screen as Y1 (orany one of the ten y's in the Y= screen), store the desired value in X, and ask for the value of thevariable Y1. How to do all of this is perhaps explained better by looking at the following example.
On the Y= screen enter 4+= xy as Y1, that is, Y1=X+4. Press 2nd [QUIT] to return to the
Home screen. To get the value of this y when x is −6, store −6 in X (see 14 Store) by pressing −6STO> X and then ENTER. Now all you need to do is ask the calculator for the value of Y1. To dothis, first press VARS. Next press the Right Arrow key to highlight the Y-VARS menu heading atthe top of the screen. Then in the Y-VARS menu press ENTER to choose the Function... menu.Choose Y1 from this menu by pressing 1 (or ENTER, since Y1's number is already highlighted).
VARS menu Y-VARS menu Function… menu
The calculator returns to the Home screen, and the variable Y1 will be displayed on thescreen. Press ENTER to find the value of Y1 when x = −6. The calculator should display the value−2. (Check the result with pencil and paper.) To find the value of Y1 when x = −4, store −4 in X,display the variable Y1 (Try pressing 2nd [ENTRY] a couple times to bring Y1 back on the screeninstead of going through VARS again.), and press ENTER. Try this same approach to find the

42 Calculator Keystroke Guide
value of Y1 when x is 0, 2, and 5. The answers may be found in Example 1 on page 93 of yourtext.
On the TI-83 there are other ways to evaluate an expression. One way relates the results tothe graph. Graph the equation 4+= xy mentioned above, using the Standard viewing window
(Zoom 6).
Press 2nd [CALC] to display the Calculate menu. Press 1 or ENTER to choose the valuecommand. The Graph screen is displayed, and at the bottom of the screen appears X=, followedby a cursor. Type in the value of x you want, such as −6 in the example above. When you pressENTER, the coordinates of the point on the graph where x = −6 appear at the bottom of the screen:X=-6 Y=-2, and a cross cursor appears on the graph to indicate where that point is. If you havemore than one graph drawn, press the Down Arrow key to see the values of y for the otherequations at the given value of x.
An easier way to produce an X= value cursor at the bottom of the graph is to press TRACEand type in the desired value of x, such as −6. As soon as you begin to type in the number, the X=value cursor will appear at the bottom of the screen. Pressing ENTER after typing in the desiredvalue of x moves the Trace cursor to the corresponding point on the graph. (See 23 Trace.) Seealso 22 Table for still another way to evaluate a Y variable for any desired values of x.
page 9222 Table
The TI-83 graphing calculator has a TABLE feature, which constructs a table of values of thevariable X and the corresponding values of the Y-variables. In the Y= screen enter the expression
32 +x as Y1. Now press 2nd [TblSet] (the second function of the WINDOW key). You should nowsee the Table Setup screen, as shown below.
Suppose you want the table to begin with the value x = −3. The cursor should be on theTblStart line. Type in −3 and press ENTER or use the down arrow key. The cursor will then go to

TI-83 43
the ∆Tbl line. ∆Tbl is the amount by which x will change as you move from row to row in thetable. Suppose you want the value of x to change by one (1) as you move from row to row. Typein 1 (if that is not already the value). Both the Indpnt and Depend settings should be on Auto. TheTable Setup screen should now appear as it does below.
Now press 2nd [TABLE]. (TABLE is second function on the GRAPH key.) The calculator shoulddisplay a table of values of x and Y1, as shown below.
The highlight is now on the initial value of x, which we had decided would be −3. Press theDown Arrow key until the number 3 is highlighted. Now watch the screen as you press the DownArrow key once more. Note that the table has "scrolled" down one row: the old first row no longerappears, all the other rows have moved up one, and a new last row (where x is 4) appears. Pressthe Down Arrow key again to make the table scroll again. Try it a few more times. Try holdingdown the Down Arrow key for a few seconds to see how the table continues to scroll downwardthrough larger values of x. Press the Up Arrow key until the top number is highlighted. Nowwatch the screen as you press the Up Arrow key once more. Note that the table has scrolled upone row. Press the Up Arrow key again to make the table scroll up again. Try it a few more times.Try holding down the Up Arrow key for a few seconds. Note that the screen scrolls upward. Thefirst value of x we used was −3. You can scroll back to that starting point by using the Up Arrowkey. Note that if you get −3 to be the top number in the X column, you can continue to press theUp Arrow key and have the table scroll up, showing more negative values of x. Any time youwant to leave the table and return to the Home screen, just press 2nd [QUIT].
There is yet another way to evaluate an expression on the TI-83 for your own list of values ofx, using the Table feature. Press 2nd [TblSet ] (the second function on the WINDOW key). Ignore thevalues of TblStart and ∆Tbl for now, and use the arrow keys to move the blinking cursor to the lineheaded Indpnt. Move the cursor over the word Ask and press ENTER. On the line headed Dependmove the cursor over the word Auto and press ENTER.

44 Calculator Keystroke Guide
Now press 2nd [TABLE] (the second function on the GRAPH key) to display a table. Type in anyvalue of x you want, such as 3 in the example above. Press ENTER to see the value of Y1 (and anyother Y's you may have) displayed in the table. Choose any other values of x you want and use thesame procedure to evaluate your Y-variables.
page 9423 Trace
When you have displayed a graph of an equation, you may trace along points on the graph byusing the Trace cursor. For example, clear out any old equations from the Y= screen and enter asY1 the expression 4+x . To get an Integer graphing window (see 17 Integer) on your calculatorwhich corresponds most closely to the graphing window shown in Figure 2.18 on page 94 in thetext, first press ZOOM 6 to get the Standard (default) viewing window. Then press ZOOM 8, andwith the cross-hair cursor still near the origin, press ENTER to create the desired Integer graphingwindow. (You may want to look at the Window settings to see that they are similar to—but notexactly the same as—those shown in Figure 2.18, which are for a different calculator model.)
To activate the Trace cursor, press the TRACE key. A cursor will appear on the graph of theequation, and the coordinates of the cursor will appear at the bottom of the screen. In the upperleft-hand corner of the screen you will also see the equation which is being traced. (If you do notsee the equation when you press TRACE, press 2nd [FORMAT] and be sure that ExprOn ishighlighted.) To move the cursor along the graph and display the coordinates of other points onthe graph, use the Left and Right Arrow keys. Unlike the general cursor (see 19 Cursor), theTrace cursor always stays on the graph and displays only coordinates of points which are on thegraph. To turn the Trace cursor off, press GRAPH.
If more than one graph is displayed, the Trace cursor may be made to trace along each graphlisted on the Y= screen. For example, go to the Y= screen. Keep the expression already entered as
Y1. Enter as Y2 the expression 112 −− x . Enter as Y3 the expression 185
2
−x
. Press GRAPH to
see all three graphs displayed. Press the TRACE key to activate the Trace cursor. The Trace cursorwill appear on the graph of Y1, as it did before. To make the Trace cursor move to the otherstraight-line graph, the graph of Y2, press the Down Arrow key. Move the Left and Right Arrowkeys to trace along the graph of Y2. To make the Trace cursor move to the curved graph of Y3,press the Down Arrow key again. Move the Left and Right Arrow keys to trace along the graph ofY3. If you press the Down Arrow key once more, the Trace cursor will cycle back to the graph ofY1. (If four graphs were displayed, the Trace cursor would have moved to the graph of the fourthequation.) Pressing the Up Arrow key makes the Trace cursor move from graph to graph inreverse order. While the Trace cursor is on, try pressing the Up Arrow key a few times to see howthe Trace cursor moves from graph to graph.
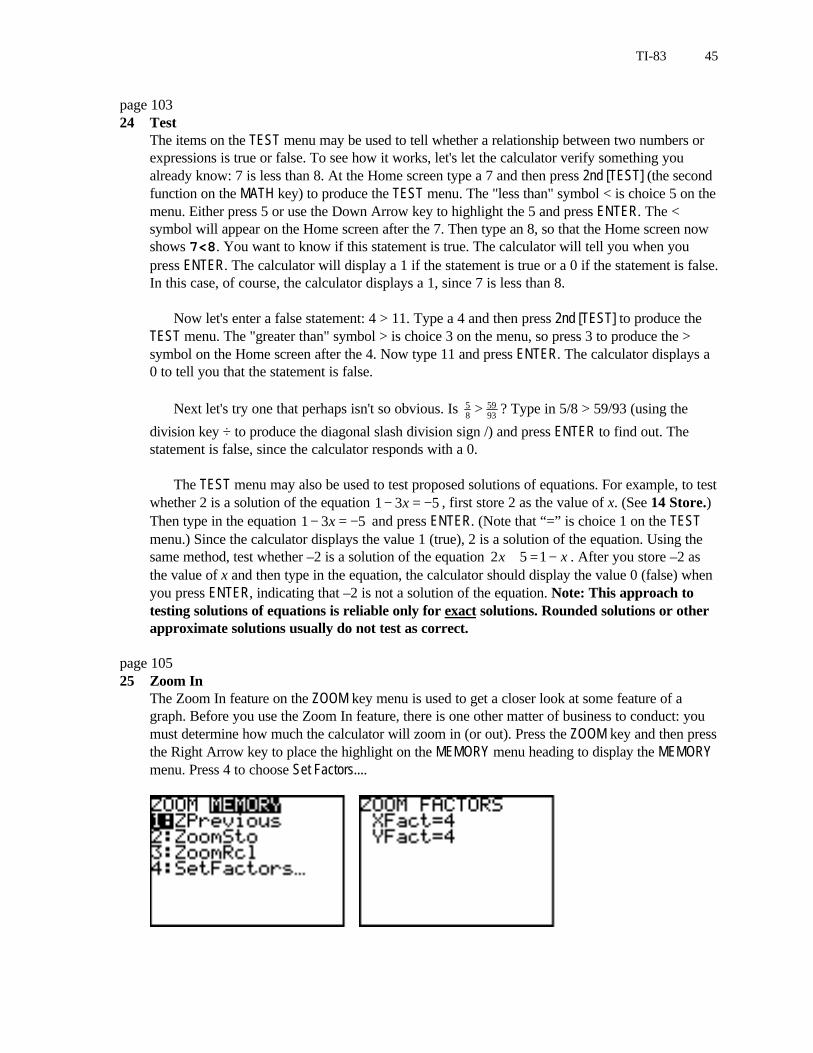
TI-83 45
page 10324 Test
The items on the TEST menu may be used to tell whether a relationship between two numbers orexpressions is true or false. To see how it works, let's let the calculator verify something youalready know: 7 is less than 8. At the Home screen type a 7 and then press 2nd [TEST] (the secondfunction on the MATH key) to produce the TEST menu. The "less than" symbol < is choice 5 on themenu. Either press 5 or use the Down Arrow key to highlight the 5 and press ENTER. The <symbol will appear on the Home screen after the 7. Then type an 8, so that the Home screen nowshows 7<8. You want to know if this statement is true. The calculator will tell you when youpress ENTER. The calculator will display a 1 if the statement is true or a 0 if the statement is false.In this case, of course, the calculator displays a 1, since 7 is less than 8.
Now let's enter a false statement: 4 > 11. Type a 4 and then press 2nd [TEST] to produce theTEST menu. The "greater than" symbol > is choice 3 on the menu, so press 3 to produce the >symbol on the Home screen after the 4. Now type 11 and press ENTER. The calculator displays a0 to tell you that the statement is false.
Next let's try one that perhaps isn't so obvious. Is 9359
85 > ? Type in 5/8 > 59/93 (using the
division key ÷ to produce the diagonal slash division sign /) and press ENTER to find out. Thestatement is false, since the calculator responds with a 0.
The TEST menu may also be used to test proposed solutions of equations. For example, to testwhether 2 is a solution of the equation 531 −=− x , first store 2 as the value of x. (See 14 Store.)Then type in the equation 531 −=− x and press ENTER. (Note that “=” is choice 1 on the TESTmenu.) Since the calculator displays the value 1 (true), 2 is a solution of the equation. Using thesame method, test whether –2 is a solution of the equation xx −=+ 152 . After you store –2 asthe value of x and then type in the equation, the calculator should display the value 0 (false) whenyou press ENTER, indicating that –2 is not a solution of the equation. Note: This approach totesting solutions of equations is reliable only for exact solutions. Rounded solutions or otherapproximate solutions usually do not test as correct.
page 10525 Zoom In
The Zoom In feature on the ZOOM key menu is used to get a closer look at some feature of agraph. Before you use the Zoom In feature, there is one other matter of business to conduct: youmust determine how much the calculator will zoom in (or out). Press the ZOOM key and then pressthe Right Arrow key to place the highlight on the MEMORY menu heading to display the MEMORYmenu. Press 4 to choose Set Factors....
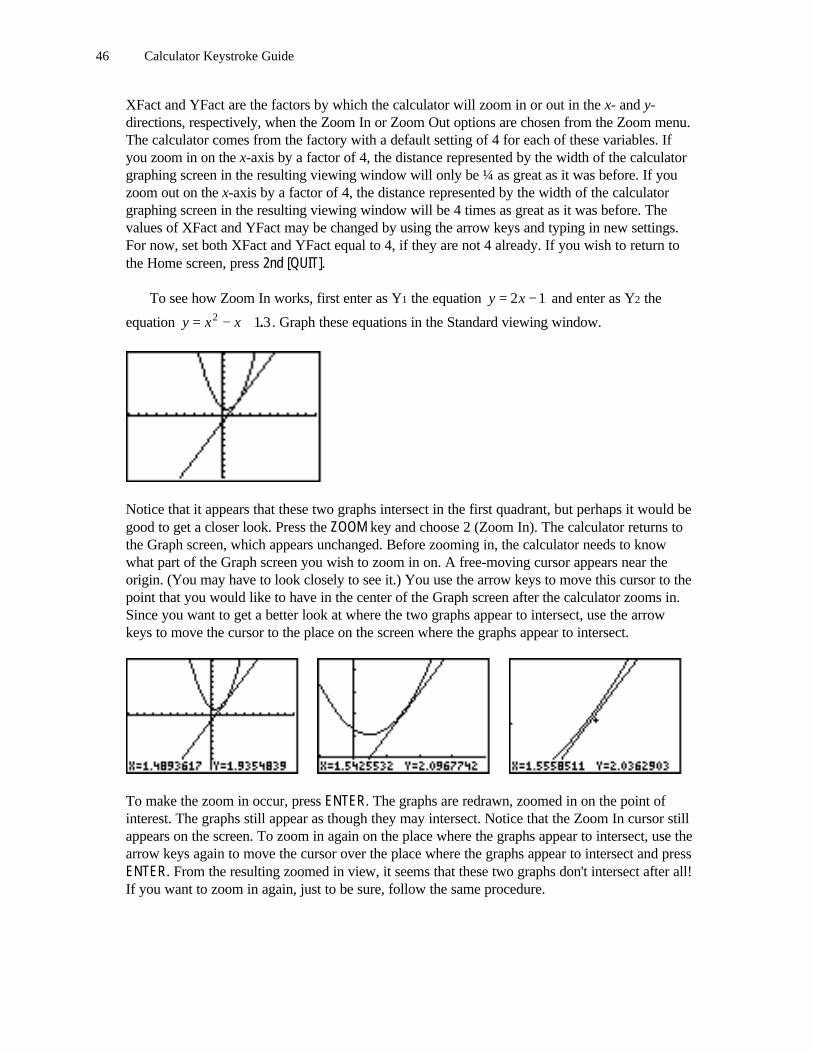
46 Calculator Keystroke Guide
XFact and YFact are the factors by which the calculator will zoom in or out in the x- and y-directions, respectively, when the Zoom In or Zoom Out options are chosen from the Zoom menu.The calculator comes from the factory with a default setting of 4 for each of these variables. Ifyou zoom in on the x-axis by a factor of 4, the distance represented by the width of the calculatorgraphing screen in the resulting viewing window will only be ¼ as great as it was before. If youzoom out on the x-axis by a factor of 4, the distance represented by the width of the calculatorgraphing screen in the resulting viewing window will be 4 times as great as it was before. Thevalues of XFact and YFact may be changed by using the arrow keys and typing in new settings.For now, set both XFact and YFact equal to 4, if they are not 4 already. If you wish to return tothe Home screen, press 2nd [QUIT].
To see how Zoom In works, first enter as Y1 the equation y x= −2 1 and enter as Y2 the
equation y x x= − +2 1 3. . Graph these equations in the Standard viewing window.
Notice that it appears that these two graphs intersect in the first quadrant, but perhaps it would begood to get a closer look. Press the ZOOM key and choose 2 (Zoom In). The calculator returns tothe Graph screen, which appears unchanged. Before zooming in, the calculator needs to knowwhat part of the Graph screen you wish to zoom in on. A free-moving cursor appears near theorigin. (You may have to look closely to see it.) You use the arrow keys to move this cursor to thepoint that you would like to have in the center of the Graph screen after the calculator zooms in.Since you want to get a better look at where the two graphs appear to intersect, use the arrowkeys to move the cursor to the place on the screen where the graphs appear to intersect.
To make the zoom in occur, press ENTER. The graphs are redrawn, zoomed in on the point ofinterest. The graphs still appear as though they may intersect. Notice that the Zoom In cursor stillappears on the screen. To zoom in again on the place where the graphs appear to intersect, use thearrow keys again to move the cursor over the place where the graphs appear to intersect and pressENTER. From the resulting zoomed in view, it seems that these two graphs don't intersect after all!If you want to zoom in again, just to be sure, follow the same procedure.

TI-83 47
page 24526 Square
A set of Window settings is said to be a square setting if a one-pixel change in the x direction(horizontal) represents the same distance as a one-pixel change in the y direction (vertical). Asquare setting can eliminate distortions in the shapes of certain geometric figures. For example, inmost graphing windows a circle will appear more like an ellipse or oval shape, but in a squaresetting a circle looks like a true circle. Also, perpendicular lines look truly perpendicular only in asquare setting.
To produce a square setting, just press the ZOOM key and then press 5 (ZSquare). Thegraphing window you had before will be converted to a square setting. For example, enter as Y1
the expression 32
1+x . (Enter it as Y1=(1/2)X+3.) Enter as Y2 the expression 42 −− x .
Graph these two perpendicular lines in the Standard viewing window (ZOOM 6). In the Standardviewing window these two lines certainly don't look perpendicular. Now press ZOOM 5 to producea square viewing window. The lines should now look much more like they are perpendicular.
page 26527 Shade
The TI-83 has two means of shading a part of the graphing window. The first, and simplest, is thegraph styles feature found in the Y= window. It may be used to shade the region of the graphingwindow above or below a given curve.
An example or two will probably best help you see how both methods work. First, suppose
you want to shade the solutions of the inequality 43
2−≤ xy . Enter the corresponding equation
43
2−= xy as Y1 on the Y= screen. (Enter the equation as Y1=(2/3)X-4.) You may want to
graph this equation in the Standard viewing window, just to see what it looks like and to see if theWindow settings give a good view of the graph. The solution of the inequality consists of allpoints on or below the graph of the equation, since for each value of x, the values of y must beless than (below) or equal to (on) the values of y on the graph. Therefore, the graph of theequation will form the top of the shaded region indicating the solution of the inequality. To shadethis region using the graphing styles feature, go to the Y= screen and use the arrow keys to movethe cursor to the diagonal line which appears to the left of Y1. If this diagonal line appears as asolid unbroken line, the graph probably appeared as it ordinarily would in Connected mode whenyou graphed it earlier. This is but one of several styles of graphing which your calculator can do.With the cursor over this diagonal line to the left of Y1, press ENTER. A thick diagonal line shouldappear. If the graph were drawn now, it would appear as a thick line. Press ENTER again. Thestyle indicator now shows a triangle shaded above and to the right of the diagonal. This indicatesthat points above the graph would be shaded in this style. Press ENTER again. The style indicatornow shows a triangle shaded below and to the left of the diagonal. This indicates that points belowthe graph would be shaded in this style. Since in our example we want points below the graph tobe shaded, press GRAPH now to see the shading.

48 Calculator Keystroke Guide
The second shading method, the Shade command, provides for more control over how andwhere the shading takes place. It can also be used to shade a part of the graphing window betweentwo graphs, or between a graph and a given constant value of y. The direction and density of theshading can also be specified, and the shading can be restricted to appear between two givenvalues of x. The Shade command asks for at least 2 and up to 6 pieces of information to producethe kind of shading you want. The information is entered in the following form. First, there is theShade command itself, followed by the minimum two pieces of information and as many as fourmore optional pieces of information, enclosed in parentheses and separated by commas:
Shade(lower function, upper function, beginning x, ending x, pattern, shading density)↑ ↑ ↑ ↑ ↑ ↑
required required optional optional optional optional
lower function = function or constant value of y you want at the bottom of the shaded regionupper function = function or constant value of y you want at the top of the shaded regionbeginning x = (optional) smallest value of x for which you want to have shadingending x = (optional) largest value of x for which you want to have shadingpattern = (optional) direction of the shading (vertical = 1 [default], horizontal = 2, diagonal upper
left to lower right = 3, diagonal lower left to upper right = 4)shading density = (optional) how densely you want the shading to occur (solid = 1 [default] to
least = 8)
All of this may look rather complicated, but working through the example again will probablyhelp. To see how to do the shading with the Shade command, go to the Y= screen, highlight thestyles feature for Y1, and keep pressing ENTER until the standard thin diagonal line reappears.Then press 2nd [QUIT] to return to the Home screen. As was noted earlier, the solution of theinequality consists of all points on or below the graph of the equation, since the values of y mustbe less than (below) or equal to (on) the values of y on the graph for each value of x. Therefore,the graph of the equation will form the top of the shaded region indicating the solution of theinequality. Thus, Y1 will be your upper function on the Shade command. All points below the graphof Y1 are part of the solution of the inequality, so there really is no bottom to the shaded region.For the purposes of the Shade command, you want the shading to go to the bottom of the graphingwindow, so you can use any number below the lowest value of y displayed, Ymin, as the lowerfunction. Really, lower function and upper function are the only two quantities needed to do a basicshading. At the Home screen press 2nd [DRAW] to display the general DRAW menu. Press 7 todisplay the Shade( command on the Home screen. Note that the Shade( command automaticallydisplays an open parenthesis to save you a bit of typing. The first thing you must enter is the lowerfunction. Since the lowest value of y in the Standard viewing window (Ymin) is −10, type inanything less, such as −11. At the Home screen you should now see Shade(-11. Before you

TI-83 49
enter the upper function, you must type in a comma to separate it from the lower function. (Thecomma key is just above the 7 key.) The upper function is Y1, so press VARS, highlight the Y-VARSmenu heading, press ENTER to choose the Function... menu, and then press 1 or ENTER to chooseY1. Type a close parenthesis at the end to complete the command. At the Home screen you shouldnow see Shade(-11,Y1). Press ENTER to execute the Shade command. The calculator shoulddisplay the graph with solid shading below the line.
If you want to erase this shading, press 2nd [DRAW] and then choose 1 (ClrDraw). If you selectthis command from the Home screen, the command ClrDraw (Clear Drawing) will be displayed atthe Home screen. Press ENTER to execute the command. The calculator will respond with theword Done. Press GRAPH to verify that the shading has been erased. If you have done someshading and are viewing the Graph screen when you select the ClrDraw command (2nd [DRAW], 1),the calculator will immediately return to the Graph screen and redraw the graphs without theshading.
To graph the solutions of the inequality xy 2> , enter in Y1 the equation xy 2= . Graph it in
the Standard viewing window (or any other convenient graphing window). This time, all pointsabove the line xy 2= are solutions of the inequality. To shade this portion of the graphing
window using the graphing styles feature, go to the Y= screen and use the arrow keys to move thecursor on the diagonal line which appears to the left of Y1. Press ENTER repeatedly until the styleindicator shows a triangle shaded above and to the right of the diagonal. This indicates that pointsabove the graph would be shaded in this style. Since in this example we want points above thegraph to be shaded, press GRAPH now to see the shading.
To see how to do the shading with the Shade command, go to the Y= screen, highlight thestyles feature for Y1, and keep pressing ENTER until the standard thin diagonal line reappears.Then press 2nd [QUIT] to return to the Home screen. In this example, use the Standard viewingwindow (ZOOM 6). As was noted earlier, the solution of the inequality consists of all points abovethe graph of the equation, since for each x, the values of y must be greater than (above) the valuesof y on the graph. Therefore, the graph of the line forms the bottom of the shaded region. Therereally is no upper boundary to the shaded region, so any number greater than Ymax will do as the

50 Calculator Keystroke Guide
upper function. To do the shading, at the Home screen press 2nd [DRAW] and select the Shadecommand as before. This time, Y1 is the lower function. You may either produce the Y1 characteras before or just type in 2X. Type a comma, and then type in 11 or any other number larger thanYmax (which is 10 in the Standard viewing window) as the upper function. To see how shadingpattern and density work, type in another comma, followed by –10, 10, 2,3, and a closeparenthesis to complete the command, which should now appear either in the formShade(Y1,11,-10,10,2,3) or Shade(2X,11,-10,10,2,3). Press ENTER to graphthe solution of the inequality. The –10 and 10 in the Shade command tell the calculator to beginthe shading on the left at x = –10 (the left edge of the Standard viewing window) and to end theshading at x = 10 (the right edge of the Standard viewing window), where applicable. The number2 in the Shade command tells the calculator to use a pattern of horizontal shading. The 3 tells thecalculator to use shading density 3, so only every 3rd row of pixels is shaded.
Use the ClrDraw command as mentioned earlier to erase the shading. Leave xy 2= as Y1 and
enter as Y2 the equation 3−−= xy . (Be sure to use the negative key (−) in front of the x and the
subtraction key in front of the 3.) Suppose you want to solidly shade all points between x = 2 andx = 5 which lie above Y2 and below Y1. At the Home screen enter the Shade command in thisway: Shade(Y2,Y1,2,5). Press ENTER to see the results. To see a less dense diagonalshading, first use the ClrDraw command, and then use Shade(Y2,Y1,2,5,3,4).
Shade(Y2,Y1,2,5) Shade(Y2,Y1,2,5,3,4)
You can find more discussion of the Shade command in the TI-83 Graphing CalculatorGuidebook which came with your calculator.
page 29528 Solve
Your calculator has the ability to solve systems of linear equations by using two matrix conceptswhose full development is beyond the scope of the course you are now taking: matrixmultiplication and the inverse of a matrix. You don’t need to worry about how these conceptswork at this point, since the calculator knows how to do the computations. All you need to be able

TI-83 51
to do is to set up two matrices associated with the system of equations and have the calculatormultiply the inverse of one by the other, all of which will be explained by working through thefollowing example.
Suppose you want to solve the system of linear equations below.
253
642
−=+=−
yx
yx
The first matrix, denoted A, which will be needed is called the coefficient matrix, since its rowsconsist of the coefficients of x and y in the first and second equations, respectively.
−=
53
42A
The second matrix needed, denoted B, is called the constant matrix. This matrix consists of thecolumn of constants found to the right of the equal signs in the system of equations.
−
=2
6B
To enter matrix A into your calculator first press the MATRX (matrix) key. Choice 1, whichcorresponds to matrix A (displayed on screen as [A]), should already be highlighted. Use theLeft or Right Arrow key to highlight the EDIT menu at the top of the screen. Press ENTER todisplay the screen used to edit matrix A. Your screens may not look exactly like the ones below,particularly if matrices have been entered into your calculator before, but they should be similar.
MATRX Screen Editing Screen for Matrix A
In the editing screen for matrix A the cursor should be blinking on the first of two numbers at theright part of the screen that indicate the dimensions of the matrix. In the above right illustrationthe dimensions are shown as 11× . The first number indicates the number of rows in the matrix.(A row is a line of numbers going left and right.) The second number indicates the number ofcolumns. (A column is a line of numbers going up and down). The matrix shown above has onlyone row and one column, and thus, only one number in it, in this case 0. Since the matrix A weneed has two rows, with the cursor blinking on the first 1, type a 2 and press ENTER. Thecalculator now displays a 12 × matrix, that is, one with two rows and one column, as shown onthe left at the top of the next page, and the cursor is now in the second dimension number position(blinking on the second 1 in our illustration). Since our desired matrix A has two columns, type a

52 Calculator Keystroke Guide
2 and press ENTER. The calculator now displays a 22 × matrix, that is, one with two rows andtwo columns, as shown on the right below.
Notice that the cursor is now positioned on the number in upper left corner of the matrix. Thisposition is row 1, column 1, in the matrix. The calculator displays 1,1=0 at the bottom of thescreen to indicate that the number presently in the position row 1, column 1, is 0. Referring tomatrix A for our system of equations, the number in row 1, column 1, needs to be 2. Type a 2. Atthe bottom of the screen the display now reads 1,1=2, but the highlighted number in the matrixabove has not yet changed. Press ENTER to have the calculator enter 2 into the position row 1,column 1, of the matrix.
Before Pressing ENTER After Pressing ENTER
The cursor is now highlighting the number in the position row 1, column 2. At the bottom ofthe screen the display reads 1,2=0, which indicates that the number in this position is 0. For oursystem of equations the number in matrix A in the position row 1, column 2, is supposed to be −4,so type a −4 and press ENTER to enter it into that position in the matrix. The cursor moves toposition row 2, column 1, as shown on the left below, where a 3 is supposed to appear in ourmatrix A. Continue to enter the rest of the numbers into matrix A so that it looks like the figure onthe right below. If you make a mistake, just use the arrow keys to highlight the number you wishto change, type in the correction, and press ENTER.
To enter the matrix B for our system of equations, press MATRX. (Notice that on the MATRXscreens the matrix A now has the notation 22 × next to it to denote that a matrix with two rows

TI-83 53
and two columns has been entered as matrix A.) Highlight the EDIT menu at the top of the screen,and press 2 for matrix B. In our system of equations matrix B has two rows and one column, sotype a 2 as the row dimension and press ENTER. Then type a 1 as the column dimension and pressENTER (or just press ENTER if the column dimension is already 1), so that the display appears ason the left below. Enter the numbers into the matrix as before until the display appears as on theright below.
Now that the matrices have been entered, press 2nd [QUIT] to return to the Home screen. If youwould like to see matrix A displayed on the Home screen, press MATRX, and with the NAMESmenu highlighted at the top of the screen, press ENTER or 1. The character [A] will be displayedon the Home screen. Press ENTER to have the calculator display matrix A as shown on the leftbelow. Press MATRX 2 to display the character [B] on the Home screen. Press ENTER to seematrix B as shown on the right below. Although you don’t really have to display these matricesbefore solving the system of equations, it isn’t a bad idea to look at them on the Home screen justto be sure that you have entered the numbers correctly. If you notice a mistake, you can still goback and make corrections at the matrix editing screen. After selecting the matrix you want, usethe arrow keys to go to the part that needs to be corrected and type and enter the corrections.
To solve the system we need to find the matrix product BA 1− , where 1A − denotes the inverseof matrix A. (You don’t have to worry about what that inverse is.) On the Home screen thismatrix product will appear as [A]-1[B]. To produce this expression on screen, press MATRX 1to produce the [A]. Then press the 1−x key to produce the exponent 1− . (Do not use ^-1instead.) Finally, press MATRX 2 to produce the [B]. With the screen displaying [A]-1[B],press ENTER to display a 12 × matrix as on the top of the next page showing, from top to bottom,the values for x and y, respectively, which form the solution of the system of equations. Thus, thesolution of the system is )1,1( − ; that is, 1 ,1 −== yx .

54 Calculator Keystroke Guide
A second method for solving such a system of equations involves writing a single “system”matrix, each of whose rows consists of the coefficient of x, the coefficient of y, and the constantfor one of the equations. For example, the system matrix for the system of equations
253
642
−=+=−
yx
yx
used in the previous example would have the following corresponding system matrix.
−
−=
253
642A
By means of operations on this matrix which are beyond the scope of this course, this matrix canbe reduced to another matrix of the form shown below (called reduced row echelon form),
b
a
10
01
representing an equivalent system of equations
byx
ayx
=+=+
0
0 or
by
ax
==
where a and b are constants and are the values of x and y, respectively, that form the solution ofthe original system of equations.
The TI-83 has a command that produces this reduced row echelon form for a system matrix.To see how it works with the system of equations above, first enter as matrix A the 32 × matrix
−
−=
253
642A
by using the techniques described earlier. Then press the MATRX key and use the arrow keys tohighlight the MATH menu. Examine the figure on the left at the top of the next page. You willnotice an arrow pointing downward next to choice 7, indicating that there are more choices on thismenu. Use the Down Arrow key to scroll down through the other choices until you come to choiceB, which is rref(. This is the reduced row echelon form command.

TI-83 55
(Do not use choice A, ref(, which is similar in appearance.) Select choice B by highlighting itand pressing ENTER (or by pressing ALPHA B). The rref( command should now appear on theHome screen. You need to tell the calculator which matrix to act upon with this command, sopress MATRX and press 1 or ENTER to select the 32 × matrix A. Type a close parenthesis afterthe matrix letter so that the Home screen displays rref([A]). Press ENTER to execute thecommand. The calculator should display the reduced row echelon form of the matrix as shownbelow.
This matrix indicates a system of equations equivalent to the original system and of the form
10
10
−=+=+
yx
yx or
1
1
−==
y
x
Thus, the solution of the system is 1=x , 1−=y , or in ordered pair form (1,−1).
page 33829 Evaluate Y
The TI-83 interprets function notation. Just as for a function xxxR −= 24)( the value of the
function when x = −1 can be denoted )1(−R , with the TI-83 the value of Y1 when x = −1 can be
denoted Y1(−1). In the Y= screen enter as Y1 the equation xxy −= 24 . Then press 2nd [QUIT] toreturn to the Home screen. Press VARS and use the arrow keys to highlight the Y-VARS menuheading at the top of the screen. In the Y-VARS menu press ENTER to choose the Function... menu.Choose Y1 from this menu by pressing ENTER. The calculator returns to the Home screen, and thevariable Y1 will be displayed on the screen. Now type the number −1 in parentheses so that theexpression Y1(-1)is displayed on screen. Press ENTER to see 5, the value of Y1 when x is −1.To find the value of Y1 when x = 3, press 2nd [ENTRY] to reproduce a copy of Y1(-1), move thecursor over the -, type a 3, and then press DEL so that the expression reads Y1(3). Press ENTERto get the value 33. See also 21 Evaluate Y and 22 Table.
56 Calculator Keystroke Guide
page 38030 Scientific
The TI-83 automatically displays some answers in scientific notation. For example, if youmultiply 658,000 by 240,000, the result is displayed as 1.5792E11. The number following theE is the exponent of the 10 in scientific notation. Thus, the display should be interpreted as1.5792·1011 = 157,920,000,000. Similarly, if you divide 32 by 256,000, the result is displayed as1.25E−4, which means 1.25·10−4 = .000125.
You may also enter numbers into your calculator in scientific notation. For example, if youwant to enter 3.4·107 into your calculator, you would first type in the 3.4. Now press 2nd [EE]. (EEis the second function on the comma key.) Notice that pressing 2nd [EE] produces the letter E onthe screen to indicate that you are about to enter the power of 10 in scientific notation, which inthis case is 7. After typing the 7, press ENTER, and you will see the number displayed as34,000,000. It is displayed in standard numeral form, since the number is small enough for thecalculator to display it that way. If you type in a larger number, such as 2.78·1021, and pressENTER, the calculator will still display the number in scientific notation, since the standardnumeral form is too large for the calculator's maximum 10-digit display.
You can also make your calculator display all results in scientific notation, if you wish, byputting the calculator into Scientific Notation mode. Press the MODE key. There are severalsettings that can be changed in the MODE menu, but the first line is our concern here. The wordNormal is probably highlighted in the first line. Use the Right Arrow key to move the blinkingcursor over the word Sci, and press ENTER. The highlight should now disappear from the wordNormal and be on the word Sci. Return to the Home screen by pressing 2nd [QUIT]. Now type thesum 3 + 9 on the calculator and press ENTER. The result is displayed as 1.2E1, which isscientific notation for 12. As long as the calculator is in Sci mode, all computation results will bedisplayed in scientific notation. To return to the normal display of calculated results, press theMODE key, and with the blinking cursor on the word Normal, press ENTER. Then press 2nd [QUIT]to return to the Home screen.

57
INDEXGuide page numbers and reference numbers (in boldface type) are listed only for those pages wherenew information on the topic may be found. Page numbers and reference numbers that only direct youto earlier Guide references on the same subject are omitted.
TI-82 TI-83 TI-82 TI-8310 Absolute Value 10 35
4 Add 6 3215 Alpha 10 37
Clear Home screen 4 30Contrast 1 27
19 Cursor 13 40Darken screen 1 27
2 Decimal 5 31DEL (delete) 3 29
16 Default 11 371 Divide 5 31
Editing expressions 3 2920 Enter Function 14 40
Entering expressions 3 2921 Evaluate Y 14 4129 Evaluate Y 26 55
8 Exponent 8 3413 Fraction 10 3620 Function, Enter 14 4018 Graph 13 40
INS (insert) 3 2917 Integer 12 39
Lighten screen 1 27Matrix (matrices) 22 50Mode 2 28
6 Multiply 8 34Off 2 28On 1 27
5 Negative 7 33Pixels 2 28
11 Reciprocal 9 363 Root, Square 6 32
30 Scientific 26 56Second function for keys 2 28
27 Shade 20 4728 Solve 22 5026 Square 20 47
3 Square Root 6 3214 Store 10 36
5 Subtract 7 3322 Table 16 4224 Test 18 4523 Trace 17 44
16 Window 11 3725 Zoom In 19 45