graph theoretic methods for the analysis of structural relationships in biological macromolecules
TRANSCRIPT

promoting access to White Rose research papers
White Rose Research Online
Universities of Leeds, Sheffield and York http://eprints.whiterose.ac.uk/
This is an author produced version of a paper published in Journal of the American Society for Information Science and Technology. White Rose Research Online URL for this paper: http://eprints.whiterose.ac.uk/3591/
Published paper Artymiuk, P.J., Spriggs, R.V. and Willett, P. (2005) Graph theoretic methods for the analysis of structural relationships in biological macromolecules, Journal of the American Society for Information Science and Technology, Volume 56 (5), 518 - 528.
Graph Theoretic Methods For The Analysis Of Structural
Relationships In Biological Macromolecules
Peter J. Artymiuk1, Ruth V. Spriggs2 and Peter Willett2*
Krebs Institute for Biomolecular Research and Departments of Molecular Biology and Biotechnology1 and
of Information Studies2, University of Sheffield, Western Bank, Sheffield S10 2TN, UK
Abstract Subgraph isomorphism and maximum common subgraph isomorphism
algorithms from graph theory provide an effective and an efficient way of identifying
structural relationships between biological macromolecules. They thus provide a natural
complement to the pattern matching algorithms that are used in bioinformatics to identify
sequence relationships. Examples are provided of the use of graph theory to analyse
proteins for which three-dimensional crystallographic or NMR structures are available,
focusing on the use of the Bron-Kerbosch clique detection algorithm to identify common
folding motifs and of the Ullmann subgraph isomorphism algorithm to identify patterns
of amino acid residues. Our methods are also applicable to other types of biological
macromolecule, such as carbohydrate and nucleic acid structures
Keywords ASSAM, Carbohydrate structure, Complex Carbohydrate Structure Database,
Database searching, Graph theory, Maximum common subgraph isomorphism,
NASSAM, Nucleic acid structure, Protein Data Bank, Protein structure, PROTEP, RNA,
Subgraph isomorphism, Substructure searching
* Author to whom all correspondence should be addressed at [email protected]
Manuscript submitted for the Bioinformatics special issue of Journal of the American
Society for Information Science and Technology
1

Introduction
The science of bioinformatics is based largely on computational methods for the
comparison of biological sequences (Baxevanis & Ouellette, 2001; Lengauer, 2001;
Lesk, 2002). Sequence comparison algorithms match one sequence with another to
identify regions of commonality or near-commonality, and many tools are available for
this purpose, drawing on work not only in molecular biology but also in aspects of
computer science, such as speech recognition and information retrieval. The ready
availability of algorithms such as BLAST (Altschul, Gish, Miller, Myers & Lipman,
1990) and their application to databases such as Swiss-Prot (at URL
http://www.expasy.ch/sprot/sprot-top.html) and GenBank (at URL
http://www.nci.nlm..nih.gov/GenBank/GenBankOverview.htm) means that sequence
comparison can be carried out both efficiently and effectively on very large numbers of
sequences.
There are several important databases that store biological structures rather than, or in
addition to, biological sequences. Sequence comparison algorithms assume a linear
representation of a macromolecule that is not appropriate for the identification of
structural relationships. Alternative computational approaches are hence required to
search and to analyse the rapidly increasing volumes of structural data that are resulting
from developments in technologies such as X-ray crystallography and nuclear magnetic
resonance. In a long-established collaboration between the Department of Molecular
Biology and Biotechnology and the Department of Information Studies at the University
of Sheffield, we have adopted an approach that is based on the use of algorithms from the
branch of mathematics known as graph theory (Diestel, 2000; Wilson, 1996). A graph
describes a set of objects, called nodes or vertices, and the relationships, called edges or
arcs, that exist between pairs of these objects. A simple example of a graph is a map of
the world showing the routes flown by an international airline: in such a graph, the nodes
are cities and there is an edge between two nodes if there is a direct inter-city flight
between them.
2
Graph theory covers many different characteristics of graphs: here, we focus on the
isomorphism techniques that have been developed for establishing the structural
relationships that exist between pairs of graphs (Gati, 1979; McGregor, 1982; Messmer &
Bunke, 1999; Read & Corneil, 1977). Specifically, we discuss the application of
isomorphism techniques to the analysis of graphs that describe the structures of biological
macromolecules. The starting point for our work was the long-established use of graph-
based methods for representing and searching databases of small molecules, which is an
important component of chemoinformatics. The successful use of such methods for
handling chemical small molecules suggested to us that they might also be applicable to
the representation and searching of the structures of biological macromolecules: in this
paper we summarise some of the major conclusions we have been able to draw as to the
appropriateness of this suggestion. The discussion focuses on the application of graph-
theoretic methods to the three-dimensional (3D) protein structures in the Protein Data
Bank (at URL http://www.rcsb.org/pdb), but we mention also the use of such methods for
searching carbohydrate and RNA structures.
Graph Theory And Its Applications In Chemoinformatics
A graph, G, consists of a set of nodes together with a set of edges connecting pairs of
nodes, and two nodes are adjacent if they are connected by an edge. A graph is labelled
if identifier labels are associated with the nodes and/or edges, and it is directed if each of
the edges specifies not only that a relationship exists between a pair of nodes but also the
direction of that relationship. Two graphs, G1 and G2, are isomorphic if there is an exact
correspondence between the nodes of G1 and of G2 such that adjacent pairs of nodes in
G1 are mapped to adjacent pairs of nodes in G2 and conversely, i.e., if the two graphs are
identical. A subgraph of G is a subset, P, of the nodes of G together with a subset of the
edges connecting pairs of nodes in P. A subgraph isomorphism exists if G1 is
isomorphic to a subgraph of G2 (or vice versa). Finally, a common subgraph of two
graphs G1 and G2 is defined as consisting of a subgraph g1 of G1 and a subgraph g2 of
3

G2 such that g1 is isomorphic to g2; the maximum common subgraph (MCS) is the
largest such common subgraph.
A graph provides a simple and direct way of encoding the topology of a two-dimensional
(2D) chemical structure diagram, by using the nodes and edges of a graph to represent the
atoms and bonds of a molecule (Figueras, 1986; Gray, 1986; Trinajstic, 1983). We can
then determine whether a user-defined query substructure, such as a penicillin ring
system, is contained within some molecule in a chemical database by applying a
subgraph isomorphism algorithm to the corresponding graph representations. This
process is referred to as substructure searching (Barnard, 1993) and was first reported by
Ray and Kirsch (1957), with the Sussenguth set-reduction algorithm (Sussenguth, 1965)
being the first subgraph isomorphism algorithm that was sufficiently fast in operation to
allow the searching of large chemical databases. It is perhaps of interest to readers of this
journal that the Sussenguth algorithm was developed in Salton’s laboratory as part of a
project to investigate the applicability of tree-based methods for language processing
(Salton & Sussenguth, 1963); the close relationship that exists between methods for
processing chemical and textual databases is discussed by Willett (2001). More recently,
it has proved possible to extend such ideas to the representation and searching of three–
dimensional (3D) chemical graphs in which the nodes and edges of a graph represent the
atoms and the inter-atomic distances of a 3D molecule (Good & Mason, 1996; Gund,
1977; Willett, 1991); searching methods based on such graph representations have
become an important tool in the discovery of novel pharmaceuticals and agrochemicals
(Martin & Willett, 1998).
The MCS between two graphs provides a natural measure of the similarity of two graphs,
and this has found application in chemoinformatics in three main ways. Historically the
first of these was for indexing the structural changes that take place as a result of a
chemical reaction, so as to provide a way of indexing reaction databases (Willett, 1986).
This can be effected by representing the reactant and product molecules as chemical
graphs and then using an MCS algorithm to find those parts of the molecules that are
common to the two sides of the equation: those parts of the molecules that are not part of
4

the MCS correspond to those parts of the molecules where the reaction has taken place
(McGregor, 1982). Another application, normally in the context of 3D chemical graphs,
is the use of MCS algorithms for pharmacophore mapping. A pharmacophore is the set
of structural features in a molecule that are thought to be involved in binding to a
biological receptor site, such as the binding site of an enzyme. Crandell and Smith
(1983) noted that if one had two, structurally-disparate molecules that both exhibited a
biological activity of interest then, in the absence of any further information, an initial
specification of the pharmacophore involved could be obtained from the MCS of the
graphs representing these two molecules. This approach is now well-established (Brint &
Willett, 1987a; Crandell & Smith, 1983; Martin et al., 1993), with the resulting patterns
then being used as the queries for 3D substructure searches to identify further molecules
that might be expected to bind to the receptor. Finally, the similar property principle
(Johnson & Maggiora, 1990) states that structurally similar molecules are likely to have
similar biological activities - an assumption that is clearly analogous to the assumption
that similar documents are likely to be relevant to the same requests which forms the
basis for the Cluster Hypothesis (van Rijsbergen, 1979). Hence, if a bioactive target
structure is used in a similarity search (Dean, 1994; Willett, Barnard & Downs, 1998),
then the most similar molecules are also likely to be active, with the result that similarity
searching is extensively used in drug- and pesticide-discovery programs. There are
various types of structure-based similarity measure that can be used for this purpose,
including measures based on the MCS between two chemical graphs (Hagadone, 1992;
Raymond, Gardiner & Willett, 2002).
The subgraph and maximum common subgraph isomorphism problems have been studied
for many years, and many isomorphism algorithms have been described in the literature.
Following extensive tests, we focused on the use of the Ullmann (1976) and Bron-
Kerbosch (1973) algorithms for subgraph and maximum common subgraph isomorphism
applications in chemoinformatics (Brint & Willett, 1987a, 1987b; Gardiner, Artymiuk &
Willett, 1998) and have used these as the basis for our subsequent work in
bioinformatics; the reader is referred to the original papers for full algorithmic details.
The principal focus of our studies to date has been the protein structures in the Protein
5

Data Bank (Berman et al., 2002; Bernstein et al., 1977), for which we have developed
two types of graph: one describing 3D patterns of secondary structure elements (hereafter
SSEs) and the other describing 3D patterns of amino acid side-chains. This work is
described in the next two sections.
Searching For Patterns Of Secondary Structure Elements In Proteins
The graph representation of a protein that we have adopted for the program PROTEP
makes use of the fact that the two most common types of SSE, the α-helix and the β-
strand, are both approximately linear structures, which can hence be represented by
vectors drawn along their major axes. The set of vectors corresponding to the SSEs in a
protein can then be used to describe that protein’s 3D structure, this structure being
represented by a graph in which the SSEs correspond to the nodes of the graph and the
geometric relationships between pairs of the SSEs correspond to the edges of the graph
(Mitchell, Artymiuk, Rice & Willett, 1990). More precisely, each node in such a graph is
denoted by the SSE type (α-helix or β-strand; no account is taken of the actual length of
each SSE vector, although such information could be included in the node labels if
desired); and each edge in such a graph is a three-part data element that contains the
angle between a pair of vectors describing SSEs, the distance of closest approach of the
two vectors and the distance between their mid-points. A protein can hence be
represented by a labelled graph that can be searched using a subgraph isomorphism
algorithm or an MCS algorithm. The precise nature of the output from a PROTEP search
is determined by the tolerances that are used. The angular tolerance is specified in terms
of numbers of degrees, while the distance tolerances (for the closest-approach and/or
mid-point distances) are specified either in Å or as a percentage of the distance in the
query structure. It is also possible to specify that the SSEs in a database protein that
match the query protein are in the same sequence order as in the query; alternatively, the
sequence order does not need to be the same. The user thus has a very large degree of
control over the number and the quality of the matches that are identified by the program.
The representation we have used is illustrated in Figure 1, where we show a simple motif
6

consisting of three SSEs (helix-A, strand-1 and strand-2), together with the corresponding
torsion angles and midpoint distances.
Early work with PROTEP involved subgraph isomorphism searches using a suitably
modified version of the Ullmann algorithm. For example, we demonstrated the striking
structural homology that exists between the CheY bacterial signal transduction protein
and EF TU, an elongation factor related to G proteins (Artymiuk, Rice, Mitchell &
Willett, 1990) and were later able to identify many previously-unrecognised occurrences
of the three-stranded ϕ-loop (Hutchinson & Thornton, 1990) as part of an extended
analysis of the occurrences of β-sheet motifs in the PDB (Artymiuk, Grindley, Poirrette,
Rice, Ujah & Willett, 1994). However, most of our work has focused on the use of an
MCS algorithm for searching SSE graphs; specifically we have developed a suitably
modified version of the Bron-Kerbosch algorithm to retrieve all of the proteins in the
PDB that contain at least some minimum number of the SSEs in the query pattern (which
is thus normally an entire structure, rather than a partial structure as is normally the case
when the Ullmann option in PROTEP is used). This has been the most productive
applications of graph theory that we have studied thus far, as demonstrated by the
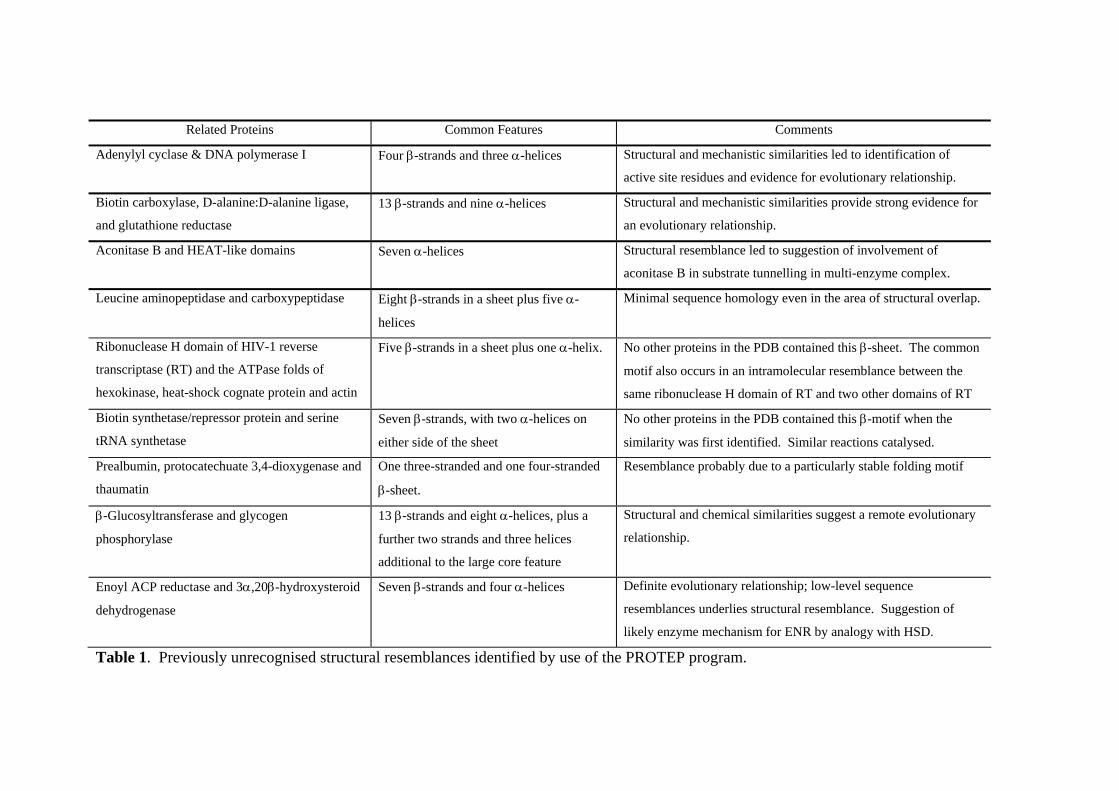
structural resemblances that we have discovered and that are listed in Table 1. Here, we
discuss three of these resemblances.
Adenylyl cyclase and DNA polymerase 1.
The first example involves adenylyl cyclase (AC), a biologically and medically important
enzyme in the hormone response that converts ATP to cyclic AMP. The crystal structure
of the core catalytic domain of AC was solved by Zhang, Lui & Hurley (1997), who
concluded that the structure of the AC catalytic domain had a completely novel fold, not
resembling any other enzyme. A PROTEP search, however, immediately revealed that
although the fold is uncommon, there is a strong resemblance between the fold of AC and
that of the catalytic “palm” domain of DNA polymerase I (Ollis et al., 1985). As can be
seen from Figure 2, the entire palm domain of the polymerase, consisting of four beta
strands and three helices is contained with identical sequence order and topology within
the adenylyl cyclase catalytic core domain (Artymiuk, Poirrette, Rice & Willett, 1997).
7

The three-dimensional resemblance is strong with 62 α-carbon atoms superposing with
an RMS deviation of 1.63 Å, but there is no significant overall sequence similarity
between the two domains.
The 3-D resemblance highlighted a previously unrecognized analogy between the
reactions catalysed by AC and the DNA polymerases: both involve attack by the 3' OH
group of a ribose unit on the alpha phosphate of a nucleotide 5'-triphosphate with
elimination of pyrophosphate (Artymiuk, Poirrette, Rice & Willett, 1997). However, in
the polymerase reaction a deoxyribonucleotide is ligated to a DNA primer, whilst in
adenylyl cyclase the reaction involves an intramolecular cyclization within one ATP
molecule. The key catalytic residues in the polymerase I active site are three acidic
groups which bind Mg2+ and are positioned at the top end of the palm domain.
Although there is no detectable sequence resemblance between the polymerase and AC,
the 3-D superposition shows that the catalytically active C1 domain of AC possesses
completely conserved acidic groups in the identical positions on its fold. We proposed
that these acidic groups would be the catalytic groups of AC. Although both the
similarity and its significance were initially disputed (Bryant et al., 1997), our proposal
has now been confirmed by mutagenic and crystallographic studies (Tesmer et al., 1999)
that confirm the value of the structural resemblance detected by PROTEP in achieving
understanding of the AC mechanism.
Biotin carboxylase and ADP-forming peptide synthetases
The second example (Artymiuk, Poirrette, Rice & Willett, 1996) involves biotin
carboxylase (BC) and the family of ADP-forming peptide synthetases, as represented by
D-alanine:D-alanine ligase (DD-ligase) and glutathione reductase (GSHase). Fan et al.
(Fan, Moews, Shi, Walsh & Knox, 1995) have reported the existence of a strong
similarity between the structures of DD-ligase, a bacterial cell-wall synthesising enzyme,
and GSHase. Both proteins consist of three domains with similar folds, and both convert
ATP to ADP as part of a ligation reaction which leads to the creation of a peptide bond.
Although there is very little sequence homology between the two proteins, the 3D
similarities are so strong that Fan et al. argued for an evolutionary relationship between
8

the two enzymes, and postulated that their common structure may represent a general fold
for that class of peptide synthetases that cleave ATP to ADP, rather than to AMP.
PROTEP was able to demonstrate a further striking similarity between the folds of
GSHase and DD-ligase and that of BC, as shown in Figure 3. The similarities are so
extensive as to be strongly suggestive of an evolutionary relationship between BC and the
peptide ligases, showing that this family of protein structures is much wider than
previously suspected and extends beyond the peptide synthetases to the large family of
biotin-dependent carboxylases. The similarity between BC and GSHase and DD-ligase is
wide-ranging and involves a total of nine α-helices and 13 β-strands, all with identical
sequence and topology. The resemblance involves virtually all of the GSHase and DD-
ligase folds with the first 318 residues of the BC fold. Overall, the folds are exceedingly
similar, although there are minor differences in the arrangement of the β-strands at the
periphery of the N-terminal β-sheet in all three enzymes. Between BC and GSHase it is
possible to superpose 101 Cα atoms with an RMSD of 1.91Å; the similarity between BC
and DD-ligase is even greater with 127 Cα atoms superposing with an RMSD of 1.64Å.
The similarities extend to the positions of the active sites of the three enzymes, although
the assignment is rather tentative for BC because of difficulties in carrying out binding
studies in the crystalline state. Moreover, there are also significant resemblances when
the functional and mechanistic characteristics of the three enzymes are examined. The
reactions they catalyse are similar, coupling the conversion of ATP to ADP to form a
carbon-nitrogen bond between a carboxyl group and an amino group: BC ligates ATP-
activated bicarbonate to the N1’ amino group of biotin to produce carboxy-biotin;
GSHase ligates the ATP-activated carboxyl of γ-Glu-Cys to the amino group of glycine
to produce glutathione; and DD-ligase ligates the ATP-activated carboxyl group of D-
alanine to the amino group of another D-alanine. The differences in chemistry relate to
the fact that in BC the reaction catalysed involves a secondary amine, whilst in GSHase
and DD-ligase, the reaction involves a primary amine. However, despite this difference,
the mechanisms of both classes of enzyme appear to be similar: the GSHase and DD-
ligase reactions proceed through acylphosphate intermediaries, and it is believed that the
9

reaction catalysed by BC proceeds through the analogous carboxyphosphate intermediate.
Given these structural and mechanistic resemblances, it is not unreasonable to postulate
the existence of a common evolutionary ancestor between BC and GSHase and DD-
ligase, and this is supported by detailed homology studies that reveal several areas of
significant sequence similarity within the three enzymes (Artymiuk, Poirrette, Rice &
Willett, 1996).
BC is a member of a large family of homologous ADP-forming biotin-dependent
carboxylases which includes carbamoyl-phosphate synthetase, proprionyl-CoA
carboxylase, pyruvate carboxylase and L-glutamine-amido-ligase. The graph-theoretic
study summarised here has thus identified a structural link between this family of
enzymes and the family of ADP-forming peptide synthetases (as represented by DD-
ligase and GSHase).
A HEAT-like domain in E.coli aconitase
Our final example shows how the detection of structural resemblances can aid on-going
structural and biochemical investigations. Aconitases catalyse the reversible
isomerization of citrate and isocitrate via cis-aconitate in the citric acid cycle, and in
addition members of the aconitase family are also able to bind 30-nucleotide mRNA
'stem-loop' iron regulatory elements and thereby regulate the synthesis of a variety of
iron-containing proteins (Klausner & Rouault, 1993). E. coli, and other gram negative
bacteria, possess two very distinct aconitases known as Aconitases A and B (AcnA and
AcnB; Gruer, Artymiuk & Guest, 1997). AcnB is of great interest because analysis of
its sequence shows a major domain rearrangement in comparison with other known
aconitases, and the 2.4 Å crystal structure of E. coli AcnB (Williams et al., 2002)
revealed a very high degree of conservation at the active-site despite this
reorganisation.
But the structure of AcnB also revealed the structure of an additional novel domain,
that is not present in other members of the aconitase family. A PROTEP search
revealed that this novel domain, which consists of a repeating pattern of pairs of alpha
10

helices, bears a strong resemblance to eukaryotic HEAT (Huntingtin-Elongation-A
subunit-TOR) -like domains, notably that in protein phosphatase 2A PR65/A (Groves
et al., 1999). A superposition of the four N-terminal HEAT repeat units of PR65/A on
repeat units I-IV of the AcnB N-terminal domain shows a striking alignment of seven
of the eight helices (as shown in Figure 4) with an RMS deviation of 1.92 Å over 74
core α-carbon atoms. HEAT proteins appear to have a common function in
protein:protein recognition in many cellular processes (Groves et al., 1999), raising the
possibility that the HEAT-like domains of AcnBs are likewise involved in
protein:protein recognition. What is more, the HEAT-like domain packs against the
remainder of the protein to form a tunnel leading to the AcnB active site. This
combination of a structural motif associated with protein:protein recognition and an
active-site channel, led to speculation that the AcnB tunnel might be involved in
substrate channelling to or from metabolically related enzymes (Williams et al., 2002).
This controversial idea, which relates to the 'metabolon' hypothesis of Srere (1985) -
who postulated that highly organized supra-molecular enzyme complexes
(‘metabolons’) may be responsible for catalyzing sequential reactions in some
metabolic pathways including the citric acid cycle - is now being investigated in further
functional studies.
Searching For Patterns Of Amino Acid Side-chains In Proteins
The second program to be discussed here, ASSAM, has been developed for the
representation and searching of patterns of amino acid side-chains in 3D space (Artymiuk
et al., 1994). The nodes in the graph representation here denote individual amino-acid
side-chains and the edges denote the inter-node geometric relationships. Specifically,
each node contains two pseudo-atoms, whose positions are chosen to emphasise the
functional part of the sidechain corresponding to that node. The locations of the two
pseudo-atoms are used to generate a vector, and each such vector corresponds to one of
the nodes in a graph. The geometric relationships between pairs of residues are defined
in terms of distances calculated between the corresponding vectors, and these
relationships correspond to the edges of a graph. Specifically, if we let S, M and E
11

denote the start, middle and end, respectively, of a vector, then the graph edges contain
five parts, these being the SS, SE, ES, EE and MM distances (although only a subset of
these five distances is normally used to specify a query pattern). A typical ASSAM
query pattern, for the serine protease catalytic triad pattern discussed in the next section,
is shown in Figure 5.
The vectorial representation is clearly an extremely simple description of the relative
orientations of the side-chains in a 3D protein structure. It does, however, have the
advantage that it does not over-define the orientations of ends of side-chains, as could
occur if a more precise representation was to be used that was based directly on the
individual atomic co-ordinates in the PDB. This is a useful feature for at least three
reasons: in medium-resolution protein-crystallographic studies, it is often difficult to get
the final torsion-angle value correct and so the fine details of the sidechain orientations
may be in doubt; the identifications of the individual atoms in a residue can often be
ambiguous; and side-chains can often move or twist, for example on binding substrates.
We have recently extended the program in two ways. First, the node labels now encode
not just the residue type but also the secondary structural state of the residue, the redox
state of cysteine residues, the solvent accessibility of the residue in the biologically
relevant multimer, and the distance of the residue from a bound ligand or known site.
This extra detail enables the user to narrow down the scope of a query, to reduce the
number of hits, and also to obtain more information from the results of a search. Second,
queries can now also be specified in terms of the main-chain of a residue, using vectors
drawn along the carbon-to-oxygen double bond, the nitrogen-to-hydrogen bond, or the α-
carbon-to-β-carbon bond.
Searches for the serine protease catalytic triad
The serine protease catalytic triad is a common active-site motif that is seen in several
families of enzyme and that is involved in cleaving peptide and ester bonds. Families
include: the trypsin-like enzymes, such as chymotrypsin, trypsin, thrombin, and elastase;
the fungal lipases; and bacterial subtilisin. The different families have emerged through
12

divergent and convergent evolution, with the active triad of residues that these proteins
have in common being composed of aspartic acid, histidine, and serine. Here, we have
used the serine protease catalytic triad from an α-chymotrypsin structure (PDB code
4CHA (Tsukada & Blow, 1985)), specifically chain A residues HIS57, ASP102, and
SER195 with S1S2, S1E2, E1S2, and E1E2 inter-vector distances at various tolerance levels
(0.5Å, 1.0Å, 1.5Å, and 2.0Å). The searches for this pattern (which is shown in Figure 5)
were run against a total of 9932 PDB structures, with the results shown in Table 2.
The 9932 PDB files were analysed to predict which structures should contain a triad of
residues similar to the active site of chymotrypsin, the predictions being obtained from
scanning of the header information and literature citations for each of the structures. 413
structures were predicted to contain an ASP-HIS-SER catalytic triad, and hits were
retrieved in 360 of these. Of the 53 files that did not produce hits, the lack of a hit in 48
can be explained by looking at mutation, covalent modification, etc. at the active site,
leaving just five predicted proteins that were not retrieved. However, three of the
missing five were retrieved when the search tolerance was increased to 3.0Å, and the
remaining two were retrieved when the tolerance was increased to 5.0Å. Recall for this
search was therefore 98.6%, at 2Å tolerance. The precision was 100%, as all hits match
the query pattern within the distance tolerance; however, not all of the retrieved matching
motifs occurred in serine protease-like enzymes.
In addition to these 360 predicted hits, unpredicted hits were retrieved in 189 files, spread
across various protein types, including non-fungal lipases, oligo-peptide binding proteins,
ribonucleoside reductases, and serine esterases. In some of these proteins the matching
motif is found to be at the active site of that protein, for example, in esterases, lipases,
and serine hydrolases. It is thus clear that this well known motif occurs much more
widely than might be expected.
A final search was performed that made use of the extended node descriptions.
Specifically, only matching motifs with secondary structure and solvent accessibility
matching that in the 4CHA structure were retrieved as hits. As expected, this resulted in
13

a substantial decrease in the numbers of matching structures, but without any additional
bias towards the predicted hits: the original search at 2Å tolerance retrieved 549 files, of
which 66% (360) were predicted, while the more detailed search retrieved 73 files, of
which only 58% (42) were predicted.
Searches for a zinc binding site
The second search discussed here was for the zinc-binding side-chains from a
thermolysin structure (PDB code 4TMN (Holden et al., 1987), chain E residues:
GLU166, HIS142, and HIS146, where the Zn++ ion is coordinated by OE1 of GLU166,
NE2 of HIS142, and NE2 of HIS146). The search used a 0.5Å distance tolerance, with
just the M1M2 inter-vector distances being specified, and identified 284 matching motifs
in 121 PDB files.
41 of the 121 hits were structures that contained zinc within the determined structure or
had named zinc coordination sites. The residues in these zinc binding sites were the
same as the residues in the matching motif in 35 of the 41 files: the residues of the
matching motif were found in named zinc coordination sites in 17 structures; and
inspection using RasMol (Sayle & Milner-White, 1995) showed that the matching motifs
were at the same position as the residues that ligand the zinc in the remaining 18 files.
One metallo-enzyme structure had the residues of the matching motif at a named iron
coordination site. Many of the matches were at zinc binding sites in thermolysin
structures, which is hardly surprising given that the query is generated from one such site.
Matching motifs were predicted in the 22 thermolysin structures of the dataset. All 22 of
these were retrieved by the search, giving 100% recall, but only 18% of the total number
of retrieved hits were predicted. When the native secondary structure and solvent
accessibility detail from 4TMN was added to the query, the search identified 71 matching
motifs in 38 files; here, 55% of the retrieved hits were predicted, as compared to 18% of
the 121 files in the initial search. Thus, unlike the catalytic triad search above, the
additional information here served to focus the output more closely on the structures that
were expected to contain the query motif.
14

Searches for a pattern of three tryptophan residues
The final searches discussed here involved an hypothetical pattern of three neighbouring
tryptophan side-chains, where the distance between the midpoints of residues one and
two was 3.4Å, and the distance between the midpoints of residues two and three was also
3.4Å: this distance was chosen as 3.4Å is the optimal stacking distance between aromatic
rings, but the motif was not taken from any specific known structure. The distance
between residues one and three was not specified.
The three-node motif was searched for using M1M2 inter-vector distances alone, at six
different distance tolerances (0.5Å, 1.0Å, 1.5Å, 2.0Å, 2.5Å, and 3.0Å) and the results are
included in Table 2. The hits were found in various types of protein. The 217 files
containing hits at 3.0Å tolerance can be grouped into 56 protein types, some containing
just one or two examples, but others (such as HIV-1 reverse transcriptase with 30
members) containing many more. One PDB file from each group was inspected and only
one had residues in the matching motif that are used in a named site: this is a zinc-α-2-
glycoprotein, with a ligand binding site that binds an unidentified ligand.
Pairs of tryptophan residues interact in different ways: face-to-face interactions occur
when the faces of the residues are stacked on top of each other; and edge-to-edge
interactions occur when the edges of the residues interact, without the faces interacting.
It was expected that the lower tolerance searches would retrieve motifs that were closer to
face-to-face interactions, and that as the tolerance increased there would be more scope
for retrieving edge-to-edge interactions. This expectation was based on the fact that
midpoint to midpoint distances were used, with an optimum face-to-face distance in the
query: therefore, a longer distance would be required to move the midpoints far enough
apart to allow only edge-to-edge interactions.
The retrieved hits generally followed this trend. At 1.0Å tolerance, the one retrieved hit
file was 1IIE (class II histocompatibility antigen (Jasanoff, Wagner & Wiley, 1998),
residues TRP168A, TRP168B, and TRP168C); inspection of the matching motif using
15

RasMol (Sayle & Milner-White (1995) revealed that the three residues are not entirely
stacked, but are slightly skewed so that all three residues are attempting face-to-face
interactions. This was also seen in 1NZY (4-chlorobenzoyl coenzyme A dehalogenase,
(Benning et al., 1996), residues TRP221A, TRP221B, and TRP221C) at 1.5Å tolerance.
At the other end of the tolerance scale, 3.0Å, the matching residues in 1A6U
(immunoglobulin (Simon, Henrick, Hirshberg & Winter, 2002), residues TRP93L,
TRP98L, and TRP347H) are positioned such that two of the residues are approximately
stacked and the other residue is placed to make edge-to-edge interactions with them both.
Examples such as these demonstrate the ability of the programme to carry out exhaustive
residue-based searches of the PDB, not just for existing motifs but also for ad hoc
searches that do not require the availability of such a motif for the formulation of a query.
As well as being effective, the program is also efficient in operation, e.g., the tryptophan
searches each required ca. 385 CPU seconds on a Silicon Graphics R10000 workstation
for scanning the file of 9932 PDB structures used here.
Conclusions
This paper has described the graph-theoretic methods that we have developed for
analysing protein structural information. Graph-theoretic methods provide a natural
complement to sequence-based approaches to bioinformatics, and are becoming
increasingly widely used for a range of purposes (Kanna & Vishveshwara, 1999;
Kleywegt, 1999; Koch, Kaden & Selbig, 1992; Pickering et al., 2001; Samudrala &
Moult, 1998). This trend is likely to grow substantially in the future as developments in
structural proteomics result in the appearance of very large numbers of new protein
structures. However, graph methods are completely general in character, and can be
applied to the structures of any type of macromolecule: thus, we have described graph-
based substructure searching in databases of carbohydrate (Bruno, Kemp, Artymiuk &
Willett, 1997) and RNA structures (Harrison, Artymiuk, South & Willett, 2002), in both
cases using an appropriately modified version of the Ullmann subgraph isomorphism
algorithm.
16

Our work on carbohydrates focused on the molecules in the Complex Carbohydrate
Structure Database (CCSD) (Doubet et al., 1989; Feizi and Bundle, 1996). Here, a
carbohydrate structure can be regarded as a labelled, directed graph, in which the nodes
of the graph denote the individual monosaccharides and the edges denote the glycosidic
linkages. More specifically, the root (or type) of each monosaccharide is given a three-
letter abbreviation, e.g., glucose and fructose are represented by Glc and Fru,
respectively. These node labels are augmented by the inclusion of information
concerning the ring size and the anomeric and absolute configurations. Glycosidic
linkages are represented as being from one particular point on a monosaccharide to
another, and each edge in a carbohydrate graph thus has an associated direction. The
node and edge labels in the resulting graphs are clearly far more detailed than in the
protein graphs considered thus far, but this merely provides additional information for a
subgraph isomorphism search. Experiments with a file of 33,174 CCSD structures
showed that the resulting search procedure was notably more effective than sequence-
based search software provided with the CCSD that took no account of the branched
nature of carbohydrate structures and that often resulted in false-drops.
Most recently, we have reported the first results of an ongoing study to develop graph-
theoretic methods for the representation and searching of RNA structures using
techniques that are similar to those in the ASSAM program described previously. Each
nucleic acid base is described by four pseudoatoms: by connecting these pseudoatoms to
give two specific pairs of atoms we can also consider the base to be represented by two
vectors and the relative positions of bases are described in terms of distances between the
defined start and end points of the vectors on each base. These points comprise the nodes
of a graph and the distances the edges of a graph, and we can hence represent a file of
RNA structures (we use those available in the PDB) by a file of graphs: this resulting file
can then be searched for user-defined patterns of bases by means of a subgraph
isomorphism procedure.
17

Our initial tests have involved searching for each of the possible 29 two hydrogen-
bonded base pairs described by Tinoco (1993). A training dataset was constructed in
which there were examples of 26 different types of these 29 pairs, and this was used to
specify the distance tolerances required to search for such query patterns. Given these
tolerance values, our search program, called NASSAM, was able to identify the locations
of non-canonical base pairs in this dataset with precision and recall values both well in
excess of 95%. The searches were then repeated on a test set that contained the large
complex 23S RNA from the 50S ribosomal subunit, and these searches gave entirely
comparable recall and precision values, demonstrating the basic effectiveness of our
graph representation in this simple situation. We have gone on to demonstrate
NASSAM’s ability to carry out effective searches for more complex patterns, including
all possible base triples comprising two, two hydrogen bonded base pairs, the adenosine
platform and larger motifs such as GNRA-tetraloop receptor type interactions and the A-
minor interaction. We have already been able to identify occurrences of complex
patterns that had not, to our knowledge, been previously identified.
We hence conclude that graph-based methods provide a powerful tool for unlocking
structural relationships between biological macromolecules that may not be evident using
existing, sequence-based approaches to database searching.
Acknowledgements. We thank the following: Ian Bruno, Eleanor Gardiner, Helen
Grindley, Anne-Marie Harrison, Nick Kemp, Eleanor Mitchell, Rungsang Nakrumpai,
Andrew Poirrette, David Rice, Darren South and Elizabeth Ujah for their contributions to
this work; the Royal Society, Tripos Inc. and the Wolfson Foundation for hardware and
software support; and the Biotechnology and Biological Sciences Research Council, the
Engineering and Physical Sciences Research Council, the Medical Research Council, the
Science and Engineering Research Council, and Tripos Inc. for funding. The Krebs
Institute for Biomolecular Research is a Biomolecular Sciences Centre of the
Biotechnology and Biological Sciences Research Council.
18

References
Altschul, S.F., Gish, W., Miller, W., Myers, E.W. & Lipman, D.J. (1990). Basic local alignment search
tool. Journal of Molecular Biology, 215, 403-410.
Artymiuk, P.J., Grindley, H.M., Poirrette, A.R., Rice, D.W., Ujah, E.C. & Willett, P. (1994). Identification
of β-sheet motifs, of ϕ-loops and of patterns of amino-acid residues in three-dimensional protein
structures using a subgraph-isomorphism algorithm. Journal of Chemical Information and
Computer Sciences, 34, 54-62.
Artymiuk, P.J., Poirrette, A.R., Grindley, H.M., Rice, D.W. & Willett, P. (1994). A graph-theoretic
approach to the identification of three-dimensional patterns of amino acid side-chains in protein
structures. Journal of Molecular Biology, 243, 327-344.
Artymiuk, P.J., Poirrette, A.R., Rice, D.W. & Willett, P. (1996). Biotin carboxylase comes into the fold.
Nature Structure Biology, 3, 128-132.
Artymiuk, P.J., Poirrette, A.R., Rice, D.W. & Willett, P. (1997). A polymerase 1 palm in adenylyl cyclase?
Nature, 388, 33-34.
Artymiuk, P.J., Rice, D.W., Mitchell, E.M. & Willett, P. (1990). Structural resemblance between the
families of bacterial signal-transduction proteins and of G proteins revealed by graph theoretical
techniques. Protein Engineering, 4, 39-43.
Barnard, J.M. (1993). Substructure searching methods: old and new. Journal of Chemical Information and
Computer Sciences, 33, 532-538.
Baxevanis, A.D. & Ouellette, B.F. (Eds.) (2001). Bioinformatics. New York: Wiley-Interscience.
Benning, M.M., Taylor, K.L., Liu, R-Q., Yang, G., Xiang, H., Wesenberg, G., Dunaway-Mariano, D. &
Holden, H.M. (1996). Structure of 4-chlorobenzoyl coenzyme A dehalogenase determined to 1.8Å
resolution: an enzyme catalyst generated via adaptive mutation. Biochemistry, 35, 8103-8109.
Berman, H.M., Battistuz, T., Bhat, T.N., Blum, W.F., Bourne, P.E., Burkhardt, K., Feng, Z., Gilliland,
G.L., Iype, L., Jain, S., Fagan, P., Marvin, J., Padilla, D., Ravichandran, V., Schneider, B., Thanki, N.,
Weissig, H., Westbrook, J.D. & Zardecki, C. (2002). The Protein Data Bank. Acta Crystallographica,
D58, 899-907.
Bernstein, F.C., Koetzle, T.F., Williams, G.J.B., Meyer, E.F., Brice, M.D., Rodgers, J.R., Kennard, O.,
Shimanouchi, T. & Tasumi, M. (1977). The Protein Data Bank: a computer-based archival file for
macromolecular structures. Journal of Molecular Biology, 112, 535-542.
Brint, A.T. & Willett, P. (1987a). Algorithms for the identification of three-dimensional maximal common
substructures. Journal of Chemical Information and Computer Sciences, 27, 152-158.
Brint, A.T. & Willett, P. (1987b). Pharmacophoric pattern matching in files of 3-D chemical structures:
comparison of geometric searching algorithms. Journal of Molecular Graphics, 5, 49-56.
Bron, C. & Kerbosch, J. (1973). Algorithm 457. Finding all cliques of an undirected graph.
Communications of the ACM, 16, 575-577.
19

Bruno, I.J., Kemp, N.M., Artymiuk, P.J. & Willett, P. (1997). Representation and searching of
carbohydrate structures using graph-theoretic techniques. Carbohydrate Research, 304, 61-67.
Bryant, S.H., Madej, T., Janin, J., Liu, Y., Ruoho, A.E., Zhang, G.Y. & Hurley, J.H. (1997). A polymerase
I palm in adenylyl cyclase? Reply. Nature, 388, 34-34.Crandell, C.W. & Smith, D.H. (1983).
Computer-assisted examination of compounds for common three-dimensional substructures. Journal
of Chemical Information and Computer Sciences, 23, 186-197.
Dean, P.M. (Ed.) (1994). Molecular similarity in drug design. Glasgow: Chapman and Hall.
Diestel, R. (2000). Graph theory. New York: Springer-Verlag.
Doubet, S., Bock, K., Smith, D., Darvill, A. & Albersheim, P. (1989). The Complex Carbohydrate
Structure Database. Trends in Biochemical Sciences, 14, 475-477.
Fan, C., Moews, P.C., Shi, Y., Walsh, C.T. & Knox, J.R. (1995). A common fold for peptide synthetases
cleaving ATP to ADP - glutathione synthetase and D-Alanine-D-Alanine ligase of Escherichia Coli.
Proceedings of the National Academy of Sciences of the USA, 92, 1172-1176.
Feizi, T. & Bundle, D. (1996). Carbohydrates and glycoconjugates. The coming age for oligosaccharide
ligands and databases for saccharide structures. Current Opinion in Structural Biology, 6, 659-662.
Figueras, J. (1986). Chemical structure handling by computer. In B.W Rossiter & J.F Hamilton (Eds.)
Physical methods of organic chemistry, Volume 1 (pp. 687-774). New York: John Wiley.
Flores, T.P., Moss, D.S. & Thornton, J.M. (1994). An algorithm for automatically generating
protein topology cartoons. Protein Engineering, 7, 31-37.
Gardiner, E.J., Artymiuk, P.J. & Willett, P. (1998). Clique-detection algorithms for matching three-
dimensional molecular structures. Journal of Molecular Graphics and Modelling, 15, 245-253.
Gati, G. (1979). Further annotated bibliography on the isomorphism disease. Journal of Graph Theory, 3,
95-109.
Good, A.C. & Mason, J.S. (1996). Three-dimensional structure database searches. Reviews in
Computational Chemistry, 7, 67-117.
Gray, N.A.B. (1986) Computer-assisted structure elucidation. New York: John Wiley. pp. 207-324.
Groves, M.R., Hanlon, N., Turowski, P., Hemmings, B.A. & Barford, D. (1999). The structure of the
protein phosphatase 2A PR65/A subunit reveals the conformation of its 15 tandemly repeated HEAT
motifs. Cell, 96, 99-110.
Gruer, M.J., Artymiuk, P.J. & Guest, J.R. (1997). The aconitase family: three structural variations on a
common theme. Trends in Biochemical Science, 22, 3-6.
Gund, P. (1977). Three-dimensional pharmacophoric pattern searching. Progress in Molecular and
Subcellular Biology, 5, 117-143.
Hagadone, T.R. (1992). Molecular subsimilarity searching: efficient retrieval in two-dimensional structure
databases. Journal of Chemical Information and Computer Sciences, 32, 515-521.
Harrison, A.-M., Artymiuk, P.J., South, D.R. & Willett, P. (2002). Representation and searching of non-
canonical base-pairs in complex RNA structures, submitted for publication.
20

Holden, H.M., Tronrud, D.E., Monzingo, A.F., Weaver, L.H. & Matthews, B.W. (1987). Slow- and fast-
binding inhibitors of thermolysin display different modes of binding: crystallographic analysis of
extended phosphonamidate transition-state analogues. Biochemistry, 26, 8542-8553.
Hutchinson, E.G. & Thornton, J.M. (1990). HERA - A program to draw schematic diagrams of protein
secondary structures. Proteins: Structure, Function, and Genetics, 8, 203-212.
Jasanoff, A., Wagner, G. & Wiley, D.C. (1998). Structure of a trimeric domain of the MHC class II-
associated chaperonin and targeting protein II. EMBO Journal, 17, 6812-6818.
Johnson, M.A. & Maggiora, G.M. (Eds.) (1990). Concepts and Applications of Molecular Similarity. New
York: John Wiley.
Kanna, N. & Vishveshwara, S. (1999). Identification of side-chain clusters in protein structures by a graph
spectral method. Journal of Molecular Biology, 292, 441-464.
Klausner, R.D. & Rouault, T.A.(1993). A double life - cytoplasmic aconitase as a regulatory RNA binding
protein. Molecular Biology of the Cell, 4, 1-5.
Kleywegt, G.J. (1999). Recognition of spatial motifs in protein structures. Journal of Molecular Biology,
285, 1887-1897.
Koch, I., Kaden, F. & Selbig, J. (1992). Analysis of protein sheet topologies by graph theoretical methods.
Proteins: Structure, Function and Genetics, 12, 314-323.
Kraulis, P.J. (1991). Molscript - a program to produce both detailed and schematic plots of protein
structures. Journal of Applied Crystallography, 24, 946-950.
Lengauer, T. (Ed.) (2001). Bioinformatics – from genomes to drugs. Weinheim: Wiley-VCH.
Lesk, A.M. (2002). Introduction to bioinformatics. Oxford: Oxford University Press.
McGregor, J.J. (1982). Backtrack search algorithms and the maximal common subgraph problem.
Software Practice and Experience, 12, 23-34.
Martin, Y.C., Bures, M.G., Danaher, E.A., DeLazzer, J., Lico, I. & Pavlik, P.A. (1993). A fast new
approach to pharmacophore mapping and its application to dopaminergic and benzodiazepine
agonists. Journal of Computer-Aided Molecular Design, 7, 83-102.
Martin, Y.C. & Willett, P. (Eds.) (1997). Designing bioactive molecules: three-dimensional techniques and
applications. Washington DC: American Chemical Society.
Messmer, B.T. & Bunke, H. (1999). A decision tree approach to graph and subgraph isomorphism
detection. Pattern Recognition, 32, 1979-1998.
Mitchell, E.M., Artymiuk, P.J., Rice, D.W. & Willett, P. (1990). Use of techniques derived from graph
theory to compare secondary structure motifs in proteins. Journal of Molecular Biology, 212, 151-
166.
Ollis, D.L., Brick, P., Hamlin, R., Xuong, N.G. & Steitz, T.A. (1985). Structure of large fragment of
Escherichia-coli DNA polymerase I complexed with DTMP. Nature, 313, 762-766.
Pickering, S.J., Bulpitt, A.J., Efford, N., Gold, N.D. & Westhead, D.R. (2001). AI-based algorithms for
protein surface comparisons. Computers and Chemistry, 26, 79-84.
21

Ray, L.C. & Kirsch, R.A. (1957). Finding chemical records by digital computers. Science, 126, 814-819.
Raymond, J.W., Gardiner, E.J. & Willett, P. (2002). Heuristics for similarity searching of chemical graphs
using a maximum common edge subgraph algorithm. Journal of Chemical Information and Computer
Sciences, 42, 305-316.
Read, R.C. & Corneil, D.G. (1977). The graph isomorphism disease. Journal of Graph Theory, 1, 339-
363.
Salton, G. & Sussenguth, E.H. (1963). Automatic structure-matching applications and some typical
retrieval applications. In G. Salton, G. (Ed.) Report ISR-4 to the Office of Aerospace Research (pp.
V-1-V.47). Cambridge MA: Harvard University Computation Laboratory.
Samudrala, R. & Moult, J. (1998). A graph-theoretic algorithm for comparative modelling of protein
structure. Journal of Molecular Biology, 279, 287-302.
Sayle, R.A. & Milner-White, E.J. (1995). RasMol: biomolecular graphics for all. Trends in Biochemical
Sciences, 20, 374-376.
Simon, T., Henrick, K., Hirshberg, M. & Winter, G. (2002). X-ray structures of Fv fragment and its (4-
hydroxy-3-nitrophenyl) acetate complex of murine B1-8 antibody, in press.
Srere, P.A. (1985). The Metabolon. Trends in Biochemical Science, 10, 109-110.
Sussenguth, E.H. (1965). A graph-theoretic algorithm for matching chemical structures. Journal of
Chemical Documentation, 5, 36-43.
Tesmer, J.J.G., Sunahara, R.K., Johnson, R.A., Gosselin, G., Gilman, A.G. & Sprang, S.R. (1999). Two-
metal-ion catalysis in adenylyl cyclase. Science, 285, 756-760
Tinoco, I. (1993). Structures of base pairs involving at least two hydrogen bonds. In: Gesteland, R.F. &
Atkins, J.F. (Eds.) The RNA world (pp. 603-607). Cold Spring Harbour: Cold Spring Harbour
Laboratory Press.
Trinajstic, N. (Ed.) (1983). Chemical graph theory. Chichester: Ellis Horwood.
Tsukada, H. & Blow, D.M. (1985). Structure of alpha-chymotrypsin refined at 1.68Å resolution. Journal of
Molecular Biology, 184, 703-711.
Ullmann, J.R. (1976). An algorithm for subgraph isomorphism. Journal of the Association for Computing
Machinery, 23, 31-42.
van Rijsbergen, C.J. (1979). Information retrieval. 2nd edition. London: Butterworth.
Willett, P. (Ed.) (1986). Modern approaches to chemical reaction searching. Aldershot: Gower.
Willett, P. (1991). Three-dimensional chemical structure handling. Taunton: Research Studies Press.
Willett, P. (2001). Textual and chemical information retrieval: different applications but similar
algorithms. Information Research, 5(2) at URL http://InformationR.net/ir/5-2/infres52.html
Willett, P., Barnard, J.M. & Downs, G.M. (1998). Chemical similarity searching. Journal of Chemical
Information and Computer Sciences, 38, 983-996.
22

23
Williams, C.H., Stillman, T.J., Barynin, V.V., Sedelnikova, S.E., Tang, Y., Green, J., Guest, J.R. &
Artymiuk, P.J. (2002). E. coli aconitase B structure reveals a HEAT-like domain with implications
for protein-protein recognition. Nature Structure Biology, 9, 447-452.
Wilson, R. (1996). Introduction to graph theory. 4th edition. Harlow: Longman. Zhang, G., Lui, Y. & Hurley, J.H. (1997). Structure of the adenylyl cyclase catalytic core. Nature, 386,
247-253.
Related Proteins Common Features Comments
Adenylyl cyclase & DNA polymerase I Four β-strands and three α-helices Structural and mechanistic similarities led to identification of
active site residues and evidence for evolutionary relationship.
Biotin carboxylase, D-alanine:D-alanine ligase,
and glutathione reductase
13 β-strands and nine α-helices Structural and mechanistic similarities provide strong evidence for
an evolutionary relationship.
Aconitase B and HEAT-like domains Seven α-helices Structural resemblance led to suggestion of involvement of
aconitase B in substrate tunnelling in multi-enzyme complex.
Leucine aminopeptidase and carboxypeptidase Eight β-strands in a sheet plus five α-
helices
Minimal sequence homology even in the area of structural overlap.
Ribonuclease H domain of HIV-1 reverse
transcriptase (RT) and the ATPase folds of
hexokinase, heat-shock cognate protein and actin
Five β-strands in a sheet plus one α-helix. No other proteins in the PDB contained this β-sheet. The common
motif also occurs in an intramolecular resemblance between the
same ribonuclease H domain of RT and two other domains of RT
Biotin synthetase/repressor protein and serine
tRNA synthetase
Seven β-strands, with two α-helices on
either side of the sheet
No other proteins in the PDB contained this β-motif when the
similarity was first identified. Similar reactions catalysed.
Prealbumin, protocatechuate 3,4-dioxygenase and
thaumatin
One three-stranded and one four-stranded
β-sheet.
Resemblance probably due to a particularly stable folding motif
β-Glucosyltransferase and glycogen
phosphorylase
13 β-strands and eight α-helices, plus a
further two strands and three helices
additional to the large core feature
Structural and chemical similarities suggest a remote evolutionary
relationship.
Enoyl ACP reductase and 3α,20β-hydroxysteroid
dehydrogenase
Seven β-strands and four α-helices Definite evolutionary relationship; low-level sequence
resemblances underlies structural resemblance. Suggestion of
likely enzyme mechanism for ENR by analogy with HSD.
Table 1. Previously unrecognised structural resemblances identified by use of the PROTEP program.

Query Inter-vector distance
tolerance (in Å) for a
match
Inter-vector
distances used in
the search
Number of structures in the
dataset containing one or more
matching motifs
0.5 SS, SE, ES, EE 149
1.0 348
1.5 458
4CHA: residues HIS57, ASP102
and SER195
2.0 549
4TMN: residues HIS142, HIS146
and GLU166
0.5 MM 121
0.5 0
1.0 1
1.5 4
2.0 39
2.5
TRP1 TRP2 TRP3: 3.4Å midpoint
to midpoint distance between
TRP1 and TRP2 and between
TRP2 and TRP3
3.0
MM
114
217
Table 2. Searches of the Protein Data Bank using the ASSAM program.
25

Captions for figures
Figure 1. Calculation of the distance and angle matrix for PROTEP. (a) A simple
schematic protein structure is shown comprising three secondary structure elements
(SSEs): an α-helix, labelled A and represented by a cylinder; and two β-antiparallel
strands labelled 1 and 2, and represented by arrows. The closest approach distance and
torsion angle between each pair of SSEs can be calculated, for example θ is the torsion
angle between strand-2 and helix-A, d is the distance between strand 1 and helix A. (b)
The complete matrix for the structure in (a) is shown with angles in degrees and distances
in Ångstroms.
Figure 2. Diagrams (Kraulis, 1991) of (a) an AC catalytic domain, and (b) the palm
domain of DNA polymerase I. The equivalent helices and strands are represented as
coiled ribbons and sequentially numbered arrows respectively. All helices and strands
occur in the same order in both structures. The additional strand and helix at the C-
terminal of AC are shown in black, other non-equivalent parts of the structures are shown
as smoothed α-carbon traces. Side chains implicated in the activity of the polymerase
are shown as black ball-and-stick atoms in (b); the binding site of a forskolin inhibitor of
AC is shown as white ball-and-stick atoms in (a).
Figure 3. Topological diagrams (Flores, Moss & Thornton, 1994) of (a) BC, (b) GSHase
and (c) DD-ligase. Circles represent α-helices and triangles represent β-strands (apex
down indicates the strand is running down into the plane of the paper, i.e., viewed from
the N-terminus). Open circles and triangles indicate those SSEs that were found by the
PROTEP search to superpose in 3D, and the shaded ones are those that do not. The
equivalenced strands in the beta sheets are numbered, and the equivalenced helices
lettered, according to their order in the sequence. Black shapes indicate the ATP and
substrate binding sites in (b) and (c) and the tentative position of the active site of BC in
(a).
26

Figure 4. Superposed α-carbon chain traces (Kraulis, 1991) of the first HEAT domain of
the PR65/A protein (black) on helices α2-α9 of the novel AcnB domain (white).
Figure 5. The ASSAM representation of side chains. Diagram of an aspartate-histidine-
serine catalytic triad pattern showing the locations of pseudoatoms (white circles) used to
represent side chains in ASSAM. Arrows represent the vectors between pseudoatoms
within a side chain, and dotted lines represent the distances between pseudoatoms used in
pattern matching, with heteroatoms shaded dark. Diagram produced with Rasmol (Sayle
& Milner-White, 1995).
27

(a)
(b)
Figure 1.
28

Figure 2.
29

Figure 3.
30

Figure 4.
31

Asp
His
Ser
StartEndPseudo-atoms
Asp
His
Ser
StartEndPseudo-atoms
Figure 5.
32