graph interaction through dynamics-based skeletal animation · graph interaction through...
TRANSCRIPT

Graph Interaction through
Dynamics-Based Skeletal Animation
COLIN MURRAY
A dissertation submitted in partial fulfillment of
the requirements for the degree of
Bachelor of Computer Science and Technology (Advanced) (Honours)
Supervisors:
Dr. Masahiro Takatsuka
Damian Merrick
School of Information Technologies
The University of Sydney
Australia
2 November 2003

Abstract
Skeletal animation is a concept that has been used in the areas of motion pictures and com-
puter games to create realistic motion for the animation of articulated characters. Recent work
has applied skeletal animation techniques from inverse kinematics to the field of graph interac-
tion. The previous work introduced an interesting idea suggesting a skeletal graph interaction
system would be intuitive and natural. However, due to problems with the skeletal animation
techniques used, the benefits of the system were limited.
This thesis investigates the use of a new dynamics-based technique previously used in the
area of skeletal animation for graph interaction. The motivation for this work was to improve
upon the previous work by providing a skeletal graph interaction system that reduces the diffi-
culty and time taken in navigating the graph and increases the amount of information that can
be interpreted and understood. We have adapted this technique and implemented it in a graph
interaction environment allowing the user to drag nodes of the skeleton in order to manipulate
the layout of the graph. The graph reacts to the user movement while maintaining the physical
constraints placed upon it by the skeletal metaphor. We have also conducted a user study, the
results of which confirm the usefulness of both this new technique and the skeletal metaphor in
aiding the user’s understanding of a graph.
ii

Acknowledgements
I would like to express my gratitude to:
• Damian Merrick, for providing a huge amount of support, advice and encouragement
at every stage throughout the year.
• Masahiro Takatsuka, for his ever-present ideas and advice.
• The rest of the Information Visualisation Research Group, for their suggestions and dis-
cussions about the project.
• All those who participated in the user study.
• Mum and Dad, for always supporting me.
• Brian, Cassie & Tanya for providing many distractions and keeping me sane.
• All the guys in G28, for making Computer Science Honours such an enjoyable and un-
forgettable experience.
iii

Conventions
Several conventions are utilised throughout this thesis.
The thesis is divided into chapters, numbered in sequential order starting from Chapter 1.
Each chapter is divided into sections. (e.g. Chapter 3 contains Section 3.2). The Contents part
of this thesis gives the page numbers and titles of each chapter and section.
Figures are numbered sequentially within each chapter, the second figure of Chapter 3 be-
ing Figure 3.2. A list of figures is given on the pages immediately following the Contents part
of the thesis.
Pseudocode is provided throughout the thesis.All pseudocode is presented
in this typeface.
iv

CONTENTS
Abstract ii
Acknowledgements iii
Conventions iv
List of Figures vii
Chapter 1. Introduction 1
1.1. Aim of the Project . . . . . . . . . . . . . . . . . . . . . . . . . . . . . . . . . . . . . . . . . . . . . . . . . . . . . . . . . 1
1.2. Motivation . . . . . . . . . . . . . . . . . . . . . . . . . . . . . . . . . . . . . . . . . . . . . . . . . . . . . . . . . . . . . . . . 3
1.3. Summary of Contribution . . . . . . . . . . . . . . . . . . . . . . . . . . . . . . . . . . . . . . . . . . . . . . . . . . 6
1.4. Structure of this Thesis. . . . . . . . . . . . . . . . . . . . . . . . . . . . . . . . . . . . . . . . . . . . . . . . . . . . . 7
Chapter 2. Literature Review 8
2.1. Graph Drawing. . . . . . . . . . . . . . . . . . . . . . . . . . . . . . . . . . . . . . . . . . . . . . . . . . . . . . . . . . . . 8
2.2. Layout Algorithms . . . . . . . . . . . . . . . . . . . . . . . . . . . . . . . . . . . . . . . . . . . . . . . . . . . . . . . . 11
2.3. Graph Interaction . . . . . . . . . . . . . . . . . . . . . . . . . . . . . . . . . . . . . . . . . . . . . . . . . . . . . . . . . . 16
2.4. Physical Metaphors for Graph Interaction . . . . . . . . . . . . . . . . . . . . . . . . . . . . . . . . . . . . 21
2.5. Skeletal Animation . . . . . . . . . . . . . . . . . . . . . . . . . . . . . . . . . . . . . . . . . . . . . . . . . . . . . . . . 23
2.6. Skeletal Animation in Graph Interaction . . . . . . . . . . . . . . . . . . . . . . . . . . . . . . . . . . . . . 26
Chapter 3. A System for Force-Based Skeletal Graph Interaction 29
3.1. A Particle System for Skeletal Animation . . . . . . . . . . . . . . . . . . . . . . . . . . . . . . . . . . . . 29
3.2. Implementation of the Particle System in a Graph Interaction Environment . . . . . . 36
3.3. Implementation of a Force-Directed Algorithm in a Graph Interaction
Environment . . . . . . . . . . . . . . . . . . . . . . . . . . . . . . . . . . . . . . . . . . . . . . . . . . . . . . . . . . . . . . 45
3.4. Computational Complexity of the methods used . . . . . . . . . . . . . . . . . . . . . . . . . . . . . . 47
v

CONTENTS vi
Chapter 4. Evaluation of Skeletal Animation Techniques in Graph Interaction 48
4.1. User Study. . . . . . . . . . . . . . . . . . . . . . . . . . . . . . . . . . . . . . . . . . . . . . . . . . . . . . . . . . . . . . . . 48
4.2. Results & Discussion . . . . . . . . . . . . . . . . . . . . . . . . . . . . . . . . . . . . . . . . . . . . . . . . . . . . . . 55
4.3. Comparison of the Particle System with Previous Techniques . . . . . . . . . . . . . . . . . . 62
Chapter 5. Conclusion 70
5.1. Research Contribution . . . . . . . . . . . . . . . . . . . . . . . . . . . . . . . . . . . . . . . . . . . . . . . . . . . . . 70
5.2. Future Work . . . . . . . . . . . . . . . . . . . . . . . . . . . . . . . . . . . . . . . . . . . . . . . . . . . . . . . . . . . . . . 72
References 74
Appendix A. System Screenshots 81
Appendix B. User Survey Forms 88

List of Figures
2.1 An Example of a Polyline Graph Drawing (Source: [Gutwenger98]). 9
2.2 An Example of a Straight-Line Graph Drawing (Source: [Eades99]). 9
2.3 An Example of an Orthogonal Graph Drawing (Source: [Biedl98a]). 9
2.4 An Example of an Upward Graph Drawing (Source: [Germano99]). 10
2.5 An Example of a Visibility Representation of a Graph (Source: [Kant97]). 10
2.6 The Evolution of a Force-Directed Graph Drawing (Source:
[Davidson96]). 12
2.7 Fisheye view of a regular grid of the plane (Source: [Herman00]). 17
2.8 Initial Configuration showing Desired End-Effector Position and a
Possible Final Configuration (Source: [Merrick02 ]). 24
2.9 An example screenshot from the first system developed for skeletal
animation in graph interaction (Source: [Merrick02 ]). 27
3.1 An Articulated Figure Representing a Character’s Skeleton (Source:
[Jakobsen01]). 30
3.2 Dragging an Articulated Figure around an environment in IO Interactive’s
"Hitman: Codename 47". (Source: http://www.ign.com). 31
3.3 Motion governed by Verlet integration within a box environment. (Source:
[Jakobsen01]). 33
3.4 The stick constraint is validated by moving the particles closer together or
further apart (Source: [Jakobsen01]). 33
3.5 Two rigid bodies connected by a pin joint to form an articulated body
(Source: [Jakobsen01]). 35
vii

L IST OF FIGURES viii
3.6 Two rigid bodies connected by a hinge joint to form an articulated body
(Source: [Jakobsen01]). 35
3.7 The length of the dotted line must exceed some threshold. This simulates
an angular constraint. (Source: [Jakobsen01]). 35
3.8 A simplified outline of the execution process of our implementation of the
particle system in a graph interaction environment. 36
3.9 Initial Configuration Showing Desired Position of End-Effector. 40
3.10 Movement of the Node to the Desired Position followed by the Constraint
Solver Produces the Final Configuration. 40
3.11 As neither node is fixed, the edge-length constraint is easily satisfied. 41
3.12 Both nodes are fixed. It is not possible to satisfy the edge-length
constraint, as moving the nodes closer together would violate the fixed
nodes constraint. 41
3.13 All constraints are satisfied. This is indicated by green edges of standard
width. 43
3.14 Some edge-length constraints are not satisfied. This is indicated by edges
of varying width and colour. 43
4.1 The graph used for part 1 of the user study. 49
4.2 The graph used for part 2 of the user study. 52
4.3 The web graph used for part 3 of the user study. 54
4.4 The hex game graph used for part 3 of the user study. 54
4.5 The results for part 1 of the user study. 64
4.6 The results for part 2 of the user study. 65
4.7 The results for the web graph in part 3 of the user study. 66
4.8 The results for the hex game graph in part 3 of the user study. 67
4.9 Comparing the results for web and hex graphs using the skeletal technique. 68

L IST OF FIGURES ix
4.10 Comparing the results for web and hex graphs using the skeletal technique
with angular constraints. 69
A.1 Dragging nodes using our dynamics-based skeletal graph interaction
system. By ensuring the constraints are satisfied, it quickly produces a
much better graph drawing and allows us to improve our understanding of
the graph structure. 81
A.2 Top: A highly stretched graph using the technique without a threshold.
Bottom: A graph stretched as far as possible using the technique with a
threshold. 82
A.3 The graph in part 2 of the study using the force-directed algorithm. 83
A.4 The graph in part 2 of the study using the standard skeletal technique. 84
A.5 The graph in part 2 of the study using the skeletal technique with angular
constraints. 85
A.6 The web graph in part 3 of the study. Top: using the standard skeletal
technique results in bunching up of nodes. Bottom: using the skeletal
technique with angular constraints gives a much better angular resolution. 86
A.7 The articulated figure from figure 3.1 represented by a graph in our graph
interaction environment. 87

CHAPTER 1
Introduction
1.1. Aim of the Project
A relational network or graph is commonly used to represent relations between objects. A
graph consists of a set of nodes and edges, where nodes represent objects and edges represent
the relationship between objects. Edges can be directed or undirected.
Graph drawing takes the set of nodes and edges of a graph and assigns coordinates to the nodes
so that they can be drawn. The aim of graph drawing is to produce a picture that allows the
viewer to easily understand the information that is represented by a graph. A lot of research has
been done in the area of graph drawing and this is given in more detail in Chapter 2 on page 8.
While a number of good graph drawing algorithms have been developed, there are always
situations, particularly in 3D, where the layout provided is difficult to understand. In these
situations it is desirable to have a mechanism to allow the viewer to modify both the graph
layout and their view of this layout. Graph interaction techniques are designed to provide this
mechanism.
Graph interaction is a field that aims to complement graph drawing by reducing the difficulty
and time taken in understanding the information that is being represented by a graph. Effective
1

1.1. AIM OF THE PROJECT 2
interaction techniques have the potential to reduce the time that an analyst needs in order to nav-
igate the presented information, and increase the amount of information that can be interpreted
and understood.
The aim of this project is to investigate graph interaction methods and provide a graph inter-
action system that allows the analyst to understand a graph’s structure more quickly and easily
than other graph interaction systems. This goal is achieved by using a skeleton as a physical
metaphor for a graph and using a skeletal animation technique that is very highly suited for this
purpose.
There are a large number of skeletal animation techniques available. This thesis describes
different skeletal animation techniques and how they can be adapted to provide an intuitive
graph interaction environment. It also evaluates these particular techniques in terms of their
usefulness in graph interaction, both against each other and against other techniques for graph
interaction. This evaluation aims to demonstrate that the skeletal metaphor is useful for graph
interaction, and also to show which skeletal animation techniques are best suited for this pur-
pose. The evaluation aims to affirm or reject the following hypotheses:
a) New techniques will have a positive effect on the simulation of the skeletal metaphor in
graph interaction.
b) The use of the skeletal metaphor will have a positive effect on the user’s ability to
understand the graph structure
Graphs are used in a variety of domains and the skeletal metaphor is potentially useful in many
graph drawing domains. This thesis will also briefly explore the areas of web graphs and the
hex game graph as domains in which skeletal graph interaction could be useful.

1.2. MOTIVATION 3
1.2. Motivation
Graph Visualisation
While graph visualisation has been an area of great interest for researchers, the basis on which
it has been built isn’t perfect. Graph drawing algorithms are generally designed to optimise
certain aesthetic criteria. Examples of aesthetic criteria include minimisation of crossings,
area, bends and maximisation of smallest angle and symmetries. The extent to which a graph
drawing satisfies this criteria is often used as a basis for evaluating its understandability.
A study by Purchase et al. has shown that aesthetic criteria are not always the best way of
drawing or measuring the understandability of a graph [Purchase00]. It argues that, because
graph drawing algorithms are often developed without a specific domain in mind, they are
often not useful once they are applied to domain-specific graphs. The characteristics of an
understandable graph drawing are shown to be highly dependent upon the domain in which
the graph is being drawn. Therefore the aesthetic criteria may not be a reliable measure of the
understandability of a graph. If these graph drawing algorithms are based upon the aesthetic
criteria, their ability to produce an understandable graph drawing is not guaranteed.
It is also reasonable to suggest that the level of readability of a graph is dependent upon the
viewer. Different analysts may gain different levels of understanding from the same graph
drawing. They may also respond differently to certain characteristics of a graph drawing.
In most cases, it seems somewhat naive to provide an analyst with only one drawing of a graph.
If they are unable to understand the graph based on this one drawing, they will have no further
avenue in which to comprehend the information. There may also be no individual drawing of
a graph that is easily understandable in its entirety. By viewing several different visualisations
of the same graph, the user is more likely to obtain an understanding.

1.2. MOTIVATION 4
By providing the user with a mechanism to change the graph drawing, we provide infinite ways
in which the graph may be represented. Not only will this allow changes to be made to an
incomprehensible graph, the changes will also be made by the analyst who is attempting to
understand the graph. By providing their own graph drawing, they are more likely to produce
a representation that they themselves are able to understand.
Graph Interaction
Simply providing the user with the ability to change the positions of nodes may not be enough.
We would like to assist the user in finding a good layout. Graph interaction allows the user to
make changes to a graph drawing with the aim of increasing the understanding of the graph
within a short time. Graph interaction techniques determine how the graph will respond to
input from the user, determining how quickly and easily they will find an understandable con-
figuration.
One such way in which we can control how movements by the user will result in changes to the
graph is through the use of a physical metaphor. The aim of a physical metaphor is to simulate
a physical structure that the user is familiar with. This will result in changes that feel natural
to the user. Any graph interaction technique should feel natural and intuitive, and a useful
physical metaphor is able to provide this.
This leads to the question of what physical metaphor would be suitable for graph interaction.
Such a metaphor must be easily mapped onto a graph structure. A physical metaphor with these
properties that was recently introduced [Merrick02 ] is the skeletal structure. A skeleton in this
case may be seen as a system of bones of fixed length connected by joints that may be rotated
at any angle.
The skeletal structure has many advantages. Firstly, it is easily mapped onto a graph. The nodes
of the graph are mapped to the joints of the skeleton and the edges of the graph are mapped

1.2. MOTIVATION 5
to the bones of the skeleton. As the user drags a node, other nodes will move and joints will
rotate. The interaction technique must ensure that edge-lengths remain constant.
The second major advantage of the skeletal metaphor is that a large amount of research has
been performed in the area of skeletal animation. The majority of skeletal animation research
has been driven by its need in robotics, computer games and motion pictures. These algorithms
can also be applied to the graph structure. As a result we have a large number of algorithms to
choose from and are likely to be able to find a technique that is suited to both skeletal animation
and graph interaction.
The skeleton is also a structure that is manipulated by humans on a regular basis and therefore,
it should feel natural and intuitive.
While Merrick introduced the skeletal metaphor, the skeletal animation techniques he used did
not provide as natural a feel as expected. As a result, there remains a need for an investigation
into other skeletal animation techniques, and an implementation of the skeletal metaphor in a
graph drawing environment that fully realises its potential in terms of its ability to increase the
user’s understanding of a graph.
Potential Applications
Merrick has mentioned domains in which the skeletal metaphor could be useful. The domains
mentioned were PERT diagrams, cluster trees and graphs containing an inherent hierarchy. Web
graphs are another area where the skeletal metaphor could be useful. The skeletal metaphor is
potentially useful in any application where it is crucial to visualize structural information as
graphs.

1.3. SUMMARY OF CONTRIBUTION 6
1.3. Summary of Contribution
This thesis makes several contributions to the field of graph interaction. We provide a brief
summary here and the remainder of this thesis will detail how they were achieved.
We have introduced a technique from skeletal animation as a method that can be used for graph
interaction tasks. We have also provided additional features designed to make it even more
suitable for graph interaction. This technique improves upon the previous techniques used for
skeletal animation in graph interaction.
We have demonstrated the usefulness of the skeletal metaphor through a comprehensive user
study into the benefits of the skeletal metaphor and the different methods used. The results
show that the skeletal techniques are much more effective at providing a mechanism for which
the user can easily understand the graph and provides solid evidence of the usefulness of the
skeletal metaphor. We have also provided some evaluation of the skeletal metaphor in the
domains of web graphs and the hex game graph to give further insight into how useful it is.
We have also added to the definition of the skeletal metaphor to further improve its utility. We
have added the condition of angular constraints. This adds even more realism to the structure
of the graph and further increases its usefulness for graph interaction.
This work adds to the field of graph interaction by providing a natural system of navigating a
graph with the ability to increase the user’s understandability of the graph structure.

1.4. STRUCTURE OF THISTHESIS 7
1.4. Structure of this Thesis
Chapter 2 provides a summary of previous research in the areas of Graph Drawing, Layout
Algorithms, Graph Interaction, Physical Metaphors for Graph Interaction, Skeletal Animation
and Skeletal Animation in Graph Interaction.
Chapter 3 provides a description of the methods that we have used for simulating skeletal
animation in a graph drawing environment. It also provides the details of our implementation.
Chapter 4 describes the process of evaluating the use of the skeletal metaphor through a usabil-
ity study.
Chapter 5 concludes with a review of the project’s goals and results, and details areas that are
seen as future research possibilities.

CHAPTER 2
Literature Review
This chapter provides an overview of prior research done in the areas of research that are
applicable to this project. In each section below, the focus is on the literature that is most
relevant to the research that is documented by this dissertation.
2.1. Graph Drawing
Graphs have been used for a long time in conveying information and as a result of this a lot of
research has been done in the area of graph drawing. Graph drawing or visualisation takes the
set of nodes and edges of a graph and assigns coordinates to the nodes so that they can be drawn.
This produces a drawing that provides a geometric representation for a set of relational data.
The aim of graph drawing is to produce a picture that allows the viewer to easily understand
the information that is represented by a graph [Battista94, Battista99].
A particular embedding of a graph drawing defines the ordering of edges around each node.
While a given graph has an infinite number of possible graph drawings it has a possibly very
large but finite number of embeddings.
In an attempt to increase graph comprehensibility, graphs have been drawn in many different
ways. Polyline [Gutwenger98] (See Figure 2.1), straight-line [Eades99] (See Figure 2.2),
orthogonal [Biedl98a] (See Figure 2.3), upward [Hutton96] (See Figure 2.4) and visibility
8

2.1. GRAPH DRAWING 9
representation [Kant97] (See Figure 2.5) are often used. A graph may be drawn in two or three
dimensions.
FIGURE 2.1. An Example of a Polyline Graph Drawing (Source: [Gutwenger98]).
FIGURE 2.2. An Example of a Straight-Line Graph Drawing (Source: [Eades99]).
FIGURE 2.3. An Example of an Orthogonal Graph Drawing (Source: [Biedl98a]).
Various aesthetic criteria have been discussed which attempt to measure the readability of a
graph drawing by general optimisation goals [Esposito88, Sugiyama87, Tamassia88]. Exam-
ples of aesthetic criteria include minimisation of crossings, area, bends and maximisation of
smallest angle and symmetries [Battista94]. In many cases, it is not possible to completely

2.1. GRAPH DRAWING 10
FIGURE 2.4. An Example of an Upward Graph Drawing (Source: [Germano99]).
FIGURE 2.5. An Example of a Visibility Representation of a Graph (Source: [Kant97]).
satisfy more than one aesthetic criteria simultaneously. It is also common to have an additional
criterion requiring that certain constraints are satisfied [Dengler93]. Examples of possible con-
straints are keeping a certain vertex in a fixed position or keeping a group of vertices close
together.

2.2. LAYOUT ALGORITHMS 11
2.2. Layout Algorithms
An algorithm for producing a graph drawing is known as a layout algorithm. As a result of the
large amount of research into graph drawing, many layout algorithms have been developed that
attempt to optimise specific aesthetic criteria. Di Battista et al. provide a good review of these
[Battista94, Battista99].
There are several types of graphs that require different layout algorithms. A planar graph
can be drawn in the plane such that no two edges cross. Such planar graph drawings are
easy to understand. Methods have been discussed that test for planarity and construct a planar
embedding in linear time [Hopcroft74, Lempel67]. However, these are difficult to implement
because they are quite complicated and hard to understand.
Directed graphs have the feature that each edge has a specified direction. The visualisation
of organisational hierarchies and biochemical pathways are areas where directed graphs have
been used [Schreiber02]. When graphs are directed we desire that all edges follow the same
direction and this is the goal of upward graph drawing for directed planar graphs. Upward graph
drawings are most effective when the graph is acyclic. The Sugiyama method [Sugiyama81]
is commonly used for both planar and non-planar graphs.
The focus in this thesis is on general undirected graphs. There are a few different paradigms on
how to draw general undirected graphs and within these ideas there are many methods.
The planarisation method draws a graph using existing algorithms for planar graphs. If the
graph is nonplanar, it is made planar by replacing edge crossings with dummy vertices. A
planar graph drawing algorithm is then used to draw the graph. An example of the use of this
method is the GIOTTO system [Tamassia88].

2.2. LAYOUT ALGORITHMS 12
The orientation method draws a graph using existing algorithms for directed graphs. First
the edges of the graph are given a direction to form a directed graph. Then a directed graph
algorithm is used to draw the graph.
Force-directed methods define a system of forces acting on the vertices and edges. The graph
drawing then evolves to a minimum energy state. Force-directed methods are relatively easy to
implement, can easily be extended to three dimensions and the smooth evolution of the drawing
helps to preserve the user’s mental map as the layout changes (See figure 2.6).
FIGURE 2.6. The Evolution of a Force-Directed Graph Drawing (Source: [Davidson96]).
The first force-directed method was Tutte’s barycentre method [Tutte60, Tutte63] where each
node is positioned at the barycentre of its neighbours. It is equivalent to a system where edges
are represented as springs with natural length zero and the external face is fixed. The barycentre
method can also be used to draw planar graphs.
The spring embedder method [Eades84] represents edges as springs with unit natural length
and non-connected vertices in the graph are connected by springs in the system with infinite

2.2. LAYOUT ALGORITHMS 13
natural length. As a result connected vertices are attracted to each other unless they are closer
than unit length together. In that case they will repel each other. Non-connected vertices will
repel each other. The system is then let go until a minimum energy state is reached.
In the work of Kamada et al., springs are placed between every pair of vertices. The natural
length of each spring is set to the graph-theoretic distance between the vertices [Kamada89].
Simulated annealing is used by Davidson and Harel [Davidson96] to reduce the energy of a
system. Simulated annealing is an optimisation technique that uses an energy function. The
energy function used by Davidson and Harel was based on the various aesthetic criteria and
weights could be used to emphasize particular criteria.
Force-directed methods do have problems. There are situations where a force-directed ap-
proach results in unfavourable drawings as the nodes can get stuck in a local minimum. This
can be due to poorly chosen initial layouts. It is also often difficult to know when a graph
has reached a minimum energy state, making stopping criteria hard to determine. This con-
tributes to a poor running time for force-directed methods as the number of nodes increases.
As a result, work has been done that uses heuristics to determine the quality of a graph drawing
[Behzadi99]. The results of these heuristics are used to generate an initial layout, move nodes
out of local minima and provide effective stopping criteria.
A modification of Eades’ work is presented by Fruchterman and Reingold [Fruchterman91].
It uses a heuristic that emphasises uniform edge lengths to provide an efficient force-directed
graph drawing algorithm.
Force-directed methods are widely used in the graph drawing field and many different force-
directed algorithms exist. This has produced a need for the evaluation of these methods.
Brandenburg et al. experimented on five graph drawing algorithms for general undirected
graphs. A wide collection of examples was used and different settings of parameters applied

2.2. LAYOUT ALGORITHMS 14
[Brandenburg96]. This evaluation confirmed the good performance of force-directed meth-
ods.
Sugiyama and Misue [Sugiyama95] apply magnetic fields to force-directed graph drawing. A
magnetic field is pre-specified and the forces on each are calculated such that they are brought
into alignment with this magnetic field.
Bertault introduced a force directed graph drawing algorithm which preserves the embedding of
an initial drawing [Bertault00]. The algorithm works like a classical force-directed algorithm
with one main difference: for each node, the maximum amplitude of a move is restricted to stay
within a zone that is calculated such that edge-crossing properties are preserved. The algorithm
thus can improve symmetry and uniformity of edge lengths, while for example preserving the
planarity of a drawing.
Force-directed methods are used for a wide variety of graph drawing applications. Recent
work has applied force-directed graph drawing algorithms to the game of hex [Murray03 ].
There exists an intuitive mapping of the state of a Hex game onto an undirected graph. This
graph representation can increase the player’s ability to find good moves/strategies if a good
graph drawing is provided. Two force-directed methods are combined to produce a planar
graph drawing with uniform edge lengths. The edge-crossings are removed by the Tutte al-
gorithm [Tutte60, Tutte63]. The force-directed algorithm preserving edge crossing properties
[Bertault00] is then used to improve symmetry and uniformity of edge lengths without intro-
ducing any edge crossings.
Force-directed methods can easily be extended to three dimensions. Bruβ and Frick [Frick94,
Bruβ96] have developed a force-directed method and extended it to three dimensions. These
methods are designed to be very fast in order to be suitable for interaction.
Dwyer [Dwyer01] has applied three dimensional graph drawing to the area of UML diagrams.
He used a variety of force-directed methods including springs and magnetic fields.

2.2. LAYOUT ALGORITHMS 15
While force-directed methods are useful, other methods have also been used for drawing graphs
in three dimensions. Orthogonal graph drawing is one such method. Minimising the number of
bends is an important aesthetic in orthogonal graph drawing. Eades et al. have presented two
algorithms for drawing three dimensional orthogonal graphs that are designed to achieve this
goal [Eades97].
Traditionally orthogonal graph drawings restricted the degree of the graph that could be drawn.
Two dimensional graphs were restricted to degree 4 and three dimensional graphs were re-
stricted to degree 6. Biedl et al. have introduced methods for drawing orthogonal graphs of any
degree in both two and three dimensions [Biedl98b, Biedl99].
Another common method of drawing graphs is the visibility representation. Bose et al. de-
signed a three dimensional visibility representation of graphs [Bose98]. In the three dimen-
sional visibility representation, vertices are mapped to rectangles parallel to the x,y-plane, with
edges represented by vertical lines of sight.
2.3. GRAPH INTERACTION 16
2.3. Graph Interaction
Graph interaction techniques determine how the graph reacts to actions by the user. The main
problem in graph interaction is providing a mechanism that will ensure that the graph becomes
and remains understandable as the user navigates the graph. It is desirable that the graph will
react in a way that is natural and intuitive [Merrick02 ]. Graph interaction techniques attempt
to provide solutions for this problem.
Evaluation of the benefits provided by the aesthetic criteria has produced mixed results [Batini85,
Ding90, Purchase97, Purchase00]. In any automated graph drawing system there will be situ-
ations where the initial graph drawing provided is not easy to understand. By providing the user
with a mechanism for changing the layout of the graph we facilitate a potential increase in the
users understanding of the graph. Studies into the effectiveness of graph interaction techniques
in increasing comprehensibility support this [Herman00].
A number of techniques have been used to aid the interaction of a user with a graph. Methods
that effectively only change the view of the graph include the operations of rotation, scaling
and translation. Scaling with the use of a zoom function has two variations. Simply increasing
or decreasing the size of the graph is referred to as geometric zooming. Semantic zooming is
a method that is often used for large and clustered graphs. This method actually changes the
information content by increasing or decreasing the level of detail.
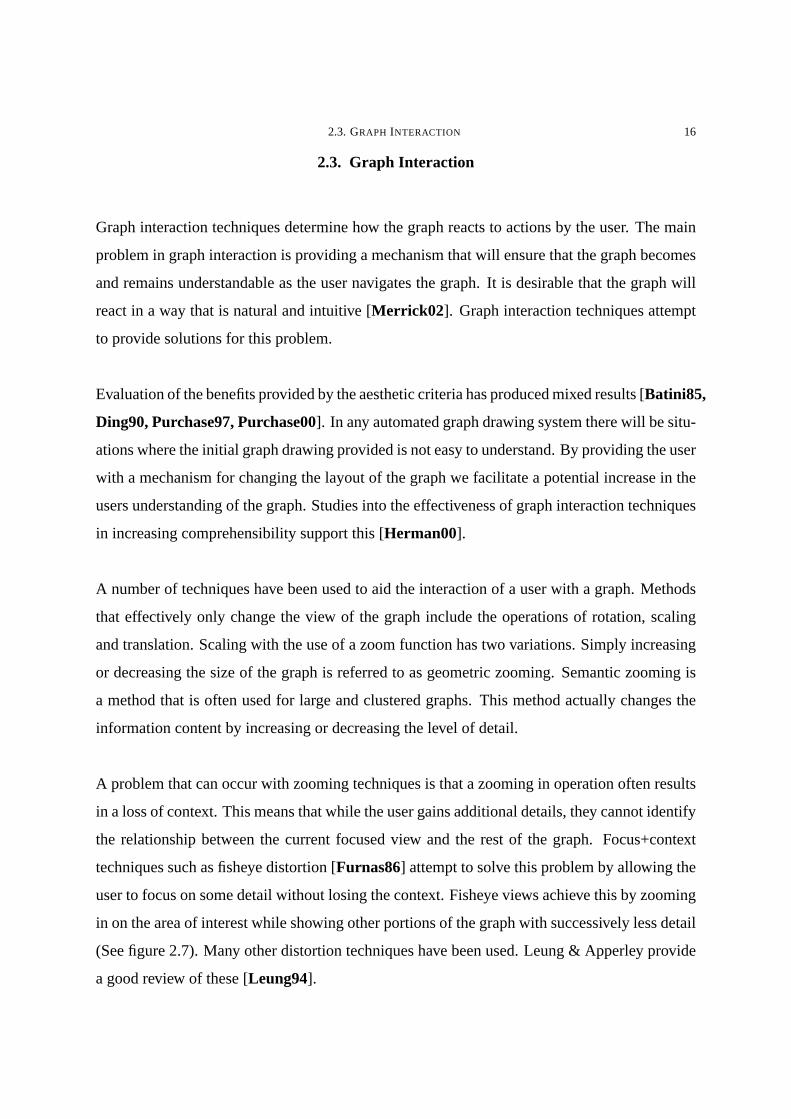
A problem that can occur with zooming techniques is that a zooming in operation often results
in a loss of context. This means that while the user gains additional details, they cannot identify
the relationship between the current focused view and the rest of the graph. Focus+context
techniques such as fisheye distortion [Furnas86] attempt to solve this problem by allowing the
user to focus on some detail without losing the context. Fisheye views achieve this by zooming
in on the area of interest while showing other portions of the graph with successively less detail
(See figure 2.7). Many other distortion techniques have been used. Leung & Apperley provide
a good review of these [Leung94].

2.3. GRAPH INTERACTION 17
FIGURE 2.7. Fisheye view of a regular grid of the plane (Source: [Herman00]).
Often graphs are so huge that it is extremely difficult to handle the full graph at any one time.
Graphs which often fall into this category are World Wide Web graphs. For huge graphs,
incremental exploration techniques are often used [Eklund99, Huang98b, Huang98a]. With
these techniques, the system only displays a small part of the graph at a time. Different parts
of the graph are displayed as needed.
In addition to these aspects that control the view of a fixed graph drawing, there are meth-
ods [Merrick02 ] that allow the user control over the positions and orientation of the nodes
themselves, facilitating modification of the graph layout. These methods give the user greater
control over how the graph is drawn as the embedding of the graph can also be changed, effec-
tively allowing the user to arrange the graph in any way possible. It is these types of methods
for graph interaction that we will be focusing on in this thesis.
While we want to give the user a degree of freedom in navigating the graph, we also want to
maintain some control over the layout of the graph that will require certain properties remain
unchanged. Placing such constraints over the control of the graph will help to ensure that
we continually provide an aesthetically pleasing graph drawing and this will assist the user
in finding an understandable layout. In addition it may reduce the time taken for the user to
achieve such a layout.
When a graph is drawn in two dimensions it is easier for a user to navigate the graph. In terms
of changing the view of the graph, interaction in two dimensions is usually limited to scrolling
or zooming and this is only necessary for graphs that exceed the size of the screen. It is the

2.3. GRAPH INTERACTION 18
positions of the nodes and the way in which the edges are drawn that will determine how easily
the graph can be understood, as these factors alone will determine the aesthetic properties of
the graph. This is because there is no depth to the drawing. As a result, it is methods that
allow the user to change the graph layout that are most important for two dimensional graph
interaction. Mechanisms that allow layout changing modifications are usually only necessary if
the drawing provided by the original layout algorithm is incomprehensible. There will always
be some situations where this is the case, and therefore such mechanisms are important.
The benefits of providing interaction can be seen in the work of do Nascimento & Eades
[Nascimento02], where user actions were used to make improvements to two dimensional
graph drawings. Modifications to the graph layout provided by the user were used as additional
input to a genetic algorithm. These hints provided by the user provided a basis for the system
to improve the drawings. It also helped to provide drawings that were better than they would
have been without user interaction.
When a graph is drawn in three dimensions, navigating the graph is much more difficult. On
regular displays the user is only seeing a two dimensional projection of a three dimensional im-
age. In any given view, it is likely that part of the graph will be obscured due to the additional
depth of the drawing and lack of depth of the display device. The user will need to be able
to change their view of the graph in order to experience all three dimensions. In any number
of dimensions it is good to start with a good graph drawing. However, in three dimensions, in
addition to the positions of the nodes, an important aspect that will determine how easily a user
can understand the graph structure is their ability to modify their view of the graph. Graph In-
teraction in three dimensions is even more important than in two dimensions as there are many
additional factors that could lead to an original graph drawing being incomprehensible. This
also makes graph interaction in three dimensions a more difficult problem. Three dimensional
graph drawing mechanisms need to provide the ability to change both the layout and view of
a graph. Also, these mechanisms are more complicated in three dimensions. There are many
more ways in which the layout can be changed as node movement isn’t restricted to a single

2.3. GRAPH INTERACTION 19
plane, and when changing the view, rotation needs to be provided in addition to translation and
zooming.
Not only is graph interaction in three dimensions more difficult, it is also more necessary. As
drawing graphs in 3D is more complicated, there are likely to be even more situations where
the initial graph drawing is difficult to understand.
Graph interaction is a field that has become more prevalent due to a more widespread use of
three dimensions in graph drawing. There are a number of reasons why this is the case. Us-
ability studies [Ware93, Ware94, Ware96, Cockburn01] have shown the benefits of three
dimensional drawings over two dimensional drawings. These studies have shown that three
dimensional drawings are more easily understood, that it is easier to follow the structure of
the graph and that it feels more realistic and natural. A wider availability of hardware capa-
ble of drawing graphs in three dimensions has also lead to three dimensional graph drawings
becoming more widespread.
While there have been studies showing the benefits of three dimensional drawings, there are
also studies claiming that it is better to draw graphs in two dimensions [Nielsen98]. Cases
where three dimensions have been shown to be not useful may be due to a poor interaction
model, as a good interaction model would have improved the understandability of the graph.
There are certainly cases where three dimensional graph drawings are useful and they can only
become more useful with a good interaction model [Cockburn01]. A good interaction model
will ensure that the benefits of three dimensions are fully realised. While graph drawing is a
field that has been thoroughly explored [Battista94, Battista99], graph interaction remains a
relatively new field and novel methods that aid the user’s understanding of the graph structure,
particularly in three dimensions, are still required.
While navigating the graph visualisation space, the user spends a reasonable amount of time
building a mental map [Gould86, Eades91, Misue95] of the structure of the graph. Being able
to maintain and add to this mental map as they navigate the graph is essential for developing

2.3. GRAPH INTERACTION 20
an understanding of the structure of the graph. The graph interaction mechanism must not
make drastic, unintuitive changes to the drawing of the graph. Graph animation [Friedrich02]
is a method that demonstrates the transition between drawings of a graph. An intuitive graph
interaction mechanism, with the aid of animation allows the user to easily follow the transition
from the initial graph drawing to the final graph drawing. Animation, when applied through
successive layouts of a graph that do not differ significantly, ensures that the mental map is
maintained.
The simplest way of providing graph interaction is to use an adaptive graph drawing algorithm.
An adaptive graph drawing algorithm produces a drawing that is dependent upon the initial
geometric properties given to the graph. These types of algorithms take a graph drawing as
input and their aim is to improve upon it. Adaptive graph drawing algorithms are useful for
graph interaction tasks as they are more likely to preserve the user’s mental map. The speed
requirements of an algorithm used for graph interaction are generally higher than that of general
graph drawing. Algorithms developed with graph interaction in mind [Bruβ96] are designed
to be very fast.

2.4. PHYSICAL METAPHORS FORGRAPH INTERACTION 21
2.4. Physical Metaphors for Graph Interaction
One method used in graph interaction involves placing a physical metaphor on the structure
of the graph such that the graph responds to movements of nodes in a way corresponding
to the physical metaphor. A common physical metaphor in undirected graph drawing is the
force-directed paradigm and this idea is easily extended to graph interaction as force-directed
algorithms are adaptive. Forces are recalculated as the user moves a node and the position of
the nodes are updated accordingly. The aim of a physical metaphor is to provide behaviour that
is naturally experienced in everyday life and therefore easy to understand, follow and predict
when applied to graph interaction.
Skeletal animation is a concept that has been applied to the creation of realistic motion for the
lifelike computer-generated characters seen in today’s motion pictures and computer games.
Recent work has applied this physical metaphor to the field of graph interaction [Merrick02 ].
The skeletal metaphor maps nodes of a graph to joints of a skeleton and edges of a graph to
the bones of a skeleton. A simplified view of a skeleton is that joints can be rotated and bones
remain at a constant length. Merrick has used skeletal animation to smoothly animate the graph
layout according to the movement applied by the user as well as various underlying constraints
forced on the graph’s skeleton. By applying these constraints on a graph he provided a physical
metaphor that feels natural to the user. It produces a graph interaction environment such that
the structure of the graph is easy to understand and the time taken in navigating the graph is
reduced. Merrick has introduced the skeleton as a physical metaphor for graph interaction and
has opened up many possibilities for future work in graph interaction.

2.4. PHYSICAL METAPHORS FORGRAPH INTERACTION 22
The definition of a skeleton provided by Merrick is:
A skeleton is a set of joints (J) and a set of bones (B). Each jointj ∈ J is connected by a set
of bonesBj ⊆ B to set of jointsjADJ ⊆ J, |jADJ | > 0.
There exist constraints on the skeleton that should be preserved:
- The lengthlb of each boneb ∈ B should not change.
- Given a set of jointsF ⊆ J , termed the fixed point set, each jointj ∈ F should remain
at its initial location in Euclidean space.

2.5. SKELETAL ANIMATION 23
2.5. Skeletal Animation
Skeletal animation is an area that is commonly used in the areas of computer games and mo-
tion pictures. As a result a large number of techniques have been developed that control the
movement of a skeleton in a way that is designed to appear natural to the viewer.
Skeletal animation is also used in the area of robotics where it is referred to as the study of
the motion of articulated bodies. Many of the methods used for skeletal animation were first
developed for use in robotics, especially in the area of inverse kinematics.
Throughout this thesis we are primarily concerned with dynamics-based modelling of artic-
ulated structures, and thus do not cover in detail the issues involved with kinematics-based
approaches to skeletal animation. We will however give a brief summary of the most important
literature in this area.
Inverse kinematic methods move a joint to a desired position while controlling the movement
of several other joints and taking into account positions of fixed joints, bone lengths and joint
angles. Korein and Badler referred to this concept as "goal-directed motion" [Korein82]. An
example of this can be seen in figure 2.8 where the red node is the end-effector and the top node
is fixed. There are potentially an infinite number of such configurations which result in the end-
effector moving to the desired point in space. There are also situations where it is impossible
to move the node to the desired location. In this case, the aim is to get it as close as possible to
the goal location.
Situations where there are a finite number of final configurations are more likely to occur in
the field of robotics where articulated bodies typically have fewer joints and are less complex.
These situations have been solved using a system of nonlinear equations [Paul81, Brady82].
The use of these methods has been limited by the difficulty in solving the equations and the
small likelihood that there will be a finite number of final configurations.

2.5. SKELETAL ANIMATION 24
FIGURE 2.8. Initial Configuration showing Desired End-Effector Position and
a Possible Final Configuration (Source: [Merrick02 ]).
The method of resolved motion rate control [Whitney69] can be used in situations where there
are an infinite number of possible final configurations. This technique calculates the inverse
of the Jacobian matrix in order to implement an iterative algorithm where each step moves
the end-effector closer to the desired end-effector position. The use of this method is limited,
however, as the Jacobian matrix is not always invertible. In this case, the pseudoinverse can be
used [Klein83, Girard85], but it can become unstable. It can be made more stable by using
Singular Value Decomposition (SVD) [Maciejewski90] but it does result in relatively high
additional runtime cost. The Jacobian transpose has proved useful [Wolovich84, Sciavicco87,
Welman93] in situations where high accuracy is not required.
An alternative to the methods based on the Jacobian matrix is a heuristic-based approach re-
ferred to as Cyclic Coordinate Descent (CCD) [Wang91]. CCD is an iterative approach that
involves visiting each joint in an articulated chain in turn. By visiting a single-joint at at time,
the problem is reduced to a simpler optimisation problem.
The inverse kinematics problem can also be approached from a nonlinear optimisation point-
of-view [Badler87, Zhao94]. This approach has been widely used for computer animation
involving articulated structures.
While inverse kinematics techniques operate on the geometry of articulated structures, with
dynamics, all interactions with the system are modelled as forces acting upon rigid and articu-
lated bodies. Inverse kinematics techniques have been useful for robotics, and as a result, it has
been the topic of the majority of research in skeletal animation. However, there has also been

2.5. SKELETAL ANIMATION 25
some development of dynamics-based techniques, a lot of which has been driven by the need
for skeletal animation techniques in computer games, where the main goals are believability
and speed of execution.
In order to achieve believability, dynamics-based techniques focuses on emulating motion as
seen in real environments. These methods are less focused on goal directed motion. These
methods use an iterative approach where, at each iteration, the forces upon the particles that
make up a body, are summed in order to determine their following positions. This process is
repeated in order to generate motion.
The dynamics-based algorithms are described further in Chapter 3 on page 29 of this thesis,
where they are used as a basis for the implementation of a graph interaction environment using
skeletal animation. We give a brief overview here.
The traditional methods [Witkin97 ] for dynamics-based skeletal animation use Euler integra-
tion using Newton’s law for particle simulation. Bones connecting particles are simulated by
springs. The major problem with this approach is its speed as well as the difficulty in choosing
parameters that will make the springs appear stiff while remaining stable.
Dynamics-based algorithms were developed by Jakobsen [Jakobsen01] to control the physics
systems in computer games. These algorithms were designed to be well suited to interactive
use and improve upon traditional approaches by providing a faster and more stable system.

2.6. SKELETAL ANIMATION IN GRAPH INTERACTION 26
2.6. Skeletal Animation in Graph Interaction
Merrick was the first to apply skeletal animation techniques to graph interaction (See figure
2.9) [Merrick02 ]. These methods were previously used in the fields of inverse kinematics and
dynamics.
The inverse kinematics methods used were based on the CCD [Wang91] method and the NLP
[Badler87, Zhao94] method. The first method used a multiple chain version of the CCD
method to simulate a skeletal structure. The second method involved the formulation of the IK
problem as input to a nonlinear programming module, including the addition and implementa-
tion of various constraints. A naive dynamics-based approach was explored as a third method,
which was based on a force-directed graph drawing algorithm. The parameters were chosen
in an attempt to create extremely stiff springs with limited success in terms of it’s ability to
simulate the skeletal metaphor. Obviously, the focus of the previous work was on inverse kine-
matics. There remains scope for a study into dynamics-based techniques for skeletal animation
applied to graph interaction.
As inverse kinematics techniques were mostly developed for use in robotics, they are designed
to be very realistic. Dynamics-based techniques have typically been developed for computer
games and don’t need to be entirely realistic as long as they give the illusion of realism. We
have similar goals for graph interaction. Therefore, dynamics-based techniques may be more
suited for graph interaction purposes. This further supports investigation into dynamics-based
skeletal animation techniques for graph interaction.
The previous approaches used to implement the skeletal metaphor in a graph interaction system
provided a natural way for the user to navigate a graph. However, these methods could be im-
proved upon in terms of the satisfaction of the constraints defining the skeleton, the naturalness
of the motion and the ability to preserve a user’s mental map between successive configurations.

2.6. SKELETAL ANIMATION IN GRAPH INTERACTION 27
FIGURE 2.9. An example screenshot from the first system developed for skele-
tal animation in graph interaction (Source: [Merrick02 ]).
In the previous work, the CCD & force-directed approaches resulted in a stretchiness of bones.
This violates the prescribed skeletal metaphor and damages the perception that a physical entity
is being manipulated.
The CCD method became very slow in some cases in the previous system. For a graph inter-
action system to be useful it must be useable in real-time, which was not always true of this
approach.
The motion should also remain smooth and natural as is the intention of the skeletal metaphor.
The NLP method provided jumpy motion and this limited its usefulness significantly.
Methods used in the previous work all have advantages and disadvantages both in terms of their
satisfaction of the skeletal metaphor and in their usefulness in graph interaction. It would be
desirable to use a technique that achieved and combined the advantages of the previous methods

2.6. SKELETAL ANIMATION IN GRAPH INTERACTION 28
without the disadvantages. There are many techniques used for skeletal animation that could
achieve this. There remains a large gap in the research for experimentation with new techniques
for skeletal animation in this area. However, it is also important to find those that will be best
suited to graph interaction. An ideal technique would both provide simulation of the skeletal
metaphor and at the same time will be useful for graph interaction tasks. There is large potential
for improvement upon the existing work by providing a highly responsive system that helps to
increase the user’s understanding of the graph by staying true to the skeletal metaphor.
The previous work in this area has mentioned domains in which the skeletal metaphor could
be useful. The domains mentioned were PERT diagrams, cluster trees and graphs containing
an inherent hierarchy. It is still necessary to evaluate the usefulness of the skeletal metaphor in
these and other domains as well as in the general case.
There is still a significant need for empirical results indicating the advantages and disadvan-
tages, if any, of using a skeletal metaphor over other types of interaction with graph visualisa-
tions. Previous evaluation of the usefulness of the skeletal metaphor was inconclusive due to
the limited scope of the survey undertaken. There remains a gap in the research that could be
filled with a more comprehensive user study in order to produce solid evidence of the useful-
ness of the skeletal metaphor. It is also important to evaluate the usefulness of each technique
in simulating the skeletal metaphor.
Another area in which the skeletal metaphor in graph interaction has been explored is in apply-
ing it to large web graphs using clustering methods [Belista03]. Clustering methods are used
reduce the size of the graph to be displayed and to combat the massive information problem.

CHAPTER 3
A System for Force-Based Skeletal Graph Interaction
This chapter describes the methods used during the course of this research project, as well as
implementation details for the system used for the evaluation given in Chapter 4. Section 3.1
details the method described by Jakobsen [Jakobsen01] and also describes the nature of many
dynamics-based methods used for computer games [Witkin97 ]. Section 3.2 describes how we
have adapted this technique to create a graph interaction environment. It also details several
additional aspects that needed to be added in order for the method to be specifically designed
to be useful for graph interaction.
3.1. A Particle System for Skeletal Animation
With the graph modelled as a skeleton we need an algorithm to ensure that the skeletal con-
straints are maintained as the user modifies the positions of the nodes. The skeletal animation
algorithms [Jakobsen01] that we have used form a dynamics-based approach. These algo-
rithms were adapted from the work of Jakobsen. Jakobsen’s work was designed to control the
physics systems in computer games, specifically IO Interactive’s "Hitman: Codename 47" (See
figure 3.2), where the major concerns are believability and speed of execution. One respon-
sibility of the physics system is the simulation of articulated bodies. An articulated body is
composed of solids and joints which define the range of motion allowed by the different parts
of the body. The result is a structure that is very similar to that of a graph. Articulated bodies are
often used to represent the skeleton structure of computer games characters (See Figure 3.1).
As the physics system was designed for computer games, it provides simulation of a skeleton
29

3.1. A PARTICLE SYSTEM FORSKELETAL ANIMATION 30
that appears natural to the viewer, and is fast, stable and well suited for interactive use. One
way in which it has been used is for the dragging of articulated bodies around an environment
(See figure 3.2). In many ways this is very similar to graph interaction. These algorithms are
highly suitable for skeletal graph interaction because they have been specifically designed with
interactive dragging of articulated bodies in mind.
FIGURE 3.1. An Articulated Figure Representing a Character’s Skeleton
(Source: [Jakobsen01]).
The physics system created by Jakobsen (2001) consists of these features:
• a Verlet integration scheme
• handling collisions and penetrations by projection
• a constraint solver
• a square root approximation that reduces the processing time
• modelling rigid and articulated bodies as particles with constraints

3.1. A PARTICLE SYSTEM FORSKELETAL ANIMATION 31
FIGURE 3.2. Dragging an Articulated Figure around an environment in IO In-
teractive’s "Hitman: Codename 47". (Source: http://www.ign.com).
Particle simulation is an important part of a physics system. The most commonly used method
for particle simulation is Euler integration using Newton’s law. In Euler integration each par-
ticle has two variables, its positionx and its velocityv. In each time step the position and
velocity values of the particle are updated. The new valuesx′ andv′ are given by:
x′ = x + v ·∆t
v′ = v + a ·∆t
where∆t is the time step, anda is the acceleration computed using Newton’s lawf = ma.
The forcef is the accumulated force acting on the particle by elements in the environment such
as gravity.
The physics system [Jakobsen01] uses a Verlet integration scheme [Verlet67] for its particle
simulation. Verlet integration schemes use a velocity-less representation. The information

3.1. A PARTICLE SYSTEM FORSKELETAL ANIMATION 32
stored consists of a particle’s current positionx and it’s previous positionx∗. The new values
using Verlet integration are given by:
x′ = 2x− x∗ + a ·∆t2
x∗ = x
This works similarly to Euler integration as2x − x∗ = x + (x − x∗) andx − x∗ provides an
approximation of the velocity of the particle. Verlet integration is faster and more stable than
Euler integration because it is harder for the velocity and position to come out of synchronisa-
tion. This has allowed it to be useful for simulating molecular dynamics.
Common methods for handling collisions and contact of particles with the environment have
a number of disadvantages that can make them unsuitable for interactive use. One method
handles collisions by inserting springs at the penetration points. In this case, it is difficult
to choose spring constants such that the system remains stable and accuracy is maintained.
Another method goes back in time to the exact point of collision, where it handles the collision
analytically before restarting the simulation. This method is likely to run very slowly when
there are a lot of collisions making it impractical for interactive applications.
In the physics simulation collisions are handled by projection. This means moving the point
perpendicularly out from the collision surface as little as possible until it is free of the obstacle,
ensuring particles are kept inside the valid environment. This works well with the Verlet inte-
gration scheme as corresponding changes in velocity will be handled automatically and there is
no need to directly cancel the velocity in the normal direction. The motion of particles within a
box environment using Verlet integration can be seen in figure 3.3. This method is also fast and
simple to implement making it suitable for interactive use. Also, as we will see in the following
sections, it works particularly well with constraint satisfaction for rigid or articulated bodies.
In a physics system particles are often connected by springs to model rigid bodies or cloth.
The problems with this approach are once again associated with the choice of parameters. It is

3.1. A PARTICLE SYSTEM FORSKELETAL ANIMATION 33
FIGURE 3.3. Motion governed by Verlet integration within a box environment.
(Source: [Jakobsen01]).
difficult to find a balance between weak springs that appear too elastic and strong springs that
cause instability in the equations. It is also difficult to solve the differential equations used in
this method.
FIGURE 3.4. The stick constraint is validated by moving the particles closer
together or further apart (Source: [Jakobsen01]).
The algorithms of the physics system model the connections between particles as infinitely stiff
springs. These springs will instantly reach their rest length and are effectively more like sticks
than springs. This makes them highly suitable for modelling bones of a skeleton. For each stick
connecting two particles, the particles must be placed such that the distance between them is
equal to the desired length of the stick. After the movement of a particle takes place due to a
Verlet integration step, the stick length may have become invalid. This constraint is validated
by moving the particles away from each other or pulling them closer together, depending on
whether the length of the stick joining them, is too large or too small (See figure 3.4). This is
highly suited to an interactive application as it is a very fast and simple approach.

3.1. A PARTICLE SYSTEM FORSKELETAL ANIMATION 34
The pseudo-code for satisfying the stick-length constraint is:
delta = x2-x1
deltalength = sqrt(delta · delta)
diff = (deltalength-restlength)/deltalength
x1 += delta*0.5*diff
x2 -= delta*0.5*diff
There are two constraints governing the system that must be satisfied. These are keeping par-
ticles within the environment and maintaining ideal stick lengths. The satisfaction of either of
these constraints can lead to the invalidation of the other. To ensure that length and collision
constraints are both satisfied, local iteration is performed, where the two constraint solvers are
repeatedly run after each other. After a number of iterations the positions of the particles con-
verge to a valid solution. This iterative method can be stopped at any time depending on the
level of accuracy required, allowing for a time/accuracy trade-off.
This physics system also has a further speed up mechanism if required making it even more suit-
able for interactive use. The costly square root operation that takes place in the stick constraint
satisfier can be approximated. This approximation uses the fact that as long as the constraints
are satisfied, or close to it, the result of the square root operation should be the rest length of the
stick. Also, if the distance between the particles is already correct then no change is necessary.
The square root function is approximated by its 1st order Taylor-expansion at a neighborhood
of the squared rest length. The pseudo-code for satisfying the stick-length constraint becomes:
delta = x2-x1
delta *= restlength*restlength/
(delta · delta+restlength*restlength)-0.5
x1 += delta
x2 -= delta

3.1. A PARTICLE SYSTEM FORSKELETAL ANIMATION 35
Rigid bodies are modelled as particles connected by sticks governed by constraints. Articulated
bodies are modelled by connecting rigid bodies. It is possible to connect multiple rigid bodies
by hinges and pin joints. Simply let two rigid bodies share a particle, and they will be connected
by a pin joint (See figure 3.5). Share two particles, and they are connected by a hinge (See figure
3.6). This provides an intuitive mapping from the particle system to a skeleton where particles
are mapped to joints and sticks are mapped to bones.
FIGURE 3.5. Two rigid bodies connected by a pin joint to form an articulated
body (Source: [Jakobsen01]).
FIGURE 3.6. Two rigid bodies connected by a hinge joint to form an articulated
body (Source: [Jakobsen01]).
Angular constraints can add further realism to the particle system. One method given by Jakob-
sen uses additional constraints that are defined for each joint connecting two sticks (See figure
3.7). The constraints are that the distance between the unconnected particles of the sticks form-
ing the joint cannot fall below some threshold. These constraints are enforced in the same way
as the stick constraints in the case where the stick length is less than it’s ideal length. This
method effectively prevents some particles from coming too close together.
FIGURE 3.7. The length of the dotted line must exceed some threshold. This
simulates an angular constraint. (Source: [Jakobsen01]).

3.2. IMPLEMENTATION OF THE PARTICLE SYSTEM IN A GRAPH INTERACTION ENVIRONMENT 36
3.2. Implementation of the Particle System in a Graph Interaction Environment
We have implemented this particle system into a graph interaction environment in Java, using
Java3D for its graphics routines. The process that is followed is illustrated in the flowchart in
figure 3.8.
FIGURE 3.8. A simplified outline of the execution process of our implementa-
tion of the particle system in a graph interaction environment.

3.2. IMPLEMENTATION OF THE PARTICLE SYSTEM IN A GRAPH INTERACTION ENVIRONMENT 37
In our system the graph is modelled as an articulated body with joints representing nodes and
bones representing edges. Our implementation allows the user to drag the nodes of the graph
around and the graph will respond according to the underlying physics engine.
Merrick applied the skeleton to only part of the graph [Merrick02 ]. Some of the techniques
used by Merrick could only be applied to limited cases. As a result, he used a preprocessing
step to determine the subgraph that would represent the skeleton. We have modelled the entire
graph as a skeleton because the technique that we have used can be applied to any graph.
Verlet Integration
As a node is dragged around the environment momentum is generated in the other nodes. The
Verlet integration scheme is used to determine the positioning of the nodes. There was a prob-
lem that no friction existed in the system and the graph would tend to float around endlessly,
never settling. The equations governing the Verlet integration scheme were modified to intro-
duce drag into the system. Jakobsen suggested the equationx′ = 1.99x − 0.99x∗ + a · ∆t2 to
introduce drag. However, this provided no noticeable difference. After some experimentation
we used the equationx′ = 1.75x − 0.75x∗ + a · ∆t2 which reduced the floating sensation and
ensured the graph would settle quickly. This also gave the graph the impression of a rigid,
physical structure as is the nature of a skeleton. We also don’t have any need for gravity in our
system, so the equation simplifies tox′ = 1.75x− 0.75x∗.

3.2. IMPLEMENTATION OF THE PARTICLE SYSTEM IN A GRAPH INTERACTION ENVIRONMENT 38
The pseudocode for the Verlet integration step is:
FOR each particle p
IF p’s location is not fixed THEN
store p’s current location in temp
p.currentX = 1.75*p.currentX - 0.75*p.oldX
p.currentY = 1.75*p.currentY - 0.75*p.oldY
p.currentZ = 1.75*p.currentZ - 0.75*p.oldZ
p’s old location = temp
END IF
END FOR
Bounding Environment Constraints
A cube is used as the environment in which the graph must remain. Collisions and penetrations
are projected onto the inside of the cube and when dragging a node the user cannot move this
node outside the cube. Other nodes which move due to the momentum created by this drag
and the stick constraints, will also stay within the environment. This allows us to restrict the
movement of the graph within a small area and keeps the user’s focus on this area. The use of
this cube is optional and it when it is used only the outline is visible. This ensures that the user
will not be not be distracted by it.
Edge Length Constraints
As a node is dragged around, the edge length constraints are enforced by the constraint solver
(See Figures 3.9, 3.10). This ensures that as a node is dragged surrounding nodes will move
closer or further away from the dragged nodes in order to maintain the constraint. This creates
a natural feel in the system as the edges remain at constant length, similarly to the bones of a
skeleton.

3.2. IMPLEMENTATION OF THE PARTICLE SYSTEM IN A GRAPH INTERACTION ENVIRONMENT 39
Iterative Constraint Solver
For each frame the iterative constraint solver is run to ensure collision and stick length con-
straints are satisfied. It also helps to preserve the user’s mental map by providing a smooth
animation from one configuration of the graph to the next. In practice we found that only a
very small number such as 5 iterations of the constraint solver were necessary. This is enough
to reduce any large violations of the constraints. Any remaining violations in the constraints
will be small and will not be noticed by the user. Also, the satisfaction of constraints will
converge further over subsequent frames. Increasing the number of iterations does not provide
significant improvement in terms of constraint satisfaction believability. With a large increase
in the number of iterations performance can become an issue for large graphs, actually reduc-
ing the natural feel of the structure rather than increasing it. The pseudocode for the constraint
solver is:
FOR each iteration
FOR each particle p with current location x
x = componentWiseMin(componentWiseMax(x,minBox),maxBox)
END FOR
FOR each edge connecting particles x1 & x2
delta = x2-x1
deltalength = sqrt(delta · delta)
diff = (deltalength-restlength)/deltalength
IF x1’s location is not fixed THEN
x1 += delta*0.5*diff
END IF
IF x2’s location is not fixed THEN
x2 -= delta*0.5*diff
END IF
END FOR
END FOR

3.2. IMPLEMENTATION OF THE PARTICLE SYSTEM IN A GRAPH INTERACTION ENVIRONMENT 40
FIGURE 3.9. Initial Configuration Showing Desired Position of End-Effector.
FIGURE 3.10. Movement of the Node to the Desired Position followed by the
Constraint Solver Produces the Final Configuration.

3.2. IMPLEMENTATION OF THE PARTICLE SYSTEM IN A GRAPH INTERACTION ENVIRONMENT 41
Fixed Node Constraints
An additional aspect necessary for satisfying the definition of a skeleton but not handled in
the original physics system is that of fixed joints. In any graph interaction environment it is
desirable for the user to be able to fix nodes so that they will remain in the same location.
The user can select nodes to be fixed or can unfix nodes at any time. We have implemented
this in our system by adding the constraint that the subset of nodes that is fixed cannot move.
This is a hard constraint and is given priority over the other constraints so that the fixed nodes
will not move from the set position at all. This introduces a problem in ensuring that the edge
length constraints are satisfied, for example, if two nodes connected by a stick are fixed. If
the user drags one of these nodes away the edge will increase in length and the constraint will
be violated as the system cannot move either node in an attempt to satisfy the constraint (See
Figures 3.11, 3.12).
FIGURE 3.11. As neither node is fixed, the edge-length constraint is easily satisfied.
FIGURE 3.12. Both nodes are fixed. It is not possible to satisfy the edge-length
constraint, as moving the nodes closer together would violate the fixed nodes
constraint.

3.2. IMPLEMENTATION OF THE PARTICLE SYSTEM IN A GRAPH INTERACTION ENVIRONMENT 42
Error Threshold
To remedy this problem we have placed restrictions on how the user can drag nodes around.
Movements of nodes that will violate an edge length constraint significantly are not allowed.
This allows us to maintain some freedom of control for the user while still providing the nat-
ural feel of the skeletal structure. A threshold that measures the sum of violations across the
entire graph is used to determine if the extent of a violation is acceptable. Once the maximum
threshold is reached, movement will be limited to actions that reduce or maintain the current
extent of violations. After reducing the extent of the violations, the user will then once again be
able to make movements freely. This provides restrictions on the movement that more closely
resemble a physical structure as is the nature of the skeleton. As a result, it is expected to
provide a more natural feel and be more effective at maintaining the skeletal structure. In our
system, we have provided a mechanism for navigating the graph with or without the threshold
restrictions. These two techniques are used as a basis for part of the usability study in Section
4.1.
Our implementation can be used with or without the square root approximation mentioned in
Section 3.1. However, because of the addition of fixed nodes in space, the constraints of the
system are less likely to be satisfied. When using the square root operation it is important to
also use a low threshold to ensure that the constraints are at least close to being satisfied. The
square root approximation does not seem necessary on smaller graphs but as the size of graphs
increases it could be used to reduce the processing time helping to ensure a fast response to the
user actions.
Visual Cues
We also provide visual cues as to where and by how much violations are occurring. A signifi-
cant edge length violation will result in a change in colour of the edge to red. Also, the width
of the edge will decrease if the edge is stretched and will increase if the edge is compressed

3.2. IMPLEMENTATION OF THE PARTICLE SYSTEM IN A GRAPH INTERACTION ENVIRONMENT 43
(See Figures 3.13, 3.14). The visual cue of highlighting fixed nodes in pink is also provided to
ensure the user is aware of the subset of fixed nodes.
FIGURE 3.13. All constraints are satisfied. This is indicated by green edges of
standard width.
FIGURE 3.14. Some edge-length constraints are not satisfied. This is indicated
by edges of varying width and colour.

3.2. IMPLEMENTATION OF THE PARTICLE SYSTEM IN A GRAPH INTERACTION ENVIRONMENT 44
Determining the Graph Structure and Initial Layout
When drawing a graph in our system we not only need to know the set of nodes and edges but
also what the ideal length of each edge will be. In some domains, graph edges have associated
weights and these can be used directly to determine the ideal edge lengths. In other cases
determining the edge lengths may not be so straight-forward. A common aesthetic property
desired in graph drawings is that of uniform edge-lengths, where all edges in the drawing have
approximately equal lengths. In our system, the edge-lengths are provided as input along with
the set of nodes and edges. The initial layout of nodes is produced randomly. The constraint
solver then improves the drawing. The drawing can then be further improved by the user, as is
the aim of our system.
The Addition of Angular Constraints
Our original definition of a skeleton does not specify any angular constraints. However, in
terms of graph navigation, there is a possible benefit of implementing angular constraints as it
would keep nodes from getting too close together. We have implemented angular constraints
in our system by a similar method to that suggested by Jakobsen. We have applied forces
between unconnected nodes. Unconnected nodes whose distance is less than a threshold are
repelled from each other. The forces on each node are summed in a way similar to force-
directed methods and nodes are moved in the direction of the force. The calculation of forces
and movement of nodes is performed within the constraint satisfaction loop. While this is not
always an accurate way of providing angular constraints, it is fast and simple and provides a
realistic feel most of the time. This method not only adds realism to the skeletal structure, it
also provides aesthetic benefits. It prevents unconnected nodes from getting too close together
and this results in good angular resolution. Edges emanating from a node will spread evenly
around a node. Because angular constraints are not part of our original definition of a skeleton,
we provide the option of whether to use angular constraints or not, and this is also used as a
basis for comparison in part of our user study in Section 4.1.

3.3. IMPLEMENTATION OF A FORCE-DIRECTED ALGORITHM IN A GRAPH INTERACTION ENVIRONMENT 45
3.3. Implementation of a Force-Directed Algorithm in a Graph Interaction Environment
In addition to the particle system, we also implemented a force-directed algorithm into the
graph interaction environment. The reason for implementing the force-directed algorithm is
for a comparative evaluation of skeletal and non-skeletal techniques as detailed in Section 4.1.
The force directed method that we implemented consisted of the following features. Connected
nodes are attracted to each other if their length is longer than desired and repelled if their length
is shorter. Disconnected nodes are repelled from each other if they are within a certain distance.
Several iterations of the force-directed algorithm are run at each frame. As nodes are dragged
around the force directed algorithm will recalculate the forces and update the positions of the
nodes accordingly. This helps to ensure that edge lengths are as desired. However, the force-
directed algorithm is more forgiving of differences between desired and actual edge lengths
than the particle system. It terms of satisfying box and fixed node constraints, the force-directed
algorithm works in exactly the same way as the particle system.
It terms of the feel of the system the force-directed method provides a more stretchy and less
rigid feel than the more rigid particle system. In terms of satisfying the edge-length constraints,
the force-directed algorithm usually quickly finds an equilibrium state. However, there are
some situations where it gets stuck and cannot find an equilibrium state. Also, it is difficult to
find parameters that are suitable for a wide variety of graphs.

3.3. IMPLEMENTATION OF A FORCE-DIRECTED ALGORITHM IN A GRAPH INTERACTION ENVIRONMENT 46
The pseudocode for the calculation of forces is:
FOR each node n1
n1.force = (0, 0, 0)
IF n1 is not fixed
FOR each node n2
IF n1 != n2 THEN
distance = Euclidean distance between n1 and n2
IF n1 and n2 are connected by an edge THEN
ideal = ideal distance between n1 and n2
attraction = (distance-ideal)/ideal
n1.force += -attraction*(n1.pos - n2.pos)
ELSE
IF distance < some threshold t THEN
repulsion = (t*t)/(distance*distance)
n1.force += repulsion*(n1.pos - n2.pos)
END IF
END IF
END IF
END FOR
END IF
END FOR
FOR each node n
move n in direction of force
END FOR

3.4. COMPUTATIONAL COMPLEXITY OF THE METHODS USED 47
3.4. Computational Complexity of the methods used
An important factor when comparing different graph interaction techniques is the computa-
tional complexity. The computational complexity largely determines the size of graphs that can
be effectively used with the technique.
It can be seen from the pseudocode that the Verlet integration step can be performed in time
linear in the number of nodes. This is because each node must be visited once. The pseudocode
for the constraint solver shows that in order to satisfy the box constraint each node must be
visited once, and for the edge-length constraint, each edge must be visited once. Therefore
the standard skeletal technique is linear in the larger of the number of nodes or edges. The
computational complexity for the standard skeletal technique isO(|V |+ |E|).
The skeletal technique with angular constraints has the additional operation of calculating the
forces on each node. Each node must determine the force exerted upon it by possibly every
other node. Therefore the time complexity is quadratic in the number of nodes. The compu-
tational complexity for the skeletal technique with angular constraints isO(|V |2). This is the
main disadvantage of the method with angular constraints over the standard skeletal method.
The force-directed algorithm also needs to visit every other node to calculate the force on each
node. The time complexity of the force-directed algorithm is thereforeO(|V |2).
It can be seen from these figures that all techniques run in polynomial time allowing them to
be useful for many situations. However, the performance of the force-directed and angular
constraints methods could deteriorate on large graphs. The standard skeletal technique would
perform better on large graphs in most cases. In cases where every node is connected to every
other node (complete graphs), the time-complexity would be the same.

CHAPTER 4
Evaluation of Skeletal Animation Techniques in Graph Interaction
Chapter 3 introduced the particle system as a technique for simulating the skeletal metaphor
in a graph interaction environment. We would like to evaluate this technique both in terms of
its ability to simulate the skeletal metaphor and in terms of its usefulness for graph interac-
tion. This chapter presents an evaluation of skeletal animation techniques when used in graph
interaction in order to determine the value of each technique and also the merit of the skeletal
metaphor. The results are provided in the form of column graphs at the end of this chapter.
4.1. User Study
Aims of the User Study
A usability study is a reliable way of measuring the usefulness of graph interaction techniques,
as feedback from users is a strong indication of how easy and natural the system is to use. It
also provides an indication of how enjoyable it is to use the system.
A study was performed as a part of this project. This study aims to provide answers to the
following research questions:
a) Is the particle system useful for simulating skeletal animation in graph interaction?
b) Is the skeletal metaphor useful for graph interaction in the general case?
c) Is the skeletal metaphor useful for graph interaction in specific domains?
48

4.1. USERSTUDY 49
d) What domains are most suited to the skeletal metaphor?
In answering these questions, the study aims to affirm or reject the following hypotheses:
a) New techniques will have a positive effect on the simulation of the skeletal metaphor in
graph interaction.
b) The use of the skeletal metaphor will have a positive effect on the user’s ability to
understand the graph structure
Description of the Process and Survey Questions
Participants of the user study used the system developed in Sections 3.2 & 3.3 to perform graph
interaction tasks. They were asked to answer survey questions based on their experience with
the system. The survey is included in Appendix B on page 88. We had 16 participants take
part in our user study. They were postgraduate and Honours students in the field of computer
science.
FIGURE 4.1. The graph used for part 1 of the user study.
Part 1 of the survey involved using the system on the graph given in figure 4.1 using the particle
system both with and without the threshold. As described in Section 3.2 the threshold restricts

4.1. USERSTUDY 50
the movement of the user in order to better maintain the skeletal constraints. The threshold
used for the study was determined experimentally. We used a threshold that provided a bal-
ance between restricting the user’s movements too much and allowing excessive violation of
constraints.
The purpose of part 1 of the survey was to evaluate the particle system in terms of its ability
to simulate the skeletal metaphor. The aim of this part is to answer research question (a) while
giving a small insight into question (b). This part was also designed to compare the particle
system using the threshold to the particle system not using the threshold.
The participants of the study were asked to provide a rating for each technique on an integer
scale of 1 (lowest) to 5 (highest), for the following four questions:
A. How well does the system preserve the structure of the skeleton? (Structure is pre-
served when the lengths of "bones" are at their original length)
B. When dragging around a node, did the bones react in the way you expected (How
intuitive is the system)?
C. While moving a node was it easy to maintain your understanding of the structure of
the graph?
D. Was the system fun to use?
The participants were advised to give ratings in such a way that the techniques could be mea-
sured individually against the scale as well as comparatively. There was also space for addi-
tional comments after each question so that the user could further explain their choice if desired.
For the remaining questions in this part, the participants were asked to give a written response
explaining their answer:
E. Which aspect of each system did you like the most, Why?
F. Which aspect of each system did you like the least, Why?
G. Based on your experience with the two systems what do you consider to be most

4.1. USERSTUDY 51
important, maintaining the skeletal structure or allowing freedom of movement? Explain.
H. Do you have any further comments to make on any aspect of these systems or this
section?
Question A is aimed at measuring and comparing the ability of each technique to satisfy the
bone-length constraints of the skeleton. This is the most important factor in terms of measuring
a techniques ability to simulate a skeleton. It is the nature of the skeleton that bone-lengths
remain constant. If this is not the case then it could be argued that the system is only loosely
simulating a skeleton. The visual cues provided in our system mean that the user will always
know if the bone-length constraints are satisfied. This will ensure that the answers provided
by participants in this question will be an accurate representation of the level of constraint
satisfaction.
Question B tries to identify which technique users find most natural or intuitive. Due to the fact
that a skeleton is a natural structure that humans are used to manipulating, it is expected that a
system that simulates the skeleton effectively would be natural and intuitive. If the system is
found not to be intuitive it could mean that it is not simulating the skeleton very well. However,
it could also mean that the skeletal metaphor is not as natural and intuitive as expected when
applied to graph interaction.
Question C is present to measure the success of each algorithm in preserving the user’s mental
map. The mental map is likely to be maintained if only small, intuitive changes are made. If
large, drastic changes are made then the user will be unable to identify how the current drawing
relates to previous drawings and the benefits of interaction are reduced. A system that simulates
the skeleton well is expected to maintain the mental map as changes are restricted to maintain
similar aesthetic properties.
Question D has been included as an informal way to ascertain the algorithm of general prefer-
ence to the participants and also to determine how enjoyable each technique is to use. Questions
E & F have been included to record what the users consider to be the strengths and weaknesses

4.1. USERSTUDY 52
of the two methods. The purpose of Question G is to determine whether restrictions placed
upon the movement of the graph in order to better satisfy the skeletal constraints, helps or hin-
ders their ability to understand the graph structure. Question H is for any extra comments the
participant may have.
FIGURE 4.2. The graph used for part 2 of the user study.
Part 2 of the survey involved using the system on the graph given in figure 4.2 using the parti-
cle system, the force-based technique and the particle system with angular constraints. While
part 1 was designed to give some insight into the usefulness of the skeletal metaphor, only
by comparing the particle system with a non-skeletal technique can we completely identify
it’s strengths and weaknesses. Evaluating the new skeletal technique against a traditional non-
skeletal technique is the purpose of part 2 of the survey. The particle system simulates the
skeleton while the force-based method is non-skeletal. The particle system with angular con-
straints is a skeletal animation technique but also has force-based elements. These techniques
will be evaluated in terms of the users understanding of the graph structure. The aim of this
part is to answer research question (b).
Once again, the participants of the study were asked to provide a rating for each technique on a
scale of 1 to 5, for the first four questions. Space for additional comments was again provided.

4.1. USERSTUDY 53
The questions were:
A. How easy was it to obtain a picture in which you could easily understand the structure
of the graph?
B. While moving the structure around, did the graph react in the way you expected (How
intuitive is the system)?
C. While moving a node was it easy to maintain your understanding of the structure of
the graph?
D. Was the system fun to use?
The questions requiring a written response were:
E. Which aspect of each system did you like the most, Why?
F. Which aspect of each system did you like the least, Why?
G. Do you have any further comments to make on any aspect of these systems or this
section?
Question A attempts to capture a general notion of the skeletal metaphor’s effect on a user’s
ability to manipulate the graph into a readable form. The main aim of graph interaction is to
allow the user to easily produce a drawing that they can understand. Therefore, the performance
of a technique in this question give a strong indication of how useful it is for interaction tasks.
The remaining questions have a similar purpose to those in part 1, this time comparing skeletal
and non-skeletal techniques.
The purpose of part 3 of the survey is to evaluate the new skeletal technique against a non-
skeletal technique using graphs from specific domains. These will be evaluated similarly to
part 2. The aim of this part is to answer research questions (c) and (d).

4.1. USERSTUDY 54
FIGURE 4.3. The web graph used for part 3 of the user study.
FIGURE 4.4. The hex game graph used for part 3 of the user study.
The questions in this section were very similar to those in part 2, this time comparing the tech-
niques in the two domains and also comparing the two domains (See Appendix B on page 88).
The first graph that was used is shown in figure 4.3. It is a graph of high degree similar to a
possible web graph. High performance of a technique on this graph gives a small indication
that the technique will be useful for high degree graphs such as web graphs.
The second graph used is that of a hex game graph [Rijswijck02, Murray03 ]. It is shown in
figure 4.4.

4.2. RESULTS& D ISCUSSION 55
4.2. Results & Discussion
Part 1 - Comparison of Skeletal Techniques
The results from part 1 of the user study are shown as a column graph in figure 4.5. To obtain
the value for each method and question we took the average of the responses provided. From
the graph we can easily see the performance of each method against the scale and we can also
easily compare the methods.
From the results in question A it can be seen that the threshold method is more effective at
preserving edge lengths than the non-threshold method. This strong trend towards the threshold
method as a better preserver of edge-lengths was to be expected, as the non-threshold method
allows the user total freedom in stretching bones. However, the scores were still towards the
high end of the scale, indicating that edge lengths were well preserved. This is because it
is only in cases were the fixed nodes are chosen such that it is impossible to satisfy edge-
lengths, that violations will occur. In normal cases, all constraints will be satisfied. As the
threshold method prevents some cases where it is impossible to satisfy edge constraints, it is
better at preserving edges lengths. Some participants did not indicate any difference between
the threshold and non-threshold methods. This may be because they did not create or attempt
to create configurations in which the violation threshold would be exceeded. The threshold
chosen still allowed some violations. Perhaps with a lower threshold, the difference between
the methods would have been more obvious. However, this would have limited the usefulness of
the method, as movement would feel too restrictive. In hindsight, it would have been beneficial
to construct more study cases with a wider variety of circumstances. Based on the results
achieved, it seems fair to claim that both methods are very effective in satisfying the skeletal
constraints and therefore in simulating the skeletal metaphor.
The results in question B indicate that the method without a threshold is more intuitive. This
may be due to participants finding the threshold method restrictive. Also, it may not have been
obvious from the visualisation when the threshold was reached. Even though the threshold

4.2. RESULTS& D ISCUSSION 56
method achieved a lower score, it still achieved a fairly high rating on the scale. Therefore, it is
reasonable to suggest that both methods are highly intuitive and feel natural to use. This shows
that these methods are effective in aiding the understanding of the graph and also shows that
the skeletal metaphor is useful for graph interaction.
From the results in Question C we can see that the threshold method received a slightly better
rating for preserving the user’s mental map. This is likely due to the fact that the movement is
more restrictive and therefore it is more difficult to make drastic changes to the graph. However,
the difference is fairly small and it would be irresponsible to make any drastic conclusions about
the difference between the techniques at maintaining the mental map. Of some concern is that
both methods are somewhat low on the scale. This indicates that too many changes could be
occurring to the graph as nodes are dragged around making it difficult to see how the current
state of the graph relates to previous drawings. While the ability of the skeletal metaphor to
preserve the mental map is not terrible, it does appear to be its weakest aspect.
As can be seen from the results for Question D, both techniques are quite fun to use. The results
also indicate that the users did not have a preference for either system.
The remaining questions produced a wide range of comments. Maintaining the skeletal struc-
ture was considered by the majority of the participants to be the more important factor in aiding
understanding of the graph. Many argued that by maintaining the skeletal structure we are more
likely to produce an aesthetically pleasing drawing, therefore making it easier to understand the
graph structure. Also, if the lengths of edges were representative of edge weights specific to the
graph, this is especially important for understanding the graph structure. Some also suggested
that when the graph was released from a highly stretched state by releasing nodes, the graph
would change drastically. This would result in a loss of the users mental map. If we maintain
the skeletal structure these highly stretched states are less likely to occur. Also, highly stretched
states are more likely to have poor aesthetic properties. Some commented that the threshold
added more realism to the skeleton structure as it would not be possible to stretch an actual
skeleton.

4.2. RESULTS& D ISCUSSION 57
Some of the participants preferred freedom of movement as a more important aspect. This al-
lows them to place the graph in any possible configuration and by unfixing nodes, they can also
ensure that the skeletal structure is satisfied. One user commented that relaxing the constraints
is beneficial in an interactive environment. This makes sense, as for a single graph drawing
we do want all constraints to be satisfied. However, in an interactive situation, it seems accept-
able to temporarily allow some violations while a configuration is being formed. Once we have
achieved a configuration which we can understand, satisfying any small violations will increase
the aesthetics of the drawing and increase our understanding of the graph even further. Also,
for graph drawings subject to edge length constraints, there may be no embedding that satisfies
the constraints [Borcea02]. So we must allow some violation of constraints or we will limit the
areas in which our techniques will be useful.
Based on these comments, we conclude that maintaining the skeletal structure is the most
important characteristic as it helps to provide an aesthetically pleasing drawing that is easy
to understand. However, we also believe that the skeletal structure can be maintained in an
environment allowing complete freedom of movement, as long as the user makes an attempt
to avoid configurations that highly stretch the graph, by paying attention to the visual cues and
also keeping the subset of fixed nodes fairly minimal. Using this technique with that mind-
set would allow the user to configure the graph in any possible way while maintaining the
skeletal structure and therefore continually achieving an aesthetically pleasing drawing, that
feels realistic and natural, therefore increasing the users understanding of the graph.
Both systems have shown to be useful for simulating the skeletal metaphor. Whether this aids
the users understanding of the graph will be evaluated further in part 2.
One respondent commented that the structure responded quickly to user input in both tech-
niques. This further supports our claim that the particle system is fast and helps to provide
smooth, natural motion.

4.2. RESULTS& D ISCUSSION 58
Part 2 - Comparison of Skeletal and Non-Skeletal Techniques
The results from part 2 of the user study are shown as a column graph in figure 4.6. To obtain
the value for each method and question we took the average of the responses provided. From
the graph we can easily see the performance of each method against the scale and we can also
easily compare the methods.
The first thing that we notice from the graph is that the skeletal technique with angular con-
straints outperforms the other techniques significantly in all questions. This indicates that the
skeletal technique with angular constraints is the best at aiding a user’s understanding of a
graph.
For question A, the skeletal technique slightly outperforms the force-directed technique, but
both techniques have high enough ratings to indicate that they are useful for quickly and easily
obtaining a readable graph. The rating of the skeletal technique with angular constraints is very
high showing that it is extremely useful for this purpose.
The results for question B indicate that the force-directed method is the least intuitive. Both
of the skeletal techniques are more intuitive. This supports our claim that the natural motion
provided by the skeletal techniques would be intuitive because people regularly manipulate a
skeletal structure. The skeletal structure with angular constraints is shown to be even more
intuitive. This is due to the fact that it provides added realism as the movement of joints in a
normal skeleton have restrictions on the range of movement.
In question C, the force-directed algorithm slightly outperforms the standard skeletal technique
but not by a significant amount. Both methods are shown to be fairly effective in preserving the
users mental map.
The users also have a preference for the angular constraints method as shown in question D.
They are more likely to enjoy using the system if it helps them to understand the graph.

4.2. RESULTS& D ISCUSSION 59
The remainder of the questions requiring descriptive answers further supported the results ob-
tained previously but failed to provide much further insight into the usefulness of each tech-
nique.
In summary, the results show that the skeletal technique is better at assisting a user to under-
stand the graph structure than the non-skeletal technique. Adding angular constraints to the
skeletal metaphor has the effect of providing good angular resolution which increases its use-
fulness significantly. Therefore, we propose the following revised version of the definition of a
skeleton:
A skeleton is a set of joints (J) and a set of bones (B). Each jointj ∈ J is connected by a set
of bonesBj ⊆ B to set of jointsjADJ ⊆ J, |jADJ | > 0.
There exist constraints on the skeleton that should be preserved:
• The lengthlb of each boneb ∈ B should not change.
• Given a set of jointsF ⊆ J , termed the fixed point set, each jointj ∈ F should remain
at its initial location in Euclidean space.
• For each pair of jointsji, jj ∈ J not connected by a boneb ∈ B, the Euclidean distance
betweenji andjj must remain greater than some thresholdt.
The skeletal method with angular constraints does have the disadvantage that the extra work in
enforcing the angular constraints makes this method a bit slower.
Our results show that the skeletal metaphor is useful for graph interaction as it significantly
helps the user to comprehend the graph.

4.2. RESULTS& D ISCUSSION 60
Part 3 - Specific Domain Graphs
The results for the web graph are given in figure 4.7. The standard skeletal technique performs
poorly on this graph. This is due to the fact that the graph was of high degree and edges tended
to bunch together around the node from which they emanate. With the angular constraints in
place however, we once again get very good results.
The results for the hex graph are given in figure 4.8. The standard skeletal technique performs
better on this graph. However, it is still slightly below the performance of the force-directed
algorithm.
Based on the ratings, all techniques perform slightly lower on these graphs than on the general
graphs. This could be because these graphs are more difficult to understand or because these
domains are less suited to the skeletal metaphor.
Figures 4.9 & 4.10 show a direct comparison between the web and hex graphs on the two
skeletal techniques. For the standard skeletal technique, the hex graph performs better largely
due to the poor performance on the web graph as described above. For the skeletal technique
with angular constraints, the web graph performs better because with good angular resolution
it is an easier graph to understand.
Our results indicate that the skeletal metaphor could be useful for graph interaction in specific
domains and that web-graphs are more highly suited to the skeletal metaphor than the hex game
graph. However, this part of our evaluation was somewhat limited. The evaluation of graph in-
teraction techniques in specific domains would give greater understanding by having expert
analysts complete specific graph interaction tasks with labelled graphs representing real data.
There are also many more domains in which these techniques could be evaluated. The skeletal
metaphor is potentially useful in any application where it is crucial to visualize structural in-
formation as graphs. Further evaluation of the use of the skeletal metaphor in specific domains
remains an area for future work.

4.2. RESULTS& D ISCUSSION 61
Summary
From the results of our study we were able to confirm our hypotheses that new techniques will
have a positive effect on the simulation of the skeletal metaphor and that the use of the skeletal
metaphor will have a positive effect on the user’s ability to understand the graph structure.
4.3. COMPARISON OF THEPARTICLE SYSTEM WITH PREVIOUS TECHNIQUES 62
4.3. Comparison of the Particle System with Previous Techniques
Part of the motivation for this thesis was that the techniques used by Merrick were not highly
successful in simulating the skeletal metaphor or increasing the user’s understanding of the
graph structure [Merrick02 ]. Therefore we will demonstrate that we have improved upon the
previous work by showing that the particle system is more effective in achieving these aims.
The CCD & force-directed approaches resulted in a stretchiness of bones. This violates the
prescribed skeletal metaphor and damages the perception that a physical entity is being manip-
ulated. The CCD method lead to a stretch in bones as a result of a cumulative error. In the
particle system, any small errors will converge over subsequent frames while more iterations
are applied. The force-directed technique resulted in very stretchy bones as a result of the naive
approach in simulating the skeleton. The parameters were chosen in an attempt to create ex-
tremely stiff springs but it was not as effective as expected, as it is still possible for the springs
to stretch. In the particle system, the edges are modelled as infinitely stiff springs, so their ideal
length is reached instantly, minimising stretching.
Generally, in the particle system, the only time when edge-length constraints remain unsatis-
fied, is when the set of fixed-nodes make it impossible to satisfy both fixed node constraints
and edge-length constraints, as described in Section 3.2 (See figure 3.12). The constraint solver
ensures that the edge length constraint is always satisfied provided the set of fixed joints allows
this to be possible. Edges that have violated the length constraint due to the nature of the
fixed joints, will return to their original length once possible. The violation of bone-length
constraints can be further reduced by using the threshold mechanism.
The CCD method became very slow in some cases in the previous system. For a graph inter-
action system to be useful it must be useable in real-time, which was not always true of this
approach. The particle system is designed to be very fast in order to be useful for interactive
purpose. Verlet integration is a fast method of simulating particle motion. Satisfying environ-
mental constraints by projection is also very fast as is satisfying edge-length constraints. It also

4.3. COMPARISON OF THEPARTICLE SYSTEM WITH PREVIOUS TECHNIQUES 63
allows for a speed versus accuracy trade off by adjusting the number of iterations per frame,
without accumulating visually obvious errors. The square-root approximation can also be used
to further speed up the system’s response to user actions.
The motion should also remain smooth and natural as is the intention of the skeletal metaphor.
The NLP method provided jumpy motion and this limited its usefulness significantly. Con-
versely, the motion provided by the physics system is smooth and natural, helping the user to
quickly and easily understand the graph structure.
None of the previous methods implemented any form of angular constraints. Angular con-
straints not only add a greater level of realism to the skeletal structure, they also greatly improve
the angular resolution of the resultant graph drawing. The results of our user study support this
and also show that the angular constraints significantly improve the users ability to understand
the graph. By providing a technique with angular constraints we provide our system with an
additional advantage over the previous techniques.
While Merrick applied the skeleton to only part of the graph, we have modelled the entire graph
as a skeleton. As a result our entire graph represents a physical structure while in Merrick’s
system this was only partially the case. Also, Merrick required preprocessing to determine the
skeleton and also required additional processing to determine the movements of non-skeletal
nodes.
The physics system provides the advantages of all three previous methods while also providing
some additional advantages. It also has none of the disadvantages of the previous techniques.
It provides satisfaction of the constraints of a skeleton while ensuring the naturalness of the
skeletal motion and fast speed of execution. The particle system provides a fast, accurate
simulation of the skeletal metaphor that increases the users ability to understand the graph
structure.

4.3. COMPARISON OF THEPARTICLE SYSTEM WITH PREVIOUS TECHNIQUES 64
�
�����
�
���
�
�� ��
�
�����
�
�����
�
����� ��!#"%$#&('*)+-,%.#/10*2436587:9<;>=@? ACB:DFEHGJIFKJLNM%O PRQ:ST*UWV XZY%[:\4]6^#_Z`bacedgfRhji%kmlonNpFqsr�tuwvyxz6{b|~}������j�������
� ������R�����
��������
�¡ ¢¤£Z¥§¦©¨ª¬«®�¯ °²±Z³§´©µ¶¬·®¸�¹
FIGURE 4.5. The results for part 1 of the user study.

4.3. COMPARISON OF THEPARTICLE SYSTEM WITH PREVIOUS TECHNIQUES 65
������
����
��� ��
������
������
�
����� �"!$#&%('*),+.-0/13254�687:98;=<>@?,A:B.CEDGFIHJLKNMPO5Q$RPS$TVUXW*Y[ZN\]_^a` b(cXdNe,f.gih(j:klnmpo[qsrXtvu wVxPy{z}|~����
�.�:���������s�������
� �@�&��[�����
� �¡¢¤£¥
¦¨§ª©¬«®°¯²±�³�´¶µ¨·¹¸¬ºI»¼�½a¾À¿LÁöÄÆÅÇ�ÈaÉÀÊLËÃ̶ÍÀÎ:ÏÑÐ0ÒÔÓÑÕ×Ö�ت٨ڤÛÀÜÞÝàßÞá�â¹ãåäçæéèpênëíì
FIGURE 4.6. The results for part 2 of the user study.

4.3. COMPARISON OF THEPARTICLE SYSTEM WITH PREVIOUS TECHNIQUES 66
�
�����
�
���
�
�� ��
�
�����
�
�����
�
����� �"!$#&%('*),+.-0/13254 687598:<;>=@?BA5C.DEGFIHJLKNMPORQ$SPT$UWVYX[Z]\N^`_badc egfYhNi,j.k[l&m5noqpBr]sutYvxw�yWzP{}|�~>������ �@�&��]�����
��������
���������¡ £¢¥¤§¦©¨�ª�«�¬®¯�°d±³²L´Iµ©¶¸·¹�ºd»³¼L½I¾©¿³À5ÁÃÂ0ÄÆÅÃÇÉÈ3Ê�Ë�Ì�ͳÎÐÏÒÑÐÓ3Ô�Õ×ÖÙØÛÚBÜqÝßÞ
FIGURE 4.7. The results for the web graph in part 3 of the user study.

4.3. COMPARISON OF THEPARTICLE SYSTEM WITH PREVIOUS TECHNIQUES 67
�
�����
�
���
�
�� ��
�
�����
�
�����
�
����� �"!$#&%('*),+.-0/13254 687598:<;>=@?BA5C.DEGFIHJLKNMPORQ$SPT$UWVYX[Z]\N^`_badc egfYhNi,j.k[l&m5noqpBr]sutYvxw�yWzP{}|�~>������ �@�&��]�����
��������
���������¡ £¢¥¤§¦©¨�ª�«�¬®¯�°d±³²L´Iµ©¶¸·¹�ºd»³¼L½I¾©¿³À5ÁÃÂ0ÄÆÅÃÇÉÈ3Ê�Ë�Ì�ͳÎÐÏÒÑÐÓ3Ô�Õ×ÖÙØÛÚBÜqÝßÞ
FIGURE 4.8. The results for the hex game graph in part 3 of the user study.

4.3. COMPARISON OF THEPARTICLE SYSTEM WITH PREVIOUS TECHNIQUES 68
�
�����
�
���
�
�� ��
�
�����
�
�����
�
����� �"!$#&%('*),+.-0/13254 687598:<;>=@?BA5C.DEGFIHJLKNMPORQ$SPT$UWVYX[Z]\N^`_badc egfYhNi,j.k[l&m5noqpBr]sutYvxw�yWzP{}|�~>������ �@�&��]�����
��������
� �@� �����
FIGURE 4.9. Comparing the results for web and hex graphs using the skeletal technique.

4.3. COMPARISON OF THEPARTICLE SYSTEM WITH PREVIOUS TECHNIQUES 69
�
�����
�
���
�
�� ��
�
�����
�
�����
�
����� �"!$#&%('*),+.-0/13254 687598:<;>=@?BA5C.DEGFIHJLKNMPORQ$SPT$UWVYX[Z]\N^`_badc egfYhNi,j.k[l&m5noqpBr]sutYvxw�yWzP{}|�~>������ �@�&��]�����
��������
� �@� �����
FIGURE 4.10. Comparing the results for web and hex graphs using the skeletal
technique with angular constraints.

CHAPTER 5
Conclusion
This chapter concludes this report by summarising the original goals, how they were achieved,
and what conclusions can be drawn from them. It also covers some directions for future re-
search work.
5.1. Research Contribution
In Chapter 1 of this thesis, we raised the issue that, although much research has been done in
the area of graph visualisation, there remains a need for investigation into techniques for graph
interaction that will complement the visualisation and increase the user’s understanding of the
graph.
We have introduced the particle system as a method for skeletal animation that can be used
for graph interaction tasks. As the skeleton is a natural structure, and this method was de-
signed for interactive use with the dragging of joints in mind, it is quite suitable for providing a
graph interaction environment that feels natural and intuitive. We made the method even more
more suitable for this purpose by adding features specifically designed to aid graph interaction
such as fixed node constraints, an error threshold and visual cues. The adapted particle sys-
tem improves upon the previous techniques used for skeletal animation in graph interaction.
This shows that our new technique has had a positive effect on the simulation of the skeletal
metaphor in graph interaction.
70

5.1. RESEARCHCONTRIBUTION 71
Previous evaluation of the usefulness of the skeletal metaphor was inconclusive due to the
limited scope of the survey undertaken. We have demonstrated it’s usefulness through a more
comprehensive user study into the benefits of the skeletal metaphor and the different methods
used. The results clearly show that the skeletal techniques, especially with angular constraints,
are much more effective at providing a mechanism for which the user can easily understand the
graph. The more comprehensive user study that we have undertaken produces solid evidence
of the usefulness of the skeletal metaphor.
We have also provided some evaluation of the skeletal metaphor in the domains of web graphs
and the hex game graph. Graph drawing and interaction techniques designed solely for general
graphs are often not useful once they are applied to domain-specific graphs [Purchase00]. By
evaluating the particle system and the skeletal metaphor in these domains we give a greater
insight into how useful it truly is.
We have also added to the definition of the skeletal metaphor to further improve its utility. We
have added the condition of angular constraints. Our user study confirms that this is advanta-
geous.
The satisfaction of the constraints of a skeleton while ensuring the naturalness of the skeletal
motion and fast speed of execution, provides a fast, accurate simulation of the skeletal metaphor
that increases the user’s ability to understand the graph structure.
This work adds to the field of graph interaction by providing a natural system of navigating a
graph with the ability to increase the user’s understandability of the graph structure, much more
so than alternative methods such as a force-directed algorithm. This shows that the use of the
skeletal metaphor has a positive effect on the user’s ability to understand the graph structure.

5.2. FUTURE WORK 72
5.2. Future Work
The only method of interaction with the system presented in this thesis, and the system de-
scribed by Merrick [Merrick02 ] was through the use of a standard two dimensional mouse.
Other devices for interaction with three dimensional displays could provide a more natural in-
terface between the user and the system, complementing the skeletal metaphor. In particular,
haptic interaction devices not only provide a method for interaction in three dimensions but use
force feedback techniques to give the user an actual physical feel of what they are interacting
with. The benefits of haptic devices have been explored [Hinckley96] and these devices have
been shown to be quite useful for a range of applications. It remains to be determined, when
using a graph interaction system utilising the skeletal metaphor, what additional benefits would
be provided by using three dimensional input devices such as haptic devices. One of many
possible benefits would be to allow the user to more easily determine when a threshold has
been reached through the use of force-feedback. We could not answer this question here, as the
complexities involved in using haptic devices, and their high cost, placed this task outside the
scope of an Honours thesis, unless it was the primary focus.
The work of Ware and Franck has shown [Ware94] that many of the benefits of three dimen-
sional visualisations are further realised when 3D display devices such as a stereoscopic, hand-
tracked 3D display are used. The use of the skeleton metaphor with such devices is therefore
likely to see even more benefits.
Our evaluation of the different techniques used gave us a strong indication of how useful the
skeletal metaphor is for general graphs. However, our evaluation in specific domains was some-
what limited as it didn’t involve completion of specific graph interaction tasks with labelled
graphs representing real data. It would also be beneficial to have expert analysts from that
field using the system. There are also many more domains in which these techniques could be
evaluated. The skeletal metaphor is potentially useful in any application where it is crucial to
visualize structural information as graphs. An evaluation of the skeletal metaphor in any of the
areas would provide a significant research contribution.

5.2. FUTURE WORK 73
An alternative to a graph interaction environment allowing the user to make changes, would be
software that animates a drawing of a graph. This animation would show many different views
of the graph independent of user input. The aim of this approach would be to smoothly animate
between configurations of the graph while maintaining aesthetic properties in order to increase
the users understanding of the graph while preserving the user’s mental map. This approach
could achieve all the advantages of graph interaction without relying on actions from the user
to produce readable drawings. It would also be possible to use skeletal animation techniques
for this approach towards aiding a user’s understanding of a graph.
Another possibly would be to use additional data associated with the graph to determine phys-
ical aspects of the graph. Some parameters that could depend on the input graph could be bone
thickness, length and stretching threshold. These factors would provide a physical structure
that more closely resembles the graph data. It remains to be seen whether this would increase
the user’s understanding of the graph but is definitely an area worth exploring.
In our system it was possible for nodes and edges to pass through each other. Collision detection
involves determining if two objects intersect each other. Adding collision detection to a skeletal
graph interaction system would provide further realism, as it could be used to prevent nodes
and edges from intersecting. This may increase the ability of the user to understand the graph,
and is therefore an area worth investigating.
This thesis has not only contributed to the field of graph interaction but have also opened up
many possibilities for future work in this area. Such research is likely to provide an important
contribution in the fields of both graph visualisation and human computer interaction in the
future.

References
[Badler87] N. Badler, Manoochehri K. and G. Walters.Articulated figure positioning by mul-
tiple constraints. IEEE Comput. Graph. Appl. 7(6), pages 28-38. (1987).
[Batini85] C. Batini, L. Furlani and E. Nardelli.What is a Good Diagram? A Pragmatic Ap-
proach. In Proc. 4th Internat. Conf. on the Entity-Relationship Approach, pages 312-
319 (1985).
[Battista94] G. Di Battista, P. Eades, R. Tamassia and I Tollis.Algorithms for Drawing Graphs:
an Annotated Bibliography. Computational Geometry: Theory and Applications, 4
(5), pp. 235-282 (1994).
[Battista99] G. Di Battista, P. Eades, R. Tamassia and I. Tollis.Graph Drawing: Algorithms
for the Visualization of Graphs. Prentice-Hall, Englewood Cliffs, NJ. 1999.
[Behzadi99] L. Behzadi.An Improved Spring-based Graph Embedding Algorithm and Lay-
outShow: a Java Environment for Graph Drawing. Master’s thesis, York University,
North York, Ontario, Canada (1999).
[Belista03] K. Belista.Interacting with Large Web Graphs Using Skeletal Animation and Clus-
tering. Honours Thesis, School of Information Technologies, The University of Syd-
ney (2003).
[Bertault00] F. Bertault.A force-directed algorithm that preserves edge-crossing properties.
Information Processing Letters, 74(1–2):7–13 (2000).
[Biedl98a] T. C. Biedl and G. Kant.A better heuristic for orthogonal graph drawings. Comput.
Geom., 9(3):159–180 (1998).
[Biedl98b] T. C. Biedl, B. P. Madden and I. G. Tollis.The Three-Phase Method: A Unified
Approach to Orthogonal Graph Drawing. In G. Di Battista, editor, Graph Drawing
(Proc. GD ’97), volume 1353 of Lecture Notes in Computer Science, pages 391–402.
SpringerVerlag (1998).
74

REFERENCES 75
[Biedl99] T. Biedl, T. Shermer, S. Whitesides and S. Wismath.Bounds for Orthogonal Graph
Drawing. J. Graph Alg. Appl., 3(4):63-79 (1999).
[Borcea02] C. Borcea and I. Streinu.On the Number of Embeddings of Minimally Rigid
Graphs. SoCG’02, June 5-7 (2002).
[Bose98] P. Bose, H. Everett, S. P. Fekete, M. E. Houle, A. Lubiw, H. Meijer, K. Romanik,
G. Rote, T. C. Shermer, S. Whitesides and C. Zelle.A Visibility Representation for
Graphs in Three Dimensions. J. Graph Algorithms Appl. 2 (3) 1-16 (1998).
[Brady82] M. Brady, J. Holierbach, T. Johnson, T. Lozano-Perez and M. Mason.Robot Mo-
tion: Planning and Control. MIT Press, Cambridge (1982).
[Brandenburg96] F. J. Brandenburg, M. Himsolt and C. Rohrer.An Experimental Comparison
of Force-Directed and Randomized Graph Drawing Algorithms. In Proceedings of
Graph Drawing GD95, pages 76-87. Springer (1996).
[Bruβ96] I. Bruβ and A. Frick.Fast Interactive 3D graph visualisation. Lecture Notes in Com-
puter Science, 1027:99—110 (1996).
[Cockburn01] A. Cockburn and B. J. McKenzie.3d or not 3d? Evaluating the effect of the
third dimension in a document management system. In CHI, pages 434-441 (2001).
[Davidson96] R. Davidson and D. Harel.Drawing graphs nicely using simulated annealing.
ACM Transactions on Graphics, 15:301-331 (1996).
[Dengler93] E. Dengler, M. Friedell and J. Marks.Constraint-Driven Diagram Layout. In
Proceedings of the 1993 IEEE Symposium on Visual Languages, pages 330–335,
Bergen, Norway (1993).
[Ding90] C. Ding and P. Mateti.A Framework for the Automated Drawing of Data Structure
Diagrams. IEEE Transactions on Software Engineering, SE-16, (5), 543–557 (1990).
[Dwyer01] T. Dwyer.Three Dimensional UML Using Force Directed Layout. In P. Eades and
T. Pattison, editors, Information Visualisation 2001 (2001).
[Eades84] P. Eades.A heuristic for graph drawing. Congressus Numerantium, 42:149–160
(1984).
[Eades91] P. Eades, W. Lai, K. Misue and K. Sugiyama.Preserving the mental map of a dia-
gram. in Proc. of Compugraphics, pp. 24-33 (1991).

REFERENCES 76
[Eades97] P. Eades, A. Symvonis and S. Whitesides.Two algorithms for three dimensional
orthogonal graph drawing. In North, S., editor, Proc. Graph Drawing, GD, number
1190, pages 139—154, Berlin, Germany. SpringerVerlag (1997).
[Eades99] P. Eades, Q.-W. Feng and X. Lin.Straight-line drawing algorithms for hierarchi-
cal graphs and clustered graphs. In S. North, editor, Graph Drawing (Proceedings
GD’96), pages 113–128 (1999).
[Eklund99] J. Eklund, J. Sawers and R. Zeiliger.NESTOR Navigator: A Tool for the Collab-
orative Construction of Knowledge Through Constructive Navigation. Proc. of Fifth
Australian World Wide Web Conference (AusWeb 99) Lismore: pp. 396-408 (1999).
[Esposito88] C. Esposito.Graph Graphics: Theory and Practice. Computer Mathematics Ap-
plications, 15(4), 247-253 (1988).
[Frick94] A. Frick, A. Ludwig and H. Mehldau.A fast adaptive layout algorithm for undirected
graphs. In Proc. of the DIMACS International Workshop on Graph Drawing (GD’94)
(1994).
[Friedrich02] C. Friedrich.Animation in Relational Information Visualization. Phd thesis. Uni-
versity of Sydney. 2002.
[Fruchterman91] T. Fruchterman and E. Reingold.Graph drawing by force-directed place-
ment. Software—Practice and Experience, 21(11):1129-1164 (1991).
[Furnas86] G. W. Furnas.Generalized Fisheye Views. Human Factors in Computing Systems,
CHI ’86 Conference Proceedings, ACM Press, pp. 16-23 (1986).
[Germano99] T. Germano.Graph Drawing. http://davis.wpi.edu/∼matt/courses/graphs/
(1999).
[Girard85] M. Girard and A. A. Maciejewski.Computational modeling for the computer ani-
mation of legged figures. In Barsky, B. A., editor, Computer Graphics (SIGGRAPH
85 Proceedings), volume 19, pages 263-270 (1985).
[Gould86] P. Gould and R. White.Mental Maps. Allen and Unwin Inc.. Winchester, Mass.
01890, USA. 1986.
[Gutwenger98] C. Gutwenger and P. Mutzel.Planar Polyline Drawings with Good Angular
Resolution. Proc. 6th Intl. Symp. Graph Drawing (GD ’98), LNCS vol. 1547, pp.
167-182 (1998).

REFERENCES 77
[Herman00] I. Herman, G. Melanon and M. S. Marshall.Graph visualization and navigation in
information visualisation: a survey. IEEE Transactions on Visualization and Com-
puter Graphics, 6(1):24–43 (2000).
[Hinckley96] K. Hinckley.Haptic Issues for Virtual Manipulation. Ph.D. dissertation, Univer-
sity of Virginia, Dept. of Computer Science (1996).
[Hopcroft74] J. Hopcroft and R. Tarjan.Efficient Planarity Testing. J. ACM, 21(4):549-568
(1974).
[Huang98a] M. L. Huang, P. Eades and R. F. Cohen.WebOFDAV - Navigating and Visualizing
the Web On-line with Animated Context Swapping. Proc. 7th Int’l World Wide Web
Conf., Brisbane, 14-18 (1998).
[Huang98b] M. L. Huang, P. Eades and J. Wang.Online animated graph drawing using a
modified spring algorithm. Journal of Visual Languages and Computing, Vol. 9 No.
6 (1998).
[Hutton96] M. D. Hutton and A. Lubiw.Upward planar drawing of single-source acyclic di-
graphs. SIAM J. Comput., 25(2):291–311 (1996).
[Jakobsen01] T. Jakobsen.Advanced Character Physics. TechReport, IO Interactive (2001).
[Kamada89] T. Kamada and S. Kawai.An Algorithm for Drawing General Undirected Graphs.
Information Processing Letters, 31(1):7-15 (1989).
[Kant97] G. Kant.A more compact visibility representation. International Journal of Compu-
tational Geometry and Applications 7, 197-210 (1997).
[Klein83] C. A. Klein and C.-H. Huang.Review of pseudoinverse control for use with kinemat-
ically redundant manipulators.. IEEE Trans. Syst., Man, and Cybern. , vol. SMC-13,
no. 2, pages 245-250 (1983).
[Korein82] J. U. Korein and N. I. Badler.Techniques for generating the goal-directed mo-
tion of articulated structures. IEEE Computer Graphics and Animation, pages 71-81
(1982).
[Lempel67] A. Lempel, S. Even and I. Cederbaum.An algorithm for planarity testing of
graphs. in Theory of Graphs (Proc. of an International Symposium, Rome) (1967).
[Leung94] Y. K. Leung and M. D. Apperley.A Review and Taxonomy of Distortion-Oriented
Presentation Techniques. ACM Transactions on Computer Human Interaction,

REFERENCES 78
1(2):126–160 (1994).
[Maciejewski90] A. A. Maciejewski.Dealing with the ill-conditioned equations of motion for
articulated figures. IEEE Comput. Graphics Appl. 10(3), pages 63-71 (1990).
[Merrick02] D. Merrick. Skeletal Animation for the Exploration of Graphs. Honours Thesis,
School of Information Technologies, The University of Sydney (2002).
[Misue95] K. Misue, P. Eades, W. Lai and K. Sugiyama.Layout adjustment and the mental
map. Journal of Visual Languages and Computing, 6(2):183–210 (1995).
[Murray03] C. Murray, C. Friedrich and P. Eades.HexGraph: Applying Graph Drawing Al-
gorithms to the Game of Hex. In Proc., 11th International Symposium on Graph
Drawing (2003).
[Nascimento02] H. A. D. do Nascimento and P. Eades.A Focus and Constraint-Based Ge-
netic Algorithm for Interactive Directed Graph Drawing. The Second International
Conference of Hybrid Intelligent Systems (HIS’02) (2002).
[Nielsen98] J. Nielsen.2d is better than 3d. http://www.zdnet.com/devhead/alertbox/981115.html
(1998).
[Paul81] R. P. Paul.Robot Manipulators, Mathematics, Programming and Control. The MIT
Press, Cambridge (1981).
[Purchase97] H. C. Purchase, R. F. Cohen and M. I. James.An experimental study of the ba-
sis for graph drawing algorithms. Journal of Experimental Algorithmics (JEA), 2:4
(1997).
[Purchase00] H. C. Purchase, M. McGill, L. Colpoys and Carrington D..Graph drawing aes-
thetics and the comprehension of UML class diagrams: an empirical study. In Aus-
tralian symposium on Information visualization, pages 129-137. Australian Com-
puter Society, Inc. (2000).
[Rijswijck02] J. van Rijswijck.Search and evaluation in Hex. Techreport, University of Al-
berta (2002).
[Schreiber02] F. Schreiber.High Quality Visualization of Biochemical Pathways in BioPath. in
Silico Biology 2(2), 59-73 (2002).
[Sciavicco87] L. Sciavicco and B. Siciliano.A dynamic solution to the inverse kinematic prob-
lem for redundant manipulators. In Proc. IEEE Int. Conf. Robotics and Automation,

REFERENCES 79
Raleigh, North Carolina, pages 1081-1087 (1987).
[Sugiyama81] K. Sugiyama, S. Tagawa and M. Toda.Methods for Visual Understandings of
Hierarchical System Structures. in IEEE Transactions in Systems, Man, and Cyber-
netics, vol. smc-11, no.2, pp. 109-125 (1981).
[Sugiyama87] K. Sugiyama.A cognitive approach for graph drawing.. Cybernetics and Sys-
tems: An International Journal, 18:447–488. (1987).
[Sugiyama95] K. Sugiyama and K. Misue.Graph drawing by magnetic spring model. Journal
of Visual Languages and Computing, Vol.6, No.3, pages 217—231 (1995).
[Tamassia88] R. Tamassia, G. Di Battista and C. Batini.Automatic Graph Drawing and read-
ability of diagrams. IEEE Trans. Syst. Man Cybern., SMC-18(1):61– 79 (1988).
[Tutte60] W. Tutte.Convex Representation of Graphs. Proc. London Math. Soc., III Ser. 10,
304–320 (1960).
[Tutte63] W. Tutte.How to draw a graph. Proc. London Math. Society, 13(52):743–768
(1963).
[Verlet67] L. Verlet.Computer experiments on classical fluids. I. Thermodynamical properties
of Lennard-Jones molecules. Phys. Rev., 159, 98-103 (1967).
[Wang91] L. C. T. Wang and C. C. Chen.A combined optimization method for solving the
inverse kinematics problem of mechanical manipulators. The International Journal
of Robotics Research (1991).
[Ware93] C. Ware, D. Hui and G. Franck.Visualizing object oriented software in three dimen-
sions. In Proc. IBM Centre for Advanced Studies Conf., CASCON (1993).
[Ware94] C. Ware and G. Franck.Viewing a graph in a virtual reality display is three times
as good as a 2-d Diagram. In IEEE Conference on Visual Languages, pp. 182-183
(1994).
[Ware96] C. Ware and G. Franck.Evaluating stereo and motion cues for visualizing informa-
tion nets in three dimensions. ACM Transactions on Graphics (TOG), 15(2):121-140
(1996).
[Welman93] C. Welman.Inverse kinematics and geometric constraints for articulated figure
manipulation. Master’s thesis, School of Computing Science, Simon Fraser Univer-
sity (1993).

REFERENCES 80
[Whitney69] D. E. Whitney.Resolved motion rate control of manipulators and human pros-
theses. IEEE Trans. Man-Machine Systems 10, pages 47-63 (1969).
[Witkin97] A. Witkin and D. Baraff.Physically Based Modeling: Principles and Practice.
Siggraph ’97 course notes (1997).
[Wolovich84] W. Wolovich and H. Elliott.A computational technique for inverse kinematics.
In Proc. 23rd. Conf. on Decision and Control, Las Vegas, NV (1984).
[Zhao94] J. Zhao and N. I. Badler.Inverse kinematics positioning using nonlinear pro-
gramming for highly articulated figures. ACM Transactions of Graphics (TOG),
13(4):313-336 (1994).

APPENDIX A
System Screenshots
FIGURE A.1. Dragging nodes using our dynamics-based skeletal graph inter-
action system. By ensuring the constraints are satisfied, it quickly produces a
much better graph drawing and allows us to improve our understanding of the
graph structure.
81

A. SYSTEM SCREENSHOTS 82
FIGURE A.2. Top: A highly stretched graph using the technique without a
threshold. Bottom: A graph stretched as far as possible using the technique
with a threshold.

A. SYSTEM SCREENSHOTS 83
FIGURE A.3. The graph in part 2 of the study using the force-directed algorithm.

A. SYSTEM SCREENSHOTS 84
FIGURE A.4. The graph in part 2 of the study using the standard skeletal technique.

A. SYSTEM SCREENSHOTS 85
FIGURE A.5. The graph in part 2 of the study using the skeletal technique with
angular constraints.

A. SYSTEM SCREENSHOTS 86
FIGURE A.6. The web graph in part 3 of the study. Top: using the standard
skeletal technique results in bunching up of nodes. Bottom: using the skeletal
technique with angular constraints gives a much better angular resolution.

A. SYSTEM SCREENSHOTS 87
FIGURE A.7. The articulated figure from figure 3.1 represented by a graph in
our graph interaction environment.

APPENDIX B
User Survey Forms
The following seven pages contain the forms given to participants of the surveys detailed in
Section 4.1 on page 48 of this thesis.
Pages 89 - 91 comprise the first part of the survey. It compares the skeletal technique with a
threshold to the skeletal technique without a threshold in terms of their ability to simulate the
skeletal metaphor.
Pages 92 - 93 comprise part 2 of the survey. It compares the force-directed algorithm, stan-
dard skeletal method and the skeletal technique with angular constraints (labelled as "hybrid").
These are evaluated in terms of their ability to increase the user’s understanding of the graph.
Pages 94 - 95 comprise part 3 of the survey, which compares the different techniques of part 2
on the specific domain graphs, including a web graph and the hex game graph.
88

89
School of Information Technologies
Faculty of Science College of Sciences and Technology
Madsen Building, F09 Telephone +61 2 9351 3776
Graph Interaction User Study Questionnaire Note: By answering these survey questions you are agreeing to participate in this study. PART 1 – Comparison of Skeletal Techniques using General Graphs For this part of the survey, we ask that you use the Skeletal Graph software and provide some brief feedback on your thoughts on two of the implemented techniques. Please run each of these commands in turn from the command line and evaluate each technique. 1 Skeletal System without thresholding (NO THRESHOLD) java -Xmx512m SkeletonGraphApp part1.cgf –s 2 Skeletal System with thresholding (THRESHOLD) java -Xmx512m SkeletonGraphApp part1.cgf –s -th A series of questions are provided below. Please circle on the given scale of 1 (LOW) to 5 (HIGH) how you feel the two systems rated. A section for extra comments is included after each question, as well as a few sections for general comments at the end of this section. A) How well does the system preserve the structure of the skeleton? (Structure is preserved when the lengths of “bones” are at their original length) NO THRESHOLD 1 2 3 4 5 THRESHOLD 1 2 3 4 5
(not well preserved) (well preserved) Additional comments:

90
B) When dragging around a node, did the bones react in the way you expected (How intuitive is the system)? NO THRESHOLD 1 2 3 4 5 THRESHOLD 1 2 3 4 5
(least intuitive) (most intuitive) Additional comments: C) While moving a node was it easy to maintain your understanding of the structure of the graph? NO THRESHOLD 1 2 3 4 5 THRESHOLD 1 2 3 4 5
(easiest) (hardest) Additional comments: D) Was the system fun to use? NO THRESHOLD 1 2 3 4 5 THRESHOLD 1 2 3 4 5
(least fun) (most fun) Additional comments: E) Which aspect of each system did you like the most, Why? NO THRESHOLD THRESHOLD F) Which aspect of each system did you like the least, Why? NO THRESHOLD THRESHOLD

91
G) Based on your experience with the two systems what do you consider to be most important, maintaining the skeletal structure or allowing freedom of movement? Explain. H) Do you have any further comments to make on any aspect of these systems or this section?

92
PART 2 – Comparison of Skeletal and Non-Skeletal Techniques For this survey, we ask that you use the Skeletal Graph software and provide some brief feedback on your thoughts on three of the implemented techniques. Please run each of these commands in turn from the command line and evaluate each technique. 1 Force-Directed Approach (FORCE) java -Xmx512m SkeletonGraphApp part2.cgf –f 2 Skeletal Approach (SKELETAL) java -Xmx512m SkeletonGraphApp part2.cgf –s 3 A Combination of the two above approaches (HYBRID) java -Xmx512m SkeletonGraphApp part2.cgf –sf Four questions are provided below. Please circle on the given scale of 1 (LOW) to 5 (HIGH) how you feel each of the three systems rated. A section for extra comments is included after each question, as well as a larger section for general comments at the end of this section. A) How easy was it to obtain a picture in which you could easily understand the structure of the graph? FORCE 1 2 3 4 5 SKELETAL 1 2 3 4 5 HYBRID 1 2 3 4 5
(very hard) (very easy) Additional comments: B) While moving the structure around, did the graph react in the way you expected (How intuitive is the system)? FORCE 1 2 3 4 5 SKELETAL 1 2 3 4 5 HYBRID 1 2 3 4 5
(least intuitive) (most intuitive) Additional comments:

93
C) While moving a node was it easy to maintain your understanding of the structure of the graph? FORCE 1 2 3 4 5 SKELETAL 1 2 3 4 5 HYBRID 1 2 3 4 5 (very hard) (very easy) Additional comments: D) Was the system fun to use? FORCE 1 2 3 4 5 SKELETAL 1 2 3 4 5 HYBRID 1 2 3 4 5
(not at all) (definitely) Additional comments: E) Which aspect of each system did you like the most, Why? FORCE SKELETAL HYBRID F) Which aspect of each system did you like the least, Why? FORCE SKELETAL HYBRID G) Do you have any further comments to make on any aspect of these systems or this section?

94
PART 3 – Specific Domain Graphs For this survey, we ask that you use the Skeletal Graph software and provide some brief feedback on your thoughts on the three implemented techniques on specific domain graphs. Please run each of these commands in turn from the command line and evaluate each technique. 1 Web Graphs (WEB) java -Xmx512m SkeletonGraphApp web.cgf –f java -Xmx512m SkeletonGraphApp web.cgf –s java -Xmx512m SkeletonGraphApp web.cgf –sf 2 Hex Graph (HEX) java -Xmx512m SkeletonGraphApp hex.cgf –f java -Xmx512m SkeletonGraphApp hex.cgf –s java -Xmx512m SkeletonGraphApp hex.cgf –sf Four questions are provided below. Please circle on the given scale of 1 (LOW) to 5 (HIGH) how you feel each of the three systems rated. A section for extra comments is included after each question, as well as a larger section for general comments at the end of this section. A) How easy was it to obtain a picture in which you could easily understand the structure of the graph? WEB FORCE 1 2 3 4 5 SKELETAL 1 2 3 4 5 HYBRID 1 2 3 4 5 HEX FORCE 1 2 3 4 5 SKELETAL 1 2 3 4 5 HYBRID 1 2 3 4 5
(very hard) (very easy) Additional comments:

95
B) While moving the structure around, did the graph react in the way you expected (How intuitive is the system)? WEB FORCE 1 2 3 4 5 SKELETAL 1 2 3 4 5 HYBRID 1 2 3 4 5 HEX FORCE 1 2 3 4 5 SKELETAL 1 2 3 4 5 HYBRID 1 2 3 4 5
(least intuitive) (most intuitive) Additional comments: C) While moving a node was it easy to maintain your understanding of the structure of the graph? WEB FORCE 1 2 3 4 5 SKELETAL 1 2 3 4 5 HYBRID 1 2 3 4 5 HEX FORCE 1 2 3 4 5 SKELETAL 1 2 3 4 5 HYBRID 1 2 3 4 5 (very hard) (very easy) Additional comments: D) Do you have any further comments to make on any aspect of these systems or this section?