graph-based multi-attribute decision making: impact …
TRANSCRIPT

Copyright © 2015 Vilnius Gediminas Technical University (VGTU) Press Technika
http://www.bjrbe.vgtu.lt
THE BALTIC JOURNAL OF ROAD AND BRIDGE ENGINEERING
ISSN 1822-427X / eISSN 1822-4288 2015 Volume 10(2): 105–111
doi:10.3846/bjrbe.2015.13
1. Introduction
There is an increasing interest in considering landscape connectivity and fragmentation in landscape planning and habitat conservation. Landscape connectivity per se is important for various species in order to sustain viable populations (Pascual-Hortal, Saura 2006; Verboom et al. 2001). Since the landscape connectivity is species-specific, different organisms interact with landscape structure at different scales and in a variety of ways. Landscape con-nectivity may positively influence population persistence for some organisms in some situations, and negatively in-fluence them in others (Grashof-Bokdam 1997; Johnson et al. 1992). Smaller habitat patches, longer and sparser corridors, increasingly isolated species are main indica-tors of increasing landscape fragmentation and decreasing landscape connectivity. Landscape fragmentation mainly results from the conversion of the natural area into urban areas and from the linkage of these urban areas via trans-port infrastructure. Meanwhile, Moser et al. (2007) found that landscape fragmentation can reduce landscape con-nectivity. Reduced landscape connectivity obstructs the
movement of organisms across the landscape, potentially affecting metapopulation dynamics and gene flow (Keyg-hobadi et al. 2005). According to Brooks (2003), landscape connectivity has two components: structural (the spatial structure of a landscape and this can be described using map elements) and functional (biological component; the response of individuals to landscape features). Thus, there are many graph and non-graph based landscape connectivi-ty indices which may be used for the prioritization of habitat patches and corridors for conservation purposes (Baranyi et al. 2011; Pascual-Hortal, Saura 2006; Tischendorf, Fahring 2000, 2003). Meanwhile, landscape connectivity indices alone do not clearly define conservation priorities for habi-tat patches. Pascual-Hortal and Saura (2006) found that many different connectivity indices have been proposed and used in this context but there is a lack of comprehensive un-derstanding of their sensitivity to pattern structure and their behaviour to different spatial changes, which seriously lim-its their proper interpretation and usefulness. Meanwhile, the relative ranking of habitat patches within a landscape by their contribution to overall landscape connectivity is most
GRAPH-BASED MULTI-ATTRIBUTE DECISION MAKING: IMPACT OF ROAD FENCING ON ECOLOGICAL NETWORK
Andrius KučasNature Research Centre, Akademijos g. 2, 08412 Vilnius, Lithuania
E-mail: [email protected]
Abstract. Conservation and transport decision makers must deal with many competing criteria in order to find the op-timal connectivity of habitat patches in order to maximize organisms’ ability to traverse the landscape successfully. Thus, there is an increasing interest in prioritization of habitat patches by their contribution to overall landscape connectivity. Many different indices can be used to quantify structural and functional landscape connectivity. However, landscape connectivity indices alone do not clearly define conservation priorities for habitat patches. In this study priority values for each available habitat patch were calculated using multiple criteria spatial decision support techniques. As criteria for prioritization, spatial graph-based element properties (habitat patch size, number of corridors connected to a habitat patch, etc.) were characterized for each habitat patch. Graph-based connectivity rules for each habitat patch within a landscape (in conjunction with largest patch size, maximum number of corridors with a minimum length connected to a habitat patch, etc.) were defined and applied. Each criterion’s importance was assessed. Criteria-based ranking of habi-tat patches within a graph better indicated exact critical habitat patches than connectivity index alone, especially when changes in network occur. Simulations in the case study of Lithuania showed that barriers (road fences to keep animals off the road) without prompt establishment of animal crossings may realign complexes of an ecological networks by reducing the importance of adjacent and increasing the importance of more distant patches. Such distant patches may become essential, and can sometimes be the only elements preserving the realigned ecological network.
Keywords: landscape connectivity, habitat patches, graph elements, multiple-criteria decision-making, ecological network.

106 A. Kučas. Graph-Based Multi-Attribute Decision Making: Impact or Road...
useful in the decision process. Thus, there is an increasing interest in prioritization of habitat patches by their con-tribution to overall landscape connectivity (Baranyi et al. 2011; Pascual-Hortal, Saura 2006).
Therefore the objectives of this study were: (1) to de-fine a new spatial graph element properties based calcu-lation procedure in order to perform the relative ranking of habitat patches within a landscape by their contribution to overall structural landscape connectivity; (2) to com-pare the TOPSIS (technique for order preference by simi-larity to ideal solution) rank value reaction to a common connectivity index especially when changes in landscape occur; and (3) to validate the new calculation procedure by intersecting Lithuanian ecological networks with road fences (to keep animals off the road) in order to show how realignments of connectivity affect adjacent and distant habitat patches.
2. Functional-spatial structure of ecological network
2.1. Ecologically compensating infrastructure Implementation of sustainable development policy is one of the most complicated tasks and challenges faced by the global community (Burinskienė, Rudzkienė 2009; Ka-valiauskas 2008). Although system of ecologically com-pensating areas is defined as parts of the ecological in-frastructure that balance disparities between the natural and anthropogenic systems (Sepp, Kaasik 2002), many different explanations have been proposed in this con-text and can be used as synonyms of different ecological networks worldwide. Whatever its scale (continental, re-gional, local), an ecological network consists of the fol-lowing elements: core areas (or biocentre), ecological (or biological) corridors, buffer (protective) zones and step-ping stones within the re-naturalisation area. Each struc-tural element has its functions, and the whole complex makes the ecological network as a functioning system (Sepp, Kaasik 2002). Theoretical structural elements of ecologically compensating infrastructure reported by (Sepp, Kaasik 2002) can be described using graph-based elements within the main system (thereafter ecological network) (Fig. 1).
In this study, nodes represent habitat patches or core areas/center of core areas of suitable habitat surrounded by inhospitable habitat – neutral area. The existence of a link between each pair of habitat patches implies the potential ability of an organism to traverse between these two habitat patches, which are considered to be con-nected. Links may have a physical correspondence on the landscape in the form of a corridor. According to Pascu-al-Hortal and Saura (2006), links between habitat patches can be defined as minimum or Euclidean distances. In this study, a component is a region of nodes connected via links representing the structural landscape of the eco-logical network. An isolated node or stepping stone makes up a component itself. A component disconnects when a part of it, after a change in the landscape, becomes un-reachable from some other part, causing an increase in the number of components in the ecological network. If disconnection creates a new component, then this link is called – cultink (Pascual-Hortal, Saura 2006). If it is a link removal that causes the disconnection within a compo-nent, then this link is called non-cutlink. In order to pri-oritize habitat patches by their contribution to the over-all landscape connectivity, the TOPSIS based rank values for each habitat patch in an ecological network must be delineated by assessing the following graph-based con-nectivity rules: the largest habitat patch area size, largest amount of directly connected corridors, the minimum total length of the directly connected corridors and the largest total area size of directly connected habitat patch-es. In this study, rank values for each available habitat patch (core areas within the ecological network) were calculated using MC-SDSS (Multiple Criteria Spatial De-cision Support System) where TOPSIS method is tightly integrated within ESRI ArcGIS® mapping environment (Kučas 2010). The higher the TOPSIS based rank val-ue (ranging from 0 to 1) for a particular habitat patch within the component, the better the overall connectivity within the component. Any barriers which appear due to increasing linkage of urban areas via transport infra-structure breaks apart the component, by increasing or decreasing TOPSIS based rank value for a particular hab-itat patch. This approach allows figuring out which rule under what conditions are affected.
2.2. Criteria and their importanceAs a criterion for habitat patch prioritization, the aggre-gated spatial graph element based properties were char-acterized for each habitat patch and each corridor within hypothetical components (Fig. 2, Table 1) in order to illus-trate various real world situations.
Connections (Fig. 2) between the patches (links, rep-resented as lines) represents length of a link (L). Nodes represented as circles of different habitat patch and rep-resents area size (N). Noncut-link that is lost is indicated by dashed lines case (4a). It is assumed that when a patch is lost, the links (functional connections) coming from it are not lost. The represented component connectivities (Fig. 2) are the same because in all cases the amount of
Fig. 1. Spatial graph-based structural elements of ecologically compensating infrastructure used for construction of ecological network for barrier (fence to keep animals of the road) impact analysis (E – European, N – National)

The Baltic Journal of Road and Bridge Engineering, 2015, 10(2): 105–111 107
habitat patches and amount of connections are the same (N = 3, L = 3), except the case (4a), (N = 3, L = 2). The represented habitat patch properties within a component: area of particular habitat patch (NS) and the length of par-ticular link (LL) which connects two habitat patches are not the same in all cases: (1) NS = NS and LL = LL, (2) NS = NS and LL ≠ LL, (3) NS ≠ NS and LL ≠ LL, (4 and 4a) NS ≠ NS and LL = LL. Case (4a) illustrates the different reaction of a component depending on how non-cutlink change occurs. In order to demonstrate criteria impor-tance delineation the area (e.g. ha) of a particular habitat patch (N) and the length (e.g. km) of a particular link (L) were assigned to each link and node for a particular com-ponent. Numerical values (for N and L) representing all cases (Fig. 2) are given in Table 1. In real applications such data can be easily extracted using standard GIS tools.
In order to perform ranking of habitat patches ac-cording to connectivity rules, the importance of spatial graph element based properties as a criteria and function has been defined for all components (Table 2) and further used for identification of which criteria and under what condition is more important than the other.
The importance of spatial graph element based pro-perties was estimated by using largest NS, TN, TA and smallest TL for each habitat patch and assumed as expert questioning (Pascual-Hortal, Saura 2006; Sepp, Kaasik 2002) The ideal habitat patch within a component would be the one which best meets graph-based connectivity ru-les. This approach also allows adding more sophisticated ecological or species specific data (e.g. amount of nests, or amount of specific land cover data etc.) as additional crite-ria representing structural and functional connectivity by delineating its criterion importance and defining required function according to optimization task needs. The criteria importance calculations for all five cases were performed using the criteria importance delineation procedure as re-ported by (Jakimavičius, Burinskienė 2007; Kučas 2010).
After criterion importance is defined, further analysis on ranking of habitat patches within a component can be performed.
3. Multiple criteria spatial decision making methods
3.1. Prioritization of habitat patches within a component using TOPSISThe TOPSIS method allows using importance of criteria which are delineated or in case of available importance of criterion, user-defined. For further analysis the case 3 (Fig. 2) is selected since it best describes the real world ir-regularity phenomena. In order to demonstrate the rank-ing procedure and calculation sensitivity the criterion importance (q) from case 3 (Table 3) will be used in as-sessment of all cases. The input data used for KBIT cal-culations are: habitat patches (Ni) as alternatives, criteria (Ri) and their importance (q). The best alternative is with the highest KBIT value. The highest TOPSIS based rank value (range from 0 to 1) means the best option and the
Fig. 2. Different cases illustrating four types of habitat patch connectivity and one case illustrating change corresponding to the loss of non-cutlink or corridor
Table 1. Input data. Area of particular habitat patch (N) and the length of particular link (L) for all cases
Node/LinkCase No.
1 2 3 4 4a
N1 1 1 1 1 1
N2 1 1 2 2 2
N3 1 1 3 3 3
L1 1 1 1 1 1
L2 1 2 2 1 1
L3 1 3 3 1 1
Table 2. Importance of criteria
No. Criteria description FunctionR1 Area size (NS) of particular habitat patch
(hereafter N). Hereafter NSMaximize
R2 Total amount (TN) of links (hereafter L) connected to a particular habitat patch (N). Hereafter TN
Maximize
R3 Total length (TL) of links (L) connected to particular habitat patch (N). Hereafter TL*
Minimize
R4 Total area (TA) of habitat patches which are connected (adjacent) to particular habitat patch (N) via links (L). Hereafter TA
Maximize
Note: * – the length of particular link (L) which connects two habitat pa-tches (N) – hereafter LL used only for TL calculation.
Table 3. The criteria importance calculation results for all cases (rank within a particular case)
CaseCriteria
R1 R2 R3 R41 0.250 (1) 0.250 (1) 0.250 (1) 0.250 (1)2 0.245 (2) 0.245 (2) 0.264 (1) 0.245 (2)3 0.265 (1) 0.231 (4) 0.253 (2) 0.251 (3)4 0.269 (1) 0.237 (3) 0.237 (3) 0.256 (2)4a 0.249 (2) 0.249 (2) 0.228 (3) 0.274 (1)

108 A. Kučas. Graph-Based Multi-Attribute Decision Making: Impact or Road...
“strongest” habitat patch in the component. The alterna-tives can then be prioritized according to their rank value in descending order.
Habitat patches which have the highest ranks with-in priority row (1) make components more compact. The habitat patches with the lowest rank (priority row ‒ 3) as-signed – rarefies the component. The ranking of habitat patches within particular components for all cases are pre-sented in Table 4 and Fig. 3.
Habitat patches that have highest rank within priority row (1) within a component are indicated in white color, medium (2) – in gray and lowest (3) – in black (Table 4, Fig. 3). Habitat patches with a higher rank can be consi-dered more important: its loss affects more seriously the connectivity of the whole component. The habitat patch (N1) case 4a shows that it may be important for connecti-vity of the whole component, but it does not mean that it is so. From an ecological point of view there are many findings in different studies concluding that small and dis-tant habitat patches are usually not occupied and appear less important (Baranyi et al. 2011). Meanwhile, if the size of a habitat patch (case 4a, N1) is big enough in order to maintain the population of a certain species, as well as ena-bling movement to assure gene flow, then such a habitat patch may preserve whole component connectivity in case of loss of non-cutlink (L2), case 4a.
3.2. Connectivity of componentsIf habitat patches are discrete, then Lindenmayer and Fischer (2006) considered that connectivity within a
component could be quantified as a function of a number of connections between those habitat patches, relative to the maximum number of potential connections. Thus, if there are direct links between all habitat patches (N) with-in a component, there will be N(N–1)/2 such links (Lin-denmayer, Fischer 2006). Then, connectivity index (C) of patches and links within a component can be calculated as follows:
, (1)
where L – the number of links; N – the number of patch-es. A fully connected component with complete levels of landscape connectivity would have a value of 1, and a com-ponent that has no connectivity would have a value of 0. In cases (Fig. 3, cases 1, 2, 3, 4) the landscape connectivity index C = 1. This means that these components are homo-geneous. In case 4a, the connectivity index C = 0.67. Case 4a illustrates the habitat patch (N1) rank change from low-est (case 4) to highest (case 4a) corresponding to the loss of non-cutlink. Using only the connectivity index, it is im-possible to delineate such particular change. Components with more dispersed and less linked habitat patches have lower connectivity.
4. Simulation of criteria based ranking of habitat patches
4.1. Study site and calculationsThis study considers how TOPSIS rank value reacts to the different types of change that can occur in the landscape and how ranks differ in predicting which habitat patch-es (based on criterion importance delineation) are more important for the maintenance of overall component con-dition. To compare and evaluate the performance of con-nectivity rules under real graph-based conditions, the Lithuanian structural ecological network (further – eco-logical network) was prepared using the ecologically com-pensating infrastructure concept (Fig. 1) and presented in Fig. 4. The Ecological networks in the Baltic countries are a constituent part of the Pan-European ecological network. Therefore its main structural elements and their func-tions are the same as those in the Pan-European network. In this study, the ecological network (Fig. 4) is limited to graph-based network analysis only. It is presumed that all habitat patches are similar, since no particular ecological or species specific data are added during the preparation of the network. This means that habitat patch sizes and amount of links may differ for particular species and do not represent the real condition of the Lithuanian ecologi-cal network. In this context, the validity of the full-fledged Lithuanian ecological network is not questioned. Never-theless, since the ecological network is a coherent system of natural or semi-natural landscape elements configured and managed with the objective of maintaining or restor-ing ecological functions as a means of conserving biodi-versity, the methods and workflows proposed in this study allow the use of more sophisticated ecological or species oriented data as criteria.
Table 4. Results of habitat patch ranking. TOPSIS (priority row within particular case)
Case Habitat patches
N1 N2 N3
1 n/a (1) n/a (1) n/a (1)2 0.500 (2) 0.000 (3) 1.000 (1)3 0.353 (3) 0.426 (2) 0.691 (1)4 0.334 (3) 0.500 (2) 0.666 (1)4a 0.551 (1) 0.356 (3) 0.449 (2)
Fig. 3. Different cases illustrating three types of habitat patch ranking according TOPSIS

The Baltic Journal of Road and Bridge Engineering, 2015, 10(2): 105–111 109
European level core areas (represented as nodes) in a component are indicated in black colour, national level core areas – in grey, stepping stones – in white. European and national level corridors represented in grey lines, exist-ing road fences in black lines. Finally, the patch area illus-trates real boundaries of core areas represented in polygons (Fig. 4). The base data are defined based on data from the Nature Research Centre, State Science Research Institute. The road barriers – fencing data are defined based on data of Lithuanian Road Administration under the Ministry of Transport and Communications. The ecological network consists of one main component, 82 core areas contain-ing all core areas except 9 components as standalone step-ping stones and 176 corridors. Connectivity index C = 0.05. Connections between the core areas – corridors indicated as lines. These lines represent corridors of national and Eu-ropean importance. Nodes represented as circles indicate core areas and represent area size. All areas are coded with unique letters and numbers (Note: E – European level, N – national level and J – stepping stone) as recognized by na-tional and European institutions (Sepp, Kaasik 2002). After data were prepared, the first assessment of core area ranking was performed in order to define the condition of the pres-ent ecological network. The TOPSIS method was used for calculations. The results are presented in a map showing ranking values for each core area and illustrates the over-all component condition. The higher the TOPSIS (range from 0.119 to 0.737) values the larger the circle on the map (Fig. 5). The criterion importance (q) calculation results for the ecological network: NS = 0.301, TN = 0.145, TA = 0.264, TL = 0.290 (W = 0.016). So, the most important criteria for assessment were length of connected corridors TL and size of core area NS. This means that change in NS and TL may affect all components more than change of TN and TA.
The highest values were assigned to larger core are-as E2, E1, N16, E28 and E4. The lowest values were assi-gned to core areas N14, N25, E16 which are smallest and less connected. In this study E16 is of a European impor-tance which received overall lowest rank. Highest ran-ked are N16, E28 and E4. However, different standardi-zation/ weighting techniques may lead to different results (Coutinho-Rodrigues et al. 2011). TOPSIS based ranking shows stepping stones as important, because it represents the full component. Since the TOPSIS method is more accurate on parameter sensitivity, the results show larger distance between low and high rank values assigned to core areas. In general the central and northern parts of the ecological network (within a main component of the eco-logical network) have core areas with lower ranks (“we-aker” movement opportunities) assigned and eastern, southern, western parts with higher (“stronger” move-ment opportunities) ranks. The central and northern parts of the ecological network show that core areas are smallest in size and connected with other adjacent small core areas via the longest corridors. Meanwhile, these parts of Lithu-ania are more fragmented (regarding forests), and mainly used for agricultural purposes (Kučas 2010).
4.2. Impact of road fences as barriers on realignment of core areasRoad barriers without prompt establishment of ani-mal crossings or conduction of chemical repellents (Balčiauskas, Jasulionis 2012) may prevent animals’ move-ment across the structural landscape. For further analysis and method validation the graphical data of road fences were added to the present ecological network and 36 cor-ridors which were intersected were removed. Removal of a corridor is not the only option, and in other cases cor-ridor weights may be assigned and assessed via particu-lar core areas. In the real world such situations may occur when the proper animal crossings are not available or es-tablished in inexact places. Reassessment using the same input data (Fig. 5) with road fencing affected corridors was performed. The criterion importance calculation re-sults for an ecological network affected by road fencing: NS = 0.305 (increased), TN = 0.164 (increased), TA = 0.240 (decreased), TL = 0.291(increased) (W = 0.016). Loss of non-cutlink affected the total area (TA) of habitat patch-es which are connected (adjacent) to a particular habi-tat patch (N) via links (L). TOPSIS (range from 0.175 to 0.826) rank values for particular habitat patches increased, but the network was rarefied because the connectivity index decreased C = 0.04 (before C = 0.05). This meant
Fig. 5. TOPSIS based ranking of core areas within ecological network
Fig. 4. Input data prepared based on ecologically compensating infrastructure concept
110 A. Kučas. Graph-Based Multi-Attribute Decision Making: Impact or Road...
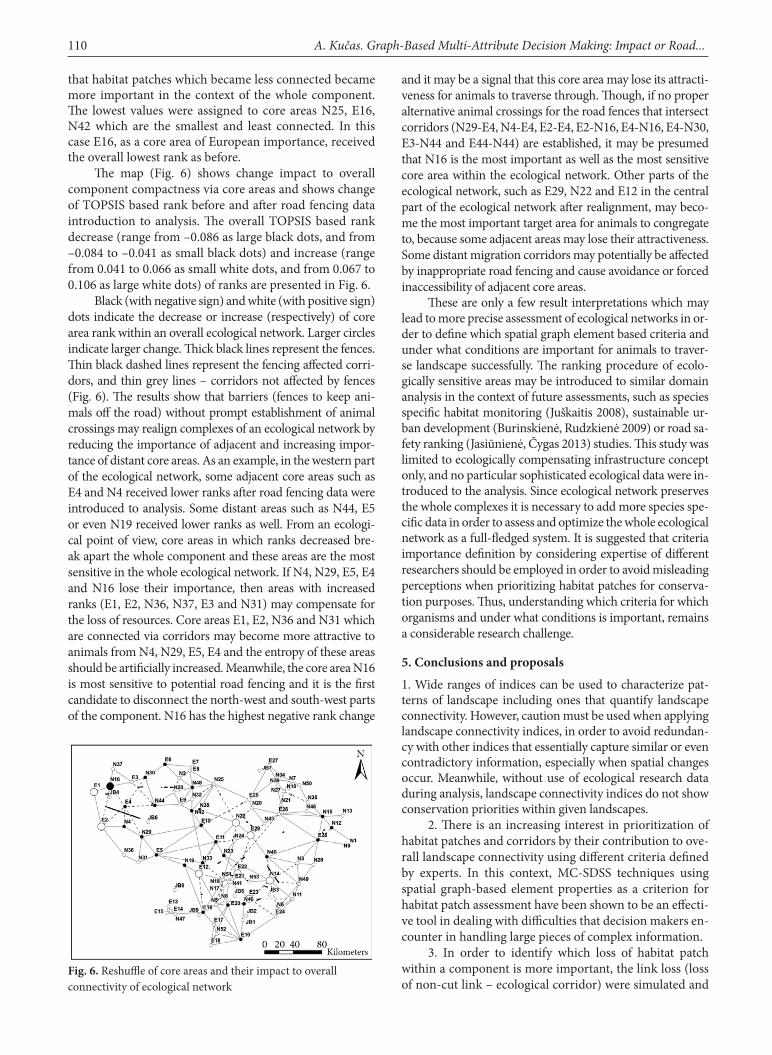
that habitat patches which became less connected became more important in the context of the whole component. The lowest values were assigned to core areas N25, E16, N42 which are the smallest and least connected. In this case E16, as a core area of European importance, received the overall lowest rank as before.
The map (Fig. 6) shows change impact to overall component compactness via core areas and shows change of TOPSIS based rank before and after road fencing data introduction to analysis. The overall TOPSIS based rank decrease (range from –0.086 as large black dots, and from –0.084 to –0.041 as small black dots) and increase (range from 0.041 to 0.066 as small white dots, and from 0.067 to 0.106 as large white dots) of ranks are presented in Fig. 6.
Black (with negative sign) and white (with positive sign) dots indicate the decrease or increase (respectively) of core area rank within an overall ecological network. Larger circles indicate larger change. Thick black lines represent the fences. Thin black dashed lines represent the fencing affected corri-dors, and thin grey lines – corridors not affected by fences (Fig. 6). The results show that barriers (fences to keep ani-mals off the road) without prompt establishment of animal crossings may realign complexes of an ecological network by reducing the importance of adjacent and increasing impor-tance of distant core areas. As an example, in the western part of the ecological network, some adjacent core areas such as E4 and N4 received lower ranks after road fencing data were introduced to analysis. Some distant areas such as N44, E5 or even N19 received lower ranks as well. From an ecologi-cal point of view, core areas in which ranks decreased bre-ak apart the whole component and these areas are the most sensitive in the whole ecological network. If N4, N29, E5, E4 and N16 lose their importance, then areas with increased ranks (E1, E2, N36, N37, E3 and N31) may compensate for the loss of resources. Core areas E1, E2, N36 and N31 which are connected via corridors may become more attractive to animals from N4, N29, E5, E4 and the entropy of these areas should be artificially increased. Meanwhile, the core area N16 is most sensitive to potential road fencing and it is the first candidate to disconnect the north-west and south-west parts of the component. N16 has the highest negative rank change
and it may be a signal that this core area may lose its attracti-veness for animals to traverse through. Though, if no proper alternative animal crossings for the road fences that intersect corridors (N29-E4, N4-E4, E2-E4, E2-N16, E4-N16, E4-N30, E3-N44 and E44-N44) are established, it may be presumed that N16 is the most important as well as the most sensitive core area within the ecological network. Other parts of the ecological network, such as E29, N22 and E12 in the central part of the ecological network after realignment, may beco-me the most important target area for animals to congregate to, because some adjacent areas may lose their attractiveness. Some distant migration corridors may potentially be affected by inappropriate road fencing and cause avoidance or forced inaccessibility of adjacent core areas.
These are only a few result interpretations which may lead to more precise assessment of ecological networks in or-der to define which spatial graph element based criteria and under what conditions are important for animals to traver-se landscape successfully. The ranking procedure of ecolo-gically sensitive areas may be introduced to similar domain analysis in the context of future assessments, such as species specific habitat monitoring (Juškaitis 2008), sustainable ur-ban development (Burinskienė, Rudzkienė 2009) or road sa-fety ranking (Jasiūnienė, Čygas 2013) studies. This study was limited to ecologically compensating infrastructure concept only, and no particular sophisticated ecological data were in-troduced to the analysis. Since ecological network preserves the whole complexes it is necessary to add more species spe-cific data in order to assess and optimize the whole ecological network as a full-fledged system. It is suggested that criteria importance definition by considering expertise of different researchers should be employed in order to avoid misleading perceptions when prioritizing habitat patches for conserva-tion purposes. Thus, understanding which criteria for which organisms and under what conditions is important, remains a considerable research challenge.
5. Conclusions and proposals
1. Wide ranges of indices can be used to characterize pat-terns of landscape including ones that quantify landscape connectivity. However, caution must be used when applying landscape connectivity indices, in order to avoid redundan-cy with other indices that essentially capture similar or even contradictory information, especially when spatial changes occur. Meanwhile, without use of ecological research data during analysis, landscape connectivity indices do not show conservation priorities within given landscapes.
2. There is an increasing interest in prioritization of habitat patches and corridors by their contribution to ove-rall landscape connectivity using different criteria defined by experts. In this context, MC-SDSS techniques using spatial graph-based element properties as a criterion for habitat patch assessment have been shown to be an effecti-ve tool in dealing with difficulties that decision makers en-counter in handling large pieces of complex information.
3. In order to identify which loss of habitat patch within a component is more important, the link loss (loss of non-cut link – ecological corridor) were simulated and
Fig. 6. Reshuffle of core areas and their impact to overall connectivity of ecological network

The Baltic Journal of Road and Bridge Engineering, 2015, 10(2): 105–111 111
habitat patch ranks were recalculated. Calculations showed that loss of non-cutlink affected not only adjacent but also distant habitat patches. The distant habitat patches may become essential, and sometimes the only elements pre-serving realigned components of an ecological network.
4. Results showed that spatial graph element proper-ties based ranking of habitat patches for conservation pur-poses show more direct and critical information regarding single habitat patch than connectivity indices alone, espe-cially when changes in a landscape occur. Ranking of all given habitat patches which are evaluated using experts’ suggestions allow the employment of more sophisticated ecological data to landscape connectivity analysis in order to manage habitats and to set priorities for all habitat pat-ches within an ecological network.
5. It is suggested that when defining criteria impor-tance by considering the expertise of different researchers, conservation and transport decision makers should be employed in order to avoid misleading perceptions when prioritizing habitat patches for conservation purposes.
Acknowledgements
The development of MC-SDSS for ESRI ArcGIS® 10.0 software extension was funded by the European Social Fund under the Global Grant measure (grant No. VP1-3.1-ŠMM-07-K-01-026). I thank L. Balčiauskas, G. Traki-mas and J. D. Hooker for their helpful comments on earlier versions of this manuscript.
References
Balčiauskas, L.; Jasiulionis, M. 2012. Reducing the Incidence of Mammals on Public Highways Using Chemical Repellent, The Baltic Journal of Road and Bridge Engineering 7(2): 92–97.
http://dx.doi.org/10.3846/bjrbe.2012.13Baranyi, G.; Saura, S.; Podanic, J.; Jordán, F. 2011. Contribution of
Habitat Patches to Network Connectivity: Redundancy and Uniqueness of Topological Indices, Ecological Indicators 11(5): 1301–1310. http://dx.doi.org/10.1016/j.ecolind.2011.02.003
Brooks, C. P. 2003. A Scalar Analysis of Landscape Connectivity, Oikos 102(2): 433–439.
http://dx.doi.org/10.1034/j.1600-0579.2003.11511.xBurinskienė, M.; Rudzkienė, V. 2009. Future Insights, Scenarios
and Expert Method Application in Sustainable Territorial Planning, Technological and Economic Development of Econ-omy 15(1): 10–25.
http://dx.doi.org/10.3846/1392-8619.2009.15.10-25Coutinho-Rodrigues, J.; Simão, A.; Antunes, A. C. 2011. A GIS-
Based Multicriteria Spatial Decision Support System for Planning Urban Infrastructures, Decision Support Systems 51(3): 720–726. http://dx.doi.org/10.1016/j.dss.2011.02.010
Grashof-Bokdam, C. 1997. Forest Species in an Agricultural Landscape in the Netherlands: Effects of Habitat Fragmenta-tion, Journal of Vegetation Science 8(1): 21–28.
http://dx.doi.org/10.2307/3237238Jakimavičius, M.; Burinskienė, M. 2007. Automobile Transport
System Analysis and Ranking in Lithuanian Administrative Regions, Transport 22(3): 214–220.
http://dx.doi.org/10.1080/16484142.2007.9638127
Jasiūnienė, V.; Čygas, D. 2013. Road Accident Prediction Model for the Roads of National Significance of Lithuania, The Baltic Journal of Road and Bridge Engineering 8(1): 66–73.
http://dx.doi.org/10.3846/bjrbe.2013.09Johnson, A. R.; Wiens, J. A.; Milne, B. T.; Crist, T. O. 1992. Ani-
mal Movements and Population-Dynamics in Heterogeneous Landscapes, Landscape Ecology 7(1): 63–75.
http://dx.doi.org/10.1007/BF02573958Juškaitis, R. 2008. Long-Term Common Dormouse Monitoring:
Effects of Forest Management on Abundance, Biodiversity and Conservation 17(14): 3559–3565.
http://dx.doi.org/10.1007/s10531-008-9470-9Kavaliauskas, P. 2008. A Concept of Sustainable Development for
Regional Land Use Planning: Lithuania Experience, Techno-logical and Economic Development of Economy 14(1): 51–63. http://dx.doi.org/10.3846/2029-0187.2008.14.51-63
Keyghobadi, N.; Roland, J.; Strobeck, C. 2005. Genetic Differen-tiation and Gene Flow among Populations of the Alpine But-terfly, Parnassius Smintheus, Vary with Landscape Connec-tivity, Molecular Ecology 14(7): 1897–1909.
http://dx.doi.org/10.1111/j.1365-294X.2005.02563.xKučas, A. 2010. Location Prioritization by Means of Multicrite-
ria Spatial Decision-Support Systems: a Case Study of Forest Fragmentation-Based Ranking of Forest Administrative Areas, Journal of Environmental Engineering and Landscape Manage-ment 18(4): 312–320. http://dx.doi.org/10.3846/jeelm.2010.36
Lindenmayer, D. B.; Fischer, J. 2006. Habitat Fragmentation and Landscape Change: an Ecological and Conservation Synthesis. Washington: Island Press. 329 p.
Moser, B.; Jaeger, J. A. G; Tappeiner, U.; Tasser, E.; Eiselt, B. 2007. Modification of the Effective Mesh Size for Measuring Land-scape Fragmentation to Solve the Boundary Problem, Land-scape Ecology 22(3): 447–459.
http://dx.doi.org/10.1007/s10980-006-9023-0Pascual-Hortal, L.; Saura, S. 2006. Comparison and Develop-
ment of New Graph-Based Landscape Connectivity Indices: Towards the Priorization of Habitat Patches and Corridors for Conservation, Landscape Ecology 21(7): 959–967.
http://dx.doi.org/10.1007/s10980-006-0013-zSepp, K.; Kaasik, A. 2002. Development of National Ecological
Networks in the Baltic Countries in the Framework of the Pan-European Ecological Network. IUCN Central Europe. War-shaw: Pracownia Poligraficzna ARWIL s.c. 183 p.
Tischendorf, L.; Fahrig, L. 2003. On the Usage and Measurement of Landscape Connectivity, Oikos 90(1): 7–19.
http://dx.doi.org/10.1034/j.1600-0706.2000.900102.xTischendorf, L.; Fahrig, L. 2000. How Should We Measure Land-
scape Connectivity?, Landscape Ecology 15(7): 633–641. http://dx.doi.org/10.1023/A:1008177324187
Verboom, J.; Foppen, R.; Chardon, P.; Opdam, P.; Luttikhuizen, P. 2001. Introducing the Key Patch Approach for Habitat Net-works with Persistent Populations: An Example for Marsh-land Birds, Biological Conservation 100(1): 89–101.
http://dx.doi.org/10.1016/S0006-3207(00)00210-X
Received 23 November 2012; accepted 7 March 2013