graph-based consensus clustering for class discovery from gene expression data
DESCRIPTION
Graph-based consensus clustering for class discovery from gene expression data. Zhiwen Yum, Hau-San Wong and Hongqiang Wang Bioinformatics, 2007. Outline. Introduction Methods Experiment Conclusion. Introduction. Class discovery consists of two steps: - PowerPoint PPT PresentationTRANSCRIPT

Graph-based consensus clustering for class discovery from gene
expression dataZhiwen Yum, Hau-San Wong and Hongqiang
Wang
Bioinformatics, 2007

Outline
• Introduction• Methods• Experiment• Conclusion
2

Introduction
• Class discovery consists of two steps:– A clustering algorithm is adopted to partition the
sample into K parts.– A cluster validity index is applied to determine the
optimal K value.
• For the class discovery problem, we focus on discovering the underlying classes from the samples.
3

Introduction
• Recently, researchers are paying more attention to class discovery based on the consensus clustering approaches.
• They consist of two major steps:– Generating a cluster ensemble based on a
clustering algorithm.– Finding a consensus partition based on this
ensemble.
4

Introduction
• Consensus clustering have five types:1) Using different clustering algorithms as the basic
clustering algorithms to obtain different solutions.2) Using random initializations of a single clustering
algorithm.3) Sub-sampling, re-sampling or adding noise to the original
data.4) Using selected subsets of features.5) Using different K values to generate different clustering
solutions
5

Methods
• In this paper, the approach belongs to type 4, in which the cluster ensemble is generated using different gene subsets.
• Graph-based consensus clustering (GCC).
6

Methods
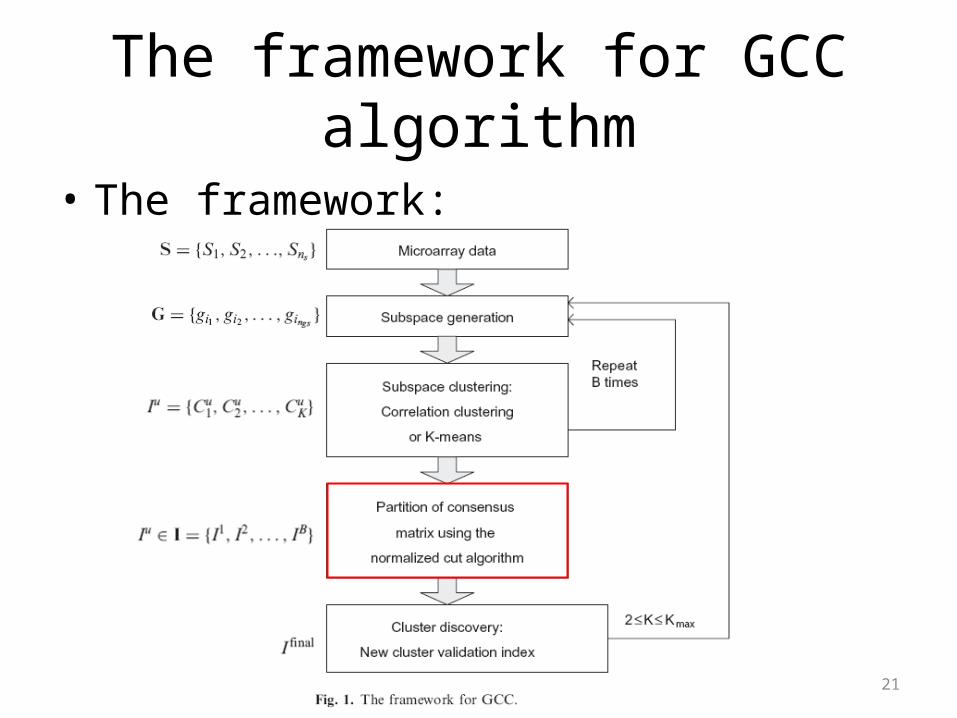
• Overview of the framework for GCC algorithm• Subspace generation• Subspace clustering• Cluster ensemble• Cluster discovery
7

The framework for GCC algorithm
• The framework:
8

The framework for GCC algorithm
• The framework:
9

Subspace generation
• A constant , which presents the number of genes in the subspace is generated by:
where is a uniform random variable, and , for is the total number of genes.
10

Subspace generation
• Then, it selects the gene one by one until genes are obtained.
• The index of each randomly selected gene is determined as:
where denotes the hth gene, and is a uniform random variable.
11

Subspace generation
• Finally, the randomly selected genes are used to construct a subspace.
12
one sample
genesRandomly selection
genes

The framework for GCC algorithm
• The framework:
13

Subspace clustering
• In the selected subspace, GCC performs two clustering approaches:– Correlation clustering• Correlation analysis• Graph partition
– K-means
14

Correlation clustering
• Correlation analysis: calculate the correlation matrix (CM) whose entries , is the number of samples.
where and denotes the ith and jth samples.
15

Correlation clustering
• Graph partition: use the normalized cut algorithm to partition the samples to K classes based on the CM.
• A graph can be constructed, whose vertices correspond to samples , and edges are the correlation between the samples (i.e. CM).
16

Correlation clustering
• “Normalized cuts” is proposed by Shi and Malik in 1997, CVPR.
• It’s an image segmentation method.– Pixels as vertices.– Similarity between pixels as weight edge.
17

Correlation clustering
• Like the normalized cuts method, we could find the label vector by solve the generalized eigenvalue problem:
where is an diagonal matrix with as diagonal, is the correlation matrix.
• The label vector is composed from the second smaller eigenvector .
18

K-means
• To minimize total intra-cluster variance, or the squared error function:
where is the center of cluster .
19
K
i Csij
ij
sV1
iiC

Subspace clustering
• After obtaining the predicted labels, the adjacency matrix is constructed by the labels, whose elements are defined as:
where and denote the predicted labels of the samples and .
20
The framework for GCC algorithm
• The framework:
21

Cluster ensemble
• For each , GCC repeats the above two steps B times, and obtains– B clustering solutions – B adjacency matrices
• GCC constructs a consensus matrix by merging the adjacency matrix as:
22
where represents the probability that two samples in the same class.

Cluster ensemble
• Then, GCC constructs a graph and applies the normalized cuts method.
• It means the clustering result when the number of clusters is K.
23

The framework for GCC algorithm
• The framework:
24

Cluster discovery
• Define an aggregated consensus matrix :
• Then, GCC converts it to a binary matrix :
• By the same way, GCC converts to .
25

Cluster discovery
• We should compare clustering results with the aggregated matrix to decide the proper value of K.
• Modified Rand Index:
26
The degree of agreement between and
Penalty term for a large set of clusters.

Cluster discovery
• The optimal number of classes is selected as
• It considers the relationship between each clustering solution and the average clustering solution.
27

Experiment
• Experiment setting• Relationship between ARI and • Experiment results
28

Experiment setting
• Four combination algorithms comparison:– GCCcorr(GCC with correlation clustering)– GCCK-means(GCC with K-means)– CCHC(CC with hierarchical clustering with average
linkage)– CCSOM(CC with Self-Organizing Maps)
• Consensus Clustering (CC) is proposed by Monti et al. in 2003, a type 3(re-sampling) consensus clustering algorithm.
29

Experiment setting
• Parameters setting:
• The datasets:
30

Experiment setting
• Adjusted Rand Index (ARI):
31
Maximum index
Expected indexReal index
The number of samples in the kth class in the true partition.
The number of samples in the ith class in the predicted partition.

Relationship between ARI and
32
• The change of ARI with respect to different K:

Relationship between ARI and
• The change of with respect to different K:
33

Relationship between ARI and
• The correlation analysis of ARI and :
34
The degree of dependence between ARI and is high.

Experiment results
• Estimated optimal K value by different approaches:
35
ground truthError terms

Experiment results
• The corresponding values of ARI:
36
The GCC approaches outperform the CC approaches.

Experiment results
• The effect of the maximum K value:
37
When Kmax increases, GCCcorr still correctly estimate the number of clusters in Synthetic2 dataset.

Experiment results
• The effect of the maximum K value:
38
When Kmax increases, GCCcorr still correctly estimate the number of clusters in Leukemia dataset.

Experiment results
• The effect of the maximum K value:
39
ζ decreases slightly when Kmax increases.
ARI is not affected when Kmax increases.
Conclusion
• This paper proposes the design of a new framework, known as GCC, to discover the classes of the samples in gene expression data.
• GCC can successfully estimate the true number of classes for the datasets in experiments.
40