grants expenditure performance as at 31 december 2014 presentation to portfolio committee
TRANSCRIPT

GRANTS EXPENDITURE PERFORMANCE AS AT 31 DECEMBER
2014
PRESENTATION TO PORTFOLIO COMMITTEE

2014/15Adjusted Allocations R' 000 Departmental Operational 711 884 Grants and transfer payments 28 705 721 Grants 27 669 053 Human Settlements Development Grant 17 084 369 Urban Settlements Development Grant 10 284 684 Municipal Human Settlements Capacity Grant 300 000 Rural Households Infrastructure Development: Direct Grant - Entities 1 022 071 Social Housing Regulatory Authority: Operational 33 480 Social Housing Regulatory Authority: Capital Restructuring Grant 827 543 Housing Development Agency 121 047 Community Schemes Ombuds Services 40 000 National Home Builders registration Council (NHBRC) 1 Departmental Transfers 14 597 Bursaries Scheme 8 985 Nelson Mandela University 4 499 UnHabitat 1 113 Council for Scientific and Industrial Research 4 000 Public Services Sector Education and Training Authority 1 170 Total 29 417 605

HUMAN SETTLEMENTS DEVELOPMENT GRANT AS AT 31 DECEMBER 2014
HSDG
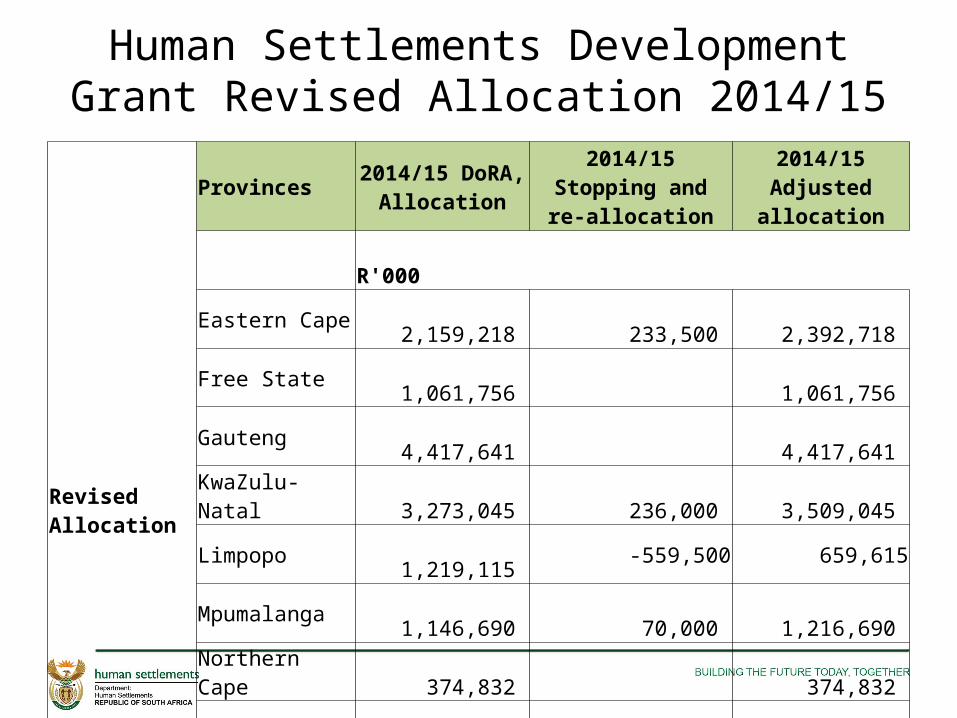
Human Settlements Development Grant Revised Allocation 2014/15
Revised Allocation
Provinces 2014/15 DoRA, Allocation
2014/15 Stopping and re-allocation
2014/15 Adjusted allocation
R'000
Eastern Cape 2,159,218 233,500 2,392,718
Free State 1,061,756 1,061,756
Gauteng 4,417,641 4,417,641
KwaZulu-Natal 3,273,045 236,000 3,509,045
Limpopo 1,219,115 -559,500 659,615
Mpumalanga 1,146,690 70,000 1,216,690
Northern Cape 374,832 374,832
North West 1,517,136 1,517,136
Western Cape 1,914,936 20,000 1,934,936
Total 17,084,369 - 17,084,369

Human Settlements Development Grant Expenditure Performance as at 31 Dec 2014
Provinces
Total Available
Year to date (1 April 2014 - 31 December 2014)
Transferred Funds
Spent by Provinces
Variance Spent vs.
Transferred
Variance Spent vs.
Total Available
Transferred as % of voted
funds
Spent as % of Total
Available
Spent as % of Transferred
Funds
Unspent as % of
Transferred Funds
Unspent as % of
Total Available
R'000 R'000 R'000 R'000 R'000
Eastern Cape 2,159,218 1,765,692 1,780,201 -14,509 379,017 82 82 101 -1 18
Free State 1,061,756 781,914 784,781 -2,867 276,975 74 74 100 -0 26
Gauteng 4,417,641 3,562,779 2,786,556
776,223
1,631,085 81 63 78 22 37
KwaZulu-Natal 3,273,045 2,805,940 2,950,350 -144,410 322,695 86 90 105 -5 10
Limpopo 1,219,115 659,591 238,355 421,236 980,760 54 20 36 64 80
Mpumalanga 1,146,690 890,037 1,017,082 -127,045 129,608 78 89 114 -14 11
Northern Cape 374,832 299,484 297,914 1,570 76,918 80 79 99 1 21
North West 1,517,136 1,191,722 1,153,893 37,829 363,243 79 76 97 3 24
Western Cape 1,914,936 1,479,180 1,420,223 58,957 494,713 77 74 96 4 26
Total 17,084,369 13,436,339 12,429,355 1,006,984 4,655,014 79 73 93 7 27
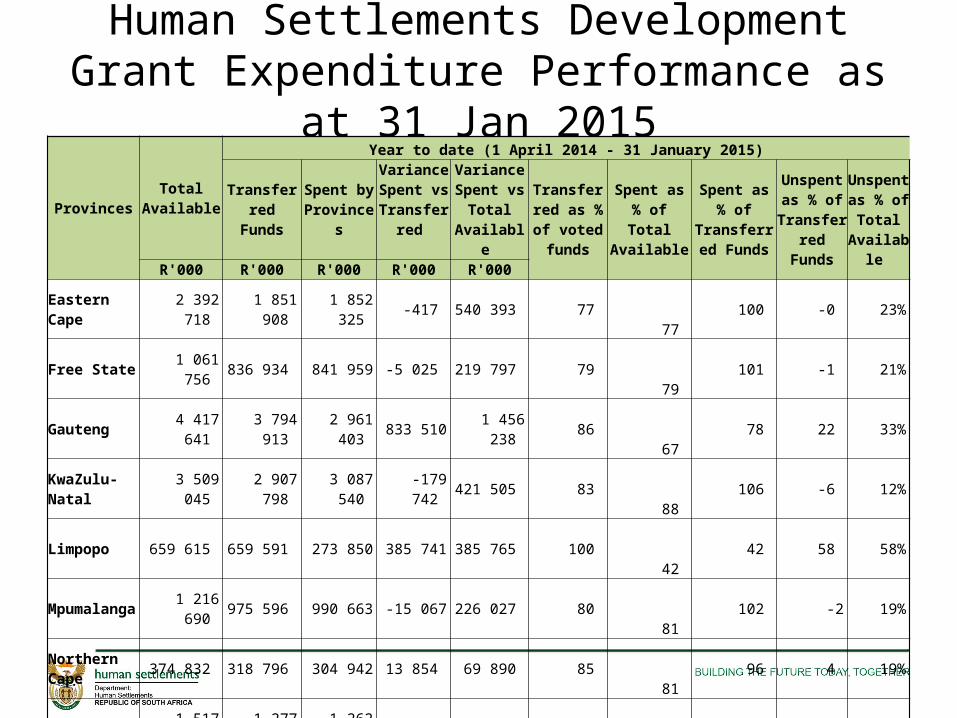
Human Settlements Development Grant Expenditure Performance as at 31 Jan 2015
ProvincesTotal
Available
Year to date (1 April 2014 - 31 January 2015)
Transferred Funds
Spent by Provinces
Variance Spent vs
Transferred
Variance Spent vs
Total Available
Transferred as % of
voted funds
Spent as % of Total
Available
Spent as % of Transferred
Funds
Unspent as % of
Transferred Funds
Unspent as % of
Total Available
R'000 R'000 R'000 R'000 R'000
Eastern Cape 2 392 718 1 851 908 1 852 325 -417 540 393 77 77 100 -0 23%
Free State 1 061 756 836 934 841 959 -5 025 219 797 79 79 101 -1 21%
Gauteng 4 417 641 3 794 913 2 961 403 833 510 1 456 238 86 67 78 22 33%
KwaZulu-Natal 3 509 045 2 907 798 3 087 540 -179 742 421 505 83 88 106 -6 12%
Limpopo 659 615 659 591 273 850 385 741 385 765 100 42 42 58 58%
Mpumalanga 1 216 690 975 596 990 663 -15 067 226 027 80 81 102 -2 19%
Northern Cape 374 832 318 796 304 942 13 854 69 890 85 81 96 4 19%
North West 1 517 136 1 277 948 1 262 416 15 532 254 720 84 83 99 1 17%
Western Cape 1 934 936 1 572 120 1 492 641 79 479 442 295 81 77 95 5 23%
Total 17 084 369 14 195 604 13 067 739 1 127 865 4 016 630 83 76 92 8 24%
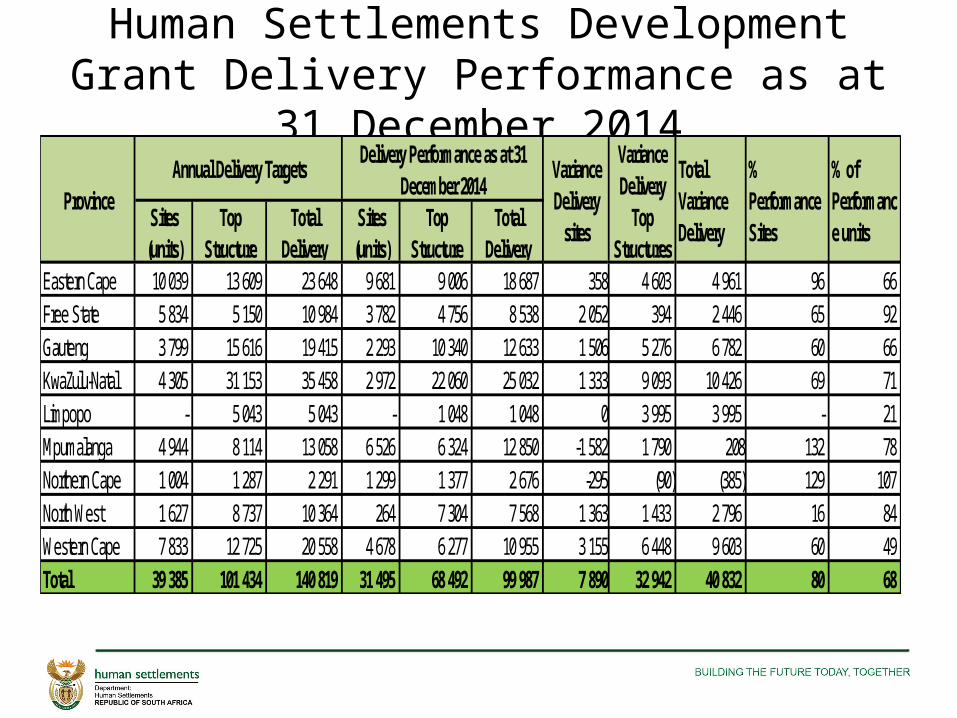
Human Settlements Development Grant Delivery Performance as at 31 December 2014
Eastern Cape 10 039 13 609 23 648 9 681 9 006 18 687 358 4 603 4 961 96 66 Free State 5 834 5 150 10 984 3 782 4 756 8 538 2 052 394 2 446 65 92 Gauteng 3 799 15 616 19 415 2 293 10 340 12 633 1 506 5 276 6 782 60 66 KwaZulu-Natal 4 305 31 153 35 458 2 972 22 060 25 032 1 333 9 093 10 426 69 71 Limpopo - 5 043 5 043 - 1 048 1 048 0 3 995 3 995 - 21 Mpumalanga 4 944 8 114 13 058 6 526 6 324 12 850 -1 582 1 790 208 132 78 Northern Cape 1 004 1 287 2 291 1 299 1 377 2 676 -295 (90) (385) 129 107 North West 1 627 8 737 10 364 264 7 304 7 568 1 363 1 433 2 796 16 84 Western Cape 7 833 12 725 20 558 4 678 6 277 10 955 3 155 6 448 9 603 60 49 Total 39 385 101 434 140 819 31 495 68 492 99 987 7 890 32 942 40 832 80 68
ProvinceAnnual Delivery Targets
Delivery Performance as at 31 December 2014
Variance Delivery
sites
Variance Delivery
Top Structures
% of Performance units
Sites (units)
Top Structure
Total Delivery
Sites (units)
Top Structure
Total Delivery
Total Variance Delivery
% Performance Sites

Human Settlements Development Grant Delivery Performance as at 31 January 2015
Province
Annual Delivery Targets Delivery Performance as at 31 January 2015
Variance Delivery
sites
Variance Delivery
Top Structures
Total Variance Delivery
% Perfor-mance
Sites
% of Perfor-mance units
Sites (units)Top
Structure (units)
Total Delivery Targets
Sites (units)Top
Structure (units)
Total Delivery
Performance
Eastern Cape 10 039 13 609 23 648 11 281 9 966 21 247 -1 242 3 643 2 401 112 73
Free State 5 834 5 150 10 984 3 782 4 823 8 605 2 052 327 2 379 65 94
Gauteng 3 799 15 616 19 415 2 293 11 521 13 814 1 506 4 095 5 601 60 74
KwaZulu-Natal 4 305 31 153 35 458 3 191 23 609 26 800 1 114 7 544 8 658 74 76
Limpopo - 5 043 5 043 - 1 188 1 188 0 3 855 3 855 - 24
Mpumalanga 4 944 8 114 13 058 6 601 6 905 13 506 -1 657 1 209 -448 134 85
Northern Cape 1 004 1 287 2 291 1 299 1 766 3 065 -295 (479) (774) 129 137
North West 1 627 8 737 10 364 264 7 666 7 930 1 363 1 071 2 434 16 88
Western Cape 7 833 12 725 20 558 5 125 7 225 12 350 2 708 5 500 8 208 65 57
Total 39 385 101 434 140 819 33 836 74 669 108 505 5 549 26 765 32 314 86 74
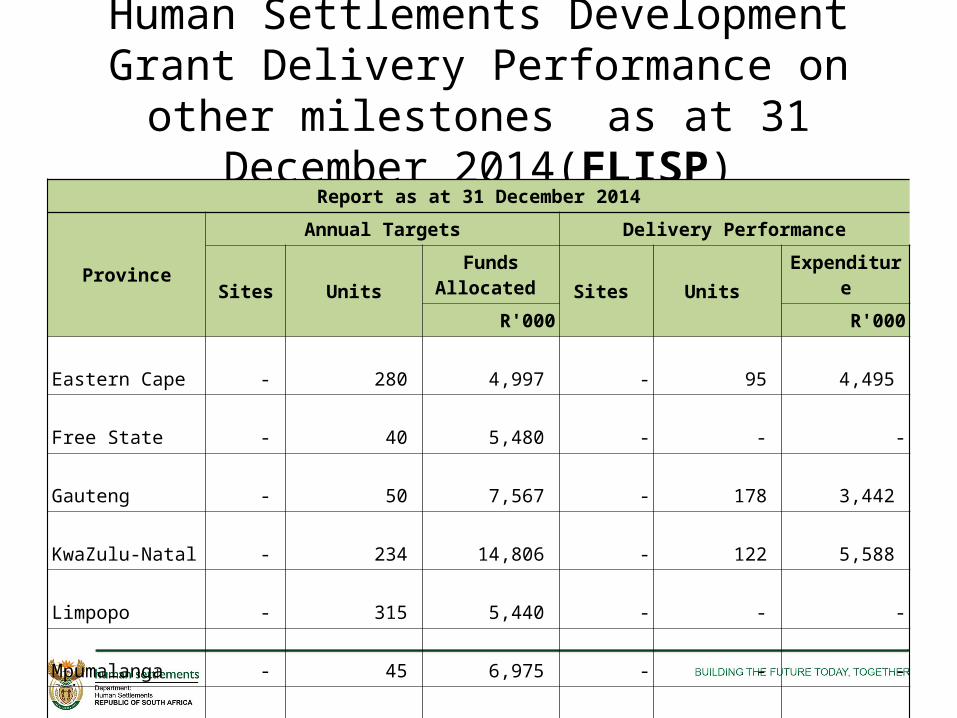
Human Settlements Development Grant Delivery Performance on other milestones as at 31
December 2014(FLISP)Report as at 31 December 2014
Province
Annual Targets Delivery Performance
Sites UnitsFunds Allocated
Sites Units Expenditure
R'000 R'000
Eastern Cape - 280 4,997 - 95 4,495
Free State - 40 5,480 - - -
Gauteng - 50 7,567 - 178 3,442
KwaZulu-Natal - 234 14,806 - 122 5,588
Limpopo - 315 5,440 - - -
Mpumalanga - 45 6,975 - - -
Northern Cape - - - - - -
North West - 12 2,058 - - -
Western Cape - 100 4,500 - 77 6,612
Total - 1,076 51,823 - 472 20,137
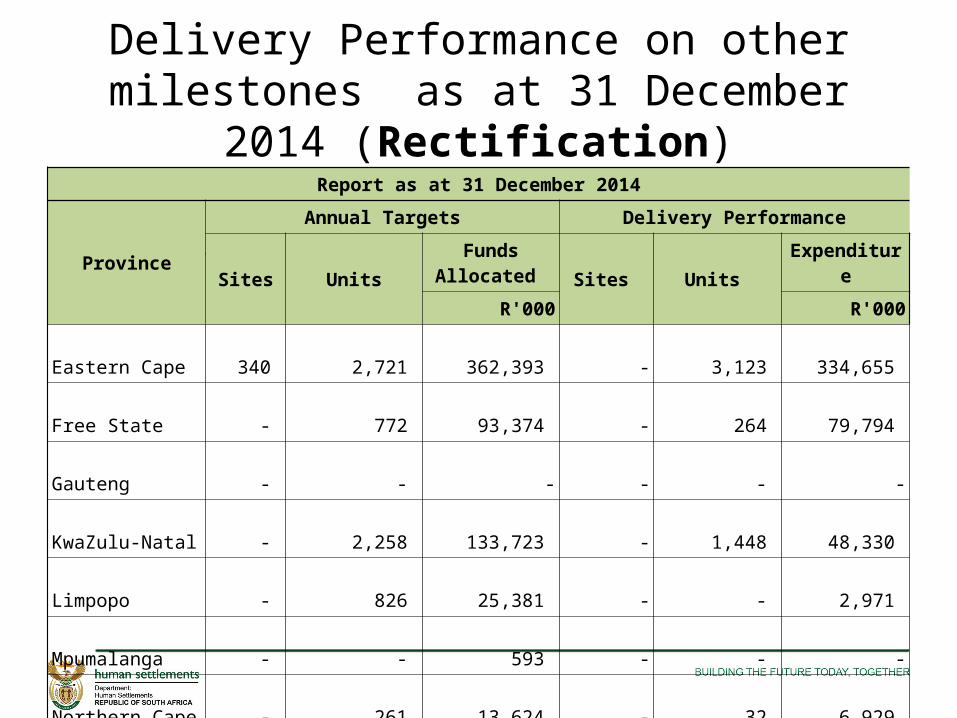
Delivery Performance on other milestones as at 31 December 2014 (Rectification)
• NBnnnna
Report as at 31 December 2014
Province
Annual Targets Delivery Performance
Sites UnitsFunds Allocated
Sites Units Expenditure
R'000 R'000
Eastern Cape 340 2,721 362,393 - 3,123 334,655
Free State - 772 93,374 - 264 79,794
Gauteng - - - - - -
KwaZulu-Natal - 2,258 133,723 - 1,448 48,330
Limpopo - 826 25,381 - - 2,971 Mpumalanga - - 593 - - -
Northern Cape - 261 13,624 - 32 6,929
North West - 23 5,599 - - 3,867
Western Cape - 365 1,270 - - 3,137
Total 340 7,226 635,957 - 4,867 479,683

Delivery Performance on other milestones as at 31 December 2014 (OPSCAP)
Report as at 31 December 2014
Province
Annual Targets Delivery Performance
Sites UnitsFunds Allocated
Sites Units Expenditure
R'000 R'000
Eastern Cape - - 49,669 - - 41,201
Free State - - 53,088 - - 60,984
Gauteng - - 222,882 - - 178,345
KwaZulu-Natal - - 91,351 - - 58,951
Limpopo - - 57,640 - - 4,694
Mpumalanga - - 19,696 - - 57,600
Northern Cape - - 12,000 - - 1,500
North West - - 74,345 - - 106,177
Western Cape - - 72,559 - - 56,240
Total - - 653,230 - - 565,692
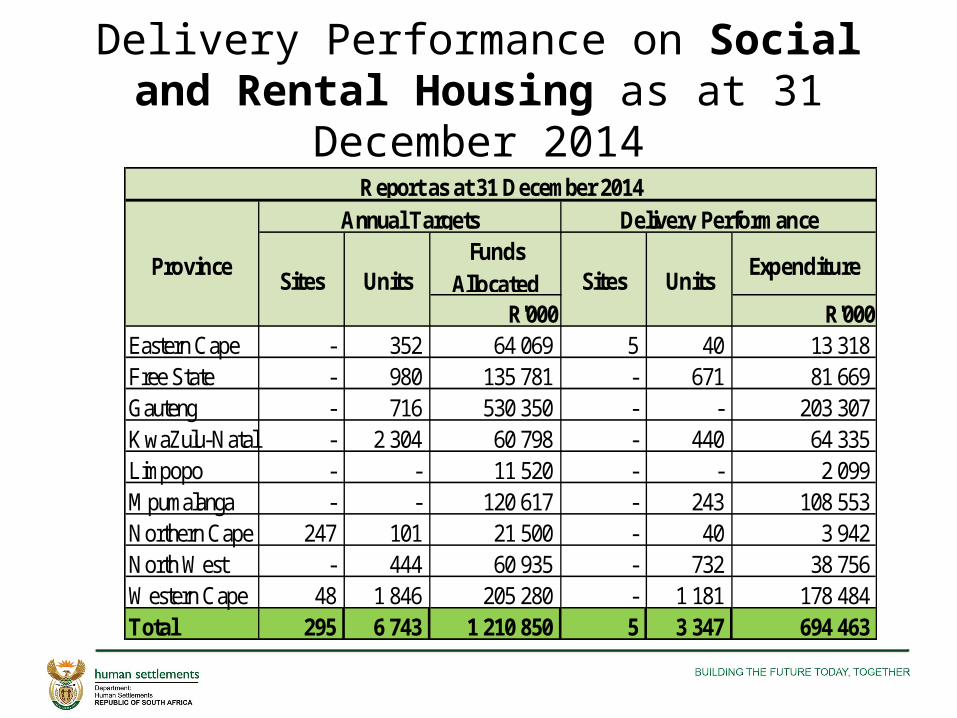
Delivery Performance on Social and Rental Housing as at 31 December 2014
Funds Allocated
Expenditure
R'000 R'000Eastern Cape - 352 64 069 5 40 13 318 Free State - 980 135 781 - 671 81 669 Gauteng - 716 530 350 - - 203 307 KwaZulu-Natal - 2 304 60 798 - 440 64 335 Limpopo - - 11 520 - - 2 099 Mpumalanga - - 120 617 - 243 108 553 Northern Cape 247 101 21 500 - 40 3 942 North West - 444 60 935 - 732 38 756 Western Cape 48 1 846 205 280 - 1 181 178 484 Total 295 6 743 1 210 850 5 3 347 694 463
Annual Targets Delivery PerformanceReport as at 31 December 2014
ProvinceSites Units Sites Units
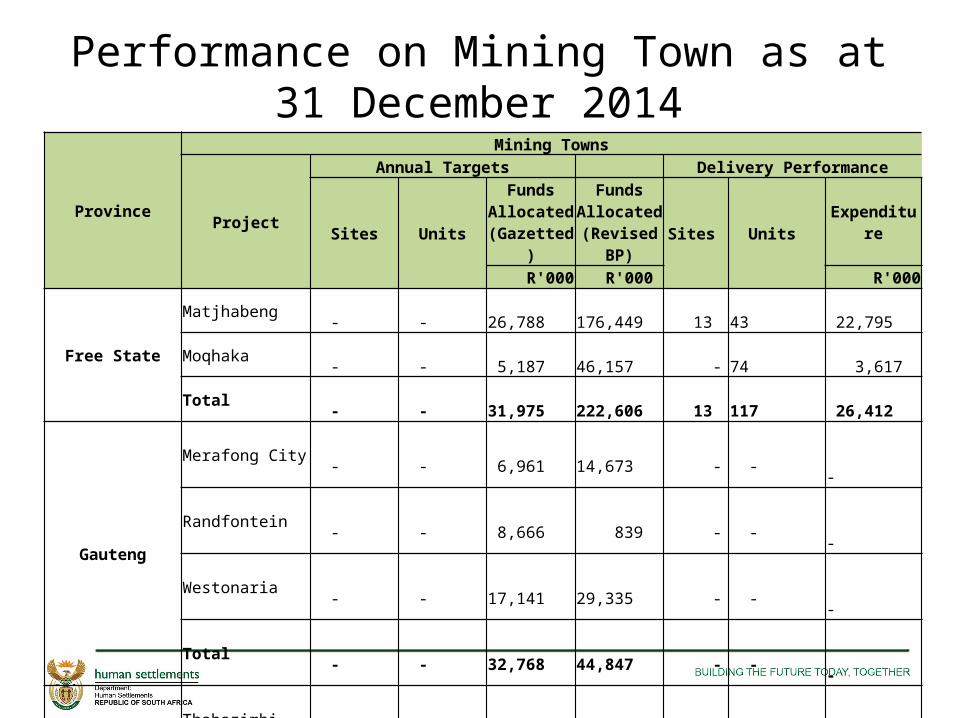
Performance on Mining Town as at 31 December 2014
Province
Mining Towns
Project
Annual Targets Delivery Performance
Sites Units
Funds Allocated (Gazetted)
Funds Allocated
(Revised BP) Sites Units Expenditure
R'000 R'000 R'000
Free State
Matjhabeng - - 26,788 176,449 13 43 22,795
Moqhaka - - 5,187 46,157 - 74 3,617
Total - - 31,975 222,606 13 117 26,412
Gauteng
Merafong City - - 6,961 14,673 - - -
Randfontein - - 8,666 839 - - -
Westonaria - - 17,141 29,335 - - -
Total - - 32,768 44,847 - - -
Limpopo
Thabazimbi - - 7,171 5,440 - - -
Greater Tubatse - - 1,684 69,946 - - -
Elias Motosoaledi - - 3,255 50,450 - - -
Lephalale - - 4,720 117,207 - - -
Fetakgomo - - 710 31,247 - - -
Total - - 17,540 274,290 - - -

Performance on Mining Town as at 31 December 2014
Province
Mining Towns
Project
Annual Targets Delivery Performance
Sites Units
Funds Allocated (Gazetted)
Funds Allocated
(Revised BP) Sites Units Expenditure
R'000 R'000
Mpumalanga
Emalahleni - - 25,507 368,591 - 327 51,925 Steve Tshwete - - 10,131 380,888 - 825 38,031 Thaba- Chweu - - 7,485 245,494 - 76 21,090 Total - - 43,123 994,973 - 1,228 111,046
Northern Cape
Tsantsabane - - 2,796 - - - - Ga-Segonyana - - 3,335 33,383 - - 2,205 Gamagara - - 3,295 15,739 - - 6,370 Total - - 9,426 49,122 - - 8,575
North West
Kgetleng Rivier - 199 4,077 61,458 - - 11,139 Madibeng - 493 69,777 11,916 - 639 56,505 Moses Kotane - 366 15,977 28,898 - 419 47,194 Rustenburg - 556 65,337 128,898 - 610 36,375 Total - 1,614 155,168 231,170 - 1,668 151,213
-
Grand Total - 1,614 290,000 1,817,008 13 3,013 297,246

Performance on Disaster Relief Grant as at 31 December 2014
Disaster Relief Grant
Province
Annual Targets Delivery Performance
Sites UnitsFunds Allocated
Sites Units Expenditure
R'000 R'000
KwaZulu-Natal - 1,744 167,093 - 428 117,869
Limpopo - - 5,700 - - -
Mpumalanga - - 7,349 - 310 7,349
Western Cape - - 4,858 - - -
Total - 1,744 185,000 - 738 125,218
URBAN SETTLEMENTS DEVELOPMENT GRANT AS AT 31 DECEMBER 2014
USDG

Urban Settlements Development Grant Expenditure Performance as at 31 December 2014
Municipality
Voted Funds
Rollover from
2013/14
Total Available Funds
Transferred Funds
Spent by Municipalit
y
Variance Spent vs Total
Available Funds
Variance Spent vs
Transferred
Transferred as % of Voted
Funds
Spent as % of Total
Available Funds
Spent as % of
Transferred funds
Unspent as % of
Transferred Funds
Buffalo City 673 289 652 673 941 438 630 278 193 395 748 160 437 65.1% 41.3% 63.4% 58.7% 36.6%Nelson Mandela Bay 828 863 - 828 863 371 602 285 622 543 241 85 980 44.8% 34.5% 76.9% 65.5% 23.1%Mangaung 654 406 70 727 725 133 464 406 176 853 548 280 287 553 71% 24.4% 38.1% 75.6% 61.9%Ekurhuleni 1 804 532 180 598 1 985 130 1 050 765 364 948 1 620 182 685 817 58.2% 18.4% 34.7% 81.6% 65.3%
City of Johannesburg 1 695 189 - 1 695 189 845 330 285 627 1 409 562 559 703 49.9% 16.8% 33.8% 83.2% 66.2%City of Tshwane 1 469 450 44 830 1 514 280 955 142 528 022 986 258 427 120 65% 34.9% 55.3% 65.1% 44.7%eThekwini 1 800 076 - 1 800 076 1 130 049 878 518 921 558 251 531 62.8% 48.8% 77.7% 51.2% 22.3%City of Cape Town 1 358 879 286 547 1 645 426 769 547 383 371 1 262 055 386 176 56.6% 23.3% 49.8% 76.7% 50.2%Total 10 284 684 583 354 10 868 038 6 025 471 3 181 154 7 686 884 2 844 317 58.6% 29.3% 52.8% 70.7% 47.2%
YEAR TO DATE (01 JULY 2014 - 31 DECEMBER 2014) EXPENDITUREUnspent as % of Total Available
FundsR'000
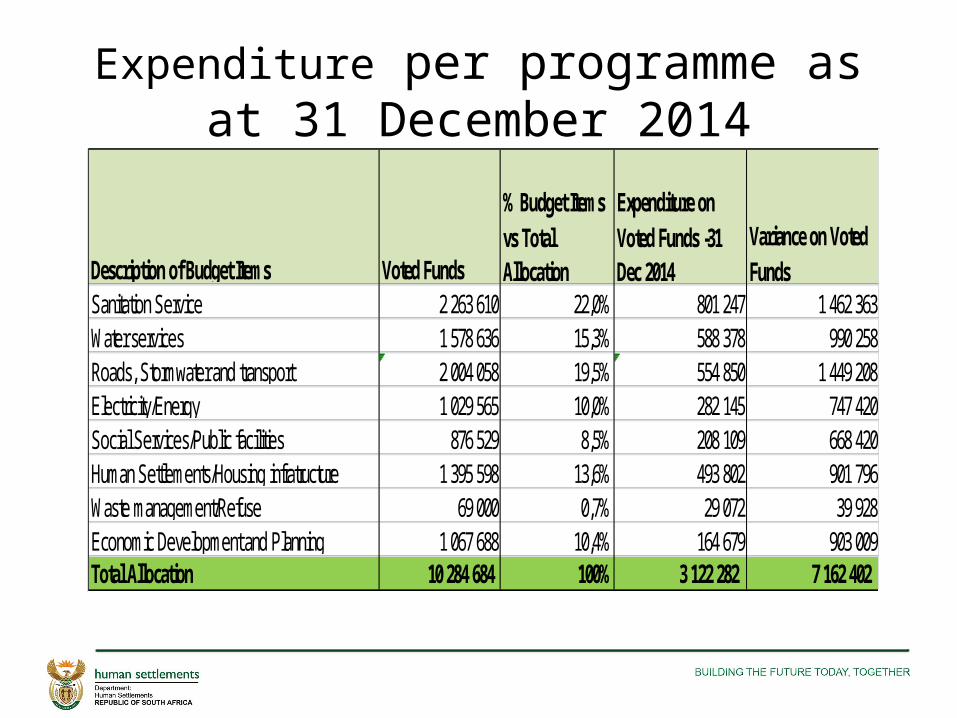
Expenditure per programme as at 31 December 2014
Description of Budget Items Voted Funds
% Budget Items vs Total Allocation
Expenditure on Voted Funds -31 Dec 2014
Variance on Voted Funds
Sanitation Service 2 263 610 22,0% 801 247 1 462 363Water services 1 578 636 15,3% 588 378 990 258Roads, Stormwater and transport 2 004 058 19,5% 554 850 1 449 208Electricity/Energy 1 029 565 10,0% 282 145 747 420Social Services/Public facilities 876 529 8,5% 208 109 668 420Human Settlements/Housing infratructure 1 395 598 13,6% 493 802 901 796Waste management/Refuse 69 000 0,7% 29 072 39 928Economic Development and Planning 1 067 688 10,4% 164 679 903 009Total Allocation 10 284 684 100% 3 122 282 7 162 402

BCM - Financial Performance as at 31 December 2014
DescriptionVoted Funds Expenditure on
Voted FundsVariance on Voted Funds % Spent on
Voted FundsR'000
Water 54,926 11,500 43,426 20.9%Waste Water 179,082 61,343 117,739 34.3%Electricity 27,699 5,301 22,398 19.1%Roads and Stormwater 198,000 137,673 60,327 69.5%Housing 64,418 36,099 28,319 56.0%Transport Planning 44,500 8,538 35,962 19.2%Waste Management / Refuse 26,000 4 25,996 0%Amenities 32,250 2,889 29,361 9.0%Environmental Services 12,000 1,584 10,416 13%Public Safety 3,000 - 3,000 0%
Enterprise Project Management Office 29,914 12,938 16,976 43.3%
Support Services 1,500 324 1,176 21.6%
Total 673,289 278,193 395,096 41.3%
20
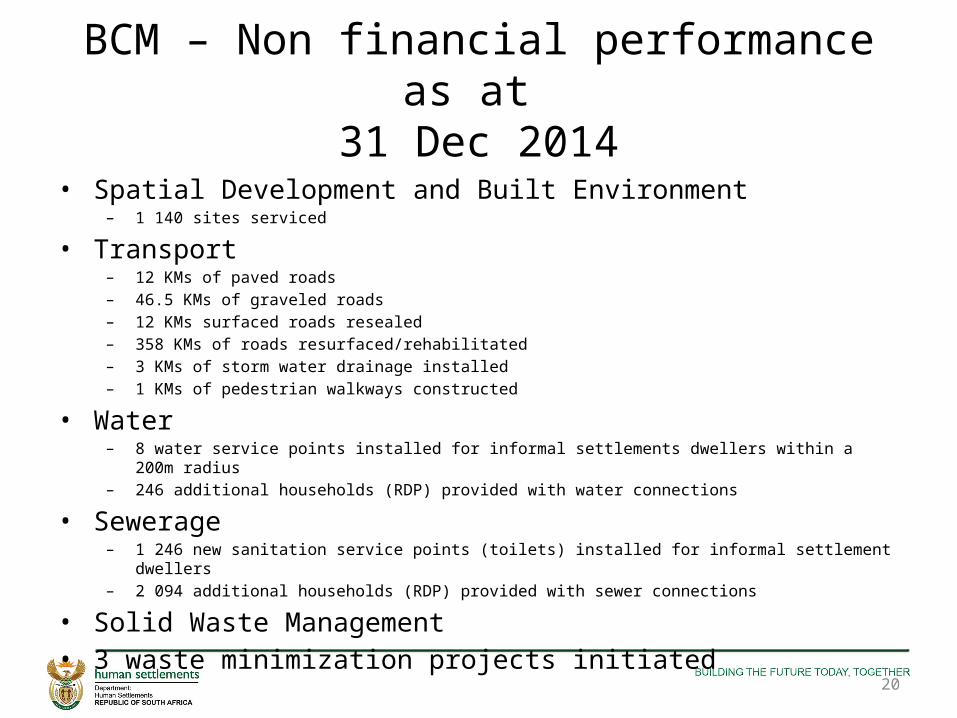
BCM – Non financial performance as at 31 Dec 2014
• Spatial Development and Built Environment – 1 140 sites serviced
• Transport– 12 KMs of paved roads – 46.5 KMs of graveled roads– 12 KMs surfaced roads resealed– 358 KMs of roads resurfaced/rehabilitated– 3 KMs of storm water drainage installed– 1 KMs of pedestrian walkways constructed
• Water– 8 water service points installed for informal settlements dwellers within a 200m radius– 246 additional households (RDP) provided with water connections
• Sewerage– 1 246 new sanitation service points (toilets) installed for informal settlement dwellers– 2 094 additional households (RDP) provided with sewer connections
• Solid Waste Management• 3 waste minimization projects initiated

NMBM - Financial Performance as at 31 December 2014
DescriptionVoted Funds Expenditure on
Voted FundsVariance on Voted Funds % Spent on
Voted FundsR'000
Human Settlements 207,791 93,775 114,016 45.1%
Roads, Storm water and Transportation 57,000 21,589 35,411 37.9%
Sanitation Service 343,482 115,212 228,270 33.5%
Water Service 220,590 55,046 165,544 25.0%
Total 828,863 285,622 543,241 34.5%

22
NMBM – Non financial performance as at 31 Dec 2014
• Spatial Development and Built Environment – 1 509 households living in informal settlements upgraded– 2 Informal settlements upgraded (services provided): In Situ– 917 household relocated to greenfield development areas
• Water– 554 additional households provided with water connections
• Sewerage– 554 additional households provided with sewer connections
• Electricity – 1 189 new erven connected to electricity
• Local Economic Development and Job Creation• 2 522 work opportunities created• 755 full time equivalent jobs

Mangaung - Financial Performance as at 31 December 2014
DescriptionVoted Funds Expenditure on
Voted FundsVariance on Voted Funds % Spent on
Voted FundsR'000
Corporate Services 20,709 3,975 16,734 19.2%
Social Services 54,259 16,518 37,741 30.4%
Planning 26,627 1,739 24,888 6.5%
Human Settlements and Housing 19,264 - 19,264 0.0%
Engineering Services 332,678 74,279 258,399 22.3%
Water 200,869 80,333 120,536 40.0%
Centlec - 9 -9 0.0%
Total 654,406 176,853 477,553 27.0%
24
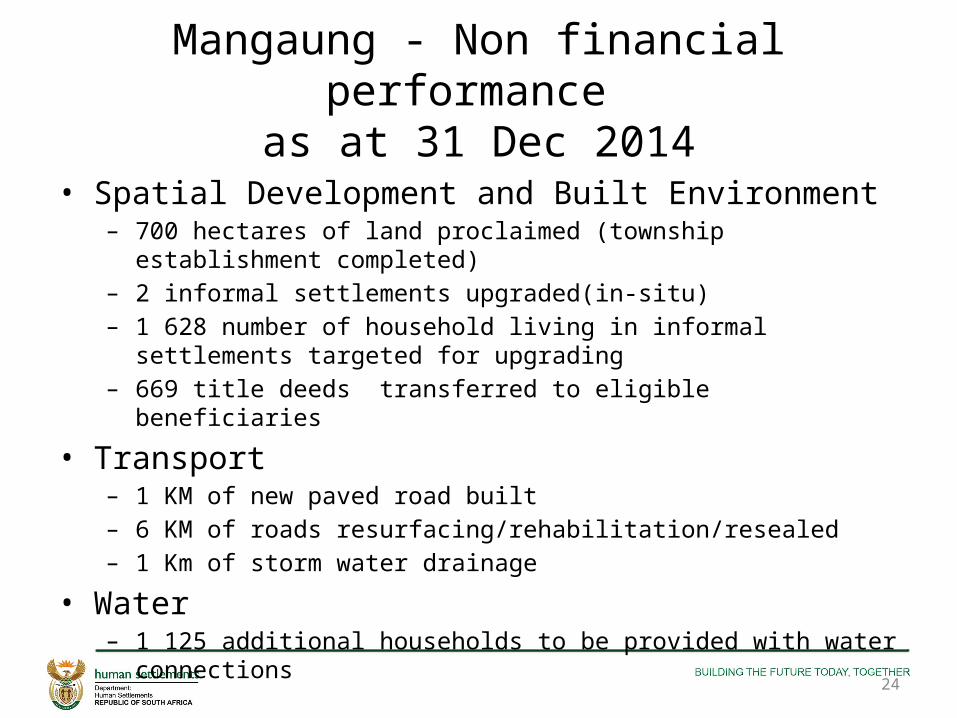
Mangaung - Non financial performance as at 31 Dec 2014
• Spatial Development and Built Environment – 700 hectares of land proclaimed (township establishment completed)– 2 informal settlements upgraded(in-situ)– 1 628 number of household living in informal settlements targeted for
upgrading– 669 title deeds transferred to eligible beneficiaries
• Transport – 1 KM of new paved road built– 6 KM of roads resurfacing/rehabilitation/resealed– 1 Km of storm water drainage
• Water– 1 125 additional households to be provided with water connections

Mangaung - Non financial performance as at 31 Dec 2014 cont.
• Sewerage– 1 259 additional households provided with sewer connections
• Electricity– 11 high mast lights installed– 127 additional street lights installed
• Socio-Economic Amenities• 1 Park/ leisure facilities developed/ upgraded
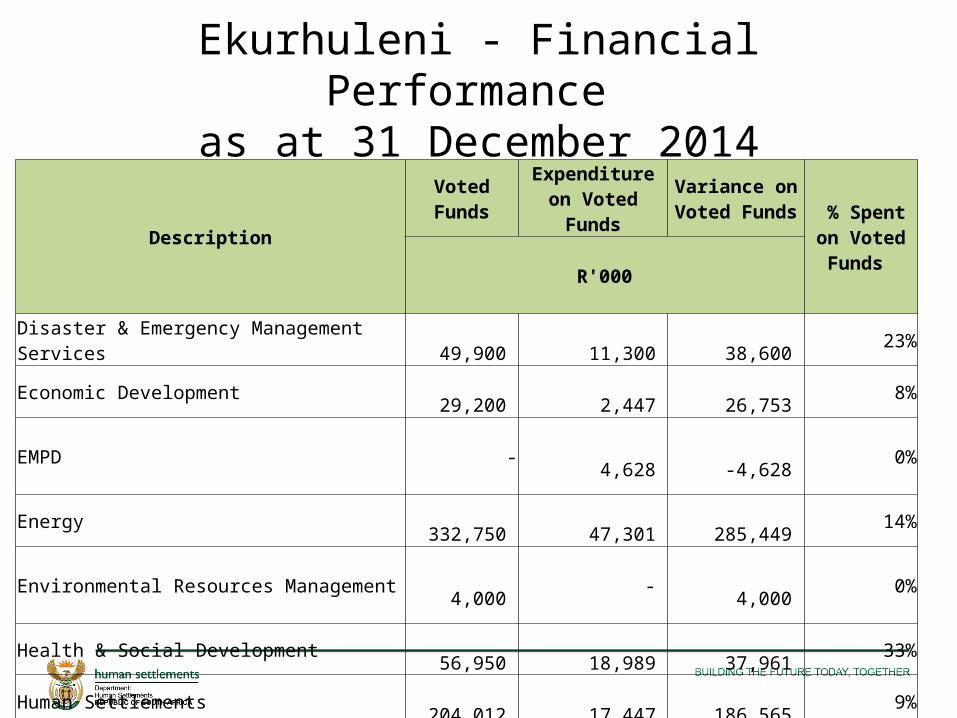
Ekurhuleni - Financial Performance as at 31 December 2014
DescriptionVoted Funds Expenditure on
Voted FundsVariance on Voted Funds % Spent on
Voted Funds R'000
Disaster & Emergency Management Services 49,900 11,300 38,600 23%Economic Development 29,200 2,447 26,753 8%EMPD - 4,628 -4,628 0%Energy 332,750 47,301 285,449 14%Environmental Resources Management 4,000 - 4,000 0%Health & Social Development 56,950 18,989 37,961 33%Human Settlements 204,012 17,447 186,565 9%Real Estate 71,100 2,512 68,588 4%Roads and Stormwater 282,250 36,954 245,296 13%SRAC 35,800 7,746 28,054 22%Transport 304,401 55,753 248,648 18%Waste Management 25,000 - 25,000 0%Water & Sanitation 174,617 51,196 123,421 29%Erwat - Wastewater treatment 50,000 50,000 - 100%Chemical Toilets 184,551 51,255 133,296 28%Human Settlements (USDG) - 7,420 -7,420 0% Total 1,804,532 364,948 1,439,584 20%
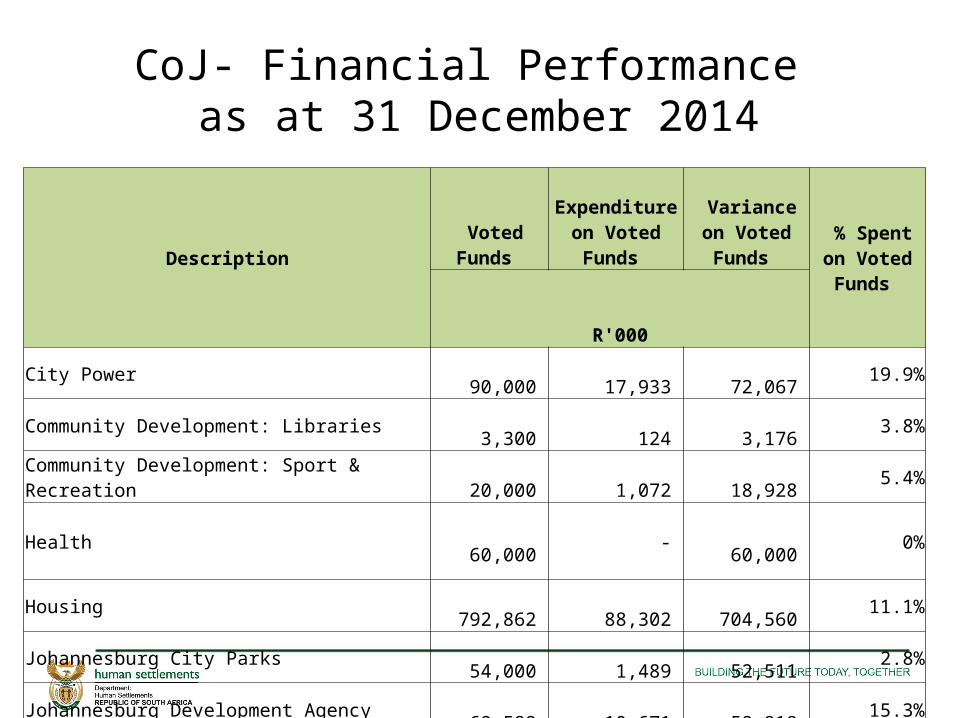
CoJ- Financial Performance as at 31 December 2014
Description Voted Funds Expenditure on
Voted Funds Variance on Voted Funds % Spent on
Voted Funds R'000
City Power 90,000 17,933 72,067 19.9%Community Development: Libraries 3,300 124 3,176 3.8%Community Development: Sport & Recreation 20,000 1,072 18,928 5.4%Health 60,000 - 60,000 0%Housing 792,862 88,302 704,560 11.1%Johannesburg City Parks 54,000 1,489 52,511 2.8%Johannesburg Development Agency 69,589 10,671 58,918 15.3%Johannesburg Social Housing Company 20,000 6,000 14,000 30%Johannesburg Water : Sewer 133,044 71,279 61,765 53.6%Johannesburg Water : Water 89,367 854 88,513 1.0%Johannesburg Road Agency 349,027 28,963 320,064 8%Pikitup 14,000 68 13,932 0%Total 1,695,189 226,755 1,468,434 13.4%

CoJ – Non financial performance as at 31 Dec 2014
• Spatial Development and the Built Environment– 1 364 household living in informal settlements upgraded– 473 title deeds transferred to eligible beneficiaries
• Roads and Storm water
– 589 km of roads resurfaced /rehabilitated/resealed– 8kms of storm water drainage installed in addition to current ones
• Transport– 5km of new pedestrian walkways to be constructed – 60 numbers of new bus/taxi stops to be constructed
28

CoJ – Non financial performance as at 31 Dec 2014 cont.
• Water– 1 274 additional water service point installed for informal settlements
dwellers within 200m radius• Sewerage
– 688 additional water service points(toilets)to be installed for informal settlement dwellers
• Solid Waste Management– 4 477 additional households provided with access to weekly refuse removal
• Electricity– 1 247 additional households living in formal provided with electricity
connections. – 569 additional street light installed

City of Tshwane- Financial Performance as at 31 December 2014
Description Voted Funds Expenditure on
Voted Funds Variance on Voted
Funds % Spent on Voted Funds
R'000
Electricity for All 260,000 159,887 100,113 61.5%
Replacement, Upgrade, Construct Wwtw Facilities 44,000 40,425 3,575 91.9%
Tshwane Public Lighting Programme 25,000 5,003 19,997 20.0%
Project Linked Housing - Water Provision 330,270 40,216 290,054 12%
Sewerage - Low Cost Housing 326,273 70,728 255,545 21.7%
Roads and Stormwater - Low Cost Housing - Project Linked Housing 71,915 - 71,915 0.0%
Project Linked Housing - Acquisition of Land 109,347 29,952 79,395 27.4%
Refurbishing of Water Networks and Backlog Eradication 177,546 91,187 86,359 51%
Internal Roads: Northern Areas 97,599 65,272 32,327 66.9%
Flooding Backlogs: Sosh & Winterveldt Area 26,000 25,352 648 97.5%
Bulk Sewer Supply- Franspoort 1,500 - 1,500 0%Total 1,469,450 528,022 941,428 35.9%

CoT – Non financial performance as at 31 Dec 2014
• Electricity– 6 122 electricity connections– 595 street lights– 40 high masts installed
• Transport– 16 km roads paved– 17.05 km of pedestrian walkways– 21.8 km storm water installed

Ethekwini- Financial Performance as at 31 December 2014
Description Voted FundsExpenditure on
Voted FundsVariance on Voted Funds
% spent on Voted funds
Housing Infrastructure 130 000 125 288 4 712 96.4%Project Management 17 930 985 16 945 5.5%Roads 117 810 51 418 66 392 43.6%Stormwater 31 350 47 320 (15 970) 150.9%Ethekwini Transport Authority 64 900 - 64 900 0%Water 505 068 309 242 195 826 61.2%Sanitation 579 750 236 323 343 427 40.8%Electricity 134 650 31 243 103 407 23.2%Community and Emergency Services HSS 39 048 6 952 32 096 17.8%Emergency Control and Disaster Management 9 000 3 581 5 419 39.8%Fire and Emergency Services 29 000 150 28 850 0.5%Economic Development and Planning 85 570 32 594 52 976 38.1%Office of City Manager 56 000 33 422 22 578 59.7%Total 1 800 076 878 518 921 558 48.8%
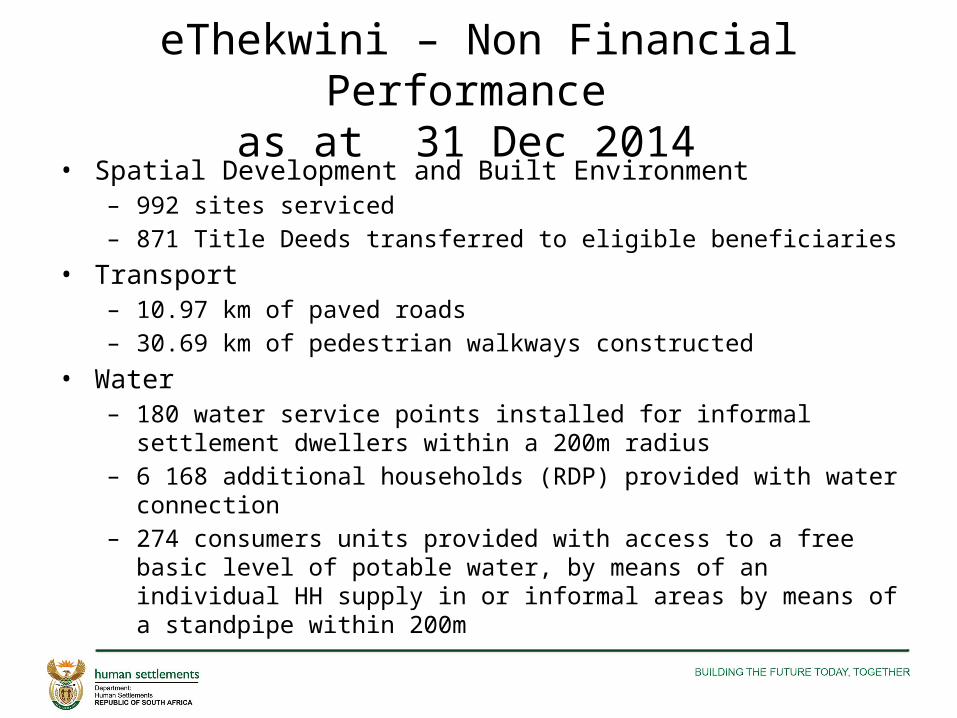
eThekwini – Non Financial Performance as at 31 Dec 2014
• Spatial Development and Built Environment– 992 sites serviced– 871 Title Deeds transferred to eligible beneficiaries
• Transport– 10.97 km of paved roads– 30.69 km of pedestrian walkways constructed
• Water– 180 water service points installed for informal settlement dwellers within a
200m radius– 6 168 additional households (RDP) provided with water connection– 274 consumers units provided with access to a free basic level of potable
water, by means of an individual HH supply in or informal areas by means of a standpipe within 200m
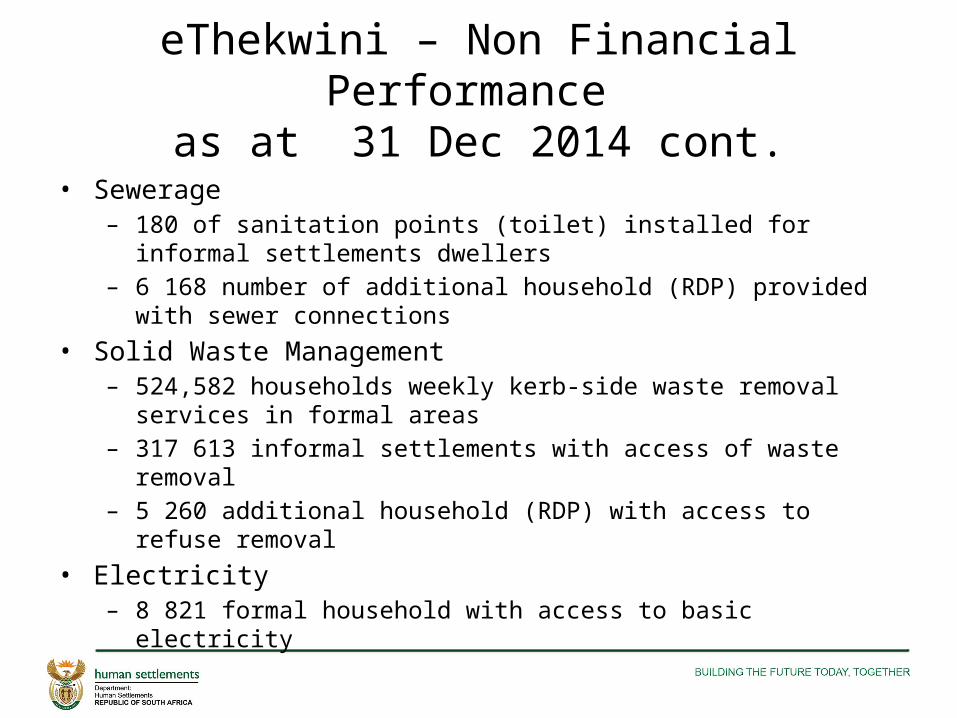
eThekwini – Non Financial Performance as at 31 Dec 2014 cont.
• Sewerage– 180 of sanitation points (toilet) installed for informal settlements dwellers– 6 168 number of additional household (RDP) provided with sewer connections
• Solid Waste Management– 524,582 households weekly kerb-side waste removal services in formal areas– 317 613 informal settlements with access of waste removal– 5 260 additional household (RDP) with access to refuse removal
• Electricity– 8 821 formal household with access to basic electricity
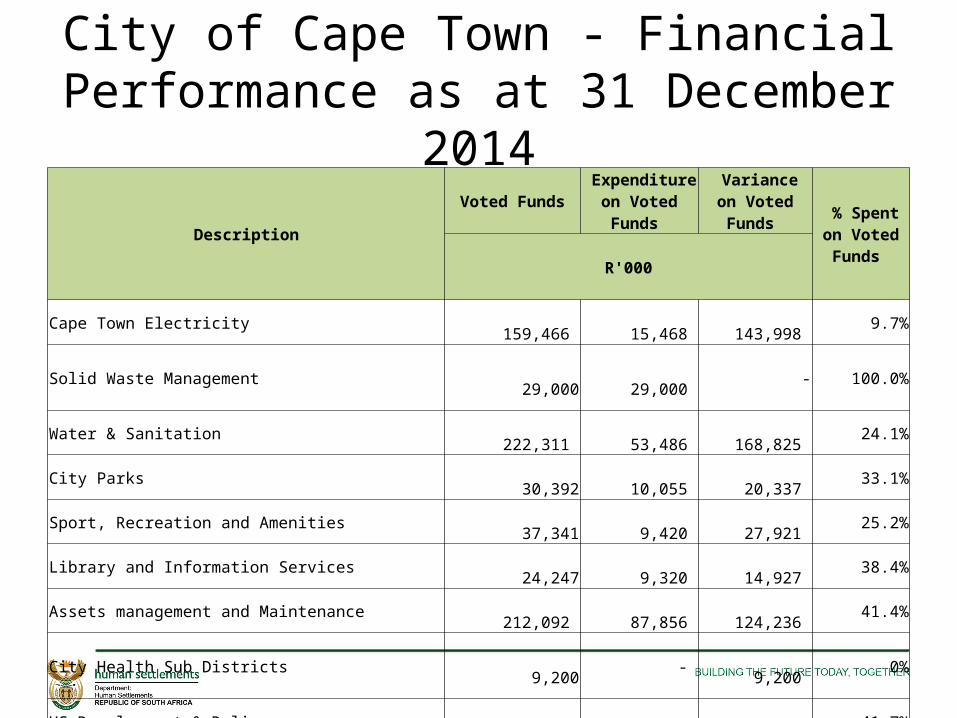
City of Cape Town - Financial Performance as at 31 December 2014
Description Voted Funds Expenditure on
Voted Funds Variance on Voted Funds % Spent on
Voted Funds R'000
Cape Town Electricity 159,466 15,468 143,998 9.7%Solid Waste Management 29,000 29,000 - 100.0%Water & Sanitation 222,311 53,486 168,825 24.1%City Parks 30,392 10,055 20,337 33.1%Sport, Recreation and Amenities 37,341 9,420 27,921 25.2%Library and Information Services 24,247 9,320 14,927 38.4%Assets management and Maintenance 212,092 87,856 124,236 41.4%City Health Sub Districts 9,200 - 9,200 0%HS Development & Delivery 170,304 70,940 99,364 41.7%HS Strategy & Planning 18,400 16,173 2,227 87.9%Public Housing and Customer Services 47,477 13,375 34,102 28.2%HS Urbanisation 277,485 41,399 236,086 14.9%
Spatial Planning and Urban Design 7,022 65 6,957 1%
Provincial Allocation 49,528 19,311 30,217 39.0%Project pre-planning 64,614 7,503 57,111 11.6%Total 1,358,879 383,371 975,508 28.2%
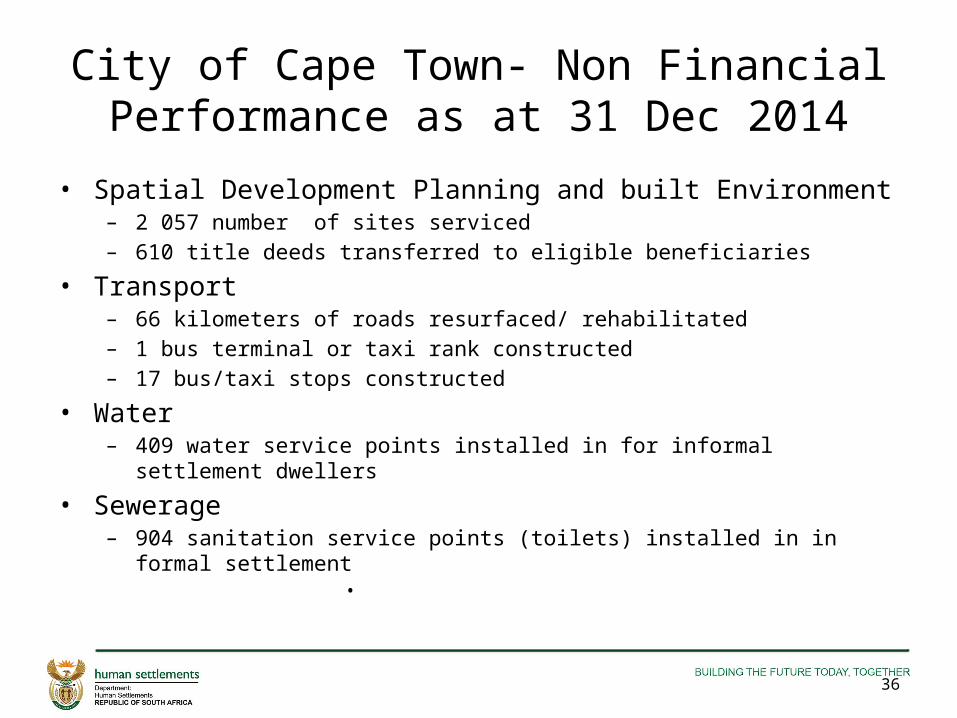
City of Cape Town- Non Financial Performance as at 31 Dec 2014
• Spatial Development Planning and built Environment– 2 057 number of sites serviced– 610 title deeds transferred to eligible beneficiaries
• Transport– 66 kilometers of roads resurfaced/ rehabilitated– 1 bus terminal or taxi rank constructed – 17 bus/taxi stops constructed
• Water– 409 water service points installed in for informal settlement dwellers
• Sewerage– 904 sanitation service points (toilets) installed in in formal settlement
•
36

Identified areas for improvement
• National Department should develop a capacity support programme to assist provinces and metros (BP, SCM and Accruals)
• Provinces should provide WIP to determine achievement of the set targets in remaining weeks
• National Department should upscale its monitoring and evaluation unit for verification of data
Identified areas for improvement
• Metros should consider reallocating budgets to moving projects to avoid under spending
• There is a need for a Metros forum to discuss challenges experienced.
• National Department to tighten the monitoring and evaluation
• Tighten the impact indicators upscale (Jobs, bulk infrastructure, basic services) job creation
THANK YOU