grand river dam authority - sai.ok.gov
TRANSCRIPT

Grand River Dam Authority (A Component Unit of the State of Oklahoma)
Basic Financial Statements as of and for the Years Ended December 31, 2014 and 2013, Required Supplementary Information (Unaudited) and Independent Auditors’ Report
GRAND RIVER DAM AUTHORITY (A Component Unit of the State of Oklahoma)
TABLE OF CONTENTS
Page
INDEPENDENT AUDITORS’ REPORT 1–2
MANAGEMENT’S DISCUSSION AND ANALYSIS (UNAUDITED) 3–12
BASIC FINANCIAL STATEMENTS AS OF AND FOR THE YEARS ENDED DECEMBER 31, 2014 AND 2013: Statements of Net Position 13 Statements of Revenues, Expenses, and Changes in Net Position 14 Statements of Cash Flows 15 Notes to Financial Statements 16–41
REQUIRED SUPPLEMENTARY INFORMATION (UNAUDITED)— 42 Actuarial Information—Other Postemployment Benefits Plan— Schedule of Funding Progress (Unaudited) 43
INDEPENDENT AUDITORS’ REPORT ON INTERNAL CONTROL OVER FINANCIAL REPORTING AND ON COMPLIANCE AND OTHER MATTERS BASED UPON AN AUDIT OF THE FINANCIAL STATEMENTS PERFORMED IN ACCORDANCE WITH GOVERNMENT AUDITING STANDARDS 44–45

INDEPENDENT AUDITORS’ REPORT
To the Board of Directors of Grand River Dam Authority:
Report on the Financial Statements
We have audited the accompanying financial statements of the Grand River Dam Authority (the “Authority”), a component unit of the State of Oklahoma, as of and for the years ended December 31, 2014 and 2013, and the related notes to the financial statements, which collectively comprise the Authority’s basic financial statements as listed in the table of contents.
Management’s Responsibility for the Consolidated Financial Statements
Management is responsible for the preparation and fair presentation of these financial statements in accordance with accounting principles generally accepted in the United States of America; this includes the design, implementation, and maintenance of internal control relevant to the preparation and fair presentation of financial statements that are free from material misstatement, whether due to fraud or error.
Auditors’ Responsibility
Our responsibility is to express an opinion on these financial statements based on our audits. We conducted our audits in accordance with auditing standards generally accepted in the United States of America and the standards applicable to financial audits included in Government Auditing Standards, issued by the Comptroller General of the United States of America. Those standards require that we plan and perform the audit to obtain reasonable assurance about whether the financial statements are free of material misstatement.
An audit involves performing procedures to obtain audit evidence about the amounts and disclosures in the financial statements. The procedures selected depend on the auditor’s judgment, including the assessment of the risks of material misstatement of the financial statements, whether due to fraud or error. In making those risk assessments, the auditor considers internal control relevant to the entity’s preparation and fair presentation of the basic financial statements in order to design audit procedures that are appropriate in the circumstances, but not for the purpose of expressing an opinion on the effectiveness of the entity’s internal control. Accordingly, we express no such opinion. An audit also includes evaluating the appropriateness of accounting policies used and the reasonableness of significant accounting estimates made by management, as well as evaluating the overall presentation of the financial statements.
We believe that the audit evidence we have obtained is sufficient and appropriate to provide a basis for our audit opinion.
- 2 -
Opinion
In our opinion, the financial statements referred to above present fairly, in all material respects, the financial position of the Authority as of December 31, 2014 and 2013, and the respective changes in financial position and, where applicable, cash flows thereof for the years then ended in conformity with accounting principles generally accepted in the United States of America.
Other Matters—Management’s Discussion and Analysis and Schedule of Funding Progress
Accounting principles generally accepted in the United States of America require that the management discussion and analysis on pages 3–12 and the schedule of funding progress on pages 42-43 be presented to supplement the basic financial statements. Such information, although not a part of the basic financial statements, is required by the Governmental Accounting Standards Board (GASB) who considers it to be an essential part of financial reporting for placing the basic financial statements in an appropriate operational, economic, or historical context. We have applied certain limited procedures to the required supplementary information in accordance with auditing standards generally accepted in the United States of America, which consisted of inquiries of management about the methods of preparing the information and comparing the information for consistency with management’s responses to our inquiries, the basic financial statements, and other knowledge we obtained during our audit of the basic financial statements. We do not express an opinion or provide any assurance on the information because the limited procedures do not provide us with sufficient evidence to express an opinion or provide any assurance.
Other Reporting Required by Government Auditing Standards
In accordance with Government Auditing Standards, we have also issued a report dated March 31, 2015, on our consideration of the Authority’s internal control over financial reporting and our tests of its compliance with certain provisions of laws, regulations, contracts, and grant agreements and other matters. The purpose of that report is to describe the scope of our testing of internal control over financial reporting and compliance and the results of that testing, and not to provide an opinion on internal control over financial reporting or on compliance. That report is an integral part of an audit performed in accordance with Government Auditing Standards in considering the Authority’s internal control over financial reporting and compliance.
March 31, 2015

16 GRDA Comprehensive Annual Financial Report 2014
Management’s Discussion And Analysis - UnauditedThe following discussion and analysis of the Grand River Dam Authority’s (GRDA or the Authority) financial performance provides an overview of the Authority’s financial activities for the year ended December 31, 2014, and 2013, in comparison with the prior year’s financial results. Please read it in conjunction with the financial statements, which follow this section.
USING THIS FINANCIAL REPORTThis annual financial report consists of a series of financial statements and reflects the self-supporting, proprietary activities of the Authority funded primarily by the sale of electrical power and energy.
The state of Oklahoma reports the business-type activities of the Authority as a discretely presented major component unit.
The basic financial statements presented in this report consist of the Statements of Net Position; the Statements of Revenues, Expenses, and Changes in Net Position; the Statements of Cash Flows; and Notes to Financial Statements.
STATEMENTS OF NET POSITION; STATEMENTS OF REVENUES, EXPENSES, AND CHANGES IN NET POSITION; STATEMENTS OF CASH FLOWS; AND NOTES TO FINANCIAL STATEMENTSThe Authority’s Statements of Net Position and Statements of Revenues, Expenses and Changes in Net Position provide an indication of the Authority’s financial health.
The Statements of Net Position include all of the Authority’s assets and liabilities, using the accrual basis of accounting, as well as an indication of which assets can be used for general purposes, and which are restricted as a result of bond covenants or for other purposes.
The Statements of Revenues, Expenses, and Changes in Net Position report all of the Authority’s revenues and expenses during the time periods indicated.
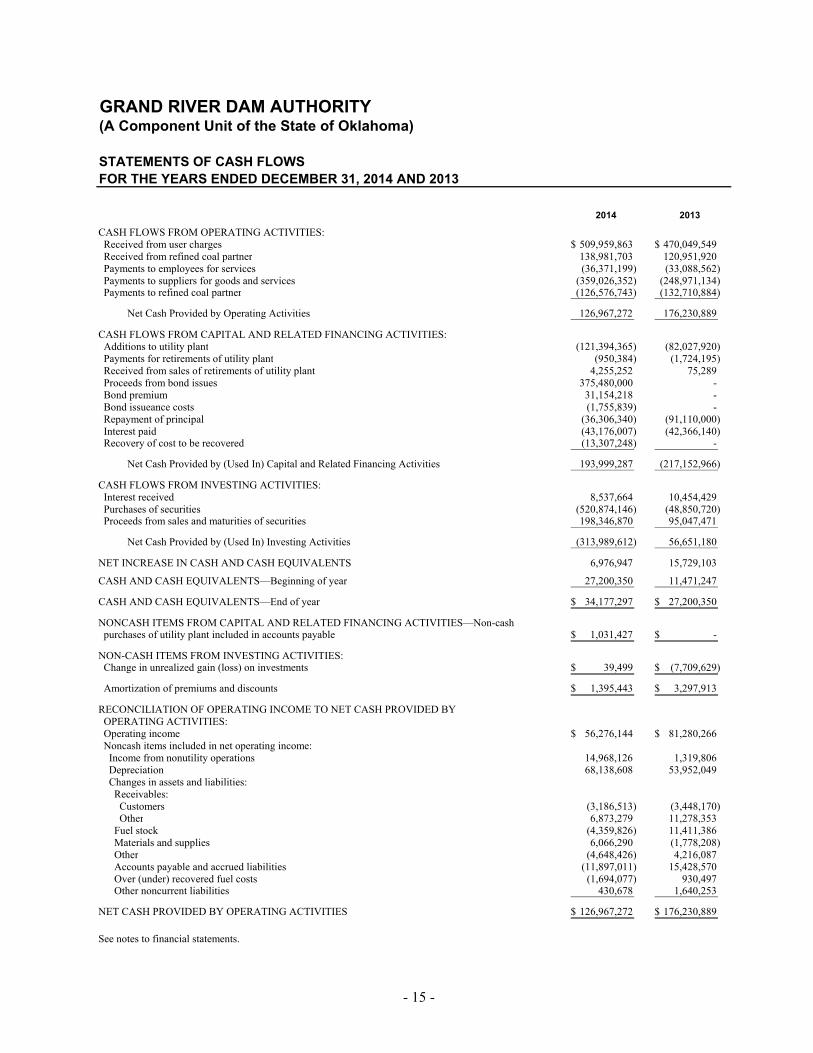
The Statements of Cash Flows report the cash provided and used by operating activities, as well as other cash sources, such as investment income or bond proceeds, and other cash uses, such as cash payments for repayment of bonds and capital additions.
The Notes to Financial Statements provide additional explanation and details about the financial information.
FINANCIAL HIGHLIGHTS The Authority today is in a more fundamentally sound financial position than the Authority of previous decades. This is primarily a result of the committed relationship it has developed with its customers, as evidenced by long-term power and sale contracts and mutual planning, as well as the equity in a diverse generation and transmission system supplying power and energy to those same customers. As a public power utility, the Authority works together with its customers to meet mutual needs. Although the Authority is a conservation and reclamation district for the State of Oklahoma, almost all of the operating revenues and expenses relate to the generation, transmission, and distribution of electricity.
The Authority today has a balanced generation portfolio of hydroelectricity, including pumped storage, coal, combined-cycle gas and wind purchases. GRDA’s standard contracts call for coordinated planning with our customers and provide revenue security that better matches the expected useful lives of the generation assets. The coordinated planning has resulted in GRDA and two of its customers being able to finance and begin construction of new generation plants. This generation will be greener as the percentage of reliance on coal generation diminishes, and more importantly, affordable.
The Authority, along with its peers in the Large Public Power Council and the American Public Power Association (APPA), are proactively at the tables where environmental and regulatory policies are being established.
GRDA is a member of the Southwest Power Pool (SPP) Regional Transmission Organization (RTO) and Regional Entity. On March 1, 2014, the SPP launched an integrated marketplace for its members which had the potential to significantly impact the financial operations of its members. GRDA’s 2014 bottom line was not negatively impacted from market participation.
The financial results discussed in the following paragraphs are a reflection of the fundamental improvements made by the GRDA Board, management, employees, and customers over the past few years. Today’s governance is policy driven and focused on safety, compliance, and risk mitigation.
Net PositionThe Net Position increased by $21.8 million or by 4% in 2014 after increasing by $39.7 million or 8% in 2013, reflecting a continued sales growth typical of the solid economies in the southern plains over the past few years. Total Assets increased by $367.1 million or 25% after decreasing by $33.5 million or 2.2% in 2013. The 2014 increase was almost entirely attributable to the deposit of $375.5 million of bond proceeds in a restricted construction account held by the Authority’s trustee. Noncurrent Liabilities increased by $383.1 million or by 49%, as a result of the same bond issuances in October and December 2014. A $31.2 million bond premium received at issuance in October 2014 and deposited in the construction account offset most of the cash paid from the debt service account to make the $36.3 million principal payment in July. In 2013, capital construction and procurement ramped up, resulting in additions to capital exceeding depreciation by $29.7 million or 4% of Net Utility Plant. Net Utility Plant increased by $50.9 million or by 6% in 2014. GRDA’s commitment to serve its customers into the future is being fulfilled through its capital program. The net 2014 capital investments are more significant in the context that the additions totaled $122.4 million, but were offset by over $68 million in depreciation expense and $26.4 million of plant retirement. The Authority utilized approximately $35.4 million and $43.0 million in current year revenues to pay for total capital additions in 2014 and 2013, respectively. The other $87 million of 2014 capital additions were paid through restricted construction accounts. Another $2.7 million of construction monies reimbursed 2013 capital projects originally paid with 2013 revenues. More detailed information about changes in Net Utility Plant is presented in Note 4 to Financial Statements, Utility Plant.
Current Assets decreased by $29.9 million or by 13% during 2014 after decreasing $15.5 million or by 6% during 2013. Importantly, $13 million in Costs to be Recovered from Future Revenues relating to accrued interest on the 2002B bonds were recovered in June 2014 when the final capital appreciation bonds matured. The Costs to be Recovered were included in Current Assets. Current Cash and Investments also decreased $14.1 million as Accounts Payable and Accrued Liabilities in Current Liabilities were paid down by $10.7 million.
Restricted Investments increased by $342.3 million or by 86% in 2014 after decreasing by $36.1 million or by 8% in 2013. As previously mentioned, the restricted construction accounts increased by the bond proceeds and bond issuance premium deposits, but decreased by approximately $92.3 million of payments for capital projects. The debt service reserve account was reduced by $44.2 million as the maximum aggregate debt service decreased. $13.7 million of the excess debt service reserve deposit was used to make principal payments during 2014, and the balance was
- 3 -

17GRDA Comprehensive Annual Financial Report 2014
2014 2013 2012 CONDENSED SCHEDULE OF NET POSITIONAssets: Current assets $ 209,580,470 $ 239,521,952 $ 255,025,040 Netutilityplant 876,027,323 825,045,007 795,320,230 Noncurrent investments 740,055,949 397,792,015 433,875,248 Other noncurrent assets 11,277,802 7,462,896 19,074,561
Total assets 1,836,941,544 1,469,821,870 1,503,295,079
Liabilities: Currentliabilities 79,863,026 117,596,459 142,613,484 Noncurrentliabilities 1,172,337,640 789,240,945 837,445,824
Totalliabilities 1,252,200,666 906,837,404 980,059,308
NetPosition: Netinvestmentincapitalassets 304,838,953 348,205,546 263,939,054 Restricted for: Debt service 17,705,259 33,526,719 56,886,806 Otherspecialpurposes 5,321,351 1,942,224 749,975 Unrestricted 256,875,315 179,309,977 201,659,936
Totalnetposition $ 584,740,878 $ 562,984,466 $ 523,235,771 CONDENSED SCHEDULE OF CHANGES IN NET POSITIONOperatingRevenues: Salesofpower $ 463,946,059 $ 416,591,647 $ 401,449,292 Otheroperatingrevenues 11,213,267 13,835,208 9,573,441 Totaloperatingrevenues 475,159,326 430,426,855 411,022,733
Non-OperatingRevenues: Investment income 7,454,283 7,121,138 12,120,926 Net increase (decrease) in fair value of investments 39,499 (7,709,629) (3,948,188) Incomefromnon-utilityoperations 14,968,126 1,319,806 1,471,833 Deferral of costs to be recovered from future revenues 698,009 1,640,965 1,560,409 OEM grant revenues - - 1,385,482
Totalnon-operatingrevenues 23,159,917 2,372,280 12,590,462
Total revenues 498,319,243 432,799,135 423,613,195
OperatingExpenses: Fuel (171,947,118) (170,624,193) (151,413,641) Purchasedpower-net (80,171,737) (32,091,910) (29,831,445) Depreciation (68,138,608) (53,952,049) (48,204,063) Operations (46,102,751) (41,766,524) (30,099,571) Maintenance (36,992,566) (34,350,768) (33,722,761) Administrativeandgeneral (15,530,402) (16,361,145) (27,120,506) Totaloperatingexpenses (418,883,182) (349,146,589) (320,391,987)
Non-OperatingExpenses: Interestexpense (42,802,762) (43,809,348) (49,034,263) Amortizationofdebtdiscountandexpense (2,824,504) (1,060,061) (1,435,153) Amortizationofbondpremium 1,254,865 965,558 1,255,649 Recovery of cost to be recovered (13,307,248) - - Totalnon-operatingexpenses (57,679,649) (43,903,851) (49,213,767)
Totalexpenses (476,562,831) (393,050,440) (369,605,754)
Netincreaseinnetposition $ 21,756,412 $ 39,748,695 $ 54,007,441
FINANCIAL HIGHLIGHTS - DECEMBER 31, 2014, 2013 AND 2012
Management’s Discussion And Analysis - Unaudited
- 4 -

18 GRDA Comprehensive Annual Financial Report 2014
Management’s Discussion And Analysis - Unaudited
Salina Pumped Storage ProjectGeneration (MWh)
Purchased Power(MWh)
Redbud Combined-CycleGeneration (MWh)
Pensacola Dam and Robert S. Kerr DamGeneration (MWh)
0
65,000
130,000
195,000
260,000
325,000
10 Year Avg
2012
2013
2014
DecNovOctSepAugJulJunMayAprMarFebJan0
65,000
130,000
195,000
260,000
325,000
10 Year Avg
2012
2013
2014
DecNovOctSepAugJulJunMayAprMarFebJan0
65,000
130,000
195,000
260,000
325,000
6 Year Avg
2012
2013
2014
DecNovOctSepAugJulJunMayAprMarFebJan0
65,000
130,000
195,000
260,000
325,000
10 Year Avg
2012
2013
2014
DecNovOctSepAugJulJunMayAprMarFebJan
unrestricted at year end. Additional information about the Restricted Investments is presented in Note 2 to Financial Statements, Deposits and Investments. Restricted Assets are discussed later in more detail in the Significant Assets and Debt Administration section.
Other Noncurrent Assets increased by $3.8 million or by 51% after decreasing by $11.6 million or by 61% in 2013. The 2013 decrease resulted from $11 million of Costs to be Recovered from Future Revenues being classified as Current Assets as of December 31, 2013. This is due to the 2002B debt maturing on June 1, 2014. The 2014 noncurrent asset increase relates to a $4.4 million prepayment for a hot-gas path upgrade project to be completed in 2018 at the Redbud combined-cycle gas plant. The cost is offset by the amortization of prepaid bond insurance. Prepaid bond issuance insurance was previously reported as Unamortized Debt Issuance Costs, but was reclassified as a prepaid asset during 2013, in accordance with the implementation of GASB 65.
Current Liabilities decreased by $37.7 million or by 32% after decreasing by $25 million or by 17% in 2013. The primary difference resulted from a $13.7 million decrease in accrued interest payable as a result of the capital appreciation bonds maturing on June 1, 2014. Additionally, decreases in 2014 and 2013, respectively, were related to decreases of $13.3 million and $54.8 million in the current portion of bonds payable, related to the June bond principal payments. Accounts payable and accrued liabilities also decreased by $10.7 million after increasing in 2013 by $15.4 million.
The Noncurrent Liabilities consist of the long-term obligations of bonds outstanding. Additional details about bonds outstanding are presented in Note 6 to Financial Statements, Bonds Payable.
Unrestricted Net Position (the part of net position used to finance day-to-day operations without constraints established by debt covenants, enabling legislation, or other legal agreements) increased by $77.6 million or by 43% in 2014 after decreasing by $22.3 million or by 11% in 2013. The 2013 decrease was because current revenues and the associated cash and investments funded approximately $43 million of capital improvements. In 2014, approximately $35 million of capital improvements were funded by current revenues. However, cash and investment balances and net position still rose significantly because principal payments declined by approximately $55 million. For the last few years, sizable debt principal payments have reduced the outstanding debt, thereby decreasing the Net Investment in Capital Assets. In 2013, Net Investment in Capital Assets increased by $84.3 million or by 32% as the Authority proceeded with its capital program. Although capital additions were higher in 2014, the $375.5 million bond issue offset the increases creating a $43.4 million or 12% decrease in 2014.
Net Position Restricted for Debt Service changed in proportion to the principal portion of sinking fund payments for repayment of long-term debt. Finally, the Net Position Restricted for Special Purposes increased for collateral for the SPP Integrated Marketplace. The Authority has a certificate of deposit backing a letter of credit to meet Federal Energy Regulatory Commission (FERC) mandated collateral requirements for SPP market participation. In 2015, the letter of credit is unsecured, so the certificate of deposit is no longer restricted.
OPERATING RESULTSThe Authority has owned and operated clean, renewable generation since the original construction of the Pensacola Dam in 1940. Additional hydroelectric generation was added in the 1960’s and 1970’s. In the 1980’s, coal-fired generation became the primary generation source. Few
changes were made to the generation resource mix until 2008, when the Authority jointly purchased Redbud, a gas-fired, combined-cycle generation plant. Wind purchase agreements supplement the owned resources. GRDA continues to focus on developing a greener generation portfolio with sufficient transmission and appropriate customer contracts to support the bonds, which finance the assets. The Authority’s heightened awareness on the future has not taken away from its attention to the present. It is the daily operation of GRDA’s current resources which drove 2014 operating results.
The operating and financial results for the Authority were positive in 2014. While good results were anticipated, there was still uncertainty going into the first year of the SPP Integrated Marketplace. The graphs, below and on the following page, which compare the monthly generation to the last ten years of generation have never had as much significance as they will over the next few years. While there are external factors that have caused some data points to be out of line, these graphs will provide a comparison of how our plants were historically dispatched by GRDA operators prior to March 1, 2014, to how SPP schedules the generation post-market implementation. In general, utilities which have a good match of generation with loads have performed better than utilities which have excess generation. The reason is natural gas prices have been low since the integrated market began, so gas units have been heavily dispatched and set the market price most of the time. If natural gas prices were to rise significantly, the next-day and real-time market prices would rise, and the dispatch priority of units in the SPP could shift to another fuel blend. GRDA strives to maintain a good match of generation to customer loads to mitigate price risk.
Water inflows will always dictate the level of generation reflected in the graph titled “Pensacola Dam and Robert S. Kerr Dam Generation.” These conventional hydro units have FERC issued licenses, with daily lake level rule curves, so they function much like run-of-the-river units. For decades, there was an inverse relationship between the generation at these two dams and the purchase of energy. The 10-year averages of generation of Pensacola and Kerr Dam include droughts in 2011 and 2012 across the summer and fall months, and can also be seen in the 2012 detail. As additional generation from coal and gas has been added to the resource portfolio, the correlation of reduced water inflow to increased purchase power has decreased. That can have a negative impact on customers’ fuel costs as purchased power tends to cost more during the summer peak when consumption is also higher.
- 5 -

19GRDA Comprehensive Annual Financial Report 2014
Management’s Discussion And Analysis - Unaudited
Salina Pumped Storage ProjectGeneration (MWh)
Purchased Power(MWh)
Redbud Combined-CycleGeneration (MWh)
Pensacola Dam and Robert S. Kerr DamGeneration (MWh)
0
65,000
130,000
195,000
260,000
325,000
10 Year Avg
2012
2013
2014
DecNovOctSepAugJulJunMayAprMarFebJan0
65,000
130,000
195,000
260,000
325,000
10 Year Avg
2012
2013
2014
DecNovOctSepAugJulJunMayAprMarFebJan0
65,000
130,000
195,000
260,000
325,000
6 Year Avg
2012
2013
2014
DecNovOctSepAugJulJunMayAprMarFebJan0
65,000
130,000
195,000
260,000
325,000
10 Year Avg
2012
2013
2014
DecNovOctSepAugJulJunMayAprMarFebJan
The “Purchased Power” graph also reflects recent trends in purchased power. Historical purchases, for the most part, were to supplement generation during the routine spring and fall outages at the Grand River Energy Center (GREC) and across the peak summer load period. With the below normal run-of-the-river generation in the summer and latter part of 2012, energy was purchased to meet the summer peak and the planned major maintenance five-year outage on GRDA 2 at the GREC which occurred in the fall of 2012. The graph also represents the normal purchase spike in the spring when the planned maintenance outage on GRDA 1 was scheduled. Since GRDA 1 is entirely owned by GRDA, it takes substantial energy to cover the loss of generation during the spring outages.
Natural gas prices, and therefore corresponding market prices, were higher than expected in late Winter/early Spring, driving up purchased power costs in 2014 as compared to 2013, and contributed to an extended period of under-collected Power Cost Adjustment (PCA). The negative connotation associated with purchased power was applicable because most purchased power costs more than energy generated by GRDA’s owned resources. In 2013, the Authority began capturing energy from wind out of the Canadian Hills Wind Project through a purchased power agreement. The energy is recorded as purchased power. The wind energy provides a good partial hedge against the potential of rising gas prices since additional wind energy can offset energy otherwise generated from higher priced generation resources. In addition, wind generation is good for Oklahoma’s environment and economy.
Finally, sales into the spot market have been less than 1% each of the past three years. Because the Authority is in an enviable position where it does not have to rely on significant spot sales revenues to meet its payment ob-ligations and debt coverages, it can take advantage of opportunities in the integrated marketplace if purchased power is lower than the cost to gen-erate energy with owned resources and pass the savings through to the customers in the PCA. In general, the SPP market’s incremental generation resource is gas based. If gas prices are approximately $3/MMBtu or lower, it is cheaper for GRDA to purchase than generate with coal, as it was dur-ing part of 2014 and much of the time subsequent to year end. However, the Authority, as well as many other utilities across the country, had issues with the railroads and delayed coal deliveries during the first half of 2014. As a result, the coal generation was curtailed to conserve coal-piles to meet customer’s peak loads. The 2014 generation curtailments are most notice-able in the graph titled “Coal-GRDA’s Share of Generation”.
GRDA purchased the Redbud combined-cycle gas plant in the fall of 2008 and relied on it primarily as a peaking and intermediate generator until gas prices fell in 2012. In that year, a new trend of base loading the gas plant began and since customer loads have grown to the point of matching the output of GRDA’s resources, it has continued to operate as a base load unit. As the graph titled “Redbud Combined-Cycle Generation” indicates, two of the four units were undergoing upgrades during March through June, but have been loaded consistently since returning to operation. Additionally, in 2013, customers’ consumption became the main driver of purchased power.
The role of the Salina Pumped Storage Project (SPSP) shifts over time. The graph labeled “Salina Pumped Storage Project Generation” reflects the trends in pumped-storage hydro generation. It has always played a significant role in reliability and regulation. What changes over time are the reversible pump/generators’ roles in economic dispatch. The generators provide the most value when there is a price difference between on-peak and off-peak power. No such difference has existed over the past few years as natural gas generation costs have been near coal-fired generation costs. Often, it has been more economical for the Authority to purchase energy from the market than it has been to pump at night and generate across the peak periods. However, the SPSP role in reliability and regulation is extremely valuable. Prior to the SPP Integrated Marketplace, the Authority utilized both SPSP and Redbud, supplemented with purchases, to meet customers’ load requirements. The Authority is continuing to evaluate the role of SPSP in the Integrated Marketplace, in particular how many
times it should be started and stopped versus the wear on the units to operate it with more frequency. It appears the ancillary services, especially the ability to regulate around wind, are valuable to SPP.
GRDA’s capital program includes the construction of a nominal 495 MW combined-cycle gas unit, GRDA 3. It is under construction and expected to be producing power on or before mid-May 2017. To comply with Environmental Protection Agency (EPA) air quality standards prior to April 16, 2016, environmental upgrades to GRDA 2 are in progress and will be substantially completed during the Fall 2015 outage. The Authority filed a request with EPA in February 2015 for a one-year extension for compliance with the Mercury and Air Toxics Standards (MATS) Rule for GRDA 1. The extension is needed to ensure GRDA can meet SPP capacity reserve margins until GRDA 3 is operational.
The graphs titled “2013 and 2014 Energy Resources and Usage” indicate the extent that GRDA relies on coal and gas generation to meet the customers’ load needs throughout the year. More importantly, they demonstrate how hydro inflows no longer influence purchased power; customer demands and the SPP markets do. The availability of adequate generation,
Coal - GRDA’s ShareGeneration (MWh)
100,000
200,000
300,000
400,000
500,000
10 Year Avg
2012
2013
2014
DecNovOctSepAugJulJunMayAprMarFebJan
-6 -

20 GRDA Comprehensive Annual Financial Report 2014
along with a reliable transmission system and firm customer contracts, ultimately drive the operating and financial results. The graphs provide a visual presentation of GRDA’s efficient and diversified resources available to support its long-term wholesale contracts.
OPERATING INCOMEOperating Income decreased $25.0 million or by 30% in 2014 after decreasing by $9.4 million or by 10% in 2013. Operating Revenues increased $44.7 million or by 10% in 2014 after increasing $19.4 million or by 5% in 2013. Additionally, Other Nonoperating Revenues increased $20.8 million mainly due to two large projects for which the Authority has received contributions in aid of construction. Other Operating Revenues also include base transmission plant costs recovered through the SPP’s administration of the transmission tariffs. Operating Revenues include Sales of Power which have shown steady increases in industrial and off-system customer growth.
Operating Expenses increased $69.7 million or by 20% in 2014 and $28.8 million or by 9% in 2013. Fuel costs were the big expense driver for the last few years, but Purchased Power and Depreciation were the big drivers in 2014. Fuel costs accounted for $19.2 million of the 2013 year increase in Operating Expenses, but only increased $1.3 million in 2014. The smaller fuel increase makes sense based on the coal curtailments and lower gas prices. It also explains the $48.1 million increase in Purchased Power in 2014 as the energy to replace the coal generation had to be purchased and additional purchases were required for customers’ growing loads. Depreciation expense was the other significant driver of the increase in Operating Expenses and accounted for another $5.7 million in 2013 and $14.2 million in 2014.
The graph labeled “Operating Income” indicates both operating revenues and operating expenses, and the difference in the column height reflects operating income. Operating Revenues are combined with other Nonoperating Revenues, primarily interest and investment income to pay the Authority’s expenses. In 2014, Other Nonoperating Revenues also included $12.7 million Contributions in Aid of Construction. As can be seen in the “Change in Net
Position” graph to the right of the “Operating Income” graph, revenues have consistently exceeded expenses. Although 2012 was anticipated to be a tough year financially because of the major, planned coal-fired plant outage combined with the last calendar year of higher debt payments, contracted sales continued to grow, and the financial results continued on the positive trend. Even though GRDA implemented a base rate decrease effective July 1, 2013, the growth in off-system firm sales provided the operating revenues which contributed to the change to net position. The third graph, labeled “Revenue Sources, Payment Types,” shows the extent to which Sales of Power, which includes the revenue sources labeled “Power Sales” and the “PCA Surcharge,” provide the majority of money to repay GRDA’s debt and cover operating costs.
While the first two graphs reflect the income statement amounts, the third graph includes the debt payments, principal and interest recovered through the Authority’s rates. GRDA’s rate structure is based on a cost-of-service approach of which fuel and purchased power, debt service and other operating expenses are the principal components. The difference in the column heights of the third graph reflects the source of funds, other than bond proceeds, reinvested in the system. The sources and uses of funds, which is not included in the basic financial statements, is further shown in a table calculating Debt Service coverage included in the Statistical Section of the Authority’s Comprehensive Annual Financial Report each year. The graphs also reflect a key shift in the cost structure as debt becomes a smaller component of GRDA’s annual revenue requirements and fuel and purchased power become larger components.
OPERATING REVENUESOperating Revenues increased $44.7 million or by 10% in 2014 after increasing $19.4 million or by 5% in 2013. The increases were driven primarily because Sales of Power increased $47.4 million or by 11% in 2014 after increasing $15.1 million or by 4% in 2013. The customer sales increases are remarkable since the Board passed base rate decreases effective July 1, 2013, meaning they were in effect for half of 2013 and all of 2014. Customer sales increases continue to be led by growth in each customer category except for spot sales. The increased
Management’s Discussion And Analysis - Unaudited
2014 Energy Resources (MWh) 2014 Energy Usage (MWh)
0
100,000
200,000
300,000
400,000
500,000
600,000
700,000
800,000
900,000
Pumping Energy
Spot
Other
Off-System Firm
Cooperative
Industrial
Municipal
DecNovOctSepAugJulJunMayAprMarFebJan
SPA Allocations
Purchased Power
Wind
Pumped Storage Hydro
Run-of-River Hydro
Gas
Coal
DecNovOctSepAugJulJunMayAprMarFebJan
2013 and 2014 Energy Resources and Usage
2013 Energy Resources (MWh) 2013 Energy Usage (MWh)
0
100,000
200,000
300,000
400,000
500,000
600,000
700,000
800,000
900,000
Pumping Energy
Spot
Other
Off-System Firm
Cooperative
Industrial
Municipal
DecNovOctSepAugJulJunMayAprMarFebJan
SPA Allocations
Purchased Power
Wind
Pumped Storage Hydro
Run-of-River Hydro
Gas
Coal
DecNovOctSepAugJulJunMayAprMarFebJan
- 7 -

21GRDA Comprehensive Annual Financial Report 2014
obligations or agreements made with the holder of such bonds and/or with any person on behalf of such holder. The Authority agreed with customers to not adopt or charge excess rates and to ensure Rate Schedules will be applied to all customers served under the same Rate Schedules at the same service level in a reasonable and not unduly discriminatory manner.
The customer contracts provide for customers and the Authority to work together to prepare a 10-year forecast. The Authority is to establish a rate stabilization fund for any unrestricted cash balances in excess of the greater of $150 million or six months operating expenses, as determined by
Power Sales
PCA Surcharge
Investment
Transmission
FEMA Grant
Lake Fees, Rents, Emissions, Water Sales, Other
Nonoperating Revenues
Operating Revenues
Operating Income(thousands)
Change In Net Position(thousands)
Revenue Sources, Payment Types(thousands)
OPERATING EXPENSES:
TOTAL REVENUES:
TOTAL EXPENSES:
OPERATING REVENUES:
REVENUE SOURCES:PAYMENT TYPES:
Depreciation
Operation, Maintenance & Administration
Fuel & Purchased Power
201420132012201120100
100,000
200,000
300,000
400,000
$500,000
Recovery of Cost to be Recovered
Interest & Amortizations
Operating Expenses
201420132012201120100
100,000
200,000
300,000
400,000
$500,000
Bond Payments
Operation, Maintenance & Administration
Purchased Power
Fuel
20142013201220112010
Operating Revenues
sales and recovery of fuel costs more than offset the decreases caused by the lower rates. Even with the collection of the fuel surcharges, the Authority’s contract rates remain competitive within the region. The graph titled “Average Customer Rates” compares customer rates before and after the PCA surcharge. Stillwater and Coffeyville led the growth in the municipal customer category. Western Farmers Electric Cooperative (WFEC) demonstrated an increase in energy, and Paragould increased capacity in the off-system firm category. Google and Pryor Chemical led the growth in the industrial category, and Northeast Electric Cooperative increased both capacity and energy in 2014. The growth is significant since the Summer of 2014 had few high temperature days as compared to normal.
The trend in customer sales by category can be seen in the graph titled “Sales and Resources.” The graph also compares GRDA’s customer sales mix and generation resources over the past five years. The additional off-system sales of the last few years reflect expanded relationships with WFEC and Oklahoma Municipal Power Authority (OMPA). As a result, through wholesale contracts, directly or indirectly, GRDA electricity reaches some portion of 75 of Oklahoma’s 77 counties.
The Authority is empowered to set rates as necessary to provide for operating expenses and debt service payments. When deemed necessary by the Board of Directors, rates can be raised 60 days after Board approval. By statute, the Authority is a self-regulated entity, and its rates do not come under the jurisdiction of the Oklahoma Corporation Commission. The rates charged by the Authority for the sale of electric power and energy are not currently regulated by FERC or by any other state or Federal authority, although the Authority participates in the SPP regional transmission tariffs.
Oklahoma law requires the Authority to maintain rates which are sufficient to produce adequate revenues to fulfill the obligations of the Authority. These obligations are to pay all maintenance and operation expenses, interest and principal of all bonds, sinking fund and/or reserve fund payments agreed to be made in respect of any such bonds, and any other
Management’s Discussion And Analysis - Unaudited
0
1,000
2,000
3,000
4,000
5,000
6,000
7,000
8,000
9,000
Purchased Power
Wind
Hydro
Gas
Coal-Fired/Thermal
20142013201220112010
Pumping Energy
Spot Sales
Off-System Firm
Industrial
Cooperative
Municipal
Other (OMPA)
20142013201220112010
Sales and Resources (thousand MWh)
- 8 -
22 GRDA Comprehensive Annual Financial Report 2014
Management’s Discussion And Analysis - Unaudited
Cost of Fuel Burned(dollars per million Btu)
Cost of Fuel Burned(dollars per MWh)
0
1
2
3
4
$ 5
HandlingCoal & Freight
20142013201220112010
Steam and CombinedCycle Generation(thousand MWh)
0
1,000
2,000
3,000
4,000
5,000
6,000
Combined CycleCoal-Fired
201420132012201120100
5
10
15
20
25
30
$ 35
Combined CycleCoal-Fired
20142013201220112010
Gas
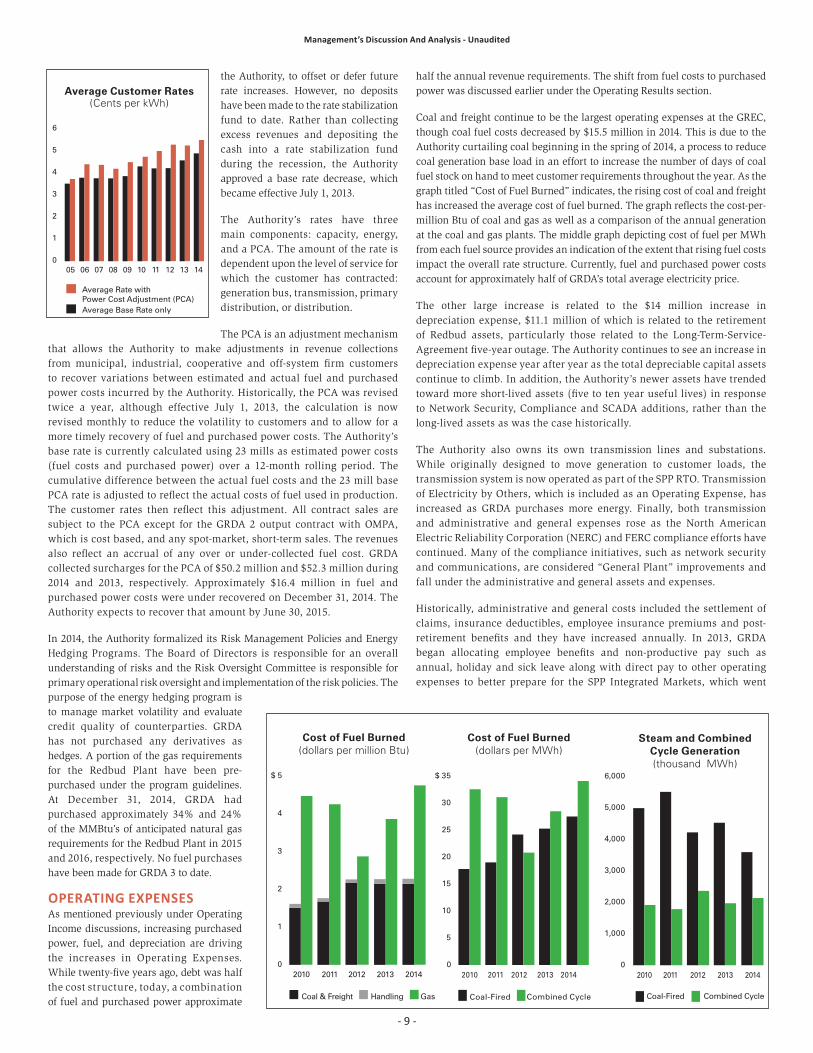
half the annual revenue requirements. The shift from fuel costs to purchased power was discussed earlier under the Operating Results section.
Coal and freight continue to be the largest operating expenses at the GREC, though coal fuel costs decreased by $15.5 million in 2014. This is due to the Authority curtailing coal beginning in the spring of 2014, a process to reduce coal generation base load in an effort to increase the number of days of coal fuel stock on hand to meet customer requirements throughout the year. As the graph titled “Cost of Fuel Burned” indicates, the rising cost of coal and freight has increased the average cost of fuel burned. The graph reflects the cost-per-million Btu of coal and gas as well as a comparison of the annual generation at the coal and gas plants. The middle graph depicting cost of fuel per MWh from each fuel source provides an indication of the extent that rising fuel costs impact the overall rate structure. Currently, fuel and purchased power costs account for approximately half of GRDA’s total average electricity price.
The other large increase is related to the $14 million increase in depreciation expense, $11.1 million of which is related to the retirement of Redbud assets, particularly those related to the Long-Term-Service-Agreement five-year outage. The Authority continues to see an increase in depreciation expense year after year as the total depreciable capital assets continue to climb. In addition, the Authority’s newer assets have trended toward more short-lived assets (five to ten year useful lives) in response to Network Security, Compliance and SCADA additions, rather than the long-lived assets as was the case historically.
The Authority also owns its own transmission lines and substations. While originally designed to move generation to customer loads, the transmission system is now operated as part of the SPP RTO. Transmission of Electricity by Others, which is included as an Operating Expense, has increased as GRDA purchases more energy. Finally, both transmission and administrative and general expenses rose as the North American Electric Reliability Corporation (NERC) and FERC compliance efforts have continued. Many of the compliance initiatives, such as network security and communications, are considered “General Plant” improvements and fall under the administrative and general assets and expenses.
Historically, administrative and general costs included the settlement of claims, insurance deductibles, employee insurance premiums and post-retirement benefits and they have increased annually. In 2013, GRDA began allocating employee benefits and non-productive pay such as annual, holiday and sick leave along with direct pay to other operating expenses to better prepare for the SPP Integrated Markets, which went
Average Customer Rates(Cents per kWh)
0
1
2
3
4
5
6
Average Rate with Power Cost Adjustment (PCA)Average Base Rate only
14131211100908070605
- 9 -
the Authority, to offset or defer future rate increases. However, no deposits have been made to the rate stabilization fund to date. Rather than collecting excess revenues and depositing the cash into a rate stabilization fund during the recession, the Authority approved a base rate decrease, which became effective July 1, 2013.
The Authority’s rates have three main components: capacity, energy, and a PCA. The amount of the rate is dependent upon the level of service for which the customer has contracted: generation bus, transmission, primary distribution, or distribution.
The PCA is an adjustment mechanism that allows the Authority to make adjustments in revenue collections from municipal, industrial, cooperative and off-system firm customers to recover variations between estimated and actual fuel and purchased power costs incurred by the Authority. Historically, the PCA was revised twice a year, although effective July 1, 2013, the calculation is now revised monthly to reduce the volatility to customers and to allow for a more timely recovery of fuel and purchased power costs. The Authority’s base rate is currently calculated using 23 mills as estimated power costs (fuel costs and purchased power) over a 12-month rolling period. The cumulative difference between the actual fuel costs and the 23 mill base PCA rate is adjusted to reflect the actual costs of fuel used in production. The customer rates then reflect this adjustment. All contract sales are subject to the PCA except for the GRDA 2 output contract with OMPA, which is cost based, and any spot-market, short-term sales. The revenues also reflect an accrual of any over or under-collected fuel cost. GRDA collected surcharges for the PCA of $50.2 million and $52.3 million during 2014 and 2013, respectively. Approximately $16.4 million in fuel and purchased power costs were under recovered on December 31, 2014. The Authority expects to recover that amount by June 30, 2015.
In 2014, the Authority formalized its Risk Management Policies and Energy Hedging Programs. The Board of Directors is responsible for an overall understanding of risks and the Risk Oversight Committee is responsible for primary operational risk oversight and implementation of the risk policies. The purpose of the energy hedging program is to manage market volatility and evaluate credit quality of counterparties. GRDA has not purchased any derivatives as hedges. A portion of the gas requirements for the Redbud Plant have been pre-purchased under the program guidelines. At December 31, 2014, GRDA had purchased approximately 34% and 24% of the MMBtu’s of anticipated natural gas requirements for the Redbud Plant in 2015 and 2016, respectively. No fuel purchases have been made for GRDA 3 to date.
OPERATING EXPENSES As mentioned previously under Operating Income discussions, increasing purchased power, fuel, and depreciation are driving the increases in Operating Expenses. While twenty-five years ago, debt was half the cost structure, today, a combination of fuel and purchased power approximate

23GRDA Comprehensive Annual Financial Report 2014
Management’s Discussion And Analysis - Unaudited
live March 1, 2014. The allocations allow GRDA to better identify the functional expenses for each generating and transmission facility.
SIGNIFICANT ASSETS AND DEBT ADMINISTRATIONCapital Assets In October 2014, GRDA went to the financial market with a capital plan that totaled just over a billion dollars. It included known capital projects from 2014 through 2023. Major construction projects listed in that forecast included environmental upgrades to GRDA 2, construction of a nominal 495 MW combined-cycle electric generation plant (GRDA 3), improvements to the transmission system and rewind of the generator-stators at the Salina Pumped Storage, as well as other smaller construction projects throughout the electric system. The projects are expected to be funded by a combination of bond proceeds, construction funds on hand, equity and current-year revenues. The diversity of the generation portfolio, which includes renewable hydro generation and adds wind energy purchase agreements, is paramount to the operational flexibility to dispatch the generation in the most economical and reliable manner. The financing of this plan was completed in October and December 2014, with the issuance of revenue bonds.
Until 2013, the payment source for the majority of the capital additions came from the construction accounts funded by the 2008 and 2010 bond issues. The 2008 and 2010 construction account projects were reprioritized, and the money in the accounts will be utilized to pay for the capital plan. Finally, because of the reduced debt payment requirements, GRDA used the additional revenues to pay for many of the capital additions. In 2014 and 2013, GRDA paid for approximately $35.4 and $43 million, respectively, in capital additions from current revenues.
Over the last several years, there has been significant investment to upgrade the generators at Kerr Dam. Additional lines and substations continue to be added or upgraded to handle the loads of new and growing customers. During the last quarter of 2013 and from March until June of 2014, significant capital improvements began for Redbud, including work related to advanced hot-gas path upgrades and the capital portion related to long term service agreement outages. Since the gas plant has run more, the milestone preventive maintenance service levels have been triggered. This has also resulted in significant retirements at the Redbud combined-cycle plant as assets installed under previous long-term service agreement work were retired. Other significant capital additions are related to the engineering and site preparation for the construction of GRDA 3 as well as the air quality control upgrades of GRDA 2.
As shown in the Utility Plant Note 4 to Financial Statements, the majority of Net Utility Plant consists of an economical mixture of renewable hydroelectric, coal and natural gas generation resources and a transmission system for the delivery of power and energy. The pie chart reflects the fuel sources of GRDA’s 2014 generation capacity. GRDA supplements the capital generation assets with capacity purchases from municipal customers Coffeyville, Cushing and Stillwater, which own generation. GRDA has amended its contracts with Coffeyville and Stillwater to allow them to replace older steam generators with high efficient reciprocating engine natural gas powered plants. While the access to customer-owned generation has enhanced generation and transmission reliability by providing GRDA access
RENEWABLE GENERATION:
Generation Capacity
Thermal-Coal
Combined-Cycle Gas
Wind Purchase
Pumped-Storage Hydro
Run-of-River Hydro
Generation
to emergency generation should the need arise, the new generators will also provide more affordability, efficiency, and operating flexibility. Additionally, the Authority added 48 MWs of wind generation through a purchased power agreement, which produced the first output in November 2012. Three other wind contracts have been signed to provide 335 MWs of energy beginning in the years 2015 and 2016.
As mentioned in Note 4, KAMO owns a share of GRDA 2. Associated Electric Cooperative (AECI) is KAMO’s power supplier and receives KAMO’s portion of the power output from GRDA 2. KAMO and GRDA also operate an integrated transmission system to provide power and energy to wholesale distribution cooperatives and municipalities. KAMO and AECI solicited proposals to identify parties who might want to purchase KAMO’s share of GRDA 2. Additionally, GRDA and KAMO are exploring amendments to the integrated transmission system agreement and the agreement between GRDA and KAMO that governs GRDA 2. Additional bond issues would not be necessary to implement the changes being explored.
Restricted AssetsThe Authority’s bond resolutions require Debt Service Reserve Funds (DSRF) be set aside. The General Bond Resolution No. 5107 requires the Debt Service Reserve account be equal to the “Maximum Aggregate Debt Service.” Upon issuance of the 2014 Series C bonds, the Debt Service Reserve requirement was calculated to be $87.8 million. The calculation included an assumed interest rate of 22 basis points for the reserve calculation based on the resolution requirement that the rate not be less than the smaller of the average One-Month LIBOR Rate during the 12 full calendar months or during the 60 full calendar months immediately preceding the Closing Date of the bond issue transaction. For 2015 budgeting purposes, a more conservative interest rate, of 3.25% was used for modeling revenue requirements for debt service.
The Authority keeps an excess in restricted accounts to compensate for any unforeseen market value fluctuations of investments in the account. As of December 31, 2014, the requirement in the debt service reserve account was $87.8 million and included an excess deposit of $0.7 million. As discussed further in the Note 2 to Financial Statements, any excess balance in the Debt Service Reserve account is reflected as a restricted asset because bond proceeds were used to initially fund the account and carry associated restrictions on how the funds can be used. As the outstanding bonds have been maturing over the past few years, the annual debt requirements as well as the maximum aggregate debt service have declined. That has created excess deposits in the Debt Service Reserve account above the safety threshold. Excess debt service reserve deposits have been used to make bond principal payments. GRDA used excess DSRF account deposits to pay principal sinking fund payments of $13.7 million and $7.5 million in 2014 and 2013, respectively. Additionally, in conjunction with the 2014 Series A and B bond transaction in October 2014, $29.8 million of excess was transferred to unrestricted cash and investment accounts, and $3.3 million was transferred to the 2014 construction account.
Additional amounts are restricted for the bond service sinking fund payments made to the trustee for annual principal and semiannual interest payments. Sinking fund payments are made to the trustee to better manage cash flows and normally equal GRDA’s annual debt service coverage (DSC) requirement. According to the General Bond Resolution 5107, the Authority’s DSC is calculated as if both principal and interest were both accrued daily in equal amounts over the calendar year. The bond service accounts held by the trustee normally approach a nominal zero balance on June 1 of each year as semi-annual interest and annual principal payments are paid to the bondholders. In most years, at December 31st, the accounts hold seven months of principal sinking fund payments, for the months of June through December, and only one month of interest for the month of December.
The Authority currently has four construction accounts. At the end of 2014 and 2013 respectively, $12.2 and $50.3 million of the $518.2 million deposit from the 2008 bond proceeds remained in the 2008 construction account.
- 10 -
24 GRDA Comprehensive Annual Financial Report 2014
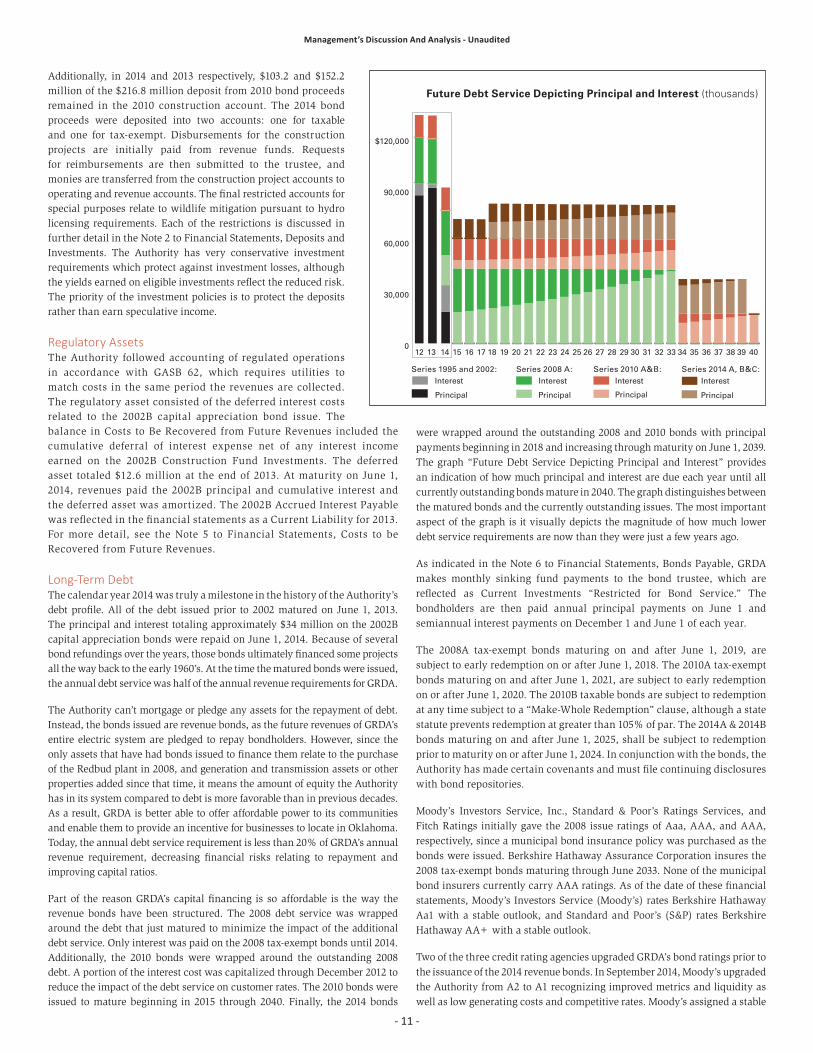
were wrapped around the outstanding 2008 and 2010 bonds with principal payments beginning in 2018 and increasing through maturity on June 1, 2039. The graph “Future Debt Service Depicting Principal and Interest” provides an indication of how much principal and interest are due each year until all currently outstanding bonds mature in 2040. The graph distinguishes between the matured bonds and the currently outstanding issues. The most important aspect of the graph is it visually depicts the magnitude of how much lower debt service requirements are now than they were just a few years ago.
As indicated in the Note 6 to Financial Statements, Bonds Payable, GRDA makes monthly sinking fund payments to the bond trustee, which are reflected as Current Investments “Restricted for Bond Service.” The bondholders are then paid annual principal payments on June 1 and semiannual interest payments on December 1 and June 1 of each year.
The 2008A tax-exempt bonds maturing on and after June 1, 2019, are subject to early redemption on or after June 1, 2018. The 2010A tax-exempt bonds maturing on and after June 1, 2021, are subject to early redemption on or after June 1, 2020. The 2010B taxable bonds are subject to redemption at any time subject to a “Make-Whole Redemption” clause, although a state statute prevents redemption at greater than 105% of par. The 2014A & 2014B bonds maturing on and after June 1, 2025, shall be subject to redemption prior to maturity on or after June 1, 2024. In conjunction with the bonds, the Authority has made certain covenants and must file continuing disclosures with bond repositories.
Moody’s Investors Service, Inc., Standard & Poor’s Ratings Services, and Fitch Ratings initially gave the 2008 issue ratings of Aaa, AAA, and AAA, respectively, since a municipal bond insurance policy was purchased as the bonds were issued. Berkshire Hathaway Assurance Corporation insures the 2008 tax-exempt bonds maturing through June 2033. None of the municipal bond insurers currently carry AAA ratings. As of the date of these financial statements, Moody’s Investors Service (Moody’s) rates Berkshire Hathaway Aa1 with a stable outlook, and Standard and Poor’s (S&P) rates Berkshire Hathaway AA+ with a stable outlook.
Two of the three credit rating agencies upgraded GRDA’s bond ratings prior to the issuance of the 2014 revenue bonds. In September 2014, Moody’s upgraded the Authority from A2 to A1 recognizing improved metrics and liquidity as well as low generating costs and competitive rates. Moody’s assigned a stable
Additionally, in 2014 and 2013 respectively, $103.2 and $152.2 million of the $216.8 million deposit from 2010 bond proceeds remained in the 2010 construction account. The 2014 bond proceeds were deposited into two accounts: one for taxable and one for tax-exempt. Disbursements for the construction projects are initially paid from revenue funds. Requests for reimbursements are then submitted to the trustee, and monies are transferred from the construction project accounts to operating and revenue accounts. The final restricted accounts for special purposes relate to wildlife mitigation pursuant to hydro licensing requirements. Each of the restrictions is discussed in further detail in the Note 2 to Financial Statements, Deposits and Investments. The Authority has very conservative investment requirements which protect against investment losses, although the yields earned on eligible investments reflect the reduced risk. The priority of the investment policies is to protect the deposits rather than earn speculative income.
Regulatory AssetsThe Authority followed accounting of regulated operations in accordance with GASB 62, which requires utilities to match costs in the same period the revenues are collected. The regulatory asset consisted of the deferred interest costs related to the 2002B capital appreciation bond issue. The balance in Costs to Be Recovered from Future Revenues included the cumulative deferral of interest expense net of any interest income earned on the 2002B Construction Fund Investments. The deferred asset totaled $12.6 million at the end of 2013. At maturity on June 1, 2014, revenues paid the 2002B principal and cumulative interest and the deferred asset was amortized. The 2002B Accrued Interest Payable was reflected in the financial statements as a Current Liability for 2013. For more detail, see the Note 5 to Financial Statements, Costs to be Recovered from Future Revenues.
Long-Term DebtThe calendar year 2014 was truly a milestone in the history of the Authority’s debt profile. All of the debt issued prior to 2002 matured on June 1, 2013. The principal and interest totaling approximately $34 million on the 2002B capital appreciation bonds were repaid on June 1, 2014. Because of several bond refundings over the years, those bonds ultimately financed some projects all the way back to the early 1960’s. At the time the matured bonds were issued, the annual debt service was half of the annual revenue requirements for GRDA.
The Authority can’t mortgage or pledge any assets for the repayment of debt. Instead, the bonds issued are revenue bonds, as the future revenues of GRDA’s entire electric system are pledged to repay bondholders. However, since the only assets that have had bonds issued to finance them relate to the purchase of the Redbud plant in 2008, and generation and transmission assets or other properties added since that time, it means the amount of equity the Authority has in its system compared to debt is more favorable than in previous decades. As a result, GRDA is better able to offer affordable power to its communities and enable them to provide an incentive for businesses to locate in Oklahoma. Today, the annual debt service requirement is less than 20% of GRDA’s annual revenue requirement, decreasing financial risks relating to repayment and improving capital ratios.
Part of the reason GRDA’s capital financing is so affordable is the way the revenue bonds have been structured. The 2008 debt service was wrapped around the debt that just matured to minimize the impact of the additional debt service. Only interest was paid on the 2008 tax-exempt bonds until 2014. Additionally, the 2010 bonds were wrapped around the outstanding 2008 debt. A portion of the interest cost was capitalized through December 2012 to reduce the impact of the debt service on customer rates. The 2010 bonds were issued to mature beginning in 2015 through 2040. Finally, the 2014 bonds
Management’s Discussion And Analysis - Unaudited
Future Debt Service Depicting Principal and Interest (thousands)
Series 1995 and 2002: Series 2008 A: Series 2010 A&B: Series 2014 A, B&C:
0
30,000
60,000
90,000
$120,000
Interest
Principal
Interest
Principal
Interest
Principal
Interest
Principal
4039383736353433323130292827262524232221201918171615141312
- 11 -

25GRDA Comprehensive Annual Financial Report 2014
outlook. S&P also raised GRDA’s rating from A to A+ in September 2014 with a stable outlook mentioning the following factors expected to maintain stronger credit metrics: lower debt service; management’s risk practices; ability to set rates; strong unrestricted liquidity; securing revenues to finance the capital program; generation plan; customer contracts; and fuel diversity. While Fitch Ratings kept GRDA’s rating at A, they did raise the outlook to positive from stable and had some favorable feedback about the power supply plan and associated financing costs, as well as noting low customer rates and improving financial metrics.
As previously mentioned, the Authority also presented a billion dollar capital plan to meet customers’ future requirements. In October 2014, $225.6 million Series A tax-exempt revenue bonds, and $84.8 million Series B federally taxable revenue bonds were issued to fund part of that capital plan. In December 2014, $65 million Series C federally taxable, variable rate, revenue bonds were issued to fund the remainder of projected needs through 2017. Under the plan, $409.4 million of bond proceeds would be required to fund the $1.03 billion of project needs through 2023. As previously discussed, the remaining funding sources are provided by equity, current revenues, and other construction funds.
The Authority has engaged Public Financial Management (PFM) to represent it as financial advisor to meet current and long-term operations and capital financing needs and render assistance with respect to debt transactions. PFM is acting as the Authority’s Independent Municipal Advisor, as defined by the U.S. Securities Exchange Commission in connection with all general capital markets activity. PFM is providing general advisory services as well as serving as financial advisor to three potential debt transactions over the next three years.
CHANGE IN FINANCIAL POSITIONAs 2014 began, the Authority had just reached some major financial milestones. The Authority’s financial metrics had improved significantly. While liquidity had always been good, debt service coverage improved significantly as older debt matured. At the same time, the Authority improved the revenue stream and worked to control risks, as well as secured the internal infrastructure. While risks with large financial impacts were prioritized and tackled first, risks such as the revenue stream, flooding mitigation, fuel supply, optimizing adequacy of generation supply with contracted customer loads, reliable transmission, and compliance and safety were also at the forefront. Supporting the improved financial position were numerous, formally adopted policies and procedures. A goal driven, customer-focused utility with sustainable policies has emerged. GRDA’s Board of Directors is ensuring its success continues and its plan is implemented efficiently and effectively.
The Authority’s generation assets are still supplying output to power the Authority’s public power partners, and on June 1, 2014, all the debt for assets financed prior to the 2008 bond issue were repaid. In October 2014, GRDA celebrated the 50th year of the operation of Kerr Dam. The Authority recently celebrated its 75th Birthday, with accolades over how it has shaped the landscape and economy of Oklahoma. The last few years were filled with philosophical questions regarding the role this state agency should play in the future. While GRDA has not been growing our service area, the economic benefits we provide to our customers enables them to grow, and they exemplify that value. At the same time, the Authority is the Grand River Dam Authority, a conservation and reclamation district, and takes its environmental and water quality responsibilities seriously.
GRDA’s generation plan was solidified with the support of the state of Oklahoma after the overwhelming factual information was provided by GRDA’s strongest advocates, its customers. Those same customers provided financial security by signing long-term contracts enabling better future load projections. Long-term revenue projections also became more stable as many of the all-requirements contracts with municipal customers run two years longer than any outstanding debt. Additionally, expanded relationships with WFEC increased firm sales and added diversification
throughout the state of Oklahoma. Consistent with other off-system firm sales, these contracts provide certain take-or-pay provisions.
As noted in the preceding Long-Term Debt section, the rating agencies also recognized the benefits provided by the revenue security and the “Grand & Greener” generation plan. Two of the three agencies upgraded GRDA’s rating, and the third upgraded the outlook on its debt from stable to positive. GRDA ended the year with what might be the highest debt coverage in its history with over a two times coverage.
The result of those positive outcomes was GRDA was able to issue $375.5 million dollars of revenue bonds in October and December at interest rates much less than the Authority had anticipated during the planning phases of the projects. The all-in total interest cost for the Series A&B Issues was 3.67%. The total cost, including interest, backup liquidity facility, and remarketing fees, of the Series C issue has averaged 0.60% since issuance in December.
ECONOMIC OUTLOOK GRDA’s rates are competitive, and 10-year financial projections indicate they will remain that way. Most major construction contracts have been awarded, and the contract commitments fall within the financial projections and financial budgets. For the last few years, internal projections, which have been shared with customers, included base rate increases of up to 7% in 2016. The engineering firm of C.H. Guernsey has been retained to review the rate structures, and it appears the 2016 rate increase might be closer to 5% because of the reduced uncertainty with construction contracting and lower than anticipated borrowing costs. The rates will allow capital additions to be paid with a combination of revenues and debt-funded construction funds. Fuel and Purchased Power costs flow through the rolling 12-month PCA surcharge. As a result, financial metrics over the next 10 years are anticipated to continue to improve primarily because debt service requirements are currently lower than in previous years.
As the Integrated Marketplace and technology impacts what end users expect from their electricity providers, it will be important for the Authority and its customers to continue to work together to educate those end users regarding the connection between efficiency and affordability. The Authority is able to add GRDA 3 without a negative impact to the rate structure because the timing came when the older debt was paid off. The longer construction of the next base load generating unit can be delayed by the smarter use of energy and demand by end users, the larger the benefit will be to Oklahoma’s economies and their environment.
GRDA has positioned itself to do for the next several decades what it has been proudly doing for the past 75 years. We protect the waters of the Grand River and the environments associated with it. We use Oklahoma’s natural water and wind resources to generate electricity. We meet customers’ needs and environmental mandates with new generation like the combined-cycle gas plant under construction now that is projected to be the most efficient plant of this type in the Western Hemisphere when it is completed. We also invested in upgrades to Unit 2 coal-fired plant to ensure it meets environmental standards. The diversity in GRDA’s generation plants allows us to manage risk well, and the system is backed by a robust transmission system. We have a favorable economic outlook because our electric system profile has low-debt costs, strong customer support, and continued mutual resource planning.
MANAGEMENT’S DISCUSSION AND ANALYSISThis report is intended to provide our customers, bondholders, citizens of the state of Oklahoma, and other interested parties with a general overview of GRDA’s financial position, results of operations, and to demonstrate accountability for the revenues GRDA receives.
Questions about this report or requests for additional financial information should be directed to the Authority at: Grand River Dam Authority, PO Box 409, 226 West Dwain Willis Avenue, Vinita, OK 74301-0409.
Management’s Discussion And Analysis - Unaudited
- 12 -

- 13 -
GRAND RIVER DAM AUTHORITY(A Component Unit of the State of Oklahoma)
STATEMENTS OF NET POSITIONAS OF DECEMBER 31, 2014 AND 2013
2014 2013
ASSETS: Current assets: Cash and cash equivalents—general operating account 34,177,297$ 27,200,350$ Investments 47,684,660 68,777,262 Accounts receivable—net 48,992,419 52,695,812 Accrued interest receivable 2,323,698 2,011,636 Fuel stock 15,427,286 11,067,460 Materials and supplies 40,554,981 46,621,271 Under recovered fuel costs 16,358,466 14,664,389 Prepaid assets 4,061,663 3,874,533 Costs to be recovered from future revenues - 12,609,239
Total current assets 209,580,470 239,521,952
Noncurrent assets: Investments 740,055,949 397,792,015 Other receivables 504,829 488,203 Net utility plant: Non-depreciable—at original cost 99,709,659 93,511,994 Depreciable—at original cost less depreciation 776,317,664 731,533,013 Other noncurrent assets: Prepaid assets 10,739,959 6,941,679 Nonutility property—at original cost 33,014 33,014
Total other noncurrent assets 10,772,973 6,974,693 Total noncurrent assets 1,627,361,074 1,230,299,918 TOTAL ASSETS 1,836,941,544 1,469,821,870
LIABILITIES: Current liabilities: Accounts payable and accrued liabilities 52,481,148 63,192,748 Accrued interest payable 4,416,878 18,097,371 Bonds payable—current portion 22,965,000 36,306,340
Total current liabilities 79,863,026 117,596,459
Noncurrent liabilities: Bonds payable—net 1,166,810,673 784,142,575 Other noncurrent liabilities 5,526,967 5,098,370
Total noncurrent liabilities 1,172,337,640 789,240,945 TOTAL LIABILITIES 1,252,200,666 906,837,404
NET POSITION: Net investment in capital assets 304,838,953 348,205,546 Restricted for: Debt service 17,705,259 33,526,719 Other special purposes 5,321,351 1,942,224 Unrestricted 256,875,315 179,309,977
TOTAL NET POSITION 584,740,878$ 562,984,466$
See notes to financial statements.

- 14 -
GRAND RIVER DAM AUTHORITY(A Component Unit of the State of Oklahoma)
STATEMENTS OF REVENUES, EXPENSES, AND CHANGES IN NET POSITIONFOR THE YEARS ENDED DECEMBER 31, 2014 AND 2013
2014 2013
OPERATING REVENUES: Sales of power 463,946,059$ 416,591,647$ Other operating revenues 11,213,267 13,835,208
Total operating revenues 475,159,326 430,426,855
OPERATING EXPENSES: Fuel (171,947,118) (170,624,193) Purchased power—net (80,171,737) (32,091,910) Depreciation (68,138,608) (53,952,049) Operations (46,102,751) (41,766,524) Maintenance (36,992,566) (34,350,768) Administrative and general (15,530,402) (16,361,145)
Total operating expenses (418,883,182) (349,146,589)
OPERATING INCOME 56,276,144 81,280,266
NONOPERATING REVENUES AND (EXPENSES): Investment income 7,454,283 7,121,138 Net increase (decrease) in the fair value of investments 39,499 (7,709,629) Income from nonutility operations 14,968,126 1,319,806 Interest expense (42,802,762) (43,809,348) Recovery of cost to be recovered (13,307,248) - Deferral of costs to be recovered from future revenues 698,009 1,640,965 Amortization of debt discount and financing costs (2,824,504) (1,060,061) Amortization of bond premium 1,254,865 965,558
Total nonoperating expenses (34,519,732) (41,531,571)
NET INCREASE IN NET POSITION 21,756,412 39,748,695
NET POSITION—Beginning of year 562,984,466 523,235,771
NET POSITION—End of year 584,740,878$ 562,984,466$
See notes to financial statements.
- 15 -
GRAND RIVER DAM AUTHORITY(A Component Unit of the State of Oklahoma)
STATEMENTS OF CASH FLOWSFOR THE YEARS ENDED DECEMBER 31, 2014 AND 2013
2014 2013
CASH FLOWS FROM OPERATING ACTIVITIES: Received from user charges 509,959,863$ 470,049,549$ Received from refined coal partner 138,981,703 120,951,920 Payments to employees for services (36,371,199) (33,088,562) Payments to suppliers for goods and services (359,026,352) (248,971,134) Payments to refined coal partner (126,576,743) (132,710,884)
Net Cash Provided by Operating Activities 126,967,272 176,230,889
CASH FLOWS FROM CAPITAL AND RELATED FINANCING ACTIVITIES: Additions to utility plant (121,394,365) (82,027,920) Payments for retirements of utility plant (950,384) (1,724,195) Received from sales of retirements of utility plant 4,255,252 75,289 Proceeds from bond issues 375,480,000 - Bond premium 31,154,218 - Bond issueance costs (1,755,839) - Repayment of principal (36,306,340) (91,110,000) Interest paid (43,176,007) (42,366,140) Recovery of cost to be recovered (13,307,248) -
Net Cash Provided by (Used In) Capital and Related Financing Activities 193,999,287 (217,152,966)
CASH FLOWS FROM INVESTING ACTIVITIES: Interest received 8,537,664 10,454,429 Purchases of securities (520,874,146) (48,850,720) Proceeds from sales and maturities of securities 198,346,870 95,047,471
Net Cash Provided by (Used In) Investing Activities (313,989,612) 56,651,180
NET INCREASE IN CASH AND CASH EQUIVALENTS 6,976,947 15,729,103
CASH AND CASH EQUIVALENTS—Beginning of year 27,200,350 11,471,247
CASH AND CASH EQUIVALENTS—End of year 34,177,297$ 27,200,350$
NONCASH ITEMS FROM CAPITAL AND RELATED FINANCING ACTIVITIES—Non-cash purchases of utility plant included in accounts payable 1,031,427$ -$
NON-CASH ITEMS FROM INVESTING ACTIVITIES: Change in unrealized gain (loss) on investments 39,499$ (7,709,629)$ Amortization of premiums and discounts 1,395,443$ 3,297,913$ RECONCILIATION OF OPERATING INCOME TO NET CASH PROVIDED BY OPERATING ACTIVITIES: Operating income 56,276,144$ 81,280,266$ Noncash items included in net operating income: Income from nonutility operations 14,968,126 1,319,806 Depreciation 68,138,608 53,952,049 Changes in assets and liabilities: Receivables: Customers (3,186,513) (3,448,170) Other 6,873,279 11,278,353 Fuel stock (4,359,826) 11,411,386 Materials and supplies 6,066,290 (1,778,208) Other (4,648,426) 4,216,087 Accounts payable and accrued liabilities (11,897,011) 15,428,570 Over (under) recovered fuel costs (1,694,077) 930,497 Other noncurrent liabilities 430,678 1,640,253
NET CASH PROVIDED BY OPERATING ACTIVITIES 126,967,272$ 176,230,889$
See notes to financial statements.

- 16 -
GRAND RIVER DAM AUTHORITY (A Component Unit of the State of Oklahoma)
NOTES TO FINANCIAL STATEMENTS AS OF AND FOR THE YEARS ENDED DECEMBER 31, 2014 AND 2013
1. SUMMARY OF SIGNIFICANT ACCOUNTING POLICIES
Nature of Business—The Grand River Dam Authority (the “Authority” or “GRDA”) was created as a nonappropriated agency by the State of Oklahoma in 1935 as a conservation and reclamation district. The Authority has the power to control, store, preserve, and distribute the waters of the Grand River and its tributaries for any useful purpose and to develop and generate water power, electric power, and electric energy within the boundaries of the Authority and to buy, sell, resell, interchange, and distribute electric power and energy. The Grand River lies entirely within Oklahoma, but its drainage basin also extends over the states of Arkansas, Kansas, and Missouri. As part of the Authority’s licensing agreements, the Authority also has lake area responsibilities. The costs of those activities are funded primarily through electricity sales to rural cooperative, municipal, industrial and off-system customers located in Oklahoma, Kansas, Missouri, and Arkansas. The Authority’s financial statements are included in the State of Oklahoma Comprehensive Annual Financial Report as a discrete proprietary component unit.
Basis of Accounting—The Authority is licensed to operate under the Federal Power Act, which requires the use of the uniform system of accounts, prescribed for public utilities and licensees. The Authority is a cost of service organization and establishes its rates to provide revenues sufficient to pay all expenses necessary for the operation and maintenance of the system, all payments, transfers, and deposits related to outstanding debt, and all other charges or obligations imposed by law or contract.
Basis of Presentation—The Authority’s basic financial statements conform to the provisions of standards issued by the Governmental Accounting Standards Board (GASB). GASB establishes standards for external financial reporting for all state and local governmental entities, which includes statements of net position, statements of revenues, expenses, and changes in net position, and statements of cash flows. It requires the classification of net position into three components—net investment in capital assets; restricted; and unrestricted. These classifications are defined as follows:
Net Investment in Capital Assets—This component of net position consists of capital assets, net of accumulated depreciation and costs to be recovered from future revenues reduced by the outstanding balances of any bonds, mortgages, notes, or other borrowings that are attributable to the acquisition, construction, or improvement of those assets. If there are significant unspent related debt proceeds at year-end, the portion of the debt attributable to the unspent proceeds is not included in the calculation of net investment in capital assets. Rather, that portion of the debt is included in the same net position component as the unspent proceeds.
Restricted—This component of net position consists of constraints placed on net position use through external constraints imposed by creditors (such as through debt covenants), contributors, or laws or regulations of other governments or constraints imposed by law through constitutional provisions or enabling legislation.
Unrestricted Net Position—This component of net position consists of net positions that do not meet the definition of “restricted” or “net investment in capital assets.”

- 17 -
The financial statements of the Authority are prepared under the accrual basis of accounting. Revenues are recognized when earned and expenses are recognized when incurred.
Estimates—The preparation of financial statements in conformity with accounting principles generally accepted in the United States of America requires management to make estimates and assumptions that affect the reported amounts of assets and liabilities and disclosure of contingent assets and liabilities at the date of the financial statements and the reported amounts of revenues and expenses during the reporting period. Actual results could differ from those estimates.
Cash and Cash Equivalents—Cash and cash equivalents include unrestricted cash in banks, unrestricted money market funds, and unrestricted certificates of deposit with original maturities of three months or less. Balances are presented on a net basis to the extent such balances are subject to the right of offset.
Investments—Investments principally comprise U.S. government securities, U.S. government agencies, U.S. government sponsored enterprises, State of Oklahoma agency bonds, money market funds, and certificates of deposit. The Authority reports investments at fair value. Fair value is determined using quoted market prices.
Fuel Stock—Coal fuel stock is carried at average cost and includes the costs of coal, freight, and labor. These amounts are charged to expense as the fuel is consumed. Gas fuel stock is carried at average cost and includes the costs of gas, transportation, and gas management fees.
In December 2011, the Authority began a fuel emissions protection project with Chouteau Fuels Company, LLC. Chouteau Fuels, LLC is a subsidiary of DTE Energy Company, which requires the sale of coal fuel stock to the counterparty that chemically treats the coal fuel stock and then sells it back to the Authority at a reduced price for consumption and enhanced environmental protection.
Materials and Supplies—Materials and supplies are valued using the average cost and specific identification methods.
Under/Over Recovered Fuel Costs—The Authority’s rate structure as approved by the Board of Directors provides for the Authority to make adjustments in revenue collections from municipal, industrial, cooperative and off-system firm customers to recover variations between estimated and actual fuel costs incurred by the Authority. Through June 30, 2013, this adjustment, referred to as the Power Cost Adjustment (PCA), was calculated twice each year. The Authority’s base rate was calculated using 13 mills as an estimated PCA. Beginning July 1, 2013, the PCA is calculated monthly and the Authority’s base rate is set at 23 mills as an estimated PCA. The cumulative difference between the actual fuel costs and the base PCA rate is reflected as either an asset (“under recovery”) or liability (“over recovery”) in the Authority’s accompanying Statements of Net Position, as amounts will either be collected from or refunded to customers of the Authority in subsequent periods.
Joint Participant—Among the Authority’s assets is coal-fired plant GRDA 2 (which is 62% owned by the Authority and 38% owned by KAMO Power (KAMO). The Authority and KAMO also jointly own an integrated transmission system. Additionally, the Authority jointly owns the Redbud combined-cycle gas plant with Oklahoma Gas and Electric (OG&E) and Oklahoma Municipal Power Authority (OMPA). The Redbud Power Plant is operated by OG&E, with OG&E, the Authority, and OMPA owning 51%, 36%, and 13% respectively. The Authority records its proportionate share of utility plant, revenues, and expenses associated with these jointly owned units.
- 18 -
Joint Ownership—On October 1, 2008, the Authority purchased certain assets and assumed certain liabilities in the Redbud combined-cycle gas plant near Luther, Oklahoma. The Authority’s undivided interest in the assets and liabilities of the facility is 36%, while OG&E’s interest is 51% and OMPA’s interest is 13%.
The Authority can schedule up to its ownership share, 36%, of the available power output of the Redbud plant. The output from Redbud is combined with the output from the Authority’s other resources, such as coal and hydroelectric generation. Revenues from the sale of total system generation resources are included in sales of power as shown on the statements of revenues, expenses, and changes in net position.
The Authority has entered into short-term natural gas supply contracts to purchase and provide its share of fuel supply for the Redbud plant and the statements of revenues, expenses, and changes in net position include $72,948,083 and $56,131,007 related to natural gas fuel expenses included in the Fuel line item of Operating Expenses for 2014 and 2013, respectively.
OG&E operates the Redbud facility under an operating agreement with the Authority and OMPA and allocates certain costs and expenses attributable to Redbud, to the Authority, and to OMPA in accordance with their undivided ownership interests (36% and 13%, respectively). The Authority’s statements of revenues, expenses, and changes in net position include the following related to those allocations: $7,543,861 and $5,206,810 in Maintenance, $3,078,312 and $1,140,678 in Operation, and $2,205,502 and $2,750,378 in Administrative and general line items of the Operating Expenses section for 2014 and 2013, respectively.
The Redbud facility has long-term service agreements with a large industrial manufacturer for the maintenance of the gas and steam turbines and the related long-term purchase commitments for GRDA’s portion totaled approximately $82.8 million and $98.2 million for 2014 and 2013, respectively. These amounts have been included in the contractual commitments in Note 9. The Authority’s statements of net position in 2014 include approximately $4.4 million in noncurrent prepaid assets for payments made in 2014 related to advanced hot gas path upgrades expected to be installed in 2018.
Utility Plant and Depreciation—The cost of utility plant includes direct material, direct labor and indirect costs such as engineering, supervision, insurance, and interest expense (net of applicable interest income) capitalized during construction. The Authority follows the Federal Energy Regulatory Commission (FERC) electric plant instruction guidelines in defining capital assets. Generally, assets, which have a cost of $500 or more at the date of acquisition and have an expected useful life of one year or more, and are not consumable, are capitalized. The cost of maintenance and repairs to property is expensed. Consistent with the Redbud plant operator’s treatment, certain costs of the long-term service agreement payments are capitalized. Gain or loss is recognized on retirements and dispositions that management believes to be unusual in nature.
Depreciation is computed on the cost of utility plant by the composite method over the following estimated useful lives and annual depreciation percentages:
Coal-fired plants 34 years 2.90%Redbud combined-cycle plant 3–32 years 33.33%–3.13%Hydraulic production plants 87 years 1.15%Transmission system 30 years 3.33%Other properties and production plant 5–30 years 20.00%–3.33%

- 19 -
Long-Lived Assets—The Authority reviews long-lived assets and certain identifiable intangibles to be held and used for impairment whenever events or changes in circumstances have indicated that the service utility of the capital assets has a significant unexpected decline. Management of the Authority has determined that no impairment adjustments required recognition in 2014 or 2013.
Costs to be Recovered from Future Revenues—Certain items included in operating costs are recovered by the Authority through rates set by the Board of Directors. The Authority, as a self-regulated utility, is subject to the requirements of GASB Statement No. 62, Codification of Accounting and Financial Reporting Guidance Contained in Pre-November 30, 1989 FASB and AICPA Pronouncements. GASB 62 provides that certain costs that would otherwise be charged to expense can be deferred as regulatory assets, based on the expected recovery from customers in future rates. Historically, recognition of these costs is deferred to the extent that such costs are later included in rates charged by the Authority in future years.
In 2004, the Authority determined that it should defer interest costs related to the 2002B capital appreciation bond issue and expense these costs in 2014, when the related bonds mature. The Authority fully recovered the deferred interest expense, net of any interest income earned on unexpended related construction funds, during 2014 as revenues were collected to pay the accrued interest and principal on June 1, 2014. At December 31, 2014 and 2013, the Authority had approximately $0 and $12.6 million, respectively, of costs to be recovered from future revenues.
Management continuously monitors the future recoverability of regulatory assets, and when, in management’s judgment, any future recovery becomes impaired, the amount of the regulatory asset is reduced or written off, as appropriate.
Bonds Payable—The Authority is operating under General Bond Resolution No. 5107 (“Resolution No. 5107”), which provides for the issuance of revenue bonds and defines eligible investment securities.
Unamortized Debt Discount or Premium and Bond Insurance Expense—Debt discount or premium and bond insurance expense are amortized using the bonds outstanding method over the periods of the applicable issues. Since January 1, 2013, the Authority expenses bond issuance costs in the period in which they are incurred, except for bond insurance costs, which are capitalized and amortized over the remaining term of the related bonds.
Unamortized Gains and Losses on Advance Refunding of Long-Term Debt—Gains and losses realized on advance refunding of long-term debt are deferred and amortized over the shorter of the life of the new bonds or the related refunding issues using the bonds outstanding method.
Operating and Nonoperating Revenues and Expenses—Operating revenues include the sales of power and other operating revenues such as rents from electric property, consisting primarily of revenues from transmission and ancillary services. Other operating revenues also include sales of water, sulfur dioxide emission credits conversions and renewable energy certificates. Operating expenses include costs to operate and maintain the Authority’s generation and transmission assets including fuel, purchased power, depreciation and related administrative and general expenses. Historically, administrative and general costs included the settlement of claims, insurance deductibles, employee insurance premiums and post-retirement benefits and they have increased annually. In 2013, GRDA began allocating employee benefits and non-productive pay such as annual, holiday and sick leave along with direct pay to other operating expenses in order to better prepare for the Southwest Power Pool (SPP) Integrated Marketplace, which went live on March 1, 2014. The allocations allow GRDA to better identify the functional expenses for each generating and transmission facility. Nonoperating revenues include investment income, net increase in the fair value of investments, deferral of costs to be recovered from future revenues, and income from nonutility operations. Nonoperating expenses include

- 20 -
interest expense, amortization of costs to be recovered from future revenues and amortization of bond-related expenses.
Purchased Power—Purchased power includes the cost of electricity purchased for resale and settlements for exchange of electricity and imbalance market transactions.
Income Taxes—The Authority is a governmental agency organized under the laws of the State of Oklahoma and is not subject to federal or state income taxes.
Adoption of New Accounting Standards—During the year, the Authority adopted the following accounting standards:
GASB Statement No. 67, Financial Reporting for Pension Plans—an amendment to GASB Statement No. 25. The objective of this statement is to improve financial reporting by state and local governmental pension plans. This statement results from a comprehensive review of the effectiveness of existing standards of accounting and financial reporting for pensions with regard to providing decision-useful information, supporting assessments of accountability and interperiod equity, and creating additional transparency. This statement was effective for the Authority in 2014. This statement did not have an impact on the Authority’s financial statements.
GASB Statement No. 69, Governmental Combinations and Disposals of Government Operations. This statement establishes accounting and financial reporting standards related to government combinations and disposals of government operations. The term government combinations includes a variety of transactions referred to as mergers, acquisitions, and transfers of operations. The distinction between government merger and a government acquisition is based upon whether an exchange of significant consideration is present within the combination transaction. This statement requires the use of carrying values to measure the assets and liabilities in a government merger. Government acquisitions are transactions in which a government acquires another entity, or its operations, in exchange for significant consideration. This statement was effective for the Authority in 2014. This statement did not have an impact on the Authority’s financial statements.
GASB Statement No. 70, Accounting and Financial Reporting for Nonexchange Financial Guarantees. This statement specifies the information required to be disclosed by governments that extend nonexchange financial guarantees. In addition, this Statement requires new information to be disclosed by governments that receive nonexchange financial guarantees. This statement was effective for the Authority in 2014. This statement did not have an impact on the Authority’s financial statements.
Recently Issued Accounting Standards—The following accounting standards will be adopted as applicable in future periods:
GASB Statement No. 68, Accounting and Financial Reporting for Pensions—an amendment of GASB Statement No. 27. The objective of this statement is to improve accounting and financial reporting by state and local governments for pensions. It also improves information provided by state and local governmental employers about financial support for pensions that is provided by other entities. This Statement results from a comprehensive review of the effectiveness of existing standards of accounting and financial reporting for pensions with regard to providing decision-useful information, supporting assessments of accountability and interperiod equity, and creating additional transparency. This statement will be effective for fiscal years beginning after June 15, 2014, which makes it effective for the Authority in 2015, and management is currently evaluating the impact of this pronouncement on the Authority’s financial statements.

- 21 -
GASB Statement No. 71, Pension Transition for Contributions Made Subsequent to the Measurement Date—an amendment of GASB Statement 68. The requirements of this Statement will eliminate the source of a potential significant understatement of restated beginning net position and expense in the first year of implementation of Statement 68 in the accrual-basis financial statements of employers and nonemployer contributing entities. This benefit will be achieved without the imposition of significant additional costs. The provisions of this statement are required to be applied simultaneously with the provisions of Statement 68, which will be effective for fiscal years beginning after June 15, 2014, which makes it effective for the Authority in 2015, and management is currently evaluating the impact of this pronouncement on the Authority’s financial statements.
GASB Statement No. 72, Fair Value Measurement and Application. This statement addresses accounting and financial reporting issues related to fair value measurements. The definition of fair value is the price that would be received to sell an asset or paid to transfer a liability in an orderly transaction between market participants at the measurement date. This statement provides guidance for determining a fair value measurement for financial reporting purposes. This statement also provides guidance for applying fair value to certain investments and disclosures related to all fair value measurements. The statement is effective for financial statements for periods beginning after June 15, 2015, which makes it effective for the Authority in 2016, and management is currently evaluating the impact of this pronouncement on the Authority’s financial statements.
2. DEPOSITS AND INVESTMENTS
The Authority’s Resolution No. 5107, provides for the issuance of revenue bonds and defines eligible investment securities as investments allowed pursuant to the Authority’s investment policy. The Authority’s Board Policy 5-2 defines the following categories of investments (1) bonds or other obligations which are direct obligations of the United States of America, (2) bonds or other specifically named obligations which are indirectly guaranteed by the United States of America, (3) direct and general obligations of any state which are rated in the two highest major categories of Moody’s, Standard & Poor’s (S&P), or Fitch, (4) certificates of deposit issued by a savings and loan association or a bank and trust company which are collateralized by the securities described in (1) and (2) or which are fully insured by the Federal Deposit Insurance Corporation (FDIC), (5) repurchase agreements with banks or government bond dealers which are secured by securities described in (1) and (2), (6) investment agreements with companies or banks whose senior debt obligations are rated no lower than the second highest category of Moody’s, S&P, or Fitch, (7) short-term obligations of any state or political subdivision which are rated in the highest short-term category by Moody’s or S&P, and (8) any cash swap or similar arrangement of the Bond Fund Trustee, the investments of which are limited to securities described in (1) and (2).
The Authority carries its investments at fair value. The Authority and trustees monitor collateral pledged to secure deposits in financial institutions for compliance with rules and regulations promulgated by the Oklahoma State Treasurer.
Interest-Rate Risk—Interest rate risk is the risk that changes in market interest rates will adversely affect the fair value of an investment. The Authority has no formal policy to address exposure to fair value losses resulting from changes in interest rates. However, Resolution No. 5107 requires that investments not mature later than such times as the funds shall be necessary to provide monies when needed for payments to be made from the Debt Service Account, and in the case of the Debt Service Reserve Account, unless otherwise provided in a Supplemental Resolution, not later than ten (10) years from the date of investment. The Authority’s Board Policy 5-2 provides that general fund investments shall not mature later than five (5) years from the date of investment. The Authority attempts to hold the investments to maturity which minimizes the exposure to rising interest rates.

- 22 -
As of December 31, 2014 and 2013, the Authority had the following cash and investments (classified as either cash equivalents, investments or restricted investments on the statements of net position) and corresponding maturities:
Investment Type Fair Value Less than 1 1–5 6–10
U.S. gov’t agencies and U.S. gov’t sponsored enterprises 714,811,085$ 241,204,067$ 460,893,326$ 12,713,692$ Certificates of deposits 9,575,345 9,575,345 - - Money market funds 96,092,339 96,092,339 - - State of Oklahoma agency bonds - - - - Cash deposits—net 1,439,137 1,439,137 - -
Total 821,917,906$ 348,310,888$ 460,893,326$ 12,713,692$
2014Investment Maturities (in Years)
Investment Type Fair Value Less than 1 1–5 6–10
U.S. gov’t agencies and U.S. gov’t sponsored enterprises 388,720,257$ 163,131,473$ 168,038,708$ 57,550,076$ Certificates of deposits 6,409,407 6,409,407 - - Money market funds 84,995,706 84,995,706 - - State of Oklahoma agency bonds 11,240,000 11,240,000 - - Cash deposits—net 2,404,257 2,404,257 - -
Total 493,769,627$ 268,180,843$ 168,038,708$ 57,550,076$
2013Investment Maturities (in Years)
Credit Risk—Credit risk is the risk that the insurer or other counterparty to an investment will not fulfill his obligation. Mortgage backed securities (MBS) which are not rated because the agencies that issue such securities did not apply to any of the nationally recognized statistical rating organizations (NRSRO) such as Moody’s Investors Service (“Moody’s”) and Standard & Poor’s (“S&P”) for ratings on their MBS. However, the agencies and the Government Sponsored Enterprises (GSE) carry Aaa/AA+ ratings from Moody’s and S&P for their debentures, and the MBS which carry their label (e.g., Federal National Mortgage Association—“FNR”; Federal Home Loan Bank—“FHR”) are direct obligations of the agencies. With the exception of Federal National Mortgage Association (“Fannie Mae”) and the Federal Home Loan Mortgage Corporation (“Freddie Mac”), which are government-sponsored quasi-governmental agencies (which also received U.S. government backing during 2008), the agencies have the backing of the U.S. Government; therefore, the Aaa/AA+/AAA rating by Moody’s, Standard & Poor’s, and Fitch is implied. MBS issued by the Government National Mortgage Association, with the label GNR, carry the explicit full faith and credit of the U.S. Government. Securities issued by the Federal Farm Credit Bank (FFCB) are rated Aaa/AA+/AAA by Moody’s, S&P, and Fitch credit rating agencies. Fannie Mae and Freddie Mac are rated Aaa/AA+/AAA by Moody’s, S&P, and Fitch credit rating agencies. The MBS are senior in the credit structure to the debentures for the FNMA and FHLMC. The State of Oklahoma bonds are Oklahoma Water Resource Board bonds which were upgraded by S&P in November 2013 to an AAA rating. The certificates of deposit are held by various

- 23 -
banks and are subject to the FDIC guarantees up to $250,000. The Money Market Funds are held by a bank and are collateralized at over 100% of the cash market value with U.S. Treasury and U.S. Agency securities. The Authority addresses credit risk of investments through the Authority’s Board Policy 5-2 which states that investments must be backed by the U.S. government, collateralized, fully insured by the FDIC, or be rated no lower than the second highest category of Moody’s (Aa), S&P (AA), or Fitch (AA).
As of December 31, 2014 and 2013, the Authority’s investments had the following ratings:
Moody’s/S&P/Fitch S&P Credit Risk
Investment Rating Aaa/AA+/AAA AAA Not Applicable Total
Money markets -$ -$ 96,092,339$ 96,092,339$ Certificates of deposits - - 9,575,345 9,575,345 US gov’t securities 406,434,435 - - 406,434,435 U.S. gov’t agencies and U.S. gov’t sponsored enterprises 308,376,650 - - 308,376,650 State of Oklahoma agency bonds - - - - Cash deposits—net - - 1,439,137 1,439,137
714,811,085$ -$ 107,106,821$ 821,917,906$
Investment Rating2014
Moody’s/S&P/Fitch S&P Credit Risk
Investment Rating Aaa/AAA/AAA AAA Not Applicable Total
Money markets -$ -$ 84,995,706$ 84,995,706$ Certificates of deposits - - 6,409,407 6,409,407 US gov’t securities 193,704,851 - - 193,704,851 U.S. gov’t agencies and U.S. gov’t sponsored enterprises 195,015,406 - - 195,015,406 State of Oklahoma agency bonds - 11,240,000 - 11,240,000 Cash deposits—net - - 2,404,257 2,404,257
388,720,257$ 11,240,000$ 93,809,370$ 493,769,627$
Investment Rating2013

- 24 -
As of December 31, 2014 and 2013, the Authority had the following portfolio of investments with credit exposure by investment type as a percentage of total investments:
U.S. government securities 49.5 % 39.2 %U.S. government agencies and U.S. government sponsored enterprises: FFCB 4.0 2.4 FHLB 19.4 14.3 GNMA 0.3 0.6 FHLMC 5.6 9.1 FNMA 8.2 13.1 Money market funds 11.6 17.2 Certificate of deposits 1.2 1.3 State of Oklahoma agency bonds - 2.3 Cash deposits—net 0.2 0.5
Custodial Credit Risk—For an investment, custodial credit risk is the risk that, in the event of the failure of the counterparty, the Authority will not be able to recover the value of its investment for collateral securities that are in the possession of an outside party. All money to be held by the Authority under Resolution No. 5107 is required to be deposited in one or more depositories in the name of the Authority. All money deposited under the provisions of Resolution No. 5107 with the Bond Fund Trustee and the Construction Fund Trustee is required to be held in trust and applied only in accordance with the provisions of Resolution No. 5107; money held by the Authority and deposited in any depository is required to be held and secured in the manner provided by Oklahoma law.
Restricted noncurrent investment funds in the bond service reserve account, and certain funds in the construction account are included in investments in noncurrent assets on the Statement of Net Position. Restricted current investment funds in the bond service account and certain deposits in the construction account are included in Investments in current assets on the Statement of Net Position. Restricted investments (noncurrent and current) are not available for general operations.

- 25 -
Carrying Values—Cash and cash equivalents and current and noncurrent investments at December 31, 2014 and 2013, follows:
OtherBond Bond Service Special
General Board Service Construction Reserve PurposesOperations Designated (Restricted) (Restricted) (Restricted) (Restricted) Total
Current: Cash deposits—net 1,439,137$ -$ -$ -$ -$ 1,044,351$ 2,483,488$ Money market funds—cash and investments 32,738,160 - 20,350 1,007,947 - 27,000 33,793,457 U.S. government securities, agencies and sponsored enterprises 19,369,109 - 17,684,909 - - - 37,054,018 Certificates of deposits— maturity > 3 months 4,280,994 - - - - 4,250,000 8,530,994
Total current 57,827,400 - 17,705,259 1,007,947 - 5,321,351 81,861,957
Non-current: U.S. government securities, agencies and sponsored enterprises 100,225,273 33,633,000 - 457,764,267 86,134,528 - 677,757,068 State of Oklahoma agency bonds - - - - - - Money market funds - - - 59,982,214 2,316,667 - 62,298,881
Total non-current 100,225,273 33,633,000 - 517,746,481 88,451,195 - 740,055,949
Total cash and investments 158,052,673$ 33,633,000$ 17,705,259$ 518,754,428$ 88,451,195$ 5,321,351$ 821,917,906$
2014

- 26 -
OtherBond Bond Service Special
General Board Service Construction Reserve PurposesOperations Designated (Restricted) (Restricted) (Restricted) (Restricted) Total
Current: Cash deposits—net 2,404,257$ -$ -$ -$ -$ 915,224$ 3,319,481$ Money market funds—cash and investments 24,796,093 - 32,180 - 9,251,773 27,000 34,107,046 U.S. government securities, agencies and sponsored enterprises 10,930,641 - 33,494,539 - 8,631,722 - 53,056,902 Certificates of deposits— maturity > 3 months 4,494,183 - - - - 1,000,000 5,494,183
Total current 42,625,174 - 33,526,719 - 17,883,495 1,942,224 95,977,612
Non-current: U.S. government securities, agencies and sponsored enterprises 43,168,671 36,500,000 - 140,402,037 115,592,647 - 335,663,355 State of Oklahoma agency bonds - - - 11,240,000 - - 11,240,000 Money market funds - - - 50,888,660 - - 50,888,660
Total non-current 43,168,671 36,500,000 - 202,530,697 115,592,647 - 397,792,015
Total cash and investments 85,793,845$ 36,500,000$ 33,526,719$ 202,530,697$ 133,476,142$ 1,942,224$ 493,769,627$
2013

- 27 -
The restricted balances are the minimum amounts required to be maintained.
Additional information relating to cash and investment restrictions follows:
Bond Service—On December 31, the bond service fund in the accompanying balance sheet reflects the minimum restricted amount sufficient to pay seven months of principal and one month of interest due the following June 1.
Construction—A 2008 construction fund was established in September 2008 with the proceeds from the Revenue Bonds, Series 2008A and 2008B. Initial disbursements were for the purchase of a 36% interest in the 1230 MW gas-fired, combined-cycle power generation facility located in Luther, Oklahoma (see Note 1). Additional costs to be funded from the remaining balance include capital additions, repairs, and improvements to the Authority’s coal-fired generation complex, transmission system, hydroelectric generating facilities and ecosystems.
A 2010 construction fund was established in December 2010 with the proceeds from the Revenue Bonds, Series 2010A and 2010B. The proceeds from the 2010 Bonds will be used to fund certain system costs consisting of capital additions, repairs and improvements to the Authority’s coal-fired generation complex, transmission system, hydroelectric generating facilities, ecosystems and the gas-fired, combined-cycle generation facility.
A 2014 construction fund was established in October 2014 with the proceeds of the Revenue Bonds, Series 2014A and 2014B. The construction fund was increased in December 2014 from the proceeds of the Revenue Bonds, Series 2014C. The proceeds from the 2014 Bonds will be used to fund a portion of the costs of construction of a nominal 495 MW gas-fired combined-cycle plant (GRDA 3) on the site of the Authority’s existing Grand River Energy Complex (formerly known as the Coal-Fired Complex) in Chouteau, OK, to fund environmental upgrades to the existing nominal 520 MW coal-fired plant (GRDA 2), and to fund other capital requirements for power supply and transmission needs.
Bond Service Reserve—The restricted amount in the accompanying Statements of Net Position reflects the maximum aggregate debt service for all bonds outstanding. The balance in the Bond Service Reserve (Restricted) account includes $87,759,969 restricted for the bond service reserve per General Bond Resolution No. 5107, and the $691,226 excess was primarily funded by tax exempt bonds. The use is restricted per tax code. GRDA will use the excess to pay for future debt principal payments, capital additions, or other purposes authorized by General Bond Resolution No. 5107.
Restricted for Other Special Purposes—Due to agreements with FERC, the Authority has restricted money for two purposes. The first restriction is for the fish and wildlife mitigation fund, established in June 2003 as required by FERC. The Authority funded an initial deposit of $260,000 in 2003, and is required to make $100,000 annual contributions (adjusted for inflation) each year the Pensacola Dam license is in effect. Generally, the purpose of this fund is to support projects to protect and enhance fish and wildlife resources at the direction of various groups external to the Authority. No expenditures were made from the fund in either 2014 or 2013. The second restriction is for the nature conservancy fund, established in May 2008 as required by FERC. The Authority funded an initial deposit of $27,000 in 2008. The Authority is required to replenish the fund to $27,000 on the first working day in January of each year. Generally, the purpose of this fund is to maintain bat caves protection on Grand Lake. No expenditures were made from the fund in either 2014 or 2013. In November 2013, the Authority established an escrow account backed by a certificate of deposit of $1 million to meet the credit policy requirements for participating in the Southwest Power Pool (SPP) Integrated Marketplace beginning in March 2014. Then, in 2014, $3.25 million was added to the escrow account to meet the increased requirements from the SPP Integrated Marketplace bringing the total to $4.25 million. These funds came from the Special Reserve and Contingency Fund II which relates to unforeseen risk.

- 28 -
In addition to these restricted funds, two special funds (designated by the Authority’s Board of Directors in December 2004) are unrestricted:
The Special Reserve and Contingency Fund I—This designated though unrestricted fund was established in December 2004 to reserve $2.5 million annually for future use, if needed, for extraordinary maintenance, operational, and environmental expenses. Total funding of $22.5 million from available unrestricted funds was board-designated as of December 31, 2014.
The Special Reserve and Contingency Fund II—This designated though unrestricted fund was established in December 2004 to reserve $2 million annually for future use, if needed, related to unforeseen risk, including, but not limited to, unscheduled outages, unexpected purchased power expense, and other extraordinary expense not covered by insurance proceeds. An initial amount of $11 million was formally designated in 2004, which combined with the $2 million designated in 2005 and the $2 million designated in 2006 from available funds. In 2013, $1 million was used to establish an escrow account to meet the credit policy requirements for participating in the SPP Integrated Marketplace beginning in March 2014. Then, in 2014, $3.25 million was added to the escrow account to meet the increased credit policy requirements for participating in the SPP Integrated Marketplace bringing the total to $4.25 million. Beginning in 2014, the annual savings from excess liability premium of $383,000 has been designated to be added to this fund bringing the total to $11.1 million as of December 31, 2014.
For purposes of computing gross realized gains and gross realized losses, cost is determined by specific identification. The calculation of realized gains is independent of the calculation of the net increase in the fair value of investments. Realized gains and losses on any investments that had been held for more than the current year may have been recognized as an increase or decrease in the fair value of investments reported in prior years.
Gross realized gains and gross realized losses on sales of investment securities for the years ended December 31, 2014 and 2013, were as follows:
2014 2013
Gross realized gains 1,159,223$ 638,346$Gross realized losses (527,985) (76,866)
Gross realized gains and losses are included in investment income in the accompanying Statements of Revenues, Expenses, and Changes in Net Position.
3. RECEIVABLES
Accounts receivable is comprised at December 31, 2014 and 2013, of the following amounts:
2014 2013
Customers 41,013,727$ 37,827,214$ Less allowance for doubtful accounts (100,000) (100,000) Other 8,078,692 14,968,598
Total 48,992,419$ 52,695,812$

- 29 -
In general, other accounts receivable include KAMO Power’s participation as a co-owner of the Authority’s coal-fired plant GRDA 2, Chouteau Fuels Company, LLC, reimbursable work for other entities, the current portion of receivables for aid of construction, and dock billings.
At December 31, 2014 and 2013, the Authority had noncurrent receivables for closure and post-closure costs related to the ash landfill at the Grand River Energy Complex of $504,829 and $488,203, respectively.
4. UTILITY PLANT
A summary of changes in utility plant for the years ended December 31, 2014 and 2013, follows:
Balance BalanceDecember 31, Additions/ December 31,
2013 Transfers Retirements 2014
Capital assets—nondepreciable: Land 35,923,398$ 25,200$ -$ 35,948,598$ Construction work in progress 57,588,596 6,172,465 - 63,761,061
Total capital assets—nondepreciable 93,511,994 6,197,665 - 99,709,659
Capital assets—depreciable: Coal-fired plant GRDA 1 (reduced by cost of common facilities applicable to joint ownership of GRDA 2 (Note 1)) 349,041,592 4,017,860 (905,451) 352,154,001 Coal-fired plant GRDA 2 (Note 1) 328,935,529 288,526 - 329,224,055 Redbud combined-cycle plant 355,134,707 37,174,993 (20,829,454) 371,480,246 Hydraulic production plants 139,927,529 20,836,439 (3,398,086) 157,365,882 Transmission system 287,302,716 44,882,034 (1,170,933) 331,013,817 Other properties and production plant 109,215,143 9,028,275 (118,556) 118,124,862
1,569,557,216 116,228,127 (26,422,480) 1,659,362,863
Less accumulated depreciation: Coal-fired plant GRDA 1 (262,591,630) (10,514,990) 660,586 (272,446,034) Coal-fired plant GRDA 2 (243,256,203) (9,371,932) - (252,628,135) Redbud combined-cycle plant (108,400,515) (15,392,620) 5,946,369 (117,846,766) Hydraulic production plants (31,084,021) (2,193,582) 1,844,821 (31,432,782) Transmission system (142,428,823) (9,012,125) 554,493 (150,886,455) Other properties and production plant (50,263,011) (7,613,824) 71,808 (57,805,027)
(838,024,203) (54,099,073) 9,078,077 (883,045,199)
Total capital assets—depreciable 731,533,013 62,129,054 (17,344,403) 776,317,664
Net utility plant 825,045,007$ 68,326,719$ (17,344,403)$ 876,027,323$
2014

- 30 -
Balance BalanceDecember 31, Additions/ December 31,
2012 Transfers Retirements 2013
Capital assets—nondepreciable: Land 35,923,398$ -$ -$ 35,923,398$ Construction work in progress 29,772,146 27,816,450 - 57,588,596
Total capital assets—nondepreciable 65,695,544 27,816,450 - 93,511,994
Capital assets—depreciable: Coal-fired plant GRDA 1 (reduced by cost of common facilities applicable to joint ownership of GRDA 2 (Note 1)) 340,281,157 9,065,393 (304,958) 349,041,592 Coal-fired plant GRDA 2 (Note 1) 328,991,843 22,117 (78,431) 328,935,529 Redbud combined-cycle plant 354,908,550 585,988 (359,831) 355,134,707 Hydraulic production plants 124,296,911 18,724,071 (3,093,453) 139,927,529 Transmission system 271,126,759 18,900,047 (2,724,090) 287,302,716 Other properties and production plant 109,657,190 6,913,854 (7,355,901) 109,215,143
1,529,262,410 54,211,470 (13,916,664) 1,569,557,216
Less accumulated depreciation: Coal-fired plant GRDA 1 (252,594,004) (10,196,977) 199,351 (262,591,630) Coal-fired plant GRDA 2 (233,949,019) (9,364,660) 57,476 (243,256,203) Redbud combined-cycle plant (94,427,287) (13,794,624) (178,604) (108,400,515) Hydraulic production plants (31,044,433) (1,811,534) 1,771,946 (31,084,021) Transmission system (137,062,425) (8,059,828) 2,693,430 (142,428,823) Other properties and production plant (50,560,556) (6,734,188) 7,031,733 (50,263,011)
(799,637,724) (49,961,811) 11,575,332 (838,024,203)
Total capital assets—depreciable 729,624,686 4,249,659 (2,341,332) 731,533,013
Net utility plant 795,320,230$ 32,066,109$ (2,341,332)$ 825,045,007$
2013
The change in construction work in progress during 2014 and 2013 is presented on a net basis to avoid a duplication of additions and retirements in the preceding tables. The change in construction work in progress includes capitalized interest of approximately $1,849,000 and $1,602,000 for 2014 and 2013, respectively, which also increases investment income. The Authority had depreciation and amortization expense of $68,138,608 and $53,952,049 for 2014 and 2013, respectively.
The Authority had contractual commitments at December 31, 2014, of approximately $460,036,000 for equipment and construction contracts. Major projects include construction of the combined cycle electric plant GRDA 3 for approximately $390,812,000, coal-fired plant GRDA 2 improvements for approximately $37,098,000, the construction of Transmission Lines and Substations for approximately $18,602,000, the Salina Generator Motor Replacement of approximately $7,883,000, the Markham Ferry Hydroelectric Plant Upgrade for approximately $2,671,000, and the renovation of the Engineering & Technology Center Building for approximately $1,808,000.

- 31 -
5. COST TO BE RECOVERED FROM FUTURE REVENUES
At December 31, 2013, the deferred regulatory asset consists of interest deferrals on the 2002B capital appreciation bonds that matured in 2014. The Authority fully recovered the deferred interest expense, net of any interest income earned on unexpended related construction funds, during 2014 as revenues were collected to pay the accrued interest and principal on June 1, 2014. At the end of 2013 these deferrals were a current asset in the accompanying Statements of Net Position. A rollforward of costs to be recovered from future revenues follows:
2014 2013
Beginning balance 12,609,239$ 10,968,274$ Deferral of 2002B interest 698,009 1,640,965 Recognition of 2002B interest (13,307,248) -
Ending balance -$ 12,609,239$
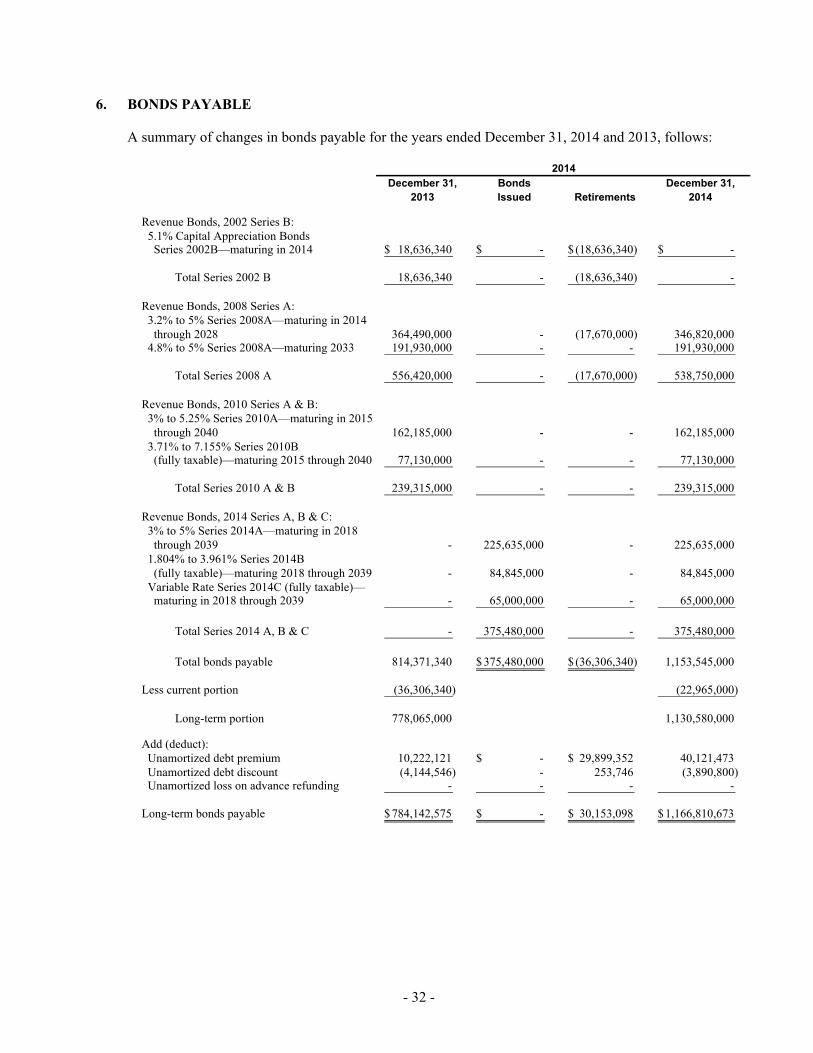
- 32 -
6. BONDS PAYABLE
A summary of changes in bonds payable for the years ended December 31, 2014 and 2013, follows:
December 31, Bonds December 31,2013 Issued Retirements 2014
Revenue Bonds, 2002 Series B: 5.1% Capital Appreciation Bonds Series 2002B—maturing in 2014 18,636,340$ -$ (18,636,340)$ -$
Total Series 2002 B 18,636,340 - (18,636,340) -
Revenue Bonds, 2008 Series A: 3.2% to 5% Series 2008A—maturing in 2014 through 2028 364,490,000 - (17,670,000) 346,820,000 4.8% to 5% Series 2008A—maturing 2033 191,930,000 - - 191,930,000
Total Series 2008 A 556,420,000 - (17,670,000) 538,750,000
Revenue Bonds, 2010 Series A & B: 3% to 5.25% Series 2010A—maturing in 2015 through 2040 162,185,000 - - 162,185,000 3.71% to 7.155% Series 2010B (fully taxable)—maturing 2015 through 2040 77,130,000 - - 77,130,000
Total Series 2010 A & B 239,315,000 - - 239,315,000
Revenue Bonds, 2014 Series A, B & C: 3% to 5% Series 2014A—maturing in 2018 through 2039 - 225,635,000 - 225,635,000 1.804% to 3.961% Series 2014B (fully taxable)—maturing 2018 through 2039 - 84,845,000 - 84,845,000 Variable Rate Series 2014C (fully taxable)— maturing in 2018 through 2039 - 65,000,000 - 65,000,000
Total Series 2014 A, B & C - 375,480,000 - 375,480,000
Total bonds payable 814,371,340 375,480,000$ (36,306,340)$ 1,153,545,000
Less current portion (36,306,340) (22,965,000)
Long-term portion 778,065,000 1,130,580,000
Add (deduct): Unamortized debt premium 10,222,121 -$ 29,899,352$ 40,121,473 Unamortized debt discount (4,144,546) - 253,746 (3,890,800) Unamortized loss on advance refunding - - - -
Long-term bonds payable 784,142,575$ -$ 30,153,098$ 1,166,810,673$
2014

- 33 -
December 31, Bonds December 31,2012 Issued Retirements 2013
Revenue Bonds, Refunding Series 1995— 5.5% maturing in 2013 91,110,000$ -$ (91,110,000)$ -$
Revenue Bonds, 2002 Series B: 5.1% Capital Appreciation Bonds Series 2002B—maturing in 2014 18,636,340 - - 18,636,340
Total Series 2002 B 18,636,340 - - 18,636,340
Revenue Bonds, 2008 Series A: 3.2% to 5% Series 2008A—maturing in 2014 through 2028 364,490,000 - - 364,490,000 4.8% to 5% Series 2008A—maturing 2033 191,930,000 - - 191,930,000
Total Series 2008 A 556,420,000 - - 556,420,000
Revenue Bonds, 2010 Series A & B: 3% to 5.25% Series 2010A—maturing in 2015 through 2040 162,185,000 - - 162,185,000 3.71% to 7.155% Series 2010B (fully taxable)—maturing 2015 through 2040 77,130,000 - - 77,130,000
Total Series 2010 A & B 239,315,000 - - 239,315,000
Total bonds payable 905,481,340 -$ (91,110,000)$ 814,371,340
Less current portion (91,110,000) (36,306,340)
Long-term portion 814,371,340 778,065,000
Add (deduct): Unamortized debt premium 11,187,678 -$ (965,557)$ 10,222,121 Unamortized debt discount (4,487,529) - 342,983 (4,144,546) Unamortized loss on advance refunding (219,829) - 219,829 -
Long-term bonds payable 820,851,660$ -$ (402,745)$ 784,142,575$
2013
Oklahoma state statutes have authorized the Authority to issue revenue bonds from time to time with the aggregate outstanding indebtedness not to exceed $1,410,000,000.
In 2014, the Authority issued $375,480,000 of 2014 Series A, Series B, and Series C Revenue Bonds to fund a portion of the construction of a nominal 495 MW combined-cycle plant (GRDA 3), to fund environmental upgrades to the existing nominal 520 MW coal-fired plant (GRDA 2), to fund other capital requirements for power supply and transmission needs and to pay certain costs of issuance of the 2014 Bonds. The $225,635,000 Series 2014A (tax-exempt) and the $84,845,000 Series B (taxable) bonds were issued in October 2014 and have a fixed interest rate. The $65,000,000 Series 2014C (taxable) bonds were issued in December 2014 and have a variable rate. The 2014C Bonds were issued in the weekly mode and will bear interest at the weekly rate, which, in the sole and exclusive judgment of the remarketing agent, would equal (but not exceed) the interest rate necessary to enable the remarketing agent to sell such Series 2014C Bonds (exclusive of accrued interest, if any) on the relevant rate adjustment date and for such rate period at a price equal to one hundred percent (100%) of the principal amount thereof. While in the weekly mode, the Series 2014C Bonds are subject to redemption and optional and mandatory tender for purchase prior to maturity. Additionally, the Series 2014C Bonds

- 34 -
have the benefit of credit facility in the form of an irrevocable direct pay letter of credit issued by Barclays Bank PLC. Barclays Capital Inc. is the remarketing agent for the Series 2014C Bonds.
In December 2010, the Authority issued $239,315,000 of 2010 Series A and Series B Revenue Bonds to fund capital additions, repairs and improvements to the system, to fund a portion of the interest accruing on the 2010 Bonds to December 1, 2012, and to pay certain costs of issuance of the 2010 Bonds.
In September 2008, the Authority issued $575,375,000 of 2008 Series A and Series B Revenue Bonds for the purchase of a 36% interest in the 1230MW gas-fired, combined-cycle Redbud Power Plant (see Note 1), to fund capital additions, repairs and improvements to the system, to make deposits into the Bonds Service Reserve, Reserve, and Contingency accounts and to pay certain costs of issuance for the 2008 bonds.
In 2002, the Authority issued $104,966,340 Revenue Bonds for the acquisition, construction, and equipment purchases related to approved authority projects and to refund the remaining outstanding 1987 revenue bonds. This consisted of $86,330,000 Revenue Bonds, Refunding Series 2002A (the “2002A Bonds”) to refund $86,160,000 remaining of the 1987 Bonds. The 2002A refunding bonds were issued at a $4.5 million premium. The Authority recorded an initial accounting loss of approximately $371,000 in connection with this advance refunding, which was recorded as a deferred contra-liability and is being amortized to expense over the life of the new bonds. The difference between the present values of the old and new debt service payments was $2.0 million. The Authority realized all of the aggregate bond savings by decreasing the June 1, 2002, debt service payment. Additionally, the Authority also issued $18,636,340 Capital Appreciation Bonds, Revenue Bonds 2002B (the “2002B Bonds”) for the acquisition, construction and equipment of Authority projects. As previously noted in Note 5, the Authority deferred interest on the 2002B capital appreciation bonds until the bonds matured on June 1, 2014, at which time the deferred regulatory asset was expensed.
In 1995, the Authority issued $173,405,000 Revenue Bonds, Refunding Series 1995 (the “1995 Bonds”) to advance refund $171,755,000 of the outstanding 1987 Bonds. The Authority recorded an initial accounting loss of approximately $17.0 million in connection with this advance refunding, which was recorded as a deferred contra-liability and is being amortized to expense over the life of the new bonds which matches the maturity of the old bonds.
Monies from the 2002A and 1995 refunding bonds were placed in escrow for the payment of principal and interest on all the defeased bonds and were invested in obligations of the United States of America, which were deposited in irrevocable trusts with recourse against the trustee if funds are not available to pay principal, interest and any redemption premium on a timely basis. As the revenue bonds that are defeased are no longer direct liabilities of the Authority, they are not reflected on the accompanying Statements of Net Position.

- 35 -
The scheduled maturities of bonds payable at December 31, 2014, are as follows and reflect the scheduled payments to be remitted by the trustee to the bondholders:
Due to TrusteeCalendar
Years Ending Annual Semiannual Year Bond Debt ServiceDecember 31 Principal Interest Payments Requirement
2015 22,965,000$ 26,549,587$ 76,068,108$ 26,137,987 75,652,574
2016 23,795,000 26,137,791 76,075,098 25,649,190 75,581,981
2017 24,780,000 25,648,994 82,825,826 25,067,911 75,496,905
2018 37,510,000 25,067,519 87,648,185 24,357,770 86,935,289
2019 38,935,000 24,357,391 87,654,434 23,603,905 86,896,296
2020–2024 220,910,000 212,506,278 433,416,278 438,392,224 2025–2029 277,070,000 155,005,233 432,075,233 438,593,569 2030–2034 305,130,000 82,028,738 387,158,738 368,647,282 2035–2039 185,535,000 27,583,554 213,118,554 202,556,699 2040 16,915,000 502,074 17,417,074 7,466,313
1,153,545,000$ 730,203,922$ 1,883,748,922$ 1,865,927,738$
Due to Bond Holders
While GRDA makes monthly sinking fund payments for cash management purposes, per the General Bond Resolution No. 5107, the payments from the revenue fund to the debt service fund only need to be sufficient to pay the June 1st interest and principal payments and the December 1st interest payments.
To secure the bonds, the Authority has pledged all revenues of the Authority. Resolution No. 5107 and supplemental bond resolutions specify multiple covenants made by the Authority to the Bond Fund Trustee and bondholders. Among the more significant requirements, the Authority has covenanted to charge adequate rates, operate and maintain the facilities and make any necessary repairs, renewals, replacements and improvements. System properties are not to be encumbered or sold or disposed of and additional parity bonds are not to be issued unless certain conditions are met. As of December 31, 2014, the Authority was in compliance with bond covenants.
In general, federal tax laws require the Authority to rebate to the U.S. Treasury any profit from investments that yield a higher rate than the tax-exempt revenue bond proceeds. The Authority has no accrued liability balance for arbitrage rebate at December 31, 2014 and 2013, respectively.

- 36 -
7. RETIREMENT PLANS, POSTRETIREMENT, AND OTHER EMPLOYEE BENEFITS
The Authority participated in four retirement plans during 2014 and 2013. The plans currently available to the Authority personnel include three defined benefit plans and one defined contribution plan. A summary of significant data for each of the retirement plans and discussion of postemployment and other employee benefits follows:
Oklahoma Public Employees Retirement Plan
Plan Description—The Authority contributes to the Oklahoma Public Employees Retirement Plan (the “OPERS Plan”), a cost-sharing multiple-employer public employee defined benefit retirement plan administered by the Oklahoma Public Employees Retirement System (OPERS), a component unit of the State of Oklahoma (the “State”). The OPERS Plan provides retirement, disability and death benefits to its members and beneficiaries, primarily state, county, and local agency employees. The benefits provided are established and may be amended by the legislature of the State. Title 74 of the Oklahoma Statutes, Sections 901 through 943, as amended, assigns the authority for management and operation of the OPERS Plan to the Board of Trustees of the OPERS.
OPERS issues a publicly available annual financial report that includes financial statements and required supplementary information for OPERS. That annual report may be obtained online at www.opers.ok.gov, by writing to OPERS, PO Box 53007, Oklahoma City, OK 73152-3007, or by calling 1-800-733-9008.
Funding Policy—OPERS members and the Authority are required to contribute to the OPERS Plan at a rate set by statute. Contribution rates are established and may be amended by the legislature of the State. Each member participates based on gross salary earned (excluding overtime). As state employees, the Authority employees contribute 3.5% on salary. The Authority contributed 16.5%, on all salary for the fiscal years ended June 30, 2014, 2013 and 2012.
OPERS members have the option to elect to increase the benefit computation factor for all future service from 2.0% to 2.5%. The election is irrevocable, binding for all future employment under OPERS, and applies only to full years of service. Those who make the election pay the standard contribution rate plus an additional contribution rate, 2.91% which is actuarially determined. The election is available for all state, county, and local government employees, except for elected officials and hazardous duty members.
The Authority made 100% of the required contributions of $6,152,613, $5,661,691, and $5,301,390 for the years ended December 31, 2014, 2013, and 2012, respectively. These contributions equal the Authority’s annual OPERS pension cost for the respective years.
Oklahoma Law Enforcement Retirement Plan
Plan Description—Legislation passed during 2003 mandated that any lake patrolmen and dispatchers hired after August 29, 2003, shall participate as members of the Oklahoma Law Enforcement Retirement Plan (the “OLERS Plan”), a cost-sharing multiple-employer public employee defined benefit retirement plan administered by the Oklahoma Law Enforcement Retirement System (OLERS), a component unit of the State. The OLERS Plan provides retirement, disability, and death benefits to its members and beneficiaries, primarily state employees providing law enforcement. The benefits provided are established and may be amended by the legislature of the State. Three of the Authority’s patrolmen elected to transfer from the OPERS Plan to the OLERS plan under Title 47 Section 2-315 which provided that Authority lake patrolmen and dispatchers as of June 30, 2003, could make an irrevocable written election by January 1, 2004, to either pay the difference between the amount transferred between

- 37 -
the plans or receive eligible prorated service credit as defined in statute. Title 47 of the Oklahoma Statutes, Sections 2-300 through 2-315, as amended, assigns the authority for management and operation of the OLERS Plan to the OLERS Board.
The System issues a publicly available annual financial report that includes financial statements and required supplementary information for OLERS. That annual report may be obtained online at www.olers.state.ok.us, by writing to OLERS, 421 NW 13th St, Suite 100, Oklahoma City, OK 73103 or by calling 1-877-213-0856.
Funding Policy—System members and the Authority are required to contribute to the OLERS Plan at a rate set by statute. These are established and may be amended by the legislature of the State. Each member participates based on gross salary earned (excluding overtime). The Authority’s patrolmen and dispatchers participating in the OLERS Plan contributed 8.0%, and the Authority contributed 10% of total base salary through October 2012. Beginning November 2012, the Authority contribution rate increased to 11% of total base salary.
Participation in the OLERS plan was effective January 1, 2004. The Authority made 100% of the required contributions of $53,482, $46,366, and $41,900 for the years ended December 31, 2014, 2013, and 2012, respectively. These contributions equal the Authority’s annual OLERS pension cost for the respective years.
Oklahoma State Employees Deferred Compensation Plan
Plan Description—Employees of the Authority may also participate in the Oklahoma State Employees Deferred Compensation Plan (the “State Plan”), a voluntary deferred compensation plan administered by OPERS. The State Plan is a defined contribution plan available to all Authority employees, which permits participants to defer receipt of a portion of their salary until future years as authorized by Section 457 of the Internal Revenue Code and in accordance with the provisions of Chapter 45 of Title 74, Oklahoma Statutes. The State Plan is established and may be amended by the legislature of the State. Title 74 of the Oklahoma Statutes, Sections 901 through 943, as amended, assigns the authority for management and operation of the State Plan to the Board of Trustees of the OPERS. The minimum amount allowable to be deferred under the State Plan is $25 per month. Under state law, each employee is eligible to receive a $25 monthly matching contribution from the Authority to be deposited in a 401(a) retirement account. Employee contributions to the Plan totaled $1,009,976, $976,160, and $765,072 for the years ended December 31, 2014, 2013, and 2012, respectively. The Authority paid matching contributions and administrative fees of $147,727, $146,064, and $142,858 for the years ended December 31, 2014, 2013, and 2012, respectively.
GRDA Postemployment Healthcare Plan
Plan Description—GRDA Postemployment Healthcare Plan is a single-employer defined benefit healthcare plan administered by the Authority. GRDA Postemployment Healthcare Plan provides medical and dental insurance benefits to eligible retirees. Beginning in 2003, revisions to Title 82, Section 864.1 of the Oklahoma Statutes authorized the Authority to pay up to $60 per month of eligible employee-only health insurance premiums for each Authority retiree. Legislation passed in 2005 removed the $60 limitation. At the December 2005 board meeting, the Authority’s directors authorized the Authority to increase the amount to a defined benefit allowance of $105 per month for eligible retiree premiums, effective January 1, 2006. At the November 2007 board meeting, the Authority’s directors authorized the Authority to increase the amount to $200 per month for eligible retiree premiums, effective January 1, 2008. This increase resulted in increases in the Annual Required Contribution and the Actuarial Accrued Liability after January 1, 2008, as reflected below and in the Required Supplementary Information section.

- 38 -
Funding Policy—The contributions of plan members and the Authority are established and may be amended by the Board of Directors within the limits of Oklahoma statutes. The contribution is based on estimated pay-as-you-go financing requirements. For the years ended December 31, 2014, 2013, and 2012, the Authority contributed $513,578, $471,079, and $442,741, respectively, to the plan which consisted entirely of current premiums and included no additional contribution to prefund benefits.
Annual OPEB Cost and Net OPEB Obligation—The Authority’s annual other postemployment benefit (OPEB) cost (expense) is calculated based on the annual required contribution of the employer (ARC), an amount actuarially determined in accordance with the parameters of GASB Statement 45. The ARC represents a level of funding that, if paid on an ongoing basis, is projected to cover normal cost each year and amortize any unfunded actuarial liabilities (or funding excess) over a period not to exceed thirty years. The following table shows the components of the Authority’s annual OPEB cost for the year, the amount actually contributed to the plan, and changes in the Authority net OPEB obligation to GRDA Postemployment Healthcare Plan (included in Other noncurrent liabilities on the Statement of Net Position):
2014 2013 2012
Annual required contribution 789,793$ 795,031$ 795,031$ Interest on net OPEB obligation 80,204 56,093 56,093 Adjustment to annual required contribution (71,167) (49,773) (49,773)
Annual OPEB cost (expense) 798,830 801,351 801,351
Contributions made (513,578) (471,079) (442,741)
Increase in net OPEB obligation 285,252 330,272 358,610
Net OPEB obligation—beginning of year 2,291,545 1,961,273 1,602,663
Net OPEB obligation—end of year 2,576,797$ 2,291,545$ 1,961,273$
The Authority’s annual OPEB cost, the percentage of annual OPEB cost contributed to the plan, and the net OPEB obligation for December 31, 2014, and the two preceding years were as follows:
Percentageof Annual
Annual OPEB Cost Net OPEBYear-End OPEB Cost Contributed Obligation
December 31, 2012 801,351$ 55.25 % 1,961,273$December 31, 2013 801,351 58.79 2,291,545 December 31, 2014 798,830 64.29 2,576,797
Actuarial valuations of an ongoing plan involve estimates of the value of reported amounts and assumptions about the probability of occurrence of events far into the future. Examples include assumptions about future employment, mortality, and the healthcare cost trend. Amounts determined regarding the funded status of the plan and the annual required contributions of the employer are subject to continual revision as actual results are compared with past expectations and new estimates are made about the future. The schedule of funding progress immediately following the notes to the financial statements and presented as required supplementary information, presents multi-year trend information about whether the actuarial value of plan assets is increasing or decreasing over time relative to the actuarial accrued liability for benefits.
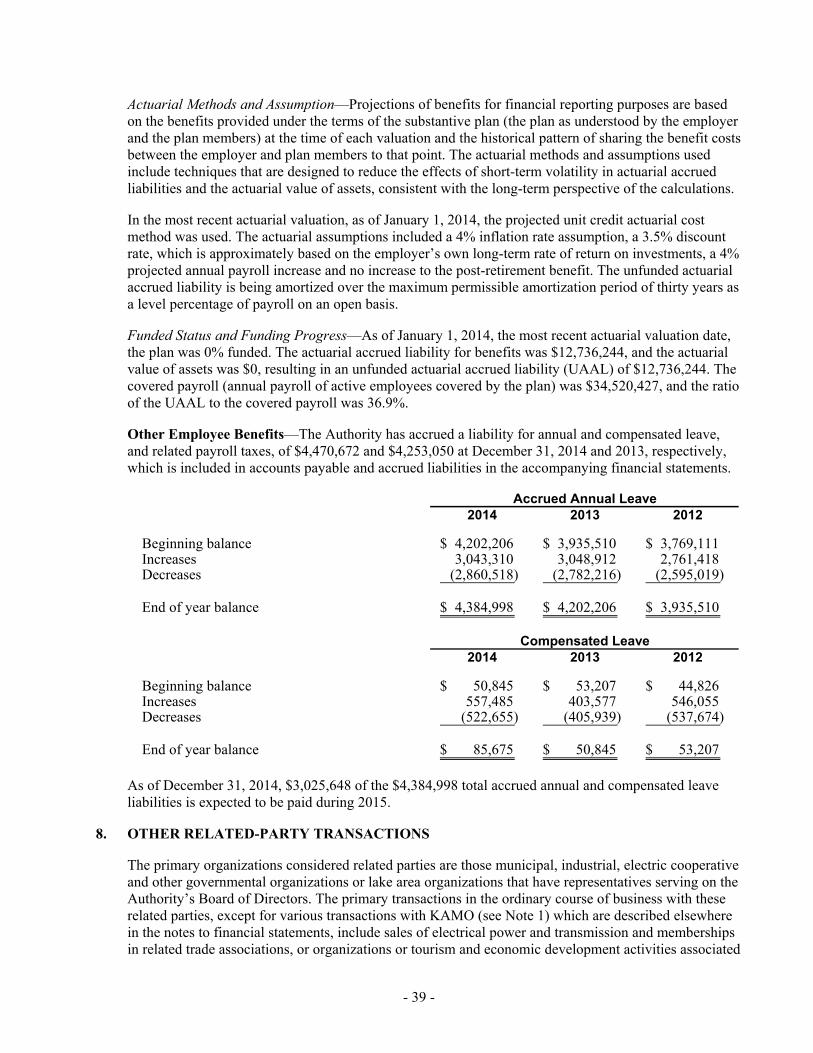
- 39 -
Actuarial Methods and Assumption—Projections of benefits for financial reporting purposes are based on the benefits provided under the terms of the substantive plan (the plan as understood by the employer and the plan members) at the time of each valuation and the historical pattern of sharing the benefit costs between the employer and plan members to that point. The actuarial methods and assumptions used include techniques that are designed to reduce the effects of short-term volatility in actuarial accrued liabilities and the actuarial value of assets, consistent with the long-term perspective of the calculations.
In the most recent actuarial valuation, as of January 1, 2014, the projected unit credit actuarial cost method was used. The actuarial assumptions included a 4% inflation rate assumption, a 3.5% discount rate, which is approximately based on the employer’s own long-term rate of return on investments, a 4% projected annual payroll increase and no increase to the post-retirement benefit. The unfunded actuarial accrued liability is being amortized over the maximum permissible amortization period of thirty years as a level percentage of payroll on an open basis.
Funded Status and Funding Progress—As of January 1, 2014, the most recent actuarial valuation date, the plan was 0% funded. The actuarial accrued liability for benefits was $12,736,244, and the actuarial value of assets was $0, resulting in an unfunded actuarial accrued liability (UAAL) of $12,736,244. The covered payroll (annual payroll of active employees covered by the plan) was $34,520,427, and the ratio of the UAAL to the covered payroll was 36.9%.
Other Employee Benefits—The Authority has accrued a liability for annual and compensated leave, and related payroll taxes, of $4,470,672 and $4,253,050 at December 31, 2014 and 2013, respectively, which is included in accounts payable and accrued liabilities in the accompanying financial statements.
2014 2013 2012
Beginning balance 4,202,206$ 3,935,510$ 3,769,111$ Increases 3,043,310 3,048,912 2,761,418 Decreases (2,860,518) (2,782,216) (2,595,019)
End of year balance 4,384,998$ 4,202,206$ 3,935,510$
2014 2013 2012
Beginning balance 50,845$ 53,207$ 44,826$ Increases 557,485 403,577 546,055 Decreases (522,655) (405,939) (537,674)
End of year balance 85,675$ 50,845$ 53,207$
Compensated Leave
Accrued Annual Leave
As of December 31, 2014, $3,025,648 of the $4,384,998 total accrued annual and compensated leave liabilities is expected to be paid during 2015.
8. OTHER RELATED-PARTY TRANSACTIONS
The primary organizations considered related parties are those municipal, industrial, electric cooperative and other governmental organizations or lake area organizations that have representatives serving on the Authority’s Board of Directors. The primary transactions in the ordinary course of business with these related parties, except for various transactions with KAMO (see Note 1) which are described elsewhere in the notes to financial statements, include sales of electrical power and transmission and memberships in related trade associations, or organizations or tourism and economic development activities associated

- 40 -
with the management of the lakes, including commercial and private dock permit fees. OG&E operates the Redbud facility under an operating agreement with the Authority and OMPA and allocates certain costs and expenses attributable to Redbud to the Authority and OMPA in accordance with their undivided ownership interests—see further discussion of Redbud facility in sections “Joint Participant” and “Joint Ownership” in Note 1.
9. COMMITMENTS AND CONTINGENCIES
In the normal course of business, the Authority makes and receives commitments for purchases of coal, natural gas and other materials and supplies inventory. In addition, in the normal course of business the Authority enters into agreements which commit the Authority to provide varying amounts of electric power to its customers. Management of the Authority does not believe the honoring of these commitments will have any material adverse effect on the Authority.
The Authority had contractual commitments at December 31, 2014, for long-term coal and freight purchases through 2020 under contracts with estimated minimum obligations. The minimum obligations below are based on the Authority’s contract rates and represents management’s best estimate of future expenditures under long-term arrangements.
Years EndingDecember 31
2015 130,726,000$ 2016 150,321,000 2017 154,200,000 2018 158,240,000 2019 162,440,000 2020 166,800,000
Total 922,727,000$
The Authority had a contractual commitment as of December 31, 2014, for a railcar operating lease with minimum obligations of $468,000 for 2015.
The Authority had contractual commitments as of December 31, 2014, for long-term service agreements at the Redbud facility for the maintenance of the gas and steam turbines of approximately $82.8 million through the year 2028. The Authority had contractual commitments as of December 31, 2014, for natural gas at the Redbud facility of approximately $43.2 million through the year 2016.
The Authority is a defendant in a lawsuit (“Allman”) brought by approximately 50 landowners claiming a constitutional taking and damages to real and personal property due to flooding beginning in the 1990s. Three “test cases” were appealed to the Oklahoma Supreme Court, which referred the cases to the Oklahoma Court of Civil Appeals. The Oklahoma Court of Civil Appeals issued its opinion on December 31, 2013. The Oklahoma Supreme Court first granted the Authority’s petition for certiorari and then withdrew its order, thus the opinion of the Court of Civil Appeals stands, and the claims have been remanded to the trial court in accordance with the opinion. Potential exposure related to this case, if any, cannot be predicted by management of the Authority.
The Authority is a defendant in a class action arising from 2007 flood events. There are approximately 400 potential class members. Plaintiffs are not currently prosecuting this case aggressively pending the outcome of the appeals in the Allman matter described in the preceding paragraph. Potential exposure related to this case, if any, cannot be predicted by management of the Authority.

- 41 -
10. FLYASH LANDFILL CLOSURE AND POSTCLOSURE COSTS
The Authority maintains a flyash landfill in Chouteau, Oklahoma. The Authority accounts for this flyash landfill in accordance with GASB Statement No. 18, Accounting for Municipal Solid Waste Landfill Closure and Postclosure Care Costs (“Statement No. 18”).
State regulations will require the Authority to place a final cover on the flyash site when it discontinues its depositing of flyash and to perform certain maintenance and monitoring functions at the site for eight years after closure. Although closure costs occur as the landfill is used, and in a manner consistent with the closure plan, postclosure costs will be paid near or after the date of discontinuance of use of the landfill. Statement No. 18 requires proprietary funds to report a portion of these costs as an operating expense in each period based on capacity and utilization. The amount recorded as a liability for the closure and postclosure costs in Other noncurrent liabilities at December 31, 2014 and 2013, was $1,403,739 and $1,357,000, respectively, which represents 87% and 85%, respectively, of the total estimated closure and postclosure costs. There was an increase in the liability from 2013 to 2014 of $46,739. The Authority will recognize the remaining estimated cost of closure and postclosure care of approximately $211,000 as the remaining estimated capacity is filled. These estimated closure amounts are based on what it would cost to perform all closure and post closure care in 2014. Actual costs are subject to change resulting from inflation, deflation, technology, or changes in applicable laws or regulations.
This flyash landfill has a total capacity of 7,449,987 cubic yards in which 5,131,024 cubic yards have been used through December 31, 2014. The remaining useful life at December 31, 2014, was approximately 32 years.
11. RISK MANAGEMENT
The Authority is exposed to a variety of risks and has obtained insurance to cover those risks, subject to negotiated coverage limits and exclusions. Resolution No. 5107 requires the Authority to, in each case where it is obtainable at a reasonable rate and on reasonable terms, insure its facilities, maintain liability insurance, and bond certain officers and employees. In general, other than workers’ compensation coverage, all insurance coverage including property (all risk coverage, including earthquake and flood), equipment, aircraft, employment practices liability, directors and officers liability, and excess liability (including an endorsement for certified “acts of terrorism” as defined in the Federal Terrorism Risk Insurance Act of 2002) , is purchased from private insurance carriers through the State of Oklahoma’s Office of Risk Management. The Office of Risk Management contracts with a third-party insurance broker for brokerage services and advice. Workers’ compensation insurance coverage is provided by CompSource Mutual Insurance Company (formerly Compsource Oklahoma). Settled claims have not exceeded commercial insurance coverage in any of the past three years. In addition, the Authority is subject to generation supply and market price risks, which are continually evaluated as to level of risk and how to best mitigate exposure to loss. Concentration of revenues from a single external customer also increases credit and market concentration risks. The Authority had two customers in 2014 and two customers in 2013 that accounted for 9% or more of the Authority’s operating revenues for the year. In 2014, sales to Western Farmers Electric Cooperative totaled approximately $71.5 million and sales to City of Coffeyville, Kansas totaled approximately $45 million. In 2013, sales to Western Farmers Electric Cooperative totaled approximately $64.6 million and sales to City of Coffeyville, Kansas totaled approximately $40 million.
* * * * * *

- 42 -
REQUIRED SUPPLEMENTARY INFORMATION (Unaudited)
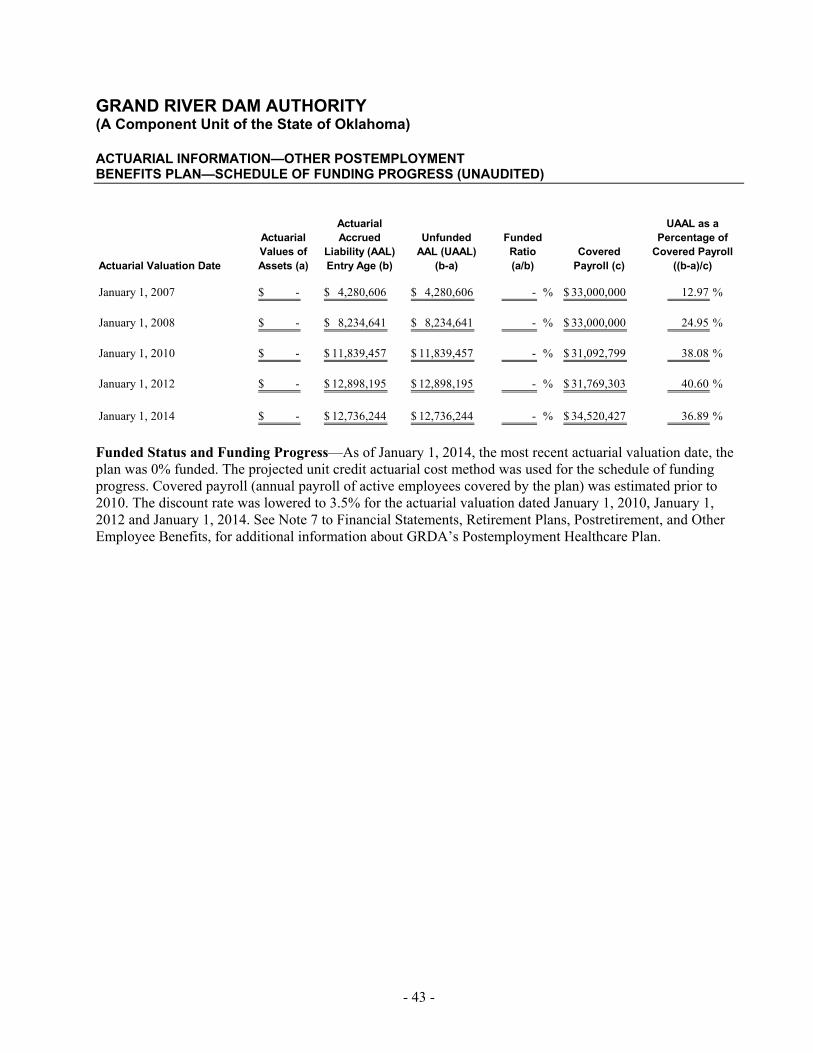
- 43 -
GRAND RIVER DAM AUTHORITY (A Component Unit of the State of Oklahoma)
ACTUARIAL INFORMATION—OTHER POSTEMPLOYMENT BENEFITS PLAN—SCHEDULE OF FUNDING PROGRESS (UNAUDITED)
Actuarial UAAL as aActuarial Accrued Unfunded Funded Percentage ofValues of Liability (AAL) AAL (UAAL) Ratio Covered Covered Payroll
Actuarial Valuation Date Assets (a) Entry Age (b) (b-a) (a/b) Payroll (c) ((b-a)/c)
January 1, 2007 -$ 4,280,606$ 4,280,606$ - % 33,000,000$ 12.97 %
January 1, 2008 -$ 8,234,641$ 8,234,641$ - % 33,000,000$ 24.95 %
January 1, 2010 -$ 11,839,457$ 11,839,457$ - % 31,092,799$ 38.08 %
January 1, 2012 -$ 12,898,195$ 12,898,195$ - % 31,769,303$ 40.60 %
January 1, 2014 -$ 12,736,244$ 12,736,244$ - % 34,520,427$ 36.89 %
Funded Status and Funding Progress—As of January 1, 2014, the most recent actuarial valuation date, the plan was 0% funded. The projected unit credit actuarial cost method was used for the schedule of funding progress. Covered payroll (annual payroll of active employees covered by the plan) was estimated prior to 2010. The discount rate was lowered to 3.5% for the actuarial valuation dated January 1, 2010, January 1, 2012 and January 1, 2014. See Note 7 to Financial Statements, Retirement Plans, Postretirement, and Other Employee Benefits, for additional information about GRDA’s Postemployment Healthcare Plan.

INDEPENDENT AUDITORS’ REPORT ON INTERNAL CONTROL OVER FINANCIAL REPORTING AND ON COMPLIANCE AND OTHER MATTERS BASED UPON AN AUDIT OF THE FINANCIAL STATEMENTS PERFORMED IN ACCORDANCE WITH GOVERNMENT AUDITING STANDARDS
Board of Directors of Grand River Dam Authority:
We have audited the accompanying financial statements of the Grand River Dam Authority (the “Authority”), a component unit of the State of Oklahoma, as of and for the year ended December 31, 2014, and the related notes to the financial statements, which collectively comprise the Authority’s basic financial statements as listed in the table of contents, and have issued our report thereon dated March 31, 2015. We conducted our audit in accordance with auditing standards generally accepted in the United States of America and the standards applicable to financial audits contained in Government Auditing Standards, issued by the Comptroller General of the United States of America.
Internal Control over Financial Reporting
In planning and performing our audit of the Authority’s basic financial statements, we considered the Authority’s internal control over financial reporting (internal control) to determine the audit procedures that are appropriate in the circumstances for the purpose of expressing our opinions on the basic financial statements, but not for the purpose of expressing an opinion on the effectiveness of the Authority’s internal control. Accordingly, we do not express an opinion on the effectiveness of Authority’s internal control.
A deficiency in internal control exists when the design or operation of a control does not allow management or employees, in the normal course of performing their assigned functions, to prevent, or detect and correct, misstatements on a timely basis. A material weakness is a deficiency, or a combination of deficiencies, in internal control, such that there is a reasonable possibility that a material misstatement of the entity’s financial statements will not be prevented, or detected and corrected on a timely basis. A significant deficiency is a deficiency, or a combination of deficiencies, in internal control that is less severe than a material weakness, yet important enough to merit attention by those charged with governance.
Our consideration of internal control was for the limited purpose described in the first paragraph of this section and was not designed to identify all deficiencies in internal control that might be material weaknesses or significant deficiencies. Given these limitations, during our audit we did not identify any deficiencies in internal control that we consider to be material weaknesses. However, material weaknesses may exist that have not been identified.
- 45 -
Compliance and Other Matters
As part of obtaining reasonable assurance about whether the Authority’s basic financial statements are free of material misstatement, we performed tests of its compliance with certain provisions of laws, regulations, contracts and grant agreements, noncompliance with which could have a direct and material effect on the determination of financial statement amounts. However, providing an opinion on compliance with those provisions was not an objective of our audit and accordingly, we do not express such an opinion. The results of our tests disclosed no instances of noncompliance or other matters that are required to be reported under Government Auditing Standards.
Purpose of this Report
The purpose of this report is solely to describe the scope of our testing of internal control and compliance and the results of that testing, and not to provide an opinion on the effectiveness of the entity’s internal control or on compliance. This report is an integral part of an audit performed in accordance with Government Auditing Standards in considering the entity’s internal control and compliance. Accordingly, this communication is not suitable for any other purpose.
March 31, 2015