grain surplus and deficit regions in mexicoafcerc.tamu.edu/publications/publication-pdfs/im-5-94...
TRANSCRIPT

GRAIN SURPLUS AND DEFICIT REGIONS IN MEXICO
Stephen Fuller Nicolas Gutierrez and Melanie Gillis
T AMRC International Market Research Report No IM-5-94
October 1994
Professor Graduate Research Assistant and Research Assistant respectively Department of Agricultural Economics Texas AampM University College Station Texas 77843-2124
GRAIN SURPLUS AND DEFICIT REGIONS IN MEXICO
Texas Agricultural Market Research Center (T AMRC) International Market Research Report No IM-1-94 by Stephen Fuller Nicolas Gutierrez and Mdanie Gillis Ocwber 1994 Special appreciation is expressed to Keith A Klindworth Assistant Chief Domestic Transportation Branch Transportation and Marketing Division Agricultural Marketing Service US Department of Agriculture for counsd offered during the course of this study Resources to carry our this study were provided by the USDA Agricultural Marketing Service the Texas Agricultural Experiment Station and a grant from the USDA Cooperative State Research Service
Absmct This report examines grain and soybean production and consumption in Mexico and estimates regional surplusesdeficits for corn wheat sorghum and soybeans Data devdoped from this effort will identify surplusdeficit regions so that subsequent studies might isolate and analyze transportation corridors important for US exports of these commodities to Mexico
The Texas Agrirulwral Market Research Center (TAMRC) has been providing timely unique and profossional research on a wide range of issues relating to agricultural markets and commodities of importance to Texas and the nation for more than two decades TAMRC is a market research service of the Texas Agricultural Experiment Station and the Texas Agricultural Extension Service The main TAMRC objective is to conduct research leading to expanded and more efficient markets for Texas and US agricultural products Major TAMRC research divisions include International Market Research Commodity Market Research and Contemporary Market Issues Research
11
GRAIN SURPLUS AND DEFICIT REGIONS IN MEXICO
EXECUTIVE SUMMARY
Mexico has become an increasingly important importer of US grains and soybeans A recent USDA study suggests that Mexico will increase corn sorghum soybean and wheat imports by 300 76 104 and 12 respectively above 1993 import levels by the year 2005 Unfortunately the transportation and grain handling infrastructure in Mexico appears inadequate to accommodate these projected increases efficiently The purpose of this study is to identify regions in Mexico which are deficient in grain and soybean supplies so that subsequent research might isolate and analyze the important transportation corridors for US exports of these commodities to Mexico
In 198990 the eight regions in Mexico analyzed in this study had an estimated deficit of 113 million metric tons (mt) Nearly 40 of the deficit was in the Central region with principal deficits located in the Distrito Federal Mexico Guanajuato Puebla and Hidalgo Other regions with significant deficits include the North (15) the Pacific Central (11) the North Central (10) the Pacific North (10) and the Gulf (8) Both overland and maritime transportation corridors will be important for US agriculture to efficiently meet grain and soybean demands in Mexico
111
GRAIN SURPLUS AND DEFICIT REGIONS IN MEXICO
TABLE OF CONTENTS
Page Abstract ii
Executive Summary lli
Factors Affecting Grain Production in Mexico 1 Corn Production 2 Wheat Production 3 Sorghum Production 4 Soybean Production 5
Factors Affecting Grain Consumption in Mexico 5
Estimation of Grain Consumption by LivestockPoultryDairy Sectors 6
Regional Estimates of Production Consumption and Apparent Surpluses and Deficits 7
Corn 7 Wheat 8 Sorghum 8 Soybeans 9
Mexican Grain and Soybean Production Policies 9 Corn Producer Subsidies 10 Sorghum Producer Subsidies 11 Wheat Producer Subsidies 11 Soybean Producer Subsidies 12 PROCAMPO A New Production Policy 12
Summary and Conclusions 13
Appendix Procedures for Estimating Mexican Grain Consumption 15
References 18
Figures 21
Tables 26
Appendix Tables 37
GRAIN SURPLUS AND DEFICIT REGIONS IN MEXICO
liST OF FIGURES
Figure Page
1 Mexican States 22
2 Study Regions in Mexico 23
3 Percent of Mexican Corn Wheat Sorghum and Soybean Production by Month 1987-1990 24
4 Estimated Mexican Population and Per Capita Gross Domestic Product 1980-1991 25
liST OF TABLES
Table Page
1 Mexico Corn Production by Region and State 1987-1991 27
2 Mexico Wheat Production by Region and State 1987-1991 28
3 Mexico Sorghum Production by Region and State 1987-1991 29
4 Mexico Soybean Production by Region and State 1987-1991 30
5 Mexico Estimated Grain Consumption by Livestock Poultry and Dairy 1989-1990 31
6 Mexico Estimated Corn ProductionConsumption and Apparent SurplusDeficit by Region and State 1989-1990 32
7 Mexico Estimated Wheat ProductionConsumption and Apparent SurplusDeficit by Region and State 1989-1990 33
8 Mexico Estimated Sorghum ProductionConsumption and Apparent SurplusDeficit by Region and State 1989-1990 34
v
LIST OF TABLES (continued)
Table Page
9 Estimated Soybean ProductionConsumption and Apparent SurplusDeficit by Region and State 1989-1990 35
10 Mexico Guaranteed and Negotiated Prices for Grains and Soybean 1989-1991 36
AI Mexico Broiler Production by Region and State 1987-1991 38
A2 Parameters and Assumptions to Estimate Grain Consumption by Mexican Poultry Industry 39
A3 Mexico Egg Production by Region and State 1987-1991 40
A4 Mexico Pork Production by Region and State 1987-1991 41
AS Parameters and Assumptions to Estimate Grain Consumption by Mexican Hog Industry 42
A6 Mexico Milk Cow Inventories by Production System Region and State 1990 43
A7 Parameters and Assumptions to Estimate Grain Consumption by Mexican Dairy Industry 44
A8 Mexico Grain-Fed Cattle Sheep and Goat Inventories by Region and State 1990 45
Vi
GRAIN SURPLUS AND DEFICIT REGIONS IN MEXICO
Mexico has become an increasingly important US agricultural trading partner since joining the General Agreement on Tariffs and Trade (GATT) in 1986 Recent approval of the North American Free Trade Agreement (NAFTA) is further reducing USlMexico trade barriers and increasing agricultural trade between the two countries US grains have typically been the largest export items to Mexico Recent studies suggest that NAFTA will further increase US grain exports to Mexico (Krissoff et al Valdes) Unfortunately constraints in the Mexican marketing and transportation infrastructure could hamper additional U SlMexico trade in grains and other bulk commodities (USDA 1992) In view of this concern this study estimates regional grainsoybean consumption in Mexico to identify likely grain deficit or import regions The results will offer important insight on the transportation corridors needed to efficiently link US grain surplus regions and Mexican grain deficit regions
Factors Afkaing Grain Production in Mexico
Mexico is located in a climatic transition zone with arid conditions in the north and humid subtropical conditions in the south and in selected coastal regions About 28 of Mexicos surface area is tropical Moderate to cool climates in central Mexico comprise about 23 of the countrys surface area (Figure 1) Dry climates in Mexico which include the northern border and north central states comprise about 49 of Mexican land area (Schulthies et al)
Rainfall in Mexico is concentrated in the July to October and December to January periods Annual rainfall in the southeastern portion of the country ranges up to 80 inches In the northwest regions however average rainfall is less than 6 inches Grain production is nearly impossible without irrigation in many of the northern states Average annual rainfall in the central states ranges from 24 to 40 inches (SARH 1989)
About 247 million hectares (ha) or 126 of the Mexican land mass (196 million ha) is arable Over the past decade an average of 213 million ha has been cultivated About 5 million ha are irrigated and approximately 14 of the remaining arable land receives adequate and reliable rainfall (Salinas)
The land tenure system in Mexico has had an important impact on crop production Land tenure was an important force behind the Mexican revolution of 1910-17 and was ultimately responsible for the development of the current small farm (ejido) system Following the revolution land was expropriated from large land holders and subsequently divided into small plots for
distribution to landless farmers The term ejido refers to land that the Mexican government has granted to groups of people Most ejidos include individual family land plots land held in common by all families in the ejido and community land In 1988 there was an estimated 307 million ejidatarios (ejido farmers) operating land plots which averaged 47 ha in size Because of their small size about 70 of the ejidos operate at a subsistence level and most ejidatarios are forced to seek offshyfarm employment (Grennes et al) In 1988 about half of Mexicos agricultural land was part of the ejido system Historically the ejido land could be bequeathed to an heir but not sold rented or mortgaged Recent land reform (December 1991) gives tide of the land to the ejidatarios which occupy the land and allows the ejidatarios to sell or lease the land Privatization of land holdings is intended to provide incentives to increase productivity farm size and output (Schulthies et al Valdes)
Corn Production
Corn is a staple in the Mexican diet and therefore has important sociological and political implications in MEXICO Corn is produced on approximately 7 million ha or about 53 of the harvested land area in Mexico Over 60 or about 22 million farmers in Mexico produce at least some corn (Knochenhauer) Torres estimates that 83 of Mexican corn producers annually harvest 2 ha or less of corn 14 harvest between 5 to 15 ha and only 3 harvest in excess of 15 ha According to Matus the average corn farmer harvests about 33 ha of corn per year The small subsistence farms tend to be located in southeast Mexico while larger farms are in central and northwest Mexico About two-thirds of the corn producing area is farmed under the ejido land tenure system Almost 90 of the producers in this system are subsistence farms (Valdes)
Historically about 88 of the planted corn area in Mexico has been rain-fed or nonshyirrigated while the remaining 12 has been irrigated Yields on rain-fed production average about 16 mtha (26 buacre) Irrigated production averages 37 mtha (59 buacre) The historical average national corn yield in Mexico is about 16 mtha (SARH 1991a) About 61 of the corn produced on irrigated farms is from large commercial operations Subsistence farmers grow over 65 of the corn produced on rain-fed land
In the 1989 and 1990 crop years 145 of the harvested corn area was irrigated with an average yield of 31 mtha (49 bushelsacre) Non-irrigated yields averaged 16 mtha Irrigated production comprised about 25 of total output while non-irrigated production comprised the remainder (SARH 1992) Mexican corn yields are low primarily because of continuous cropping and a land tenure system which is not conducive to the addition of technology (Torres)
During the 1980s corn production in Mexico ranged from 106 to 145 million metric (mt) Average production during this period was 122 million mt During the 1989-1990 period of this study corn production dropped to an estimated 109 million mt about 11 below the average Corn production in Mexico is variable because of marginal rainfall in many producing regions and the relatively small share of production which is irrigated (SARH 1992)
2
Corn is produced in every state in Mexico but production tends to be concentrated in the Central and Pacific Central regions (50) and the Pacific South (20) region (Table 1 and Figure 2) Historically nearly half of Mexican corn production has been located in Jalisco (15) Mexico (12) Puebla (7) Michoacan (7) and Guanajuato (4) which are the principal producing states in the central regions Chiapas a southern state has historically produced nearly 9 of the Mexican annual corn supply (Figure 1)
Corn produced in the central and south regions is planted in late winterearly spring and harvested during the late fallearly winter Nearly 85 of the Mexican corn supply is gathered in the November through February period (Figure 3)
Approximately one-third of the Mexican corn production is consumed on farm Another 65 of goes for human consumption while the remainder (35) is fed to livestock (primarily poultry and dairy animals) and used for seed Ejido farms of five ha or less consume about 60 of their production and market the remainder On average about two-thirds of Mexican corn production is sold off the farm where it subsequendy enters the commercial market channel Supplies to the commercial market channel are augmented by imports which averaged about 39 million mt during the 1988-91 period or about 38 of Mexican corn production About 85 of the corn in the commercial market channel is processed for direct human consumption (harina and nixtamal) while the remainder is processed into starch oil syrup other derivatives and balanced rations for animals (Garda Garda and Montero)
The production of nixtarnal involves the soaking of corn in lime water and then processed into dough or masa The masa is made into tortillas and chips The production of harina is similar except masa is dried and milled to the desired texture (Schulthies et al)
Wheat Production
Wheat is an important foodgrain in the Mexican diet Wheat comprises about 8 of the total harvested surface area (1 million ha) in Mexico and in contrast to corn is generally produced under irrigated conditions (Knochenhauer) In 1989 and 1990 crop years 87 of the harvested wheat production area was irrigated representing about 94 of total wheat output Yield on the irrigated production averaged 43 mtha (64 bushelsacre) Non-irrigated production averaged 18 mtha (27 buacre) (SARH 1992) Wheat yields in Mexico are among the highest in the world because of agronomic research and extensive use of irrigation In contrast to corn most of the wheat in Mexico is produced under relatively advanced technological conditions (Schulthies et al)
Wheat production in Mexico increased from approximately 22 million mt in the early 1970s to 45 million mt in the latter 1980s This doubling in output is attributed to improved varieties and associated higher yields expanded acreage irrigation and improved technology Production in
3
the 1989-90 study period was 44 million mt an output representative of the latter 19805 (SARH 1992)
Wheat production is concentrated in the Pacific North (62) and Central regions (22) of Mexico (Table 2) Sinaloa and Sonora (Pacific North region) produce 17 and 34 of the national wheat supply respectively Guanajuato and Michoacancontribute 17 and 5 respectively Approximately 99 of the Mexican annual wheat supply is generated in the April through July period (Figure 3)
Five classes of wheat are produced in Mexico (Groups I II III IV and V) Groups I and II are bread wheats More specifically Group I wheats are for commercial bread baking operations while Group II wheat is for at-home consumption Group III and IV wheats are soft wheats designed for cookies tortillas bread rolls cakes and pastry products Group V wheat is for pasta and macaroni Group III wheat is used in combination with Groups I and II wheat for purposes of bread production Historically about 42 of the annual wheat production has been Group I and II Group III production has comprised about one third of total wheat output Group IV wheat has made up about 10 of production and Group V about 15 All wheat groups are produced in substantial volume in northwest Mexico except Group II wheat which dominates central Mexico production (SECOFI)
Sorghum Production
Sorghum is the principal feedgrain produced in Mexico Sorghum comprises about 14 of the harvested area (17 million ha) and ranks third behind corn and dry beans in area harvested (Knochenhauer) In 1989 and 1990 33 of the harvested sorghum area was irrigated representing about 48 of total sorghum output Yield on the irrigated production averaged 47 mtha (74 buacre) while rain-fed production averaged 25 mtha (39 bushelsacre) (SARH 1992) Over half of Mexican sorghum production is on private farms greater than 5 ha
Mexican sorghum production during the 1989-90 study period was estimated to be 50 million mt about 14 below average production during previous 5-year period (1985-1989) Mexican sorghum production has increased about 90 during the past two decades as a result of expanded acreage (62) and increased yields (20) (SARH 1992)
Sorghum is produced in all regions of Mexico but is concentrated in Guanajuato (24) Jalisco (13) and Michoacan (10) Tamaulipas in the Gulf region and Sinaloa in northwest Mexico contribute approximately 31 and 6 respectively to the national sorghum supply (Table 3) Nearly 90 of the Mexican annual sorghum supply is generated in the fallwinter season when much of the central Mexican harvest is carried out (Figure 3)
4
Soybean Production
Soybeans account for over 50 of Mexican oilseed production Virtually all soybeans are processed (Schulthies et al) Soybean meal is an important source of protein for pork and poultry producers Soybean oil accounts for about 40 of the edible oils consumed in Mexico l
bull Soybeans are produced on approximately 4 of the Mexican harvested area (004 million ha) (Knochenhauer) In 1989 and 1990 crop years approximately 83 of the Mexican harvested production area was irrigated Yields on irrigated production averaged 22 mtha (33 bushelsacre) Yields on rain-fed production averaged 13 mtha (19 bushelsacre) About 90 of Mexican soybean output was produced on irrigated land in 1989-1990 (SARH 1992)
Soybean production in Mexico averaged about 07 million mt in the 1985-89 period about one-third below the 1989-1990 production of nearly 10 million mt Soybean production is concentrated in the Pacific North where Sonora and Sinaloa have historically accounted for about 25 and 48 respectively of national soybean output (Table 4) Soybean production in this region tends to be produced on relatively large private farms (USDA 1992) Tamaulipas in the northeast has a historical production share of 12 Virtually all remaining production is concentrated in Chiapas Chihuahua and Veracruz Over 80 of Mexican soybean production is harvested in September (25) and October (58) (Figure 3)
Factors Affecting Grain Consumption in Mexico
Mexico has an estimated population of nearly 90 million which has grown at an average rate of 23 over the past decade Mexico is the eleventh most populated country in the world The population of Mexico is relatively young with an average age of 22 As a result the work force increases about 4 per year (Schulthies et al) Mexico City alone has a population in excess of 10 million making it the most populated city in the world The greater Mexico City urban area is estimated to have a population of nearly 20 million accounting for almost 20 of the national population Other large concentrations of people are in the cities ofGuadalajara Jalisco Monterrey Nuevo Leon and Puebla Puebla
Historically Mexico was a population of rural peoples In 1940 about two-thirds of the Mexican population lived in rural areas By 1980 however only one of every three Mexicans lived in a rural area In 1990 an estimated 275 of all Mexicans lived in rural areas (Salinas) The Mexican rural population is thought to have peaked in the mid-1980s at nearly 25 million and is projected to decline to less than 20 million by the year 2000 (Schulthies et al)
Personallnterview with official from Consejo de la Industria Acdtera Mexicana SA
5
I
Until the early 1980s income from oil exports provided the basis for rapid economic growth in Mexico Growth in gross domestic product from 1977 to 1981 averaged about 85 Duting this period Mexico borrowed heavily from foreign institutions to finance public projects Unfortunately falling oil prices and rapidly increasing interest rates in 1982 erased many ofMexicos earlier economic gains A burgeoning foreign debt rampant inflation and a dramatic decline in Mexican consumer purchasing power resulted The standard of living in Mexico declined to 1960 levels (Schulthies et al) Income from one day of work (minimum wage) in 1982 purchased 85 kilos of pork compared to only 45 kilos in 1987 Similarly one day of income in 1982 purchased 51 kilos of chicken compared to only 22 kilos in 1987 Per capita GNP declined about 40 from 1981 to 1987 (Figure 4)
Since the economic crisis in the early 1980s Mexico has changed its policy of protectionism by reducing subsidies deregulating industry and initiating a process to privatize many inefficient state-owned enterprises As a result Mexican GNP commenced positive growth in the mid-1980s Between 1987 and 1991 per capita GNP increased about 60 Recent policy reforms have generated optimism regarding future economic growth in Mexico (Figure 4)
Estimation of Grain Consumption by LivestocklPoulttylDairy Sectors
To estimate regional feedgrain consumption by the livestock and poultry sectors in Mexico production estimates (pork broiler egg turkey sheep and goat) for each state were converted into feed requirements and subsequendy into grain demands Grain consumption by the dairy and catde feeding sectors were calculated from estimates of state populations and representative rations Conversion coefficients and rations were obtained from interviews with government and private sector representatives in Mexico and US personnel who consult with the livestockpoultry and dairy sectors in Mexico State estimates of livestockpoultry production were taken from the Instituto Nacional de Estadfstica Geografia e Informatica (INEGI 1992) National projections were obtained from the USDA Production Supply and Demand Database An effort was made to adjust livestock poultry and dairy consumption to a October 1 1989-September 30 1990 production year in order to keep grain and livestock-poultry production periods the same (SARH 1991b) Details on the procedures used to estimate feedgrain consumption are presented in the Appendix
Estimating regional grain consumption in Mexico is particularly difficult because of the variability in both the livestock production estimates and Mexican animal production systems Despite the various problems associated with estimating regional feedgrain demands the national estimates approximate the data in the USDA Production Supply and Demand Database and provided by Bivings The latter estimated that Mexican feedgrain demand at approximately 77 million mt in 1989 an estimate similar to the 75 million mt estimate in this study and by the US Department of Agriculture (Table 5)
The Mexican poultry industry comprised about 47 of national feedgrain demand in 1989shy90 The hog sector was responsible for 29 of total feedgrain disappearance Approximately 18
6
of total feedgrain demand in Mexico was attributed to the dairy industry with the remaining 6 distributed among the beef sheep and goat industries (Table 5) Nearly half of Mexican feedgrain demand was located in the states of Jalisco (l5) Sonora (10) Puebla (9) Guanajuato (8) and Michoacan (6) The Central (30) Pacific Central (23) and Pacific North (17) regions accounted for about 70 of the national demand for feedgrains (Table 5)
Regional Estimates of Production and Consumption and Apparent Surplus and Deficit Regions
The calculation of the apparent feedgrain surplus or deficit that exists in a region (as determined by subtracting the estimated consumption from estimated production in each region) offers some perspective into the location ofMexican excess demand regions and potential destinations for US grainsoybean exports National production and consumption estimates generally conform to estimates included in the USDA Production Supply and Demand Database These data include input from agricultural attaches at US embassies FAS personnel and country and commodity analysts with the USDA Economic Research Service (ERS) In general production and consumption estimates included in the USDA Production Supply and Demand Database were similar to the official Mexican data estimates When differences did occur however the Mexican estimates were adjusted to reflect those of the USDA
Corn
Much of the Mexican corn supply is consumed directly as tortillas chips and dry masa flour Numerous small processing plants produce these products for direct human consumption Torres indicates that corn processing capacity is highly correlated with the population Accordingly for this study corn for direct human consumption was assumed to be proportional to regional population
Corn for direct human consumption was estimated to be 012 mtcapita (INEGI 1988) This parameter in combination with population (86 million) was used to generate a human corn consumption estimate of 1032 million mt It is estimated that 8-10 of Mexican corn production is diverted to livestock feed This corn is often not suitable for human consumption and some is fed by small producers regardless of the government prohibition Estimates of lossseed and corn processing demands were taken from Garda Garda and Sagarnaga and communication from Secretada de Comercio y Fomento Industrial (SECOFI)
Based on production and consumption estimates for 1989-90 only five states (Chiapas Guerrero Tlaxca1a Puebla and Tamaulipas) and one region (Pacific South) have a corn surplus (Table 6) Nearly half of the Mexican corn deficit (47) is located in the Central region where the
7
Distrito Federal (Mexico City) and Mexico have deficits of 26 and 13 respectively of the total Mexican corn deficit Additional states with large deficits include Nuevo Leon Sonora and Veracruz accounting for 10 11 and 7 respectively of the Mexican 1989-90 corn deficit These three states in combination with the Distrito Federal and Mexico include cwo-thirds of the projected Mexican deficit (Table 6)
Wheat
The flour milling industry in Mexico is comprised of 133 plants that tend to be located near large population centers (1992 Milling Directory and Buyers Guide) The installed flour milling capacity in Mexico is approximately 17000 mt per 24 hour period Nearly 60 of this capacity is located in the Distrito Federal (17) Puebla (II ) Mexico (9) Guanajuato (9) Michoacan (6) and Nuevo Leon (6) In contrast Sonora the leading wheat producing state in Mexico has approximately 2 of the Mexican installed milling capacity
Historic data on the quantity of wheat milled annually by wheat class in seven regions or states in Mexico (Distrito Federal and Mexico Central Northwest Gulf Puebla Northeast and Jalisco) in combination with state-level milling capacity was used to estimate the quantity of each wheat class milled per state Historic data on wheat produced and milled by region and wheat class were obtained via a communication from the Apoyos y Servicios a la Comercializaci6n Agropecuaria (ASERCA) Milling capacity by state was taken from 1992 Milling Directory and Buyers Guide
Estimated quantities of Durum (Group V) wheat produced and milled by state were removed when estimating state-level productionconsumption Accordingly wheat production and consumption estimates represent only hard and soft wheat Durum or Group V wheat is produced in excess of domestic demands Production of this wheat (500000 mt) is concentrated in Sonora where considerable quantities are fed by the poultry and livestock industries and exported (USDA GEDES Reports)
Two regions have a dominant effect on Mexican wheat production and consumption - the Pacific North region with an estimated 176 million mt surplus and the Central region with a deficit of 128 million mt The remaining six regions have a comparatively modest deficit for a total apparent national deficit of 317000 mt Principal deficits are located in the Distrito Federal (665852 mt) Puebla (416005 mt) Mexico (389871 mt) and Nuevo Leon (211794 mt)(Table 7)
Sorghum
Sorghum is the primary feedgrain in Mexico Approximately 80-85 of Mexican feedgrain demands are met with sorghum Less than 3 of the total sorghum supply is used in industrial and food processes In 1989-90 six of the seven Mexican regions had an estimated grain sorghum
8
deficit The seventh region (the Gu1f) had an estimated 363807 mt surplus Approximately 60 of the Mexican grain sorghum deficit (26 million mt) was located in the Central (38) and North Central (22) regions Another nearly 20 was concentrated in the North region (Table 8)
Soybeans
Virtually all of the Mexican soybean supply (97) is crushed or processed for purposes of producing meal and oil Soybean processing by state was estimated from a list of operating processors in 1990 and their associated installed capacity The portion ofnational processing capacity operated by state was used to allocate national crushing to each state (Table 9)
Surplus Mexican soybean production is concentrated in the Pacific North (84) Deficits in supply are located in the Pacific Central and Central regions These respective regions include about 33 and 55 of the national soybean deficit of 085 million mt in 1989190
Mexican Grain and Soybean Production Policies
The government ofMexico has actively influenced the production and consumption ofgrains and soybeans and therefore regional surpluses and deficits through various policies Production policies have generally included guaranteed output prices and subsidized inputs (ie subsidized interest insurance electricity and irrigation and purchased inputs like fertilizer and pesticides) In addition low-income producers have received additional production and marketing subsidies as part of the governments commitment to economic equity (Roberts and Trapido) During the 1980s however economic pressures forced the government of Mexico to begin reducing subsidies For example guaranteed support prices were not fully adjusted for inflation implying declining real producer prices Further guaranteed commodity prices were no longer announced at planting adding to producer uncertainty Also subsidies for purchased inputs were reduced However Mexican grain producers during the 1980s continued to be protected by import licensing requirements and tariffs In general import licenses were not granted until domestic supplies of the respective grains were depleted which supported the price of domestic supplies higher than world price levels
The US Department of Agriculture estimates that during the 1985-87 period transfers by the Mexican government to producers accounted for over one-half of the value of Mexican corn production nearly one-half of the value of Mexican sorghum production (47) 41 of the value
9
of soybean production and about 15 of the value of Mexican wheat production (USDA 1992)2 Most of the subsidies to corn producers (about two-thirds of the total subsidy) was in the form of price supports and trade protection with the remaining subsidies for purchased inputs Similar subsidy ratios held for other grains and soybeans except wheat where as much as 80 of the subsidies were for purchased inputs (Grennes et al)
During the 1989-91 period Mexican government agricultural policies and subsidies were substantially altered Guaranteed prices were eliminated in the fall of 1989 for all commodities except corn and dry beans for which guaranteed prices are still calculated in a manner that isolates corn and dry beans from world market price variations In lieu of guaranteed prices a system of negotiated prices (Precios de Concertaci6n) were established for other grains and soybeans The negotiated sorghum prices were based on expected import prices while negotiated soybean prices were set near imported price levels for crushers but above international prices for producers
Corn Producer Subsidies
Farm credit subsidies for corn have been significant because about one-half of the corn producers are ejidatarios who have generally been unable to secure short-term commercial loans Under the ejido land tenure system the land is owned by the government but provided to peasant farmers for their use Consequendy ejidatarios have not been able to use their land as collateral to secure commercial loans The government designed a fiscal support program in 1987 to partially subsidize machinery purchases andor production infrastructure for corn producers Producers in rain-fed areas received payments for 25 of these expenditures while producers in irrigated areas received 15 This program was eliminated in 1989
Since 1990 the government ofMexico has established different guaranteed support prices for yellow and white corn For the 1990-91 marketing year the price of white corn was set at 636000 pesos ($557bushel) and 530000 pesos ($464bushel) for yellow corn (Table 10) Guaranteed prices to Mexican corn producers increased substantially during the 1989-91 period (Table 10) (USDA GEDES Reports Salinas de Gortari) In nominal terms white corn (food corn) prices increased about 67 in nominal terms but about 33 in real terms For yellow corn nominal prices increased about 33 and real prices about 20 Historically Mexico has controlled corn imports through a system of import licensing
Sorghum Producer Subsidies
Historically price supportS and import licensing accounted for much of the support to sorghum producers as did subsidies for credit and insurance However Mexico has eliminated most
The rdated percentages were estimated using official Mexican exchange rates When subsidies are calculated using an estimated equilibrium
exchange rate the subsidies were 25 to 30 percent larger
10
2
of producer subsidies in favor of subsidies for human consumption Subsidies for machinery purchases and production infrastructure were eliminated for sorghum producers in 1989
Historically the sorghumcorn price ratio was maintained at about 060 Strong pressure from producers in the early 1980s however resulted in an increase in the sorghum support price producing a shift toward the production of sorghum Nevertheless the government has increased the price of corn relative to sorghum since 1989 as a result maintaining guaranteed prices for corn while shifting to a negotiated price system for sorghum (Table 10)
Under the negotiated price system for sorghum CONASUPO (Compafiia Nacional de Subsistencias Populares) no longer purchased sorghum to support prices Rather users were required to purchase the entire domestic crop before importing In 1990 the government instituted a seasonal (May I-December 1) 15 ad valorem tariff to assute purchase of the domestic crop
The negotiated sorghum prices were based on international prices plus transportation and tariffs Domestic farm-level prices generally move parallel to US prices During the study period (I989-91) planted sorghum acreage decreased Land formerly planted to sorghum was shifted to corn as a result of the relatively high guaranteed corn price and the uncertainties of the negotiated sorghum price
Wheat Producer Subsidies
Wheat input subsidies for fertilizer credit and irrigation water in Mexico have all decreased in recent years Irrigation water and fertilizer have accounted for a large share of the subsidy to these producers Producers paid an estimated 30 of the market price for irrigation water and capital costs of irrigation systems Fertilizer costs to wheat farmers were 40 to 60 of the price of imported fertilizer Subsidies for machinery and production infrastructure were discontinued for wheat farmers in 1989
Mexico protected its domestic wheat market through import licensing and tariffs Since 1992 CONASUPO has permitted private millers to import wheat Milling wheat has no tariff Durum wheat has a 15 ad valorem duty that is being reduced over 10 years under NAFT A
Implementation of the negotiated price system for wheat in 1989 has attempted to move the wheat sector toward market-oriented price policies For the 1989-90 wheat harvest Mexican producers were given the choice between an open market with higher prevailing prices at that time or a lower domestic price but with the guarantee that their entire crop would be marketed at the negotiated price Mexican wheat producers opted for the lower negotiated price which was fIxed For the 1990-91 wheat crop the Mexican government wanted to adopt international wheat prices The dramatic decline in world price however was thought to create major hardships for Mexican wheat producers Accordingly a negotiated formula price was adopted for the 1990-91 harvest The resulting price was calculated in the manner of a guaranteed price It is the intent of the Mexican
11
government to move to international prices for wheat production but if necessary to provide a subsidy payment
Soybean Producer Subsidies
Input subsidies to soybean producers have generally declined in recent years Irrigation water has been highly subsidized In 1990 the subsidy for irrigation water was increased Subsidies for machinery and production infrastructure were eliminated in 1989
Historically import licenses and import duties insured that the domestic crop would be purchased before foreign supplies However import license requirements for soybeans intended for crushing were suspended in July 1990 and a seasonal tariff (10 ad valorem) was put into effect for October 1 through December 31 A 15 tariff was implemented for the period August 1 1991 through January 31 1992
Beginning with the 1990 crop soybean prices were established through negotiations (precios de concertacion) In the fmt year the negotiated price was based on a fifteen day average of the nearest soybean futures price plus transportation and internment costs and the tariff equivalent Soybean output fell in 1990 due to limited water availability in northwest Mexico rather than the lower negotiated prices Although water was abundant in the following year world soybean prices were low Responding to pressure from the politically powerful producers in northwest Mexico a tariffwas initiated and prices were established at about 850000 pesos per mt For the 1991 soybean crop the negotiated price was 810000 pesos per mt with producers to receive an additional subsidy payment equal to 70000 pesos per mt
PROCAMPO A New Production Policy
In October 1993 President Salinas announced PROCAMPO a new domestic farm program ~The program coincides with Mexicos obligation under NAFTA to move away from border policies as the means of agricultural price support PROCAMPO replaces current price support schemes for major crops (grains cotton soybeans and safflower) and generally implies farm prices above international price levels Domestic prices will gradually be aligned with international prices Direct income payments are made to eligible producers based on historical acreage with no production requirement The payments are to compensate for lower prices expected as trade barriers are lowered under NAFTA Payments are to be flXed for ten years then completely phased out in years 11 through 15 (Valdes)
PROCAMPO is to be phased-in gradually in 1993-94 and become operational in 1995 During the phase-in producers will receive reduced price supports in combination with per hectare payments In the first year the producer will receive 330 new pesosha ($45acre) and 350 new
12
pesosha in real terms in the second through the tenth years In the autumnwinter of 1994-95 corn wheat soybeans and sorghum are to be aligned with international prices Eligible producers are to receive payments based on historical area planted and yield PROCAMPO is considered to
be a socially superior program to price supports since cash benefits are provided to subsistence producers Historically subsistence producers consumed much of their own production on farm and benefitted little from selling crops at relatively high supporc prices
To be eligible for the program producers are required to be registered in the 1993 census as cultivating one of the eligible crops for the last three years New lands will not be allowed in the program This latter stipulation is to prevent qualification by clearing forest or marginal lands Producers who qualify will receive payments regardless of the crop produced Estimated acreage to benefit from PROCAMPO represents 70 of total cultivated area in Mexico
An analysis by the US Depanment of Agriculture suggests that PRO CAM PO will lead to lower grain prices in Mexico (Valdes and Hjorc) Lower prices will reduce acreage planted lower production raise consumption and increase imports Implementation ofPRO CAMPO and NAFTA are expecred to increase Mexican feedgrain demand and imports Corn impons are expected to increase from 15 million mt in 1993 to 60 million mt in 2005 Mexican imports of sorghum are expected to increase steadily from 29 million mt in 1993 to 51 million mt in 2005 and soybean imports from 21 million mt in 1993 to 43 million mt by 2005 Wheat imporcs by Mexico are projected to grow more modestly increasing from 17 million mt in 1993 to 19 million mt in 2005 (Valdes)
Summary and Conclusions
A recent study by the US Department ofAgriculture indicates that corn sorghum soybean and wheat imports by Mexico will increase 30076 104 and 12 respectively above 1993 expon levels during the 1994-2005 period (Valdes and Hjort) The transportation and grain handling infrastructure in Mexico however appears inadequate to efficiendy accommodate these projected increases The purpose of this study was to identify regions in Mexico which are deficient in grain and soybean supplies so that subsequent studies might isolate and analyze USMexico transponation corridors imponant for the expon of grainsoilseeds to Mexico
In 1989-90 the eight analyzed regions in Mexico had an estimated deficit of about 11 million mt Nearly 40 of this deficit was located in the Central region which was calculated to have deficits of 18 million mt 13 million mt 10 million mt and 03 million mt in corn wheat sorghum and soybean supplies respectively Principal deficits in the Central region are located in the Distrito Federal Mexico Guanajuato Puebla and Hidalgo Other regions with significant deficits include the North (16) Pacific Central (11 ) North Central (10) and Pacific North (10)
13
Appendix Procedures for Estimating Mexican Grain Consumption
This appendix identifies the geographic location ofMexican livestockdairypoultry production and parameters and assumptions used in calculating their feedgrain consumption
PoultryBroilers
Approximately two-thirds of Mexican broiler production is concentrated in the Central (36) Pacific Central (16) and North Central (13) regions Leading states in these regions include Jalisco Guanajuato Durango Mexico Morelos and Puebla Other important producing states include Nuevo Leon Sinaloa Veracruz and Yucatan (Table AI)
The Mexican broiler industry is highly concentrated and employs fully integrated production systems similar to those in the United States It is estimated that about 1 of the broiler operations in Mexico produce about 56 of all broilers (Schulthies et al) Interviews with Mexican and US personnel indicated broiler production technology in Mexico is similar to that in the United States and is generally used throughout Mexic03bull Turkey meat production in Mexico is modest and is projected to be about 3 of broiler production Table A2 shows parameters and assumptions used to calculate grain consumption by the Mexican poultry industry
PoultryLayers
Over one-half of Mexican egg production is concentrated in Jalisco (22) Puebla (20) and Sonora (14) Other important producers include Nuevo Leon and Sinaloa (Table A3) An estimated 22 of the laying enterprises in Mexico produce about 67 of the national supply The majority of these large layer operations are fully integrated and utilize modern technology equal to
that in developed countries (Schulthies et al)
Hog
Pork production in the Bajio comprises nearly 40 of national output States in this region include Jalisco Guanajuato and Michoacan with 19 11 and 10 production shares
Advice on broiler and egg production in Mexico was provided by Cirpriano BerIruljo-Osornio Union Nacional de Avicultores Mexico City
Mexico
14
3
respectively Puebla a state in the Central region produces about 5 of national production while Sonora in the Pacific North has a 13 production share (Table A4)
In contrast to poultry production in Mexico hog production is carried out under a variety of systems Three systems dominate (1) technical (2) semi-technical and (3) rural systems The technical system is an intensive confined feeding system and tends to parallel technology in the United States The semi-technical system typically involves smaller less capitalized production units than those characterized by the technical system With the rural or traspatio system hogs scavenge for much of their food supply No grain or concentrate are typically fed An estimated 35 of the Mexican pork supply is generated by the technical system which includes about 17 of the nations breeding herd The semi-technical system includes about 30 of the hog population and produces about 35 of the national pork output In contrast the rural system includes 53 of the hog population but produces only 30 of the annual pork supply
Hogs produced in the technical and semi-technical systems consume grain but tend to be characterized by differing conversion ratios Hogs in the rural system consume virtually no grain To accurately estimate grain consumption by hogs in the technical and semi-technical systems Perez estimated state-by-state production accomplished by each system4
bull This information in combination with conversion ratios and other parameters was used to estimate grain consumption (Table A5)
Dairy
The Mexican dairy production industry is characterized by three production systems including (1) the technical or confined system (2) the semi-technical or pastoral system and (3) the dual-purpose system The technical or confined system includes an estimated 14-18 of the Mexican dairy herd and produces about 50 of the domestically produced milk Cows in this system are typically Holsteins which produce 4000 to 6000 liters per year These animals are fed high quality forages and concentrates Artificial insemination is a typical breeding practice Some heifer replacements are imported from the United States or Canada In general herds in this system are well managed and similar to large dairy farms in the southwest United States (Knutson et al Hallberg et al Odermatt et al)
The semi-technical or pastoral system includes about 23 of the national dairy herd and about 17 of Mexican milk production Most cows in this system are crosses between Zebu and Holstein or Brown Swiss Cows in this system annually produce up to 4000 liters and are maintained on improved pasture supplemented by corn stalks grain and oilseed meals
Dual-purpose operations in Mexico are primarily beef production units that earn additional income by milking lactating beef cows Cows in this system are typically Zebu with annual
4 Rosario Perez-Espejo is witlt Comisi6n Nacion de Porcicultura Mexico City Mexico
15
production of 540 to 750 liters per year Cows in this system are fed on native pasture and receive no grain or concentrate
Grain consumption by animals in the technical and semi-technical production systems was estimated from data on regional populations and rations Population data was obtained from the Secretarfa de Agricultura y Recursos Hidraulicos and rations from dairy farms in Mexico (Tables A6 and A7)
Beef
Although beef is important in the Mexican diet a relatively small portion of Mexican beef production is grain-fed An estimated 580000 head were grain-fed during 1990 To calculate grain consumption it was assumed that approximately 160 kiloshead are gained during the feeding process and that the feed to meat conversion ratio is 80 1 (Table A8) Further it was assumed that 40 of the ration was grains
SheepGoats
Sheep and goats are a relatively minor source of meat for the Mexican population In 198990 approximately 57000 mt of sheep and goat meat were produced in Mexico Production is concentrated in San LUls POtOSl (15) Mexico (9) Coahuila (7) Puebla (7) Hidalgo (6) and Zacatecas (5) Population data in combination with a coarse grain conversion ratio of 19 were used to estimate grain consumption (Sullivan et al)
Advice on beef ration and consumption provided by Ricardo Celrna US Feed Grains Council Mexico City Mexico
16
5
References
Apoyos y Servicios ala Comercializaci6n Agropecuaria (ASERCA) FAX communication 1993
Bivings EL Price Seasonality and Trade Liberalization A Dynamic Spatial Modd of the Mexican Feedgrains Sector Unpublished PhD Dissertation Stanford University 1992
Garda JA MA Garda and LM Sagarnaga Flujos Comerciales de Maiz en Mexico CONASUPO 1992
Garcia MR DG Garcia and HR Montero Notas Sobre Mercados y Comercializacion de Productos Agropecuarios Colegio de Post-graduados Montecillo Mexico 1990
Salinas de Gortari e Quinto Infonne de Gobierno 1993 Anexo Poder Ejecutivo Federal 1993
Grennes T J Hernandez B Krissoff J Matus J Sharples and e Valdes An Analysis ofa United States-Canada-Mexico Free Trade Agreement Commissioned Paper No 10 International Agricultural Trade Research Consortium November 1991
Hallberg Me JR Cranney SM Smith and eM Faldes The Mexican Dairy Economy and Potentials ofLiberalized Trade for the us Dairy Industry AE amp RS 236 Agricultural Economics and Rural Sociology Department The Pennsylvania State University July 1992
Instituto Nacional de Estadlstica Geografia e Informatica (INEGI) Abasto y Comercializacion de Productos Bdsicos Maiz 1988
Instituto Nacional de Estadlstica Geografia e Informatica (INEGI) El Sector Alimentario en Mexico Edici6n 1992
Knochenhauer G La Modernizaci6n dd Agro en Mexico Comercio Exterior VoL 40 No9 September 1990
Knutson R eP Rosson III J Oudaw A Angel and J Miller NAFTA and the us Dairy Industry AFPC Policy Working Paper 93-3 Department of Agricultural Economics Texas AampM University May 1993
Krissoff B L Neff and J Sharples Estimated Impacts of a Potential US-Mexico Preferential Trading Arrangement for the Agricultural Sector Agriculture and Trade Analysis Division Economic Research Service US Department of Agriculture January 1992
Matus J Precios de Garantfa y PoHtica Agraria Comercio Exterior VoL 40 No 10 October 1990
17
Mufioz M Limites y Potencialidades dd Sistema de la Leche en Mexico Comertio Exterior VoL 40 No9 September 1990
1992 Milling Directory and Buyers Guide Sosland Publishing Co Kansas City Kansas 1993
Odermatt P and M Mufioz Retos y Oportunidades del Sistema Leche en Mexico Ante EI Tratado de Libre Comercio Centro de Investigaciones Economicas Sociales y T ecnologicas de la Agricultura y la Agroindustria Mundial (CIESTAAM) Universidad Autonoma Chapingo Chapingo Mexico October 1993
Roberts D and P Trapido Government Intervention in Latin American Agriculture 1982-1987 Economic Research Service Agricultural and Trade Analysis Division 1988
Salcedo S JR Garcia and M Sagarnaga Politica AgrIcola y Maiz en Mexico Hacia el Libre Comercio Norteamericano Comercio Exterior VoL 44 No4 April 1993
Salinas R El Campo Mexicano Ante el Reto de la Modernizacion Comertio Exterior VoL 40 No9 September 1990
Schulthies BK KD Hall C Livas-Hernandez and GW Williams The Agriculture ofMexico TAMRC International Market Research Report No IM-1-93 Department of Agricultural Economics Texas AampM University Forthcoming
Secretarfa de Agricultura y Recursos Hiddulicos (SARH) Subdireccion de Disefio de Sistemas Anuario Estadistico de la Production Agricola Nacional Direcci6n General de Estadfstica March 1991 a
Secretaria de Agriculrura y Recursos Hidraulicos (SARH) Subsecretaria de Planeacion Boletin Mensual de Informacion Bdsica del Sector Agropecuario y Forestal ISSN-0188-4360 October 1991b
Secretaria de Agricultura y Recursos Hidraulicos (SARH) Subsecretarla de Planeacion Cultivos Bdsicos Printipales Indicadores 1960-1991 May 1992
Secretaria de Agricultura y Recursos Hidriulicos (SARH) Subsecretaria de PoHtica Sectorial y Concertacion Indicadores del Sector Agropecuario y Forestal Mexico City Mexico 1989
Secretarfa de Comercio y Fomento Industrial (SECOFI) Servicio Nacional de Informacion de Mercados Comportamiento de la Production y Comertializacion del Trigo Durante el Perlodo 1987-1991 1992
Secretarla de Comercio y Fomento Industrial (SECOFI) FAX communication 1993
18
Sullivan J J Wainio and V Roningen A Database for Trade Liberalization Studies Economic Research Service US Department of Agriculture March 1989
Torres F Patr6n de Abastecimento y Distribuci6n del Malz en la ZMCM Tesis Doctorado en Economfa Universidad Nacional Aut6noma de Mexico 1993
US Department of Agriculture (USDA) Agriculture in a North American Free Trade Agreement Analysis of Liberalizing Trade Between the United States and Mexico Economic Research Service Washington DC July 1992
US Department of Agriculture (USDA) GEDES Voluntary Report Agricultural Affairs Office Mexico City Mexico various issues
US Department of Agriculture Production Supply and Demand Database Economic Research Service Washington DC various issues
Valdes CM Mexico Western Hemisphere Situation and Outlook Series RS-94-2 Economic Research Service US Department of Agriculture July 1994
Valdes CM and K Hjort Potential Effects of the NAFTA on Mexicos Grain Sector Western Hemisphere Situation and Outlook Series RS-93-2 Economic Research Service US Department of Agriculture July 1993
19
FIGURES
Figure 1 Mexican States
Chihuahua
~
Aguascaliemes
Nayarit
Guanajuato
Morelos
Figure 2 Study Regions in Mexico
Pacific North
~
~
Figure 3 Percent ofMcrican Com Wheat Sorghum and Soybean Production by Month 1987-1990
70
60
I I
0 I50 -
o o I
middotbullbull bullbull
bull middot bull Imiddot I 40 It
I bull bull bull bull I p i I I~ 30
20
10
o
I bull bull i Ibull bull I
i Ibull bull i I I
middot middot
-
-January February March April May June July AugUSt September October November December
Montb
Com Wheat Sorghum Soybeans
Source Secretarla de Agricultura y Recursos Hidniulicos Subsecretarfa de Planeaci6n Boletin Mensual de Informaci6n Bctsica del Sector Agropecuario y Forestal ISSN-0183-4360 October 1991
bullbull bull bull bull bull bull bull bull
bull bull bull bull
bull bull bull bull
bull bull bull bull
3200
3000
2800
2600
fl ~2400u ~ tv
Vl
2200
2000
1800
1600
Figure 4 Estimated Mexican Population and Per Capita Gross Domestic Product 1980-1991
90
bull
bullmiddotbull bull bull bull bull 85 bull bullbull bull bull bull bull bullbull bull bull bull bull bull bullbullbull bullbullbull bullbull
bull bullbull bullbull BOa bull bull ~middotbull bull
bullbullbull bull
bullbull bullbull
bullbullbullbullbullbullbull
sect
bull bullbull bullbull bullbull t 75e
bull bull o bullbull bull
obull bullbull
o bull 70 bullbullbullbull
65 1980 1981 1982 1983 1984 1985 1986 1987 1988 1989 1990 1991
Year
Population Gross Domestic ProductlCapita
Source USDA ERS Watern Hlmisphm Situation and Outlook Sents 1993
TABLES
1991
Table 1 Merico Com Production by Region and State 1987-1991
Mexican ampgionlState 1287 1988 1982 1920 ----------------------------------------------- metric tons -----------------------------------------shy
Central Distrito Federal 28774 25152 29585 21786 22168 Mexico 1886116 617230 1167505 2327144 1755997 Guanajuato 434198 410681 408406 666431 531155 Hidalgo 328773 336414 358045 439723 382287 Morelos 43778 71081 87317 95254 67511 Puebla 563426 570023 897753 1077138 1023371 Queretaro 76410 44790 94352 107156 71113 llaxcala 301219 119982 275538 305474 294456
Subtotal 3662694 2195353 3318501 5040106 4148058 Gulf
Tabasco 97299 77084 82661 92161 74294 Tamaulipas 441571 893661 543603 658631 441515 Veracruz 569513 700055 719787 846122 791893
Subtotal 1108383 1670800 1346051 1596914 1307702 North
Chihuahua 399118 250425 235504 435729 740155 Coahuila 42798 45822 30552 46403 63137 Nuevo Leon 68537 50947 38246 61180 59489
Subtotal 510453 347194 304302 543312 862781 North Central
Aguascalientes 55837 47108 41799 74222 47460 Durango 204005 168950 109676 234458 239127 San Luis Potosi 163037 203573 146417 197093 216681 Zacatecas 383192 279671 191176 458416 216501
Subtotal 806071 699302 489068 964189 719769 Pacific Central
Colima 47346 69524 72369 75270 62552 Jalisco 1768973 1812274 1534645 2226388 1779491 Michoacan 840501 842049 644091 904757 965718 Nayarit 99731 142313 141410 144399 172277
Subtotal 2756551 2866160 2392515 3350814 2980038 Pacific North
B California Norte 12192 11219 7686 3273 2012 B California Sur 4600 6109 9017 26643 77843 Sinaloa 149821 140383 237518 317517 813661 Sonora 116222 193609 34540 119401 398184
Subtotal 282835 351320 288761 466834 1291700 Pacific South
Chiapas 1119747 1067807 1125677 1075343 983415 Guerrero 778936 863892 972546 828556 786515 Oaxaca 350990 509867 542039 452964 422014
Subtotal 2249673 2441566 2640262 2356863 2191944
Peninsula Campeche 78484 12839 55907 92766 52141
Quintana Roo 30843 6045 21669 34370 16250
Yucatan 120941 8924 87651 119860 131844
Subtotal 230268 27808 165227 246996 200235
Total 11606928 10599503 10944687 14566028 13702~27
Source INEGI 1992
27
Table 2 Mexico Wheat Production by Region and Stare 1987-1991
Mexican ReeionState 1287 1988 1289 1220 1991 ---------------------------------------------- metric tons --------------------------------------shy
Central Distrito Federal 300 0 36 0 0 Mexico 38162 51072 69138 71003 63079 Guanajuato 941379 581150 629187 452860 795312 Hidalgo 2457 6866 14801 20616 41975 Morelos 1744 1960 2742 3003 2645 Puebla 26488 11491 40339 50890 51004 Queretaro 20445 19886 12258 21141 26964 Tlaxcala 60307 27328 87290 116668 132475
Subtotal 1091282 699753 855791 736181 1113454 Gulf
Tabasco 0 0 0 0 0 Tamaulipas 23174 34360 21389 27733 26047 Veracruz 476 25 1584 1093 856
Subtotal 23650 34385 22973 28826 26903 North
Chihuahua 245932 230200 203164 180324 251348 Coahuila 24259 32347 20403 25472 29165 Nuevo Leon 65608 47080 20628 36831 36892
Subtotal 335799 309627 244195 242627 317405 North Central
Aguascalienres 35 235 237 50 18 Durango 31278 37316 30490 29433 37671 San Luis Potosi 894 2527 809 3087 2097 Zacatecas 4680 8632 12266 20666 15673
Subtotal 36887 48710 43802 53236 55459 Pacific Central
Colima 0 0 0 0 0 Jalisco 196875 137446 170076 87609 146746 Michoacan 217867 197580 220047 117663 273959 Nayarit 0 0 0 0 0
Subtotal 414742 335026 390123 205272 420705 Pacific North
B California Norte 402448 250695 224104 256642 329284 B California Sur 87657 134704 132881 93328 68619 Sinaloa 611692 397690 1045543 888578 624122 Sonora 1504422 1439295 1396912 1412958 1149707
Subtotal 2606219 2222384 2799440 2651506 2171732 Pacific South
Chiapas 2 0 3 352 322 Guerrero 0 0 0 0 0 Oaxaca 6810 14943 18111 12904 11727
Subtotal 6812 14943 18114 13256 12049 Peninsula
Campeche 0 0 0 0 0
Quintana Roo 0 0 0 0 0
Yucatan 0 0 0 0 0
Subtotal 0 0 0 0 0
Total 415151391 3)6641828 41374A38 319301204 4z1171707
Source INEGI1992
28
Table 3 Mexico Sorghum Production by Region and State 1987-1991
Mexican RegionState 1987 1288 1982 1920 1991 ------------------------------------------ metric tons -------------------------------shy
Central Distrito Federal Mexico 2210deg 1061deg 703deg 124deg 855deg Guanajuato 1385688 1504970 1035350 1691242 965491 Hidalgo 390 340 203 109 Morelos 68438 98182 105336 130752deg 78216 Puebla 5394 23165 29305 28187 13318 Queretaro 111149 74606 90659 92791 92719 Tlaxcala deg deg deg 1943096deg deg Subtotal 1573269 1702324 1261556 1150708
Gulf Tabasco 15519 8666 10164 11459 2292 Tamaulipas 2062935 2013545 1106870 1946886 1605121 Veracruz 6058 5629 5970 17817 6045
Subtotal 2084512 2027840 1123004 1976162 1613458 North
Chihuahua 159998 103292 129411 126144 90325 Coahuila 41630 32237 29161 26395 45122 Nuevo Leon 163779 112069 97375 75797 61927
Subtotal 365407 247598 255947 228336 197374 North Central
Aguascalientes 3769 3108 5719 2428 5172 Durango 40808 24020 26933 21635 27047 San Luis Potosi 15716 28723 28802 34598 23417 Zacatecas 5160 6812 6426 8745 3460
Subtotal 65453 62663 67880 67406 59096 Pacific Central
Colima 4423 7295 5226 4713 2919 Jalisco 792091 914626 801295 637340 495319 Michoacan 628199 583067 594827 519309 420019 Nayarit 105979 90030 129537 117229 58834
Subtotal 1530692 1595018 1530885 1278591 977091 Pacific North
B California Norte 22175 4536 12121 10028 4911 B California Sur 17185 15895 51479 14198 2014 Sinaloa 518871 150242 408616 442862 207834 Sonora 95248 53000 45292 46869 25696
Subtotal 653479 223673 517508 513957 240455 Pacific South
Chiapas 12883 21754 29119 17139 9184 Guerrero 5835 8049 11428 12666 10260
Oaxaca 1328 4128 8201 4344 9938 Subtotal 20046 33931 48748 34149 29382
Peninsula Campeche Quintana Roo Yucatan
Subtotal
2946 371
1836 5153
85 499
1318 1902
280 622 120
1022
239 7 9
255
deg deg63 63
Total 6298011 5894949 4806550 6041952 4267627
Source INEG 1992
29
~~~--
Table 4 Mcrico Soybean Production by Region and Stare 1987-1991
Mexican RegionState 1987 1988 1982 1990 1921 ---------------------------------------------- metric tons ---------------------------------------shy
Central Distrito Federal 0 0 0 0 0 Mexico 0 22 40 11 20 Guanajuato 0 0 0 0 8 Hidalgo 0 0 0 0 0 Morelos 1 0 0 9 0 Puebla 0 0 0 0 0 Queretaro 0 0 0 0 0 Tlaxcala 0 0 0 0 0
Subtotal 1 22 40 20 28 Gulf
Tabasco 0 0 0 0 0 Tamaulipas 37462 70881 57180 72188 56359 Veracruz 1495 4173 7600 1176 1632
Subtotal 38957 75054 64780 73364 57991 North
Chihuahua 46405 25340 38683 21309 15063 Coahuila 0 0 0 0 0 Nuevo Leon 0 0 1 4 1756
Subtotal 46405 25340 38684 21313 16819 North Central
Aguascalientes 0 0 0 0 0 Durango 28 230 0 0 0 San Luis Potosi 5579 7115 9797 4327 1896 Zacatecas 0 0 1 0 0
Subtotal 5607 7345 9798 4327 1896 Pacific Central
Colima 8 0 0 0 0 Jalisco 17 0 13 0 0 Michoacan 109 0 0 0 0 Nayarit 0 0 0 0 2
Subtotal 134 0 13 0 2 Pacific North
B California Norte 236 27 218 0 0 B California Sur 78 0 0 0 0 Sinaloa 448946 24550 575772 435272 415527 Sonora 233000 54569 254071 5769 203776
Subtotal 682260 79146 830061 441041 619303 Pacific South
Chiapas 54431 39218 47732 34633 26137 Guerrero 6 24 16 11 3 Oaxaca 0 0 0 0 0
Subtotal 54437 39242 47748 34644 26140
Peninsula Campeche Quintana Roo Yucatan
Subtotal
60 349
0 409
32 124
0 156
1010 274
0 1284
300 0 0
300
250 0 0
250
Total 828210 226305 992408 575009 722429
Source INEG 1992
30
Table 5 Mexico Estimalld Grain Consumption by Livesto~ Poulay and Dairy 1989-1990
Mexican RegionState Pork Eggs Broilers Dail Beef SheeeGoats Turkey Total
----------------------------------------------------------- metric tons ------------------------------------------------------shyCentral
Distrito Federal 15237 3655 4915 15502 110 592 137 40148 Mexico 100846 29907 101131 79857 20846 12858 4374 349820 Guanajuato 278388 67291 167130 69059 3600 5594 deg 591061 Hidalgo 85826 8637 71641 42908 10392 9085 1799 230287 Morelos 7818 42902 74117 11 515 2281 547 486 139665 Puebla 112623 351896 125111 55711 3268 9903 7934 666447 Queretaro 13282 8145 65845 28665 9705 1629 338 127608 Tlaxcala 35683 1325 4654 16119 1480 2600 477 62339
Subtotal 649703 513760 614544 319336 51682 42808 15545 2207375 Gulf
Tabasco deg 3586 27432 32070 922 472 8304 72785 Tarnaulipas 13649 6936 4552 15697 8955 2127 3359 55274 Veracruz deg 19805 101674 153297 6083 5053 deg 285912
Subtotal 13649 30327 133659 201064 15959 7653 11662 413972 North
Chihuahua 45759 6040 11858 68142 11987 5288 9864 158937 Coahuila 37280 55094 29683 43347 40450 10038 deg 215892 Nuevo Leon 55405 108965 91967 9840 44960 4509 deg 315644
Subtotal 138444 170098 133508 121328 97397 19835 9864 690473 North Central
Aguasca1ientes 13180 8150 45252 17694 1202 1865 deg 87344 Durango 46013 79236 128117 50710 2032 4425 deg 310532 San Luis Potosi 29781 2008 40479 46698 885 21698 0 141548 Zacatecas 51042 3680 6861 50594 614 7366 105 120262
Subtotal 140016 93074 220709 165696 4734 35353 105 659686 Pacific Central
Colima 5537 5119 7564 7152 2491 598 125 28587 Jalisco 427208 385559 178233 189336 33637 4434 deg 1218407 Michoacan 174126 56053 16567 129582 3584 6241 deg 386153 Nayarit 21613 27143 24933 10945 289 551 deg 85474
Subtotal 628485 473874 227297 337016 40000 11824 125 1718621 Pacific North
B California Norte 25241 24187 7548 21547 34579 957 deg 114059 B California Sur 4149 5846 4740 2304 801 794 deg 18633 Sinaloa 82416 97166 77494 43991 20043 1509 deg 322618 Sonora 433390 221064 53453 29093 25467 1375 14049 777892
Subtotal 545196 348264 143235 96935 80890 4635 14049 1233202 Pacific South
Chiapas deg 14130 32995 57080 1080 3408 3650 112342 Guerrero deg 14906 77401 22898 2051 6526 3039 126821 Oaxaca deg 6680 7575 40319 789 10688 693 66743
Subtotal deg 35716 117972 120296 3920 20622 7381 305906 Peninsula
Carnpeche deg 1379 9197 5795 deg 101 512 16983
Quintana Roo 21442 3366 11315 866 deg 146 119 37254
Yucatan 42957 43914 81108 5158 1485 474 1432 176527 Subtotal 64399 48658 101619 11819 1485 721 2064 230764
Total 211791820 Il13l70 116921243 113731482 2961067 143A50 6deg1793 7A601000
31
Table 6 Mexico Estimated Com ProductionConsumption and Apparent SwpluslDdicit by Region and State 1989-1990
Human Livestock Industrial Surplus or Mexican RegionState Production Consum~tion Consum~tion Seed Loss (Deficit)
-------------------------------------------- metric tons -------------------------------------------shyCentral
Distrito Federal 26356 1046071 1345 23814 (1044874) Mexico 1040064 1246762 53066 270367 (530131) Guanajuato 363826 505853 18551 52616 (213194) Hidalgo 318962 239853 35837 45291 (2018) Morelos 77786 151792 4033 11428 (89467) Puebla 799757 524081 121433 113687 40557 Queretaro 84053 133524 4289 76117 (129877) TIaxcala 245461 96696 31905 35530 81330
Subtotal 2956264 3944630 270458 628850 (1887674) Gulf
Tabasco 73638 190745 3644 10349 (131100) Tamaulipas 484265 285733 24626 142890 31016 Veracruz 641217 791086 9587 141356 (300811)
Subtotal 1199120 1267564 37857 294595 (400895) North
Chihuahua 209797 310157 11399 53410 (165169) Coahuila 27217 250519 1389 3940 (228631) Nuevo Leon 34071 393589 1739 37163 (398420)
Subtotal 271085 954264 14527 94513 (792219) North Central
Aguascalientes 37236 91408 1900 5390 (61462) Durango 97704 171392 4985 14142 (92815) San Luis Potosi 130435 254437 6542 18547 (149091) Zacatecas 170308 162113 9944 24656 (26406)
Subtotal 435683 679351 23371 62735 (329774) Pacific Central
Colima 64469 54428 4373 8477 (2808) Jalisco I367128 673526 284615 650865 (241878) Michoacan 573784 450678 32574 99865 (9333) Nayarit 125974 104743 6318 42461 (27548)
Subtotal 2131356 1283374 327880 801668 (281566) Pacific North
B California Norte 6847 210955 10349 989 (215446) B California Sur 8033 40361 400 1134 (33862) Sinaloa 211591 279950 10771 71443 (150573) Sonora 30770 231627 197542 31125 (429524)
Subtotal 257241 762893 219062 104691 (829405) Pacific South
Chiapas 1002802 407784 49876 163139 382003 Guerrero 866386 332863 105718 125252 302553 Oaxaca 482872 383532 40745 69339 (10744)
Subtotal 2352059 1124179 196339 357730 673812
Peninsula Campeche 49804 67977 2550 7281 (28004)
Quintana Roo 19304 62654 984 2792 (47126)
Yucatan 78083 173115 6971 11264 (113267)
Subtotal 147191 303746 10505 21337 (188397)
Total 9750000 10320000 1100000 2366119 (4036119)
32
Table 7 Maico Estimated Wheat ProductionConsumption and Apparent SurpluslDeficit by Region and Sta~ 1989-1990
Milling livestock Surplus or Mexican RegionState Production Consum[tion Consum[tion (Deficit)
----------------------------------------------- metric tons -------------------------------------------shyCentral
Distrito Federal 35 665888 2 (665852) Mexico 68084 457955 3754 (389871) Guanajuato 444710 254900 24522 189811 Hidalgo 14386 55457 793 (41071) Morelos 2699 15772 149 (13074) Puebla 39765 455769 2193 (416005) Queretaro 18350 50370 1012 (32020) l1axcala 85912 0 4737 85912
Subtotal 673941 1956111 37162 (1282170) Gulf
Tabasco 0 0 0 0 Tamaulipas 27295 0 1505 27295 Veracruz 1559 78451 86 (76892)
Subtotal 28854 78451 1591 (49597) North
Chihuahua 166530 98064 9183 68466 Coahuila 25069 172883 1382 (147813) Nuevo Leon 36013 247807 1986 (211794)
Subtotal 227612 518754 12551 (291141) North Central
Aguascalientes 7 57746 0 (57739) Durango 21144 92003 1166 (70859) San Luis Potosi 738 24422 41 (23684) Zacatecas 11421 1347 630 10074
Subtotal 33309 175517 1837 (142208) Pacific Central
Colima 0 0 0 0 ]alisco 83464 130407 4602 (46943) Michoacan 116404 214706 6419 (98302) Nayarit 0 0 0 0
Subtotal 199868 345113 11021 (145245) Pacific North
B California Norte 252336 40278 13914 212058 B California Sur 91853 12389 5065 79464 Sinaloa 789239 129029 43520 660210 Sonora 1039965 234038 302345 805927
Subtotal 2173394 415734 364845 1757660 Pacific South
Chiapas 54 43933 3 (43879) Guerrero 0 14750 0 (14750) Oaxaca 17968 0 991 17968
Subtotal 18022 58682 994 (40661)
Peninsula Campeche Quintana Roo Yucatan
Subtotal
0 0 0 0
18828 0
104810 123638
0 0 0 0
(18828) 0
(104810) (123638)
Total 3355000 3672000 430000 (317000)
33
Table 8 Mexico Estimated SoIghum ProductionConsumption and Apparent SurplusDeficit by Rfgion and State 1989-1990
Livestock Surplus or Mexican RegionState Production Consumption SeedLoss (Deficit)
-------------------------------------------- metric tons -----------------------------------------shyCentral
Distrito Federal 0 38801 deg (38801)
Mexico 548 293000 53 (292504)
Guanajuato 807765 547988 77428 182349
Hidalgo 158 193658 15 (193514)
Morelos 82182 135483 7883 (61185)
Puebla 22863 542821 2192 (522150)
Queretaro 70731 122307 6780 (58356) Tlaxcala deg 25697 deg (25697)
Subtotal 984247 1899756 94350 (1009859) Gulf
Tabasco 7930 69141 728 (61939) Tamaulipas 863564 29143 136046 698375 Veracruz 4658 276239 1048 (272629)
Subtotal 876151 374523 137822 363806
North Chihuahua 100965 138355 9678 (47069)
Coahuila 22751 213120 2181 (192550) Nuevo leon 75971 311919 7282 (243231)
Subtotal 199686 663395 19141 (482850)
North Central Aguascalienres 4462 85444 428 (81409)
Durango 21013 304381 2014 (285383) San Luis Potosi 22471 134965 2849 (115344) Zacatecas 5013 109688 481 (105155)
Subtotal 52959 634478 5772 (587291) Pacific Central
Colima 4077 24214 313 (20450)
Jalisco 625159 929189 59969 (364000)
Michoacan 464075 347160 44605 72311
Nayarit 101063 79156 8241 13666
Subtotal 1194374 1379720 113127 (298473) Pacific North
B California Norte 9457 89796 906 (81246)
B California Sur 40163 13168 3875 23120
Sinaloa 318796 268327 30712 19757
Sonora 35336 278005 3387 (246056)
Subtotal 403752 649296 38880 (284425)
Pacific South Chiapas 22718 62463 1963 (41708)
Guerrero 8916 21103 782 (12969)
Oaxaca 6398 25008 621 (19231)
Subtotal 38032 108574 3366 (73908)
Peninsula Campeche 218 14433 37 (14252)
Quintana Roo 485 36270 deg (35785)
Yucatan 94 169556 4 (169467)
Subtotal 797 220259 42 (219504)
Total 3750000 5930000 412500 (2592500)
34
Table 9 Mexico Estimated Soybean ProductionConsumption and Apparent SurplusDeficit by Region and Scue 1989-1990
Processing Feed Seed Surplus or Mexican RegionState Production Consumetion Loss (Deficit)
--------------------------------------------shy metric tons ------------------------------------------shyCentral
Distrito Federal 0 23353 0 (23353)
Mexico 47 70591 3 (70547)
Guanajuato 0 60091 0 (60091) Hidalgo 0 0 0 0 Morelos 0 0 0 0 Puebla 0 125886 0 (125886) Queretaro 0 0 0 0 ~naxcala 0 0 0 0
Subtotal 47 279921 3 (279877) Gulf
Tabasco 0 0 0 0
Tamaulipas 56226 119220 3257 (66251) Veracruz 7585 39217 439 (32071) Subtotal 63811 158437 3696 (98322)
North Chihuahua 38306 2219 36087 Coahuila 0 0 deg 0 Nuevo Leon 1 223537 0 (223536)
Subtotal 38307 223537 2219 (187449) North Central
Aguascalientes 0 0 0 degDurango 0 70591 deg (70591) San Luis Potosi 9704 0 562 9142 Zacatecas 0 0 0 degSubtotal 9704 70591 562 (61449)
Pacific Central Colima 0 0 deg degJalisco 13 465898 1 (465886) Michoacan deg 5971 0 (5971) Nayarit deg 0 0 0
Subtotal 13 471869 (471857) Pacific North
B California Norte 216 deg 13 203 B California Sur deg deg 0 degSinaloa 571687 91768 33116 446803 Sonora 251596 354522 14574 (117500)
Subtotal 823499 446290 47703 329506 Pacific South
Chiapas 47332 0 2742 44590
Guerrero 16 0 1 15
Oaxaca 0 0 deg 0
Subtotal 47348 0 2743 44605
Peninsula Campeche 1000 deg 58 942
Quintana Roo 271 0 16 255
Yucatan 0 122357 0 (l22357)
Subtotal 1271 122357 74 (121160)
Total 984000 1773000 57000 846z000l
35
Table 10 Mexico Guaranteed and N~tiated Prices for Grains and Soybeans 1989-91
SpringSummer FalVWinter SpringSummer FalVWinter SpringSummer Grain 1989 1989-90 1990 1990-91 1991
-----------------------------------------shy 1000 pesoslmt ---------------------------------------shy
White Corn 435S 60001 63601 68011 71501
YeUowCorn 435S 60001 53001 56501 5950
Sorghum 32001 36002 41402 37002 38002
Wheat 39501 48402 56002 57502
Soybeans 98601 85002 81002
IGuaranteed prices lNegotiated prices
Sources Salinas de Gortari and US Department of Agriculture 1989
36
APPENDIX TABLES
1221
Table AI Mexico Broiler Production by Rfgion and State 1987-1991
Mexican ReeionState 1987 1988 1989 1920 ---------------------------------------- metric tons ------------------------------------shy
Central Distrito Federal 1351 2100 2131 2096 1908 Mexico 45290 36662 40167 44884 56537 Guanajuato 58035 59944 62042 76248 79069 Hidalgo 32182 30802 28838 31612 30465 Morelos 12639 11950 24573 35219 38515 Puebla 44089 36600 40138 60091 61425 Queretaro 22175 25200 23589 30448 69120 Tlaxcala 2500 2543 1630 2170 886
Subtotal 218261 205801 223108 282768 337925 Gulf
Tabasco 13791 11202 11295 11984 12178 Tamaulipas 7709 9663 2242 1813 8074 Veracruz 33519 33118 37421 46540 52000
Subtotal 55019 53983 50958 60337 72252 North
Chihuahua 3850 2995 3818 5689 5204 Coahuila 11442 18942 11534 13296 13895 Nuevo Leon 35275 44996 40285 39021 39019
Subtotal 50567 66933 55637 58006 58118 North Central
Aguascalienres 9093 9163 19731 19244 15103 Durango 34392 11518 45298 59530 74143 San Luis Potosi 69209 14448 16857 17593 17596 Zacatecas 1114 1848 2629 3091 2536
Subtotal 113808 36977 84515 99458 109378 Pacific Central
Colima 1983 2070 3298 3217 4033 Jalisco 92380 94513 46364 90774 108373 Michoacan 9429 22513 6621 7333 7638 Nayarit 9582 13868 8623 11677 10968
Subtotal 113374 132964 64906 113001 131012 Pacific North
B California Norte 4230 4112 4296 2730 2232 B California Sur 930 1830 2275 1916 1951 Sinaloa 26359 27257 33778 32960 30106 Sonora 33850 24825 22985 22885 26223
Subtotal 65369 58024 63334 60491 60512 Pacific South
Chiapas 7187 11023 12230 15062 14430 Guerrero 13267 13831 12666 12989 13142 Oaxaca 2616 4298 2720 3500 3541
Subtotal 23070 29152 27616 31551 31113 Peninsula
Campeche 3832 4702 3405 4200 3915 Quintana Roo 1793 2536 3252 5615 5122 Yucatan 27800 36377 34301 35000 48600
Subtotal 33425 43615 40958 44815 57637
Total 672893 627449 611032 750427 8571947
Source INEGI 1992
38
Table Al ParameterS and Assumptions to Estimate Grain Consumption by Mexican Poulay Ind1lStlyl
Estimation of Grain Consumption by Broiler Production
(1) Carcass weight to live weight conversion ratio 067
(2) Concentrate to live weight conversion ratio 221
(3) 65 of concentrate is grain
(4) 3 death loss
Estimation of Grain Consumption by Broiler Mother Flock
(1) Hen lays 125 eggsyear
(2) Hen consumes 315 pounds of grain per day
Estimation of Grain Consumption by Layers2
(1) Concentrate to egg weight conversion ratio 231
(2) 65 of concentrate is grain
Estimation of Grain Consumption by Turkeys3
(1) Carcass weight to live weight conversion ratio 67
(2) Concentrate to live weight conversion ratio 301
(3) 65 of concentrate is grain
Advice provided by Cirpriano Bermajo-Osornio Union Nacional de Avicultores Mexico City Mexico Dr Philip Hargis Department of Poultry Science University of Arkansas and Dr PD Thornberry Department of Poultry Science Texas AampM University
Concentrate to egg weight conversion ratio includes poults grain consumption prior to laying Grain consumption by layers mother flock is small and calculated to be 07 of layer consumption
Conversion ratio reflects mother flock grain consumption and death loss
39
1221
Table A3 Mexico Egg Production by Region and State 1987-1991
Mexican ReeionState 1287 1988 1282 1920 ----------------------------------------- metric tons ---------------------------------------shy
Central Distrito Federal 4830 4616 2175 2184 2111 Mexico 24213 41499 24062 14616 27560 Guanajuato 37494 37088 39980 40237 42165 Hidalgo 10179 10135 6936 4228 6489 Morelos 21905 21078 49403 13238 14627 Puebla 171765 173846 174490 228372 273535 Queretaro 5974 11350 4100 5254 4194 TIaxeala 1147 1691 1185 586 4736
Subtotal 277507 301303 302331 308715 375417 Gulf
Tabasco 2166 2085 2121 2149 1842 Tamaulipas 13307 13118 5840 3255 1371 Veracruz 9160 13640 14081 10641 18317
Subtotal 24633 28843 22042 16045 21530 North
Chihuahua 2674 4452 3247 3789 5006 Coahuila 31937 39790 31243 33717 40473 Nuevo Leon 74442 81229 69400 62736 58598
Subtotal 109053 125471 103890 100242 104077 North Central
Aguascalientes 5050 5212 5498 4533 4675 Durango 41666 37290 46284 47791 57416 San Luis Potosi 1627 1676 1217 1188 1083 Zacatecas 1289 2347 2335 2123 2248
Subtotal 49632 46525 55334 55635 65422 Pacific Central
Colima 2061 2000 3294 2930 2300 Jalisco 191971 256123 210056 240419 258303 Michoacan 5998 18173 31469 34469 34839 Nayarit 16209 14046 11892 18429 17300
Subtotal 216239 290342 256711 296247 2742 Pacific North
B California Norte 13400 16184 14874 14201 18503 B California Sur 1797 4372 3831 3310 3374 Sinaloa 65471 64060 69614 51931 49811 Sonora 177120 167704 169884 112176 122578
Subtotal 257788 252320 258203 181618 194266 Pacific South
Chiapas 2951 8037 8329 8483 8015 Guerrero 7373 7579 8441 9129 9340 Oaxaca 3434 3800 4150 3900 4401
Subtotal 13758 19416 20920 21512 21756 Peninsula
Campeche 2514 3261 866 800 700 Quintana Roo 4905 4717 2900 1545 671
Yucatan 19000 17876 23822 27436 39800
Subtotal 26419 25854 27588 29781 41171
Total 9751029 110901074 110471012 I 1OO9l95 111361281
Source INEGI 1992
40
Table A4 Mexico Pork Produaion by Region and State 1987-1991
Mexican RegionState 1287 1988 1989 1290 1991 -------------------------------------- metric tons ---------------------------------------shy
Central Distrito Federal 5850 5402 4036 2552 2613 Mexico 90860 49974 36215 32424 25404 Guanajuato 87320 95083 85107 95376 99278
Hidalgo 20550 18802 15965 17047 13572 Morelos 5337 5315 1978 1346 1337 Puebla 29247 31421 37074 46644 61156
Queretaro 8090 11657 5229 4089 9612 Tlaxcala 7733 7680 10114 15423 11878
Subtotal 254987 225334 195718 214901 224850 Gulf
Tabasco 9603 11055 11389 10039 10665 Tamaulipas 8931 8780 3294 3534 5556 Veracruz 33807 32671 32131 34684 35766
Subtotal 52341 52506 46814 48257 51987 North
Chihuahua 9958 9608 11455 11686 15326 Coahuila 9070 6710 8618 6740 6802 Nuevo Leon 11389 14717 14410 13936 9890
Subtotal 30417 31035 34483 32362 32018 North Central
Aguascalientes 4788 3219 4089 4492 3718 Durango 11121 8216 8871 9016 6395 San Luis Potosi 9126 9137 5740 5836 6086 Zacatecas 14141 14092 12317 9024 10353
Subtotal 39176 34664 31017 28368 26552 Pacific Central
Colima 3477 3598 1718 1887 2200
Jalisco 149066 171208 138384 143290 155491 Michoacan 132404 111559 55664 58696 61624
Nayarit 5218 5711 3886 4346 5530 Subtotal 290165 292076 199652 208219 224845
Pacific North B California Norte 7985 6421 6580 6343 4969 B California Sur 322 862 850 1134 1061
Sinaloa 25215 25339 16597 22640 23235 Sonora 108099 110342 109729 110191 111033
Subtotal 141621 142964 133756 140308 140298
Pacific South Chiapas 35382 15436 13741 14783 32980
Guerrero 18938 19558 20142 20511 20802
Oaxaca 24250 25310 27512 23672 29363
Subtotal 78570 60304 61395 58966 83145
Peninsula Campeche 3898 4621 3574 3000 2800
Quintana Roo 6398 4559 4800 5700 5189
Yucatan 17000 13137 15461 17270 20215
Subtotal 27296 22317 23835 25970 28204
Total 914573 861200 726670 757351 811899
Source INEGI 1992
41
Table A5 Parameters and Assumptions to Estimate Grain Consumption by Mexican Hog IndllStJf
Estimation of Grain Consumption by Slaughtered Hogs
(1) Carcass weight to live weight conversion ratio 072
(2) Concentrate to live weight conversion factor for technical system 301
(3) Concentrate to live weight conversion factor for semi-technical system 41 1
(4) 75 of concentrate is grain
(5) 4 death loss
Estimation of Grain Consumption by Breeding Herd
(1) Average weight of slaughtered hog is 105 kilos
(2) Each sow produces 165 feeder pigs per year
(3) Sow to boar ratio 17
(4) Sows fed 5 lbslday of concentrate for 306 days per year and concentrate is 80 grain Sow fed 12 lbslday of concentrate for 59 days per year (lactation period) and concentrate is 64 grain
Advice provided by Rosario Perez-Espejo Comision Nacional de Porcicultura Merico City Merica Deparrment of Animal Science Texas AampM University and Dr T D Tanksley consultant to hog industry in Mexico
42
Table A6 Mexico Milk Cow Inventories by Production System RtWon and State 1990
Mexican ReeionState Semi-Specialized S~cialized Total
----------------------------------------- head ------------------------------------shyCentral
Distrito Federal 575 14589 15164 Mexico 30777 64796 95573 Guanajuato 72485 38955 111440 Hidalgo 0 40973 40973 Morelos 24737 1785 26522 Puebla 23874 44310 68184 Queretaro 2445 26462 28907 Tlaxcala 2157 14589 16746
Subtotal 157051 246458 403509 Gulf
Tabasco 77663 1707 79370 Tamaulipas 29627 3958 33585 Veracruz 305618 32592 338210
Subtotal 412907 38257 451164 North
Chihuahua 46166 47879 94045 Coahuila 18840 34377 53217 Nuevo Leon 4602 7682 12285
Subtotal 69609 89938 159547 North Central
Aguascalientes 2445 15986 18431 Durango 38975 33911 72886 San Luis Potosti 53070 24832 77902 Zacatecas 71191 21806 92997
Subtotal 165681 96534 262215 Pacific Central
Colima 4171 5277 9448 Jalisco 83128 149846 232974 Michoacan 1l2036 82023 194059 Nayarit 20566 2794 23360
Subtotal 219901 239939 459840 Pacific North
B California Norte 863 20254 21117 B California Sur 2157 1397 3554 Sinaloa 102400 3880 106280 Sonora 49186 9467 58654
Subtotal 154607 34998 189604 Pacific South
Chiapas 137636 3259 140895 Guerrero 39551 7139 46690 Oaxaca 60261 16063 76324
Subtotal 237447 26462 263908
Peninsula Campeche 10067 1785 11852 Quintana Roo 2013 78 2091 Yucatan 9061 1552 10613
Subtotal 21142 3414 24556
Total 1438344 776000 2214344
Source NEGI 1992
43
Table A7 Parameters and Assumptions to Estimate Grain Consumption by Morlan Dairy Ind~
Estimation of Grain Consumption by SpecializedSYstem
(1) 45 of population lactates at any point in time and this population consumes 56 lcilosday of grain
(2) Non-lactating population (55) consumes 054 lciloslday of grain
Estimation of Grain Consumption by Semi-Specialized System
(1) 45 of population lactates at any point in time and this population consumes 19 lcilosday of grain
(2) Non-lactating population (55) consumes 36 lcilosday of grain
Advice provided by Dr Bud Schwart Department of Agricultural Economics T ex AampM University Rations are based on those provided by operating dairies in Mexico
44
Table AB Mexico Grain-Fed Cattle Sheep and Goat Inventories by Region and Stare 1990
Mexican ReeionlState Cattle SheeeGoats ------------------------------ head --------------------------shy
Central Distrito Federal 215 234 Mexico 40715 5074 Guanajuato 4005 2207 Hidalgo 20296 3585 Morelos 4455 216 Puebla 6384 3908 Queretaro 18955 643 Tlaxcala 2891 1026
Subtotal 97916 16893 Gulf
Tabasco 1800 186 Tamaulipas 17490 839 Veracruz 11880 1994
Subtotal 31170 3020 North
Chihuahua 23412 2087 Coahuila 40727 3961 Nuevo Leon 87812 1779
Subtotal 151951 7827 North Central
Aguascalientes 2348 736 Durango 3969 1746 San Luis Potosi 1729 8562 Zacatecas 1199 2907
Subtotal 9245 13951 Pacific Central
Colima 4865 236 Jalisco 65697 1750 Michoacan 7000 2463 Nayarit 564 218
Subtotal 78126 4666 Pacific North
B California Norte 67537 378 B California Sur 1565 313 Sinaloa 39146 595 Sonora 49741 543
Subtotal 157989 1829 Pacific South
Chiapas 2108 1345 Guerrero 7031 2575 Oaxaca 1542 4217
Subtotal 10681 8138
Peninsula Campeche 0 40
Quintana Roo 0 58
Yucatan 2900 187
Subtotal 2900 285
Total 5781254 562607
Source INEGI 1992
45
48
DEP
APPENDIX A
BEA ECONOMIC REGIONS
[Fold out map]
91gt1
SISA1VNV )IWONOl3 ~O OV3HOa
1VNO~3H 31-U AS OllV3NmO
ONO~3 f3S ___________bull ___________________JJ----~__L_________________~
JnJJWWro 10 L3KJlyaQ saJYlS OlllAA
GRAIN SURPLUS AND DEFICIT REGIONS IN MEXICO
liST OF FIGURES
Figure Page
1 Mexican States 22
2 Study Regions in Mexico 23
3 Percent of Mexican Corn Wheat Sorghum and Soybean Production by Month 1987-1990 24
4 Estimated Mexican Population and Per Capita Gross Domestic Product 1980-1991 25
liST OF TABLES
Table Page
1 Mexico Corn Production by Region and State 1987-1991 27
2 Mexico Wheat Production by Region and State 1987-1991 28
3 Mexico Sorghum Production by Region and State 1987-1991 29
4 Mexico Soybean Production by Region and State 1987-1991 30
5 Mexico Estimated Grain Consumption by Livestock Poultry and Dairy 1989-1990 31
6 Mexico Estimated Corn ProductionConsumption and Apparent SurplusDeficit by Region and State 1989-1990 32
7 Mexico Estimated Wheat ProductionConsumption and Apparent SurplusDeficit by Region and State 1989-1990 33
8 Mexico Estimated Sorghum ProductionConsumption and Apparent SurplusDeficit by Region and State 1989-1990 34
v
LIST OF TABLES (continued)
Table Page
9 Estimated Soybean ProductionConsumption and Apparent SurplusDeficit by Region and State 1989-1990 35
10 Mexico Guaranteed and Negotiated Prices for Grains and Soybean 1989-1991 36
AI Mexico Broiler Production by Region and State 1987-1991 38
A2 Parameters and Assumptions to Estimate Grain Consumption by Mexican Poultry Industry 39
A3 Mexico Egg Production by Region and State 1987-1991 40
A4 Mexico Pork Production by Region and State 1987-1991 41
AS Parameters and Assumptions to Estimate Grain Consumption by Mexican Hog Industry 42
A6 Mexico Milk Cow Inventories by Production System Region and State 1990 43
A7 Parameters and Assumptions to Estimate Grain Consumption by Mexican Dairy Industry 44
A8 Mexico Grain-Fed Cattle Sheep and Goat Inventories by Region and State 1990 45
Vi
GRAIN SURPLUS AND DEFICIT REGIONS IN MEXICO
Mexico has become an increasingly important US agricultural trading partner since joining the General Agreement on Tariffs and Trade (GATT) in 1986 Recent approval of the North American Free Trade Agreement (NAFTA) is further reducing USlMexico trade barriers and increasing agricultural trade between the two countries US grains have typically been the largest export items to Mexico Recent studies suggest that NAFTA will further increase US grain exports to Mexico (Krissoff et al Valdes) Unfortunately constraints in the Mexican marketing and transportation infrastructure could hamper additional U SlMexico trade in grains and other bulk commodities (USDA 1992) In view of this concern this study estimates regional grainsoybean consumption in Mexico to identify likely grain deficit or import regions The results will offer important insight on the transportation corridors needed to efficiently link US grain surplus regions and Mexican grain deficit regions
Factors Afkaing Grain Production in Mexico
Mexico is located in a climatic transition zone with arid conditions in the north and humid subtropical conditions in the south and in selected coastal regions About 28 of Mexicos surface area is tropical Moderate to cool climates in central Mexico comprise about 23 of the countrys surface area (Figure 1) Dry climates in Mexico which include the northern border and north central states comprise about 49 of Mexican land area (Schulthies et al)
Rainfall in Mexico is concentrated in the July to October and December to January periods Annual rainfall in the southeastern portion of the country ranges up to 80 inches In the northwest regions however average rainfall is less than 6 inches Grain production is nearly impossible without irrigation in many of the northern states Average annual rainfall in the central states ranges from 24 to 40 inches (SARH 1989)
About 247 million hectares (ha) or 126 of the Mexican land mass (196 million ha) is arable Over the past decade an average of 213 million ha has been cultivated About 5 million ha are irrigated and approximately 14 of the remaining arable land receives adequate and reliable rainfall (Salinas)
The land tenure system in Mexico has had an important impact on crop production Land tenure was an important force behind the Mexican revolution of 1910-17 and was ultimately responsible for the development of the current small farm (ejido) system Following the revolution land was expropriated from large land holders and subsequently divided into small plots for
distribution to landless farmers The term ejido refers to land that the Mexican government has granted to groups of people Most ejidos include individual family land plots land held in common by all families in the ejido and community land In 1988 there was an estimated 307 million ejidatarios (ejido farmers) operating land plots which averaged 47 ha in size Because of their small size about 70 of the ejidos operate at a subsistence level and most ejidatarios are forced to seek offshyfarm employment (Grennes et al) In 1988 about half of Mexicos agricultural land was part of the ejido system Historically the ejido land could be bequeathed to an heir but not sold rented or mortgaged Recent land reform (December 1991) gives tide of the land to the ejidatarios which occupy the land and allows the ejidatarios to sell or lease the land Privatization of land holdings is intended to provide incentives to increase productivity farm size and output (Schulthies et al Valdes)
Corn Production
Corn is a staple in the Mexican diet and therefore has important sociological and political implications in MEXICO Corn is produced on approximately 7 million ha or about 53 of the harvested land area in Mexico Over 60 or about 22 million farmers in Mexico produce at least some corn (Knochenhauer) Torres estimates that 83 of Mexican corn producers annually harvest 2 ha or less of corn 14 harvest between 5 to 15 ha and only 3 harvest in excess of 15 ha According to Matus the average corn farmer harvests about 33 ha of corn per year The small subsistence farms tend to be located in southeast Mexico while larger farms are in central and northwest Mexico About two-thirds of the corn producing area is farmed under the ejido land tenure system Almost 90 of the producers in this system are subsistence farms (Valdes)
Historically about 88 of the planted corn area in Mexico has been rain-fed or nonshyirrigated while the remaining 12 has been irrigated Yields on rain-fed production average about 16 mtha (26 buacre) Irrigated production averages 37 mtha (59 buacre) The historical average national corn yield in Mexico is about 16 mtha (SARH 1991a) About 61 of the corn produced on irrigated farms is from large commercial operations Subsistence farmers grow over 65 of the corn produced on rain-fed land
In the 1989 and 1990 crop years 145 of the harvested corn area was irrigated with an average yield of 31 mtha (49 bushelsacre) Non-irrigated yields averaged 16 mtha Irrigated production comprised about 25 of total output while non-irrigated production comprised the remainder (SARH 1992) Mexican corn yields are low primarily because of continuous cropping and a land tenure system which is not conducive to the addition of technology (Torres)
During the 1980s corn production in Mexico ranged from 106 to 145 million metric (mt) Average production during this period was 122 million mt During the 1989-1990 period of this study corn production dropped to an estimated 109 million mt about 11 below the average Corn production in Mexico is variable because of marginal rainfall in many producing regions and the relatively small share of production which is irrigated (SARH 1992)
2
Corn is produced in every state in Mexico but production tends to be concentrated in the Central and Pacific Central regions (50) and the Pacific South (20) region (Table 1 and Figure 2) Historically nearly half of Mexican corn production has been located in Jalisco (15) Mexico (12) Puebla (7) Michoacan (7) and Guanajuato (4) which are the principal producing states in the central regions Chiapas a southern state has historically produced nearly 9 of the Mexican annual corn supply (Figure 1)
Corn produced in the central and south regions is planted in late winterearly spring and harvested during the late fallearly winter Nearly 85 of the Mexican corn supply is gathered in the November through February period (Figure 3)
Approximately one-third of the Mexican corn production is consumed on farm Another 65 of goes for human consumption while the remainder (35) is fed to livestock (primarily poultry and dairy animals) and used for seed Ejido farms of five ha or less consume about 60 of their production and market the remainder On average about two-thirds of Mexican corn production is sold off the farm where it subsequendy enters the commercial market channel Supplies to the commercial market channel are augmented by imports which averaged about 39 million mt during the 1988-91 period or about 38 of Mexican corn production About 85 of the corn in the commercial market channel is processed for direct human consumption (harina and nixtamal) while the remainder is processed into starch oil syrup other derivatives and balanced rations for animals (Garda Garda and Montero)
The production of nixtarnal involves the soaking of corn in lime water and then processed into dough or masa The masa is made into tortillas and chips The production of harina is similar except masa is dried and milled to the desired texture (Schulthies et al)
Wheat Production
Wheat is an important foodgrain in the Mexican diet Wheat comprises about 8 of the total harvested surface area (1 million ha) in Mexico and in contrast to corn is generally produced under irrigated conditions (Knochenhauer) In 1989 and 1990 crop years 87 of the harvested wheat production area was irrigated representing about 94 of total wheat output Yield on the irrigated production averaged 43 mtha (64 bushelsacre) Non-irrigated production averaged 18 mtha (27 buacre) (SARH 1992) Wheat yields in Mexico are among the highest in the world because of agronomic research and extensive use of irrigation In contrast to corn most of the wheat in Mexico is produced under relatively advanced technological conditions (Schulthies et al)
Wheat production in Mexico increased from approximately 22 million mt in the early 1970s to 45 million mt in the latter 1980s This doubling in output is attributed to improved varieties and associated higher yields expanded acreage irrigation and improved technology Production in
3
the 1989-90 study period was 44 million mt an output representative of the latter 19805 (SARH 1992)
Wheat production is concentrated in the Pacific North (62) and Central regions (22) of Mexico (Table 2) Sinaloa and Sonora (Pacific North region) produce 17 and 34 of the national wheat supply respectively Guanajuato and Michoacancontribute 17 and 5 respectively Approximately 99 of the Mexican annual wheat supply is generated in the April through July period (Figure 3)
Five classes of wheat are produced in Mexico (Groups I II III IV and V) Groups I and II are bread wheats More specifically Group I wheats are for commercial bread baking operations while Group II wheat is for at-home consumption Group III and IV wheats are soft wheats designed for cookies tortillas bread rolls cakes and pastry products Group V wheat is for pasta and macaroni Group III wheat is used in combination with Groups I and II wheat for purposes of bread production Historically about 42 of the annual wheat production has been Group I and II Group III production has comprised about one third of total wheat output Group IV wheat has made up about 10 of production and Group V about 15 All wheat groups are produced in substantial volume in northwest Mexico except Group II wheat which dominates central Mexico production (SECOFI)
Sorghum Production
Sorghum is the principal feedgrain produced in Mexico Sorghum comprises about 14 of the harvested area (17 million ha) and ranks third behind corn and dry beans in area harvested (Knochenhauer) In 1989 and 1990 33 of the harvested sorghum area was irrigated representing about 48 of total sorghum output Yield on the irrigated production averaged 47 mtha (74 buacre) while rain-fed production averaged 25 mtha (39 bushelsacre) (SARH 1992) Over half of Mexican sorghum production is on private farms greater than 5 ha
Mexican sorghum production during the 1989-90 study period was estimated to be 50 million mt about 14 below average production during previous 5-year period (1985-1989) Mexican sorghum production has increased about 90 during the past two decades as a result of expanded acreage (62) and increased yields (20) (SARH 1992)
Sorghum is produced in all regions of Mexico but is concentrated in Guanajuato (24) Jalisco (13) and Michoacan (10) Tamaulipas in the Gulf region and Sinaloa in northwest Mexico contribute approximately 31 and 6 respectively to the national sorghum supply (Table 3) Nearly 90 of the Mexican annual sorghum supply is generated in the fallwinter season when much of the central Mexican harvest is carried out (Figure 3)
4
Soybean Production
Soybeans account for over 50 of Mexican oilseed production Virtually all soybeans are processed (Schulthies et al) Soybean meal is an important source of protein for pork and poultry producers Soybean oil accounts for about 40 of the edible oils consumed in Mexico l
bull Soybeans are produced on approximately 4 of the Mexican harvested area (004 million ha) (Knochenhauer) In 1989 and 1990 crop years approximately 83 of the Mexican harvested production area was irrigated Yields on irrigated production averaged 22 mtha (33 bushelsacre) Yields on rain-fed production averaged 13 mtha (19 bushelsacre) About 90 of Mexican soybean output was produced on irrigated land in 1989-1990 (SARH 1992)
Soybean production in Mexico averaged about 07 million mt in the 1985-89 period about one-third below the 1989-1990 production of nearly 10 million mt Soybean production is concentrated in the Pacific North where Sonora and Sinaloa have historically accounted for about 25 and 48 respectively of national soybean output (Table 4) Soybean production in this region tends to be produced on relatively large private farms (USDA 1992) Tamaulipas in the northeast has a historical production share of 12 Virtually all remaining production is concentrated in Chiapas Chihuahua and Veracruz Over 80 of Mexican soybean production is harvested in September (25) and October (58) (Figure 3)
Factors Affecting Grain Consumption in Mexico
Mexico has an estimated population of nearly 90 million which has grown at an average rate of 23 over the past decade Mexico is the eleventh most populated country in the world The population of Mexico is relatively young with an average age of 22 As a result the work force increases about 4 per year (Schulthies et al) Mexico City alone has a population in excess of 10 million making it the most populated city in the world The greater Mexico City urban area is estimated to have a population of nearly 20 million accounting for almost 20 of the national population Other large concentrations of people are in the cities ofGuadalajara Jalisco Monterrey Nuevo Leon and Puebla Puebla
Historically Mexico was a population of rural peoples In 1940 about two-thirds of the Mexican population lived in rural areas By 1980 however only one of every three Mexicans lived in a rural area In 1990 an estimated 275 of all Mexicans lived in rural areas (Salinas) The Mexican rural population is thought to have peaked in the mid-1980s at nearly 25 million and is projected to decline to less than 20 million by the year 2000 (Schulthies et al)
Personallnterview with official from Consejo de la Industria Acdtera Mexicana SA
5
I
Until the early 1980s income from oil exports provided the basis for rapid economic growth in Mexico Growth in gross domestic product from 1977 to 1981 averaged about 85 Duting this period Mexico borrowed heavily from foreign institutions to finance public projects Unfortunately falling oil prices and rapidly increasing interest rates in 1982 erased many ofMexicos earlier economic gains A burgeoning foreign debt rampant inflation and a dramatic decline in Mexican consumer purchasing power resulted The standard of living in Mexico declined to 1960 levels (Schulthies et al) Income from one day of work (minimum wage) in 1982 purchased 85 kilos of pork compared to only 45 kilos in 1987 Similarly one day of income in 1982 purchased 51 kilos of chicken compared to only 22 kilos in 1987 Per capita GNP declined about 40 from 1981 to 1987 (Figure 4)
Since the economic crisis in the early 1980s Mexico has changed its policy of protectionism by reducing subsidies deregulating industry and initiating a process to privatize many inefficient state-owned enterprises As a result Mexican GNP commenced positive growth in the mid-1980s Between 1987 and 1991 per capita GNP increased about 60 Recent policy reforms have generated optimism regarding future economic growth in Mexico (Figure 4)
Estimation of Grain Consumption by LivestocklPoulttylDairy Sectors
To estimate regional feedgrain consumption by the livestock and poultry sectors in Mexico production estimates (pork broiler egg turkey sheep and goat) for each state were converted into feed requirements and subsequendy into grain demands Grain consumption by the dairy and catde feeding sectors were calculated from estimates of state populations and representative rations Conversion coefficients and rations were obtained from interviews with government and private sector representatives in Mexico and US personnel who consult with the livestockpoultry and dairy sectors in Mexico State estimates of livestockpoultry production were taken from the Instituto Nacional de Estadfstica Geografia e Informatica (INEGI 1992) National projections were obtained from the USDA Production Supply and Demand Database An effort was made to adjust livestock poultry and dairy consumption to a October 1 1989-September 30 1990 production year in order to keep grain and livestock-poultry production periods the same (SARH 1991b) Details on the procedures used to estimate feedgrain consumption are presented in the Appendix
Estimating regional grain consumption in Mexico is particularly difficult because of the variability in both the livestock production estimates and Mexican animal production systems Despite the various problems associated with estimating regional feedgrain demands the national estimates approximate the data in the USDA Production Supply and Demand Database and provided by Bivings The latter estimated that Mexican feedgrain demand at approximately 77 million mt in 1989 an estimate similar to the 75 million mt estimate in this study and by the US Department of Agriculture (Table 5)
The Mexican poultry industry comprised about 47 of national feedgrain demand in 1989shy90 The hog sector was responsible for 29 of total feedgrain disappearance Approximately 18
6
of total feedgrain demand in Mexico was attributed to the dairy industry with the remaining 6 distributed among the beef sheep and goat industries (Table 5) Nearly half of Mexican feedgrain demand was located in the states of Jalisco (l5) Sonora (10) Puebla (9) Guanajuato (8) and Michoacan (6) The Central (30) Pacific Central (23) and Pacific North (17) regions accounted for about 70 of the national demand for feedgrains (Table 5)
Regional Estimates of Production and Consumption and Apparent Surplus and Deficit Regions
The calculation of the apparent feedgrain surplus or deficit that exists in a region (as determined by subtracting the estimated consumption from estimated production in each region) offers some perspective into the location ofMexican excess demand regions and potential destinations for US grainsoybean exports National production and consumption estimates generally conform to estimates included in the USDA Production Supply and Demand Database These data include input from agricultural attaches at US embassies FAS personnel and country and commodity analysts with the USDA Economic Research Service (ERS) In general production and consumption estimates included in the USDA Production Supply and Demand Database were similar to the official Mexican data estimates When differences did occur however the Mexican estimates were adjusted to reflect those of the USDA
Corn
Much of the Mexican corn supply is consumed directly as tortillas chips and dry masa flour Numerous small processing plants produce these products for direct human consumption Torres indicates that corn processing capacity is highly correlated with the population Accordingly for this study corn for direct human consumption was assumed to be proportional to regional population
Corn for direct human consumption was estimated to be 012 mtcapita (INEGI 1988) This parameter in combination with population (86 million) was used to generate a human corn consumption estimate of 1032 million mt It is estimated that 8-10 of Mexican corn production is diverted to livestock feed This corn is often not suitable for human consumption and some is fed by small producers regardless of the government prohibition Estimates of lossseed and corn processing demands were taken from Garda Garda and Sagarnaga and communication from Secretada de Comercio y Fomento Industrial (SECOFI)
Based on production and consumption estimates for 1989-90 only five states (Chiapas Guerrero Tlaxca1a Puebla and Tamaulipas) and one region (Pacific South) have a corn surplus (Table 6) Nearly half of the Mexican corn deficit (47) is located in the Central region where the
7
Distrito Federal (Mexico City) and Mexico have deficits of 26 and 13 respectively of the total Mexican corn deficit Additional states with large deficits include Nuevo Leon Sonora and Veracruz accounting for 10 11 and 7 respectively of the Mexican 1989-90 corn deficit These three states in combination with the Distrito Federal and Mexico include cwo-thirds of the projected Mexican deficit (Table 6)
Wheat
The flour milling industry in Mexico is comprised of 133 plants that tend to be located near large population centers (1992 Milling Directory and Buyers Guide) The installed flour milling capacity in Mexico is approximately 17000 mt per 24 hour period Nearly 60 of this capacity is located in the Distrito Federal (17) Puebla (II ) Mexico (9) Guanajuato (9) Michoacan (6) and Nuevo Leon (6) In contrast Sonora the leading wheat producing state in Mexico has approximately 2 of the Mexican installed milling capacity
Historic data on the quantity of wheat milled annually by wheat class in seven regions or states in Mexico (Distrito Federal and Mexico Central Northwest Gulf Puebla Northeast and Jalisco) in combination with state-level milling capacity was used to estimate the quantity of each wheat class milled per state Historic data on wheat produced and milled by region and wheat class were obtained via a communication from the Apoyos y Servicios a la Comercializaci6n Agropecuaria (ASERCA) Milling capacity by state was taken from 1992 Milling Directory and Buyers Guide
Estimated quantities of Durum (Group V) wheat produced and milled by state were removed when estimating state-level productionconsumption Accordingly wheat production and consumption estimates represent only hard and soft wheat Durum or Group V wheat is produced in excess of domestic demands Production of this wheat (500000 mt) is concentrated in Sonora where considerable quantities are fed by the poultry and livestock industries and exported (USDA GEDES Reports)
Two regions have a dominant effect on Mexican wheat production and consumption - the Pacific North region with an estimated 176 million mt surplus and the Central region with a deficit of 128 million mt The remaining six regions have a comparatively modest deficit for a total apparent national deficit of 317000 mt Principal deficits are located in the Distrito Federal (665852 mt) Puebla (416005 mt) Mexico (389871 mt) and Nuevo Leon (211794 mt)(Table 7)
Sorghum
Sorghum is the primary feedgrain in Mexico Approximately 80-85 of Mexican feedgrain demands are met with sorghum Less than 3 of the total sorghum supply is used in industrial and food processes In 1989-90 six of the seven Mexican regions had an estimated grain sorghum
8
deficit The seventh region (the Gu1f) had an estimated 363807 mt surplus Approximately 60 of the Mexican grain sorghum deficit (26 million mt) was located in the Central (38) and North Central (22) regions Another nearly 20 was concentrated in the North region (Table 8)
Soybeans
Virtually all of the Mexican soybean supply (97) is crushed or processed for purposes of producing meal and oil Soybean processing by state was estimated from a list of operating processors in 1990 and their associated installed capacity The portion ofnational processing capacity operated by state was used to allocate national crushing to each state (Table 9)
Surplus Mexican soybean production is concentrated in the Pacific North (84) Deficits in supply are located in the Pacific Central and Central regions These respective regions include about 33 and 55 of the national soybean deficit of 085 million mt in 1989190
Mexican Grain and Soybean Production Policies
The government ofMexico has actively influenced the production and consumption ofgrains and soybeans and therefore regional surpluses and deficits through various policies Production policies have generally included guaranteed output prices and subsidized inputs (ie subsidized interest insurance electricity and irrigation and purchased inputs like fertilizer and pesticides) In addition low-income producers have received additional production and marketing subsidies as part of the governments commitment to economic equity (Roberts and Trapido) During the 1980s however economic pressures forced the government of Mexico to begin reducing subsidies For example guaranteed support prices were not fully adjusted for inflation implying declining real producer prices Further guaranteed commodity prices were no longer announced at planting adding to producer uncertainty Also subsidies for purchased inputs were reduced However Mexican grain producers during the 1980s continued to be protected by import licensing requirements and tariffs In general import licenses were not granted until domestic supplies of the respective grains were depleted which supported the price of domestic supplies higher than world price levels
The US Department of Agriculture estimates that during the 1985-87 period transfers by the Mexican government to producers accounted for over one-half of the value of Mexican corn production nearly one-half of the value of Mexican sorghum production (47) 41 of the value
9
of soybean production and about 15 of the value of Mexican wheat production (USDA 1992)2 Most of the subsidies to corn producers (about two-thirds of the total subsidy) was in the form of price supports and trade protection with the remaining subsidies for purchased inputs Similar subsidy ratios held for other grains and soybeans except wheat where as much as 80 of the subsidies were for purchased inputs (Grennes et al)
During the 1989-91 period Mexican government agricultural policies and subsidies were substantially altered Guaranteed prices were eliminated in the fall of 1989 for all commodities except corn and dry beans for which guaranteed prices are still calculated in a manner that isolates corn and dry beans from world market price variations In lieu of guaranteed prices a system of negotiated prices (Precios de Concertaci6n) were established for other grains and soybeans The negotiated sorghum prices were based on expected import prices while negotiated soybean prices were set near imported price levels for crushers but above international prices for producers
Corn Producer Subsidies
Farm credit subsidies for corn have been significant because about one-half of the corn producers are ejidatarios who have generally been unable to secure short-term commercial loans Under the ejido land tenure system the land is owned by the government but provided to peasant farmers for their use Consequendy ejidatarios have not been able to use their land as collateral to secure commercial loans The government designed a fiscal support program in 1987 to partially subsidize machinery purchases andor production infrastructure for corn producers Producers in rain-fed areas received payments for 25 of these expenditures while producers in irrigated areas received 15 This program was eliminated in 1989
Since 1990 the government ofMexico has established different guaranteed support prices for yellow and white corn For the 1990-91 marketing year the price of white corn was set at 636000 pesos ($557bushel) and 530000 pesos ($464bushel) for yellow corn (Table 10) Guaranteed prices to Mexican corn producers increased substantially during the 1989-91 period (Table 10) (USDA GEDES Reports Salinas de Gortari) In nominal terms white corn (food corn) prices increased about 67 in nominal terms but about 33 in real terms For yellow corn nominal prices increased about 33 and real prices about 20 Historically Mexico has controlled corn imports through a system of import licensing
Sorghum Producer Subsidies
Historically price supportS and import licensing accounted for much of the support to sorghum producers as did subsidies for credit and insurance However Mexico has eliminated most
The rdated percentages were estimated using official Mexican exchange rates When subsidies are calculated using an estimated equilibrium
exchange rate the subsidies were 25 to 30 percent larger
10
2
of producer subsidies in favor of subsidies for human consumption Subsidies for machinery purchases and production infrastructure were eliminated for sorghum producers in 1989
Historically the sorghumcorn price ratio was maintained at about 060 Strong pressure from producers in the early 1980s however resulted in an increase in the sorghum support price producing a shift toward the production of sorghum Nevertheless the government has increased the price of corn relative to sorghum since 1989 as a result maintaining guaranteed prices for corn while shifting to a negotiated price system for sorghum (Table 10)
Under the negotiated price system for sorghum CONASUPO (Compafiia Nacional de Subsistencias Populares) no longer purchased sorghum to support prices Rather users were required to purchase the entire domestic crop before importing In 1990 the government instituted a seasonal (May I-December 1) 15 ad valorem tariff to assute purchase of the domestic crop
The negotiated sorghum prices were based on international prices plus transportation and tariffs Domestic farm-level prices generally move parallel to US prices During the study period (I989-91) planted sorghum acreage decreased Land formerly planted to sorghum was shifted to corn as a result of the relatively high guaranteed corn price and the uncertainties of the negotiated sorghum price
Wheat Producer Subsidies
Wheat input subsidies for fertilizer credit and irrigation water in Mexico have all decreased in recent years Irrigation water and fertilizer have accounted for a large share of the subsidy to these producers Producers paid an estimated 30 of the market price for irrigation water and capital costs of irrigation systems Fertilizer costs to wheat farmers were 40 to 60 of the price of imported fertilizer Subsidies for machinery and production infrastructure were discontinued for wheat farmers in 1989
Mexico protected its domestic wheat market through import licensing and tariffs Since 1992 CONASUPO has permitted private millers to import wheat Milling wheat has no tariff Durum wheat has a 15 ad valorem duty that is being reduced over 10 years under NAFT A
Implementation of the negotiated price system for wheat in 1989 has attempted to move the wheat sector toward market-oriented price policies For the 1989-90 wheat harvest Mexican producers were given the choice between an open market with higher prevailing prices at that time or a lower domestic price but with the guarantee that their entire crop would be marketed at the negotiated price Mexican wheat producers opted for the lower negotiated price which was fIxed For the 1990-91 wheat crop the Mexican government wanted to adopt international wheat prices The dramatic decline in world price however was thought to create major hardships for Mexican wheat producers Accordingly a negotiated formula price was adopted for the 1990-91 harvest The resulting price was calculated in the manner of a guaranteed price It is the intent of the Mexican
11
government to move to international prices for wheat production but if necessary to provide a subsidy payment
Soybean Producer Subsidies
Input subsidies to soybean producers have generally declined in recent years Irrigation water has been highly subsidized In 1990 the subsidy for irrigation water was increased Subsidies for machinery and production infrastructure were eliminated in 1989
Historically import licenses and import duties insured that the domestic crop would be purchased before foreign supplies However import license requirements for soybeans intended for crushing were suspended in July 1990 and a seasonal tariff (10 ad valorem) was put into effect for October 1 through December 31 A 15 tariff was implemented for the period August 1 1991 through January 31 1992
Beginning with the 1990 crop soybean prices were established through negotiations (precios de concertacion) In the fmt year the negotiated price was based on a fifteen day average of the nearest soybean futures price plus transportation and internment costs and the tariff equivalent Soybean output fell in 1990 due to limited water availability in northwest Mexico rather than the lower negotiated prices Although water was abundant in the following year world soybean prices were low Responding to pressure from the politically powerful producers in northwest Mexico a tariffwas initiated and prices were established at about 850000 pesos per mt For the 1991 soybean crop the negotiated price was 810000 pesos per mt with producers to receive an additional subsidy payment equal to 70000 pesos per mt
PROCAMPO A New Production Policy
In October 1993 President Salinas announced PROCAMPO a new domestic farm program ~The program coincides with Mexicos obligation under NAFTA to move away from border policies as the means of agricultural price support PROCAMPO replaces current price support schemes for major crops (grains cotton soybeans and safflower) and generally implies farm prices above international price levels Domestic prices will gradually be aligned with international prices Direct income payments are made to eligible producers based on historical acreage with no production requirement The payments are to compensate for lower prices expected as trade barriers are lowered under NAFTA Payments are to be flXed for ten years then completely phased out in years 11 through 15 (Valdes)
PROCAMPO is to be phased-in gradually in 1993-94 and become operational in 1995 During the phase-in producers will receive reduced price supports in combination with per hectare payments In the first year the producer will receive 330 new pesosha ($45acre) and 350 new
12
pesosha in real terms in the second through the tenth years In the autumnwinter of 1994-95 corn wheat soybeans and sorghum are to be aligned with international prices Eligible producers are to receive payments based on historical area planted and yield PROCAMPO is considered to
be a socially superior program to price supports since cash benefits are provided to subsistence producers Historically subsistence producers consumed much of their own production on farm and benefitted little from selling crops at relatively high supporc prices
To be eligible for the program producers are required to be registered in the 1993 census as cultivating one of the eligible crops for the last three years New lands will not be allowed in the program This latter stipulation is to prevent qualification by clearing forest or marginal lands Producers who qualify will receive payments regardless of the crop produced Estimated acreage to benefit from PROCAMPO represents 70 of total cultivated area in Mexico
An analysis by the US Depanment of Agriculture suggests that PRO CAM PO will lead to lower grain prices in Mexico (Valdes and Hjorc) Lower prices will reduce acreage planted lower production raise consumption and increase imports Implementation ofPRO CAMPO and NAFTA are expecred to increase Mexican feedgrain demand and imports Corn impons are expected to increase from 15 million mt in 1993 to 60 million mt in 2005 Mexican imports of sorghum are expected to increase steadily from 29 million mt in 1993 to 51 million mt in 2005 and soybean imports from 21 million mt in 1993 to 43 million mt by 2005 Wheat imporcs by Mexico are projected to grow more modestly increasing from 17 million mt in 1993 to 19 million mt in 2005 (Valdes)
Summary and Conclusions
A recent study by the US Department ofAgriculture indicates that corn sorghum soybean and wheat imports by Mexico will increase 30076 104 and 12 respectively above 1993 expon levels during the 1994-2005 period (Valdes and Hjort) The transportation and grain handling infrastructure in Mexico however appears inadequate to efficiendy accommodate these projected increases The purpose of this study was to identify regions in Mexico which are deficient in grain and soybean supplies so that subsequent studies might isolate and analyze USMexico transponation corridors imponant for the expon of grainsoilseeds to Mexico
In 1989-90 the eight analyzed regions in Mexico had an estimated deficit of about 11 million mt Nearly 40 of this deficit was located in the Central region which was calculated to have deficits of 18 million mt 13 million mt 10 million mt and 03 million mt in corn wheat sorghum and soybean supplies respectively Principal deficits in the Central region are located in the Distrito Federal Mexico Guanajuato Puebla and Hidalgo Other regions with significant deficits include the North (16) Pacific Central (11 ) North Central (10) and Pacific North (10)
13
Appendix Procedures for Estimating Mexican Grain Consumption
This appendix identifies the geographic location ofMexican livestockdairypoultry production and parameters and assumptions used in calculating their feedgrain consumption
PoultryBroilers
Approximately two-thirds of Mexican broiler production is concentrated in the Central (36) Pacific Central (16) and North Central (13) regions Leading states in these regions include Jalisco Guanajuato Durango Mexico Morelos and Puebla Other important producing states include Nuevo Leon Sinaloa Veracruz and Yucatan (Table AI)
The Mexican broiler industry is highly concentrated and employs fully integrated production systems similar to those in the United States It is estimated that about 1 of the broiler operations in Mexico produce about 56 of all broilers (Schulthies et al) Interviews with Mexican and US personnel indicated broiler production technology in Mexico is similar to that in the United States and is generally used throughout Mexic03bull Turkey meat production in Mexico is modest and is projected to be about 3 of broiler production Table A2 shows parameters and assumptions used to calculate grain consumption by the Mexican poultry industry
PoultryLayers
Over one-half of Mexican egg production is concentrated in Jalisco (22) Puebla (20) and Sonora (14) Other important producers include Nuevo Leon and Sinaloa (Table A3) An estimated 22 of the laying enterprises in Mexico produce about 67 of the national supply The majority of these large layer operations are fully integrated and utilize modern technology equal to
that in developed countries (Schulthies et al)
Hog
Pork production in the Bajio comprises nearly 40 of national output States in this region include Jalisco Guanajuato and Michoacan with 19 11 and 10 production shares
Advice on broiler and egg production in Mexico was provided by Cirpriano BerIruljo-Osornio Union Nacional de Avicultores Mexico City
Mexico
14
3
respectively Puebla a state in the Central region produces about 5 of national production while Sonora in the Pacific North has a 13 production share (Table A4)
In contrast to poultry production in Mexico hog production is carried out under a variety of systems Three systems dominate (1) technical (2) semi-technical and (3) rural systems The technical system is an intensive confined feeding system and tends to parallel technology in the United States The semi-technical system typically involves smaller less capitalized production units than those characterized by the technical system With the rural or traspatio system hogs scavenge for much of their food supply No grain or concentrate are typically fed An estimated 35 of the Mexican pork supply is generated by the technical system which includes about 17 of the nations breeding herd The semi-technical system includes about 30 of the hog population and produces about 35 of the national pork output In contrast the rural system includes 53 of the hog population but produces only 30 of the annual pork supply
Hogs produced in the technical and semi-technical systems consume grain but tend to be characterized by differing conversion ratios Hogs in the rural system consume virtually no grain To accurately estimate grain consumption by hogs in the technical and semi-technical systems Perez estimated state-by-state production accomplished by each system4
bull This information in combination with conversion ratios and other parameters was used to estimate grain consumption (Table A5)
Dairy
The Mexican dairy production industry is characterized by three production systems including (1) the technical or confined system (2) the semi-technical or pastoral system and (3) the dual-purpose system The technical or confined system includes an estimated 14-18 of the Mexican dairy herd and produces about 50 of the domestically produced milk Cows in this system are typically Holsteins which produce 4000 to 6000 liters per year These animals are fed high quality forages and concentrates Artificial insemination is a typical breeding practice Some heifer replacements are imported from the United States or Canada In general herds in this system are well managed and similar to large dairy farms in the southwest United States (Knutson et al Hallberg et al Odermatt et al)
The semi-technical or pastoral system includes about 23 of the national dairy herd and about 17 of Mexican milk production Most cows in this system are crosses between Zebu and Holstein or Brown Swiss Cows in this system annually produce up to 4000 liters and are maintained on improved pasture supplemented by corn stalks grain and oilseed meals
Dual-purpose operations in Mexico are primarily beef production units that earn additional income by milking lactating beef cows Cows in this system are typically Zebu with annual
4 Rosario Perez-Espejo is witlt Comisi6n Nacion de Porcicultura Mexico City Mexico
15
production of 540 to 750 liters per year Cows in this system are fed on native pasture and receive no grain or concentrate
Grain consumption by animals in the technical and semi-technical production systems was estimated from data on regional populations and rations Population data was obtained from the Secretarfa de Agricultura y Recursos Hidraulicos and rations from dairy farms in Mexico (Tables A6 and A7)
Beef
Although beef is important in the Mexican diet a relatively small portion of Mexican beef production is grain-fed An estimated 580000 head were grain-fed during 1990 To calculate grain consumption it was assumed that approximately 160 kiloshead are gained during the feeding process and that the feed to meat conversion ratio is 80 1 (Table A8) Further it was assumed that 40 of the ration was grains
SheepGoats
Sheep and goats are a relatively minor source of meat for the Mexican population In 198990 approximately 57000 mt of sheep and goat meat were produced in Mexico Production is concentrated in San LUls POtOSl (15) Mexico (9) Coahuila (7) Puebla (7) Hidalgo (6) and Zacatecas (5) Population data in combination with a coarse grain conversion ratio of 19 were used to estimate grain consumption (Sullivan et al)
Advice on beef ration and consumption provided by Ricardo Celrna US Feed Grains Council Mexico City Mexico
16
5
References
Apoyos y Servicios ala Comercializaci6n Agropecuaria (ASERCA) FAX communication 1993
Bivings EL Price Seasonality and Trade Liberalization A Dynamic Spatial Modd of the Mexican Feedgrains Sector Unpublished PhD Dissertation Stanford University 1992
Garda JA MA Garda and LM Sagarnaga Flujos Comerciales de Maiz en Mexico CONASUPO 1992
Garcia MR DG Garcia and HR Montero Notas Sobre Mercados y Comercializacion de Productos Agropecuarios Colegio de Post-graduados Montecillo Mexico 1990
Salinas de Gortari e Quinto Infonne de Gobierno 1993 Anexo Poder Ejecutivo Federal 1993
Grennes T J Hernandez B Krissoff J Matus J Sharples and e Valdes An Analysis ofa United States-Canada-Mexico Free Trade Agreement Commissioned Paper No 10 International Agricultural Trade Research Consortium November 1991
Hallberg Me JR Cranney SM Smith and eM Faldes The Mexican Dairy Economy and Potentials ofLiberalized Trade for the us Dairy Industry AE amp RS 236 Agricultural Economics and Rural Sociology Department The Pennsylvania State University July 1992
Instituto Nacional de Estadlstica Geografia e Informatica (INEGI) Abasto y Comercializacion de Productos Bdsicos Maiz 1988
Instituto Nacional de Estadlstica Geografia e Informatica (INEGI) El Sector Alimentario en Mexico Edici6n 1992
Knochenhauer G La Modernizaci6n dd Agro en Mexico Comercio Exterior VoL 40 No9 September 1990
Knutson R eP Rosson III J Oudaw A Angel and J Miller NAFTA and the us Dairy Industry AFPC Policy Working Paper 93-3 Department of Agricultural Economics Texas AampM University May 1993
Krissoff B L Neff and J Sharples Estimated Impacts of a Potential US-Mexico Preferential Trading Arrangement for the Agricultural Sector Agriculture and Trade Analysis Division Economic Research Service US Department of Agriculture January 1992
Matus J Precios de Garantfa y PoHtica Agraria Comercio Exterior VoL 40 No 10 October 1990
17
Mufioz M Limites y Potencialidades dd Sistema de la Leche en Mexico Comertio Exterior VoL 40 No9 September 1990
1992 Milling Directory and Buyers Guide Sosland Publishing Co Kansas City Kansas 1993
Odermatt P and M Mufioz Retos y Oportunidades del Sistema Leche en Mexico Ante EI Tratado de Libre Comercio Centro de Investigaciones Economicas Sociales y T ecnologicas de la Agricultura y la Agroindustria Mundial (CIESTAAM) Universidad Autonoma Chapingo Chapingo Mexico October 1993
Roberts D and P Trapido Government Intervention in Latin American Agriculture 1982-1987 Economic Research Service Agricultural and Trade Analysis Division 1988
Salcedo S JR Garcia and M Sagarnaga Politica AgrIcola y Maiz en Mexico Hacia el Libre Comercio Norteamericano Comercio Exterior VoL 44 No4 April 1993
Salinas R El Campo Mexicano Ante el Reto de la Modernizacion Comertio Exterior VoL 40 No9 September 1990
Schulthies BK KD Hall C Livas-Hernandez and GW Williams The Agriculture ofMexico TAMRC International Market Research Report No IM-1-93 Department of Agricultural Economics Texas AampM University Forthcoming
Secretarfa de Agricultura y Recursos Hiddulicos (SARH) Subdireccion de Disefio de Sistemas Anuario Estadistico de la Production Agricola Nacional Direcci6n General de Estadfstica March 1991 a
Secretaria de Agriculrura y Recursos Hidraulicos (SARH) Subsecretaria de Planeacion Boletin Mensual de Informacion Bdsica del Sector Agropecuario y Forestal ISSN-0188-4360 October 1991b
Secretaria de Agricultura y Recursos Hidraulicos (SARH) Subsecretarla de Planeacion Cultivos Bdsicos Printipales Indicadores 1960-1991 May 1992
Secretaria de Agricultura y Recursos Hidriulicos (SARH) Subsecretaria de PoHtica Sectorial y Concertacion Indicadores del Sector Agropecuario y Forestal Mexico City Mexico 1989
Secretarfa de Comercio y Fomento Industrial (SECOFI) Servicio Nacional de Informacion de Mercados Comportamiento de la Production y Comertializacion del Trigo Durante el Perlodo 1987-1991 1992
Secretarla de Comercio y Fomento Industrial (SECOFI) FAX communication 1993
18
Sullivan J J Wainio and V Roningen A Database for Trade Liberalization Studies Economic Research Service US Department of Agriculture March 1989
Torres F Patr6n de Abastecimento y Distribuci6n del Malz en la ZMCM Tesis Doctorado en Economfa Universidad Nacional Aut6noma de Mexico 1993
US Department of Agriculture (USDA) Agriculture in a North American Free Trade Agreement Analysis of Liberalizing Trade Between the United States and Mexico Economic Research Service Washington DC July 1992
US Department of Agriculture (USDA) GEDES Voluntary Report Agricultural Affairs Office Mexico City Mexico various issues
US Department of Agriculture Production Supply and Demand Database Economic Research Service Washington DC various issues
Valdes CM Mexico Western Hemisphere Situation and Outlook Series RS-94-2 Economic Research Service US Department of Agriculture July 1994
Valdes CM and K Hjort Potential Effects of the NAFTA on Mexicos Grain Sector Western Hemisphere Situation and Outlook Series RS-93-2 Economic Research Service US Department of Agriculture July 1993
19
FIGURES
Figure 1 Mexican States
Chihuahua
~
Aguascaliemes
Nayarit
Guanajuato
Morelos
Figure 2 Study Regions in Mexico
Pacific North
~
~
Figure 3 Percent ofMcrican Com Wheat Sorghum and Soybean Production by Month 1987-1990
70
60
I I
0 I50 -
o o I
middotbullbull bullbull
bull middot bull Imiddot I 40 It
I bull bull bull bull I p i I I~ 30
20
10
o
I bull bull i Ibull bull I
i Ibull bull i I I
middot middot
-
-January February March April May June July AugUSt September October November December
Montb
Com Wheat Sorghum Soybeans
Source Secretarla de Agricultura y Recursos Hidniulicos Subsecretarfa de Planeaci6n Boletin Mensual de Informaci6n Bctsica del Sector Agropecuario y Forestal ISSN-0183-4360 October 1991
bullbull bull bull bull bull bull bull bull
bull bull bull bull
bull bull bull bull
bull bull bull bull
3200
3000
2800
2600
fl ~2400u ~ tv
Vl
2200
2000
1800
1600
Figure 4 Estimated Mexican Population and Per Capita Gross Domestic Product 1980-1991
90
bull
bullmiddotbull bull bull bull bull 85 bull bullbull bull bull bull bull bullbull bull bull bull bull bull bullbullbull bullbullbull bullbull
bull bullbull bullbull BOa bull bull ~middotbull bull
bullbullbull bull
bullbull bullbull
bullbullbullbullbullbullbull
sect
bull bullbull bullbull bullbull t 75e
bull bull o bullbull bull
obull bullbull
o bull 70 bullbullbullbull
65 1980 1981 1982 1983 1984 1985 1986 1987 1988 1989 1990 1991
Year
Population Gross Domestic ProductlCapita
Source USDA ERS Watern Hlmisphm Situation and Outlook Sents 1993
TABLES
1991
Table 1 Merico Com Production by Region and State 1987-1991
Mexican ampgionlState 1287 1988 1982 1920 ----------------------------------------------- metric tons -----------------------------------------shy
Central Distrito Federal 28774 25152 29585 21786 22168 Mexico 1886116 617230 1167505 2327144 1755997 Guanajuato 434198 410681 408406 666431 531155 Hidalgo 328773 336414 358045 439723 382287 Morelos 43778 71081 87317 95254 67511 Puebla 563426 570023 897753 1077138 1023371 Queretaro 76410 44790 94352 107156 71113 llaxcala 301219 119982 275538 305474 294456
Subtotal 3662694 2195353 3318501 5040106 4148058 Gulf
Tabasco 97299 77084 82661 92161 74294 Tamaulipas 441571 893661 543603 658631 441515 Veracruz 569513 700055 719787 846122 791893
Subtotal 1108383 1670800 1346051 1596914 1307702 North
Chihuahua 399118 250425 235504 435729 740155 Coahuila 42798 45822 30552 46403 63137 Nuevo Leon 68537 50947 38246 61180 59489
Subtotal 510453 347194 304302 543312 862781 North Central
Aguascalientes 55837 47108 41799 74222 47460 Durango 204005 168950 109676 234458 239127 San Luis Potosi 163037 203573 146417 197093 216681 Zacatecas 383192 279671 191176 458416 216501
Subtotal 806071 699302 489068 964189 719769 Pacific Central
Colima 47346 69524 72369 75270 62552 Jalisco 1768973 1812274 1534645 2226388 1779491 Michoacan 840501 842049 644091 904757 965718 Nayarit 99731 142313 141410 144399 172277
Subtotal 2756551 2866160 2392515 3350814 2980038 Pacific North
B California Norte 12192 11219 7686 3273 2012 B California Sur 4600 6109 9017 26643 77843 Sinaloa 149821 140383 237518 317517 813661 Sonora 116222 193609 34540 119401 398184
Subtotal 282835 351320 288761 466834 1291700 Pacific South
Chiapas 1119747 1067807 1125677 1075343 983415 Guerrero 778936 863892 972546 828556 786515 Oaxaca 350990 509867 542039 452964 422014
Subtotal 2249673 2441566 2640262 2356863 2191944
Peninsula Campeche 78484 12839 55907 92766 52141
Quintana Roo 30843 6045 21669 34370 16250
Yucatan 120941 8924 87651 119860 131844
Subtotal 230268 27808 165227 246996 200235
Total 11606928 10599503 10944687 14566028 13702~27
Source INEGI 1992
27
Table 2 Mexico Wheat Production by Region and Stare 1987-1991
Mexican ReeionState 1287 1988 1289 1220 1991 ---------------------------------------------- metric tons --------------------------------------shy
Central Distrito Federal 300 0 36 0 0 Mexico 38162 51072 69138 71003 63079 Guanajuato 941379 581150 629187 452860 795312 Hidalgo 2457 6866 14801 20616 41975 Morelos 1744 1960 2742 3003 2645 Puebla 26488 11491 40339 50890 51004 Queretaro 20445 19886 12258 21141 26964 Tlaxcala 60307 27328 87290 116668 132475
Subtotal 1091282 699753 855791 736181 1113454 Gulf
Tabasco 0 0 0 0 0 Tamaulipas 23174 34360 21389 27733 26047 Veracruz 476 25 1584 1093 856
Subtotal 23650 34385 22973 28826 26903 North
Chihuahua 245932 230200 203164 180324 251348 Coahuila 24259 32347 20403 25472 29165 Nuevo Leon 65608 47080 20628 36831 36892
Subtotal 335799 309627 244195 242627 317405 North Central
Aguascalienres 35 235 237 50 18 Durango 31278 37316 30490 29433 37671 San Luis Potosi 894 2527 809 3087 2097 Zacatecas 4680 8632 12266 20666 15673
Subtotal 36887 48710 43802 53236 55459 Pacific Central
Colima 0 0 0 0 0 Jalisco 196875 137446 170076 87609 146746 Michoacan 217867 197580 220047 117663 273959 Nayarit 0 0 0 0 0
Subtotal 414742 335026 390123 205272 420705 Pacific North
B California Norte 402448 250695 224104 256642 329284 B California Sur 87657 134704 132881 93328 68619 Sinaloa 611692 397690 1045543 888578 624122 Sonora 1504422 1439295 1396912 1412958 1149707
Subtotal 2606219 2222384 2799440 2651506 2171732 Pacific South
Chiapas 2 0 3 352 322 Guerrero 0 0 0 0 0 Oaxaca 6810 14943 18111 12904 11727
Subtotal 6812 14943 18114 13256 12049 Peninsula
Campeche 0 0 0 0 0
Quintana Roo 0 0 0 0 0
Yucatan 0 0 0 0 0
Subtotal 0 0 0 0 0
Total 415151391 3)6641828 41374A38 319301204 4z1171707
Source INEGI1992
28
Table 3 Mexico Sorghum Production by Region and State 1987-1991
Mexican RegionState 1987 1288 1982 1920 1991 ------------------------------------------ metric tons -------------------------------shy
Central Distrito Federal Mexico 2210deg 1061deg 703deg 124deg 855deg Guanajuato 1385688 1504970 1035350 1691242 965491 Hidalgo 390 340 203 109 Morelos 68438 98182 105336 130752deg 78216 Puebla 5394 23165 29305 28187 13318 Queretaro 111149 74606 90659 92791 92719 Tlaxcala deg deg deg 1943096deg deg Subtotal 1573269 1702324 1261556 1150708
Gulf Tabasco 15519 8666 10164 11459 2292 Tamaulipas 2062935 2013545 1106870 1946886 1605121 Veracruz 6058 5629 5970 17817 6045
Subtotal 2084512 2027840 1123004 1976162 1613458 North
Chihuahua 159998 103292 129411 126144 90325 Coahuila 41630 32237 29161 26395 45122 Nuevo Leon 163779 112069 97375 75797 61927
Subtotal 365407 247598 255947 228336 197374 North Central
Aguascalientes 3769 3108 5719 2428 5172 Durango 40808 24020 26933 21635 27047 San Luis Potosi 15716 28723 28802 34598 23417 Zacatecas 5160 6812 6426 8745 3460
Subtotal 65453 62663 67880 67406 59096 Pacific Central
Colima 4423 7295 5226 4713 2919 Jalisco 792091 914626 801295 637340 495319 Michoacan 628199 583067 594827 519309 420019 Nayarit 105979 90030 129537 117229 58834
Subtotal 1530692 1595018 1530885 1278591 977091 Pacific North
B California Norte 22175 4536 12121 10028 4911 B California Sur 17185 15895 51479 14198 2014 Sinaloa 518871 150242 408616 442862 207834 Sonora 95248 53000 45292 46869 25696
Subtotal 653479 223673 517508 513957 240455 Pacific South
Chiapas 12883 21754 29119 17139 9184 Guerrero 5835 8049 11428 12666 10260
Oaxaca 1328 4128 8201 4344 9938 Subtotal 20046 33931 48748 34149 29382
Peninsula Campeche Quintana Roo Yucatan
Subtotal
2946 371
1836 5153
85 499
1318 1902
280 622 120
1022
239 7 9
255
deg deg63 63
Total 6298011 5894949 4806550 6041952 4267627
Source INEG 1992
29
~~~--
Table 4 Mcrico Soybean Production by Region and Stare 1987-1991
Mexican RegionState 1987 1988 1982 1990 1921 ---------------------------------------------- metric tons ---------------------------------------shy
Central Distrito Federal 0 0 0 0 0 Mexico 0 22 40 11 20 Guanajuato 0 0 0 0 8 Hidalgo 0 0 0 0 0 Morelos 1 0 0 9 0 Puebla 0 0 0 0 0 Queretaro 0 0 0 0 0 Tlaxcala 0 0 0 0 0
Subtotal 1 22 40 20 28 Gulf
Tabasco 0 0 0 0 0 Tamaulipas 37462 70881 57180 72188 56359 Veracruz 1495 4173 7600 1176 1632
Subtotal 38957 75054 64780 73364 57991 North
Chihuahua 46405 25340 38683 21309 15063 Coahuila 0 0 0 0 0 Nuevo Leon 0 0 1 4 1756
Subtotal 46405 25340 38684 21313 16819 North Central
Aguascalientes 0 0 0 0 0 Durango 28 230 0 0 0 San Luis Potosi 5579 7115 9797 4327 1896 Zacatecas 0 0 1 0 0
Subtotal 5607 7345 9798 4327 1896 Pacific Central
Colima 8 0 0 0 0 Jalisco 17 0 13 0 0 Michoacan 109 0 0 0 0 Nayarit 0 0 0 0 2
Subtotal 134 0 13 0 2 Pacific North
B California Norte 236 27 218 0 0 B California Sur 78 0 0 0 0 Sinaloa 448946 24550 575772 435272 415527 Sonora 233000 54569 254071 5769 203776
Subtotal 682260 79146 830061 441041 619303 Pacific South
Chiapas 54431 39218 47732 34633 26137 Guerrero 6 24 16 11 3 Oaxaca 0 0 0 0 0
Subtotal 54437 39242 47748 34644 26140
Peninsula Campeche Quintana Roo Yucatan
Subtotal
60 349
0 409
32 124
0 156
1010 274
0 1284
300 0 0
300
250 0 0
250
Total 828210 226305 992408 575009 722429
Source INEG 1992
30
Table 5 Mexico Estimalld Grain Consumption by Livesto~ Poulay and Dairy 1989-1990
Mexican RegionState Pork Eggs Broilers Dail Beef SheeeGoats Turkey Total
----------------------------------------------------------- metric tons ------------------------------------------------------shyCentral
Distrito Federal 15237 3655 4915 15502 110 592 137 40148 Mexico 100846 29907 101131 79857 20846 12858 4374 349820 Guanajuato 278388 67291 167130 69059 3600 5594 deg 591061 Hidalgo 85826 8637 71641 42908 10392 9085 1799 230287 Morelos 7818 42902 74117 11 515 2281 547 486 139665 Puebla 112623 351896 125111 55711 3268 9903 7934 666447 Queretaro 13282 8145 65845 28665 9705 1629 338 127608 Tlaxcala 35683 1325 4654 16119 1480 2600 477 62339
Subtotal 649703 513760 614544 319336 51682 42808 15545 2207375 Gulf
Tabasco deg 3586 27432 32070 922 472 8304 72785 Tarnaulipas 13649 6936 4552 15697 8955 2127 3359 55274 Veracruz deg 19805 101674 153297 6083 5053 deg 285912
Subtotal 13649 30327 133659 201064 15959 7653 11662 413972 North
Chihuahua 45759 6040 11858 68142 11987 5288 9864 158937 Coahuila 37280 55094 29683 43347 40450 10038 deg 215892 Nuevo Leon 55405 108965 91967 9840 44960 4509 deg 315644
Subtotal 138444 170098 133508 121328 97397 19835 9864 690473 North Central
Aguasca1ientes 13180 8150 45252 17694 1202 1865 deg 87344 Durango 46013 79236 128117 50710 2032 4425 deg 310532 San Luis Potosi 29781 2008 40479 46698 885 21698 0 141548 Zacatecas 51042 3680 6861 50594 614 7366 105 120262
Subtotal 140016 93074 220709 165696 4734 35353 105 659686 Pacific Central
Colima 5537 5119 7564 7152 2491 598 125 28587 Jalisco 427208 385559 178233 189336 33637 4434 deg 1218407 Michoacan 174126 56053 16567 129582 3584 6241 deg 386153 Nayarit 21613 27143 24933 10945 289 551 deg 85474
Subtotal 628485 473874 227297 337016 40000 11824 125 1718621 Pacific North
B California Norte 25241 24187 7548 21547 34579 957 deg 114059 B California Sur 4149 5846 4740 2304 801 794 deg 18633 Sinaloa 82416 97166 77494 43991 20043 1509 deg 322618 Sonora 433390 221064 53453 29093 25467 1375 14049 777892
Subtotal 545196 348264 143235 96935 80890 4635 14049 1233202 Pacific South
Chiapas deg 14130 32995 57080 1080 3408 3650 112342 Guerrero deg 14906 77401 22898 2051 6526 3039 126821 Oaxaca deg 6680 7575 40319 789 10688 693 66743
Subtotal deg 35716 117972 120296 3920 20622 7381 305906 Peninsula
Carnpeche deg 1379 9197 5795 deg 101 512 16983
Quintana Roo 21442 3366 11315 866 deg 146 119 37254
Yucatan 42957 43914 81108 5158 1485 474 1432 176527 Subtotal 64399 48658 101619 11819 1485 721 2064 230764
Total 211791820 Il13l70 116921243 113731482 2961067 143A50 6deg1793 7A601000
31
Table 6 Mexico Estimated Com ProductionConsumption and Apparent SwpluslDdicit by Region and State 1989-1990
Human Livestock Industrial Surplus or Mexican RegionState Production Consum~tion Consum~tion Seed Loss (Deficit)
-------------------------------------------- metric tons -------------------------------------------shyCentral
Distrito Federal 26356 1046071 1345 23814 (1044874) Mexico 1040064 1246762 53066 270367 (530131) Guanajuato 363826 505853 18551 52616 (213194) Hidalgo 318962 239853 35837 45291 (2018) Morelos 77786 151792 4033 11428 (89467) Puebla 799757 524081 121433 113687 40557 Queretaro 84053 133524 4289 76117 (129877) TIaxcala 245461 96696 31905 35530 81330
Subtotal 2956264 3944630 270458 628850 (1887674) Gulf
Tabasco 73638 190745 3644 10349 (131100) Tamaulipas 484265 285733 24626 142890 31016 Veracruz 641217 791086 9587 141356 (300811)
Subtotal 1199120 1267564 37857 294595 (400895) North
Chihuahua 209797 310157 11399 53410 (165169) Coahuila 27217 250519 1389 3940 (228631) Nuevo Leon 34071 393589 1739 37163 (398420)
Subtotal 271085 954264 14527 94513 (792219) North Central
Aguascalientes 37236 91408 1900 5390 (61462) Durango 97704 171392 4985 14142 (92815) San Luis Potosi 130435 254437 6542 18547 (149091) Zacatecas 170308 162113 9944 24656 (26406)
Subtotal 435683 679351 23371 62735 (329774) Pacific Central
Colima 64469 54428 4373 8477 (2808) Jalisco I367128 673526 284615 650865 (241878) Michoacan 573784 450678 32574 99865 (9333) Nayarit 125974 104743 6318 42461 (27548)
Subtotal 2131356 1283374 327880 801668 (281566) Pacific North
B California Norte 6847 210955 10349 989 (215446) B California Sur 8033 40361 400 1134 (33862) Sinaloa 211591 279950 10771 71443 (150573) Sonora 30770 231627 197542 31125 (429524)
Subtotal 257241 762893 219062 104691 (829405) Pacific South
Chiapas 1002802 407784 49876 163139 382003 Guerrero 866386 332863 105718 125252 302553 Oaxaca 482872 383532 40745 69339 (10744)
Subtotal 2352059 1124179 196339 357730 673812
Peninsula Campeche 49804 67977 2550 7281 (28004)
Quintana Roo 19304 62654 984 2792 (47126)
Yucatan 78083 173115 6971 11264 (113267)
Subtotal 147191 303746 10505 21337 (188397)
Total 9750000 10320000 1100000 2366119 (4036119)
32
Table 7 Maico Estimated Wheat ProductionConsumption and Apparent SurpluslDeficit by Region and Sta~ 1989-1990
Milling livestock Surplus or Mexican RegionState Production Consum[tion Consum[tion (Deficit)
----------------------------------------------- metric tons -------------------------------------------shyCentral
Distrito Federal 35 665888 2 (665852) Mexico 68084 457955 3754 (389871) Guanajuato 444710 254900 24522 189811 Hidalgo 14386 55457 793 (41071) Morelos 2699 15772 149 (13074) Puebla 39765 455769 2193 (416005) Queretaro 18350 50370 1012 (32020) l1axcala 85912 0 4737 85912
Subtotal 673941 1956111 37162 (1282170) Gulf
Tabasco 0 0 0 0 Tamaulipas 27295 0 1505 27295 Veracruz 1559 78451 86 (76892)
Subtotal 28854 78451 1591 (49597) North
Chihuahua 166530 98064 9183 68466 Coahuila 25069 172883 1382 (147813) Nuevo Leon 36013 247807 1986 (211794)
Subtotal 227612 518754 12551 (291141) North Central
Aguascalientes 7 57746 0 (57739) Durango 21144 92003 1166 (70859) San Luis Potosi 738 24422 41 (23684) Zacatecas 11421 1347 630 10074
Subtotal 33309 175517 1837 (142208) Pacific Central
Colima 0 0 0 0 ]alisco 83464 130407 4602 (46943) Michoacan 116404 214706 6419 (98302) Nayarit 0 0 0 0
Subtotal 199868 345113 11021 (145245) Pacific North
B California Norte 252336 40278 13914 212058 B California Sur 91853 12389 5065 79464 Sinaloa 789239 129029 43520 660210 Sonora 1039965 234038 302345 805927
Subtotal 2173394 415734 364845 1757660 Pacific South
Chiapas 54 43933 3 (43879) Guerrero 0 14750 0 (14750) Oaxaca 17968 0 991 17968
Subtotal 18022 58682 994 (40661)
Peninsula Campeche Quintana Roo Yucatan
Subtotal
0 0 0 0
18828 0
104810 123638
0 0 0 0
(18828) 0
(104810) (123638)
Total 3355000 3672000 430000 (317000)
33
Table 8 Mexico Estimated SoIghum ProductionConsumption and Apparent SurplusDeficit by Rfgion and State 1989-1990
Livestock Surplus or Mexican RegionState Production Consumption SeedLoss (Deficit)
-------------------------------------------- metric tons -----------------------------------------shyCentral
Distrito Federal 0 38801 deg (38801)
Mexico 548 293000 53 (292504)
Guanajuato 807765 547988 77428 182349
Hidalgo 158 193658 15 (193514)
Morelos 82182 135483 7883 (61185)
Puebla 22863 542821 2192 (522150)
Queretaro 70731 122307 6780 (58356) Tlaxcala deg 25697 deg (25697)
Subtotal 984247 1899756 94350 (1009859) Gulf
Tabasco 7930 69141 728 (61939) Tamaulipas 863564 29143 136046 698375 Veracruz 4658 276239 1048 (272629)
Subtotal 876151 374523 137822 363806
North Chihuahua 100965 138355 9678 (47069)
Coahuila 22751 213120 2181 (192550) Nuevo leon 75971 311919 7282 (243231)
Subtotal 199686 663395 19141 (482850)
North Central Aguascalienres 4462 85444 428 (81409)
Durango 21013 304381 2014 (285383) San Luis Potosi 22471 134965 2849 (115344) Zacatecas 5013 109688 481 (105155)
Subtotal 52959 634478 5772 (587291) Pacific Central
Colima 4077 24214 313 (20450)
Jalisco 625159 929189 59969 (364000)
Michoacan 464075 347160 44605 72311
Nayarit 101063 79156 8241 13666
Subtotal 1194374 1379720 113127 (298473) Pacific North
B California Norte 9457 89796 906 (81246)
B California Sur 40163 13168 3875 23120
Sinaloa 318796 268327 30712 19757
Sonora 35336 278005 3387 (246056)
Subtotal 403752 649296 38880 (284425)
Pacific South Chiapas 22718 62463 1963 (41708)
Guerrero 8916 21103 782 (12969)
Oaxaca 6398 25008 621 (19231)
Subtotal 38032 108574 3366 (73908)
Peninsula Campeche 218 14433 37 (14252)
Quintana Roo 485 36270 deg (35785)
Yucatan 94 169556 4 (169467)
Subtotal 797 220259 42 (219504)
Total 3750000 5930000 412500 (2592500)
34
Table 9 Mexico Estimated Soybean ProductionConsumption and Apparent SurplusDeficit by Region and Scue 1989-1990
Processing Feed Seed Surplus or Mexican RegionState Production Consumetion Loss (Deficit)
--------------------------------------------shy metric tons ------------------------------------------shyCentral
Distrito Federal 0 23353 0 (23353)
Mexico 47 70591 3 (70547)
Guanajuato 0 60091 0 (60091) Hidalgo 0 0 0 0 Morelos 0 0 0 0 Puebla 0 125886 0 (125886) Queretaro 0 0 0 0 ~naxcala 0 0 0 0
Subtotal 47 279921 3 (279877) Gulf
Tabasco 0 0 0 0
Tamaulipas 56226 119220 3257 (66251) Veracruz 7585 39217 439 (32071) Subtotal 63811 158437 3696 (98322)
North Chihuahua 38306 2219 36087 Coahuila 0 0 deg 0 Nuevo Leon 1 223537 0 (223536)
Subtotal 38307 223537 2219 (187449) North Central
Aguascalientes 0 0 0 degDurango 0 70591 deg (70591) San Luis Potosi 9704 0 562 9142 Zacatecas 0 0 0 degSubtotal 9704 70591 562 (61449)
Pacific Central Colima 0 0 deg degJalisco 13 465898 1 (465886) Michoacan deg 5971 0 (5971) Nayarit deg 0 0 0
Subtotal 13 471869 (471857) Pacific North
B California Norte 216 deg 13 203 B California Sur deg deg 0 degSinaloa 571687 91768 33116 446803 Sonora 251596 354522 14574 (117500)
Subtotal 823499 446290 47703 329506 Pacific South
Chiapas 47332 0 2742 44590
Guerrero 16 0 1 15
Oaxaca 0 0 deg 0
Subtotal 47348 0 2743 44605
Peninsula Campeche 1000 deg 58 942
Quintana Roo 271 0 16 255
Yucatan 0 122357 0 (l22357)
Subtotal 1271 122357 74 (121160)
Total 984000 1773000 57000 846z000l
35
Table 10 Mexico Guaranteed and N~tiated Prices for Grains and Soybeans 1989-91
SpringSummer FalVWinter SpringSummer FalVWinter SpringSummer Grain 1989 1989-90 1990 1990-91 1991
-----------------------------------------shy 1000 pesoslmt ---------------------------------------shy
White Corn 435S 60001 63601 68011 71501
YeUowCorn 435S 60001 53001 56501 5950
Sorghum 32001 36002 41402 37002 38002
Wheat 39501 48402 56002 57502
Soybeans 98601 85002 81002
IGuaranteed prices lNegotiated prices
Sources Salinas de Gortari and US Department of Agriculture 1989
36
APPENDIX TABLES
1221
Table AI Mexico Broiler Production by Rfgion and State 1987-1991
Mexican ReeionState 1987 1988 1989 1920 ---------------------------------------- metric tons ------------------------------------shy
Central Distrito Federal 1351 2100 2131 2096 1908 Mexico 45290 36662 40167 44884 56537 Guanajuato 58035 59944 62042 76248 79069 Hidalgo 32182 30802 28838 31612 30465 Morelos 12639 11950 24573 35219 38515 Puebla 44089 36600 40138 60091 61425 Queretaro 22175 25200 23589 30448 69120 Tlaxcala 2500 2543 1630 2170 886
Subtotal 218261 205801 223108 282768 337925 Gulf
Tabasco 13791 11202 11295 11984 12178 Tamaulipas 7709 9663 2242 1813 8074 Veracruz 33519 33118 37421 46540 52000
Subtotal 55019 53983 50958 60337 72252 North
Chihuahua 3850 2995 3818 5689 5204 Coahuila 11442 18942 11534 13296 13895 Nuevo Leon 35275 44996 40285 39021 39019
Subtotal 50567 66933 55637 58006 58118 North Central
Aguascalienres 9093 9163 19731 19244 15103 Durango 34392 11518 45298 59530 74143 San Luis Potosi 69209 14448 16857 17593 17596 Zacatecas 1114 1848 2629 3091 2536
Subtotal 113808 36977 84515 99458 109378 Pacific Central
Colima 1983 2070 3298 3217 4033 Jalisco 92380 94513 46364 90774 108373 Michoacan 9429 22513 6621 7333 7638 Nayarit 9582 13868 8623 11677 10968
Subtotal 113374 132964 64906 113001 131012 Pacific North
B California Norte 4230 4112 4296 2730 2232 B California Sur 930 1830 2275 1916 1951 Sinaloa 26359 27257 33778 32960 30106 Sonora 33850 24825 22985 22885 26223
Subtotal 65369 58024 63334 60491 60512 Pacific South
Chiapas 7187 11023 12230 15062 14430 Guerrero 13267 13831 12666 12989 13142 Oaxaca 2616 4298 2720 3500 3541
Subtotal 23070 29152 27616 31551 31113 Peninsula
Campeche 3832 4702 3405 4200 3915 Quintana Roo 1793 2536 3252 5615 5122 Yucatan 27800 36377 34301 35000 48600
Subtotal 33425 43615 40958 44815 57637
Total 672893 627449 611032 750427 8571947
Source INEGI 1992
38
Table Al ParameterS and Assumptions to Estimate Grain Consumption by Mexican Poulay Ind1lStlyl
Estimation of Grain Consumption by Broiler Production
(1) Carcass weight to live weight conversion ratio 067
(2) Concentrate to live weight conversion ratio 221
(3) 65 of concentrate is grain
(4) 3 death loss
Estimation of Grain Consumption by Broiler Mother Flock
(1) Hen lays 125 eggsyear
(2) Hen consumes 315 pounds of grain per day
Estimation of Grain Consumption by Layers2
(1) Concentrate to egg weight conversion ratio 231
(2) 65 of concentrate is grain
Estimation of Grain Consumption by Turkeys3
(1) Carcass weight to live weight conversion ratio 67
(2) Concentrate to live weight conversion ratio 301
(3) 65 of concentrate is grain
Advice provided by Cirpriano Bermajo-Osornio Union Nacional de Avicultores Mexico City Mexico Dr Philip Hargis Department of Poultry Science University of Arkansas and Dr PD Thornberry Department of Poultry Science Texas AampM University
Concentrate to egg weight conversion ratio includes poults grain consumption prior to laying Grain consumption by layers mother flock is small and calculated to be 07 of layer consumption
Conversion ratio reflects mother flock grain consumption and death loss
39
1221
Table A3 Mexico Egg Production by Region and State 1987-1991
Mexican ReeionState 1287 1988 1282 1920 ----------------------------------------- metric tons ---------------------------------------shy
Central Distrito Federal 4830 4616 2175 2184 2111 Mexico 24213 41499 24062 14616 27560 Guanajuato 37494 37088 39980 40237 42165 Hidalgo 10179 10135 6936 4228 6489 Morelos 21905 21078 49403 13238 14627 Puebla 171765 173846 174490 228372 273535 Queretaro 5974 11350 4100 5254 4194 TIaxeala 1147 1691 1185 586 4736
Subtotal 277507 301303 302331 308715 375417 Gulf
Tabasco 2166 2085 2121 2149 1842 Tamaulipas 13307 13118 5840 3255 1371 Veracruz 9160 13640 14081 10641 18317
Subtotal 24633 28843 22042 16045 21530 North
Chihuahua 2674 4452 3247 3789 5006 Coahuila 31937 39790 31243 33717 40473 Nuevo Leon 74442 81229 69400 62736 58598
Subtotal 109053 125471 103890 100242 104077 North Central
Aguascalientes 5050 5212 5498 4533 4675 Durango 41666 37290 46284 47791 57416 San Luis Potosi 1627 1676 1217 1188 1083 Zacatecas 1289 2347 2335 2123 2248
Subtotal 49632 46525 55334 55635 65422 Pacific Central
Colima 2061 2000 3294 2930 2300 Jalisco 191971 256123 210056 240419 258303 Michoacan 5998 18173 31469 34469 34839 Nayarit 16209 14046 11892 18429 17300
Subtotal 216239 290342 256711 296247 2742 Pacific North
B California Norte 13400 16184 14874 14201 18503 B California Sur 1797 4372 3831 3310 3374 Sinaloa 65471 64060 69614 51931 49811 Sonora 177120 167704 169884 112176 122578
Subtotal 257788 252320 258203 181618 194266 Pacific South
Chiapas 2951 8037 8329 8483 8015 Guerrero 7373 7579 8441 9129 9340 Oaxaca 3434 3800 4150 3900 4401
Subtotal 13758 19416 20920 21512 21756 Peninsula
Campeche 2514 3261 866 800 700 Quintana Roo 4905 4717 2900 1545 671
Yucatan 19000 17876 23822 27436 39800
Subtotal 26419 25854 27588 29781 41171
Total 9751029 110901074 110471012 I 1OO9l95 111361281
Source INEGI 1992
40
Table A4 Mexico Pork Produaion by Region and State 1987-1991
Mexican RegionState 1287 1988 1989 1290 1991 -------------------------------------- metric tons ---------------------------------------shy
Central Distrito Federal 5850 5402 4036 2552 2613 Mexico 90860 49974 36215 32424 25404 Guanajuato 87320 95083 85107 95376 99278
Hidalgo 20550 18802 15965 17047 13572 Morelos 5337 5315 1978 1346 1337 Puebla 29247 31421 37074 46644 61156
Queretaro 8090 11657 5229 4089 9612 Tlaxcala 7733 7680 10114 15423 11878
Subtotal 254987 225334 195718 214901 224850 Gulf
Tabasco 9603 11055 11389 10039 10665 Tamaulipas 8931 8780 3294 3534 5556 Veracruz 33807 32671 32131 34684 35766
Subtotal 52341 52506 46814 48257 51987 North
Chihuahua 9958 9608 11455 11686 15326 Coahuila 9070 6710 8618 6740 6802 Nuevo Leon 11389 14717 14410 13936 9890
Subtotal 30417 31035 34483 32362 32018 North Central
Aguascalientes 4788 3219 4089 4492 3718 Durango 11121 8216 8871 9016 6395 San Luis Potosi 9126 9137 5740 5836 6086 Zacatecas 14141 14092 12317 9024 10353
Subtotal 39176 34664 31017 28368 26552 Pacific Central
Colima 3477 3598 1718 1887 2200
Jalisco 149066 171208 138384 143290 155491 Michoacan 132404 111559 55664 58696 61624
Nayarit 5218 5711 3886 4346 5530 Subtotal 290165 292076 199652 208219 224845
Pacific North B California Norte 7985 6421 6580 6343 4969 B California Sur 322 862 850 1134 1061
Sinaloa 25215 25339 16597 22640 23235 Sonora 108099 110342 109729 110191 111033
Subtotal 141621 142964 133756 140308 140298
Pacific South Chiapas 35382 15436 13741 14783 32980
Guerrero 18938 19558 20142 20511 20802
Oaxaca 24250 25310 27512 23672 29363
Subtotal 78570 60304 61395 58966 83145
Peninsula Campeche 3898 4621 3574 3000 2800
Quintana Roo 6398 4559 4800 5700 5189
Yucatan 17000 13137 15461 17270 20215
Subtotal 27296 22317 23835 25970 28204
Total 914573 861200 726670 757351 811899
Source INEGI 1992
41
Table A5 Parameters and Assumptions to Estimate Grain Consumption by Mexican Hog IndllStJf
Estimation of Grain Consumption by Slaughtered Hogs
(1) Carcass weight to live weight conversion ratio 072
(2) Concentrate to live weight conversion factor for technical system 301
(3) Concentrate to live weight conversion factor for semi-technical system 41 1
(4) 75 of concentrate is grain
(5) 4 death loss
Estimation of Grain Consumption by Breeding Herd
(1) Average weight of slaughtered hog is 105 kilos
(2) Each sow produces 165 feeder pigs per year
(3) Sow to boar ratio 17
(4) Sows fed 5 lbslday of concentrate for 306 days per year and concentrate is 80 grain Sow fed 12 lbslday of concentrate for 59 days per year (lactation period) and concentrate is 64 grain
Advice provided by Rosario Perez-Espejo Comision Nacional de Porcicultura Merico City Merica Deparrment of Animal Science Texas AampM University and Dr T D Tanksley consultant to hog industry in Mexico
42
Table A6 Mexico Milk Cow Inventories by Production System RtWon and State 1990
Mexican ReeionState Semi-Specialized S~cialized Total
----------------------------------------- head ------------------------------------shyCentral
Distrito Federal 575 14589 15164 Mexico 30777 64796 95573 Guanajuato 72485 38955 111440 Hidalgo 0 40973 40973 Morelos 24737 1785 26522 Puebla 23874 44310 68184 Queretaro 2445 26462 28907 Tlaxcala 2157 14589 16746
Subtotal 157051 246458 403509 Gulf
Tabasco 77663 1707 79370 Tamaulipas 29627 3958 33585 Veracruz 305618 32592 338210
Subtotal 412907 38257 451164 North
Chihuahua 46166 47879 94045 Coahuila 18840 34377 53217 Nuevo Leon 4602 7682 12285
Subtotal 69609 89938 159547 North Central
Aguascalientes 2445 15986 18431 Durango 38975 33911 72886 San Luis Potosti 53070 24832 77902 Zacatecas 71191 21806 92997
Subtotal 165681 96534 262215 Pacific Central
Colima 4171 5277 9448 Jalisco 83128 149846 232974 Michoacan 1l2036 82023 194059 Nayarit 20566 2794 23360
Subtotal 219901 239939 459840 Pacific North
B California Norte 863 20254 21117 B California Sur 2157 1397 3554 Sinaloa 102400 3880 106280 Sonora 49186 9467 58654
Subtotal 154607 34998 189604 Pacific South
Chiapas 137636 3259 140895 Guerrero 39551 7139 46690 Oaxaca 60261 16063 76324
Subtotal 237447 26462 263908
Peninsula Campeche 10067 1785 11852 Quintana Roo 2013 78 2091 Yucatan 9061 1552 10613
Subtotal 21142 3414 24556
Total 1438344 776000 2214344
Source NEGI 1992
43
Table A7 Parameters and Assumptions to Estimate Grain Consumption by Morlan Dairy Ind~
Estimation of Grain Consumption by SpecializedSYstem
(1) 45 of population lactates at any point in time and this population consumes 56 lcilosday of grain
(2) Non-lactating population (55) consumes 054 lciloslday of grain
Estimation of Grain Consumption by Semi-Specialized System
(1) 45 of population lactates at any point in time and this population consumes 19 lcilosday of grain
(2) Non-lactating population (55) consumes 36 lcilosday of grain
Advice provided by Dr Bud Schwart Department of Agricultural Economics T ex AampM University Rations are based on those provided by operating dairies in Mexico
44
Table AB Mexico Grain-Fed Cattle Sheep and Goat Inventories by Region and Stare 1990
Mexican ReeionlState Cattle SheeeGoats ------------------------------ head --------------------------shy
Central Distrito Federal 215 234 Mexico 40715 5074 Guanajuato 4005 2207 Hidalgo 20296 3585 Morelos 4455 216 Puebla 6384 3908 Queretaro 18955 643 Tlaxcala 2891 1026
Subtotal 97916 16893 Gulf
Tabasco 1800 186 Tamaulipas 17490 839 Veracruz 11880 1994
Subtotal 31170 3020 North
Chihuahua 23412 2087 Coahuila 40727 3961 Nuevo Leon 87812 1779
Subtotal 151951 7827 North Central
Aguascalientes 2348 736 Durango 3969 1746 San Luis Potosi 1729 8562 Zacatecas 1199 2907
Subtotal 9245 13951 Pacific Central
Colima 4865 236 Jalisco 65697 1750 Michoacan 7000 2463 Nayarit 564 218
Subtotal 78126 4666 Pacific North
B California Norte 67537 378 B California Sur 1565 313 Sinaloa 39146 595 Sonora 49741 543
Subtotal 157989 1829 Pacific South
Chiapas 2108 1345 Guerrero 7031 2575 Oaxaca 1542 4217
Subtotal 10681 8138
Peninsula Campeche 0 40
Quintana Roo 0 58
Yucatan 2900 187
Subtotal 2900 285
Total 5781254 562607
Source INEGI 1992
45
48
DEP
APPENDIX A
BEA ECONOMIC REGIONS
[Fold out map]
91gt1
SISA1VNV )IWONOl3 ~O OV3HOa
1VNO~3H 31-U AS OllV3NmO
ONO~3 f3S ___________bull ___________________JJ----~__L_________________~
JnJJWWro 10 L3KJlyaQ saJYlS OlllAA
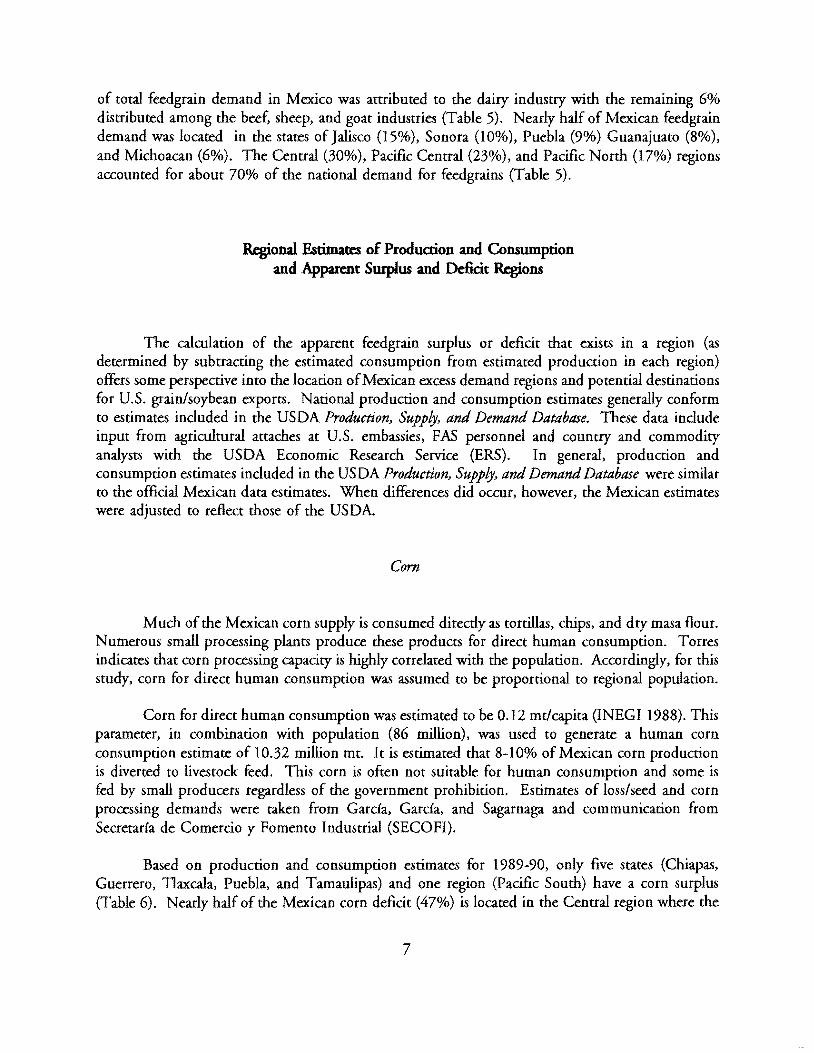
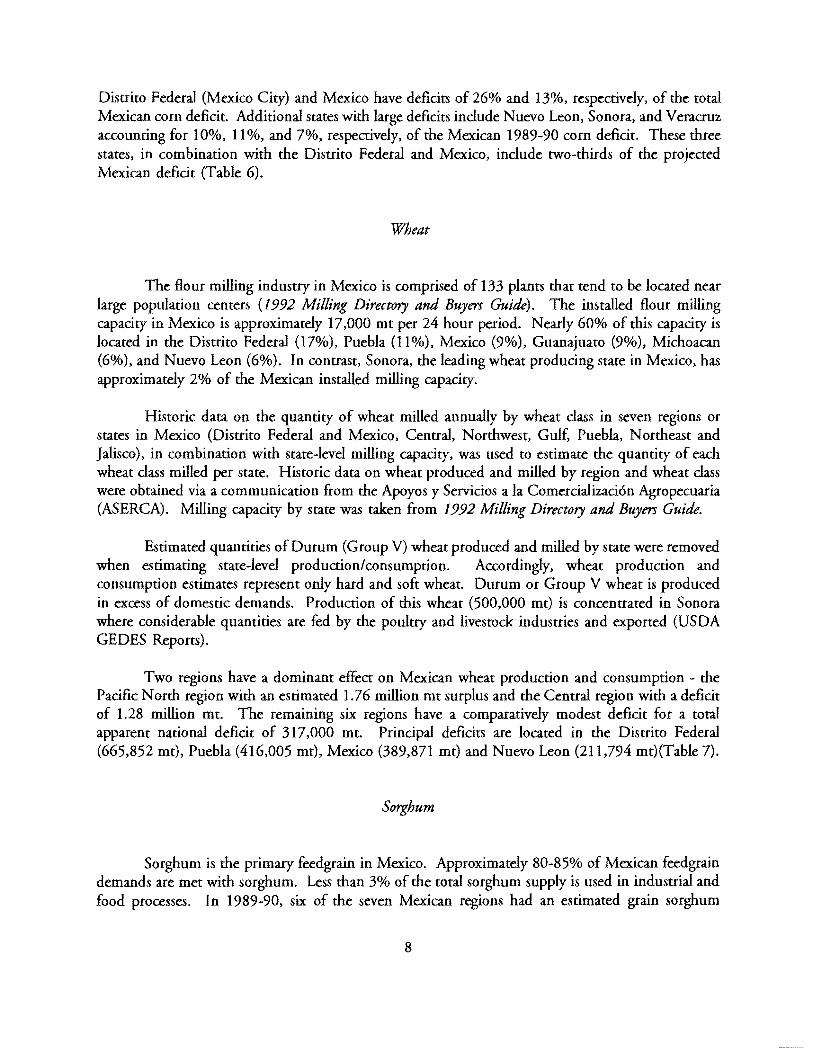
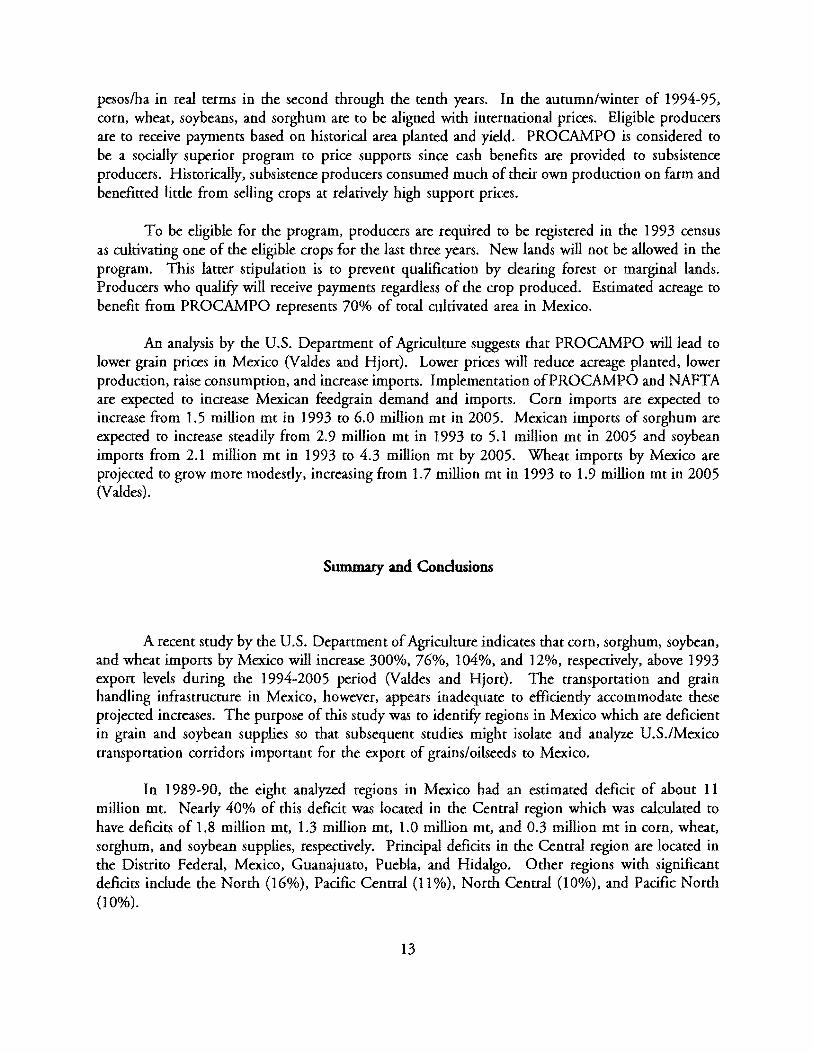
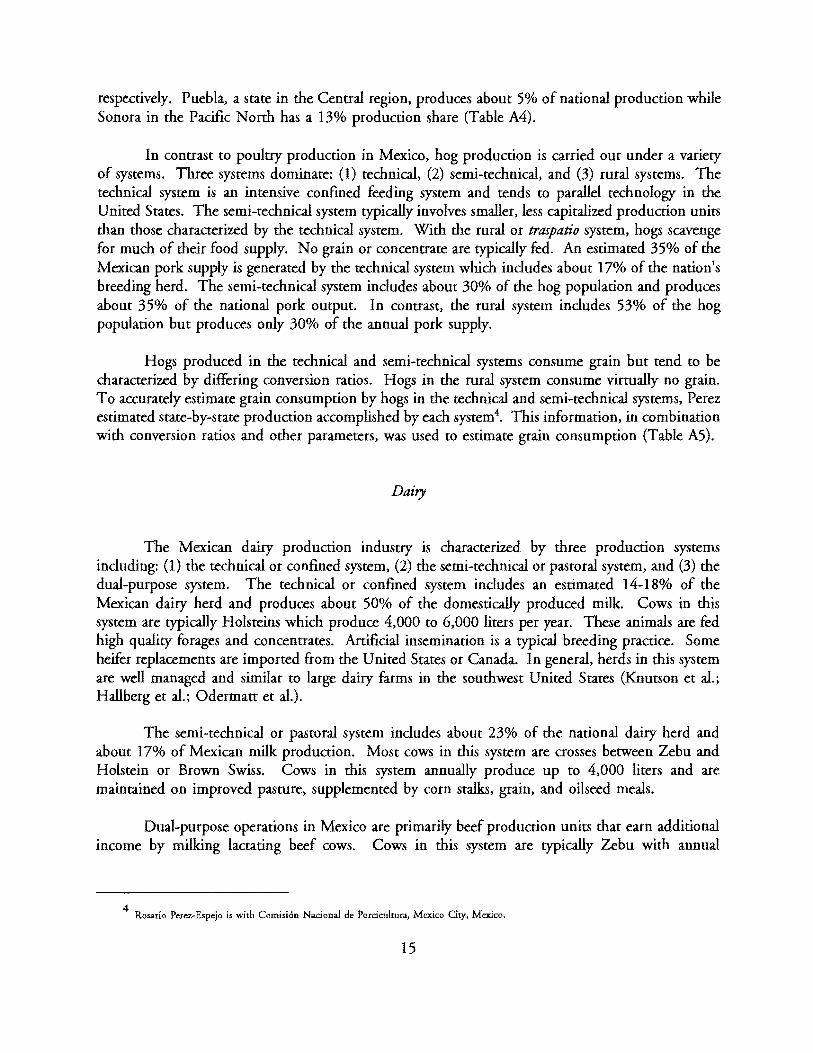
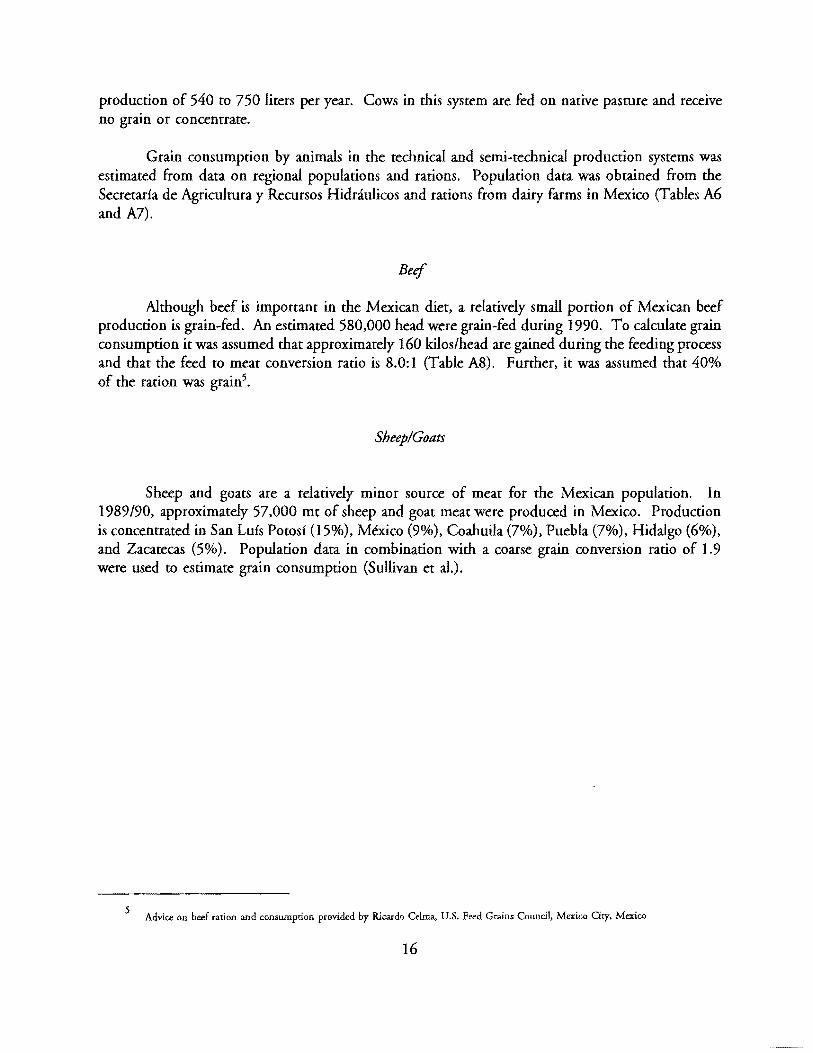
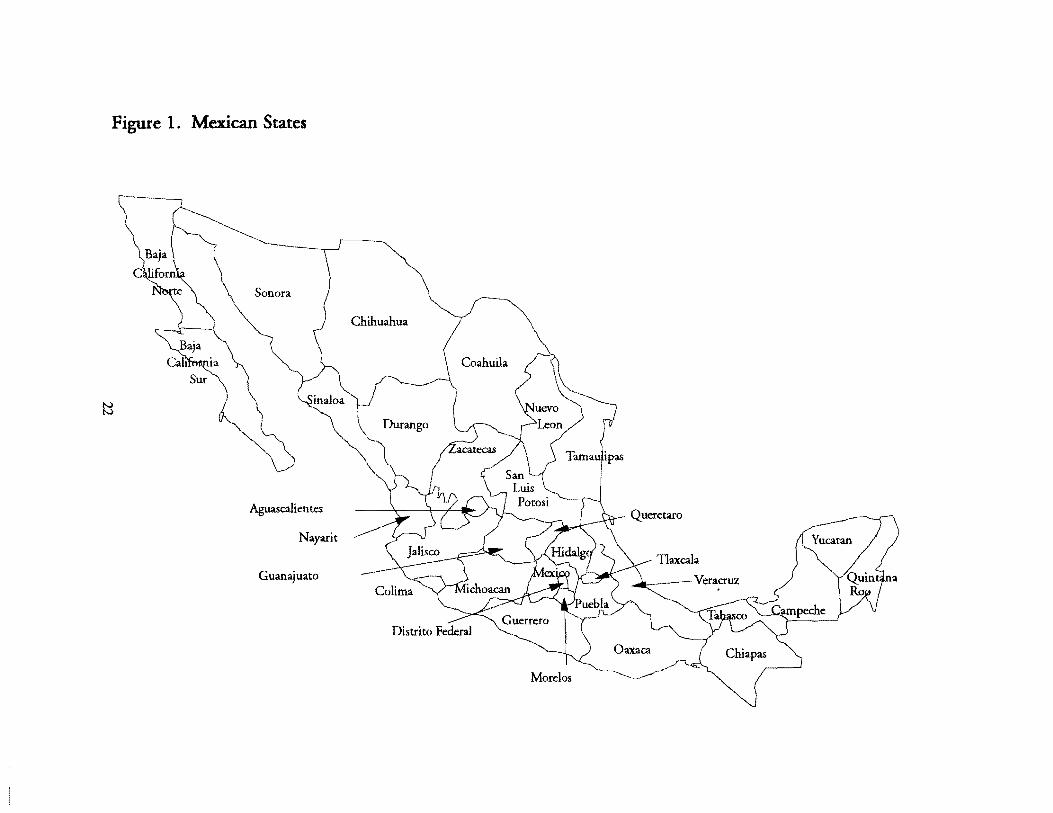
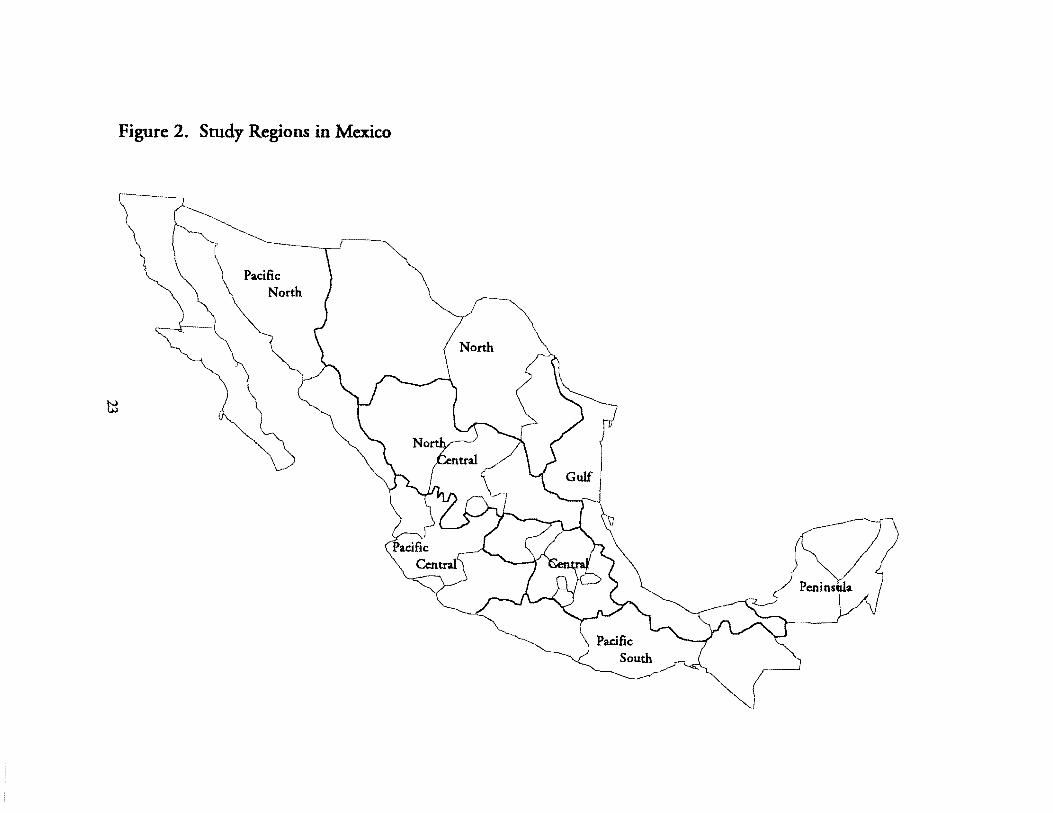
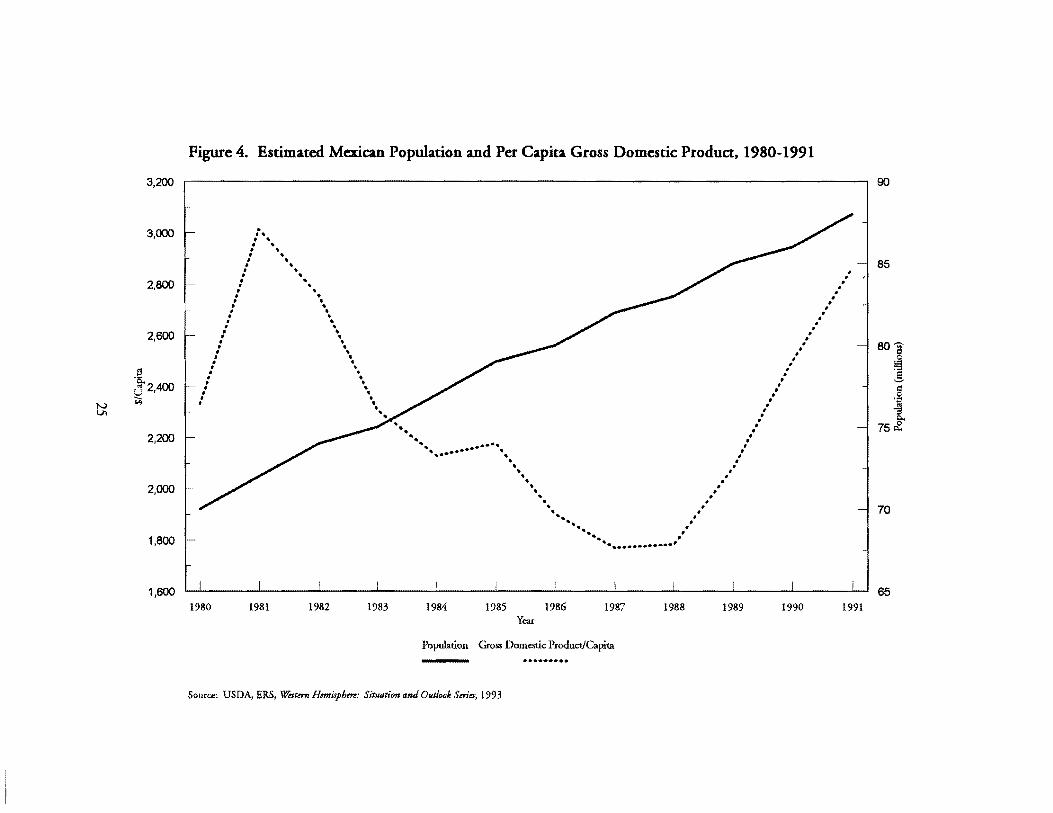
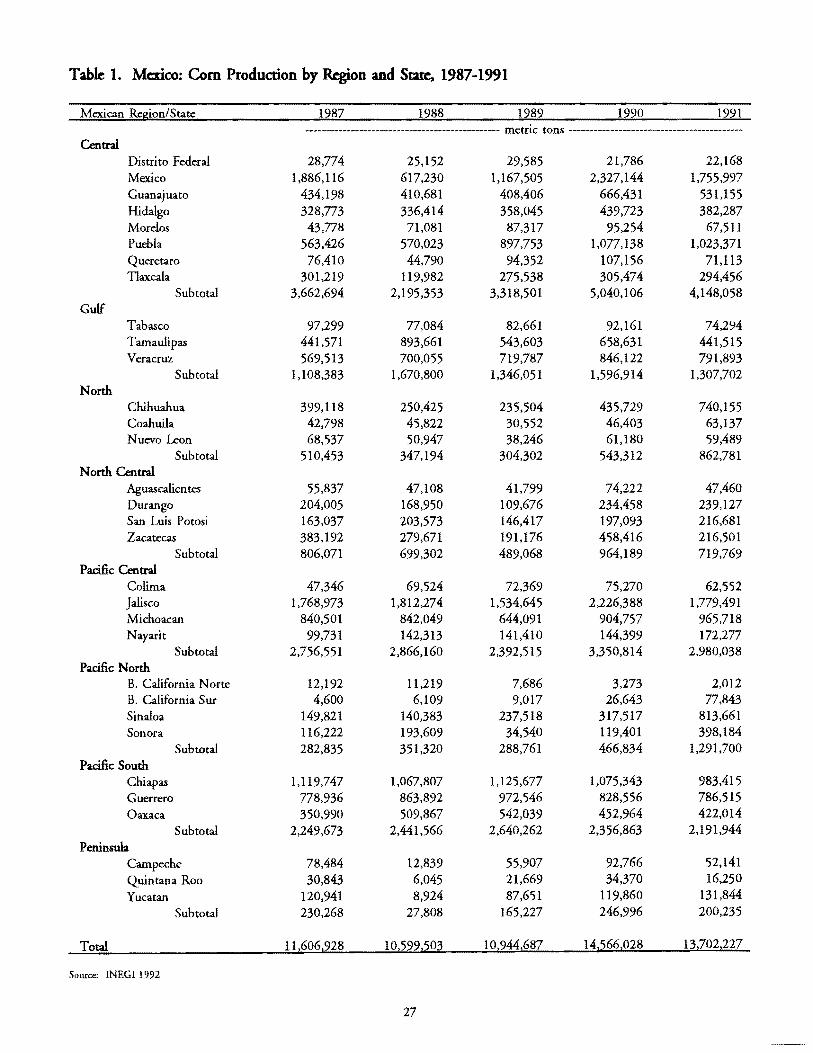
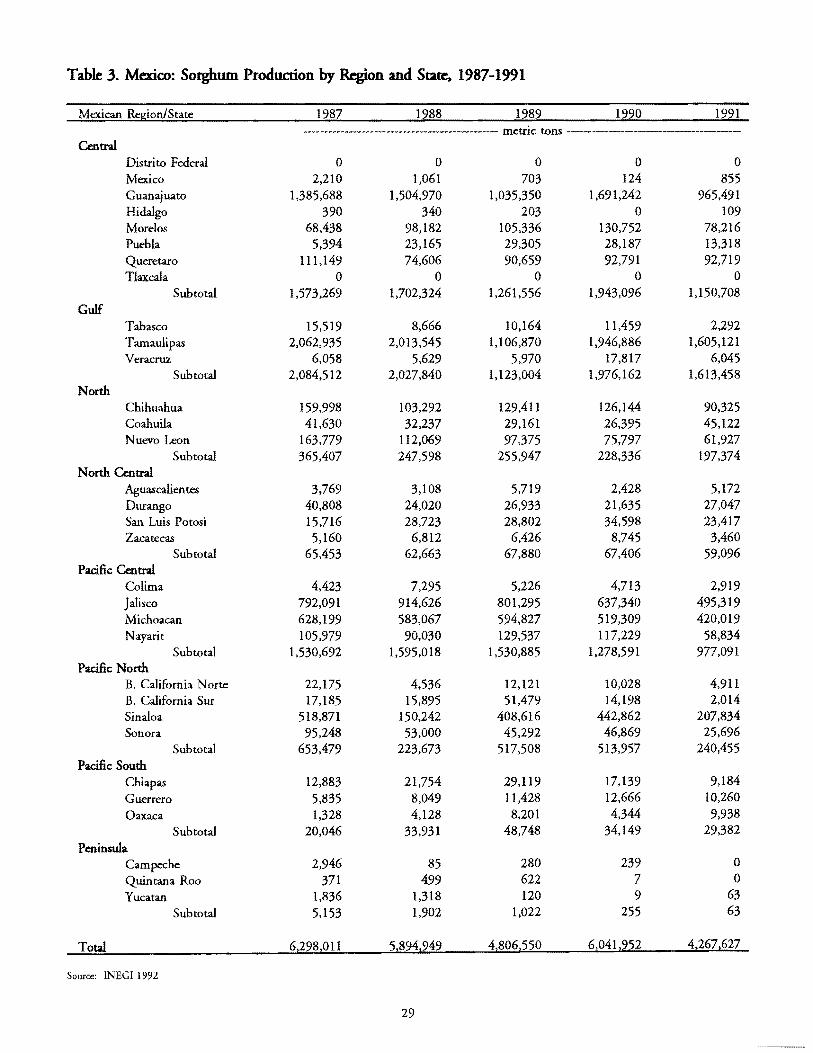
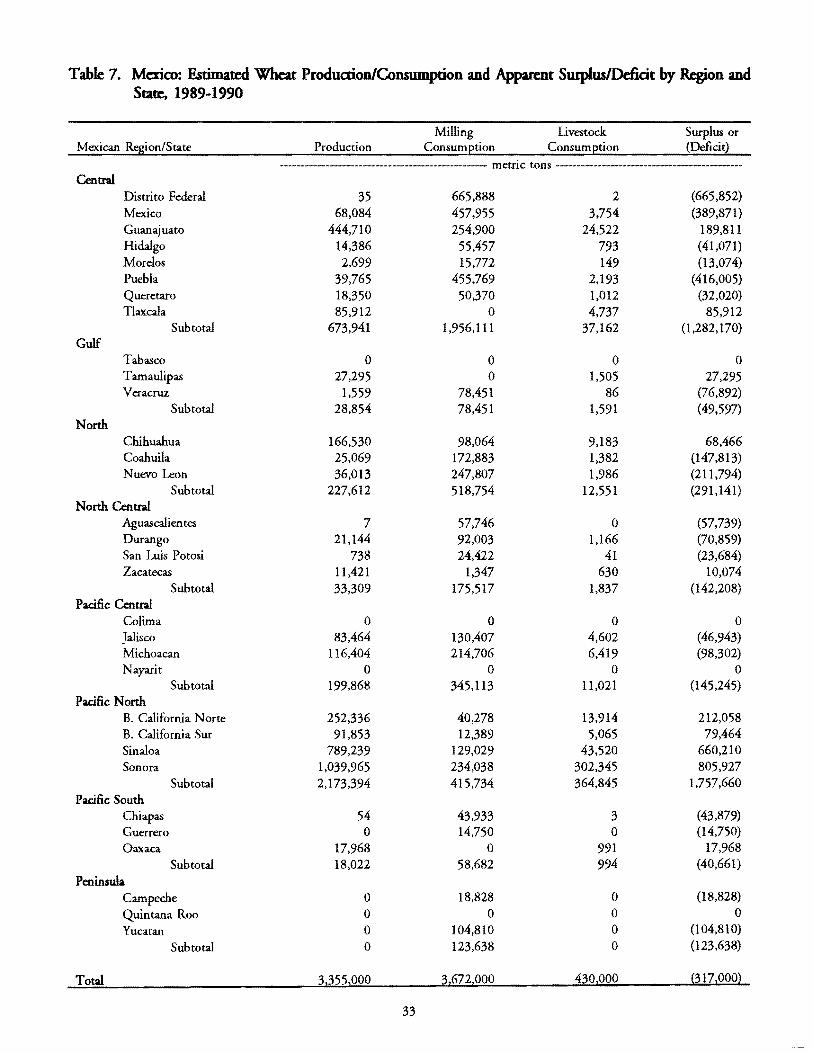
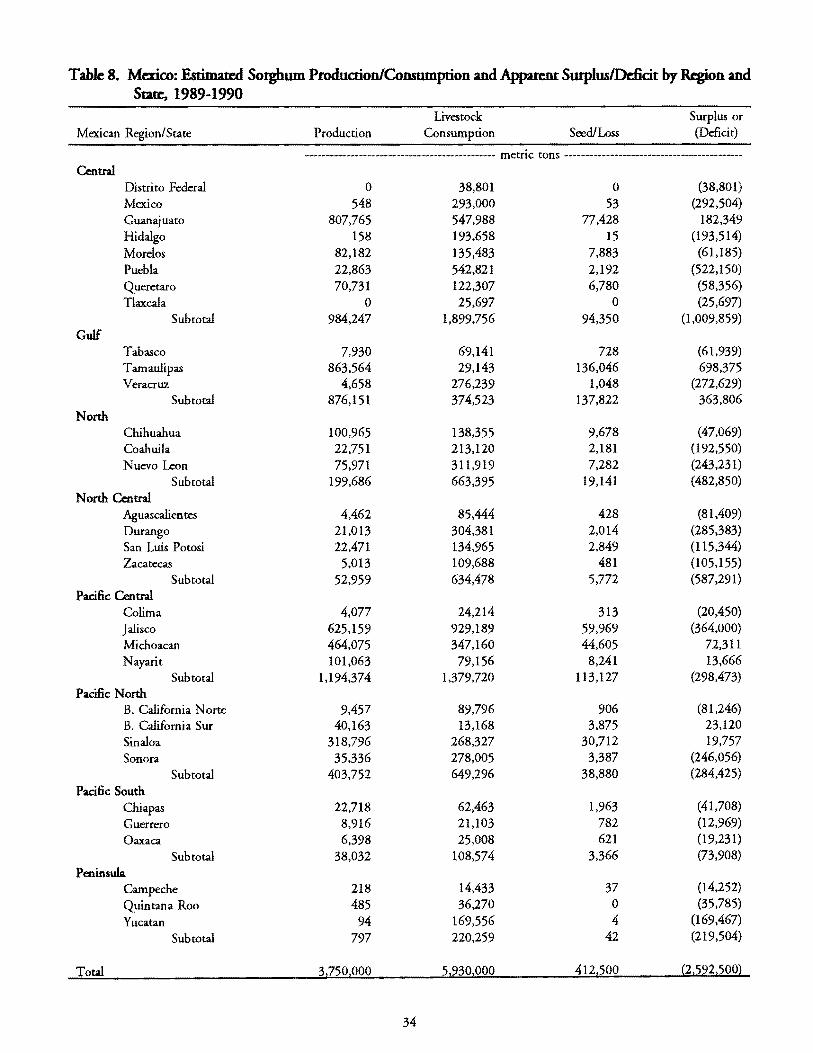
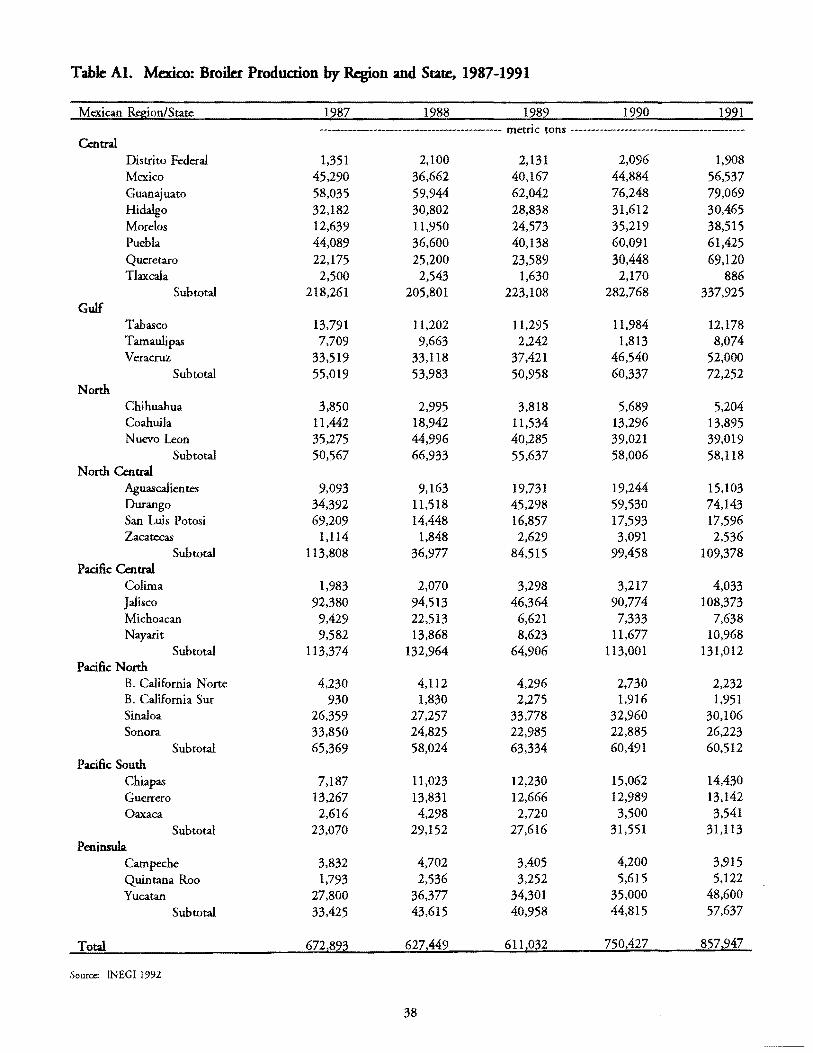
1221
Table AI Mexico Broiler Production by Rfgion and State 1987-1991
Mexican ReeionState 1987 1988 1989 1920 ---------------------------------------- metric tons ------------------------------------shy
Central Distrito Federal 1351 2100 2131 2096 1908 Mexico 45290 36662 40167 44884 56537 Guanajuato 58035 59944 62042 76248 79069 Hidalgo 32182 30802 28838 31612 30465 Morelos 12639 11950 24573 35219 38515 Puebla 44089 36600 40138 60091 61425 Queretaro 22175 25200 23589 30448 69120 Tlaxcala 2500 2543 1630 2170 886
Subtotal 218261 205801 223108 282768 337925 Gulf
Tabasco 13791 11202 11295 11984 12178 Tamaulipas 7709 9663 2242 1813 8074 Veracruz 33519 33118 37421 46540 52000
Subtotal 55019 53983 50958 60337 72252 North
Chihuahua 3850 2995 3818 5689 5204 Coahuila 11442 18942 11534 13296 13895 Nuevo Leon 35275 44996 40285 39021 39019
Subtotal 50567 66933 55637 58006 58118 North Central
Aguascalienres 9093 9163 19731 19244 15103 Durango 34392 11518 45298 59530 74143 San Luis Potosi 69209 14448 16857 17593 17596 Zacatecas 1114 1848 2629 3091 2536
Subtotal 113808 36977 84515 99458 109378 Pacific Central
Colima 1983 2070 3298 3217 4033 Jalisco 92380 94513 46364 90774 108373 Michoacan 9429 22513 6621 7333 7638 Nayarit 9582 13868 8623 11677 10968
Subtotal 113374 132964 64906 113001 131012 Pacific North
B California Norte 4230 4112 4296 2730 2232 B California Sur 930 1830 2275 1916 1951 Sinaloa 26359 27257 33778 32960 30106 Sonora 33850 24825 22985 22885 26223
Subtotal 65369 58024 63334 60491 60512 Pacific South
Chiapas 7187 11023 12230 15062 14430 Guerrero 13267 13831 12666 12989 13142 Oaxaca 2616 4298 2720 3500 3541
Subtotal 23070 29152 27616 31551 31113 Peninsula
Campeche 3832 4702 3405 4200 3915 Quintana Roo 1793 2536 3252 5615 5122 Yucatan 27800 36377 34301 35000 48600
Subtotal 33425 43615 40958 44815 57637
Total 672893 627449 611032 750427 8571947
Source INEGI 1992
38
Table Al ParameterS and Assumptions to Estimate Grain Consumption by Mexican Poulay Ind1lStlyl
Estimation of Grain Consumption by Broiler Production
(1) Carcass weight to live weight conversion ratio 067
(2) Concentrate to live weight conversion ratio 221
(3) 65 of concentrate is grain
(4) 3 death loss
Estimation of Grain Consumption by Broiler Mother Flock
(1) Hen lays 125 eggsyear
(2) Hen consumes 315 pounds of grain per day
Estimation of Grain Consumption by Layers2
(1) Concentrate to egg weight conversion ratio 231
(2) 65 of concentrate is grain
Estimation of Grain Consumption by Turkeys3
(1) Carcass weight to live weight conversion ratio 67
(2) Concentrate to live weight conversion ratio 301
(3) 65 of concentrate is grain
Advice provided by Cirpriano Bermajo-Osornio Union Nacional de Avicultores Mexico City Mexico Dr Philip Hargis Department of Poultry Science University of Arkansas and Dr PD Thornberry Department of Poultry Science Texas AampM University
Concentrate to egg weight conversion ratio includes poults grain consumption prior to laying Grain consumption by layers mother flock is small and calculated to be 07 of layer consumption
Conversion ratio reflects mother flock grain consumption and death loss
39
1221
Table A3 Mexico Egg Production by Region and State 1987-1991
Mexican ReeionState 1287 1988 1282 1920 ----------------------------------------- metric tons ---------------------------------------shy
Central Distrito Federal 4830 4616 2175 2184 2111 Mexico 24213 41499 24062 14616 27560 Guanajuato 37494 37088 39980 40237 42165 Hidalgo 10179 10135 6936 4228 6489 Morelos 21905 21078 49403 13238 14627 Puebla 171765 173846 174490 228372 273535 Queretaro 5974 11350 4100 5254 4194 TIaxeala 1147 1691 1185 586 4736
Subtotal 277507 301303 302331 308715 375417 Gulf
Tabasco 2166 2085 2121 2149 1842 Tamaulipas 13307 13118 5840 3255 1371 Veracruz 9160 13640 14081 10641 18317
Subtotal 24633 28843 22042 16045 21530 North
Chihuahua 2674 4452 3247 3789 5006 Coahuila 31937 39790 31243 33717 40473 Nuevo Leon 74442 81229 69400 62736 58598
Subtotal 109053 125471 103890 100242 104077 North Central
Aguascalientes 5050 5212 5498 4533 4675 Durango 41666 37290 46284 47791 57416 San Luis Potosi 1627 1676 1217 1188 1083 Zacatecas 1289 2347 2335 2123 2248
Subtotal 49632 46525 55334 55635 65422 Pacific Central
Colima 2061 2000 3294 2930 2300 Jalisco 191971 256123 210056 240419 258303 Michoacan 5998 18173 31469 34469 34839 Nayarit 16209 14046 11892 18429 17300
Subtotal 216239 290342 256711 296247 2742 Pacific North
B California Norte 13400 16184 14874 14201 18503 B California Sur 1797 4372 3831 3310 3374 Sinaloa 65471 64060 69614 51931 49811 Sonora 177120 167704 169884 112176 122578
Subtotal 257788 252320 258203 181618 194266 Pacific South
Chiapas 2951 8037 8329 8483 8015 Guerrero 7373 7579 8441 9129 9340 Oaxaca 3434 3800 4150 3900 4401
Subtotal 13758 19416 20920 21512 21756 Peninsula
Campeche 2514 3261 866 800 700 Quintana Roo 4905 4717 2900 1545 671
Yucatan 19000 17876 23822 27436 39800
Subtotal 26419 25854 27588 29781 41171
Total 9751029 110901074 110471012 I 1OO9l95 111361281
Source INEGI 1992
40
Table A4 Mexico Pork Produaion by Region and State 1987-1991
Mexican RegionState 1287 1988 1989 1290 1991 -------------------------------------- metric tons ---------------------------------------shy
Central Distrito Federal 5850 5402 4036 2552 2613 Mexico 90860 49974 36215 32424 25404 Guanajuato 87320 95083 85107 95376 99278
Hidalgo 20550 18802 15965 17047 13572 Morelos 5337 5315 1978 1346 1337 Puebla 29247 31421 37074 46644 61156
Queretaro 8090 11657 5229 4089 9612 Tlaxcala 7733 7680 10114 15423 11878
Subtotal 254987 225334 195718 214901 224850 Gulf
Tabasco 9603 11055 11389 10039 10665 Tamaulipas 8931 8780 3294 3534 5556 Veracruz 33807 32671 32131 34684 35766
Subtotal 52341 52506 46814 48257 51987 North
Chihuahua 9958 9608 11455 11686 15326 Coahuila 9070 6710 8618 6740 6802 Nuevo Leon 11389 14717 14410 13936 9890
Subtotal 30417 31035 34483 32362 32018 North Central
Aguascalientes 4788 3219 4089 4492 3718 Durango 11121 8216 8871 9016 6395 San Luis Potosi 9126 9137 5740 5836 6086 Zacatecas 14141 14092 12317 9024 10353
Subtotal 39176 34664 31017 28368 26552 Pacific Central
Colima 3477 3598 1718 1887 2200
Jalisco 149066 171208 138384 143290 155491 Michoacan 132404 111559 55664 58696 61624
Nayarit 5218 5711 3886 4346 5530 Subtotal 290165 292076 199652 208219 224845
Pacific North B California Norte 7985 6421 6580 6343 4969 B California Sur 322 862 850 1134 1061
Sinaloa 25215 25339 16597 22640 23235 Sonora 108099 110342 109729 110191 111033
Subtotal 141621 142964 133756 140308 140298
Pacific South Chiapas 35382 15436 13741 14783 32980
Guerrero 18938 19558 20142 20511 20802
Oaxaca 24250 25310 27512 23672 29363
Subtotal 78570 60304 61395 58966 83145
Peninsula Campeche 3898 4621 3574 3000 2800
Quintana Roo 6398 4559 4800 5700 5189
Yucatan 17000 13137 15461 17270 20215
Subtotal 27296 22317 23835 25970 28204
Total 914573 861200 726670 757351 811899
Source INEGI 1992
41
Table A5 Parameters and Assumptions to Estimate Grain Consumption by Mexican Hog IndllStJf
Estimation of Grain Consumption by Slaughtered Hogs
(1) Carcass weight to live weight conversion ratio 072
(2) Concentrate to live weight conversion factor for technical system 301
(3) Concentrate to live weight conversion factor for semi-technical system 41 1
(4) 75 of concentrate is grain
(5) 4 death loss
Estimation of Grain Consumption by Breeding Herd
(1) Average weight of slaughtered hog is 105 kilos
(2) Each sow produces 165 feeder pigs per year
(3) Sow to boar ratio 17
(4) Sows fed 5 lbslday of concentrate for 306 days per year and concentrate is 80 grain Sow fed 12 lbslday of concentrate for 59 days per year (lactation period) and concentrate is 64 grain
Advice provided by Rosario Perez-Espejo Comision Nacional de Porcicultura Merico City Merica Deparrment of Animal Science Texas AampM University and Dr T D Tanksley consultant to hog industry in Mexico
42
Table A6 Mexico Milk Cow Inventories by Production System RtWon and State 1990
Mexican ReeionState Semi-Specialized S~cialized Total
----------------------------------------- head ------------------------------------shyCentral
Distrito Federal 575 14589 15164 Mexico 30777 64796 95573 Guanajuato 72485 38955 111440 Hidalgo 0 40973 40973 Morelos 24737 1785 26522 Puebla 23874 44310 68184 Queretaro 2445 26462 28907 Tlaxcala 2157 14589 16746
Subtotal 157051 246458 403509 Gulf
Tabasco 77663 1707 79370 Tamaulipas 29627 3958 33585 Veracruz 305618 32592 338210
Subtotal 412907 38257 451164 North
Chihuahua 46166 47879 94045 Coahuila 18840 34377 53217 Nuevo Leon 4602 7682 12285
Subtotal 69609 89938 159547 North Central
Aguascalientes 2445 15986 18431 Durango 38975 33911 72886 San Luis Potosti 53070 24832 77902 Zacatecas 71191 21806 92997
Subtotal 165681 96534 262215 Pacific Central
Colima 4171 5277 9448 Jalisco 83128 149846 232974 Michoacan 1l2036 82023 194059 Nayarit 20566 2794 23360
Subtotal 219901 239939 459840 Pacific North
B California Norte 863 20254 21117 B California Sur 2157 1397 3554 Sinaloa 102400 3880 106280 Sonora 49186 9467 58654
Subtotal 154607 34998 189604 Pacific South
Chiapas 137636 3259 140895 Guerrero 39551 7139 46690 Oaxaca 60261 16063 76324
Subtotal 237447 26462 263908
Peninsula Campeche 10067 1785 11852 Quintana Roo 2013 78 2091 Yucatan 9061 1552 10613
Subtotal 21142 3414 24556
Total 1438344 776000 2214344
Source NEGI 1992
43
Table A7 Parameters and Assumptions to Estimate Grain Consumption by Morlan Dairy Ind~
Estimation of Grain Consumption by SpecializedSYstem
(1) 45 of population lactates at any point in time and this population consumes 56 lcilosday of grain
(2) Non-lactating population (55) consumes 054 lciloslday of grain
Estimation of Grain Consumption by Semi-Specialized System
(1) 45 of population lactates at any point in time and this population consumes 19 lcilosday of grain
(2) Non-lactating population (55) consumes 36 lcilosday of grain
Advice provided by Dr Bud Schwart Department of Agricultural Economics T ex AampM University Rations are based on those provided by operating dairies in Mexico
44
Table AB Mexico Grain-Fed Cattle Sheep and Goat Inventories by Region and Stare 1990
Mexican ReeionlState Cattle SheeeGoats ------------------------------ head --------------------------shy
Central Distrito Federal 215 234 Mexico 40715 5074 Guanajuato 4005 2207 Hidalgo 20296 3585 Morelos 4455 216 Puebla 6384 3908 Queretaro 18955 643 Tlaxcala 2891 1026
Subtotal 97916 16893 Gulf
Tabasco 1800 186 Tamaulipas 17490 839 Veracruz 11880 1994
Subtotal 31170 3020 North
Chihuahua 23412 2087 Coahuila 40727 3961 Nuevo Leon 87812 1779
Subtotal 151951 7827 North Central
Aguascalientes 2348 736 Durango 3969 1746 San Luis Potosi 1729 8562 Zacatecas 1199 2907
Subtotal 9245 13951 Pacific Central
Colima 4865 236 Jalisco 65697 1750 Michoacan 7000 2463 Nayarit 564 218
Subtotal 78126 4666 Pacific North
B California Norte 67537 378 B California Sur 1565 313 Sinaloa 39146 595 Sonora 49741 543
Subtotal 157989 1829 Pacific South
Chiapas 2108 1345 Guerrero 7031 2575 Oaxaca 1542 4217
Subtotal 10681 8138
Peninsula Campeche 0 40
Quintana Roo 0 58
Yucatan 2900 187
Subtotal 2900 285
Total 5781254 562607
Source INEGI 1992
45
48
DEP
APPENDIX A
BEA ECONOMIC REGIONS
[Fold out map]
91gt1
SISA1VNV )IWONOl3 ~O OV3HOa
1VNO~3H 31-U AS OllV3NmO
ONO~3 f3S ___________bull ___________________JJ----~__L_________________~
JnJJWWro 10 L3KJlyaQ saJYlS OlllAA
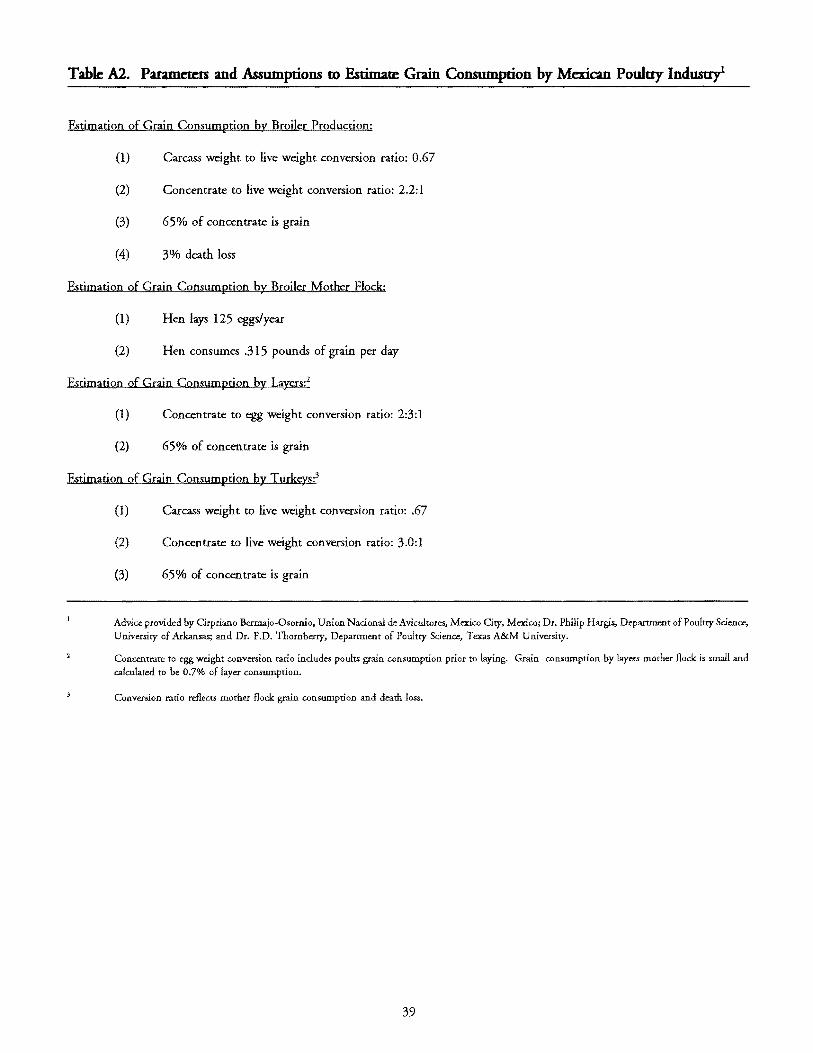
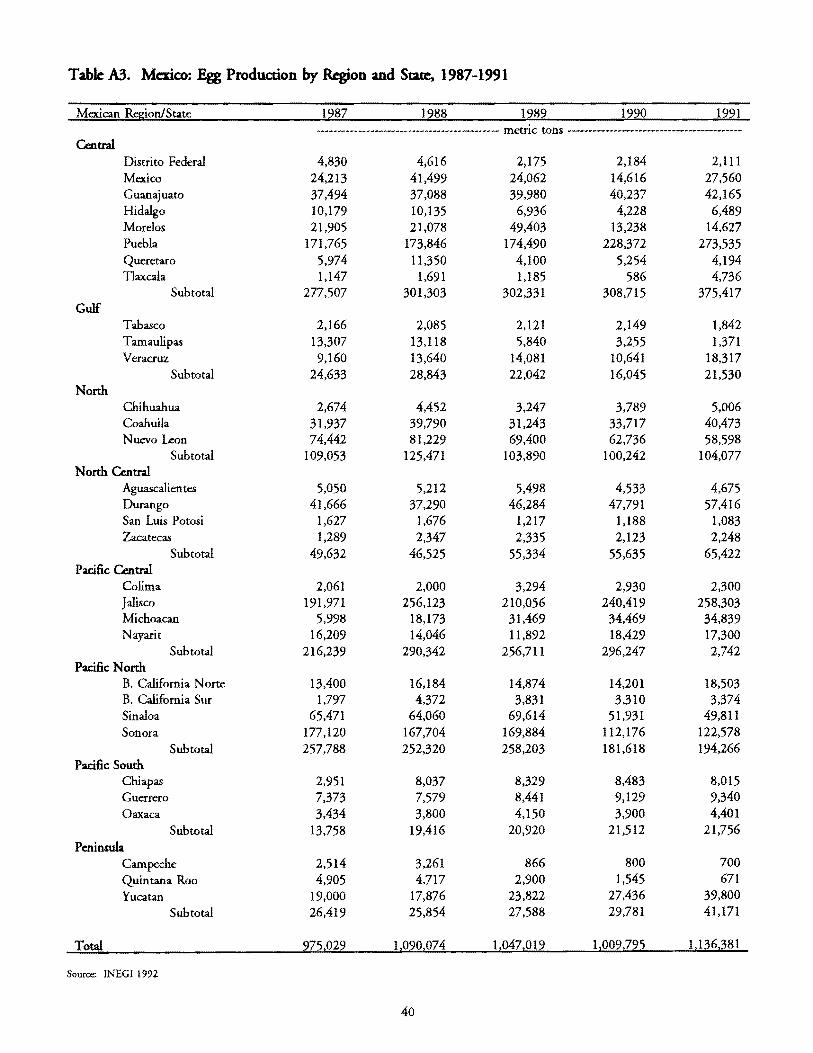
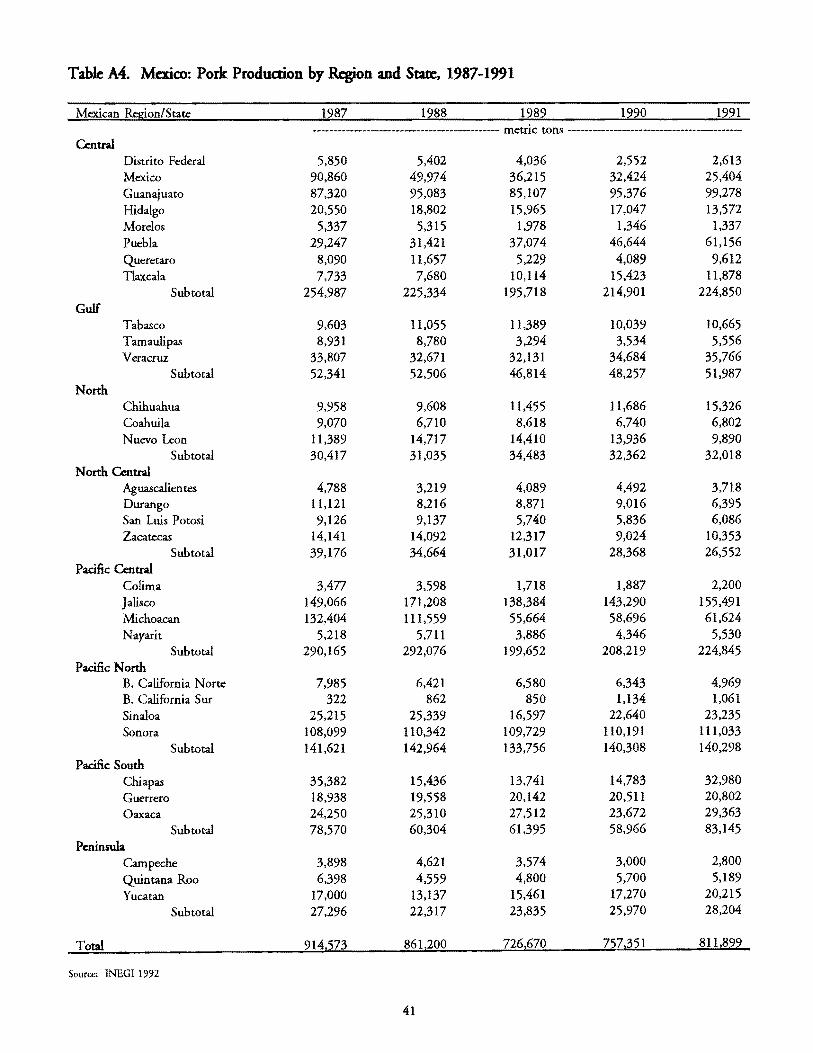
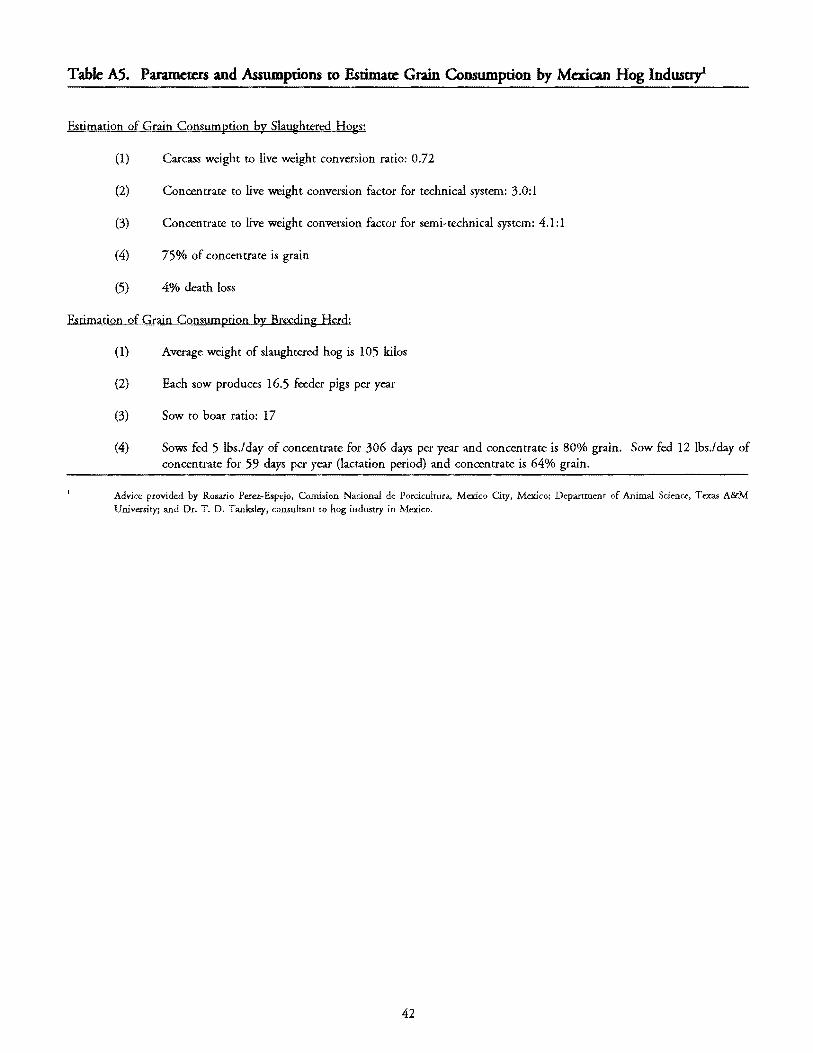
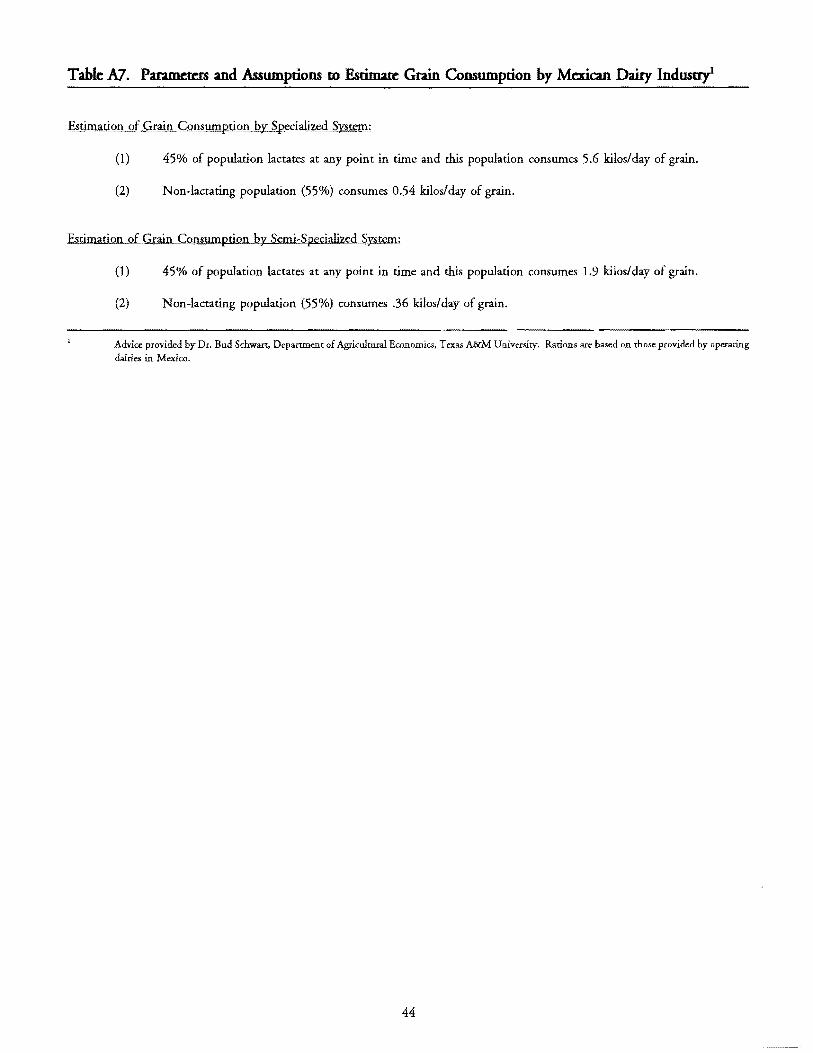

48
DEP
APPENDIX A
BEA ECONOMIC REGIONS
[Fold out map]
91gt1
SISA1VNV )IWONOl3 ~O OV3HOa
1VNO~3H 31-U AS OllV3NmO
ONO~3 f3S ___________bull ___________________JJ----~__L_________________~
JnJJWWro 10 L3KJlyaQ saJYlS OlllAA

91gt1
SISA1VNV )IWONOl3 ~O OV3HOa
1VNO~3H 31-U AS OllV3NmO
ONO~3 f3S ___________bull ___________________JJ----~__L_________________~
JnJJWWro 10 L3KJlyaQ saJYlS OlllAA