grain drying systems - university of wisconsin-extension
TRANSCRIPT

GEAPS FDC July 28-31, 2002
1
Grain Drying Systems
By
Dr. Dirk E. Maier, Ph.D., P.E. Professor and Extension Agricultural Engineer
Post-Harvest Education & Research Center Purdue University
And
Dr. Fred W. Bakker-Arkema, Ph.D.
Professor Emeritus Biosystems Engineering Department
Michigan State University Written for presentation at the 2002 Facility Design Conference of the Grain Elevator & Processing Society held July 28-31, 2002 in St. Charles, Illinois, U.S.A.

GEAPS FDC July 28-31, 2002
2
Table of Contents Table of Tables.................................................................................................................... 4 Table of Figures .................................................................................................................. 6 Table of Figures .................................................................................................................. 6 Introduction...................................................................................................................... 7 Introduction...................................................................................................................... 7 Basic Drying Concepts ................................................................................................. 8 Moisture Content ................................................................................................................. 8 Moisture Shrink ................................................................................................................... 8 Forced Airflow.................................................................................................................... 9 Fans ..................................................................................................................................... 9 Fan Power ........................................................................................................................... 9 Heat Energy....................................................................................................................... 10 Burner Capacity ................................................................................................................ 10 Fuel Consumption............................................................................................................. 10 Drying Capacity................................................................................................................ 10 Energy Efficiency ............................................................................................................. 11 Grain Quality..................................................................................................................... 12 Grain Kernel Temperature ................................................................................................ 12 Stress Cracks and Breakage Susceptibility....................................................................... 12 Drying System Considerations ................................................................................. 14 Dryer Selection Criteria .................................................................................................... 14 Dryer Sizing and Capacity................................................................................................ 14 Site Selection..................................................................................................................... 15 Dryer Types....................................................................................................................... 16 Dryer Comparison............................................................................................................. 16 Conventional Crossflow Dryers........................................................................................ 17
Air-Grain Temperature and Moisture Content Distribution..................................... 17 Temperature, Moisture and Quality Gradients ......................................................... 18
Modified Crossflow Dryers .............................................................................................. 19 Reverse-Airflow (Suction) Cooling .......................................................................... 19 Reverse Airflow (Suction) Drying............................................................................ 20 Grain Column Inverting ............................................................................................ 20 Slotted Plenum Panels............................................................................................... 20 Differential Crossflow Drying .................................................................................. 21 Perforated Screen Wearability .................................................................................. 21
Mixed-Flow Dryers........................................................................................................... 21 Concurrent-Flow Dryers ................................................................................................... 22 Energy Conservation and Recovery.................................................................................. 23 Tempering Between Stages............................................................................................... 23 Segregating Initial Moistures............................................................................................ 24 Preheating in the Wet Holding Bin ................................................................................... 24 High-Capacity Drying and Slow Cooling......................................................................... 24
In-bin Cooling ........................................................................................................... 25 Dryeration ................................................................................................................. 25

GEAPS FDC July 28-31, 2002
3
Combination High-and-Low Temperature (2-Stage) Drying ................................... 25 Continuous-flow Slow Cooling ................................................................................ 26 Limitations of Slow Cooling Methods...................................................................... 26
Automatic Dryer Control .................................................................................................. 26 Economic Considerations........................................................................................... 27 Regulatory Considerations......................................................................................... 28 Future Dryer Development Issues ........................................................................... 28 Segregated Grain Handling and Drying............................................................................ 28 Smart Processing Systems ................................................................................................ 29 Alternative Fuel Sources ................................................................................................... 29 Stochastic Dryer Models ................................................................................................... 29 Crossflow Dryer Development Needs .............................................................................. 30 Mixed-Flow Dryer Development Needs........................................................................... 30 Concurrent Flow Dryer Development Needs ................................................................... 30 References ...................................................................................................................... 30

GEAPS FDC July 28-31, 2002
4
Table of Tables Table 1. Maximum recommended moisture contents for aerated grain storage in various
regions of the United States. ..................................................................................... 32 Table 2. Available energy and heat conversion efficiency for fuels commonly used for
grain drying. .............................................................................................................. 32 Table 3. Natural gas consumption (Therms/h) per one bushel of wet corn into a high-
capacity dryer for various energy efficiencies and moisture content ranges. ........... 32 Table 4. Maximum grain kernel temperature limits. ........................................................ 33 Table 5. Breakage susceptibility of different corn hybrids after hand shelling and drying
at 75ºF (24ºC)............................................................................................................ 34 Table 6. Effect of moisture reduction during drying at 160ºF (71ºC) on the stress crack
development of corn. ................................................................................................. 34 Table 7. Effect of drying method, drying air temperature, hybrid and initial moisture
content (MCin) on percent kernels with stress cracks. .............................................. 34 Table 8. Drying capacity (bushels/hour) per bushel of grain in the drying section of a
commercial crossflow tower dryer as a function of airflow rate and drying air temperature................................................................................................................ 35
Table 9. List of criteria for selecting a high-capacity grain dryer..................................... 36 Table 10. The average effect of dryer type on the drying-air temperature, the maximum
grain temperature, and the percentage of stress-cracked kernels in maize. .............. 36 Table 11. Typical specifications of a conventional crossflow corn dryer employed in
drying corn from 25% to 15% (w.b.). ....................................................................... 37 Table 12. Long-term change in the average moisture content (MC), moisture content
range, percentage point differential, and standard deviation (SD) in individual corn kernels after high temperature drying and subsequent storage in a 60,000 bushel (1500 tonne) bin under Michigan conditions (Initial storage date: November 30, 1993). ........................................................................................................................ 37
Table 13. Average moisture content (MC), moisture content range, percentage point differential, and standard deviation (SD) in maize kernels collected at the inlet and outlet of commercial crossflow (CF), concurrent- flow (CCF), and mixed-flow (MF) dryers......................................................................................................................... 38
Table 14. Average percent stress-cracked kernels by type, and total percent stress-cracked kernels of maize dried in commercial concurrent- flow (CCF), mixed-flow (MF) and crossflow (CF) dryers................................................................................................ 38
Table 15. Moisture content gradient in grain columns of a conventional crossflow dryer after drying corn from 25.5% to 16.0% (w.b.) before and after fast cooling. .......... 39
Table 16. Grain temperature, moisture content, and breakage susceptibility at different locations in grain columns of a conventional crossflow dryer after drying corn without cooling from 25.5% to an average of 19% (w.b.) at 230ºF (110ºC). ........... 39
Table 17. Effect of the average final moisture content on breakage susceptibility of 25% moisture content (w.b.) corn dried in a conventional crossflow dryer at 230ºF (110ºC). ..................................................................................................................... 39
Table 18. Specifications of a modified crossflow dryer with reverse airflow (suction) cooling....................................................................................................................... 40

GEAPS FDC July 28-31, 2002
5
Table 19. Operating conditions of a conventional versus modified crossflow dryer drying corn from 25% to 15% (w.b.) at the same grainflow rate and a maximum corn kernel temperature of 140ºF (60ºC). .................................................................................... 40
Table 20. Specifications of a mixed-flow dryer for the drying of maize from 30.0% to 15.0% (w.b.).............................................................................................................. 41
Table 21. Specifications of a commercial 3-stage concurrent-flow dryer for the drying of maize from 25.5% to 15.5% (w.b.). .......................................................................... 42
Table 22. Average kernel moisture content and moisture content range of 50 kernels on an ear of an early and late variety maize in the Midwestern U. S. ........................... 42

GEAPS FDC July 28-31, 2002
6
Table of Figures Figure 1. Schematics of the four major types of high-temperature grain dryers:
crossflow, counterflow, concurrent- flow, and mixed-flow. ..................................... 43 Figure 2. Moisture and temperature changes during: (a) crossflow drying; (b)
concurrent- flow drying; (c) counterflow drying; and (d) mixed-flow drying. ......... 44 Figure 3. Conventional crossflow dryer with forced-air drying and cooling. ................. 45 Figure 4. Modified crossflow dryer with reverse-airflow (suction) cooling. ................. 46 Figure 5. Commercial modified crossflow dryer with grain exchanger and reverse-
airflow cooling. ......................................................................................................... 47 Figure 6. Modified crossflow dryer with multiple grain exchangers............................... 48 Figure 7. Schematic of a mixed-flow grain dryer. ........................................................... 49 Figure 8. A mixed-flow grain dryer. (Source: Cimbria Unigrain, Ltd., Denmark)......... 50 Figure 9. Two-stage concurrent-flow dryer with counterflow cooler, tempering section,
and air recirculation of the cooling air and part of the drying air. ............................ 51 Figure 10. Combination drying system utilizing medium temperature drying and (a) in-
bin cooling, (b) dryeration, and (c) two-stage in-bin natural air/low temperature drying. ....................................................................................................................... 52
Figure 11. Moisture distribution before and after drying of corn in a crossflow dryer; average inlet MC=30.3% (d.b.), average outlet MC=17.2% (d.b.). (Source: Bakker-Arkema and Maier, 1995). ........................................................................................ 53

GEAPS FDC July 28-31, 2002
7
Introduction Drying of grains (coarse grains – corn, sorghum; cereal grains – wheat, durum, oats, barley, rice; small grains – canola, flax, mustard), pulses (lentils, peas, edible beans) and oilseeds (soybeans, sunflower) can be divided into four broad categories: (1) low temperature drying, which uses unheated air, or air heated by up to 15ºF (8ºC), (2) medium temperature drying with heated air that keeps grain kernel temperatures below 110ºF (43ºC) for seed grains, and below 140ºF (60ºC) for grains to be milled and processed, (3) high temperature drying with heated air that keeps kernel temperatures below 180ºF (82ºC) for animal feed, and (4) combination drying, which uses both low and higher temperature air to reduce the grain moisture content to a safe storage level. Low temperature and combination drying systems are generally only used on-farm, while medium and high temperature drying systems are used both on- and off- farm. Dryers located at commercial elevators are almost exclusively high-capacity, continuous-flow systems with a throughput of at least 500 bushels of wet grain per hour (12.5 wet MT/h). This excludes all but the largest in-bin grain drying systems. A high-capacity dryer requires high drying-air temperatures. The optimum temperature depends on the dryer type, the grain species and the grain quality requirements, and ranges from 100ºF (40ºC) for rough rice in cross flow dryers to 530ºF (275ºC) for feed corna in concurrent- flow dryers. High-capacity drying equipment requires major initial capital investment, and incurs significant operating costs because of the large amounts of energy needed to operate these systems. The energy required to evaporate a unit mass of moisture in a high-capacity grain dryer (i.e., the specific energy efficiency) ranges from 1500 BTU to 3000 BTU per pound of water (3.5 MJ to 7.0 MJ per kg of water), depending on the dryer design and the ambient conditions. The rate of moisture loss of grain in a high-capacity dryer is strongly dependent on the grain temperature [note: not on the temperature of the drying air]. In some dryer types (e.g. cross flow and mixed-flow dryers), the grain approaches the inlet-air temperature; in other dryers (e.g. concurrent- flow dryers), the difference between the maximum temperature of the air and grain is large. This explains why the maximum air temperature for drying wheat in crossflow dryers is about 120ºF (50ºC), but is 350-390ºF (175-200ºC) in concur rent- flow dryers. The drying air in addition to heating up the grain, carries the water in the form of vapor away from the grain being dried. Since more water vapor is produced at higher grain temperatures, it is clear that high- temperature dryers require higher airflow rates than low-temperature dryers. The common airflow rate in high- temperature grain dryers is in the range of 50-150 ft3 per minute (cfm) per bushelb of grain (50-150 m3 per minute per tonne of grain). A significant parameter in grain-dryer evaluation is the residence time of the grain in the dryer. Comparing two dryers of similar type and of equal throughput, an evaluation of the residence-time of the dryers will reveal the rate of moisture loss by the individual kernels. a The U.S. term for maize is corn and will be used throughout this text. b For the conversion of bushels to metric tonnes, the approximation of 1 metric tonne of corn equal to 40 bushels of corn is used throughout this text.

GEAPS FDC July 28-31, 2002
8
A short residence time requires a high drying rate, and can lead to excessive thermal and moisture stresses in the kernels, and thus to stress cracking. A longer residence time indicates a slower and more gentle drying process that can preserve end use grain quality more effectively. Basic Drying Concepts Moisture Content Drying reduces the amount of water contained in the crop after harvest to an acceptable level for marketing, storage, or processing. Lowering the moisture content is necessary to prevent grain spoilage, which is primarily caused by molds and insect infestation. Both grain temperature and moisture content are critical in maintaining quality. Mold and insect activity is greatly reduced below 60ºF (15ºC). Safe moisture levels for storage depend on grain variety, length of storage, storage structure, and geographical location. Table 1 summarizes typical recommendations for grains and oilseeds stored in aerated structures in various regions of the United States. The amount of water, or moisture, in a grain kernel is expressed as a percentage value. Moisture content on the wet basis expresses the amount of water in the grain as a percent of the total grain weight. The difference between the wet and total weight is the amount of dry weight, or dry matter of the grain. Wet-basis moisture content is usually measured in the commercial grain industry with a calibrated moisture meter. However, it can also be calculated if the wet and dry weights are known:
Mw = 100 x (wet weight – dry weight) / (wet weight) Where, Mw is the wet basis moisture content in percent. The limitation of using wet-basis moisture content is that during drying the wet weight changes. Thus, the wet basis moisture content values cannot be directly added or subtracted to find the weight change, or moisture shrink, due to drying. For example, 10,000 bushels (250 MT) of shelled corn dried from 25% to 15% moisture do NOT experience a moisture shrink of 10% of the initial weight, or 1,000 bushels (25 MT)! Moisture Shrink During the drying process both the wet and total weights of grain change. This is expressed as the water, or moisture shrink loss. Moisture shrink is the amount of water lost as the grain dries to a standard moisture content – typically 15% for corn and 14% for wheat. Moisture shrink is calculated as:
Moisture Shrink = 100 x (Mo – Mf) / (100 – Mf) Where, moisture shrink is a percentage value, Mo is the original and Mf the final moisture content in percent. For example, 10,000 bushels (250 MT) of shelled corn dried from 25% to 15% moisture would experience a moisture shrink of (100 x (25% - 15%) / (100 – 15%)) = 11.76%, or 1,176 bushel (29 MT). It is important to note that the above shrink calculation only refers to water loss during drying. The commercial grain trade uses a number of different shrinkage techniques (shrink factors, Minary chart, pencil shrink),

GEAPS FDC July 28-31, 2002
9
which include not only weight loss due to water removal but also handling and other losses. Typical shrink values range from 0.5-1.4%. Forced Airflow Airflow is created with fans that force air to move through the grain mass, absorb moisture from the grain, and carry that moisture away from the grain mass. Airflow rates for drying and cooling typically range from 75 – 125 ft3 of air per minute per bushel (cfm/buc) of grain being dried or cooled (75 – 125 m3/min/t), or 50 – 100 cfm per ft2 of perforated screen area (0.25-0.51 m3/s m2). These airflow rates create relatively low static pressures of 1 – 5 inches water column (0.249-1.25 kPa) in crossflow and mixed-flow dryers. [Static pressure is the resistive force the fans work against while trying to push the air through the grain columns.] Fans Airflow has to be provided by a fan with sufficient capacity. Fans are classified as axial-flow (air is moved by rotating blades parallel to the shaft) and centrifugal (air enters the fan parallel to the shaft, is moved radially through the blades, and discharged tangentially from the scroll housing). Proper selection of fan size is critical to assure efficient operation, which lies in the 55 to 75% range for axial- flow and in the 50 to 65% range for centrifugal fans. Both fan types are non-overloading. At the same power requirement, axial- flow fans yield higher airflows at up to 4 inches of static pressures (0.996 kPa), while centrifugal fans are preferred above 6 inches (1.49 kPa). Centrifugal fans are quieter because they generally operate at 1,750 rpm at 60 HZ (1460 rpm at 50 Hz) compared to 3,500 rpm at 60 Hz (2915 rpm at 50 HZ) for axial- flow fans. [The reader is referred to (Brooker, 1992) and (Brook, 1992) for more detailed discussions on properly selecting and sizing fans.] Fan Power The power requirement from a fan for supplying a given level of airflow can be calculated as:
Fan Power = (AV x SP) / (63.56 x Eff) Where, fan power is in HP, AV is the total airflow rate in ft3/min (cfm), SP is the static pressure caused by the airflow in the grain column in inches of water column, Eff is the fan power efficiency in percent and depends on the fan manufacturer and type. A good estimate is 47 percent. For example, a 3,000 bu/h (75 MT/h) crossflow dryer with a holding capacity of 4,000 bu (100 MT), an airflow rate of 75 cfm/bu (75 m3/min/t) and a static pressure drop through a 12- inch (305 mm) column of 1.5 inches (0.374 kPa), would have a total airflow rate of (4,000 bu/h x 75 cfm/bu) = 300,000 cfm (142 m3/s). Thus, this dryer would require a fan power of about (300,000 cfm x 1.5 in.) / (63.56 x 47%) = 150 Hp (112 kW).
c For the conversion of cfm/bu to m3/min/tonne, the approximation of 1 cfm/bu equal 1 m3/min/tonne is used throughout this text.

GEAPS FDC July 28-31, 2002
10
Heat Energy Heat is added to the drying air across a burner to raise the temperature of the air and the grain. Increasing the air temperature increases the amount of water that can be absorbed by the air and carried away from the grain. Increasing the temperature of the grain increases the rate of moisture removal from the grain. Energy for heating the air has to be provided by a burner with sufficient capacity. Burner Capacity The amount of energy needed from a burner to raise the air temperature to a certain level can be calculated as:
Burner Capacity = 1.1 x AV x (Tf – To) Where, energy for the burner capacity is measured in Btu/h, AV is the total airflow rate in cfm, Tf is the final air temperature after the burner (ºF), and To is the initial air temperature before the burner (ºF). [One Btu raises the temperature of 1 lb of water by 1ºF.] For example, heating air from 40ºF to 220ºF (from 4ºC to 104ºC) for a crossflow dryer with a total airflow rate of 300,000 cfm (141.58 m3/s) would require a burner with a capacity of about (1.1 x 300,000 cfm x (220ºF – 40ºF)) = 59,400,000 Btu/h, or 59.4 million Btu/h (62,615 MJ/h). Fuel Consumption The amount of heat that can be obtained from a given burner depends on the type of fuel and the efficiency of the combustion process, which converts the fuel to heat. Table 2 summarizes the energy contents of a range of popular fuels used for grain drying and the approximate efficiencies for the heat conversion process. The fuel consumption for a dryer can be calculated as:
Fuel Consumption = (100 x Burner Capacity) / (AE x Eff) Where, fuel consumption is the amount of fuel consumed per hour, AE is the available energy for the particular fuel and is listed in column 2 of Table 2, and Eff is the combustion efficiency and is listed in column 3 of Table 2. For example, the above crossflow dryer with a burner capacity of 59.4 million Btu/h (62,615 MJ/h) and natural gas as the fuel would consume approximately (100 x 59,400,000 Btu/h) / (100,000 Btu/Therm x 95%) = 625 Therms of natural gas per hour of operation, or 62,500 ft3 (1769.8 m3) of gas per hour (given that 1 Therm equals 100 ft3). Drying Capacity Drying capacity, or grain flow, is usually expressed in bushels per hour dried over a specific moisture range, usually 5 or 10 points of moisture removal. Generally, for shelled corn, 5 points removal refers to drying from 20% to 15% moisture, and 10 points removal to drying from 25% to 15% moisture. The grain flow, or velocity of the grain, through the dryer is controlled by the speed of the unloading or discharge augers. Grain flow determines the retention time of the grain in the heating and cooling sections.
GEAPS FDC July 28-31, 2002
11
The speed of the unloading augers is controlled automatically. Conventional automatic controllers use one or multiple probes placed inside the grain columns to sense temperature. This temperature is converted to an approximate grain moisture content. If the measured temperature is low, the moisture content is assumed too high and the metering rolls are slowed down; if the temperature is high, the grain is assumed to be overdried and the metering rolls are sped up. Modern dryer controllers are microprocessor-based and sense the actual moisture content of the grain entering and leaving the dryer. Drying capacity for a particular dryer depends on the initia l grain moisture content, the drying air temperature, the drying and cooling airflow rates, the outside weather conditions, and the size and maintenance condition of the dryer. Specifying an adequate drying capacity is important for selecting the right dryer size. Dryer capacities are quoted for ideal drying conditions, which rarely occur at the elevator. Thus, experience has shown that realistic capacities are only 70 – 80% of the advertised values. Dryer capacity can be determined during field-testing using an internationally recognized standard developed by the International Standards Organization (ISO) (ISO 11520-1:1997 Agricultural grain driers – Determination of drying performance – Part 1: General; and ISO 11520-2:2001 Agricultural grain driers – Determination of drying performance – Part 2: Additional procedures and crop-specific requirements). Energy Efficiency Energy efficiency, or specific energy consumption, or drying efficiency, is generally expressed as the amount of energy required per pound of water evaporated from the grain during the drying process. It depends on the design of the dryer, the amount of moisture removed, and the weather conditions during drying. This measure of efficiency can be calculated given the initial and final grain moisture contents, the amount of grain dried, and the amount of fuel energy consumed:
Energy Eff = (100 x Fuel Consumption x AE) / (Moisture Shrink x WBD x 56 lb/bu) Where, WBD is wet bushels dried. For example, the above crossflow dryer consumes 62,500 ft3 (1769.8 m3) of gas per hour, and drying 3,000 bu/h (75 MT/h) from 25% to 15% moisture yields 11.76% moisture shrink. Thus, the energy efficiency of this dryer is (100 x 62,500 ft3/h x 1,000 Btu/ft3) / (11.76% x 3,000 bu/h x 56 lb/bu) = 3,163 Btu/lb (7.35 MJ/kg) of water evaporated. The specific energy consumption of crossflow dryers typically ranges from 1,500 to 4,500 Btu per lb of water removed (from 3.48 to 10.45 MJ/kg). In comparison, the evaporation of pure water boiling on a stove top requires between 900 – 1,100 Btu/lb of water (2.09-2.55 MJ/kg), while the evaporation of water from a single kernel of grain under ideal conditions would require about 1,100 – 1,300 Btu/lb of water evaporated (2.55-3.02 MJ/kg). Thus, minimizing drying costs involves maximizing drying efficiency. Table 3 summarizes the natural gas consumption per bushel of wet corn dried for a range of energy efficiencies, and two moisture reduction ranges. For example, drying 3,000 bu (75 MT) from 25% to 15% moisture in a dryer with an energy efficiency of 2,000 Btu/lb (4.64 MJ/kg) of water removed requires (3,000 bu x 0.132 Therms/h/bu) = 400 Therms/h (42,165 MJ/h).

GEAPS FDC July 28-31, 2002
12
Grain Quality Grain quality is a nebulous term that means different things to different people. Grain quality largely depends on the grain type and its end use. It includes a range of properties that can be defined in terms of physical (moisture content, test weight, heat-damage, stress cracking and fissuring, breakage susceptibility, kernel discoloration), sanitary (mold and mycotoxin count, insect damage, rodent excrements, foreign material, pesticide residue), and intrinsic (milling yield, baking quality, oil recovery, protein content, feed value, viability) quality characteristics. The quality properties of a grain are affected by the seed genetics, agronomic practices, environment during the growing period, harvest timing and equipment, post-harvest handling and drying treatment, storage structures and management practices, and transportation system and procedures. Only a few of these quality factors are actually part of official standards used for grading grains and oilseeds. The majority of these properties are specified separately in sales contracts, which are specific for end use purposes. Thus, it is important to understand how these quality characteristics are affected, especially by the drying process. Grain Kernel Temperature The operator of a dryer must be aware of the difference between the drying air temperature, which is set at the burner, and the temperature individual grain kernels may reach as they flow through the columns of the grain dryer. They are NOT the same! High grain kernel temperatures during drying probably have the most detrimental effect on the quality characteristics. High kernel temperatures reduce protein content in feed grains, increase the amount of stress cracking (fissuring in rice) and breakage susceptibility of corn and rice, increase the amount of surface wrinkling and kernel shrinkage in small grains and cereals, reduce the yield of grit s and flour during dry milling and of starch during wet milling, diminish the yield and quality of oil from oilseeds, reduce the baking quality of wheat, and destroy the germination value in malting barley and seed grain. Typically, air temperatures used to dry commodity grains in high-temperature, high-capacity crossflow dryers range from 180 – 230ºF (82.2-110ºC). If dried to the market moisture content of 13-15% (depending on grain type), kernel temperatures will heat to the drying air temperature especially along the inside screen of a crossflow dryer. The negative impact of these high values on desirable quality characteristics can be limited by using air temperatures sufficiently low to avoid exceeding the maximum recommended values in Table 4. Regardless of dryer design, grain kernel temperatures must be kept below these maximum values during the entire drying process to minimize undesirable quality losses. Stress Cracks and Breakage Susceptibility Stress cracks in corn kernels (similarly to fissures in rice kernels and cracking of soybeans) are due to changes in viscoelastic properties that cause internal failures in the endosperm. The viscoelastic properties of a grain kernel change as a function of grain temperature and moisture content, which are determined by the drying and cooling conditions and rates. [Viscoelasticity refers to mechanical behavior of a biological

GEAPS FDC July 28-31, 2002
13
material that combines response characteristics of both an elastic solid and a viscous fluid. The response behavior of a viscoelastic material is a fundamental property of its molecular structure.] In terms of a grain kernel, it is characterized by a certain level of rigidity of an elastic solid body, and at the same time, it is characterized by a certain level of fluidity and energy dissipation of a viscous fluid. Generally, at higher moisture contents, kernel properties are more fluid- like (rubbery), and at lower moisture contents, kernel properties are more solid-like (glassy). During the drying process, an increasing temperature front moves rapidly from the surface into each grain kernel and a decreasing moisture front moves relatively slower from the surface into each grain kernel. Under high-temperature, high-airflow drying conditions, the viscoelastic properties at the kernel surface change quickly from the rubbery state to the glassy state. The change from the rubbery state to the glassy state (called glass transition) causes a high level of viscoelastic stress that can lead to structural failure. Thus, similarly to the moisture front, a front of viscoelastic stresses propagates from the surface into the grain kernel as well. Depending on the level of viscoelastic stress at a particular location inside a kernel, the physical structure of the kernel may overload and fail, which will lead to the formation of stress cracks in corn kernels, fissures in rice kernels, or cracking of soybeans. Stress cracks in corn kernels may or may not reach the surface just beneath the pericarp. Stress cracks and fissures are easily detected by candling individual kernels over a light source. In corn, they are classified as single, multiple, or checked cracks. Corn with a high percentage of stress-cracked kernels tends to increase in the amount of broken corn and foreign material (BCFM) as the product moves through a grain handling facility and the marketing channel. The susceptibility of grain to breaking (brittleness) can be measured with a commercial breakage tester, and is expressed as a percentage value. Years of research and experience have clearly shown that the development of stress cracks (and thus the amount of BCFM) can be minimized by selecting less susceptible hybrids (Table 5), harvesting and drying at lower initial moisture contents, avoiding overdrying, controlling the amount of moisture removed per drying pass especially between 15 – 18% moisture (Table 6), minimizing the drying rate to less than 5 percentage points per hour for corn (less than 5 points/hour for sorghum and sunflower, 4 points/hour for wheat, 3 points/hour for soybeans, 2 points/hour for rice), reducing the grain kernel temperature, tempering during drying and before cooling, and slow cooling after drying (Table 7). Although the effect of viscoelastic stress on the behavior of biological materials has been extensively researched, the effect of drying on viscoelastic stress formation in grains and oilseeds has not been well documented until recently. Research at the University of Arkansas suggests that rice can be dried using air temperature and humidity conditions that will avoid glass transition behavior and thus eliminate fissuring of rice kernels (Cnossen and Siebenmorgen, 2000). Research at Purdue University has led to the development of a numerical simulation model that is able to predict viscoelastic stress formation in single grain kernels as a function of drying air temperature and humidity (Singh et al., 2002). Results suggest that air temperature and humidity conditions that

GEAPS FDC July 28-31, 2002
14
expose soybeans to dry below 10% should be avoided because the effect of glass transition on stress development and fissuring was clearly observed. Drying System Considerations Dryer Selection Criteria Before the designs of the common high-capacity grain dryers are presented, the topic of dryer selection for a particular grain elevator, grain depot or large farm is considered. People choose dryers for various reasons. Table 9 lists criteria used by elevator managers in selecting dryers for their installations. Initial cost, energy efficiency and grain quality rate high in the eyes of most managers but some decide on purchase based on such factors as horsepower demand, air-pollution characteristics or operator-expertise requirement. Recently attempts have been made to quantify the selection procedure of grain dryers. The World Bank used the following criteria as "the ten most-desirable dryer characteristics" in selecting high-capacity corn dryers for Northeast China (Maier, 1995): (1) fixed cost per tonne capacity, (2) dryer type, (3) dryer reliability and manufacturer's service record, (4) specific energy consumption, (5) grain-quality characteristics, (6) required operator expertise, (7) maintenance costs, (8) dryer controls, (9) air/noise pollution characteristics, and (10) service life. Each item contributed a different percentage to the final score. Qualifying the significant factors in the selection of a high-capacity dryer is less controversial than quantifying the various factors. The quantification is organization-dependent. For instance, the World Bank assigned 60% of the final score to initial cost, and only 40% to the remaining nine criteria listed in the previous paragraph. Many dryer buyers in food-related industries will not agree with this particular dryer-selection criteria quantification. Instead, they would likely assign 75% to grain-quality characteristics. Dryer Sizing and Capacity One of the primary questions a facility manager has to address when selecting a drying system is the size and capacity of the dryer needed. A general rule of thumb for calculating the needed capacity of a dryer is to determine the total daily receipts of grain expected at a facility during the peak period of the harvest season. In the Midwestern Corn Belt, corn and soybean volumes determine the needed storage capacity, but corn volume determines the needed receiving and drying capacities. Grain drying capacity should be based on the average percentage points of moisture that had to be removed from the crop during the past ten years for the geographical location of the facility. In the Midwestern Corn Belt, that average is typically five percentage points of moisture removal. Additionally, even though a dryer can operate 24 hours per day, a more realistic operating period for the purpose of calculating the needed drying capacity is 20 hours per day. Drying Capacity Example: Let’s assume that the receiving system of a particular facility is sized to unload at an average capacity of 20,000 bushels per hour (bph) during a daily 12-hour operational period. Total daily receipts would be 240,000 bu (20,000 bph x 12 h

GEAPS FDC July 28-31, 2002
15
= 240,000 bu). Further assuming that during the peak of the season, 75% of daily receipts are corn (i.e., 180,000 bu), and that during a typical season two-thirds of that corn is received “wet” (i.e., above 16-17% moisture content), then 120,000 bu (240,000 bpd x 0.75 x 0.66 = 120,000 bpd) of wet corn will have to be run through the dryer. In order to keep up with the accumulated wet corn on peak days, the drying capacity will have to be 6,000 bph (120,000 bu / 20 h = 6,000 bph) at five percentage points of moisture removal. In terms of the size of the dryer, the relationship between drying capacity versus airflow and drying air temperature has to be known. Most commercial grain dryer manufacturers have quantified that relationship for their respective drying systems (Table 8). Dryer Size Example: If the dryer in the above example were operated at 180ºF and had a drying section airflow of 75 cfm/bu, then the drying capacity based on Table 8 would be 1.39 bph for each bushel held in the heat section of the dryer. Thus, for the needed drying capacity of 6,000 bph, the dryer would have to be sized to hold 4,317 bu (6,000 bph / 1.39 bph/bu = 4,317 bu). For a 24-ft diameter tower dryer with a 12- inch screen column width, the height of the drying section would then have to be 74.3 ft (5,370 ft3 / 72.3 ft2 = 74.3 ft; where, 4,317 bu x 1.244 ft3/bu = 5,370 ft3, and 3.141 x ((12ft)2 – (11ft)2) = 72.3 ft2). The airflow in the drying section would be 323,741 cfm (75 cfm/bu x 4,317 bu = 323,741 cfm). In addition to the drying capacity, the needed wet grain holding capacity has to be determined in order to provide for a buffer ahead of the drying system. As a rule of thumb, the wet grain holding capacity should be sized for at least 25-50% of the peak daily wet receipts volume. Some operations managers maintain wet grain holding capacities of 50-150% directly ahead of the dryer preferably in multiple hopper-bottom bins or silos to provide flexibility for segregation and blending capabilities. Wet Grain Holding Capacity Example: For the above example, a wet holding capacity of 30,000 bu would represent 25% of the peak daily wet receipts. Adding this wet holding capacity to the wet grain receipts on peak days will yield 120,000 bu + 30,000 bu = 150,000 bu. The dryer would have to operate at its rated capacity for more than 24 hours per day in order to dry the additional wet corn in the buffer (150,000 bu / 6,000 bph = 25 h). If during a wet harvest drying capacity were reduced to 3,600 bph for ten points of moisture removal, daily drying capacity would only be 72,000 bu (3,600 bph x 20 h = 72,000 bu). Subtracting this daily drying capacity from the peak day wet grain receipts yields a minimum wet holding capacity of 48,000 bu (120,000 bu – 72,000 bu = 48,000 bu). If a typical 50% flex factor is added to the minimum wet holding capacities for the above example calculations, the desirable wet holding capacities would increase to 45,000 bu (30,000 bu x 1.5 = 45,000 bu) and 72,000 bu (48,000 bu x 1.5 = 72,000 bu), or 38% and 60% of the peak daily wet receipts volume, respectively. Site Selection Most commercial grain dryer sales are for the upgrading and modernization of existing facilities, and involve replacement of old and outdated dryers. Although a footprint for a new dryer typically exists, wet grain holding capacity and conveying equipment to and

GEAPS FDC July 28-31, 2002
16
from the dryer will likely have to be upgraded to properly match the process flow of grain from receiving to final storage. Construction of the foundation and erection of the dryer are generally straightforward at an existing facility because the site had previously been prepared for other structures such as receiving pits and storage bins. On the other hand, an important consideration easily overlooked is the need for increased capacity of utility services especially natural gas and electricity. Before a larger capacity replacement dryer is selected, the natural gas supply and line pressure must be verified to assure it can be upgraded to handle the significantly greater fuel requirements. In the case of propane, multiple tanks and reliable tanker supply service during the peak of the season needs to be available. Similarly, three-phase power requirements will likely increase because the connected load of the new dryer may be as high as 400 Hp. The cost of upgrading the fuel supply and electricity service can be considerable and should not be underestimated. In some cases, these upgrades have been reported to cost as much or more than the new dryer! Dryer Types The three major continuous-flow grain drying systems employed in the commercial grain industry are (in order of numbers operating worldwide): (1) crossflow, (2) mixed-flow, and (3) concurrent- flow. They are classified according to the directions the grain and the air move through the dryer (Figure 1). Each type has advantages over the two others with respect to some of the criteria in Table 9. However, no dryer, or dryer type, is best for every high-capacity grain drying operation. In a crossflow dryer the air and grain move perpendicular to each other, while in a concurrent- flow dryer they move in parallel. In a mixed flow dryer, parts of the air flow with (concurrently), against (counter), and perpendicular to (crossflow) the grain. It is important to realize that these patterns have a significant effect on drying capacity, energy efficiency, grain quality, and grain kernel temperature. Crossflow dryers are most widely used in the United States and Canada, while mixed-flow (rack) dryers are predominant in Europe, Asia and Latin America. In Argentina crossflow and mixed-flow dryers share the market approximately half and half. Concurrent- flow dryers are a more recent design and have been used for a few specialty applications in the U.S. High-capacity grain dryers usually contain a cooling section (except when grain is to be cooled after the high- temperature drying process by dryeration in a bin or silo). The objective of the cooler is to lower the temperature of the dried grain to within 5-10ºF (3-6ºC) of the ambient temperature. Depending on the grain-flow rate through the dryer, grain loses 0.5-1% of moisture in the cooling process. The relative direction of the air and the grain in the cooler section is the same as in the drying section of crossflow and mixed-flow dryers but counter- flow in a concurrent-flow dryer. The grain remains in the drying stage(s) about twice as long as in the cooling section. Dryer Comparison A comparison between the three major grain dryer types is given in Table 10 with respect to the drying-air temperature, the maximum temperature reached by the grain, and the expected grain quality decrease when drying corn by ten percentage points of moisture

GEAPS FDC July 28-31, 2002
17
(Montross et al., 1994). Mixed-flow dryers fall between the crossflow and concurrent-flow models in these three categories. The percentage of stress-cracked kernels and the energy consumption of concurrent- flow dryers are less than for the other two dryer types. This comes at a cost: concurrent-flow dryers are, in general, the most expensive of the three dryer types. Conventional Crossflow Dryers Figure 3 is a schematic of a conventional continuous-flow crossflow (CF) dryer, which are either of the upright tower or the horizontal low-profile (stackable) design. Wet grain flows from the holding section by gravity into the drying zone, which consists of two sets of perforated metal screens separated by a distance of several inches (cm). The fan and burner assembly forces the heated air perpendicularly from the plenum through the drying column, which can be from 10 to 100 ft (3 – 30 m) in length. The retention time of the grain in the cross flow dryer is controlled by the rpm of the grain-unloading auger. The design specifications of a typical conventional cross flow dryer are given in Table 11. Column width, or thickness, in CF grain dryers varies from 8 to 18 inches (from 20 to 46 cm). The wider columns provide improved energy efficiency because the moisture-carrying capacity of the drying air is maximized. However, wider columns create a larger gradient of grain temperature and moisture content between the air inlet and outlet sides of the column. Additionally, a somewhat lower drying capacity is associated with wider columns. Narrowing the column thickness near the grain inlet increases the airflow rate per bushel of grain. This will result in a faster heat-up of the grain, but reduces the energy efficiency somewhat because of the lower exhaust air saturation. A single-stage conventional CF dryer employs two fans: one in the heating and one in the cooling stage. The air from both fans is exhausted directly to the atmosphere after it passes through the grain column. Many single-stage dryers allow stacking of one dryer on top of another, which allows for the simultaneous operation of several fan and burner units. On the other hand, some tower dryers are designed with multiple fan-burner units. The primary advantage of multiple drying stages is the operation of each burner at a different drying air temperature. Near the top of the dryer, higher air temperatures can be used because the incoming wet kernels are primarily heated with little drying taking place. The further down the drying column, the lower the drying air temperature should be set to avoid exceeding the maximum grain kernel temperature (see Table 4). Multiple drying stages in an upright tower dryer with only a single fan-burner unit can be created by interrupting the drying process through placement of tempering sections or turning devices along the drying column. Although beneficial, this approach does not allow for a controlled variation of drying air temperature in the different stages. However, a drying air temperature gradient of 15-30ºF (8-17ºC) along the length of the drying column is commonly observed in those dryer types. Air-Grain Temperature and Moisture Content Distribution The direction of air versus grain flow through a dryer determines the temperature and moisture distributions in the dryer. Each of the three major dryer types has a typical

GEAPS FDC July 28-31, 2002
18
pattern, which is illustrated in Figure 2. The air-grain temperatures and moisture content distributions for a conventional CF dryer show that the grain is not dried uniformly. The grain at the air inlet side of the column is overdried and exits the dryer at a grain temperature close to the drying air temperature; the grain at the air exhaust side of the column is underdried and remains well below the inlet drying air temperature. As the grain exits the dryer after the cooling section, the overdried and underdried kernels mix to produce an "average" moisture content. The potential reduction in grain quality can be minimized (but not eliminated) in CF dryers only by using alternative or modified dryer designs and operational procedures. In recent years, numerous improvements have been implemented as standard design features, or are available as options. Temperature, Moisture and Quality Gradients Recent research revealed additional interesting results with respect to the effect of drying systems on the temperature, moisture and quality distribution in dryers. For obvious reasons, grain kernels enter any dryer type at significantly different moisture contents that can vary by as much as 30 percentage points. Unfortunately, this kernel moisture variation is only reduced but not eliminated during drying. Grain kernels do not equilibrate to an uniform moisture content even after long storage periods (Table 12). In the past, it has been assumed that the moisture content distribution among individual corn kernels exiting a concurrent- or mixed-flow dryer is more uniform than that found in a crossflow dryer. Montross et al. (1994) confirmed that the large variability in kernel moisture content entering a dryer offsets the positive effect a more uniform drying treatment has (Table 13). Thus, crossflow drying, which inherently creates non-uniform temperature and moisture gradients across the width of the column, does not change the kernel moisture variability any more or less than concurrent- and mixed-flow dryers. On the other hand, the dryer type does have a significant effect on kernel stress crack values (Table 14). Corn dried in concurrent- flow dryers generally has the fewest stress cracks, and that dried in crossflow dryers the most. Thus, the effect on stress crack formation is directly related to the uniformity of the temperature and moisture gradient patterns created in the dryer. Table 15 illustrates the moisture gradients developed in the 12- inch (30 cm) thick grain column of a conventional CF dryer after the heating and cooling sections. Drying corn from 25.5% to 16% moisture with an air temperature of 180ºF (82ºC) resulted in a moisture spread of 9.7 points between the inside and the outside of the column after the heating section, and 8.6 points after the cooling section. Thus, immediate and fast cooling of hot corn does not significantly reduce the moisture gradient, while higher drying air temperatures increase the spread significantly. To illustrate this further, Table 16 summarizes the moisture content, temperature and quality of corn at different locations across the width of the crossflow drying column. At 0.5 inches (1.3 cm) from the inlet, the grain kernel temperature was within 15ºF (8.3ºC) of the drying air temperature, while the moisture content was 10 percent, or 9 points below the "average" moisture of 19 percent. At a distance of 5.5 inches (14 cm) the corn remained essentially undried. Quality in terms of breakage susceptibility was 48% near

GEAPS FDC July 28-31, 2002
19
the inlet of the air, while further into the column it had only increased to 10%. Thus, the further into the drying column, the lower the grain kernel temperature and breakage susceptibility, but the higher the moisture content. Table 17 shows the effect of "average" final moisture content on quality. As it is reduced from 18% to 11%, the average breakage susceptibility increases by a factor of 3.5. If drying were stopped at 15% moisture, the quality would decrease by a factor of only 1.5. Thus, overdrying not only wastes energy and increases shrink loss, but it also has a significantly detrimental effect on quality. Modified Crossflow Dryers The performance of conventional CF dryers can be significantly improved with respect to the effects on temperature, moisture and quality variations, as well as overall energy efficiency. The two major disadvantages of conventional CF dryers are: (1) large moisture content and quality gradients across the width of the column, and (2) low energy efficiencies. In recent years numerous improvements have been implemented as standard design features, or are available as options. However, non-uniformity of moisture, temperature and quality can never be completely eliminated using the crossflow design for grain drying. Reverse-Airflow (Suction) Cooling One of the primary CF dryer design modifications utilizes reverse-airflow in the cooling section (or suction cooling). In this design the fan and burner unit are typically mounted inside the dryer drawing the cooling air through the grain in the cooling section and pushing it into the heated air plenum (Figure 4). In the heating section the air is forced through the grain column and exhausted in the same manner as in the conventional CF dryer. Suction cooling has been primarily implemented in upright tower dryers. Typical operating specifications are summarized in Table 18. The reverse-airflow design has two primary advantages: (1) During the cooling of the grain part of the heat is reclaimed by prewarming the drying
air before the burner. This decreases the specific energy consumption of the drying process by as much as 30% (Table 19).
(2) The ambient cooling air enters the grain column where the grain temperature is the lowest. This reduces the cooling shock by minimizing the grain-air temperature difference and improves the moisture gradient (Table 19) and breakage susceptibility. [The significant reduction in the moisture gradient is attributed to the lower drying air temperatures, which maintained the maximum corn kernel temperature near 140ºF (60ºC) throughout the dryer.]
Another modification of upright tower dryers is the addition of an enclosure of the drying section, or the entire dryer. This decreases the wind effect on the drying columns, which minimizes the overall heat loss, assures a more even temperature distribution throughout the circumference of the dryer, and reduces condensation and caking on the outer screened column. Blocking off part of the drying air escape near the bottom of the heating section allows for the recirculation of exhausted drying air back to the fan and burner in a positive pressure dryer, and into the upper part of the cooling section in a

GEAPS FDC July 28-31, 2002
20
suction system. This reduces the initial cooling shock and improves energy efficiency even further. However, one of the disadvantages of reverse-airflow cooling is the accumulation of more chaff and fines sucked into the plenum from the cooling columns. This requires more maintenance and frequent cleaning of the dryer. A recent dryer design places the blowers at the side of the tower and allows a choice between both pressure and suction cooling for maximizing energy efficiency or minimizing trash build-up. Reverse Airflow (Suction) Drying Another alternative modification of conventional CF dryers is to reverse the airflow along the drying column. Although a rather expensive modification, this design has been shown to reduce the moisture gradient across the width of the column by up to 3.5 points, and improve the energy efficiency by up to 29% compared to a conventional CF dryer. The air from the top half of the drying section flows from the inside of the plenum through the column and is exhausted to the atmosphere, while the air for the second half of the drying section is introduced from the outside of the column. The inlet air for both drying stages is recycled air, which is mixed from the exhaust cooling air and the second drying stage air. Grain Column Inverting Although reverse-airflow dryers reduce the overall moisture differential in the grain column, they do not eliminate it. In order to decrease the moisture gradient significantly in the drying section, a grain exchanger should be installed about half-way down the drying column of an upright tower dryer (Figure 5). This turns the overheated-overdried grain from the air inlet side to the air outlet side of the column, while the underheated-underdried grain is turned from the exhaust air side to the air inlet side. For maximum quality the installation of multiple grain exchangers should be considered (Figure 6). Grain exchangers mix the grain somewhat while turning it. They also reduce the specific energy consumption slightly because the drying air has to heat the underheated-underdried grain while lowering the temperature of the overheated-overdried grain now at the outside of the column. A recent modification of this design that has been implemented in commercial tower dryers turns only the inner 12 inches (30 cm) of a 14-inch (36 cm) column of grain. The outer two inches (5 cm) of grain are allowed to flow past the exchanger. The primary advantage of this partia l inversion is a much lower emission of particulate matter and dust during the turning process as well as a lower energy loss due to the disrupted grain flow without impacting grain quality much. Upright stacked dryers achieve mixing of the grain in the transition between stages but do not accomplish actual inverting of the grain column. Slotted Plenum Panels A recent commercial innovation incorporates multiple tempering sections by replacing the inside plenum screen in a crossflow column dryer with slotted panels (2 inches high by 16 inches long; 5 cm high by 41 cm long) and product deflectors. This design allows the drying air to spread while flowing across the width of the column so that the grain closest to the panel has a short exposure to the highest air temperature followed by tempering until the next slot is reached. On the other hand, the wetter, cooler, outer grain layers are continually exposed to airflow. The grain should dry more gently and evenly
GEAPS FDC July 28-31, 2002
21
because of the reduced temperature and moisture differential across the column width. Although the slotted plenum panel dryer was only recently introduced, reports on energy efficiency and grain quality are promising. Differential Crossflow Drying A further improvement in crossflow drying is the differential grain flow dryer, which consists of tapered columns, dual variable-speed discharge augers, and a tempering hopper separating the first and second drying zones. The exhaust air from the second drying zone and from the cooling section are mixed and recycled. Due to the tapered column design and the dual discharge augers, the grain on the air inlet side of the columns moves more rapidly through the drying sections than the cooler grain near the air exhaust side of the drying zones. Thus, the moisture gradients across the width of the columns are significantly reduced. Additionally, the drying process is interrupted for 0.5 to 1.0 hours by tempering the grain between the two drying stages. A less complicated version of the differential flow design has recently been commercialized in a new farm dryer, and initial reports on grain quality are promising. Perforated Screen Wearability Perforated screens are either galvanized metal or stainless steel. Typically, the interior screens of tower and stackable crossflow dryers are galvanized metal and the exterior screens are stainless steel. The primary concern with galvanized screens is corrosion that over the long-term can seal over the holes. The perforations are stamped through the galvanized sheets and would expose the non-galvanized metal holes to condensation, caking and the environment, if they were used as exterior screens. Additionally, the continuous flow of grain kernels along the perforated screens causes abrasion, which eventually will wear out the perforated screen material. This is generally not a significant concern for dryers used only seasonally, such as corn drying during the fall harvest or wheat drying during the summer harvest. However, soybean and rice processors that operate dryers year-round usually prefer modified crossflow dryers with rectangular columns, which are more easily replaced compared to screens in tower or stackable dryers. Mixed-Flow Dryers A schematic of the essential parts of a mixed-flow (MF) dryer is shown in Figure 7; a typical MF dryer is illustrated in Figure 8. The moist grain flows (cascades) over alternate horizontal rows of inlet and outlet air ducts. Each intake channel for drying air is surrounded by four exhaust channels at equal distances. The MF dryer has one or more drying sections (sometimes divided by a tempering zone) in the upper part, and a cooling section in the lower part of the dryer. The relative flow of air and grain is a combination of concurrent-, cross-, and counter-flow (Brooker, 1992). The grain velocity through the dryer is typically controlled by a row of variable speed unloading baskets that swing back and forth to allow grain to drop out of the dryer intermittently. The design specifications of a typical MF dryer are given in Table 20. The drying characteristics of a conventional mixed-flow dryer are shown in Figure 2. Note the multiple treatments of the grain with hot drying air as the grain flows through a

GEAPS FDC July 28-31, 2002
22
dryer section, and the resulting high/low pattern in the kernel temperature. The drying air exiting the air- inlet ducts has passed through relatively thin layers of grain (i.e., thinner than in cross flow and concurrent-flow dryers), and therefore MF dryers have relatively low fan power requirements. The air ducts in a mixed-flow dryer are roof- or inverted-V shaped, with open bottoms through which the air passes into the grain. Perforated screens are not part of the basic design, and therefore MF dryers can be used for grains with a wide range of kernel sizes. It has long been assumed that basically all grain kernels in a mixed-flow dryer have the same residence time and undergo the same drying treatment (see Figure 2). However, the air ducts in the grain bed constitute flow obstructions, leading in commercial MF dryers to significant differences in kernel residence times. To improve drying uniformity, research has been conducted to optimize duct design, duct spacing and airflow rate (Liu, 1993). Computer simulation was utilized to design a pilot-scale mixed-flow dryer at Michigan State University that included the shifting of inlet ducts and the reversal of airflow direction through the grain column. Results with respect to improved drying uniformity were positive. Concurrent-Flow Dryers A schematic of a two-stage concurrent-flow (CCF) dryer is illustrated in Figure 9. Moist grain flows from the garner bin through a drying section in the same direction downward as the drying air. In the cooler, the grain and the air flow in opposite directions. Unlike in crossflow dryers, the grain column is not supported by screens but by the solid outside-walls of the dryer. The grain retention time in the CCF dryer is controlled by a series of unloading augers located at the bottom of the cooling section, and which facilitate a uniform downward movement of the grain bed through the dryer. The drying characteristics of a one-stage concurrent- flow dryer are illustrated in Figure 2. Unlike for crossflow dryers, only one moisture vs. time curve is drawn because in CCF dryers all grain kernels are ideally subjected to the same air / temperature treatment. Assuming the initial moisture content is uniform, the final moisture content is also uniform. As the wet grain enters the drying section, it is treated with air at ultra-high temperature (i.e. above 392ºF (200ºC)) and thus heats up very quickly. The maximum grain temperature is soon reached, resulting in rapid initial drying of the grain kernels. The high rate of moisture evaporation requires much energy, and consequently leads to a steep decrease in the air temperature, the kernel temperature and the kernel drying rate in the latter part of the drying zone. A distinguishing feature of concurrent- flow dryers is the large depth of the drying bed in the drying section(s) and in the cooling section, typically 20-40 inches (0.5-1.0 m). This results in higher static pressure requirements of CCF dryers than of CF dryers. Concurrent- flow dryers are classified as one-stage, two-stage or three-stage models, depending on the number of drying zones (Brooker, 1992). The drying stages in multi-stage CCF dryers are separated by a so-called tempering zone in which the grain is not subjected to any hot or cold airflow treatment. The specifications of a typical three-stage

GEAPS FDC July 28-31, 2002
23
concurrent- flow corn dryer are summarized in Table 21. Characteristic for the CCF dryer are the high drying-air temperatures (545, 473, 374ºF, or 285, 245, 190ºC) and the low airflow rates (171, 151, 125 cfm/ft2 or 50, 45 and 35 m3/m2 min) in the three drying stages. The requirement of ultra high air temperatures and static pressures will likely keep the price of CCF dryers above that of comparable crossflow and mixed-flow grain dryers. The higher initial cost, however, is often offset by the lower operating costs and higher grain quality. Energy Conservation and Recovery Recovering some of the discharged air from high-capacity dryers can reduce energy use by 20-30%, while reducing the drying capacity only slightly. The amount of saturation of the exhaust air varies along the length of the column of a CF dryer. Near the grain inlet at the top of the dryer, the exhaust air is nearly saturated. Saturated exhaust air feels relatively cool. For example, air heated to 230ºF (110ºC), forced through the grain column, and exhausted at 90% humidity may be as cool as 60ºF (16ºC) on a typical fall drying day. On the other hand, the air exhausted near the transition from the heating to the cooling section is relatively dry and still has a lot of its drying potential left. The exhausting of relatively dry air wastes fuel and reduces the energy efficiency of a any dryer significantly. An energy recovery system aims at capturing as much of the useful energy as possible left in the exhaust air. Some dryers recover all (or part) of the cooling air and recirculate it into the burner; others recover and recirculate the cooling air and part of the discharged drying air from the lower sections of the drying zone. The actual amount of energy savings due to exhaust air recovery depends on dryer airflow direction, final grain moisture content, moisture reduction in the dryer, weather conditions, and the proportion of airflow that is recovered. The additional costs of an energy reclaiming system have to be weighed against the potential savings. For example, drying 3,000 bu/h of corn from 25% moisture to 15% requires the removal of approximately 20,000 lb of water. At an energy efficiency of 3,000 BTU/lb (6.96 MJ/kg) of water this would require about 600 Therms of natural gas per hour of drying (Tables 2 and 3). If the drying efficiency were improved to 1,500 BTU/lb (3.48 MJ/kg) of water, the fuel consumption would be cut by 50% to 300 Therms/h. At $0.45/therm, a 50% improvement in energy efficiency would save $135 for every hour the dryer is operated. If the dryer handled 1 million bushels (25,000 MT) per year, approximately $45,000 could be saved in energy costs alone (in other words, the drying costs could be reduced by about 4.5 cents per bushel (1.80 $/MT)). Tempering Between Stages When grain is tempered between drying stages, the grain is not subjected to any air treatment for an extended period of time. Thus, the temperature, moisture and viscoelastic stress gradients that develop while moisture is evaporating from individual grain kernels are diminished (or equalize) before drying or cooling of the grain is

GEAPS FDC July 28-31, 2002
24
resumed. The tempering process limits stress cracking and subsequently reduces the breakage susceptibility of the grain. Tempering between successive passes of drying has been utilized for years in the rice drying industry, where the prevention of fissures is of primary concern. Tempering has also been used successfully in drying systems that transfer grain hot into a bin where it is slowly cooled. Not only is drying efficiency improved, but stress cracking and kernel fissuring are diminished also. Incorporating a tempering section into a high- temperature, high-capacity dryer is especially beneficial between the drying and cooling stages. Research has identified fast cooling as a primary cause of stress crack development. Thus, tempering before cooling in a continuous-flow dryer, or tempering followed by slow cooling in a bin will significantly reduce stress cracks. Although a tempering section requires an increased overall dryer height, less than one foot (30 cm) of drying section is needed to make up for one foot (30 cm) of tempering. Incorporating a tempering zone along a drying section modifies a single-stage into a multi-stage dryer. Segregating Initial Moistures A major challenge for any dryer design is to adjust its drying speed quickly and accurately to reflect the inevitable variation of the moisture content of incoming grain. Drying speed can be optimized using automatic dryer controllers. However, segregating grain into multiple wet holding bins according to different moisture content ranges will improve the performance of even the best dryer controller with the added benefit of better energy efficiency and grain quality. For example, elevator operators have been know to segregate wet grain into above and below 20% moisture categories, and into ranges of 18% and below, 18-22%, and 22% and above. Both examples have yielded more uniformity during the drying process. Preheating in the Wet Holding Bin Preheating of grain occurs to a limited extent in the wet holding hopper above most dryers. However, preheating grain in the wet holding bin by utilizing waste heat from the dryer and boosting its energy content with additional burners has been shown to increase the drying capacity of existing dryers by 15-20%. Preheating can reduce overall fuel costs and improve grain quality, however, these benefits have not been thoroughly quantified. High-Capacity Drying and Slow Cooling High-capacity dryers are generally set up at elevators to rapidly cool the dried grain before transferring it to the storage structure. However, employing delayed cooling methods can reduce fuel costs, increase drying capacity, reduce stress cracks, fissuring and brittleness, and provide more operational flexibility. Delayed cooling usually involves transferring hot grain (grain kernel temperature of 100-140ºF, or 38-60ºC) from the high-capacity dryer to separate cooling bins. The most widely used methods are known as dryeration, in-bin cooling and combination high-and- low temperature drying. A recent study by Montross & Maier (2000) confirmed that full-heat drying followed by dryeration or combination drying reduced the total drying cost by approximately 10% compared to conventional drying and cooling within a crossflow dryer. The greatest benefit was an increase of 72 and 159% in drying capacity when dryeration and

GEAPS FDC July 28-31, 2002
25
combination drying were used instead of conventional drying and cooling within the dryer, respectively. Transferring grain hot followed by slow cooling was originally developed in the 1960’s to help commercial grain elevator operators in the Midwestern Corn Belt increase drying capacity and reduce corn brittleness. It has since been used widely as an on-farm combination drying technique throughout the Midwestern Corn Belt. Although the technique has not been widely used by commercial elevators in many years, recent concerns over grain quality, the potential to boost drying capacity of existing systems, and the availability of premiums for low stress crack corn have sparked renewed interest among elevator managers. In-bin Cooling In-bin cooling reduces fuel consumption by at least 10% and increases capacity of a high-capacity dryer by 10-20%. High- temperature drying is stopped and the hot grain is transferred when the grain moisture content is about 1 to 2 percentage points above the desired final moisture content (Figure 10a). The hot grain is cooled slowly over several hours at a full-bin airflow rate of about 0.5 cfm/bu (0.5 m3/min/t). After cooling is completed, the grain can remain in the bin for storage. A critical modification of storage bins involves the need for fully perforated floors, adequate fan capacity, and sufficient roof venting to prevent condensed moisture from dripping back on the cooled grain. For bins that are filled over several days, multiple cooling fans may be used to assure airflow rates at any grain depth close to 0.5 cfm/bu (0.5 m3 /min/t) while the bin is filled. Fans are turned on sequentially, and non-operating fans are equipped with backdraft vents to prevent air leakage. Dryeration Dryeration reduces fuel consumption by about 15-30% and increases capacity of a high-capacity dryer by 50% or more. High-temperature drying is stopped and the hot grain is transferred when the grain moisture content is about 2 to 3 percentage points about the desired final moisture (Figure 10b). The hot grain is allowed to temper (steep, sweat) for 6 to 12 hours in a separate bin before cooling it slowly over several hours at an airflow rate of about 0.5 to 1.0 cfm/bu (from 0.5 to 1.0 m3/min/t). After cooling is completed, the grain is transferred to the final storage structure. The primary reason for cooling in a separate bin is the large amount of water evaporation accompanying dryeration. Moving grain out of the tempering bin avoids problems of potential spoilage caused by condensed moisture on the bin roof and walls. Combination High-and-Low Temperature (2-Stage) Drying Combination 2-stage drying is most suitable for crops harvested too wet for safe low-temperature bin drying. Wet grain is dried partially in a high-capacity dryer to 19-21% moisture, and transferred hot into a low-temperature drying bin (Figure 10c). The cooling effect will remove about 1 point of moisture at full bin airflow rates of 1 to 2 cfm/bu (from 1 to 2 m3/min/t). Drying to 15% moisture requires several weeks, or even months. Combination drying may be a suitable technique for an elevator that handles a certain amount of specialty corn (food-grade, waxy) that requires strict quality standards in terms of maximum allowable grain kernel temperature and minimum stress cracking. However, low-temperature drying is generally limited to 10,000 to 30,000 bushel (from 250 to 750

GEAPS FDC July 28-31, 2002
26
MT) bins. Thus, several such bins may be needed to handle the low-temperature drying operation. Commercial examples of successfully operating multiple low temperature drying bins are found in the popcorn industry, where quality requirements regarding stress cracks and moisture content are most stringent. Continuous-flow Slow Cooling A primary obstacle to acceptance of slow cooling methods at commercial elevators is the size and layout of most storage structures (steel bins, tanks, concrete silos, flats). However, a modification of the slow cooling process available from one equipment manufacturer may be a potentially viable technique for commercial elevators. This modification involves a separate cooling bin (or silo) with a tapered auger system that continuously removes a layer of cooled grain from the bottom of the bin. The cooled grain is transferred to the final storage. Proper operation of such a system would assure adequate tempering time and airflow, as well as the necessary first- in, first-out flow of grain. Alternatively, a massflow cooling bin that eliminated the need for the tapered auger system would appear even more desirable. Such a system has been in operation at cooperative elevator facilities for many years in France for the purpose of drying corn . Limitations of Slow Cooling Methods The following limitations should be considered carefully for commercial elevators: (1) Existing conveying equipment and storage structures are not set up to handle the significant water condensation from the large volumes of grain transferred hot during the cold fall weather. (2) Existing storage structures are not equipped with large enough fans to provide the necessary airflow rates to complete cooling within the allowable safe time limits. (3) Flat storage structures are never suitable for cooling hot grain. Airflow from aeration ducts will not flow uniformly through the grain pile and significant condensation would occur on the underside of building roofs. (4) Large storage tanks are generally not equipped with fully perforated floors. Non-uniform airflow and thus cooling would be a significant concern. (5) Upright concrete silos are generally too deep and would require too much fan horsepower to achieve the necessary cooling rates. Before serious consideration should be given to implementing slow cooling methods at commercial elevators, the potential gains in fuel savings, drying capacity and grain quality need to be compared against the capital equipment costs. However, for the utilization with high-value crops these investments may be justifiable. Automatic Dryer Control Operator expertise and automatic dryer control can be considered under the same heading. Automatic control greatly facilitates the ease of operating a grain dryer, and thus reduces the required operator expertise. A controller's objective is to minimize the overdrying/underdrying of grain. Secondary objectives are to minimize energy consumption and to optimize dryer capacity, both subject to grain quality constraints. Many high-capacity dryers are fitted with temperature-activated feedback-type controllers, which measure the grain or exhaust-air temperature at several locations along
GEAPS FDC July 28-31, 2002
27
the drying column. This controller type is inaccurate at inlet moisture content changes exceeding ±3%. Moisture-activated control systems, which measure the inlet and outlet moisture content of the grain continuously, are far more accurate than temperature-activated controllers. Moisture-activated automatic dryer controllers need further development with respect to optimum control strategy. The most sophisticated moisture-based controllers use engineering equations to predict the drying rate of the grain along the columns by continuously reading the incoming and leaving moisture contents. This allows the microprocessor to predict drying progress, and make more precise adjustments to the metering rolls than what a simple grain temperature or moisture sensing controller can accomplish. Fortunately, most of the new commercial grain dryers are equipped with PLC-based control systems that these more sophisticated moisture-activated controllers can tap into. Economic Considerations A high-capacity dryer represents a significant capital investment that must be paid back primarily from drying revenues. Erection costs are typically a line item in the sales contract and are generally inc luded in the purchase price of the dryer. The decision between long-term profitability and initial investment must be weighed carefully. Although a short payback period of 2 to 4 years is desirable, future events such as stricter environmental regulations could turn what initially appears to be a short payback period into a much longer one. The analysis of profitability of the purchase of a dryer is an essential part of the evaluation of different dryer types. Analyses commonly used, such as the payback period and rate of return, do not adequately take into account the dryer-selection criteria listed in Table 9. However, the capital-budgeting (also called life-cycle costing) analysis allows the buyer to analyze the cash-flows over time resulting from the purchase of a specific dryer model. The procedure requires values for a series of parameters - including the fixed and operating costs, the energy consumption, the grain quality change, the fuel and maintenance costs, the drying capacity gain, the service life, the time value of money, and the desired rate of return. Only a capital-budgeting analysis allows a realistic economic comparison of dryer types. An initially costly dryer may in the long run be the preferred buy because it may produce better quality grain at lower operating costs and lower environmental pollution. A payback-period analysis may not reveal these advantages; a capital-budgeting analysis, spanning a 3-10 year planning horizon, will. A capital-budgeting analysis of the purchase of a dryer requires knowledge, or accurate estimates, of a number of technical parameters such as the dryer capacity, energy efficiency, salvage value, etc. Cost factors when determining operating expenses include service life and availability, fuel, expansion feasibility, reliability, labor, taxes, insurance, and maintenance. Service life and availability tie in closely with maintenance and reliability. Due to the short drying season any breakdown or delayed repair can have a significant effect on drying business. An undersized dryer, or one that frequently breaks down will turn farmers away to competing elevators. Drying business lost once is not recoverable during a current season, and possibly not even in a future season. Future

GEAPS FDC July 28-31, 2002
28
growth of an elevator operation should allow for expansion of the drying facility either by adding a second dryer in parallel, or by adding additional stages to an existing system. Annual operating costs can be calculated from the total amount of grain dried and fuel used, and the average incoming moisture content, receiving volume, and weather conditions. To improve accuracy, separate meters should be installed to monitor fuel and electricity consumption of the dryer itself. Additionally, peak receiving volume should be monitored for future planning purposes. Operational data suggests that the higher the receiving volume, the lower the cost per bushel per point removed. The cut-off after which no significant reduction in operating costs appears to occur is about 1 million bushel (25,000 MT) per year. Elevator operators need to consider that they not only compete with other elevators for drying business, but also with on-farm systems. If farmers can dry their crops cheaper, they will likely build or expand their own facilities. Regulatory Considerations New rules implemented by the Environmental Protection Agency (EPA) under the Clean Air Act sets specific limits on particulate matter (PM) emissions from drying (and handling) operations through the United States. These rules also specify tha t the hole size for perforated screens in crossflow dryers cannot be larger than 0.094 inches (0.24 cm), and that the exhaust air from mixed-flow dryers must pass through 15 mesh screen. Although current emission controls focus on PM, grain handling and processing facilities will need to address pollution from noise, odor, and combustion products in the future as well. One example is a California pecan drying operation, which had to determine and submit combustion product numbers to their respective air qua lity district before receiving a permit. Federal regulations from the Occupational Safety & Health Administration (OSHA) specify standards for the design and presence of ladders and catwalks, and address personal safety and fall protection issues. These need to be considered as they affect the maintenance and operation of drying and handling systems. In some states, additional regulations apply such as the requirement to have dryer control components be approved by Underwriters Laboratory (UL). In the future, energy efficiency is expected to be regulated as well. Efficiency standards have already been implemented in other industries, such as the average fleet fuel rating of automobiles. Drying systems that do not maximize energy efficiency will be unacceptable in the future. Additionally, future regulations may require dryer capacity ratings to be based on internationally accepted standards such as ISO 11520-1:1997 (Agricultural grain driers – Determination of drying performance – Part 1: General) and ISO 11520-2:2001 (Agricultural grain driers – Determination of drying performance – Part 2: Additional procedures and crop-specific requirements). Future Dryer Development Issues Segregated Grain Handling and Drying Stricter end user demands and a more competitive export market will continue to increase the importance of grain quality throughout the entire grain production and processing

GEAPS FDC July 28-31, 2002
29
chain. The handling of grain according to specific intrinsic characteristics, such as oil, protein and starch content, is becoming the norm, and bulk commodity corn as it is known now may become a "specialty" grain. This will require the separate handling of possibly smaller batches and/or multiple identity preserved streams through drying and storage facilities that will avo id destruction, contamination and blending of high-quality grains. Future dryer designs will need to allow for easier cleanout between identity preserved grain streams to avoid especially cross contamination. Another important consideration may be the need for multiple dryers at a facility dedicated to the drying of separate identity preserved grain streams rather than a single high-capacity dryer. Already processors separate grain according to color (white and yellow food corn), starch content (waxy corn), and oil content (high oil corn). Large integrated livestock feeders are beginning to follow this example basing separation on nutrient content of feed grains (nutrient dense corn). For such a differentiated product system to effectively develop, end users will have to pay premiums for grains handled to meet these higher quality standards. Grain handlers will need to pass these incentives on to producers because it is there that the identity preservation is first initiated. Smart Processing Systems In the future, dryers will be designed, built and operated differently as well. Smart processing systems will automate many manual tasks and make it easier for operators to track performance of their dryers more closely. Temperatures, moisture contents, grain quality, and grain flow will be automatically controlled, and records including weather conditions and fuel consumption will be linked directly with the company database. At least one such system is already commercially available from a manufacturer that could be enabled to perform the linking function. Critical to this automation will be the development of reliable sensors that withstand the harsh agricultural environment. Alternative Fuel Sources There will also likely be a demand for the utilization of alternative fuel sources for drying. Previous biomass burner designs will be improved, and farmers' demand for ethanol-based fuels for drying will be answered. In overly strict clean air districts the only feasible option may be electric grain dryers operating in conjunction with a new generation of super efficient dust, noise, and odor separation equipment. Stochastic Dryer Models In the design of grain dryers, deterministic-type simulation models are employed for optimal design (Liu and Bakker-Arkema, 1997). The models assume an uniform moisture content of the grain entering a dryer. This is a gross assumption as is evident from the data for maize presented in Table 22. The average moisture content of the tip kernels in an ear of corn is considerably lower than in the middle or at the butt end of an ear. Besides, the range in the moisture content of the kernels at the three locations of an ear varies by as much as 20 percentage points. Figure 11 shows the effect of the non-uniformity of the moisture content of corn entering a crossflow dryer on the distribution of the moisture content in the corn exiting the dryer. The employment of deterministic models, which assume an uniform moisture content in

GEAPS FDC July 28-31, 2002
30
the grain entering and leaving a dryer, is obviously a simplification. In the near future, stochastic grain-drying models will become available. They will improve the ability to predict the quality of grain dried in high-capacity dryers. Crossflow Dryer Development Needs The inherent limitation of the crossflow dryer design with respect to the uniformity of the drying treatment has not been completely overcome with the available standard modifications. Additionally, the issue of single kernel moisture variability of the incoming grain stream should to be addressed. Future crossflow-dryer development needs include: (1) additional design modifications minimizing the non-uniformity of the drying treatment and of the single kernel moisture contents, (2) evaluation of the slotted-panel screen and differential grain-speed designs, and (3) cost/benefit analyses of the optimum number and location of tempering section(s) and grain inverter(s). Mixed-Flow Dryer Development Needs The optimum shape, size and location of the inlet and outlet air ducts in the drying bed of a mixed-flow grain dryer have not been established. Nor has an adequate two-dimensional model been developed for this dryer type. Future mixed-flow dryer development needs include: (1) designs minimizing the non-uniformity of the drying treatment and of the single kernel moisture contents, (2) improved design of the shape, size and location of the air ducts, and (3) cost/benefit analyses of the optimum number and location of tempering section(s). Concurrent Flow Dryer Development Needs Less research is available on CCF dryers than on CF and MF types. Excessive power consumption is frequently listed as one of the CCF's disadvantages, along with its perceived need of requiring insulation. Future concurrent-flow dryer development needs include: (1) designs minimizing power consumption, (2) automatic control of multi-stage dryers, and (3) cost/benefit analyses of a pre-cooler tempering section and of dryer insulation. In summary, the bottom line for dryer design will be demand leading the supply. In other words, regulations and the quality demands of elevators and processors will force dryer companies to manufacture highly efficient, cost-effective, and innovative new dryers. In the short-term many of the currently available options for crossflow dryers such as turning devises, tempering zones, moisture-based controllers, full heat drying, and multiple stages will become standard features. Additionally, there will be more slow cooling applications, and an increased utilization of mixed flow dryers. References Brook, R. C. 1992. Drying cereal grains. In: Storage of cereal grains and their products.
D. B. Sauer (ed.). American Association of Cereal Chemists, St. Paul, Minnesota: pp. 183-218.

GEAPS FDC July 28-31, 2002
31
Brooker, D. B., Bakker-Arkema, F.W., and Hall, C.W. 1992. Drying and storage of grains and oilseeds. Van Nostrand Reinhold, New York, New York.
Cnossen, A.G. and Siebenmorgen, T.J. 2000. The glass transition temperature concept in rice drying and tempering; effect on milling quality. Transactions of the ASAE. 43(6):1661-1667.
Krischik, V., Cuperus, G., and Galliart. D. 1995. Stored product management. Publication E-912, Cooperative Extension Service, Oklahoma State University, Stillwater, OK.
Lasseran, J. and Courtois, F. 1993. A CAD software to improve the heat energy efficiency of mixed-flow maize dryers. CESA/FAO Conference, Porto Alegre, Brazil.
Liu, Q. 1993. Study on the drying mechanism, simulation and testing of the mixed-flow grain dryer. Unpublished Ph.D. dissertation, Beijing Agricultural Engineering University, Beijing, China.
Liu, Q. and Bakker-Arkema, F.W. 1997. Stochastic simulation and control of grain quality in crossflow grain dryers. Paper No. 97-6030. ASAE, St. Joseph, MI.
Maier, D.E. and Bakker-Arkema, F.W. 1995. State-of-the-art and future research needs of off- farm grain drying. Paper No. 95-6133. ASAE, St. Joseph, MI.
Maier, D.E. and Watkins, A.E. 1998. Drying of white food corn for quality. Grain Quality Fact Sheet 34, Cooperative Extension Service, Purdue University, West Lafayette, IN.
McMorris, J. 2002. Drying small grains and cereals. Proceedings of GEAPS Exchange 2002. Grain Elevator & Processing Society, Minneapolis, MN.
Montross, M. D., Bakker-Arkema, F.W., Leppanen, C.L., and Hines, R.E. 1994. Moisture content variation and grain quality of corn dried in different high-temperature dryers. Paper No. 94-6590. ASAE, St. Joseph, MI.
Montross, M.D. and Maier, D.E. 2000. Simulated performance of conventional high-temperature drying, dryeration, and combination drying of shelled corn with automatic conditioning. Transactions of the ASAE. 43(3):691-699.
Singh, P.P. 2001. Modeling of fluid transport and thermomechanical stresses in soybeans. Unpublished Ph.D. Dissertation, Purdue University, West Lafayette, IN.
Acknowledgement The authors would like to thank Mr. Ricardo Bartosik, Graduate Research Assistant, Department of Agricultural & Biological Engineering, Purdue University; Dr. Q. Liu, Research Engineer, and Dr. David Morrison, Vice President of GSI Commercial Dryers, The GSI Group, Assumption, Illinois; and Mr. Harmon Towne, Vice President, Sales & Marketing, CTB Brock, Milford, Indiana for reviewing this manuscript and for providing numerous suggestions for improvement.

GEAPS FDC July 28-31, 2002
32
Table 1. Maximum recommended moisture contents for aerated grain storage in various regions of the United States.
Grain Type and Storage Time
Maximum Moisture Content for Safe Storagea (Percent Wet Basis)
South Central North Shelled corn and sorghum sold as #2 by spring stored 6 to 12 months stored more than 1 year Soybeans Sold by spring Stored 6 to 12 months Stored more than 1 year Wheat, oats, barley, rice Stored up to 6 months Stored 6 to 12 months Stored more than 1 year Edible beans Stored up to 6 months Stored 6 to 12 months Stored more than 1 year
14 13 12
13 12 11
12 11 10
14 12 10
14.5-15 13.5-14
13
14 12 11
13 12 11
15 13 11
15-15.5 14-14.5
13
14 13 12
14 13 12
15 14 12
aValues for good quality, clean grain and aerated storage. Reduce one percent for poor quality grain, such as grain damaged by blight, drought, etc. Reduce each entry by two percent for non-aerated storage. ____________ Adapted from Krischik et al. (1992) E-912, Oklahoma State University
Table 2. Available energy and heat conversion efficiency for fuels commonly used for grain drying.
Fuel Available Energy Conversion Efficiency (%) Electricity Fuel Oil #2 LP gas Natural gas
3,414 – 3,412 Btu/kWh 142,000 – 137,000 Btu/gal
96,000 – 91,500 Btu/gal 100,000 Btu/Therm or 1000 Btu/ft3
95 60 85 95
Table 3. Natural gas consumption (Therms/h) per one bushel of wet corn into a high-capacity dryer for various energy efficiencies and moisture content ranges.
Energy Efficiency, Btu/lb water evap Moisture Reduction Range
1500
2000
2500
3000
3500
4000
25 to 15%
0.099
0.132
0.165
0.198
0.231
0.264

GEAPS FDC July 28-31, 2002
33
20 to 15% 0.050 0.066 0.083 0.099 0.116 0.132
Table 4. Maximum grain kernel temperature limits.
Limit Grain End Use ºF ºC
Seed 100-110 38-43 Dry Milling 100-110 38-43 Wet Milling 130-140 54-60
Corn
Feed Use 160-180 71-82 Popcorn Snack Food 100 38
Seed (>24% MC) 110 43 Seed (<24% MC) 120 49 Flour 120-150 49-66 1 & 2 Canadian Western Red Spring 135-150b 57-66b 3 Canadian Western Red Spring 150-170b 66-77b Canadian Prairie Spring Red & White 150-170b 66-77b Canadian Winter Wheat 150-170b 66-77b
Wheat
Feed Use 165-185b 74-85b 1 & 2 Canadian Western Amber 135-145b 57-63b 3 & 4 Canadian Western Amber 150-170b 66-77b
Durum
5 Canadian Western Amber 165-185b 74-85b Malting 105-120b 41-49b Barley Feed 165-185b 74-85b
Oats Flour/Feed 145-175b 63-79b Milling (>20% MC) 105 40 Rice Milling (<20% MC) 110 44 Seed 100a 38 Soybeans Oil Crushing 120 49
Canola Oil Crushing 105-120b 41-49b Flax Oil Crushing 100-120b 38-49b
Food 140-170 60-77 Sunflower Oil Crushing 170-195 77-91 Edible 125-150b 52-66b Peas Feed 125-150b 52-66b
Beans Edible 100a 38 aRelative humidity should be kept above 40% to reduce seed coat cracking bHeat chart values presented by McMorris (2002) were drying air temperature recommendations for mixed flow dryers, and were reduced by 15ºF for the purpose of this table. __________ Adapted from Brook (1992), McMorris (2002) and Maier & Watkins (1998)

GEAPS FDC July 28-31, 2002
34
Table 5. Breakage susceptibility of different corn hybrids after hand shelling and drying at 75ºF (24ºC).
Genotype Breakage Susceptibility (%) FRB 73 x FR 18 FRB 73 x PA 91 FRB 73 x FR Mo FR Mo 17 x FR 634
23.5 10.5 7.5 4.3
Brooker et al. (1992)
Table 6. Effect of moisture reduction during drying at 160ºF (71ºC) on the stress crack development of corn.
Moisture Reduction (%) Kernels with Multiple Stress Cracks (%) 22 to 18 22 to 16 22 to 14
5.0 86.9 100.0
Source: Brooker et al. (1992)
Table 7. Effect of drying method, drying air temperature, hybrid and initial moisture content (MCin) on percent kernels with stress cracks.
Variety I 21% MCin
Variety II 26% MCin
Low Temperature High Temperature and Fast Cooling High Temperature and Slow Cooling
110ºF (43ºC) 140ºF (60ºC) 180ºF (82ºC) 140ºF (60ºC) 180ºF (82ºC) 210ºF (99ºC)
3 74 64 73 13 15 8
1 37 37 28 8 6 5
Adapted from Brown et al. (1979) Cereal Chemistry 56:529.

GEAPS FDC July 28-31, 2002
35
Table 8. Drying capacity (bushels/hour) per bushel of grain in the drying section of a commercial crossflow tower dryer as a function of airflow rate and drying air temperature.
Drying Capacity
(bu/hr per bu of grain in the drying section)
Drying Section Airflow
(CFM/bu) 180ºF 190ºF 200ºF 210ºF 220ºF 45 1.00 1.06 1.12 1.18 1.24 50 1.07 1.14 1.21 1.28 1.35 55 1.14 1.22 1.30 1.37 1.44 60 1.21 1.30 1.38 1.46 1.53 65 1.28 1.37 1.46 1.54 1.62 70 1.34 1.44 1.53 1.61 1.70 75 1.39 1.49 1.59 1.69 1.78 80 1.45 1.56 1.67 1.76 1.86 85 1.50 1.61 1.72 1.83 1.93 90 1.55 1.67 1.78 1.89 1.99 95 1.60 1.72 1.84 1.95 2.06 100 1.64 1.77 1.89 2.01 2.12 105 1.69 1.82 1.94 2.06 2.18 110 1.73 1.86 1.99 2.12 2.24 115 1.76 1.90 2.04 2.17 2.29 120 1.80 1.94 2.09 2.22 2.34 Source: The GSI Group, Assumption, Illinois

GEAPS FDC July 28-31, 2002
36
Table 9. List of criteria for selecting a high-capacity grain dryer.
Rated capacity (at 5, 10, 15 points) Grain column width
Fixed dryer cost Fan HP -drying zone
Fixed cost per bushel capacity Fan HP -cooling zone
Erection time and costs Total dryer HP
Foundation size and costs Grain types to be dried
Freight costs Grain quality characteristics
Operating dryer costs Required grain cleanliness
Specific energy consumption Fuel type
Maintenance schedule and costs Dryer dimensions
Insurance costs Dryer controls
Grain-holding capacity Required operator expertise
Fan characteristics Ease of start-up
Airflow - drying zone Ease of shut-down
Airflow - cooling zone Manufacturer's service record
Static pressure - drying zone Service life
Static pressure - cooling zone Personal preference
Table 10. The average effect of dryer type on the drying-air temperature, the maximum
grain temperature, and the percentage of stress-cracked kernels in maize.
Dryer Type
Drying-Air
Temperature
ºF (°C)
Maximum Grain
Temperature
ºF (°C)
Stress-Cracked
Kernels
(%)
Crossflow
Mixed-Flow
Concurrent-Flow
176-230 (80-110)
212-266 (100-130)
392-545 (200-285)
176-230 (80-110)
158-212 (70-100)
140-176 (60-80)
70-85
40-55
30-45
Source: Montross et al. (1994)

GEAPS FDC July 28-31, 2002
37
Table 11. Typical specifications of a conventional crossflow corn dryer employed in drying corn from 25% to 15% (w.b.). Width of grain column 10-18 inches 0.25-0.45 m
Length of drying column 10-100 ft 3-30 m
Length of cooling column 3-30 ft 1-10 m
Airflow rate 80-135 cfm/bu 80-135 m3/ min tonne
Static pressure 2-5 inches 0.5-1.2 kPa
Drying temperature (for maize) 180-230ºF 80-110ºC
Retention time (10-point removal) 2-3 h 2-3 h
Specific energy consumption 2,600-4,000 BTU/lb 6-9 MJ/kg
Table 12. Long-term change in the average moisture content (MC), moisture content range, percentage point differential, and standard deviation (SD) in individual corn kernels after high temperature drying and subsequent storage in a 60,000 bushel (1500 tonne) bin under Michigan conditions (Initial storage date: November 30, 1993).
Date Average MC (%)
MC Range (%)
Point Differential
Standard Deviation
11/30/93 14.5 9.0 - 30.5 +21.5 3.75
1/10/94 16.4 11.0 - 18.5 +7.5 1.30 2/17/94 15.2 11.0 - 17.5 +6.5 1.06
3/22/94 13.6 10.0 - 15.0 +5.0 1.15 4/25/94 13.2 10.5 - 15.5 +5.0 1.07
Source: Montross et al. (1994)

GEAPS FDC July 28-31, 2002
38
Table 13. Average moisture content (MC), moisture content range, percentage point differential, and standard deviation (SD) in maize kernels collected at the inlet and outlet of commercial crossflow (CF), concurrent-flow (CCF), and mixed-flow (MF) dryers.
Inlet Dryer Type Average MC
(%) MC Range
(%) Point
Differential Standard Deviation
CF 20.8 10.0 – 33.1 +23.1 3.92
CCF 21.7 14.5 – 37.5 +23.0 4.42 MF 22.4 8.5 – 38.5 +30.0 4.23
Outlet
Dryer Type Average MC (%)
MC Range (%)
Point Differential
Standard Deviation
CF 15.0 8.5 – 31.5 +23.0 4.82 CCF 14.7 7.0 – 34.0 +27.0 4.57 MF 14.8 8.0 – 35.5 +27.5 4.19
Source: Montross et al. (1994)
Table 14. Average percent stress-cracked kernels by type, and total percent stress-cracked kernels of maize dried in commercial concurrent-flow (CCF), mixed-flow (MF) and crossflow (CF) dryers.
Dryer Type
None (%) Single (%)
Multiple (%)
Checked (%)
Total (%)
CF 11.3 3.4 38.6 45.8 87.8 CCF 47.6 5.8 27.1 19.7 52.6
MF 32.0 8.0 32.5 25.0 65.5 Source: Montross et al. (1994)

GEAPS FDC July 28-31, 2002
39
Table 15. Moisture content gradient in grain columns of a conventional crossflow dryer after drying corn from 25.5% to 16.0% (w.b.) before and after fast cooling.
Moisture Content Gradient Air Temp
ºF (ºC) After Heating
(%) After Cooling
(%) 180 (82) 9.7 8.6 230 (110) 14.2 12.2 280 (138) 19.4 16.6
Source: Brooker et al. (1992)
Table 16. Grain temperature, moisture content, and breakage susceptibility at different locations in grain columns of a conventional crossflow dryer after drying corn without cooling from 25.5% to an average of 19% (w.b.) at 230ºF (110ºC).
Distance from Air Inlet inches (cm)
Grain Temp. ºF (ºC)
Moisture Content (% w.b.)
Breakage Susceptibility (%)
0.5 (1.3) 215 (101) 10 48 3.0 (7.6) 172 (78) 20 11 5.5 (14.0) 124 (51) 24 10
Source: Brooker et al. (1992)
Table 17. Effect of the average final moisture content on breakage susceptibility of 25% moisture content (w.b.) corn dried in a conventional crossflow dryer at 230ºF (110ºC).
Final Average Moisture Content (% w.b.)
Breakage Susceptibility
(%) 18 11 15 18 13 27 11 39
Source: Brooker et al. (1992)

GEAPS FDC July 28-31, 2002
40
Table 18. Specifications of a modified crossflow dryer with reverse airflow (suction) cooling.
Airflow heat section 69 cfm/bu 79 m3/min/t Airflow cooling section 132 cfm/bu 147 m3/min/t Column width 12 in 0.3 m Grainflow at 5 point moisture removal 85.3 ft/h 26.8 m/h Recommended drying air temperature 180ºF 82ºC Rated capacity 20-15% MC 5,000 bu/hr 127 t/h Retention time at rated capacity 1 hr 1 h Burner capacity 54.2 mio Btu/hr 57.2 mio kJ/h Fuel type Natural gas Natural gas
Source: Brooker et al. (1992)
Table 19. Operating conditions of a conventional versus modified crossflow dryer drying corn from 25% to 15% (w.b.) at the same grainflow rate and a maximum corn kernel temperature of 140ºF (60ºC).
Dryer Type
Drying Air Temperature
ºF (ºC)
MC Gradient (% w.b.)
Energy Efficiency
Btu/lb (MJ/kg) Conventional 154 (68) 5.0 3000 (6.9) Modified 149 (65) 1.3 2100 (4.9)
Source: Brooker et al. (1992)

GEAPS FDC July 28-31, 2002
41
Table 20. Specifications of a mixed-flow dryer for the drying of maize from 30.0% to 15.0% (w.b.).
Depth of drying/cooling bed 10 inches 0.25 m
Total number of drying/cooling beds 64 64
Number of drying beds 48 48
Number of cooling beds 16 16
Horizontal cross-section 108 ft2 10 m2
Airflow 150 lb/h/ft3 2,400 kg/h/m3
Drying-air temperature 248ºF 120ºC
Energy input 10.5 mio Btu/lb 24,335 MJ/kg
Energy efficiency 2322 Btu/lb 5.4 MJ/kg
Dryer capacity 840 bu/h 21 t/h
Source: Lasseran & Courtois (1993)

GEAPS FDC July 28-31, 2002
42
Table 21. Specifications of a commercial 3-stage concurrent-flow dryer for the drying of maize from 25.5% to 15.5% (w.b.). Dryer holding capacity 7900 bu 197 tonne
Bed cross-sectional area 144 ft2 13.4 m2
Bed depth drying stages 2.6 ft 0.8 m
Bed depth cooling stage 5 ft 1.5 m
Bed depth tempering zones 15 ft 4.5 m
Airflow drying stage one 164 cfm/ft2 50 m3/m2/min
Airflow drying stage two 148 cfm/ft2 45 m3/m2/min
Airflow drying stage three 115 cfm/ft2 35 m3/m2/min
Airflow cooling stage 98 cfm/ft2 30 m3/m2/min
Air-temperature drying stage one 545ºF 285ºC
Air-temperature drying stage two 473ºF 245ºC
Air-temperature drying stage three 374ºF 190 ºC
Natural gas usage 28,605 ft3/h 810 m3/h
Total electrical power 188 kW 188 kW
Energy efficiency 1,720 Btu/lb 4.0 MJ/kg
Dryer capacity 2,400 bu/h 60 t/h
Source: Brooker et al. (1992)
Table 22. Average kernel moisture content and moisture content range of 50 kernels on an ear of an early and late variety maize in the Midwestern U. S.
Late Variety Early Variety
Location Average MC MC Range Average MC MC Range
Tip
Middle
Butt
18.1
25.0
25.8
13.0-25.0
13.5-33.5
15.5-36.5
15.4
16.1
17.0
13.5-16.5
15.0-19.5
15.0-21.5
Source: Montross et al. (1994)

GEAPS FDC July 28-31, 2002
43
Figure 1. Schematics of the four major types of high-temperature grain dryers: crossflow, counterflow, concurrent- flow, and mixed-flow.

GEAPS FDC July 28-31, 2002
44
Figure 2. Moisture and temperature changes during: (a) crossflow drying; (b)
concurrent- flow drying; (c) counterflow drying; and (d) mixed-flow drying.

GEAPS FDC July 28-31, 2002
45
Figure 3. Conventional crossflow dryer with forced-air drying and cooling.
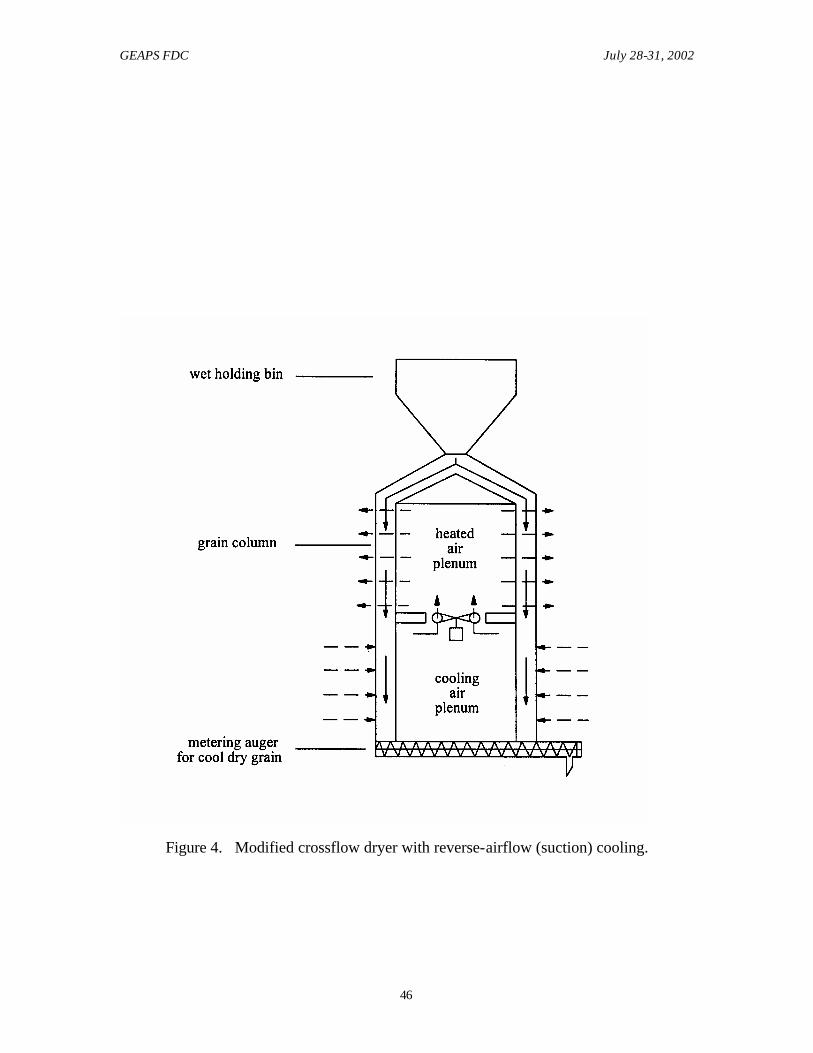
GEAPS FDC July 28-31, 2002
46
Figure 4. Modified crossflow dryer with reverse-airflow (suction) cooling.

GEAPS FDC July 28-31, 2002
47
Figure 5. Commercial modified crossflow dryer with grain exchanger and reverse-
airflow cooling.

GEAPS FDC July 28-31, 2002
48
Figure 6. Modified crossflow dryer with multiple grain exchangers.

GEAPS FDC July 28-31, 2002
49
Figure 7. Schematic of a mixed-flow grain dryer.

GEAPS FDC July 28-31, 2002
50
Figure 8. A mixed-flow grain dryer. (Source: Cimbria Unigrain, Ltd., Denmark)

GEAPS FDC July 28-31, 2002
51
Figure 9. Two-stage concurrent-flow dryer with counterflow cooler, tempering section,
and air recirculation of the cooling air and part of the drying air.

GEAPS FDC July 28-31, 2002
52
(a)
(b)
(c)
Figure 10. Combination drying system utilizing medium temperature drying and (a) in-
bin cooling, (b) dryeration, and (c) two-stage in-bin natural air/low
temperature drying.

GEAPS FDC July 28-31, 2002
53
Figure 11. Moisture distribution before and after drying of corn in a crossflow dryer;
average inlet MC=30.3% (d.b.), average outlet MC=17.2% (d.b.). (Source:
Bakker-Arkema and Maier, 1995).