graduation presentation
TRANSCRIPT

Financial Analysis for

Agenda Of The Presentation
• KPMG contract with STC
• Telecom Industry In SA
• STC Under Focus
• STC Financial Analysis
• Recommendations

–Report on Revenue Leakage–Completion of Billing cycle report.–Policies and procedure manual.–Job descriptions.–Roles and responsibilities.
• KPMG contract Included :

Telecom Industry In SA

Telecom Industry In SA
Expected Expansion..
Initial approval for 3 additional operators that is expected to go public via an IPO

Telecom Industry In SA

STC UNDER FOCUS

• “As leaders in a world of constant change, we strive to exceed our customers 'expectations so that, together, we reach new horizons”
STC UNDER FOCUS
Honesty Respect Commitment Initiative Cooperation Loyalty
Mission:
Values:

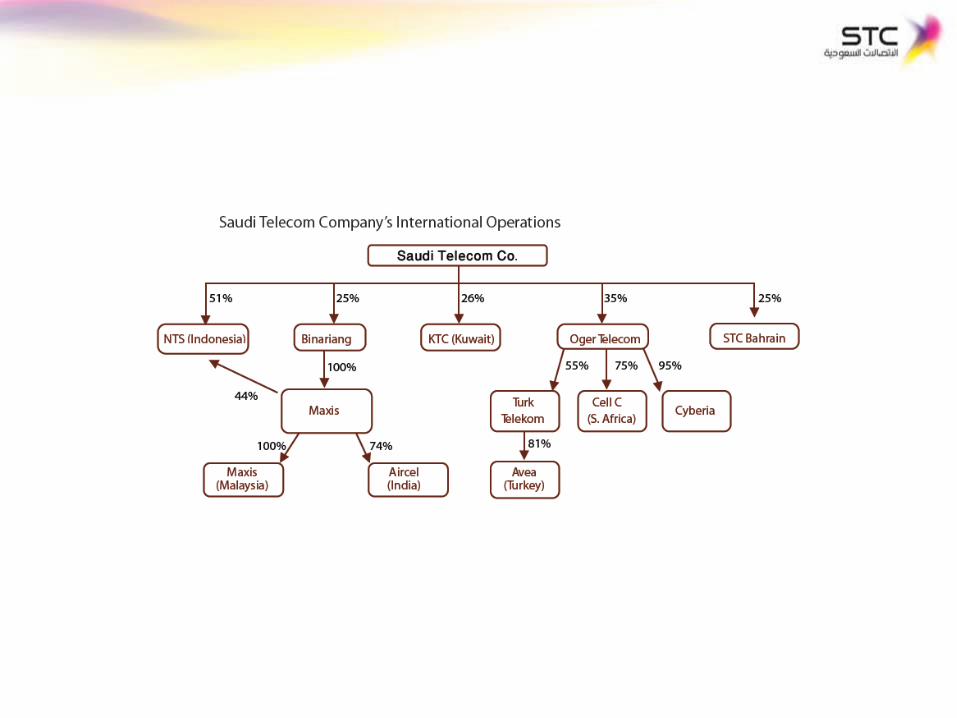
STC Profile
- Largest telecom operator in the MENA region- Over 19,500 employees- 98% coverage of populated areas and highways- 19 million mobile subscribers, 4.1 million fixed subscribers and over 1million Broadband subscribers as at 31stDec. 2008


Financial Analysis

Liquidity Ratios
The Current ratio = Current Assets/Current liabilities
A part of surplus cash is invested in Murabaha deals with maturity periods of 90 days or less with Several local banks
Quick ratio= (current assets-inventories)/current liabilities

Net working capital = current assets – current liabilities Cash ratio = (Cash + Marketable securities)/ Current liabilities

The profitability Ratios
Gross Profit Margin= Gross Profit / Sales Net Profit Margin= Net Income/Sales
The increased currency losses and tax provisions were mainly due to increased international operations of STC through its subsidiaries

Return on Total Assets= EBIT / Total Assets
1- Increasing competition in the domestic GSM market.
Return on Equity= Net Income/Total Equity
2- the increase in the operating expenses.

The Payout Ratio = Div./Net Income The Plowback Ratio = 1 – Payout Ratio
Growth in Equity = Plowback ratio * ROE

HAJJ EFFECT ON PROFITABILITY
Mobily vs. STC : 3 million pilgrimages come to SA, Roaming revenues increase

The leverage Ratios
Equity Multiplier = Total Assets/ Total Equity Debt Ratio = Total Liabilities/Total Assets
Debt to Equity = Total Liabilities/ Equity

Efficiency Ratios
Assets Turnover = Sales / Average Total Assets
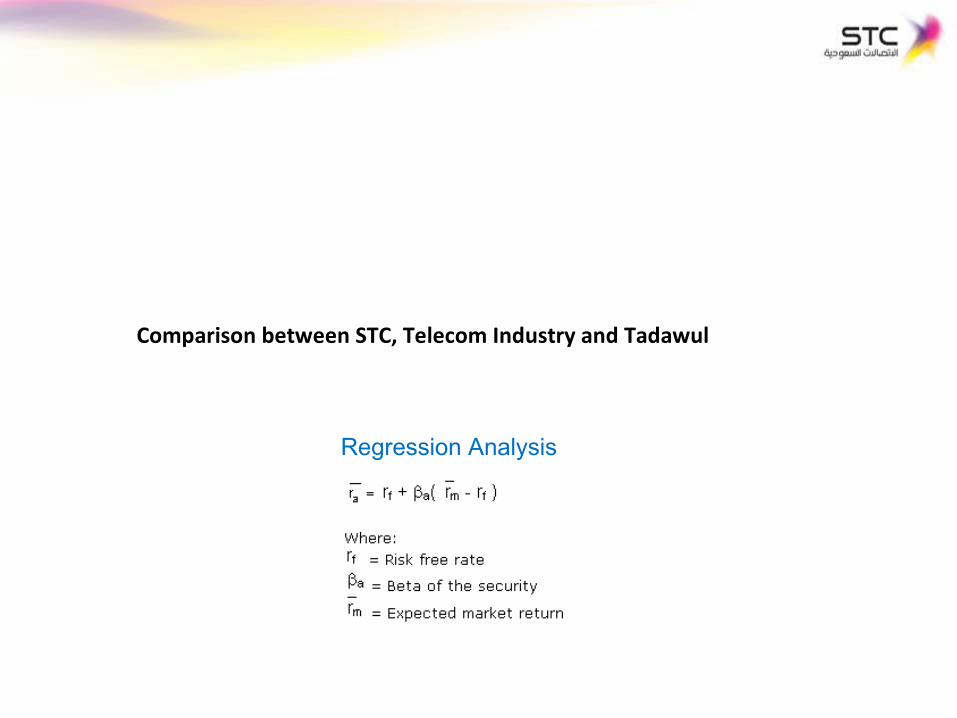
Comparison between STC, Telecom Industry and Tadawul
Regression Analysis

STS Regression vs. TASI
SUMMARY OUTPUT
Regression Statistics
Multiple R 0.567966
R Square 0.322586
Adjusted R Square 0.320557
Standard Error 1.341974
Observations 336
ANOVA
df SS MS F Significance F
Regression 1 286.4344 286.4344 159.0513 4.31944E-30
Residual 334 601.4983 1.800893
Total 335 887.9327
CoefficientsStandard
Error t Stat P-value Lower 95% Upper 95% Lower 95.0% Upper 95.0%
Intercept -0.12631 0.073395 -1.72091 0.086193 -0.27068233 0.01806835 -0.270682334 0.01806835
X Variable 1 0.692213 0.054887 12.61155 4.32E-30 0.584245201 0.80018173 0.584245201 0.80018173

Telecom Industry's Regression vs. TASI
SUMMARY OUTPUT
Regression Statistics
Multiple R 0.774565529
R Square 0.599951759
Adjusted R Square 0.59875401
Standard Error 0.731796062
Observations 336
ANOVA
df SS MS F Significance F
Regression 1 268.2443414 268.2443 500.8993 2.0072E-68
Residual 334 178.8655093 0.535525
Total 335 447.1098506
Coefficients Standard Error t Stat P-value Lower 95% Upper 95% Lower 95.0% Upper 95.0%
Intercept -0.034387424 0.040023445 -0.85918 0.390856 -0.11311722 0.044342 -0.1131172 0.04434237
X Variable 1 0.66987345 0.029930746 22.38078 2.01E-68 0.61099692 0.72875 0.61099692 0.72874998

Recommendations & Conclusion

1- The mechanism of choosing managers, employees in STC must be developed
2- More Focus on the local market
3- I expect Mobily is going to beat STC more on the market share side, taking advantage of the internal systematic problems in STC
4- From 1998 until now, STC monopolizes the Saudi wired line voice operations. The introduction of 3 new fixed line licenses will negatively affect STC’s wired line revenues

Thank you for listening

Q & A