graduate tacoma 2016 community impact report
TRANSCRIPT

Building and strengthening Tacoma’s community-wide movement tohelp every student achieve success from cradle to college and career.
2016 Community Impact Report

Tacoma’s Community-Built GoalBy the Class of 2020, WE WILL increase by 50% both the
graduation rate of Tacoma Public Schools students and those
who complete a college degree or technical certificate. Success will
require measuring and closing gaps in access, opportunities, and
achievement for all students from cradle to college and career.
50%
photo quality issue (need higher res.)

1
Community Compass for Student SuccessThe 2016 Student & Community Impact Report isn’t just a technical report we release once a year. It’s our community’s compass, giving us the strategic direction to keep improving student success every day.
Since 2013, the Graduate Tacoma community movement has used this annual guide to measure student progress and help parents, educators, and the community adapt to these constant changes and align shared strategies, youth programs, community initiatives, systems, and resources. Our student and community indicators highlight what’s working and what should be brought to scale, as well as challenges that require more intentional focus to close gaps in access, opportunities, and student achievement.
I’d like to extend a special thanks to our Community Partners and the Collaborative Action Networks that contributed to this report and inspire our collective work every day. Also, thank you to Tacoma Public Schools for their commitment to authentic community partnership, and alignment with our student and community indicators.
As you’ll read in the coming pages, we are making great strides, but there’s still much to be done and it will take a sustained community-wide commitment to realize our shared goal.
Thank you all for your partnership. Together, WE WILL Graduate Tacoma!
Eric WilsonPresident & CEOFoundation for Tacoma Students
Helping EVERY child achieve success – from
cradle to college and career.
2016 Community Impact Report
Tacoma’s Community-Built GoalIntroduction .....................................................................1
Graduate Tacoma! About Graduate Tacoma! ...........................................2 Collective Impact .......................................................3 Tacoma by the Numbers ............................................4
Action Networks Early Learning & Reading ..........................................8 Out of School & Summer Learning ..........................10 College Bound Support ...........................................12
Student Indicators Cradle to Career ......................................................14 EARLY LEARNING Developmental Screening .................................17 Participation in Quality Preschools ...................18 ELEMENTARY SCHOOL Ready for Kindergarten .....................................20 Third Grade Reading ........................................21 MIDDLE SCHOOL Sixth Grade Achievement .................................23 Eighth Grade Math ............................................24 HIGH SCHOOL Ninth Grade Achievement .................................26 College Entry Exams ........................................27 High School Graduation ....................................28 COLLEGE AND TECHNICAL SCHOOLS College Enrollment ...........................................31 College Completion ..........................................32
Community Indicators High Expectations ....................................................34 Out of School & Summer Learning ..........................35 Attendance...............................................................36 Parent & Family Engagement ..................................37 Social-Emotional Support ........................................38 Safe & Healthy Environment....................................38
Thanks to You .........................................................39 Community Partners ................................................40
Get Involved ............................................................41

2
Vision:A Tacoma where every child succeeds in school, career, and life.
Mission:To build and strengthen Tacoma’s community-wide movement to help every child achieve success from cradle to college and career by aligning goals, data, resources, and partners.
Values:
About Graduate Tacoma!
More than two-thirds of the experiences and learning opportunities that shape a child’s life occur outside of the classroom. Graduate Tacoma is taking a community-wide approach to ensure that every child has access and opportunities for quality learning. Kids need the community at different times. Graduate Tacoma is about reaching them when and where they need us.
Why it Matters5-YEAR EXTENDED HIGH SCHOOL GRADUATION RATE100%
90%
80%
70%
60%
50%58%
2014-152013-142012-132011-12 2010-11
67% 69%
77%
82.5% 87%
2020
GOA
L
EquityWe believe every child has the capacity to be successful with the right resources and support.
TransparencyWe share data and information to influence and improve outcomes for our youth.
AccountabilityWe trust in collective ownership and shared responsibility.
CollaborationWe believe in collaboration as the best pathway to achieving our goals.
InclusionWe are strengthened by diversity and inclusive of all community voices.
Boldness & CourageWe are ambitious because our community deserves nothing less.
InnovationWe test and try new ideas and actions.
OptimismWe celebrate Tacoma as a place people choose to live, learn, and lead.

3
We build and strengthen Tacoma’s community-wide movement to help every child achieve success from cradle to college and career.
Build Shared Community Goal Forge and keep focus on our community-built 2020 goal to increase, by 50%, both the high school graduation and college or technical school completion rates and close gaps in access, opportunities, and achievement.
Measure Student & Community Indicators Collect, share, and analyze data with the community around a common set of “cradle to career” measures. The data guides evidence-based decision making and collective action, helping identify what’s working, fix what’s not, and reach the students in greatest need.
Organize Collaborative ActionOrganize the power of shared goals, aligned strategies, and results-based actions to advocate and impact student success through three Collaborative Action Networks; Early Learning & Reading,Out of School & Summer Learning, and College Bound Support.
Align Resources & SustainabilityCoordinate with community partners to initiate or redirect resources – time, talent and treasure – toward data-to-action practices on a continuous basis and engage the collective community to ensure long-term sustainability.
Collective Impact – It’s What We DoIn 2010, just over half (55%) of Tacoma students were graduating from high school. USA Today featured Tacoma schools under the shameful headline, “Dropout Factories.” No one person or organization, working alone, could achieve the large-scale changes our children needed.
The Tacoma community came together like never before. Graduate Tacoma was born. We demanded a different way forward, built on high expectations, informed by transparent student and community data, grounded in shared responsibility, and guided by an unwavering belief in the potential of every child.
Today, the community-wide movement is nearly 200 Community Partners strong from every neighborhood in our city. We are parents and educators, early learning and higher education, youth and community service, business and labor, civic and philanthropic, government and communities of faith.
Together, we are proving poverty is not destiny. By the Class of 2015, the 4-year on time graduation rate hit a record-high 82.6%, despite nearly two-thirds of our students living in poverty. And the college enrollment rate for the 4-year cohort increased by 30 percent from 33% to 43% since 2010. Together, we are showing our children that Tacoma is their “City of Destiny.”
Our Story

4
Stud
ent P
rofil
eC
ity P
rofil
ePoverty is NOT Destiny
Tacoma “City of Destiny”
29,439 K-12 STUDENTS
34,930 STUDENTS when factoring highly mobile students entering and leaving during school year
1,782PRESCHOOL STUDENTSEnrolled in one of 33TPS Preschools
64% STUDENTS IN POVERTYHighest % in Poverty in WA of10 largest Districts
58% MAJORITY STUDENTS OF COLORMost multi-ethnically diverse in WA
14% SPECIAL EDUCATION STUDENTS
10% TRANSITION BILINGUAL STUDENTS
82.6%CLASS OF 2015 H.S. GRADUATION RATERecord-high, 5th year of gains since 55% in 2010
61% TOTAL GRADUATES IN 2013 HEADED TO COLLEGE Graduating Seniors (regardless of cohort)
43% CLASS OF 2013 ENROLLED IN COLLEGE (Students in Class beginning in 9th Grade)
39% COMPLETING COLLEGE 4th year of gains from 31% in 2010
“3rd”LARGEST CITY IN WASHINGTON
205,159PEOPLE IN TACOMA
135,190JOBS IN TACOMA
3,928CHILDREN BORN IN 2014
20BIRTHRATE PER 1,000 POPULATION
40% PEOPLE OF COLOR
21% FAMILIES WITH CHILDREN IN POVERTY
8 COLLEGES & UNIVERSITIES (Tacoma & Pierce Co.)
30,000+ STUDENTS ENROLLED IN
LOCAL COLLEGES & UNIVERSITIES
$51,269MEDIAN HOUSEHOLD INCOME($60,294 Washington State)
51% HOME OWNERSHIP RATE
26% ADULTS WITH COLLEGE DEGREE
10% SINGLE PARENT HOUSEHOLDS
!!!
Multi-Racial 6.5%Native American 1.5%Paci�c Islander 1%
Hispanic11%
Black11%
Asian 8%White 60% Peopleof Color
40%
White60%
Multi-Racial 6%Native American 1%Paci�c Islander 2.6%
Hispanic 18%Black 19%
Asian 18%
White 42%
Studentsof Color
58%
WhiteStudents
42%
*
Data sources: American Community Survey, Employment Security Department, U.S. Census
Data sources: ERDC. OSPI, Tacoma Public Schools
* Poverty measured by students who qualify for free & reduced lunch. **This number is an estimate- ERDC reports the % of h.s. graduates in a given year who enroll in post-secondary education (total students who received a diploma, independent of cohort). In order to estimate the % of students overall (not just h.s. graduates) who enroll in post-secondary education, we multiply the % of TPS grads enrolling in college (cohort independent) by the 4-year grad rate (cohort dependent). Assuming that the % of h.s. grads who enroll in college in a given year is roughly equivalent, regardless of their particular cohort, this is a fairly accurate approximation.
**

5
Tacoma Public School District
Larger Districts by Comparison
District Profile
Other D
istricts
SeattleTacoma
Spokane
WASHINGTON
#3 3RD LARGEST DISTRICT ENROLLMENT
1,842 CLASSROOM TEACHERS
95% CLASSES TAUGHT BY “HIGHLY QUALIFIED” TEACHERS
63% TEACHERS WITH MASTER’S DEGREE OR MORE
8 HIGH
SCHOOLS
10 MIDDLE
SCHOOLS
35 ELEMENTARY
SCHOOLS
33 PRESCHOOLS, MOST WITHIN
ELEMENTARY SCHOOLS
1 HIGH SCHOOL
RE-ENGAGEMENT CENTER
71%RECORD-HIGH VOTERS SUPPORTING LAST SCHOOL IMPROVEMENT BOND (2013)
TOTAL POPULATION
TACOMA 205,000
SEATTLE 668,000
SPOKANE 212,000
STUDENT ENROLLMENT
TACOMA 29,348
SEATTLE 51,918
SPOKANE 29,355
MEDIAN HOUSE VALUE
TACOMA $207,000
SEATTLE $437,000
SPOKANE $158,000
STATE $257,000
MEDIAN HOUSEHOLD INCOME
TACOMA $51,000
SEATTLE $67,000
SPOKANE $42,000
STATE $60,000
% ADULTS (25+) WITH COLLEGE DEGREE
TACOMA 25.5%
SEATTLE 57.2%
SPOKANE 28.6%
STATE 32.3%
% FAMILIES IN POVERTY WITH CHILDREN
TACOMA 21.1%
SEATTLE 11.2%
SPOKANE 20.0%
STATE 15.0%
% SINGLE PARENT HOUSEHOLDS
TACOMA 10.3%
SEATTLE 4.8%
SPOKANE 9.9%
STATE 8.4%
HIGH SCHOOL GRADUATION RATE
TACOMA 82.6%
SEATTLE 77.0%
SPOKANE 84.5%
STATE 78.0%
% 4-YEAR COHORT ENROLLING IN COLLEGE (Class of 2013)
TACOMA 43%
SEATTLE 53%
SPOKANE 46%
STATE 47%
67%VOTERS SUPPORTING LAST SCHOOL OPERATIONS LEVY (2014)
Tacoma by the Numbers
Data sources: OSPI, Tacoma Public Schools
Data sources: OSPI, ERDC,American Community Survey, U.S. Census

6
Collaborative Action Networks
Programs and services for young people have served Tacoma and
communities throughout the country for generations.
We have seen hundreds of individual programs, organizations, and
initiatives work to solve overlapping local challenges. These efforts
have traditionally fought for the same resources with mixed results.
Graduate Tacoma is different. Organizations providing youth services are
working together to achieve a greater collective impact.

7
There is powerful synergy when organizations embrace alignment. Graduate Tacoma currently has three
stakeholder groups, called collaborative Action Networks, actively working to improve student
achievement by focusing on Early Learning & Reading, Out of School & Summer Learning, and College Bound Support.
Collaborative Action Networks

8
Spot
ligh
t
The percentage of kindergarten students demonstrating the characteristics of entering
kindergarteners in 6 of 6 developmental areas (WaKIDS assessment).
50%
Our PurposeThis Network is dedicated to increasing the number and percent of students demonstrating the characteristics of entering kindergarteners in 6 of 6 developmental areas (WaKIDS assessment) and the number and percent of students reading proficiently by the end of third grade.
Early Learning & ReadingOur FocusThe Early Learning & Reading Network is dedicated to increasing access to books and increasing reading proficiency for children age 0-5, as well as increasing the number of students reading at or above grade level by the end of third grade. The Network is dedicated to collaboration and engagement with parents and families. It’s also committed to reaching children earlier, through developmental screenings at age 0-3, along with referrals that address physical or learning challenges so children don’t fall behind.
C O L L A B O R AT I V E A C T I O N N E T W O R K Early Learning & Reading
What We’re Doing • Collaborate to build and plant “Little Free
Libraries” in the neighborhoods of Whitman and Reed elementary schools.
• Invest in the “Book to Home Project,” where books and reading suggestions are mailed over the summer to the homes of students not reading on grade level.
• Identify and support reading mentors who follow up with “Book to Home” students during the school year.
• Support reading resource fairs, early learning and reading communication campaigns, and more.
Connecting Care Providers with Schools
Building Connections, a program that is coordinated by the Early Learning & Reading Network, is just one of the ways our coalition is working to increase the demonstrated skills of entering kindergarteners through the WaKIDS assessment.
Building Connections brings together elementary school teachers with child care providers who typically serve three and four year olds, to better understand the characteristics of kindergarteners in 6 developmental areas; social-emotional, physical, language, literacy, cognitive, and math.
Building Connections creates meaningful connections between childcare providers, preschools, and elementary educators so knowledge is exchanged – sooner than later – about individual students as well as how to better serve all young students in the transition from preschool to elementary school. This knowledge, along with shared professional development between child care providers, preschools, kindergarten teachers, principals, and community, helps identify the support children need earlier than ever before.

9
What’s Next• Strengthen systems by supporting early learning community
leaders, like First5 FUNdamentals, in establishing mapping of birth-to-three services.
• Identify the gaps and opportunities for Universal Developmental Screening.
• Support pilot projects that increase the reading proficiency of third grade students not yet meeting grade level standards. For example, Communities in Schools and Pacific Lutheran University now recruit college students for the “Reading Mentor Project” at Whitman and Reed elementary schools.
• Identify shared understanding and ways to support parent and family engagement among diverse communities at the elementary, middle, and high school levels.
• Promote the message that parents are their child’s first teacher and they already have what it takes to spark learning. We’ll do this through Parent Engagement Coordinators and messaging campaigns like Vroom.
C O L L A B O R AT I V E A C T I O N N E T W O R K Early Learning & Reading
Community Leads• Bamford Foundation • Big Brothers Big Sisters of
Puget Sound• Campaign for Grade Level Reading• Center for Strong Schools• Childcare Resources• Children’s Museum of Tacoma• Communities in Schools of Tacoma• First5 FUNdamentals• Foundation for Tacoma Students
• KBTC Public Television• Pediatrics Northwest• Reach Out and Read• Stand for Children• Tacoma Community House• Tacoma Housing Authority• Tacoma Public Library• Tacoma Public Schools• United Way of Pierce County• YMCA of Pierce & Kitsap Counties
Community Partners

10
Spot
ligh
t
The percentage increase in program slots filled over 2013 baseline.
72%
Our Purpose This Network is dedicated to increasing the positive impact of expanded learning opportunities for diverse cultural, ethnic, and socioeconomic communities of Tacoma students.
Out of School & Summer Learning
C O L L A B O R AT I V E A C T I O N N E T W O R K Out of School & Summer Learning
Our FocusThe Out of School & Summer Learning Network is committed to expanding equitable access for Tacoma’s most underserved students. The Network focuses on the use of data to inform practice and strongly encourages the use of program quality improvement models, such as “Youth Program Quality Initiative,” to promote student engagement and effectiveness.
Expanding Access to the Eastside
For the first time this past year, the Out of School & Summer Learning Network supported new summer learning programs that focused on the Eastside of Tacoma, where access and participation have been lower. The Broadway Center’s Folklorico program allowed the network to:
• Expand conservatory-quality performing arts education that is geographically, economically, and culturally accessible for underserved families.
• Support the Network’s goal to widen summer learning opportunities in East Tacoma.
• Offer integrated arts/academic content that is engaging and works to prevent “summer slide.”
The highly successful program offered four classes, served 31 students, conducted over 48 hours of instruction, collaborated with four credentialed teachers and hosted two large performances for the Roosevelt Elementary community, where each show averaged 60-70 attendees.
What We’re Doing• Focus on quality programs for students and
expand access to those who are furthest away from opportunities.
• Use data to make informed decisions.
• Work collaboratively with 70 community partners to promote more than 455 programs – educational, recreational, arts, and more – to increase summer participation and reduce the “summer slide,” learning loss that happens after the summer break.
• Manage the summer learning website, SummerLearningTacoma.org, a quick and easy site allowing families to sort for opportunities by neighborhood, cost/scholarship, date, age/grade, and type of program.

11
C O L L A B O R AT I V E A C T I O N N E T W O R K Out of School & Summer Learning
What’s Next• Increase student participation by 25% over the 2013
baseline year – the number of students participating in summer learning programs.
• Increase by 50% the number of Black and Hispanic students participating over 2015.
• Expand access to program offerings for students in underserved neighborhoods.
• Expand program quality training to all service providers and teachers who host afterschool and out of school programs.
Courtesy of Point Defiance Zoo & Aquarium
• Grow community partner participation with the Network and the SummerLearningTacoma.org website.
Community Leads• Boys and Girls Clubs of South Puget Sound• Broadway Center for
Performing Arts• City of Tacoma• Foundation for Tacoma Students• Greater Tacoma Community Foundation• Hilltop Artists• Metro Parks• Oasis Youth Center • Peace Community Center• Pierce Transit
• Point Defiance Zoo & Aquarium • Puget Sound Educational Service District• Safe Streets• School’s Out Washington• Tacoma Art Museum• Tacoma Pierce County Chamber of Commerce• Tacoma Public Schools• Tacoma Rescue Mission• University of Puget Sound• University of Washington Tacoma• YMCA of Pierce & Kitsap Counties
Community Partners

12
Spot
ligh
t
Graduation rate of all “College Bound Scholars,” a program that provides full
tuition and fees to eligible students at any Washington State college or university.
83%
Our PurposeThis Network is dedicated to increasing the number and percent of Tacoma Public Schools graduates who enroll in a right-fit college or technical school the year after graduation and who successfully complete a degree or technical certificate, especially students of color and those impacted by poverty.
Tacoma College Support NetworkOur FocusTacoma College Support Network is dedicated to increasing access and opportunities for post-secondary education and technical or certificated training for all students in Tacoma. Focusing on strategies that help students navigate the pre-admission application and financial aid process, the network seeks to provide meaningful support for students and families. The Network also supports sign-ups for “College Bound Scholars” by the deadline at the end of 8th grade. Eligible students who go on to graduate from high school can receive tuition at any Washington state college or university as long as they remain a student in good standing.
C O L L A B O R AT I V E A C T I O N N E T W O R K College Bound Support
What We’re Doing • Aim for 100% sign-up of all eligible eighth graders for “College
Bound Scholars.”
• Host the annual “College Bound Saturday” event and workshops that support College Bound Scholars, attracting over 700 high school students and their parents.
• Encourage creative achievement programs and projects to support student outcomes, like “College Depot,” a six-week college preparedness program for juniors and seniors.
• Create college planning toolkits and checklists with deadlines – each year from 9th through 12th grade – to help students, parents, and families prepare for and navigate the options and the financial aid opportunities for college or technical school.
Supporting Students’ Transition
The Catalyst Academy is just one creative grassroots program supported by the College Bound Support Network. This pilot project targeted Tacoma high school graduates intending to enroll at Tacoma Community College.
This intensive leadership training and support program supported students’ transition into college. The Catalyst Academy recruited Washington State Need Grant eligible students who intended to enroll in fall 2015 and expressed a desire to succeed in college, grow in leadership, and learn to better serve their communities.
Starting in mid-July, Catalyst Academy met weekly with two professional coaches to establish supportive friendships and grow as a team, hone study and time-management strategies, build intercultural leadership skills, and help wrestle with challenging issues.

13
C O L L A B O R AT I V E A C T I O N N E T W O R K College Bound Support
What’s Next• Increase applications to college or technical school
and students completing the Federal Student Aid and the Washington State Opportunity Scholarship applications.
• Help prepare families for upcoming changes to the Federal Student Aid application.
• Strengthen communication between high school students and higher education institutions to prepare for a smooth transition to college or technical school.
• Host SAT preparedness workshops to help increase scores and prepare students for the expected changes to the SAT exam in 2016.
• Increase the number of students taking the SAT, a prerequisite at most colleges and universities.
Community Leads• Act Six• Bates Technical College• Center for Strong Schools• Clover Park Technical College• College Success Foundation• Degrees of Change• The Evergreen State College
Tacoma Program• Foundation for Tacoma Students• League of Education Voters• MDC (Metropolitan
Development Council)• Pacific Lutheran University
• Palmer Scholars• Peace Community Center• Pierce College• Tacoma Community College• Tacoma Community House• Tacoma Public Schools• Tacoma South Puget Sound MESA• University of Puget Sound• University of Washington Tacoma• Washington College Access Network• Washington Student Achievement Council
Community Partners

9TH GRADEACHIEVEMENT
6TH GRADEACHIEVEMENT
HIGH SCHOOLGRADUATION
3RD GRADE READING
READY FOR KINDERGARTEN
EARLY SCREENING
COLLEGEENTRY EXAMS
8TH GRADEMATH
COLLEGECOMPLETION
COLLEGEENROLLMENT
QUALITY PRESCHOOL
high expectations
studentattendAnce
ExpandedLearning
Safe & Healthyenvironment
Social &Emotional Support
Parent & Family
Engagement
Every Child. One Community. Cradle to Career.
C
M
Y
CM
MY
CY
CMY
K
Info graphic version 3 green runner.pdf 1 3/10/16 3:48 PM
S T U D E N T & C O M M U N I T Y I N D I C AT O R S Cradle to Career

16
Early Learning
A child’s capacity to learn is influenced by many factors. Long before a child takes part in organized education,
parents, family, and friends play a vital role helping to develop the key building blocks that lay the foundation for learning. The first three years of life, when the brain is developing, is the most intensive
period for acquiring speech and language skills. These skills develop best in a world that is rich with sounds, sights,
and consistent exposure to the speech and language of others.

17
A Bright Future Senate Bill 5317, commonly referred to as “Bright Futures,” was implemented on January 1, 2016. This legislation called for the Health Care Authority to require universal screening and provider payment for autism and developmental delays as recommended by the “Bright Futures” guidelines of the American Academy of Pediatrics.
“Bright Futures” is an important step in making sure that families are getting their children screened early enough to receive services for intervention prior to entering any organized education system. Senate Bill 5317 recommends that screenings are conducted during well-child visits. As screenings
become part of a regular routine during well-child visits, more developmental delays can be identified and addressed early so children are better able to start school on par with their peers.
There is also a statewide collective impact effort called “Help Me Grow Washington,” committed to implementing universal developmental screenings statewide. In Pierce County, First5 FUNdamentals has been working closely with “Help Me Grow” to asset map birth-to-three services in our area.
key findingsImportance of Early ScreeningEarly screening helps detect and address vision, hearing, and other developmental impairments that can affect a child’s ability to learn. Young children have the best chance to enter school on par with their peers when learning and physical challenges are detected and addressed through early screenings.
Well-child exams in the first years of life help detect developmental delays. Screenings during childrens’ 9, 18, and 24-month checkups use the nationally recommended “Ages and Stages Questionnaire” to assess each child’s development in five important areas:
• Communication • Gross motor • Fine motor • Personal/social • Problem-solving
These screenings also open up conversations between health care providers and parents, providing an opportunity to discuss concerns and help decide how best to address them. It also lends an opportunity to connect parents with helpful community resources.
E A R LY L E A R N I N G Developmental Screening
AIMING HIGHER GOAL: Increase the number of children screened by age three and age five.
DEVELOPMENTAL SCREENING
Comm
unit
y Sp
otli
ght
NOTE: Developmental screening data of Tacoma children in their earliest years is not yet consistently available. A measure for this indicator remains important to set and track in the future.

18
The increase in Tacoma Public SchoolsPreschool enrollment since 2010-11.
key findingsFour Years of TPS Enrollment Increases TPS Preschools
Tacoma Public Schools offers half-day preschool at 33 locations, including most elementary schools, serving over 1,500 students each year. Enrollment has increased over the past four years, representing a 49% increase since the 2010-11 school year.
There have been solid increases in enrollment among Hispanic preschoolers (+57%) since 2010-11, and a significant decrease in enrollment among Black preschoolers (-21%) during the same time period.
Licensed Community Childcare Providers
High quality childcare helps kids get ready for success in kindergarten. In 2012, Washington State introduced a quality rating and improvement system called “Early Achievers.” This program uses a simple rating system making it easy for families to consider their licensed childcare options. It also offers providers with coaching and resources to further support childrens’ learning and development.
In January 2015, 38% of Pierce County’s childcare providers were participating in “Early Achievers,” with 98 providers participating in Tacoma. Beginning July 2016, all state-funded childcare providers will be required to participate in “Early Achievers” and future reports will share this new data with the Tacoma community.
E A R LY L E A R N I N G Participation in Quality Preschools
HEAD START, ECEAP, TITLE 1, SPECIAL ED, MONTESSORI
1,199
RACE & ETHNICITY
BASELINE (2010-11) CURRENT (2014-15)
ENROLLED IN TPS PRESCHOOLS – BREAKOUT
ENROLLED IN TPS PRESCHOOLS – ALL STUDENTS
1,782
AIMING HIGHER GOAL: Increase the number of children attending Tacoma Public Schools or community child-
care/preschools that meet quality standards.
49% BASELINE (2010-11)
NativeAmerican
1%
Multi-Racial
2%
Multi-Racial17%
NativeAmerican
1%
White34%
Hispanic27%
Black15%Asian
5%
CURRENT (2014-15)
Paci�cIslander
1%
Paci�cIslander
1%
White35%
Hispanic25%
Black28%
Asian8%
NOTE: Reference the Appendix for additional data on this student indicator.
Data Sources: Tacoma Public Schools & Child Care Resources, Child Care Resources

19
Elementary School
Elementary school lays the foundation for a child’s BASIC READING, MATH, AND SCIENCE SKILLS and sets the stage for a lifetime of academic learning. It’s also a valuable time to Build Social Skills, like how
to get along with other children. We need to ensure that children get the early support they need for future success.

20
“The increase in gap for Hispanic students demonstrating characteristics of entering kindergarteners in 6 of 6 developmental areas. The gap for Black students closed
by 10 points in the same time period. Gaps are measured between white
students and students of color.
E L E M E N TA R Y S C H O O L Ready for Kindergarten
key findingsModest Gains for Three Years While there have been modest gains for three consecutive years, only half of the kids are demonstrating the characteristics of entering kindergarteners in all six developmental areas.
Tacoma assesses every child through the Washington Kindergarten Inventory of Developing Skills (WaKIDS), which includes pre-kindergarten meetings, a six-area developmental assessment, and ongoing opportunities for collaboration between educators. WaKIDS provides families, early learning professionals, and kindergarten teachers a formal process for sharing information so children receive the support they need to be successful in school. It is not a tool to determine whether a child should enter kindergarten.
Assessments are conducted during the first two months of kindergarten as teachers observe each child and note demonstrated characteristics in six key areas:
• Social-emotional • Language • Physical • Literacy • Cognitive • Math
As you can see below, of the six developmental areas, Language has seen the largest increase (+8 points) and Math stands out with the lowest scores (66%) overall. Additionally, a significant 25% gap stubbornly persists between students in poverty and those who are not.
AIMING HIGHER GOAL: Increase the percentage of incoming kindergartners who demonstrate the skills typical of a child
entering kindergarten in all six developmental areas asmeasured by the WaKIDS assessment.
IN ALL DEVELOPMENTAL AREAS
44% 50%
POVERTY, RACE & ETHNICITY
WaKIDS ASSESSMENT – ALL STUDENTS
BASELINE CURRENT (2011-12) (2014-15)
WaKIDS ASSESSMENT – BREAKOUT
65%
60%
55%
50%
45%
40%
35%
30% BASELINE CURRENT (2011-12) (2014-15)
Asian
Black
Multi-Racial
NativeAmerican
Hispanic
Perce
nt R
eady
for K
inde
rgar
ten i
n all D
evel
opm
enta
l Are
as
40
5452
Non-Poverty
62
58 White
n/a 40 Paci�cIslander
31
35
52
4746
n/a
51
40
33
POVERTY
Poverty
65NON-POVERTY
38
NOTE: TPS data for 2014-15 includes those students who completed 6 out of 6 tasks. Previous reports included students assessed in any single developmental area.
20%WaKIDS ASSESSMENT – IN EACH DEVELOPMENTAL AREA90%
80%
70%
60%
BASELINE (2011-12) CURRENT (2014-15)
76%
Math Literacy Cognitive Language Physical Social
79% 75%
78% 74%
82% 79% 77%
83% 83%
64% 66%
Data Source: Office of the Superintendent fo Public Instruction & Tacoma Public Schools

21
Previous Three Years of Decline
While a new baseline has been established for third grade reading in 2015, recent MSP test results reveal this is still an area in need of additional attention. Scores over the previous three years have steadily declined for both students in poverty and those who are not, with
the exception of modest gains for Asian (+2 points) and Pacific Islander (+3 points) students.
MSP data for the past three years showed just over 60% of students reading at or above grade level, nearly 10 points lower than the state average.
The gap between white students and students of color also remains fairly static, around 10% for Multi-racial and Pacific Islander students and just over 20% for Black and Native American students.
The new Smarter Balanced Assessment sets the new baseline with significant room for improvement.
DATA
DIV
E
The achievement gap between third grade students impacted by poverty and
those who are not.
LITERACY AT OR ABOVE GRADE LEVEL
42% %
POVERTY, RACE & ETHNICITY
THIRD GRADE LITERACY – ALL STUDENTS
NEW BASELINE FUTURE (2014-15)
THIRD GRADE LITERACY – BREAKOUT
key findingsNew Baseline Set, Gaps Need Closing Research shows that literacy and reading at grade-level by third grade is fundamental to a child’s future success in all subjects. Students who are not reading at grade-level in third grade are four times less likely to graduate from high school, in part because it becomes more difficult to keep up with more rigorous reading required in all classes.
A new test for literacy and language arts in third grade was introduced during the 2014-15 school year. Replacing the Measurement of Student Progress (MSP) test in all Washington State public schools is the Smarter Balanced Assessment Consortium (SBAC), which assesses reading, writing, speaking/listening, and research competencies.
The first year of the new assessment shows significant need for improvement with only 42% of students assessed at grade-level and a major achievement gap (31%) between students in poverty and those who are not. The chart on this page also shows that most students of color are achieving at significantly lower rates.
About Common Core
SBAC aligns curriculum resources with the Common Core Standards, consistent guidelines for student knowledge in Math and English Language Arts/Literacy for grades 3-8 and 11. Washington is among 42 states that have adopted a set of common standards so students can more easily transition as they move between regions or districts. Common Core focuses on developing critical-thinking, problem-solving, and analytical skills.
E L E M E N TA R Y S C H O O L Third Grade Reading
AIMING HIGHER GOAL: Increase the percentage of third graders meeting the Washington State standardized
test for third grade reading, now the Smarter Balanced Assessment Consortium (SBAC).
White
65%
60%
55%
50%
45%
40%
35%
30%
25%
20%
Black
Multi-Racial
NativeAmerican
Hispanic
Perce
nt of
Third
Gra
de Li
tera
cy O
n or A
bove
Gra
de Le
vel
NON-POVERTY
54
25 Paci�cIslander
27
44
32
35
POVERTY
63
32
Asian50
NEW BASELINE (2014-15)
31%
Data Source: Office of the Superintendent of Public Instruction

22
Middle School years are full of big transitions – socially, emotionally, and in terms of
academic preparation for success in high school.
Middle School

23
M I D D L E S C H O O L
AIMING HIGHER GOAL: Increase the percentage of sixth graders who pass all, or all but one, of their classes.
PASSING CLASSES
77 % 86%
POVERTY, RACE & ETHNICITY
SIXTH GRADE ACHIEVEMENT – ALL STUDENTS
BASELINE CURRENT (2010-11) (2014-15)
SIXTH GRADE ACHIEVEMENT – BREAKOUT
Sixth Grade Achievement
95%
90%
85%
80%
75%
70%
BASELINE CURRENT (2010-11) (2014-15)
Asian
Hispanic
NativeAmerican
Black
Perce
nt of
6th g
rade
rs pa
ssin
g all o
r all-
but-o
ne cl
ass 92
93
91
Non-Poverty 93
85
NON-POVERTY
88 White88
75 Paci�cIslander
82
8080
86
7675
84
80
84
71
POVE
RTY
Multi-Racial
The percentage increase in sixth grade achievement among students in poverty
since 2010-11.
13%
key findingsMore Than Four Out of Five Kids on Track The sixth grade year – both academically and socially – can offer an “early warning” for students who may not be feeling connected or are not keeping up academically. Measuring achievement helps identify problem areas and supports students’ needs during this transition.
Overall, students in poverty and most students of color have increased their achievement or stayed the same since 2010-11. In 2015, more than four out of five kids were on track in sixth grade.
Encouragingly, achievement for students in poverty increased from 71% to 80% since 2010-11. There have been modest gains among Hispanic (+6 points) and Native American students (+9 points), but a decline among Pacific Islander students (-13 points) in that same time period.
CLOSING GAPS – SIXTH GRADE ACHIEVEMENT
Gap is Measured Between White Students and Students of Color
13% GAPPaci�c Islander 3% GAP 2011
4% GAPNative American 16% GAP
20152011
4% GAPMulti-Racial 15% GAP
2% GAPHispanic 11% GAP
20152011
8% GAPBlack 9% GAP
20152011
NO GAPAsian NO GAP 2011
20152011
2015
2015
GAP IS MEASURED BETWEEN WHITE STUDENTS & STUDENTS OF COLOR
Data Source: Tacoma Public Schools

24
The gap between students in poverty and those not in poverty who are passing algebra or geometry with a C or better in the first semester. By second semester,
that gap decreased to 20%.
AIMING HIGHER GOAL: Increase the percentage of eighth graders who pass algebra or geometry with a C or better.
PASSING ALGEBRA OR GEOMETRY
65% %
POVERTY, RACE & ETHNICITY
EIGHTH GRADE MATH – ALL STUDENTS
NEW BASELINE FUTURE (2014-15)
EIGHTH GRADE MATH – BREAKOUT
key findingsTwo-Thirds of Students AchievingC or Better, New Baseline Set The standard for eighth grade mathematics achievement changed this past year to the percentage of eighth grade students passing algebra or geometry with a C or better each semester. Previously we had measured students passing the end-of-course exam in Algebra, which is no longer in place. Given the change, we have set a new baseline in 2014-15 to measure future progress.
The new baseline data reveals two-thirds of students are passing algebra or geometry with a C or better each semester. With the exception of Native American students, whose performance increased (+11 points) in the second semester, all other students decreased slightly. Students impacted by poverty remain consistent in both semesters with 57% achievement, while students not impacted by poverty decreased (-5 points) in the second semester.
The chart below and to the right shows data for this indicator reported by semester. The baseline number of 65% is an average of the achievement rate for the first semester (66%) and the second semester (64%).
25%
M I D D L E S C H O O L Eighth Grade Math
PREVIOUS TRENDS – EIGHTH GRADE MATH
Overall
2014
-15
2010
-11
80%
70%
60%
50%
40%
79%
WhitePaci�cIslander
NativeAmerican
Multi-Racial
Hispanic Black Asian
75%
59% 56% 54%
52%
66% 63%
54%
65% 61%
72% 71%
SECO
ND
FIRST
SECO
ND
FIRST
SECO
ND
FIRST
SECO
ND
FIRST
SECO
ND
FIRST
SECO
ND
FIRST
SECO
ND
FIRST
56%
66% 64%
SECO
ND
FIRST
2014-15FIRST SEMESTER & SECOND SEMESTER
RACE & ETHNICITY
85%
80%
75%
70%
65%
60%
55%
50%
2014-15 FIRST SEMESTER
Asian
Black
Multi-Racial
NativeAmerican
Hispanic
Perce
nt of
8th g
rade
rs pa
ssin
g alg
ebra
or ge
omet
ry w
ith a
C or b
ette
r
79
NON-POVERTY
72 White
61 Paci�cIslander
59
66
57
54
POVERTY
82
54
2014-15 SECOND SEMESTER
Asian
Black
Multi-Racial
NativeAmerican
Hispanic
75
NON-POVERTY
71 White
56Paci�cIslander
56
63
57
65
POVERTY
77
52
Data Source: Tacoma Public Schools

25
High School
Students should receive the tools, skills, and confidence necessary to graduate from high school and
Prepare them for cOLLEGE OR TECHNICAL SCHOOL.

26
DATA
DIV
E
AIMING HIGHER GOAL: Increase the percentage of ninth graders who pass all or all but one of their classes.
PASSING ALL OR ALL BUT ONE CLASS
72% 70%
POVERTY, RACE & ETHNICITY
NINTH GRADE ACHIEVEMENT – ALL STUDENTS
BASELINE CURRENT (2010-11) (2014-15)
NINTH GRADE ACHIEVEMENT – BREAKOUT
key findingsPoverty Gap Persists The transition from middle school to high school means an increased workload, additional academic and social opportunities, and challenges. Students who fail classes in the ninth grade can fall behind in their credits, making it harder to graduate on time and go on to college or technical school.
The ninth grade indicator for students passing all, or all but one class, has dropped slightly to 70% from the baseline of 72% in 2010-11, but is back up from a low of 58% in 2013-14. Notably, the achievement gap has widened considerably between students impacted by poverty and those who are not (+17 points).
Further detailed data available in the Appendix shows achievement inconsistencies across race and ethnicity. There has been a decrease among Black (-9 points) and Multi-racial students (-7 points) as well as a decline for Native American students (-20 points), particularly in the past three years.
90%
80%
70%
60%
50%
40%
BASELINE CURRENT (2010-11) (2014-15)
Asian
Black
Multi-Racial
NativeAmerican
Hispanic
Perce
nt of
9th g
rade
rs pa
ssin
g all o
r all b
ut on
e cla
ss
79
87
77Non-Poverty
70
76 White
63
69 Paci�cIslander
71
75
62 6162
54
61
42
POVERTY
78
6362 Poverty
NON-POVERTY
H I G H S C H O O L Ninth Grade Achievement
The increase in achievement gap percentage points between students
impacted by poverty and those who are not.
17%NINTH GRADE ACHIEVEMENT – POVERTY GAP ACTIVITY
Gaps Widening
While the majority of Student Indicators show progress towards closing gaps, Ninth Grade Achievement is an exception.
Data for students impacted by poverty and those who are not show areas for concern since the baseline year of
2010-11 when there was no achievement gap. In the 2011-12 school year, the gap widened to 19%, and hit a high in 2013-14 at 31%. For 2014-15, the achievement gap narrowed for poverty students to 17%, an improvement over the previous school year, but still an area for attention.
17% GAP
NO GAP
Gap Widening Between Poverty & Non-Poverty Students
20112015
GAP WIDENING BETWEEN POVERTY & NON-POVERTY STUDENTS
Data Source: Tacoma Public Schools

27
DATA
DIV
E
Percentage increase in students takingthe SAT since Class of 2011.
AIMING HIGHER GOAL: Increase the percentage of twelfth graders who take the SAT; Increase the average score on the SAT.
TAKING SCHOLASTIC APTITUDE TEST (SAT)
39% 77%
POVERTY, RACE & ETHNICITY
COLLEGE ENTRY EXAMS – ALL STUDENTS
BASELINE CURRENT (Class of 2011) (Class of 2015)
COLLEGE ENTRY EXAMS – BREAKOUT
key findingsStudents Taking SAT Up Significantly From Baseline An important part of our community-built goal is increasing college completion by 50% by the class of 2020. That first requires more students enrolling in college, which further requires proper preparation and college entry exams. When Graduate Tacoma began in 2010, just 39% of Tacoma Public Schools seniors were taking the Scholastic Aptitude Test (SAT), one of the admission tests required by most colleges and universities. This was a huge barrier to realizing the 2020 goal.
Since preparing, participating, and scoring well on college entry exams is such a key milestone for college, for the past two years TPS has eliminated the cost barrier and paid the fees for every senior to take the SAT. The district also covers the cost for PSAT tests, along with administering the tests during the school day, which eliminates student scheduling and transportation barriers.
Because these barriers have been removed, the number of students taking the SAT test has increased considerably – up to 77% in 2010-11.
97%
H I G H S C H O O L College Entry Exams
NOTE: The baseline year for students taking the SAT is 2010-11. Disaggregated data for poverty, race and ethnicity is available after 2013-14.
90%
80%
70%
60%
50%
BASELINE CURRENT (Class of 2014) (Class of 2015)
Asian Multi-Racial
NativeAmerican
Perce
nt of
Stud
ents
Takin
g Sch
olas
tic A
ptitu
de Te
st (S
AT)
80
83
54
77 White
69
72 Paci�cIslander
70
63 63
55
84
57
78
81 Black Hispanic
Non-Poverty
65
59
70
POVERTY
90
Poverty
NON-
POVE
RTY
SAT SCORES
READING 435 441
MATHEMATICS 448 443
WRITING 420 432
BASELINE (2014) CURRENT (2015)
SAT Scores Decrease, but Signs of ProgressWhile the number of students taking the SAT is up overall, the scores have declined somewhat from 1,461 in 2010-11 to 1,316 in 2014-15.
But with more students now taking the SAT, there are some more recent signs of progress. Over the
past year, both reading and writing scores have increased, while math scores have decreased and overall scores increased slightly. With the exception of Multi-racial and Asian students, every ethnic demographic saw decreases in their math scores.
Additionally, students impacted by poverty declined in reading (-5), writing (-4) and math (-10) scores, while non-poverty students increased in reading (+6) scores, but decreased in both math (-11) and writing (-1) scores.
Data Source: College Board & Tacoma Public Schools

28
key findingsGaps Closing, Gains Across All Demographics This year marks the fifth consecutive year that the high school graduation rate has increased, up to a record high 82.6% for the class of 2015. Just as important, in that same time period, graduation rates have increased significantly across every ethnic demographic.
The achievement gap between white students and students of color has decreased considerably as well. As the graph below shows, while white students continue to see increases in graduation rate, students of color are seeing even larger gains, which is narrowing the overall achievement gap, even eliminating the gap for Multi-racial students.
H I G H S C H O O L 4-Year On TIme Graduation
Record setting graduation rate for the class of 2015, surpassing the state
average for the second year in a row.
AIMING HIGHER GOAL: Increase the 4-year on time high school graduation rate to 85% by 2020.
4-YEAR ON TIME
POVERTY, RACE & ETHNICITY
HIGH SCHOOL GRADUATION – ALL STUDENTS
BASELINE CURRENT (Class of 2010) (Class of 2015)
HIGH SCHOOL GRADUATION – BREAKOUT
55% 82%
82.6%
100%
90%
80%
70%
60%
50%
BASELINE CURRENT (Class of 2010) (Class of 2015)
Asian
Multi-Racial
NativeAmerican
Perce
nt of
12th
grad
ers g
radu
atin
g on-
time i
n 4 ye
ars
72
83
74
Non-Poverty
80
84White
52
80 Paci�cIslander
59 5958
63
49
88
77
71
POVERTY
94
80 81
Poverty
NON-POVERTY
Black Hispanic
CLOSING GAPS – HIGH SCHOOL GRADUATION
Gap Between Poverty and Non-Poverty Students
17% GAP21% GAP 2012
4% GAPPaci�c Islander 22% GAP
20152012
13% GAPNative American 25% GAP
20152012
0% GAPMulti-Racial 11% GAP 2012
4% GAPHispanic 16% GAP
20152012
3% GAPBlack 15% GAP
20152012
1% GAPAsian 2% GAP 2012
2015
2015
2015
GAP IS MEASURED BETWEEN WHITE STUDENTS & STUDENTS OF COLOR
Data Source: Office of the Superintendent of Public Instruction

29
Major Reductions in Dropouts
There has been a significant 14% reduction in dropout rates over the past four years, including major decreases across all ethnic demographics and for students in poverty (-15 points) and non-poverty (-16 points). The largest
decreases in dropout rates were among Pacific Islander students (-28 points) and Native American Students (-20 points) as well as significant declines among Black (-15 points), Hispanic (-15 points) and Asian students (-12 points). This data is encouraging, since keeping kids in school is paramount to achieving our goal to increase, by 50%, both the high school graduation and college completion rates by 2020.
In addition to those gains, the gaps between white students and students of color are closing significantly.
DATA
DIV
E
The percentage increase in 5-year extended graduation rates since 2010-11.
key findingsExtended Graduation Up 42% From Baseline The Graduate Tacoma community-wide goal supports all students earning their high school diploma, even if it takes a fifth year to earn the credits for graduation. Many seniors are very close to graduating – maybe just one or two credits shy – and we’re not giving up on them.
Since the class of 2010, 24% more students graduated within 5 years by the class of 2014. The increase from 58% in 2010 to 82.5% in 2014 represents a 42% increase toward the Graduate Tacoma 2020 goal.
42%
H I G H S C H O O L 5-year extended Graduation
NOTE: The graduation rate is calculated consistently across all school districts by the State of Washington. They track students as an entire class beginning in the ninth grade and include both 4-year on time and 5-year extended high school graduates. Every student is tracked until verified that they have graduated, transferred, dropped out, or continued on in high school beyond 4 years in order to complete all graduation requirements.
AIMING HIGHER GOAL: Increase the 5-year extended high school graduation rate by 50% – to 87% by 2020.
5-YEAR EXTENDED
POVERTY, RACE & ETHNICITY
HIGH SCHOOL GRADUATION – ALL STUDENTS
BASELINE CURRENT (Class of 2010) (Class of 2014)
HIGH SCHOOL GRADUATION – BREAKOUT
58% 82%
100%
90%
80%
70%
60%
50%
BASELINE CURRENT (Class of 2010) (Class of 2014)
Asian
Multi-Racial
NativeAmerican
Perce
nt of
stud
ents
grad
uatin
g at 5
-yea
r ext
ende
d rat
e
74
89
70
Non-Poverty
75
85 White
50
77 Paci�cIslander
6361
62
67
55
68
76
73
POVERTY
92
72
82
Poverty
NON-POVERTY
Black
Hispanic
5-YEAR EXTENDED – HIGH SCHOOL GRADUATION
100%
90%
80%
70%
60%
50%58%
Class of 2014Class of 2013Class of 2012Class of 2011 Class of 2010
67% 69%
77%
82.5% 87%
50% increaseover 2010
DROP OUT CLASS OF CLASS OF DECLINES 2011 2015POVERTY -15 points 29% 14%NON-POVERTY -16 points 20% 4%Asian -12 points 21% 9%Black -15 points 26% 11%Hispanic -15 points 28% 13%Native American -20 points 44% 24% Pacific Islander -28 points 41% 13%
Data Source: Office of the Superintendent of Public Instruction

30
College AND TECHNICAL SCHOOLS
We consider post-secondary education to be any formal learning programs that occur after high-school graduation: colleges,
universities, seminaries, military, technical, or vocational schools that award academic degrees or professional certificates.
Today’s high school graduate earns an average of 30% more than students who drop out. Graduates who go on to earn a
college degree, on average, earn more than twice as much as their peers who
don’t complete high school. Our students need – and deserve – support to graduate from these institutions.

31
DATA
DIV
EC O L L E G E A N D T E C H N I C A L S C H O O L S
AIMING HIGHER GOAL: Increase the percentage of TPS graduates who enroll in two or four-year colleges,
apprenticeship programs or technical certification courses within one year of graduation.
4-YEAR OR 2-YEAR COLLEGE / TECHNICAL SCHOOL
POVERTY, RACE & ETHNICITY
COLLEGE ENROLLMENT – ALL STUDENTS
BASELINE CURRENT (Class of 2010) (Class of 2013)
COLLEGE ENROLLMENT – BREAKOUT
33% 43%
College Enrollment
key findingsUp 10% from Class of 2010 College Enrollment is up significantly for overall class populations. Black, Hispanic, and White student enrollment has remained relatively flat while Native American and Pacific Islander students have increased and Multi-racial students have decreased.
The more you learn the more you earn. Today’s high school graduate earns an average of 30% more than students who drop out. Graduates who go on to earn a college degree, on average, earn more than twice as much as their peers who don’t complete high school. Our students need – and deserve – support to graduate from these institutions.
Attending college or technical school also puts young people on the road to a lifetime of learning, considerably more choices, and the opportunity for a fulfilling career.
Seniors Show College Intent
Having a post-graduation plan helps students better prepare for the future and often becomes self-fulfilling. It also helps parents, educators, and the community support students in their plans.
Verified Acceptance to Next Institution, or VANI, is a relatively new measurement that Tacoma Public Schools began tracking. It’s unique to other measures because it looks beyond 2 and 4-year admission intentions to include military and certificate programs.
From the first year of reporting (2012-13) there has been a 58% increase in VANIs handed in by seniors, as well as major increases in every ethnic demographic and students impacted by poverty.
For the 2015-16 school year, Tacoma Public Schools has made VANI a graduation requirement for students. 70%
60%
50%
40%
BASELINE CURRENT (Class of 2010) (Class of 2013)
Asian /Paci�c Islander
Multi-Racial
NativeAmerican
TPS g
radu
ates
who
enro
ll in a
4 or
2-ye
ar co
llege
the y
ear a
fter g
radu
atio
n
65
69
58
Non-Poverty
6462 White
5354
64
4240
56
50
POVERTY
66
54
60
Poverty
NON-POVERTY
Hispanic
60 Black
The average increased earningsfor a high school graduate, compared to
students who drop out.
30%Courtesy of UW Tacoma
Data Sources: Tacoma Public Schools, Educational Research & Data Center, Office of Financial Management
NOTE: The current percentage for this indicator is based on an estimate. Refer to the footnote on page 4 of the Impact Report for full explanation on this calculation.

32
Spot
ligh
t Tacoma Named Top 50 College Town
In 2015, Tacoma was ranked among the Top 50 college towns in America by “Best College Reviews,” which ranks
colleges, universities and communities across America with emphasis on academic quality, affordability and flexibility.
“This college town is bustling with students. Tacoma is listed as the 19th most walkable
city in the nation, and one of America’s most livable areas. Today a variety of employers call Tacoma home including the Port of Tacoma, local Universities, state departments, healthcare providers and Boeing. Art, seafood, microbreweries, and coffee make Tacoma a joy similar to Seattle, just a bit smaller.”
This national recognition further validates the college-going culture that our community has worked so hard to promote as we march towards increasing high school graduation and college completion rates.
The percentage of jobs in WashingtonState that will require a degree or
career credential by 2018.
66%
C O L L E G E A N D T E C H N I C A L S C H O O L S
NOTE: Demographic breakouts for college completion are based on the ERDC data source and subject to their categorization. They are different from TPS and OPSI, referenced throughout most of this report.
AIMING HIGHER GOAL: Increase the percentage of TPS high school graduates who complete a 2 or 4-year
college degree within six years of high school graduation by 50% to 47% by 2020.
4-YEAR OR 2-YEAR COLLEGE / TECHNICAL SCHOOL
RACE & ETHNICITY
COLLEGE COMPLETION – ALL STUDENTS
BASELINE CURRENT (TPS Class of 2005; (TPS Class of 2009; College Grad by 2011) College Grad by 2014)
COLLEGE COMPLETION – BREAKOUT
31% 39%
College Completion
key findingsCollege Completion Up 26% College completion increased to a high of 39% for TPS graduates completing college by 2014. The college completion indicator measures the TPS cohort class that graduates from a 2 or 4-year college within six years of high school graduation. The college completion rate reported in 2014 represents a 26% increase from the college completion rate reported in 2011.
There were considerable gains for all ethnic demographics that are measured; +14 points for Asian/Pacific Islander, +17 points for Black, +6 points for Hispanic and +14 points for White students.
Completion of a degree or certificated program is an important milestone for students on their path to a successful career and life. By 2018, two-thirds of all jobs in Washington State will require a degree or career credential.
COLLEGE COMPLETION – ALL STUDENTS
50%
40%
30%
20%2009200820072006 2005
31%
36% 33%
37% 39%
47%
2020
GOA
L
PROGRESS TOWARDS OUR COLLEGE COMPLETION GOAL
50%
40%
30%
20%
10%
BASELINE CURRENT (2004-05; (2008-09; Class of 2005) Class of 2009)
Asian/Paci�cIslander
Multi-Racial
Perce
nt of
TPS g
rads
earn
ing a
colle
ge de
gree
with
in 6
year
s
28
42
29
43White
14
22
NA
28
31 Black
Hispanic
NativeAmerican NA
GAPS WIDENING FOR HISPANIC STUDENTS – COLLEGE COMPLETION
15% GAP
7% GAP 2005
Gap Widening for Hispanic Students
2009
Gap is Measured Between White and Hispanic Students
GAP IS MEASURED BETWEEN WHITE STUDENTS & STUDENTS OF COLOR
Data Source: Educational Research & Data Center, Office of Financial Management

33
Community Indicators
It’s up to all of us – parents, educators, and the community – to understand how to
align and focus the programs and services our youth need both inside and outside of schools to
HELP EVERY CHILD ACHIEVE THEIR FULL POTENTIAL.

34
comm
unit
y Sp
otli
ght Pathways to Promise
Many kids in Tacoma did not grow up thinking about college as a viable option. Programs like “Pathways to Promise” are working to change that. Tacoma Public Schools, Graduate Tacoma, and the work of many other community partners are creating and supporting a college-going culture in our community.
“Pathways to Promise” is a partnership between UW Tacoma and local school districts like Tacoma Public Schools, focused on getting students to think seriously about their futures and the skills needed for college and career. Since it began in 2013, there has been a 47% increase in the number of UW Tacoma applications coming
from Tacoma Public Schools, resulting in increased enrollment numbers. The year before “Pathways to Promise” began, there were 117 applicants to UW Tacoma from Tacoma Public Schools. In 2015 the number of applications from TPS students jumped to 220 – an 88% increase.
UW Tacoma is providing planning tools, advisors, and outreach specialists to focus on planting seeds with middle school students that college is a viable option, which gets them ready and excited to go to college.
C O M M U N I T Y I N D I C AT O R S High Expectations
key findingsIncreases Across All Demographics Taking Rigorous Courses There are high expectations for every child in Tacoma regardless of income, ethnicity, or background. It’s been a fundamental change in our community over the past five years, and we are now seeing more students taking rigorous courses, achieving at higher levels and, in turn, setting their sights on college.
Overall the number of students enrolled in college credit-eligible classes has increased 82% since 2012-13. That increase represents big gains across every ethnic demographic, as well as students affected by poverty and those who are not.
AIMING HIGHER GOAL: Increase the percentage of eleventh and twelfth graders taking at least one
advanced class eligible for college credit.
ENROLLED IN COLLEGE CREDIT-ELIGIBLE CLASSES
POVERTY, RACE & ETHNICITY
STUDENT ENROLLMENT – ALL STUDENTS
BASELINE CURRENT (2012-13) (2014-15)
STUDENT ENROLLMENT – BREAKOUT
33% 60%
The percentage increase in students living in poverty taking rigorous courses since 2012-13.
79%
80%
70%
60%
50%
40%
30%
20%
10%
BASELINE CURRENT (2012-13) (2014-15)
Asian
Multi-Racial
NativeAmerican
High
Scho
ol St
uden
ts en
rolle
d in C
olle
ge Cr
edit-
Eligi
ble C
lass
es
45
73
63 White
2118
48
33
5455 Hispanic
25
Black
23
45 Paci�cIslander
29
52
POVERTY
Poverty
Non-Poverty
37
69
NON-POVE
RTY
29
35
Data Source: Tacoma Public Schools

35
comm
unit
y Sp
otli
ght Beating the Summer Slide
Graduate Tacoma’s Out-of-School and Summer Learning Network actively fights against the “summer slide” – learning loss that happens during the summer break – by raising awareness and helping parents find summer learning opportunities. Summer learning loss disproportionately impacts low-income students who lose two or more months in reading progress over the summer compared with their non-poverty peers.
In 2013, Graduate Tacoma convened a meeting to explore summer school partnerships and the Boys & Girls Clubs of South Puget Sound was inspired to join with Tacoma Public Schools to create the “Summer
Boost” program. Designed for third grade students reading below grade level, the program combined focused learning in small classes taught by TPS certified teachers with the full-day enrichment opportunities of the Club.
Professional evaluation by UW Tacoma’s Center for Strong Schools is very encouraging. More than 93% of students in the program avoided the summer slide, and 41% of students experienced a year or more of growth in literacy skills. Students experienced growth in social and emotional health as well. While 34% of kids were at moderate to high risk of emotional problems prior to the program, that number dropped to 12% by the end of the program.
C O M M U N I T Y I N D I C AT O R S Out of School & Summer Learning
key findingsProgram ParticipationUp SignificantlyKids learn in many different ways outside the regular school day. After all, kids are in school less than half the calendar days of the year and, at most, half their waking hours each day.
Summer and after-school programs offer tremendous opportunities for the community to engage in preparing students for success through activities that enhance learning, knowledge, and personal development. Graduate Tacoma supports and promotes many of these opportunities through the SummerLearningTacoma.org website. This website captures more than 70 community partners and lists nearly 455 different program options for families and children. Now in its third year, the Out of School & Summer Learning Network has begun capturing participation data and breaking it down by poverty, race and ethnicity, grade range, and neighborhood. Moving forward, the Action Network will be better able to assess who is participating, and in which types of programs, so we not only expand overall participation, but reach students who have traditionally not participated in summer programs.
The first year of collecting and disaggregating the summer learning participation data shows significant participation by students on the Eastside (31%). The chart to the right shows a 23% participation rate for Black students and a 19% participation rate for Hispanic students in summer learning programs.
Overall, participation is higher among students in poverty (57%) than those who are not (43%), an encouraging sign that we are reaching the students with the greatest need.
AIMING HIGHER GOAL: Increase the number of students participating in out-of-school and summer learming opportunities.
Increase the quality of community programs and strengthen academic content.
SUMMER PROGRAM PARTICIPATION
POVERTY, RACE & ETHNICITY
STUDENT PARTICIPATION – ALL STUDENTS
BASELINE CURRENT (2013) (2015)
SUMMER PARTICIPATION – UNDUPLICATED
5,616
The percentage of students participating in Summer programs from Eastside Tacoma.
31%
9,673
60%
50%
40%
30%
20%
10%
0%
NEW BASELINE (2014-15)
Asian
Black
Multi-Racial
NativeAmerican
Hispanic
Out o
f Sch
ool &
Sum
mer
Lear
ning
Prog
ram
Slot
s Fill
ed
9
NON-POVERTY
39 White
2Paci�cIslander
23
7
57
1
POVERTY
43
19
Data Sources: Community partners, TPS eSchools+, and Foundation for Tacoma Students

36
C O M M U N I T Y I N D I C AT O R S Attendance
key findingsPoverty Gaps Narrow Students need to be in school to learn. It helps them keep up with key academic skills and milestones. Everyone—students, parents, community members—can promote and support consistent school attendance.
The gap between poverty and non-poverty students who are chronically absent (18+ or more days) has narrowed from 14% in 2013-14 to just 3% in 2014-15. Chronic absence also declined for high school students, down 3% from last year. More detailed data on attendance is available in the Appendix.
AIMING HIGHER GOAL: Decrease the percentageof students who are chronically absent—
missing 10% of the school year (18 days or more).
POVERTY, RACE & ETHNICITY
CHRONIC ABSENCE – ALL STUDENTS
BASELINE CURRENT (2013-14) (2014-15)
CHRONIC ABSENCE – BREAKOUT
26% 27%
CHRONIC ABSENCE BY SCHOOL TYPE – ALL STUDENTS
NOTE: Data includes both excused and unexcused absences.
50%
40%
30%
20%
10%
BASELINE (2013-14) CURRENT (2014-15)
15%
High SchoolMiddle SchoolElementary School
17%
27% 31%
47% 44%
CHRONIC ABSENCE (18+ DAYS)
50%
40%
30%
20%
10%
BASELINE CURRENT (2013-14) (2014-15)
Asian
Multi-Racial
NativeAmerican
Perce
ntag
e of s
tude
nts w
ho ar
e chr
onica
lly ab
sent
18 da
ys or
mor
e
1819
24
Non-Poverty
17
26White2626
37
3129
42
2628
31
Hispanic
31Black
35
39 Paci�cIslander
NON-POVERTY
31 POVERTYPoverty
comm
unit
y Sp
otli
ght Attendance Improves at Mt. Tahoma
The Whole Child Initiative (TWCI), a partnership between UW Tacoma’s Center for Strong Schools, Tacoma Public Schools, and supported by Graduate Tacoma, is on a mission to create sustainable change in Tacoma schools and the community so that every child is treated as the whole child that they are – engaged, successful, resilient, and ready to achieve their full potential in life.
Mt. Tahoma High School is a great example of how TWCI is successfully supporting the social and emotional well-being of students. After the program was implemented, the unexcused
absence count decreased a dramatic 44%, from 7,295 in 2012 to 4,081 in 2013. At the same time, students showed an equally impressive 50% improvement in reading, math, writing, and science. While only 404 students had passed the state test in 2012, that number jumped to 608 students in 2013.
TWCI is set to roll out to other TPS high schools in 2016.
The gap between poverty and non-poverty students who are chronically absent. A significant
improvement from the 14% gap in 2013-14.
3%
Data Source: Tacoma Public Schools

37
Comm
unit
y Sp
otli
ght College Toolkits Reach
Students & Families
The majority of Tacoma Public Schools graduates will be the first in their families to attend college. According to 2010 census data, just 26% of Tacoma adults hold a college degree, which means navigating the complicated admissions process is new to both students and their families. That’s why Graduate Tacoma produces College & Career Toolkits for every high school student and their families with the goal of getting valuable college information into their hands.
Designed to demystify the application steps and financial aid options and opportunities, toolkits are sent home during Freshmen, Sophomore, Junior, and Senior years and customized to give students and their families the most relevant information and checklists appropriate for that year.
C O M M U N I T Y I N D I C AT O R S Parent & Family Engagement
key findingsPositive Engagement Benefits Students Both at Home and School Parents and family are a child’s first and most important teachers. When parents and family members play an active role in their child’s education, students are more successful in school.
Positive engagement – connections that are built on respect, relationship, and shared decision-making – can benefit students both at home and at school. Parent and family involvement can result in:
• Improved grades and test scores • Increased attendance • Higher enrollment in challenging courses • Improved social skills and behavior
These connections are embedded in the Graduate Tacoma movement and the TPS Community Partnership office. By bringing the community together around the common goal of investing time, skills, and diverse abilities in the education of our children, we are addressing important school and non-school factors that will lead to increased student achievement. This, in turn, impacts the quality of life for the entire Tacoma community. Programs like “Family & Community Learning Academy” are held each year and bring together parents, students, teachers, and community to realize this shared goal.
These connections impact non-school factors such as healthy and safe environments, which contribute to student achievement.
AIMING HIGHER GOAL: Increase the numberof parents and guardians who are supported
and engaged in student success.
PARENT & FAMILY ENGAGEMENT
NOTE: Data for these indicators is not yet available, but a measure remains important to set and track in the future.
38
Comm
unit
y Sp
otli
ght
C O M M U N I T Y I N D I C AT O R S Safe & Healthy EnvironmentSocial-Emotional Support
Prompt Response and Support Helps KidsStay on TrackEach day of learning can be different for every student. School staff and community partners play key roles in recognizing when students have learning, behavioral, or personal difficulties. Personal and behavioral issues can create learning barriers, but prompt response and support can make a huge difference in helping students stay on track and in school.
This can mean anything from extra academic assistance to helping youth overcome social and emotional barriers.
Shared expectations in the classroom, at school, at home, and in community settings also help students.
AIMING HIGHER GOAL: Increase in positive behaviorand student engagement and decrease in
behavioral challenges.
SOCIAL-EMOTIONAL SUPPORT
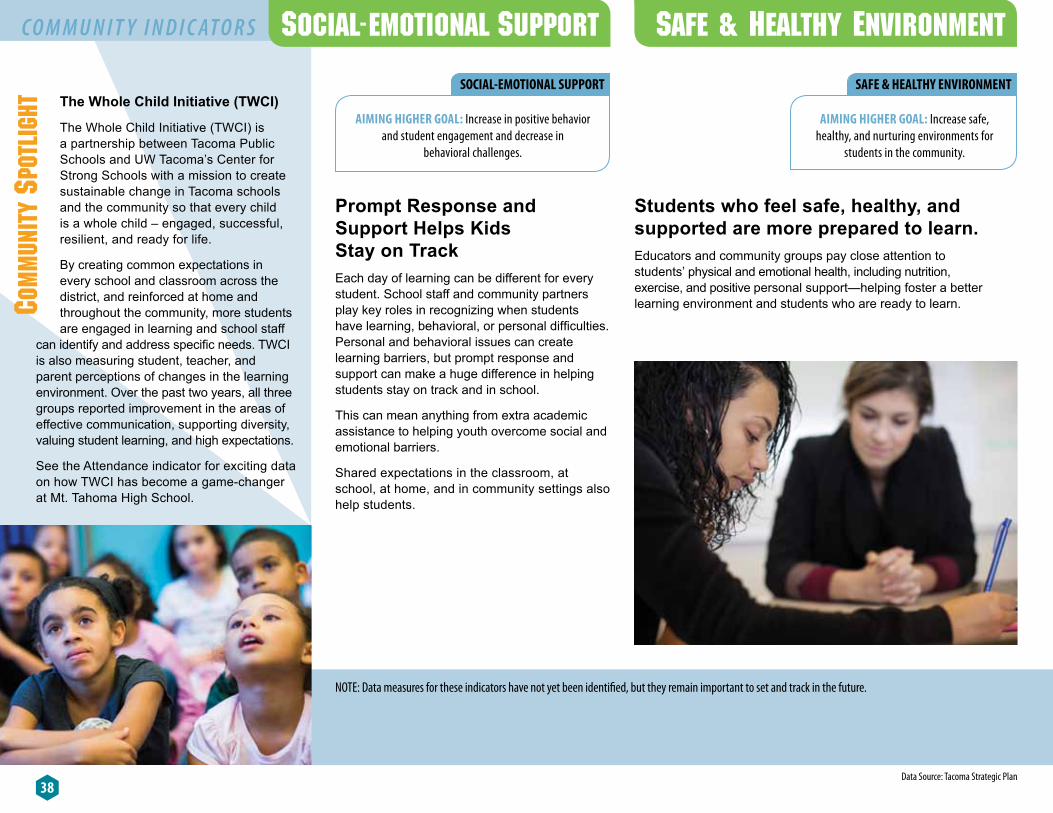
Students who feel safe, healthy, and supported are more prepared to learn. Educators and community groups pay close attention to students’ physical and emotional health, including nutrition, exercise, and positive personal support—helping foster a better learning environment and students who are ready to learn.
AIMING HIGHER GOAL: Increase safe, healthy, and nurturing environments for
students in the community.
SAFE & HEALTHY ENVIRONMENTThe Whole Child Initiative (TWCI)
The Whole Child Initiative (TWCI) is a partnership between Tacoma Public Schools and UW Tacoma’s Center for Strong Schools with a mission to create sustainable change in Tacoma schools and the community so that every child is a whole child – engaged, successful, resilient, and ready for life.
By creating common expectations in every school and classroom across the district, and reinforced at home and throughout the community, more students are engaged in learning and school staff
can identify and address specific needs. TWCI is also measuring student, teacher, and parent perceptions of changes in the learning environment. Over the past two years, all three groups reported improvement in the areas of effective communication, supporting diversity, valuing student learning, and high expectations.
See the Attendance indicator for exciting data on how TWCI has become a game-changer at Mt. Tahoma High School.
NOTE: Data measures for these indicators have not yet been identified, but they remain important to set and track in the future.
Data Source: Tacoma Strategic Plan

39
Thanks to you
Foundation for Tacoma Students BOARD OF DIRECTORS
Officers & Leadership
Kent Roberts, ChairDan Barkley, Vice ChairDion Rurik, Secretary Brad Cheney, TreasurerJim Walton, At-LargeJim Shoemake, Past Chair
Directors
Bill BaarsmaHolly Bamford HuntLois Bernstein Benjii BittleMelannie Denise Cunningham John Folsom Rose Lincoln Hamilton Kathi LittmanLyle Quasim Patty Rose Carla SantornoWillie StewartMarilyn Strickland Shon SylviaSulja WarnickDebbie Winskill Victoria Woodards Jeff Woodworth
STAFF
Eric WilsonPresident & CEO
Tafona ErvinDirector of Collective Action
Tolena ThorburnDirector of Communications
Sandra EliasonDirector of Funding Alignment
Courtney YdstieOperations Manager
Jared WrightNetwork Coordinator
It takes everyone working together – parents, educators, and the community – to improve outcomes for every student, every day. By working together, we are all making a difference.
We value the commitment of our nearly 200 Community Partners from every sector of Tacoma, appreciate the generosity of our funders and supporters, and treasure the leadership dedicated to building and strengthening this community-wide movement. Thank you all.
Today we are reaping the benefits of our focused, collaborative efforts. We are seeing success because we are aligning resources and continuously analyzing and sharing data to measure progress towards closing gaps in access, opportunities, and achievement for every child from cradle to college and career.
You’ve seen the numbers. We have made positive changes that affect kids today and for the future. You have also seen that our work is not done. But we are inspired by the progress we’ve made and are confident in our collective ability to do even more so every child succeeds.


41
Get Involved
Graduate Tacoma! Get InvolvedIt takes the whole community – parents, educators, all of us – working together to make lasting changes and support a child’s success. Through collective action we can make a difference. You can be a part of the change. You will make an impact.
There are endless ways to get involved, find the ones that work for you and your organization.
Together, WE will Graduate Tacoma!
Join UsJoin the Graduate Tacoma movement and stay connected. Help increase high school and post-secondary graduation by 50% by the Class of 2020. Visit GraduateTacoma.org and sign your name to the roster of community members and organizations who believe in Tacoma’s shared goal and are dedicated to every child achieving success from cradle to college and career.
And tell a friend.
Stay ConnectedTrack the progress of Graduate Tacoma by reading more and digging further into the data on GraduateTacoma.org. Like us on Facebook. Follow us on Twitter.
CommitVolunteer, mentor, donate, reach out to your neighborhood school—see what you learn and how you might help. You are gold to this effort, whether it’s reading with a child, mentoring youth, or donating to a program.
Be InspiredEvery day incredible strides are being made by and for Tacoma’s youth. Stay connected to the stories and the impact we are making together on the lives of our students. These stories promise to inspire and – we hope – help you recommit to our goals and to continuing the work of aligning our efforts.
Join the Conversation! GraduateTacoma.org

302 S. 9th St., Suite 200, Tacoma, WA 98402GraduateTacoma.org | 253.272.1600