graduate school of international development€¦ · recent hossain, shinkai, yunus, and bakht...
TRANSCRIPT

Graduate School
of
International Development
NAGOYA UNIVERSITY NAGOYA 464-8601, JAPAN
〒464-8601 名古屋市千種区不老町 名古屋大学大学院国際開発研究科
O
Discussion Paper No.181
Impact of the Global Financial Crisis on the IT Sector in Bangladesh:
Lessons Learned and Policy Recommendations
Naoko Shinkai and Monzur Hossain
December 2010

1
Impact of the Global Financial Crisis on the IT Sector in Bangladesh: Lessons
Learned and Policy Recommendations
By
Naoko Shinkai and Monzur Hossain
Graduate School of International Development, Nagoya University and
Bangladesh Institute of Development Studies
December, 2010
Abstract
The recent global financial crisis seemed to have affected negatively many countries in the world
not only directly but indirectly. However, there might be some opportunities created if some
countries or sectors could take advantage of relocations of productions of multinational firms
seeking for more efficient supply. In this paper, one of the leading and fast growing industries,
whose market shares are mostly acquired by those affected countries, the IT sector in Bangladesh is
examined in order to measure the impact of the global financial crisis. In order to find out the
situation in the sector more closely, we have conducted a survey of 202 IT firms of various sizes in
Dhaka in 2009. It is concluded that, to some extent, the negative impact appears in performance
measures but in 2008 most SMEs seemed to have recovered. In terms of total productivity, for those
firms, which are more than 5 years old, show that E-governance activities contribute to total
productivity by 0.8984 percent. Infrastructure development, tax exemption, export promotion and
training of engineers are considered to be major concerns among others in IT business operations
based on the survey, which can be tackled by policies to support further development of this sector.
1. Introduction
The Sub-prime loan crisis that led to the grave recession in 2007 in the United States seemed to
have given negative impact to trading partners all over the world since demand from those

2
countries decreased. At the same time, some countries might have benefited from this crisis since
shifts in locations of productions could have been aggravated by investors seeking for cost
advantage. As for the supply side, there might be a case that international investors which rebuilt
supply chains in order to hedge the risk from the global financial crisis, could have brought new
opportunities. Therefore, it is neither evident whether the effect of the financial crisis was negative
in all sectors, nor how severe those effects were. Then, even within the sector, there might be a case
where not all the firms are affected by the crisis in a same manner. In South Asia, the IT sector is
one of the leading industries whose market shares were captured mostly by the United States. The
effects of the crisis may not be avoided but for a country like Bangladesh to which cost advantage
and abundant human resources can bring benefit. In this study, the IT sector in Bangladesh, is
examined in order to measure the effect of the recent global financial crisis, to identify factors
enabling firms to make a good use of opportunities yielded, and to direct to policy recommendations.
In the following, background of the IT sector is outlaid in Section 1, followed by performance
assessment of IT firms in our survey presented in Section 2, the analysis of the impact of the global
financial crisis and determinants of productivity on the IT sector is provided in Section 3, then,
policy recommendations are exhibited to conclude.
1.1 Background of the IT sector in Bangladesh
Bangladesh is a country of population over 150 million with literacy rate more than 50 percent. In
the last two decades, the country has fetched remarkable economic progress with GDP growth rate
of more than 5 percent. It is argued that there is a tremendous prospect for the country to leapfrog
into industrialized economy through the development of the IT sector. Because Bangladesh has
high potential to become a huge source of skilled human resources with its cultural adoption
capability, English language skills, analytical capability and a large number of educated and
energetic youths with bright aptitude, good quality and natural ability in software development. A
recent Hossain, Shinkai, Yunus, and Bakht (2010) BIDS (Bangladesh Institute of Development
Studies)’s study shows that the wage rate of IT professionals in Bangladesh is almost half of the
Indian IT professionals. Despite these favorable conditions, the IT sector has not yet been growing
as much as expected. The country obtained US$ 33 million by exporting software in 2009. Although
the export earnings from the software sector increased by eight million dollars in 2009, compared to
2008, the share of software export is only 0.2 percent of country’s total export. The IT sector mainly
3
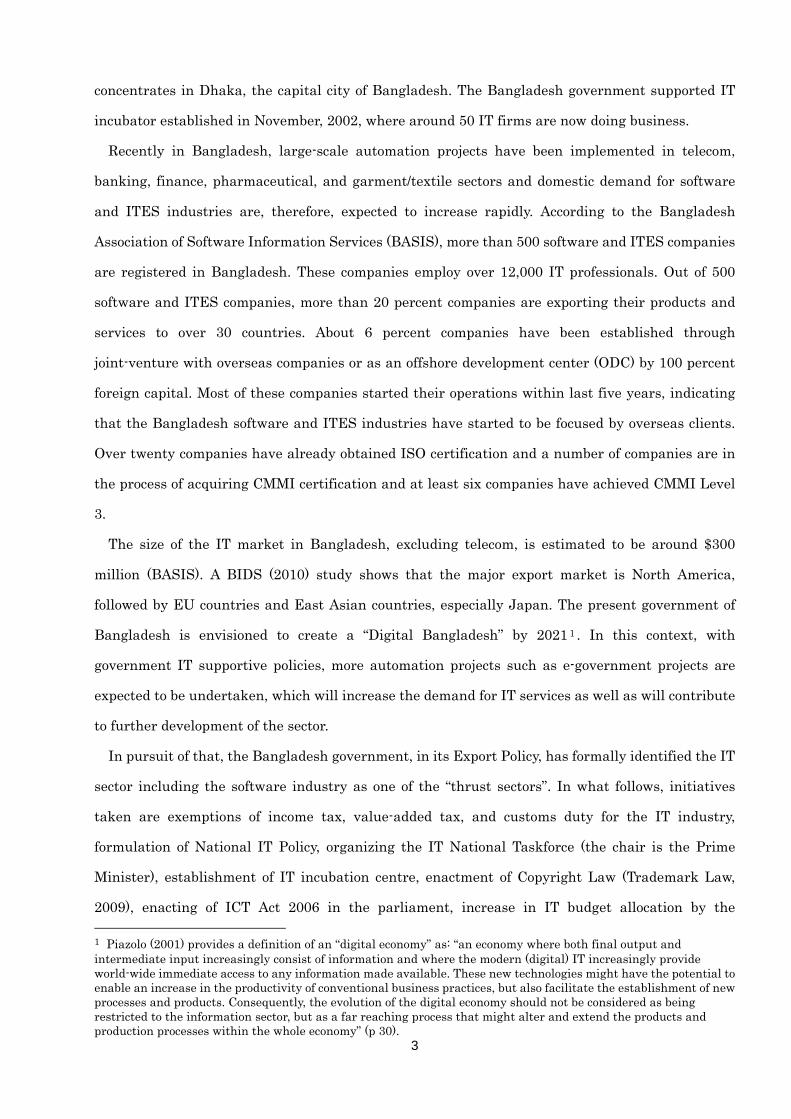
concentrates in Dhaka, the capital city of Bangladesh. The Bangladesh government supported IT
incubator established in November, 2002, where around 50 IT firms are now doing business.
Recently in Bangladesh, large-scale automation projects have been implemented in telecom,
banking, finance, pharmaceutical, and garment/textile sectors and domestic demand for software
and ITES industries are, therefore, expected to increase rapidly. According to the Bangladesh
Association of Software Information Services (BASIS), more than 500 software and ITES companies
are registered in Bangladesh. These companies employ over 12,000 IT professionals. Out of 500
software and ITES companies, more than 20 percent companies are exporting their products and
services to over 30 countries. About 6 percent companies have been established through
joint-venture with overseas companies or as an offshore development center (ODC) by 100 percent
foreign capital. Most of these companies started their operations within last five years, indicating
that the Bangladesh software and ITES industries have started to be focused by overseas clients.
Over twenty companies have already obtained ISO certification and a number of companies are in
the process of acquiring CMMI certification and at least six companies have achieved CMMI Level
3.
The size of the IT market in Bangladesh, excluding telecom, is estimated to be around $300
million (BASIS). A BIDS (2010) study shows that the major export market is North America,
followed by EU countries and East Asian countries, especially Japan. The present government of
Bangladesh is envisioned to create a “Digital Bangladesh” by 2021 1 . In this context, with
government IT supportive policies, more automation projects such as e-government projects are
expected to be undertaken, which will increase the demand for IT services as well as will contribute
to further development of the sector.
In pursuit of that, the Bangladesh government, in its Export Policy, has formally identified the IT
sector including the software industry as one of the “thrust sectors”. In what follows, initiatives
taken are exemptions of income tax, value-added tax, and customs duty for the IT industry,
formulation of National IT Policy, organizing the IT National Taskforce (the chair is the Prime
Minister), establishment of IT incubation centre, enactment of Copyright Law (Trademark Law,
2009), enacting of ICT Act 2006 in the parliament, increase in IT budget allocation by the 1 Piazolo (2001) provides a definition of an “digital economy” as: “an economy where both final output and intermediate input increasingly consist of information and where the modern (digital) IT increasingly provide world-wide immediate access to any information made available. These new technologies might have the potential to enable an increase in the productivity of conventional business practices, but also facilitate the establishment of new processes and products. Consequently, the evolution of the digital economy should not be considered as being restricted to the information sector, but as a far reaching process that might alter and extend the products and production processes within the whole economy” (p 30).

4
government (targeting 2% of annual development plan expenditure), etc. With the support of the
government, the software industry in Bangladesh has started growing since the
1990s. Bangladesh has recently been focused by other countries as an outsourcing target. However,
the absence of IT park as well as electricity and internet problems remain as key barriers to
expanding the industry at an expected level.
Historically, computer use started back in 1964 by Atomic Energy Center, Dhaka and
Universities. The first main frame computer came to Bangladesh in 1964. The Internet came late in
Bangladesh, with UUCP e-mail beginning in 1993 and IP connectivity in 1996. By July 1997 there
were 5,500 IP and UUCP accounts as estimates2. In June 1996, the government decided to allow
private companies to act as Internet Services Providers (ISPs) using VSATs. In June 1997, the
Government of Bangladesh appointed a Committee to look into the problems and prospects of
export of software from Bangladesh. The Committee submitted its report in September, 19973. The
government has taken a decision on June, 1998 to withdraw all import duties and VAT from all
computer hardware and software. This has brought the prices of computers down to a level
affordable by middle income households. Mobile telephone has seen a phenomenal growth in
Bangladesh, which is contributing to the growth of the IT sector positively.
Table 1 IT indicators in Bangladesh, 2006
Internet users 450,000
Internet users (per 100 people) 0.28
Secure Internet servers (per 1 million people) 0.019
Telephone mainlines (per 100 people) 0.72
Investment in telecoms with private participation
(current US$) 8.93E+08
International Internet bandwidth (bits per person) 7.97
International Internet bandwidth (Mbps) 1244
Mobile phone operators 6
Mobile phone subscribers (as of 2009) 66 million
Source: World Development Indicators, The World Bank and BTRC, Dhaka4
2 http://www.c2o.org/reports/Report_PAN_Asia_Networking.pdf 3 http://www.sdnbd.org/sdi/issues/IT-computer/expartsoft-report.htm 4 All the tables were produced by the authors if not specified.

5
2. Performance Assessment of IT firms Surveyed
The IT sector in Bangladesh is one of the fast growing sectors and it is also quite export oriented.
However, as it is mentioned in the previous section, the growth of this industry is somewhat lower
than expected. In order to identify the causes for straggling and to observe variations of impact by
firm, we conducted the survey of IT firms in Dhaka in October and November 2009. Firms were
selected based on stratified random sampling in the first stage. In this first stage, all the key
commercial areas in Dhaka were covered. In total, 202 software firms were sampled, including
some large firms5.
2.1 Sales revenue and profit
Based on the data of 202 surveyed firms, different indicators of performance of IT firms are
examined. The IT firms in Bangladesh showed a staggered growth of sales revenue over the years,
2005-2008.
Figure 1 Average growth of sales of IT firms by major activities, 2005-2008 (%)
Global economic recession in 2007 has impacted Bangladeshi software firms to some extent.
Figure 1 shows that Bangladeshi software firms have faced downturn in product sales growth for
some activities during 2006 and 2007 and there is a sign of rebound in 2008. The above picture is
also confirmed from respondents’ opinion. Whereas, about 55 percent firms were affected by the
5 This survey was supported by Grant-in-Aid for Scientific Research, Japan Society for the Promotion of Science, No. 20402027 and No. 21530259.

6
global recession through drop in sales, about 12 percent firms were reportedly benefitted by the
global recession through increase in sales.
Table 2 shows that gross profit of firms is reported to be around 18 percent of the total revenue on
average in 2008. As expected, profit declined slightly in 2008 for most of the firms except for the
medium-sized firms.
Table 2 Gross profit as % of sales revenue
Gross Profit as % of revenue
by size (the number of
employees)
Micro
(<10)
Small
(10-49)
Medium
(50-99)
Large
(>100) All
2008 17.3 18.7 19.4 12.2 18.1
2007 28.8 20.1 17.0 26.2 21.1
2006 27.0 17.5 17.4 20.6 18.8
2005 20.6 18.1 20.8 28.3 19.7
2004 52.4 32.6 16.2 20.4 31.9
2.2 Skill level and Labor Dynamics
In view of the theoretical and empirical evidence, skill level is positively associated with the
performance of firms. As mentioned earlier, an important prerequisite for the development of IT
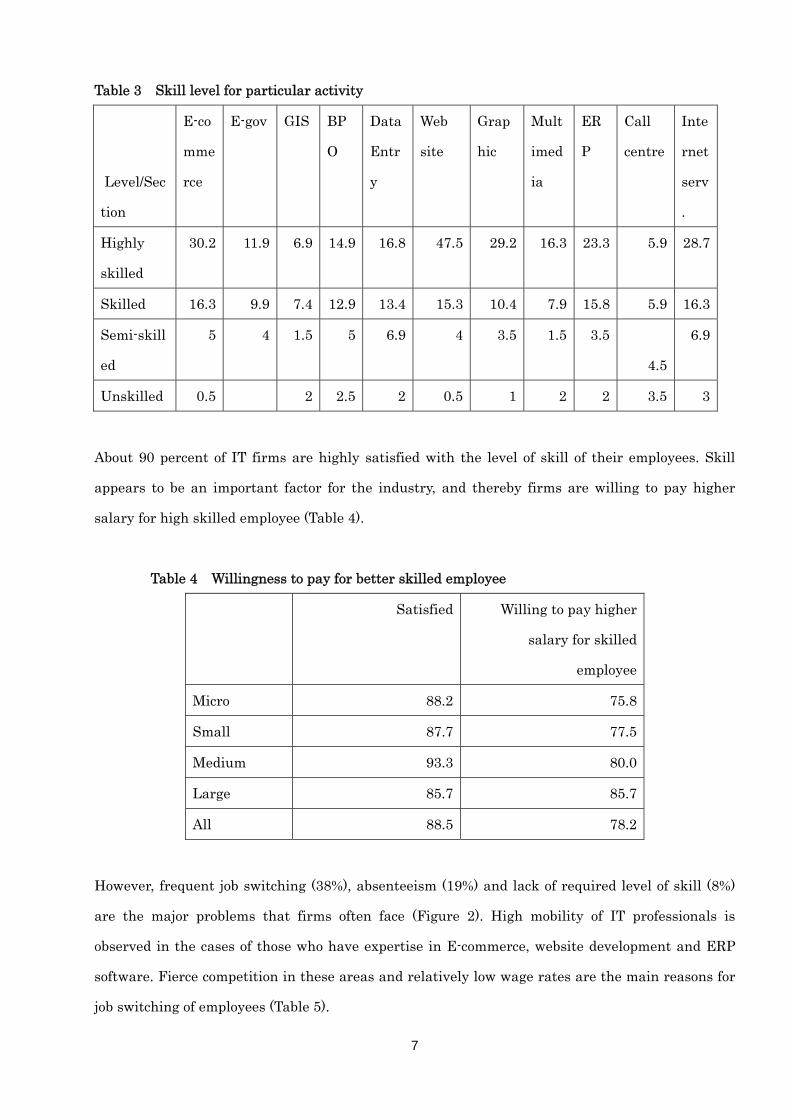
sector is the availability of skilled workforce with cheaper wage rate. Table 3 shows that highly
skilled or skilled workforce is necessary for all the services, but particularly for E-commerce,
website/web-analytics, Enterprise Resource Planning (ERP) and graphic analysis.
7
Table 3 Skill level for particular activity
Level/Sec
tion
E-co
mme
rce
E-gov GIS BP
O
Data
Entr
y
Web
site
Grap
hic
Mult
imed
ia
ER
P
Call
centre
Inte
rnet
serv
.
Highly
skilled
30.2 11.9 6.9 14.9 16.8 47.5 29.2 16.3 23.3 5.9 28.7
Skilled 16.3 9.9 7.4 12.9 13.4 15.3 10.4 7.9 15.8 5.9 16.3
Semi-skill
ed
5 4 1.5 5 6.9 4 3.5 1.5 3.5
4.5
6.9
Unskilled 0.5 2 2.5 2 0.5 1 2 2 3.5 3
About 90 percent of IT firms are highly satisfied with the level of skill of their employees. Skill
appears to be an important factor for the industry, and thereby firms are willing to pay higher
salary for high skilled employee (Table 4).
Table 4 Willingness to pay for better skilled employee
Satisfied Willing to pay higher
salary for skilled
employee
Micro 88.2 75.8
Small 87.7 77.5
Medium 93.3 80.0
Large 85.7 85.7
All 88.5 78.2
However, frequent job switching (38%), absenteeism (19%) and lack of required level of skill (8%)
are the major problems that firms often face (Figure 2). High mobility of IT professionals is
observed in the cases of those who have expertise in E-commerce, website development and ERP
software. Fierce competition in these areas and relatively low wage rates are the main reasons for
job switching of employees (Table 5).

8
Figure 2 Human capital related problems for the IT industry
Firms tend to overcome these problems by increasing salary (63%) or providing promotion (40%).
In other words, the situation indicates scarcity of appropriate human capital required for the
further development of the industry.
Table 5 Labor mobility and reasons
Reasons for mobility Activities
High
mobility
(in 1
month)
High
mobility
(in 3
month)
Many
competitors
Job is not
interesting
Low
salary
Others
E-commerce 6.9 8.4 40.0 6.7 46.7 6.7
E-gov 1.5 4.5 50.0 37.5 12.5
GIS 0.5 2.5 20.0 20.0 40.0 20.0
BPO 3 5 40.0 10.0 40.0 10.0
Data Entry 3 0 20.0 20.0 50.0 10.0
Web site 11.9 11.4 30.0 15.0 45.0 10.0
Graphic 5.4 3.5 18.2 9.1 72.7
Multimedia 3 2 40.0 60.0
ERP 7.4 6.9 25.0 18.8 43.8 12.5
Call centre 0 0.5 100
Interest serv. 5 10.9 26.9 15.4 50.0 7.7

9
Next table shows the salary structure of IT professionals for the year 2008. It shows that family
workers receive slightly higher wages than those of other staff. On average, the monthly salary of
managers is about Tk. 40,000 (US$ 575), Tk. 32000 (US$465) for engineers and about Tk. 10,000
(US$150) for operators. This wage rate is cheaper compared to India (BIDS, 2010).
Table 6 Wage structure of IT Professionals
Family worker Permanent staff Contractual staff
Senior/mid level
manager
41,500 38,000 32,500
Engineer 56,700 32,000 32,500
Operator 7,000 10,000 8500
2.3 Marketing and Promotion
Another important aspect of the software industry is to have better marketing strategies in place.
Exploring new markets, building network and alliances with TNCs, obtaining certificates of
standards and membership of IT leaders, such as Microsoft and IBM could facilitate their entrance
into the global value chain, and thus the performance of software firms. About 40 percent firms are
exporting software services. It is observed that the United States and Canada remain the major
export market for Bangladeshi software firms. While the US and Canada account for 61 percent,
UK accounts for 13 percent, Japan 5 percent and the rest 21 percent.
Figure 3 Export market structure of the IT industry

10
As already mentioned, establishing network and alliances could be an important business strategy
for better market access. Respondents suggest that one of the ways to build a network is to be a
member of a software association (62%). Other ways are to attend market development program
(36%), to visit foreign countries as a part of delegation (25%), and to achieve different quality
certificates such as CMMI and ISO (14%) etc.
Table 7 Strategy to build marketing network
Percentage
Become a member of association 62.4
Attended in marketing development
program
35.6
Went abroad in a delegation on
market promotion
24.8
Achieved quality certificates 14.4
Attended exhibition expo 42.6
Others 5.4
2.4 Access to finance
During the survey, it has emerged that lack of access to finance has been important barriers to
the performance of IT firms in Bangladesh. Another barrier is related to the infrastructure, such as
the lack of electricity supply (Table 8).

11
Table 8 Impediments to development of the IT industry in Bangladesh
1st
Obstacles
2nd
Obstacles
3rd
Obstacles
4th
Obstacles
Access to finance (availability &
cost)
23.8 7.7 8.1 5.7
Access to land 4.5 6.7 3.2 4.6
Business licensing & permits 5.4 5.7 1.6 2.9
Corruption 9.9 10.8 7.0 6.9
Crime, theft & disorder 3.0 4.1 3.8 4.0
Customs & trade regulations 5.4 7.7 2.7 2.9
Electricity 26.7 20.6 14.5 8.6
Inadequate skilled labor 5.9 8.2 12.9 4.6
Labor regulations 2.0 1.5 3.2 1.1
Political stability 3.5 11.3 10.8 9.7
Tax administration 2.0 4.1 4.3 4.6
Tax rate 2.5 3.8 5.1
Transportation 1.0 10.8 10.3
Access to market 3.5 7.2 6.5 14.3
Access to technology 1.0 1.0 2.7 11.4
Copy right 1.0 2.7 2.9
It is observed that very few IT firms have access to formal financial institutions including the
Equity Entrepreneurship Fund (EEF), a venture capital fund provided by the Bangladesh Bank
(Central bank). Most of the IT firms claimed that high interest rates and tangible collateral assets
are the most important obstacle for their access to finance since interest rates are higher,
particularly for micro firms. Average interest rate ranges between 14 and 21 percent (Table 9).

12
Table 9 Average interest rates for borrowing fund from financial institutions
Firm size Short term Mid term long term
Micro 25.0 30.0 16.0
Small 18.6 18.0 14.0
Medium 15.1 19.0 13.8
Large 0 14.5 17.0
All 17.4 21.0 14.2
Table 11 shows that in most cases, software firms use land or building and other personal assets of
owner as collateral for loans since most of the firms do not have tangible assets.
Table 10 Types of collateral needed
Collateral type
Short-term
loan
Mid-term
loan
Long-term
loan
No 42.9 25.0
Land/building 14.3 60.0 30.0
Machinery & equipments
including movables
14.3 20.0 20.0
Accounts receivables and
inventories
20.0 5.0
Personal assets of owner 14.3 5.0
Others 14.3 15.0
3. Impact of the Global Financial Crisis and Determinants of Productivity
3.1 Impact of the Global Financial Crisis
As discussed in the previous section, in Bangladesh, the development of the IT sector has been
supported by the Bangladesh government during the period starting from 2002. Recent sectoral
progress shows that the efforts are coming into effect. As the domestic environment is becoming
favorable with the increase in demand for the IT sector, the external factors have been recently

13
looking severe. When the global financial crisis initiated from the US in 2007, another South Asian
country, which is the leading country in this sector, India, was prone to the decrease in revenue and
performance. Among those IT firms, especially SME firms were affected (Hossain, Shinkai, Yunus,
and Bakht (2010)). For the case of Bangladesh, this crisis might have affected those firms dealing
with the US and Europe mostly if the demand from those countries dropped. At the same time, we
have observed some calling centers from the US were established due to the increase in the cost of
operations in India. If the shift in demand into Bangladesh of the multinational companies in this
sector surpasses the decrease in existing demand from those companies, there might be a chance
that this crisis might have worked positively for the IT sector in Bangladesh. In this section, the
impact of recent global financial crisis is examined using several performance indicators of IT firms.
In addition, the determinants of those performance indicators are investigated.
It seems that the age of owners is mostly concentrated in the 40s and somewhat in the early 50s
whereas in India, the average age of owners is found in the late 30s. This could be resulted from the
reallocation of business between sectors due to the support of the government in terms of tax
incentives, the positive prospect in the market, the increase in graduates of polytechnic institutes
and engineering departments. Some of the owners even said that the impression of handling
business in the IT sector is better than other sectors since the IT sector has the image of modern
industry and advanced technology. The fact that there are quite a few owners in the 50s may also
imply that there might be some cases from early retirement of their former jobs in the public or
private sectors. These owners are young in this sector although they are not new in doing business
as shown in the distribution of age of owners. The average experience of the owners in doing
business is 16.59 years whereas the age of companies in the IT sector is mostly less than 8 years
with peaks in 3, 5, 7, and 8 years. (Figure 4).

14
Figure 4 Age of owners
Age of Owners
0
5
10
15
20
25
30
35
25-27 28-30 31-33 34-36 37-39 40-42 43-45 46-48 50-52 53-55 56-58 60-62 63-65 66-
Figure 5 Age of companies
Age of company
0
5
10
15
20
25
30
1 2 3 4 5 6 7 8 9 10 11 12 13 14 15 16 17 19 21 23
the n
umber
of ob
s.

15
The average size of firms measured by the number of total employees is 40.10 and 11 firms have
more than 100 employees. Next, several performance indicators and the influence of the recent
global financial crisis are considered. First, the rate of profit (gross profit expressed as earnings
before interest and taxes) to revenue is investigated.
Changes in profit rates are presented in Table 11. Among those firms which reported profit rates
each year, the effect of the global financial crisis is not found. On the other hand, when firms are
restricted to those which reported sales figures in 2004, the profit rates seem to have been affected
negatively by the global financial crisis. This ambiguity of the impact of the crisis measured by
profit rates could be caused by some new entrants, which joined after 2004, are relatively
performing better. As more details are examined later in the section where determinants of
productivity are discussed, first the rate of engineers, which is given frequently in the analysis of
the IT sector, is explored.
Table 11 Changes in profit rates
Changes in Profit rates (all obs.) Changes in Profit rates ( for sales in 2004>0)
Obs. Mean Std.Dev Obs. Mean Std.Dev
2008-2007 77 0.0054 0.0890 2008-2007 39 0.0144 0.0889
2007-2006 69 0.0107 0.0762 2007-2006 37 -0.0095 0.0831
2006-2005 62 0.0060 0.0377 2006-2005 37 0.0003 0.0363
2005-2004 50 0.0037 0.0497 2005-2004 36 0.0003 0.0495
It can be concluded that when the rate of engineers goes up, if the scale economy works in a
positive manner, the performance of firms may improve. On the other hand, if the cost disadvantage
of hiring engineers prevails over the scale effect, the performance of firms may deteriorate. Next,

16
the relationship between profit rates and the rate of engineers are examined. Table 12 presents the
correlations between these two variables. In the given five year period, except for 2004, other years
show negative relationships. In 2007 and 2008, especially, the negative correlations are significant.
Therefore, there might be a chance that the cost burden of hiring engineers overcomes the scale
effect. This tendency did not change much when large firms are taken out from the analysis. Then,
next questions will be how the shares of engineers changed over time and whether firms adjusted
the global financial crisis by cost adjustment and/or by the reduction of engineers. In order to
answer these questions, the movement of shares of engineers is examined next by different
categories of firms.
Table 12 Correlations between profit rates and shares of engineers
Profit rates
2004 2005 2006 2007 2008
Share of Engineers
2004 0.0653
(0.6629)
2005 -0.0562
(0.667)
2006 -0.0647
(0.6032)
2007 -0.1907*
(0.0989)
2008 -0.2473**
(0.027)
Note: ** significant at 5% level, * significant at 10% level
Table 13 shows changes in shares of engineers overtime. A decrease in the share of engineers is
observed between 2006 and 2007 for SMEs with less than 100 employees. On the other hand, this

17
decrease between 2006 and 2007 is not detected for large firms with more than or equal to 100
employees. This probably coincides with the view that the scale effect might work better in large
firms rather than in SMEs, thus large firms tend to keep hiring more engineers despite the
downturn of the economy. Alternatively, for SMEs, the cost disadvantage might be stronger and
they reserve hiring engineers in difficult time.
Next, another performance indicator, productivity of firms is investigated.
Table 13 Shares of engineers
Share of Engineers
Obs. Mean Std. Dev.
2008 191 0.4888 0.2526
2007 187 0.4820 0.2549
2006 170 0.4704 0.2517
2005 136 0.4622 0.2417
2004 102 0.4493 0.2444

18
Table 14 Changes in shares of engineers
Less than 100 employees Less than 100 employees
Changes in Share of Engineers Changes in Share of Engineers
(for sales in 2004>0)
Obs. Mean Std. Dev. Obs. Mean Std.Dev.
2008-2007 174 0.0109 0.0793 2008-2007 73 0.0125 0.0688
2007-2006 159 -0.0038 0.0549 2007-2006 71 -0.0050 0.0415
2006-2005 127 0.0037 0.0556 2006-2005 71 -0.0036 0.0566
2005-2004 94 0.0079 0.0706 2005-2004 69 0.0117 0.0711
More than or equal to 100 employees More than or equal to 100 employees
Changes in Shares of
Engineers Changes in Shares of Engineers
(for sales in 2004>0)
Obs. Mean Std. Dev. Obs. Mean Std.Dev.
2008-2007 12 -0.0374 0.1331 2008-2007 5 0.0254 0.0304
2007-2006 11 0.0012 0.0245 2007-2006 5 0.0055 0.0237
2006-2005 9 0.0175 0.0476 2006-2005 5 0.0046 0.0280
2005-2004 8 0.0050 0.0470 2005-2004 5 -0.0102 0.0243

19
Productivity here is measured by Total Productivity (TP) defined as the Hicks neutral efficiency
term in the production function.
itititititit KCSLLSYTP lnlnlnln −−= (1)
when Y represents sales, L is labor, LS is labor share, CS is capital share, and K is capital
respectively. i represents a firm and t represents year. Capital was constructed by reported Capital
in 2008 and investment each year. Capital share was calculated from the replacement cost and
sales. Labor share was computed from wages and the number of employees and sales6. Total
Productivity here resembles Total Factor Productivity (TFP). However, more strictly speaking,
Value Added instead of sales/output should be used to calculate TFP. For IT firms, materials may
not be a major component, such that TP and TFP may not differ much. Nevertheless, in order to
differentiate the method to lead the difference in results, here we call Total Productivity following
Hulten, Bennathan, and Srinivasan (2006). Productivity growth between 2004 and 2008 is
presented in Table 15. The negative growth rates in the 2005-2006 period and the 2006-2007 period
are observed for SMEs. When firms are restricted to those, which reported sales in 2004, the same
tendency remains but the negative growth in the 2006-2007 period is larger. In contrast, in large
firms, the negative growth rates were found both in the 2006-2007 period and the 2007-2008 period.
This might be partly from the retaining the input structure as much as possible in the downturn,
whereas SMEs seem to have adjusted input structure in those periods more quickly. In the
following section, total productivity is revisited in order to find out the sources of the productivity.
6 Here, capital was calculated from the average investment rate and depreciation rate in the data. For input shares, reported figures in 2008 were used to calculate shares of inputs. Then, the average of those figures was used for all firms and all years.

20
Table 15 Productivity growth between 2004 and 2008
Less than 100 employees Less than 100 employees
TP growth rate TP growth rate
(for sales in 2004>0)
Obs. Mean Std. Dev. Obs. Mean Std. Dev.
2008-2007 140 0.0065 0.8805 2008-2007 70 0.0692 1.0344
2007-2006 123 -0.0254 0.5668 2007-2006 69 -0.0757 0.4692
2006-2005 89 -0.0456 0.3702 2006-2005 69 -0.0453 0.3386
2005-2004 67 0.0056 0.3915 2005-2004 67 0.0056 0.3915
More than or equal to 100 employees More than or equal to 100 employees
TP growth rate TP growth rate
(for sales in 2004>0)
Obs. Mean Std. Dev. Obs. Mean Std. Dev.
2008-2007 8 -0.3565 2.0725 2008-2007 4 -1.2902 2.2591
2007-2006 8 0.0355 0.3664 2007-2006 5 -0.0872 0.1077
2006-2005 6 0.0678 0.3319 2006-2005 5 0.0644 0.3710
2005-2004 5 0.0282 0.3035 2005-2004 5 0.0282 0.3035
3.2 Determinants of Productivity
In the previous section, total productivity growth and the impact of the recent global financial
crisis have been examined for the period between 2004 and 2008. As seen in the trend of total
productivity growth as well as in the change of shares of engineers, the difference in firm behaviors

21
among SMEs and large firms is detected. Whereas some firms stay productive from the beginning,
others face difficulties. Firms can also take several approaches during the downturn, such as
adjusting cost structures to become more efficient, exploring new markets, building a strategy to
emphasize strength and/or lessen weakness etc. In this section, factors which contribute to a higher
level of total productivity are investigated. The logarithm of total productivity may be considered as
a summation of a factor which affects the whole IT sector and factors which are firm and time
specific as indicated above.
itit xTP βα += lnln (2)
where α is the sector specific factor and itx are firm specific factors. Firm specific factors are
divided into 4 groups; 1) cost structures, represented by ln (the number of engineers) and shares of
engineers, 2) market structures, expressed by percentages of outsourcing, export shares, and main
market activities, 3) strategies based on strength and weakness, such as participations in external
training program (yes or no) and financial access indicators 7 , and 4) other firm specific
characteristics, such as years of experience of owners and the age of firms. As strength, human
resource management was mostly quoted. On the other hand, as weakness, access to financial
resources was the option most heavily cited. In addition, since the behavior of SMEs is a main
concern, only those firms with less than 100 employees are included for the rest of the analysis
here8. Results of regression analyses are demonstrated in Table 16. It is evident that for most firms,
the higher the share of export is, the larger total productivity would be. On the other hand, the
percentage of outsourcing within the domestic market has a significant negative relationship with
total productivity, especially for those firms which are more than 5 years old. This can be due to the
fact that those firms, which are less efficient, may outsource tasks to others in the domestic market.
As for activities, E-governance tends to increase the level of total productivity for those firms which
are more than 5 years old. For younger firms, which established firms less than or equal to 5 years,
not a single activity seems to significantly contribute to the level of total productivity. Although
whether senior managers had any outside training seems to be positively related with total
productivity, the coefficients are not significant. The age of company also seems to have no
7 A dummy variable was created based on replies of owners. When owners said interest rates, fees, or collateral are major or severe obstacles, it is indicated as one. 8 Due to the availability of some of the explanatory variables, total productivity in 2008 is examined only.

22
relationship with total productivity. Overall, although the signs of coefficients seem to mostly
coincide with predictions for those 4 sets of explanatory variables, those variables which represent
market orientations and market structures explain total productivity of SMEs in the Bangladeshi
IT sector the most.

23
Table 16 Determinants of total productivity All firms Firms Firms, less than or
more than 5 years old equal to 5 years old
Coefficients Std. Err. Coefficients Std. Err. Coefficients Std. Err.
Ln (Experience of owner) -0.0962 0.1619 -0.1108 0.2583 -0.0899 0.2333
Ln (Age of firm) 0.1152 0.1329 -0.0450 0.3682 0.2444 0.3028
Ln (Number of Engineers) 0.1105 0.1313 0.1979 0.1638 -0.0132 0.2335
Ln(Share of engineer) -0.6548 0.5670 -0.7716 0.7963 -0.3501 0.8838
% of outsourcing -0.6622 * 0.3840 -1.0320 ** 0.4756 0.1568 0.6833
% of exports 0.7477 ** 0.2878 0.4619 0.4662 0.8127 * 0.3932
E-commerce -0.0001 0.1984 0.1759 0.2583 0.0368 0.3357
BPO -0.1301 0.2380 0.3635 0.3296 -0.3898 0.3758
E-gov. 0.1521 0.2477 0.8984 ** 0.3268 -0.6259 0.4103
ERP 0.0049 0.2302 -0.1735 0.3080 0.1554 0.4055
GIS 0.5728 0.3692 0.4516 0.4557 0.9682 0.6726
Website 0.3118 0.1866 -0.0058 0.2552 0.4350 0.3105
Call center -0.1693 0.5590 -0.1837 0.6471
Training 0.1360 0.2229 0.0833 0.2753 0.0223 0.3943
Access to finance -0.1965 0.2449 -0.3568 0.2824 -0.1983 0.5182
Constant 5.5403 ** 0.4932 5.8593 ** 0.8758 5.4721 ** 0.8287
R2 0.1358 0.2683 0.1861
Obs. 156 79 77
Note: ** significant at 5% level * significant at 10% level

24
4. Useful policies for the IT Industry
In this section, useful policies for the IT industry are considered. Based on our survey
results, infrastructure development and tax exemption seem to be the most preferred
policies for the development of the IT sector (Table 17). Export promotion and training
of engineers are other preferred concerns of the firms.
Table 17 Useful policy for IT business (Percent)
1st preference
2nd preference
3rd preference
Infrastructure development
64.8 0 0
Tax exemption 21.2 51.7 0 Export promotion 6.7 20.0 34.4 Trade licensing facilitation 2.2 8.3 9.4 Export licensing facilitation
.6 2.5 10.9
Training of engineers 2.8 14.2 43.8 Others 1.7 3.3 1.6
Establishing more IT parks could solve the infrastructure bottlenecks for the IT
industry. About 87 percent respondents shared the view that an IT park is necessary for
the development of the IT industry in Bangladesh. They suggest that the Park should
have the facilities like training institute (41%), uninterrupted electricity (42%), foreign
company contact points (20%) etc.(Table 18).
Table 18 Important facilities for IT park (Percent) Facility type Rank-1 Rank-2 Rank-3 Rank-4 Rank-5 Training Institute 40.6 22.8 13.9 6.8 4.8University 4.0 9.4 6.7 9.5 11.2Conference center 4.6 18.7 21.8 18.9 18.4Library .6 4.7 9.7 18.2 17.6Hostels 1.7 1.8 2.4 4.7 5.624 hours electricity & other infrastructure
42.3 20.5 18.2 10.8 2.4
Bank 2.9 9.1 14.2 12.8Foreign companies contact points
5.1 18.1 16.4 14.9 24.8
Other 1.1 1.2 1.8 2.0 2.4

25
For the overall development of the IT industry in Bangladesh, more IT clusters/parks,
more skilled workforce, more infrastructure, more training institutes seem to be
required. Moreover, industry-academia linkages and FDI are necessary to reap the
benefits of this industry (Table 19). They also suggest that these facilities will further
help attract more foreign investments in this sector.
Table 19 Suggestions for further development of the IT industry
Rank-1 Rank-2 Rank-3 Rank-4 Rank-5
More clustering 10.9 6.0 4.0 3.7 6.9 More skilled workforce 35.1 19.9 8.5 6.9 6.3 More training institutes 14.4 21.4 15.6 8.0 6.9 More infrastructure 21.3 18.9 21.1 5.3 2.9 Industry-academia linkage 3.5 10.0 14.1 13.8 8.6 Foreign investment 6.4 10.4 16.6 18.1 11.4 Political stability 4.5 6.5 13.6 23.9 15.4 Reduce corruption 3.0 2.5 2.0 8.5 22.3 Partnership with other companies in the same sector in Bang
2.5 1.5 6.9 9.7
Decrease VAT 1.0 2.0 4.8 9.1 Others 1.0 1.0 1.0 .6
5. Concluding remarks
The recent global financial crisis has affected negatively various countries not only
directly but also indirectly from the drop in demand. However, some of the sectors might
have enjoyed cost advantage owing to the downturn of the economy of international
investors, which might have shifted supply system for services. This advantage can
overcome the reduction in sales from the demand side. In order to investigate the
impact of the recent global financial crisis in one of the leading service sectors in South
Asia and detect cost advantage effects, the IT sector in Bangladesh was examined.
It is found that performance indicators measured by profit rates got worsened in
2006-2007. The share of engineers seems to be negatively correlated with profit rates.
This fact indicates that firms in the IT sector have adjusted market structures rather
than cost structures during the downturn. This tendency is supported by the results
from the regression analysis based on total productivity at the firm level. The rate of

26
outsourcing within the domestic market is negatively and the share of exports is
positively related to the level of total productivity in 2008 in this sector. As for firms,
which are more than 5 years old, E-governance activities contribute to the higher level
of total productivity.
In terms of policies, infrastructure development and tax exemption are more
preferred policies by the surveyed IT firms, followed by export promotion and training of
engineers. For further development of the IT industry, it would be recommendable to
target these factors in supporting this industry.
27
References Hossain, M., N. Shinkai, M. Yunus, and Z. Bakht (2010). Integration of ICT Industries and Its Impact on Market Access and Trade: The Case of Bangladesh and India, Draft Report, 2010, Bangladesh Institute of Development Studies. Hulten, C., E. Bennathan, and S. Srinivasan (2006), “Infrastructure, Externalities, and Economic Development: A Study of the Indian Manufacturing Industry”, The World Bank Economic Review, Vol. 20, No. 2, pp. 291-308. Kraemer, K., J. Dedrick, and D. Dunkle (2010), Offshoring of Software Development: Patterns and Recession Effects, Irvine, University of California Kumar, N. (2001). “National Innovation System and the Indian Software Industry Development” Background paper for the World Industrial Development Report, 2002, Vienna, UNIDO. Kumar, N. (2005). “Indian software industry development: National and international perspectives”, in Ashwani, S. and M. Vijayabaskar (eds), ICTs and Indian Economic Development, SAGE Publications, 2005. Lateef, A. (1997). “Linking up with the Global Economy: A case study of the Bangalore Software Industry”, NIOP, DP/96/97, Geneva: International Institute for Labor Studies. Lewin, A. and V. Cuoto. (2007). Next Generation Offshoring: The Globalization of Innovation. Durham, NC: Duke Offshoring Research Network. NASSCOM. (2010). Annual Report 2009-2010. NASSCOM. OECD (2002). Measuring the Information Economy, OECD. ______,(2010). OECD Science, Technology and Industry Outlook 2010, OECD. Piazolo D. (2001). The Digital Divide, CESifo Forum, Vol 2, no 3, pp. 29-34. Poverty Reduction and Economic Management Unit, the World Bank (2007). Bangladesh: Strategy for Sustained Growth, Bangladesh Development Series Paper No. 18, The World Bank. Solow, R. (1957). “Technical Change and the Aggregate Production Function.” Review of Economics and Statistics, Vol. 39, pp. 312-20.