grade 6 numerical patterns - university of winnipegion.uwinnipeg.ca/~jameis/my course/my3stages/gr 6...
TRANSCRIPT
Grade 6 Numerical Patterns
6.PR.16.PR.1
Demonstrate an understanding of the relationships within tables of values to solve problems.
1. Generate values in one column of a table of values, values in the other column and a pattern rule.
2. State, using mathematical language, the relationship in a table of values.3. Create a concrete or pictorial representation of the relationship shown in
a table of values.4. Predict the value of an unknown term using the relationship in a table of
values and verify the prediction.5. Formulate a rule to describe the relationship between two columns of
numbers in a table of values.6. Identify missing elements in a table of values.7. Identify errors in a table of values.8. Describe the pattern within each column of a table of values.9. Create a table of values to record and reveal a pattern to solve a problem.
6.PR.26.PR.2
Represent and describe patterns and relationships using graphs and tables.
10. Translate a pattern to a table of values and graph the table of values (limit to linear graphs with discrete elements).
11. Create a table of values from a pattern or a graph.12. Describe, using everyday language, orally or in writing, the relationship
shown on a graph.
Clarification of the outcome:
✦ The emphasis is on the input/output rule (I/O rule). The pattern/relationship between output values (as observed in a T-chart) is helpful for determining the I/O rule.
✦ The outcomes are combined because they are closely related. As well, two duplicate achievement indicators from outcome 6.PR.3 are addressed: (1) Describe the relationship in a table using a mathematical expression and (2) Represent a pattern rule using a simple mathematical expression, such as 4d or 2n + 1.
Required close-to-at-hand prior knowledge:
✤ Understand grade 5 patterning.✤ Understand there is an input/output relationship between two variables.

SET SCENE stage
The problem task to present to students:
Have students design an animal made from joined squares. They make different sizes of the animal so that a pattern involving the number of squares exists between consecutive sizes. Using a paint program, they create an animal design instruction sheet that includes:
➡ three consecutive size drawings of the animal, ➡ a T-Chart for predicting the number of squares needed for making the 20th size of
the animal,➡ a description of a pattern they used to create the animals.
Here is an example of what students are expected to do for the problem task.
To make the next animal:• Increase the length of the
body between the legs by 1 square.
• Increase the length of each leg by 1 square.
• Increase the length of the neck by 1 square and the width of the head by 1 square.
When you count the squares for the first three sizes you get 8, 13, and 18 squares.The number of squares increases by 5 each time. You can use this pattern to figure out the number of squares for size #4 and size #5. If you draw animal size #4, you will find you need to draw 23 squares to make it.
Comments:
The activity is open-ended. It allows students freedom to create interesting shapes for which the numerical patterns are within their comfort zone of difficulty. The activity involves computer technology, something that usually captures student interest and revisits Grade 5 knowledge about making a T-chart, predicting and confirming, and explaining rules.
DEVELOP stage
Activity 1: Revisits SET SCENE and addresses achievement indicator 1.
✦ Ask some students to show their designs and explain the patterns. [NOTE: The patterns students describe should only concern what they see. Do not focus on the input/output rule type of pattern yet.]
✦ Discuss where students have seen designs that might have patterns in them (e. g., paving bricks or wallpaper). Discuss why identifying and extending number patterns might be a useful skill.
Comments:
The designation of vertical and horizontal in relation to a T-chart depends on which direction the T-chart is oriented. The important matter is NOT the orientation in space of the T-chart. Rather, the important matter is whether the pattern in question is the pattern between input and output values (I/O rule) or the pattern between consecutive outputs values.Two orientations of the T-chart are used in what follows.

Activity 2: Addresses achievement indicators 2, 5, and 8.
✦ Create two input/output rules of the form 'N x input + B' (e.g. double the input, then add 3 to the result). Do not tell students the rules. Use each rule to complete two T-charts. Present students with the two completed T-charts (see examples).
✦ Have students determine the pattern between the output values. Discuss their thinking. ✦ Have students determine the pattern between input and output (the input/output rule).
[This will be more difficult for them. Assist as necessary.] Discuss their thinking and lead them to realize that the constant number being added between consecutive outputs is the multiplier for the input/output rule (see examples).

Activity 3: Addresses achievement indicator 2, 4, 5, 7, and 8, and practice.
✦ Provide students with at least three T-charts, where each one has data missing (see example). Have students determine the missing values by determining and using the input/output rule.
✦ Provide students with T-charts consisting of five input/output pairings. At least one output value is incorrect in each T-chart (see example: two errors in it). Ask students to determine the error(s) and the correct it/them.
Comments:
Encourage students to use the pattern within a pattern, namely, that the constant increase between consecutive output values in the T-chart is the multiplier number in the I/O rule (Refer to activity #2).

Activity 4: Addresses achievement indicators 1, 2, 3, 4, 5, 6, 8, 9, and 11.
✦ Provide students with a suitable problem (see example).• Determine the perimeters for the first three hexagon chains (the unit of length is one side
of a hexagon).• Record the data in a T-table and look for patterns. Confirm your prediction by drawing
chain #4.• Determine the input/output rule. Explain how you figured it out.• Predict the perimeter for a chain consisting of 200 hexagons, using the input out put rule.
Here a sample student response.
Comments:
Encourage students to use the pattern within a pattern, namely, that the constant increase between consecutive output values in the T-chart is the multiplier number in the I/O rule (Refer to activity #2).

Activity 5: Addresses achievement indicators 1, 2, 3, 4, 5, 6, 8, 9, and 11, and practice.
✦ Provide students with three diagrams for a chain of squares. The squares are made with small sticks such as toothpicks. Have students make/draw the next diagram. With teacher assistance, have them make a T-chart (diagram number and number of sticks) and identify the two kinds of patterns in the chart: the input/output rule and the pattern between consecutive output values.
✦ Have students determine the number of sticks needed to make the 50th diagram, using the input/output rule they identified. See below for the initial three diagrams of the chain of squares and for appropriate student responses to the tasks.
Comments:
Encourage students to use the pattern within a pattern, namely, that the constant increase between consecutive output values in the T-chart is the multiplier number in the I/O rule (Refer to activity #2).

Activity 6: Addresses achievement indicators 1, 2, 3, 4, 5, 6, 8, 9, and 11, and practice.
✦ Provide students with the following problem. A fence is constructed using posts and boards. The number of boards between adjacent posts is always two (see diagram). How many boards will you need to build a fence having 40 posts?
✦ Have students make/draw the next fence. Have them make a T-chart and identify the two kinds of patterns in the chart: the input/output rule and the pattern between consecutive output values. Have students determine the number of boards needed to make the 40th fence, using input/output rule they identified.
Comments:
Encourage students to use the pattern within a pattern, namely, that the constant increase between consecutive output values in the T-chart is the multiplier number in the I/O rule (Refer to activity #2).
Activity 7: Addresses achievement indicators 1, 2, 3, 4, 5, 6, 8, 9, and 11, and practice.
✦ Provide students with the following problem. The letter T can be constructed, using square bricks. Each time, the T can be made wider and thicker (see below for the first three T’s of the series). How many bricks will you need to build the 40th letter T?
✦ Have students make/draw the next letter T. Have them make a T-chart and identify the two kinds of patterns in the chart: the input/output rule and the pattern between consecutive output values. Have students predict the number of bricks needed to make the 40th letter T, using the input/output rule they identified.
Comments:
Encourage students to use the pattern within a pattern, namely, that the constant increase between consecutive output values in the T-chart is the multiplier number in the I/O rule (Refer to activity #2).

Activity 8: Addresses achievement indicators 2, 3, 10, 11 and 12.
✦ Select a T-chart from one of the previous activities. [The T-chart from activity #4 (Chain # vs perimeter) is the example here.]
✦ Have students make a dot graph (a graph only showing discrete values, 1, 2, 3, etc.) of the data. Discuss that the input (chain #) goes on the horizontal axis and the output (perimeter) goes on the vertical axis. Assist as needed. The completed graph would look as shown. Discuss why the dots should not be joined. [The data is not continuous. In other words, the chain numbers can only be whole numbers.] Discuss how the graph shows the data from the T-chart.
✦ Repeat the activity for a T-chart from another activity.
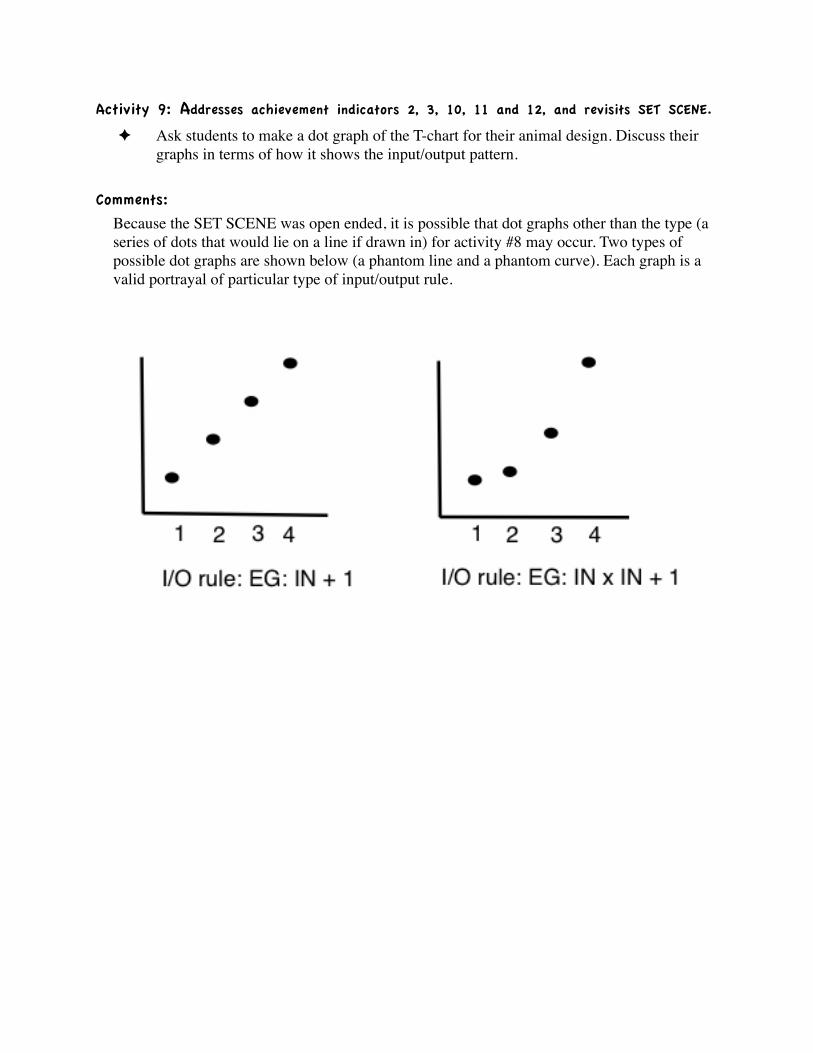
Activity 9: Addresses achievement indicators 2, 3, 10, 11 and 12, and revisits SET SCENE.
✦ Ask students to make a dot graph of the T-chart for their animal design. Discuss their graphs in terms of how it shows the input/output pattern.
Comments:
Because the SET SCENE was open ended, it is possible that dot graphs other than the type (a series of dots that would lie on a line if drawn in) for activity #8 may occur. Two types of possible dot graphs are shown below (a phantom line and a phantom curve). Each graph is a valid portrayal of particular type of input/output rule.

Activity 10: Addresses achievement indicator 2, 3, 10, 11 and 12, and practice.
✦ Provide students with completed T-charts. Have them make the dot graphs and determine the input/output rule from the dot graphs.
✦ Have them confirm their thinking by determining the input/output rule and relationship between output values from the T-charts. Discuss the results.
Activity 11: Assessment of teaching.
Have students use pattern-block squares to copy and extend the following donut designs. They determine the number of squares for each donut size, record the data in a T-chart and look for patterns. They predict the number of squares needed to make donut #100 and describe the I/O rule used to predict the number of squares needed for donut #100. Have students make a dot graph from the T-chart.
If all is well with the assessment of teaching, engage students in PRACTICE (the conclusion to the lesson plan).
One example of partially well-designed worksheet follows.
The worksheet contains a sampling of question types. More questions of each type are needed for a well-designed worksheet.
The MAINTAIN stage follows the sample worksheets.

Question 1.What is the input/output rule for the T-chart data. ________________________Use the I/O rule to fill in the missing values.
INPUT OUTPUT
1 6
2 8
3 10
4
5 14
50
Question 2.There are two output errors in the T-chart. Circle them and then correct them.
INPUT OUTPUT
1 2
2 5
3 8
4 12
5 14
6 17
30 91

Question 3.Make a T-chart form the information on the graph and determine the input/output rule.
INPUT OUTPUT GRAPH
Question 4.a) Draw the next shape in the series.
b) Place the data in the T-chart.
SHAPE # Number of sticks to build it
1 3
2 5
3
4
c) Determine the inout/output rule. ___________________d) How many sticks are needed to build shape #200? ___________________

MAINTAIN stage
Mini-task example
Every so often:
• Present students with a T-chart. Ask them to determine the inout/output rule.
Rich-task example #1
Have students solve the following problem. A T-rex fence is made with concrete posts and steel rods that connect the posts. There are always 4 rods between two consecutive posts. How many rods are needed in all to make a fence having 50 posts? Each rod costs $35 and each post costs $280. What is the total cost of the fence materials? Have students use a T-chart and the input/output rule to solve the problem. Ask them to describe the input/output rule (e. g., rods = 4 x posts – 4).
Rich-task example #2
Provide students with clay and toothpicks to construct skeletons of pyramids. Ask them to construct a triangular pyramid (pyramid #1: base is an equilateral triangle), a square pyramid (pyramid #2: base is a square), a pentagonal pyramid (pyramid #3: base is a regular pentagon), and a hexagonal pyramid (pyramid #4: base is a hexagon). Have students count the number of sticks (edges) and the number of clumps of clay (vertices) needed to build each type of pyramid. Have them count the number of faces of each pyramid. Have them construct three T-charts of the data. Chart #1 has pyramid number and number of sticks as the headings. Chart #2 has pyramid number and number of clumps of clay as headings. Chart #3 has pyramid number and number of faces as headings. Ask students to determine the input/output rule and the pattern between consecutive output values. for each T-chart. [See samples.] Ask them to determine the number of sticks, the number of clumps of clay, and the number of faces for pyramid #10 (has a 12-sided regular polygon as its base), using the input/output rules. Have them construct pyramid #10 to verify what they determined by using the I/O rules.