grade 6 louisiana student standards: companion document ... · louisiana student standards:...
TRANSCRIPT

Grade 6
Louisiana Student Standards: Companion Document for Teachers 2.0
This document is designed to assist educators in interpreting and implementing Louisiana’s new mathematics standards. It contains descriptions of each grade 6 math standard to answer questions about the standard’s meaning and how it applies to student knowledge and performance. Version 2.0 has been updated to include information from LDOE’s Grade 6 Remediation
and Rigor documents. Some examples have been added, deleted or revised to better reflect the intent of the standard. Examples are samples only and should not be considered an exhaustive list.
This companion document is considered a “living” document as we believe that teachers and other educators will find ways to
improve the document as they use it. Please send feedback to [email protected] so that we may use your input when updating this guide.
Additional information on the Louisiana Student Standards for Mathematics, including how to read the standards’ codes, a
listing of standards for each grade or course, and links to additional resources, is available at http://www.louisianabelieves.com/resources/library/k-12-math-year-long-planning.
Posted September 15, 2017

1
Louisiana Student Standards: Companion Document for Teachers
Grade 6 Math
Table of Contents Introduction
How to Read Guide.............................................................................................................................................................. 2 Classification of Major, Supporting, and Additional Work.................................................................................................. 3 Components of Rigor ........................................................................................................................................................... 3
Grade Level Standards and Sample Problems
Standards for Mathematical Practice .................................................................................................................................. 4 Ratios and Proportional Relationships ................................................................................................................................ 6
The Number System .......................................................................................................................................................... 10 Equations and Expressions ................................................................................................................................................ 22 Geometry ........................................................................................................................................................................... 31 Statistics and Probability ................................................................................................................................................... 36
Lower Grade Standards for Addressing Gaps
Grade 1 Standards ............................................................................................................................................................. 45 Grade 3 Standards ............................................................................................................................................................. 45 Grade 4 Standards ............................................................................................................................................................. 45 Grade 5 Standards ............................................................................................................................................................. 46

2
Louisiana Student Standards: Companion Document for Teachers
Grade 6 Math
How-to-Read Guide
The diagram below provides an overview of the information found in all companion documents. Definitions and more complete descriptions are provided on the next page.
3
Louisiana Student Standards: Companion Document for Teachers
Grade 6 Math
1. Domain Name and Abbreviation: A grouping of standards consisting of related content that are further divided into clusters. Each domain has a unique abbreviation and is provided in parentheses beside the domain name.
2. Cluster Letter and Description: Each cluster within a domain begins with a letter. The description provides a general overview of the focus of the standards in the cluster.
3. Previous Grade(s) Standards: One or more standards that students should have mastered in previous grades to prepare them for the current grade standard. If students lack the pre-requisite knowledge and remediation is required, the previous grade standards provide a starting point.
4. Standards Taught in Advance: These current grade standards include skills or concepts on which the target standard is built. These standards are best taught before the target standard.
5. Standards Taught Concurrently: Standards which should be taught with the target standard to provide coherence and connectedness in instruction. 6. Component(s) of Rigor: See full explanation on components of rigor below. 7. Sample Problem: The sample provides an example how a student might meet the requirements of the standard. Multiple examples are provided for
some standards. However, sample problems should not be considered an exhaustive list. Explanations, when appropriate, are also included. 8. Text of Standard: The complete text of the targeted Louisiana Student Standards of Mathematics is provided. Classification of Major, Supporting, and Additional Work Students should spend the large majority of their time on the major work of the grade. Supporting work and, where appropriate, additional work can engage students in the major work of the grade. Each standard is color-coded to quickly and simply determine how class time should be allocated. Furthermore, standards from previous grades that provide foundational skills for current grade standards are also color-coded to show whether those standards are classified as major, supporting, or additional in their respective grades. Components of Rigor The K-12 mathematics standards lay the foundation that allows students to become mathematically proficient by focusing on conceptual understanding, procedural skill and fluency, and application.
Conceptual Understanding refers to understanding mathematical concepts, operations, and relations. It is more than knowing isolated facts and methods. Students should be able to make sense of why a mathematical idea is important and the kinds of contexts in which it is useful. It also allows students to connect prior knowledge to new ideas and concepts.
Procedural Skill and Fluency is the ability to apply procedures accurately, efficiently, and flexibly. It requires speed and accuracy in calculation while giving students opportunities to practice basic skills. Students’ ability to solve more complex application tasks is dependent on procedural skill and fluency.
Application provides a valuable content for learning and the opportunity to solve problems in a relevant and a meaningful way. It is through real-world application that students learn to select an efficient method to find a solution, determine whether the solution makes sense by reasoning, and develop critical thinking skills.

4
Louisiana Student Standards: Companion Document for Teachers
Grade 6 Math
Standards for Mathematical Practices
The Louisiana Standards for Mathematical Practice are expected to be integrated into every mathematics lesson for all students in grades K-12. Below are a few examples of how these practices may be integrated into tasks that students in grade 6 complete.
Louisiana Standards for Mathematical Practice (MP) Louisiana Standard Explanations and Examples 6.MP.1 Make sense of problems and persevere in solving them.
In grade 6, students solve problems involving ratios and rates and discuss how they solved them. Students solve real-world problems through the application of algebraic and geometric concepts. Students seek the meaning of a problem and look for efficient ways to represent and solve it. They may check their thinking by asking themselves, “What is the most efficient way to solve the problem?”, “Does this make sense?”, and “Can I solve the problem in a different way?”
6.MP.2 Reason abstractly and quantitatively.
In grade 6, students represent a wide variety of real-world contexts through the use of real numbers and variables in mathematical expressions, equations, and inequalities. Students contextualize to understand the meaning of the number or variable as related to the problem and decontextualize to manipulate symbolic representations by applying properties of operations.
6.MP.3 Construct viable arguments and critique the reasoning of others.
In grade 6, students construct arguments using verbal or written explanations accompanied by expressions, equations, inequalities, models, and graphs, tables, and other data displays (i.e. box plots, dot plots, histograms, etc.). They further refine their mathematical communication skills through mathematical discussions in which they critically evaluate their own thinking and the thinking of other students. They pose questions like “How did you get that?”, “Why is that true?” “Does that always work?” They explain their thinking to others and respond to others’ thinking.
6.MP.4 Model with mathematics.
In grade 6, students model problem situations symbolically, graphically, tabularly, and contextually. Students form expressions, equations, or inequalities from real-world contexts and connect symbolic and graphical representations. Students begin to explore covariance and represent two quantities simultaneously. Students use number lines to compare numbers and represent inequalities. They use measures of center and variability and data displays (i.e. box plots and histograms) to draw inferences about and make comparisons between data sets. Students need many opportunities to connect and explain the connections between the different representations. They should be able to use all of these representations as appropriate to a problem context.

5
Louisiana Student Standards: Companion Document for Teachers
Grade 6 Math
6.MP.5 Use appropriate tools strategically.
Students consider available tools (including estimation and technology) when solving a mathematical problem and decide when certain tools might be helpful. For instance, students in grade 6 may decide to represent similar data sets using dot plots with the same scale to visually compare the center and variability of the data. Additionally, students might use physical objects or applets to construct nets and calculate the surface area of three-dimensional figures.
6.MP.6 Attend to precision.
In grade 6, students continue to refine their mathematical communication skills by using clear and precise language in their discussions with others and in their own reasoning. Students use appropriate terminology when referring to rates, ratios, geometric figures, data displays, and components of expressions, equations or inequalities.
6.MP.7 Look for and make use of structure.
Students routinely seek patterns or structures to model and solve problems. For instance, students recognize patterns that exist in ratio tables recognizing both the additive and multiplicative properties. Students apply properties to generate equivalent expressions (i.e. 6 + 2x = 2 (3 + x) by distributive property) and solve equations (i.e. 2c + 3 = 15, 2c = 12 by subtraction property of equality; c=6 by division property of equality). Students compose and decompose two- and three-dimensional figures to solve real-world problems involving area and volume.
6.MP.8 Look for and express regularity in repeated reasoning.
In grade 6, students use repeated reasoning to understand algorithms and make generalizations about patterns. During multiple opportunities to solve and model problems, they may notice that a/b ÷ c/d = ad/bc and construct other examples and models that confirm their generalization. Students connect place value and their prior work with operations to understand algorithms to fluently divide multi-digit numbers and perform all operations with multi-digit decimals. Students informally begin to make connections between covariance, rates, and representations showing the relationships between quantities.

6
Louisiana Student Standards: Companion Document for Teachers
Grade 6 Math
Ratios and Proportional Relationships (RP) A. Understand ratio concepts and use ratio reasoning to solve problems. In this cluster, the terms students should learn to use with increasing precision are ratio, ratio relationship, equivalent ratios, rate, unit rate, part-to-part ratio, part-to-whole ratio, and percent.
Louisiana Standard Explanations and Examples 6.RP.A.1 Understand the concept of a ratio and use ratio language to describe a ratio relationship between two quantities. For example, “The ratio of wings to beaks in the bird house at the zoo was 2:1, because for every 2 wings there was 1 beak.” “For every vote candidate A received, candidate C received nearly three votes.”
Component(s) of Rigor: Conceptual Understanding Remediation - Previous Grade(s) Standard: 4.OA.A.2, 4.MD.A.1, 5.OA.B.3, 5.NF.B.5 6th Grade Standard Taught in Advance: none 6th Grade Standard Taught Concurrently: none A ratio is an ordered pair of numbers (a, b) where both a and b are not zero. A ratio relationship is a set of all ratios that are equivalent to each other. Ratio language can be used to describe relationships between two types of quantities. Example:
If there is a bowl that contains 6 guppies and 9 goldfish, then one could say the ratio of guppies to goldfish is 6 to 9, or 6:9. If the number of guppies is represented by black circles and the number of goldfish is represented by white circles, this ratio could be modeled as These values can be regrouped into 2 black circles (guppies) to 3 white circles (goldfish), creating an equivalent ratio of 2 to 3 or 2:3. Students should be able to identify and describe any ratio using ratio language, “For every _____, there are _____.” In the example above, the relationship could be described as, “For every 2 guppies, there are 3 goldfish.” Teacher Note: Although ratios and fractions do not have identical meaning, a fraction can be formed from a given ratio to describe a part-whole relationship.
7
Louisiana Student Standards: Companion Document for Teachers
Grade 6 Math
6.RP.A.2 Understand the concept of a unit rate a/b associated with a ratio a:b with b ≠ 0, and use rate language in the context of a ratio relationship. For example, “This recipe has a ratio of 3 cups of flour to 4 cups of sugar, so there is 3/4 cup of flour for each cup of sugar.” “We paid $75 for 15 hamburgers, which is a rate of $5 per hamburger.” *
*Expectations for unit rates in this grade are limited to non-complex fractions.
Component(s) of Rigor: Conceptual Understanding Remediation - Previous Grade(s) Standard: 4.OA.A.2, 5.NF.B.3, 5.NF.B.7 6th Grade Standard Taught in Advance: 6.RP.A.1 6th Grade Standard Taught Concurrently: none As students extend their work in 6.RP.A.1 with ratio relationships, they understand that for two ratios to be considered equivalent they must have the same value. All ratios have an associated value, and that value is called the unit rate. Therefore, when students are trying to determine if a set of ratios are in a ratio relationship, they can find the value of each ratio (i.e., the unit rate). From there, students can use rate language to describe the ratio relationship in simpler terms. This will lead students to solving real-world problems involving unit pricing and constant speed (6.RP.A.3b). In grade 6, students are not expected to work with unit rates expressed as complex fractions. Both the numerator and denominator of the original ratio will be whole numbers.
Examples:
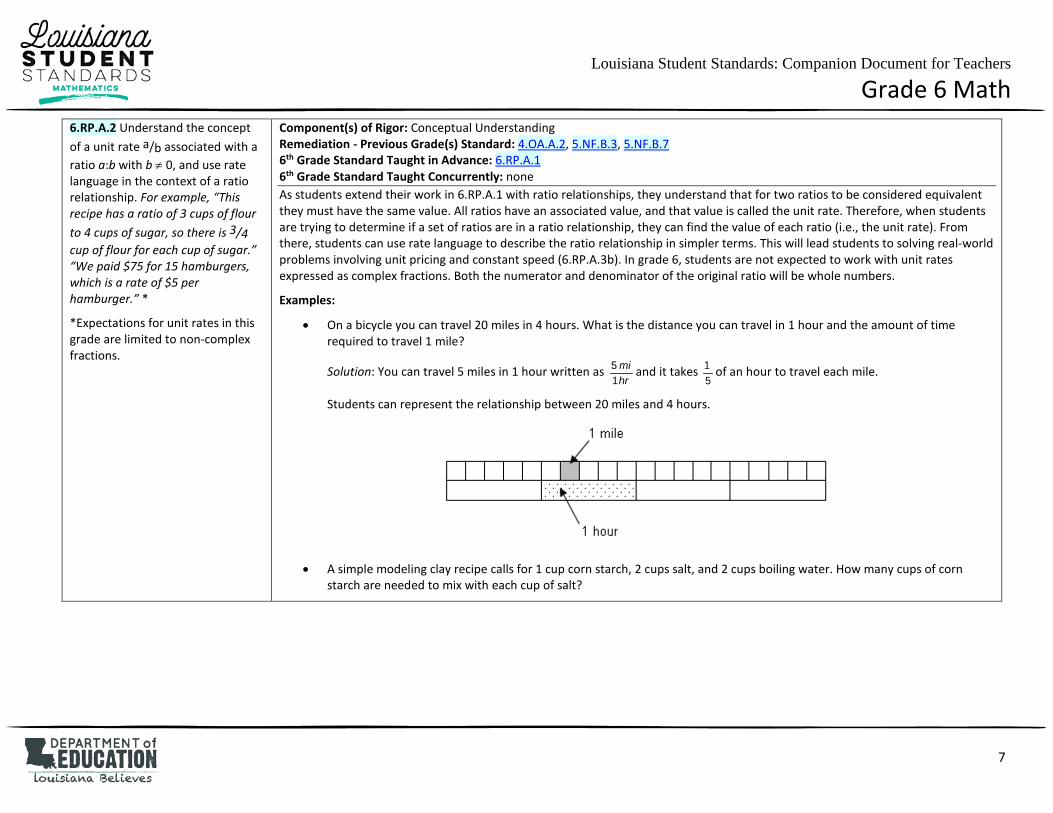
• On a bicycle you can travel 20 miles in 4 hours. What is the distance you can travel in 1 hour and the amount of time required to travel 1 mile?
Solution: You can travel 5 miles in 1 hour written as hrmi
1 5 and it takes
5 1 of an hour to travel each mile.
Students can represent the relationship between 20 miles and 4 hours.
• A simple modeling clay recipe calls for 1 cup corn starch, 2 cups salt, and 2 cups boiling water. How many cups of corn starch are needed to mix with each cup of salt?

8
Louisiana Student Standards: Companion Document for Teachers
Grade 6 Math
6.RP.A.3 Use ratio and rate reasoning to solve real-world and mathematical problems, e.g., by reasoning about tables of equivalent ratios, tape diagrams, double number line diagrams, or equations.
a. Make tables of equivalent ratios relating quantities with whole-number measurements, find missing values in the tables, and plot the pairs of values on the coordinate plane. Use tables to compare ratios.
b. Solve unit rate problems including those involving unit pricing and constant speed. For example, if it took 7 hours to mow 4 lawns, then at that rate, how many lawns could be mowed in 35 hours? At what unit rate were lawns being mowed?
c. Find a percent of a quantity as a rate per 100 (e.g., 30% of a quantity means 30/100 times the quantity); solve problems involving finding the whole, given a part and the percent.
d. Use ratio reasoning to convert measurement units; manipulate and transform units appropriately when multiplying or dividing quantities.
Component(s) of Rigor: Conceptual Understanding (3a, 3d), Procedural Skill and Fluency (3, 3a, 3c, 3d), Application (3, 3b, 3c) Remediation - Previous Grade(s) Standard: none 6th Grade Standard Taught in Advance: none 6th Grade Standard Taught Concurrently: none Once students have developed a strong understanding of ratios, ratio relationships, rates, and unit rates, they can begin solving real-world problems using various methods and representations of ratio relationships. Previously, students have used additive reasoning in tables to solve problems. To begin the shift to proportional reasoning, students need to begin using multiplicative reasoning. Scaling up or down with multiplication maintains the equivalence. To aid in the development of proportional reasoning the cross-product algorithm is not expected at this level. When working with ratio tables and graphs, whole number measurements are the expectation for this standard.
Examples:
• Using the information in the table, find the number of yards in 24 feet.
Feet 3 6 9 15 24 Yards 1 2 3 5 ?
There are several strategies that students could use to determine the solution to this problem. o Add quantities from the table to total 24 feet (9 feet and 15 feet); therefore the number of yards must be 8 yards (3
yards and 5 yards). o Use multiplication to find 24 feet: 1) 3 feet x 8 = 24 feet; therefore 1 yard x 8 = 8 yards, or 2) 6 feet x 4 = 24 feet;
therefore 2 yards x 4 = 8 yards.
• Compare the number of black to white circles. If the ratio remains the same, how many black circles will you have if you have 60 white circles?
Black 4 40 20 60 ? White 3 30 15 45 60
• If 6 is 30% of a value, what is that value? (Solution: 20)

9
Louisiana Student Standards: Companion Document for Teachers
Grade 6 Math
6.RP.A.3 continued
Students recognize that a conversion factor is a fraction equal to 1 since the numerator and denominator both describe the same quantity. For example,12 inches
1 foot is a conversion factor since the numerator and denominator equal the same amount. Since the
fraction is equivalent to 1, the identity property of multiplication allows an amount to be multiplied by the fraction. Conversion factors will be given and can occur both between and across the metric and English systems.
• How many centimeters are in 7 feet, given that 1inch ≈ 2.54 cm
Solution: 7 feet x 12 inches x 2.54 cm = 7 feet x 12 inches x 2.54 cm = 7 x 12 x 2.54 cm = 213.36 cm 1 foot 1 inch 1 foot 1 inch

10
Louisiana Student Standards: Companion Document for Teachers
Grade 6 Math
The Number System (NS) A. Apply and extend previous understanding of multiplication and division to divide fractions by fractions. In this cluster, the terms students should learn to use with increasing precision are reciprocal, multiplicative inverses, and visual fraction model. Louisiana Standard Explanations and Examples 6.NS.A.1 Interpret and compute quotients of fractions, and solve word problems involving division of fractions by fractions, e.g., by using visual fraction models and equations to represent the problem. For example, create a story context for (2/3) ÷ (3/4) and use a visual fraction model to show the quotient; use the relationship between multiplication and division to explain that (2/3) ÷ (3/4) = 8/9 because 3/4 of 8/9 is 2/3. (In general, (a/b) ÷ (c/d) = ad/bc.) How much chocolate will each person get if 3 people share 1/2 lb. of chocolate equally? How many 3/4-cup servings are in 2/3 of a cup of yogurt? How wide is a rectangular strip of land with length 3/4 mi and area 1/2 square mi?
Component(s) of Rigor: Conceptual Understanding, Procedural Skill and Fluency, Application Remediation - Previous Grade(s) Standard: 3.OA.B.6, 5.NF.B.7 6th Grade Standard Taught in Advance: none 6th Grade Standard Taught Concurrently: none In fifth grade students divided whole numbers by unit fractions and divided unit fractions by whole numbers. Students continue to develop this concept by using visual models and equations to divide whole numbers by fractions and fractions by fractions to solve word problems. Students deepen their understanding of the relationship between multiplication and division.
Examples:
• Use multiplication to explain why 𝟑𝟑𝟒𝟒
÷ 𝟐𝟐𝟓𝟓
= 𝟏𝟏𝟓𝟓𝟖𝟖
. Solution: 𝟏𝟏𝟓𝟓𝟖𝟖
× 𝟐𝟐𝟓𝟓
= 3040
= 34 . If I can multiply the quotient by one of the two
numbers in the division problem, I should get the other number in division problem. For example, 4 x 3 =12, so 12 ÷ 3 has to be 4. When I multiplied 𝟏𝟏𝟓𝟓
𝟖𝟖 by 𝟐𝟐
𝟓𝟓 , I got 𝟑𝟑
𝟒𝟒, so I know that the division is correct.
• Manny has 21 yard of fabric to make book covers. Each book cover is made from
81 yard of fabric. How many book covers
can Manny make? Solution: Manny can make 4 book covers.
• Represent 32
21
÷ in a problem context and draw a model to show your solution.
Context: You are making a recipe that calls for 32 cup of yogurt. You have
21 cup of yogurt from a snack pack. How much of
the recipe can you make?

11
Louisiana Student Standards: Companion Document for Teachers
Grade 6 Math
6.NS.A.1 continued Explanation of Model:
The first model shows21 cup. The shaded squares in all three models show
21 cup.
The second model shows 21 cup and also shows
31 cups horizontally.
The third model shows 21 cup moved to fit in only the area shown by
32 of the model.
32 is the new referent unit (whole) .
3 out of the 4 squares in the 32 portion are shaded. A
21 cup is only
43 of a
32 cup portion, so you can only make
43 of the
recipe.
21
21

12
Louisiana Student Standards: Companion Document for Teachers
Grade 6 Math
The Number System (NS) B. Compute fluently with multi-digit numbers and find common factors and multiples. In this cluster, the term students should learn to use with increasing precision is algorithm.
Louisiana Standard Explanations and Examples 6.NS.B.2 Fluently divide multi-digit numbers using the standard algorithm.
Component(s) of Rigor: Procedural Skill and Fluency Remediation - Previous Grade(s) Standard: 5.NBT.B.6 6th Grade Standard Taught in Advance: none 6th Grade Standard Taught Concurrently: none Students are expected to fluently and accurately divide multi-digit whole numbers. Divisors can be any number of digits at this grade level.
As students divide they should continue to use their understanding of place value to describe what they are doing. When using the standard algorithm, students’ language should reference place value. For example, when dividing 32 into 8456, as they write a 2 in the quotient they should say, “there are 200 thirty-twos in 8456,” and could write 6400 beneath the 8456 rather than only writing 64.
There are 200 thirty-twos in 8456.
200 times 32 is 6400.
8456 minus 6400 is 2056.
There are 60 thirty-twos in 2056.
13
Louisiana Student Standards: Companion Document for Teachers
Grade 6 Math
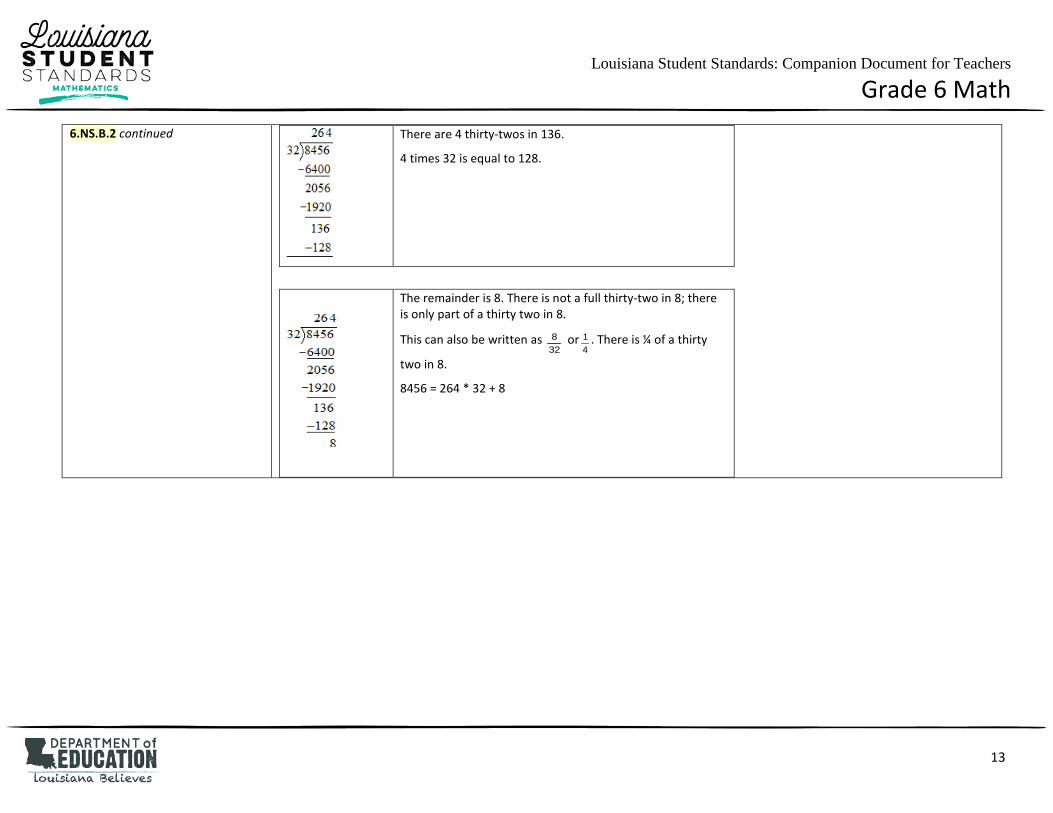
6.NS.B.2 continued
There are 4 thirty-twos in 136.
4 times 32 is equal to 128.
The remainder is 8. There is not a full thirty-two in 8; there is only part of a thirty two in 8.
This can also be written as 328 or
41 . There is ¼ of a thirty
two in 8.
8456 = 264 * 32 + 8
14
Louisiana Student Standards: Companion Document for Teachers
Grade 6 Math
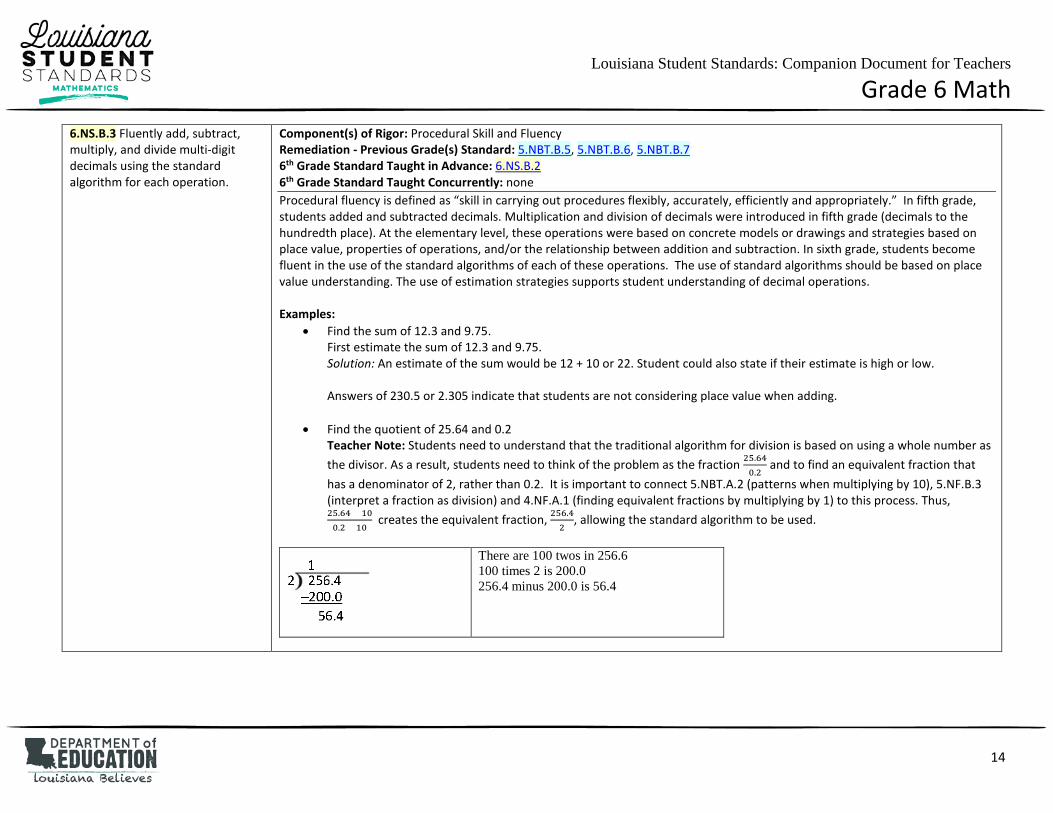
6.NS.B.3 Fluently add, subtract, multiply, and divide multi-digit decimals using the standard algorithm for each operation.
Component(s) of Rigor: Procedural Skill and Fluency Remediation - Previous Grade(s) Standard: 5.NBT.B.5, 5.NBT.B.6, 5.NBT.B.7 6th Grade Standard Taught in Advance: 6.NS.B.2 6th Grade Standard Taught Concurrently: none Procedural fluency is defined as “skill in carrying out procedures flexibly, accurately, efficiently and appropriately.” In fifth grade, students added and subtracted decimals. Multiplication and division of decimals were introduced in fifth grade (decimals to the hundredth place). At the elementary level, these operations were based on concrete models or drawings and strategies based on place value, properties of operations, and/or the relationship between addition and subtraction. In sixth grade, students become fluent in the use of the standard algorithms of each of these operations. The use of standard algorithms should be based on place value understanding. The use of estimation strategies supports student understanding of decimal operations. Examples:
• Find the sum of 12.3 and 9.75. First estimate the sum of 12.3 and 9.75. Solution: An estimate of the sum would be 12 + 10 or 22. Student could also state if their estimate is high or low. Answers of 230.5 or 2.305 indicate that students are not considering place value when adding.
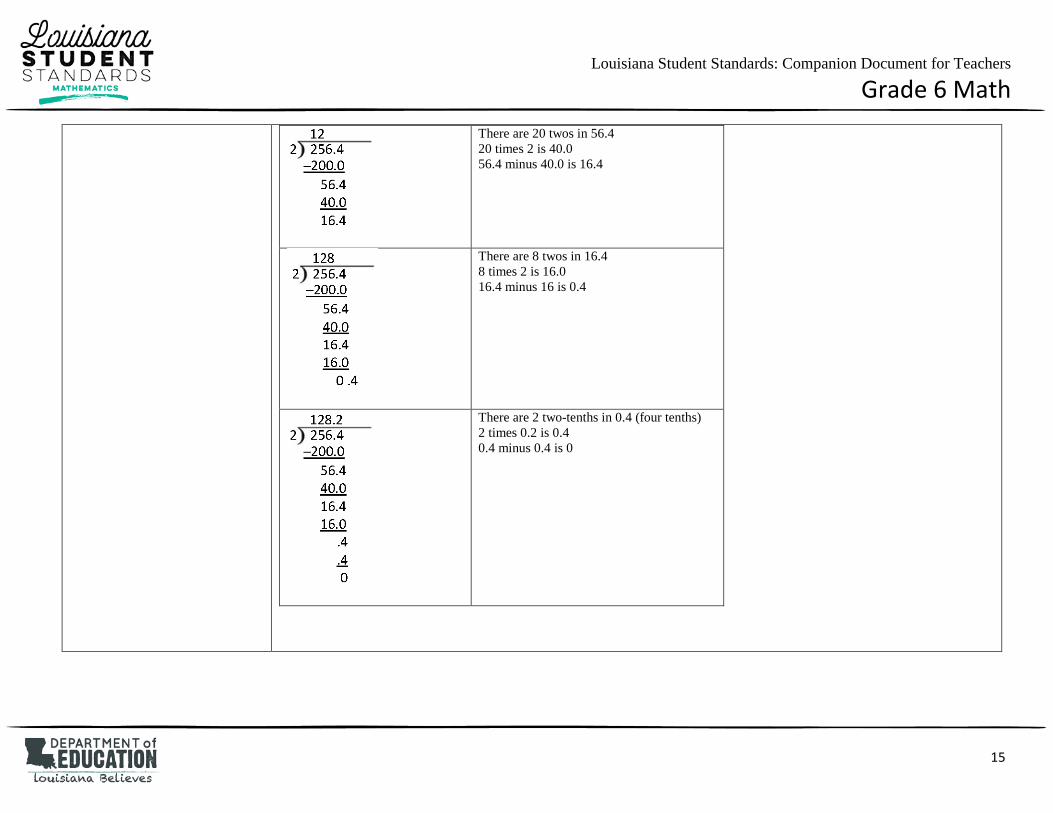
• Find the quotient of 25.64 and 0.2 Teacher Note: Students need to understand that the traditional algorithm for division is based on using a whole number as the divisor. As a result, students need to think of the problem as the fraction 25.64
0.2 and to find an equivalent fraction that
has a denominator of 2, rather than 0.2. It is important to connect 5.NBT.A.2 (patterns when multiplying by 10), 5.NF.B.3 (interpret a fraction as division) and 4.NF.A.1 (finding equivalent fractions by multiplying by 1) to this process. Thus, 25.64 × 100.2 × 10
creates the equivalent fraction, 256.42
, allowing the standard algorithm to be used.
There are 100 twos in 256.6 100 times 2 is 200.0 256.4 minus 200.0 is 56.4
15
Louisiana Student Standards: Companion Document for Teachers
Grade 6 Math
There are 20 twos in 56.4 20 times 2 is 40.0 56.4 minus 40.0 is 16.4
There are 8 twos in 16.4 8 times 2 is 16.0 16.4 minus 16 is 0.4
There are 2 two-tenths in 0.4 (four tenths) 2 times 0.2 is 0.4 0.4 minus 0.4 is 0

16
Louisiana Student Standards: Companion Document for Teachers
Grade 6 Math
6.NS.B.4 Find the greatest common factor of two whole numbers less than or equal to 100 and the least common multiple of two whole numbers less than or equal to 12. Use the distributive property to express a sum of two whole numbers 1–100 with a common factor as a multiple of a sum of two whole numbers with no common factor. For example, express 36 + 8 as 4(9+2).
Component(s) of Rigor: Procedural Skill and Fluency Remediation - Previous Grade(s) Standard: 4.OA.B.4, 5.OA.A.2 6th Grade Standard Taught in Advance: none 6th Grade Standard Taught Concurrently: none In elementary school, students identified primes, composites, and factor pairs (4.OA.4). In sixth grade students will find the greatest common factor of two whole numbers less than or equal to 100. Typical strategies for finding the greatest common factor are 1) listing all factors of each number given and then finding the greatest factor found in each list and 2) listing the prime factors for each number given and then multiplying the common factors.
Students should also understand that the greatest common factor of two prime numbers is 1. Examples:
• What is the greatest common factor (GCF) of 24 and 36? How can you use factor lists or the prime factorizations to find the GCF?
Solution: 22 ∗ 3 = 12. Students should be able to explain that both 24 and 36 have 2 factors of 2 and one factor of 3, thus 2 x 2 x 3 is the greatest common factor.)
• What is the least common multiple (LCM) of 12 and 8? How can you use multiple lists or the prime factorizations to find the LCM?
Solution: 23 ∗ 3 = 24. Students should be able to explain that the least common multiple is the smallest number that is a multiple of 12 and a multiple of 8. To be a multiple of 12, a number must have 2 factors of 2 and one factor of 3 (2 x 2 x 3). To be a multiple of 8, a number must have 3 factors of 2 (2 x 2 x 2). Thus the least common multiple of 12 and 8 must have 3 factors of 2 and one factor of 3 (2 x 2 x 2 x 3).
Factors of 16 Factors of 40 5 2
2 2 2
The product of the intersecting numbers is the GCF

17
Louisiana Student Standards: Companion Document for Teachers
Grade 6 Math
6.NS.B.4 continued • Rewrite 84 + 28 by using the distributive property. Did you rewrite the expression using the greatest common factor? How do you know? Solution: 28(3+1). Explanation: 84 = 7 × 22 x 3 and 28 = 7 × 22. So both numbers have 7 × 4 as common factors and 7 × 4 =28.
The Number System (NS) C. Apply and extend previous understandings of the system of rational numbers. In this cluster, the terms students should learn to use with increasing precision are rational numbers, opposites, absolute value, greater than, >, less than, <, greater than or equal to, ≥, less than or equal to, ≤, origin, quadrants, coordinate plane, ordered pairs, x-axis, y-axis, and coordinates.
Louisiana Standard Explanations and Examples 6.NS.C.5 Understand that positive and negative numbers are used together to describe quantities having opposite directions or values (e.g., temperature above/below zero, elevation above/below sea level, credits/debits, positive/negative electric charge); use positive and negative numbers to represent quantities in real-world contexts, explaining the meaning of 0 in each situation
Component(s) of Rigor: Conceptual Understanding Remediation - Previous Grade(s) Standard: none 6th Grade Standard Taught in Advance: none 6th Grade Standard Taught Concurrently: none Students use rational numbers (fractions, decimals, and integers) to represent real-world contexts and understand the meaning of 0 in each situation. This standard does not include using opposites in operations. Examples:
a. Use an integer to represent 25 feet below sea level b. Use an integer to represent 25 feet above sea level. c. What would 0 (zero) represent in the scenario above?
Solution:
a. -25 b. +25 c. 0 would represent sea level

18
Louisiana Student Standards: Companion Document for Teachers
Grade 6 Math
6.NS.C.6 Understand a rational number as a point on the number line. Extend number line diagrams and coordinate axes familiar from previous grades to represent points on the line and in the plane with negative number coordinates.
a. Recognize opposite signs of numbers as indicating locations on opposite sides of 0 on the number line; recognize that the opposite of the opposite of a number is the number itself, e.g., -(-3) = 3, and that 0 is its own opposite.
b. Understand signs of numbers in ordered pairs as indicating locations in quadrants of the coordinate plane; recognize that when two ordered pairs differ only by signs, the locations of the points are related by reflections across one or both axes.
c. Find and position integers and other rational numbers on a horizontal or vertical number line diagram; find and position pairs of integers and other rational numbers on a coordinate plane.
Component(s) of Rigor: Conceptual Understanding (6, 6a, 6b, 6c), Procedural Skill and Fluency (6c) Remediation - Previous Grade(s) Standard: 3.NF.A.2, 5.G.A.1 6th Grade Standard Taught in Advance: 6.NS.C.5 6th Grade Standard Taught Concurrently: none This is the first time that students will see a number line extended beyond zero to the left to show numbers and their opposites. Both 3 and -3 are 3 units from zero on the number line. Graphing points and reflecting across zero on a number line extends to graphing and reflecting points across axes on a coordinate grid. The use of both horizontal and vertical number line models facilitates the movement from number lines to coordinate grids.
Examples:
• What is the opposite of 212
? Use a number line to explain how you know.
• Place the following numbers on the number line: –4.5, 2, 3.2, –3 , 0.2, –2, .
• Graph the following points in the correct quadrant of the coordinate plane. If you reflected each point across the x-axis, what are the coordinates of the reflected points? What similarities do you notice between coordinates of the original point and the reflected point?
−
213 ,
21
−− 3 ,
21 ( )75.0 ,25.0 −
Solution: �1
2, 3 1
2� (- ½ , 3) (0.25, 0.75) The x-coordinate in each ordered pair stays the same. The y-coordinate is
the opposite of the original y-coordinate.
35
112

19
Louisiana Student Standards: Companion Document for Teachers
Grade 6 Math
6.NS.C.7 Understand ordering and absolute value of rational numbers.
a. Interpret statements of inequality as statements about the relative position of two numbers on a number line diagram. For example, interpret –3 > –7 as a statement that –3 is located to the right of –7 on a number line oriented from left to right.
b. Write, interpret, and explain statements of order for rational numbers in real-world contexts. For example, write –3 oC > –7 oC to express the fact that –3 oC is warmer than –7 oC.
c. Understand the absolute value of a rational number as its distance from 0 on the number line; interpret absolute value as magnitude for a positive or negative quantity in a real-world situation. For example, for an account balance of –30 dollars, write |–30| = 30 to describe the size of the debt in dollars.
d. Distinguish comparisons of absolute value from statements about order. For example, recognize that an account balance less than –30 dollars represents a debt greater than 30 dollars
Component(s) of Rigor: Conceptual Understanding (7, 7a, 7b, 7c, 7d) Remediation - Previous Grade(s) Standard: none 6th Grade Standard Taught in Advance: none 6th Grade Standard Taught Concurrently: none Common models to represent and compare integers include number line models, temperature models and the profit-loss model. On a number line model, the number is represented by an arrow drawn from zero to the location of the number on the number line; the absolute value is the length of this arrow with the symbol│ │ used to represent the absolute value. The number line can also be viewed as a thermometer where each point of on the number line is a specific temperature. In the profit-loss model, a positive number corresponds to profit and the negative number corresponds to a loss. Each of these models is useful for examining values but can also be used in later grades when students begin to perform operations on integers.
In working with number line models, students internalize the order of the numbers; larger numbers on the right or top of the number line and smaller numbers to the left or bottom of the number line. They use the order to correctly locate integers and other rational numbers on the number line. By placing two numbers on the same number line, they are able to write inequalities and make statements about the relationships between the numbers.
Case 1: Two positive numbers
5 > 3 5 is greater than 3
Case 2: One positive and one negative number
3 > -3 positive 3 is greater than negative 3 negative 3 is less than positive 3 Case 3: Two negative numbers
-3 > -5 negative 3 is greater than negative 5 negative 5 is less than negative 3
When working with positive numbers, the absolute value (distance from zero) of the number and the value of the number is the same; therefore, ordering is not problematic. However, negative numbers have a distinction that students need to understand. As

20
Louisiana Student Standards: Companion Document for Teachers
Grade 6 Math
6.NS.C.7 continued the negative number increases (moves to the left on a number line), the value of the number decreases. For example, –24 is less than –14 because –24 is located to the left of –14 on the number line. However, absolute value is the distance from zero. In terms of absolute value (or distance) the absolute value of –24 is greater than the absolute value of –14. For negative numbers, as the absolute value increases, the value of the negative number decreases. Examples:
• One of the thermometers shows -3°C and the other shows -7°C. Which thermometer shows which temperature? Which is the colder temperature? How much colder? Write an inequality to show the relationship between the temperatures and explain how the model shows this relationship.
Students recognize the distance from zero as the absolute value or magnitude of a rational number. Students need multiple experiences to understand the relationships between numbers, absolute value, and statements about order.
• Find the value of | –3 |. Solution: 312
• The balance in Sue’s checkbook was –$12.55. The balance in John’s checkbook was –$10.45. Write an inequality to show the relationship between these amounts. Who owes more?
Solution: –12.55 < –10.45, Sue owes more than John. The interpretation could also be “John owes less than Sue”.
12

21
Louisiana Student Standards: Companion Document for Teachers
Grade 6 Math
6.NS.C.8 Solve real-world and mathematical problems by graphing points in all four quadrants of the coordinate plane. Include use of coordinates and absolute value to find distances between points with the same first coordinate or the same second coordinate.
Component(s) of Rigor: Procedural Skill and Fluency, Application Remediation - Previous Grade(s) Standard: 5.G.A.2 6th Grade Standard Taught in Advance: none 6th Grade Standard Taught Concurrently: 6.G.A.3 Students find the distance between points when ordered pairs have the same x-coordinate (vertical) or same y-coordinate (horizontal). Examples:
• If the points on the coordinate plane below are the three vertices of a rectangle, what are the coordinates of the fourth vertex? How do you know? What are the length and width of the rectangle?
To determine the distance along the x-axis between the point (-4, 2) and (2, 2) a student must recognize that -4 is |−4| or 4 units to the left of 0 and 2 is |2| or 2 units to the right of zero, so the two points are total of 6 units apart along the x-axis. Students should represent this on the coordinate grid as (2, -3).
• What is the distance between (3, –5 ) and (3, 2 )? Teacher Note: Students in grade 6 use only non-negative numbers
(values greater than or equal to 0) in calculations. In this problem, students should recognize that the distance from –5
to 0 is │- 5 │and that the distance from 2 to 0 is 2 . Adding 5 to 2 results in the distance between the two
points since the x-coordinates are the same. Therefore, the distance is 734.
12
14
12
12
14
14
12
14

22
Louisiana Student Standards: Companion Document for Teachers
Grade 6 Math
Expressions and Equations (EE) A. Apply and extend previous understandings of arithmetic to algebraic expressions. In this cluster, the terms students should learn to use with increasing precision are exponents, base, numerical expressions, algebraic expressions, evaluate, sum, term, product, factor, quantity, quotient, coefficient, constant, like terms, equivalent expressions, and variables.
Louisiana Standard Explanations and Examples 6.EE.A.1 Write and evaluate numerical expressions involving whole-number exponents.
Component(s) of Rigor: Conceptual Understanding, Procedural Skill and Fluency Remediation - Previous Grade(s) Standard: 4.OA.B.4, 5.NBT.A.2 6th Grade Standard Taught in Advance: none 6th Grade Standard Taught Concurrently: none Students demonstrate the meaning of exponents to write and evaluate numerical expressions with whole number exponents. The
base can be a whole number, positive decimal or a positive fraction (i.e., �12�5
can be written • •
• • which has the
same value as ). Standard 6.EE.2 extends this concept to recognizing that an expression with a variable base represents the same
mathematics (i.e., x5 can be written as x • x • x • x • x) and write algebraic expressions from verbal expressions. Order of operations is introduced throughout elementary grades, including the use of the grouping symbols ( ) and { } in fifth grade. Order of operations with exponents is the focus in sixth grade. Examples:
• Write the following expressions using exponential notation.
o 8 × 8 Solution: 82
o 45
× 45
× 45
Solution: �45�3
o 6 × 6 × 6 × 6 × 6 × 4 Solution: 65 • 4
• Evaluate:
o 34 Solution: 64
o 625 4 •+ Solution: 101
o 2632472 +÷− Solution: 67
12
12
12
12
12
132

23
Louisiana Student Standards: Companion Document for Teachers
Grade 6 Math
6.EE.A.2 Write, read, and evaluate expressions in which letters stand for numbers.
a. Write expressions that record operations with numbers and with letters standing for numbers. For example, express the calculation “Subtract y from 5” as 5 – y.
b. Identify parts of an expression using mathematical terms (sum, term, product, factor, quotient, and coefficient); view one or more parts of an expression as a single entity. For example, describe the expression 2(8+7) as a product of two factors; view (8+7) as both a single entity and a sum of two terms.
c. Evaluate expressions at specific values of their variables. Include expressions that arise from formulas used in real-world problems. Perform arithmetic operations, including those involving whole-number exponents, in the conventional order when there are no parentheses to specify a particular order (Order of Operations). For example, use the formulas V=s3 and A=6 s2 to find the volume and surface area of a cube with sides of length s=1/2.
Component(s) of Rigor: Conceptual Understanding(2, 2a, 2b), Procedural Skill and Fluency (2, 2b, 2c) Remediation - Previous Grade(s) Standard: 5.OA.A.2, 5.OA.B.3 6th Grade Standard Taught in Advance: 6.EE.A.1 6th Grade Standard Taught Concurrently: none Terms are the parts of a sum. When the term is an explicit number, it is called a constant. When the term is a product of a number and a variable, the number is called the coefficient of the variable.
Variables are letters that represent numbers. There are various possibilities for the numbers they can represent; students can substitute these possible numbers for the letters in the expression for various different purposes. Consider the following expression:
6352 +++ xyx The variables are 𝑥𝑥 and 𝑦𝑦. There are 4 terms: 𝑥𝑥2, 5𝑦𝑦, 3𝑥𝑥, and 6. There are 3 variable terms: 𝑥𝑥2, 5𝑦𝑦, 3𝑥𝑥. They have coefficients of 1, 5, and 3 respectively. The coefficient of 𝑥𝑥2 is 1, since 𝑥𝑥2 = 1 𝑥𝑥2. The term 5𝑦𝑦 represents 5 • 𝑦𝑦. There is one constant term, 6. The expression shows a sum of all four terms. Examples:
• Using 𝑥𝑥 for the unknown number, write an expression for
o “7 more than 3 times a number”
o “3 times the sum of a number and 5”
o “7 less than the product of 2 and a number”
o “Twice the difference between a number and 5” • Evaluate 5(𝑛𝑛 + 3) – 7𝑛𝑛, when 𝑛𝑛 = 1
2.
• The expression c + 0.07c can be used to find the total cost of an item with 7% sales tax, where c is the pre-tax cost of the item. Use the expression to find the total cost of an item that cost $25.
• The perimeter of a parallelogram is found using the formula p = 2𝑙𝑙 + 2𝑤𝑤. What is the perimeter of a rectangular picture frame with dimensions of 8.5 inches by 11 inches.
• Evaluate 7x𝑦𝑦 when 𝑥𝑥 = 2.5 and 𝑦𝑦 = 9
• Evaluate when 𝑥𝑥 = 4 and 𝑦𝑦 = 2
x 2 + y 3
3

24
Louisiana Student Standards: Companion Document for Teachers
Grade 6 Math
6.EE.A.3 Apply the properties of operations to generate equivalent expressions. For example, apply the distributive property to the expression 3 (2 + x) to produce the equivalent expression 6 + 3x; apply the distributive property to the expression 24x + 18y to produce the equivalent expression 6 (4x + 3y); apply properties of operations to y + y + y to produce the equivalent expression 3y.
Component(s) of Rigor: Conceptual Understanding, Procedural Skill and Fluency Remediation - Previous Grade(s) Standard: 1.OA.B.3, 3.OA.B.5, 5.OA.A.2 6th Grade Standard Taught in Advance: 6.NS.B.4, 6.EE.A.2 6th Grade Standard Taught Concurrently: 6.EE.A.4 Students use the distributive property to write equivalent expressions. Using their understanding of area models from elementary students illustrate the distributive property with variables. Properties are introduced throughout elementary grades (3.OA.5); however, there has not been an emphasis on recognizing and naming the property. In sixth grade students are able to use the properties and identify by name.
Students use their understanding of multiplication to interpret 3 (2 + 𝑥𝑥) as 3 groups of (2 + 𝑥𝑥). They use a model to represent x, and make an array to show the meaning of 3(2 + 𝑥𝑥). They can explain why it makes sense that 3(2 + 𝑥𝑥) is equal to 6 + 3𝑥𝑥. An array with 3 columns and 𝑥𝑥 + 2 in each column:
Students interpret 𝑦𝑦 as referring to one 𝑦𝑦. Thus, they can reason that one 𝑦𝑦 plus one 𝑦𝑦 plus one 𝑦𝑦 must be 3𝑦𝑦. They also the distributive property, the multiplicative identity property of 1, and the commutative property for multiplication to prove that 𝑦𝑦 + 𝑦𝑦 + 𝑦𝑦 = 3𝑦𝑦
Solution:
𝑦𝑦 + 𝑦𝑦 + 𝑦𝑦 𝑦𝑦 • 1 + 𝑦𝑦 • 1 + 𝑦𝑦 • 1 Multiplicative Identity 𝑦𝑦 • (1 + 1 + 1) Distributive Property 𝑦𝑦 • 3 Addition 3𝑦𝑦 Commutative Property

25
Louisiana Student Standards: Companion Document for Teachers
Grade 6 Math
6.EE.A.4 Identify when two expressions are equivalent (i.e., when the two expressions name the same number regardless of which value is substituted into them). For example, the expressions y + y + y and 3y are equivalent because they name the same number regardless of which number y stands for.
Component(s) of Rigor: Conceptual Understanding Remediation - Previous Grade(s) Standard: 1.OA.B.3, 3.OA.B.5, 5.OA.A.2 6th Grade Standard Taught in Advance: 6.NS.B.4, 6.EE.A.2 6th Grade Standard Taught Concurrently: 6.EE.A.3 Students demonstrate an understanding of like terms as terms being added or subtracted with the same variables and exponents. For example, 3𝑥𝑥 + 4𝑥𝑥 are like terms and can be combined as 7𝑥𝑥; however, 3𝑥𝑥 + 4𝑥𝑥2 are not like terms since the exponents with the x are not the same. This concept can be illustrated by substituting in a value for 𝑥𝑥. For example, 9𝑥𝑥 – 3𝑥𝑥 = 6𝑥𝑥 not 6. Choosing a value for 𝑥𝑥, such as 2, can prove non-equivalence. 9(2) – 3(2) = 6(2) however 9(2) – 3(2) = 6 18 – 6 = 12 18– 6 = 6 12 = 12 12 ≠ 6 Students can also generate equivalent expressions using the associative, commutative, and distributive properties. They can prove that the expressions are equivalent by simplifying each expression into the same form. Examples:
• Are the expressions equivalent? Explain your answer? 4𝑚𝑚 + 8 4(𝑚𝑚 + 2) 3𝑚𝑚 + 8 + 𝑚𝑚 2 + 2𝑚𝑚 + 𝑚𝑚 + 6 + 𝑚𝑚 Solution:
Expression Simplifying the Expression Explanation
4𝑚𝑚 + 8 4𝑚𝑚 + 8 Already in simplest form
4(𝑚𝑚 + 2) 4(𝑚𝑚 + 2) = 4(𝑚𝑚) + 4(2) = 4𝑚𝑚 + 8 Distributive property
3𝑚𝑚 + 8 + 𝑚𝑚 3𝑚𝑚 + 8 + 𝑚𝑚 3𝑚𝑚 + 𝑚𝑚 + 8
4𝑚𝑚 + 8
Reordered using Commutative Property, then combined like terms
2 + 2𝑚𝑚 + 𝑚𝑚 + 6 + 𝑚𝑚
2𝑚𝑚 + 𝑚𝑚 + 𝑚𝑚 + 2 + 6 4𝑚𝑚 + 8
Reordered using Commutative Property, then combined like terms

26
Louisiana Student Standards: Companion Document for Teachers
Grade 6 Math
Expressions and Equations (EE) B. Reason about and solve one-variable equations and inequalities. In this cluster, the terms students should learn to use with increasing precision are inequalities, equations, greater than, >, less than, <, greater than or equal to, ≥, less than or equal to, ≤, profit, and exceed.
Louisiana Standard Explanations and Examples 6.EE.B.5 Understand solving an equation or inequality as a process of answering a question: which values from a specified set, if any, make the equation or inequality true? Use substitution to determine whether a given number in a specified set makes an equation or inequality true.
Component(s) of Rigor: Conceptual Understanding, Procedural Skill and Fluency Remediation - Previous Grade(s) Standard: none 6th Grade Standard Taught in Advance: 6.EE.A.2 6th Grade Standard Taught Concurrently: 6.EE.B.7, 6.EE.B.8 In elementary grades, students explored the concept of equality. In sixth grade, students explore equations as expressions being set equal to a specific value. The solution is the value of the variable that will make the equation or inequality true. Students use various processes to identify the value(s) that when substituted for the variable will make the equation true. Examples:
• Substitute the numbers in the set for n and determine which values make the equation or inequality true. Explain how you know your answer is correct.
Equation or Inequality
Set of Numbers Solution and Sample Explanation
n < -4 {0, ─ 1
2, 5, ─6, 21
3, 4,
─10}
Solution: ─6 and ─10 Numbers to the left of -4 on the number line are less than -4.1
23𝑛𝑛 = 4 {0, 2, 6, 9}
Solution: 6 23 × 6 = (2 × 6) × 1
3 = 12 × 1
3= 12
3= 4, so both sides of the equation
equal 4
5𝑛𝑛 = 24 {4.8, 245
, 4 45} Solution: 5 × 4.8 = 24. 24
5 and 4 4
5 are equivalent to 4.8, so all the
numbers in the set make the equation true. 1Students in Grade 6 do not solve equations and inequalities using negative numbers. This example reinforces coherence with 6.NS.C.7a which requires students to interpret inequality statements in terms of positions on a number line.
27
Louisiana Student Standards: Companion Document for Teachers
Grade 6 Math
6.EE.B.5 continued • Solve 26 + 𝑛𝑛 = 100 for 𝑛𝑛 and provide your reasoning. Possible reasoning strategies:
o 26 + 70 is 96 and 96 + 4 is 100, so the number added to 26 to get 100 is 74. o Use knowledge of fact families to write related equations:
𝑛𝑛 + 26 = 100, 100 − 𝑛𝑛 = 26, 100 − 26 = 𝑛𝑛. Select the equation that helps to find 𝑛𝑛 easily. o Use knowledge of inverse operations: Since subtraction “undoes” addition then subtract 26 from 100 to get the
numerical value of 𝑛𝑛.
• Twelve is less than 3 times another number can be shown by the inequality n312 < . What numbers could possibly make this a true statement? Explain how you know. Solution: Students provide at least two values greater than 4 and show that the product of the given number and 3 is greater than 12.
6.EE.B.6 Use variables to represent numbers and write expressions when solving a real-world or mathematical problem; understand that a variable can represent an unknown number, or, depending on the purpose at hand, any number in a specified set.
Component(s) of Rigor: Conceptual Understanding, Procedural Skill and Fluency, Application Remediation - Previous Grade(s) Standard: none 6th Grade Standard Taught in Advance: 6.EE.A.2 6th Grade Standard Taught Concurrently: 6.EE.B.7 Connecting writing expressions with real-world problems and/or drawing pictures will give students a context for this work. It is important for students to read algebraic expressions in a manner that reinforces that the variable represents a number.
Examples:
• Maria has three more than twice as many crayons as Elizabeth. Write an algebraic expression to represent the number of crayons that Maria has. (Solution: 2𝑐𝑐 + 3 where c represents the number of crayons that Elizabeth has.)
• An amusement park charges $28 to enter and $0.35 per ticket. Write an algebraic expression to represent the total amount spent. (Solution: 28 + 0.35𝑡𝑡 where t represents the number of tickets purchased)
• Andrew has a summer job doing yard work. He is paid $15 per hour and a $20 bonus when he completes the yard. He was paid $85 for completing one yard. Write an equation to represent the amount of money he earned. (Solution: 15ℎ + 20 = 85 where h is the number of hours worked)
• Describe a problem situation that can be solved using the equation 2𝑐𝑐 + 3 = 15; where c represents the cost of an item
• Bill earned $5.00 mowing the lawn on Saturday. He earned more money on Sunday. Write an expression that shows the amount of money Bill has earned. (Solution: $5.00 + 𝑛𝑛 where 𝑛𝑛 is the amount earned on Sunday.)

28
Louisiana Student Standards: Companion Document for Teachers
Grade 6 Math
6.EE.B.7 Solve real-world and mathematical problems by writing and solving equations and inequalities of the form x + p = q and px = q for cases in which p, q and x are all nonnegative rational numbers. Inequalities will include >, <, ≤, and ≥.
Component(s) of Rigor: Procedural Skill and Fluency, Application Remediation - Previous Grade(s) Standard: 5.NF.A.1, 5.NF.B.4 6th Grade Standard Taught in Advance: 6.NS.A.1 6th Grade Standard Taught Concurrently: 6.EE.B.5, 6.EE.B.6, 6.EE.C.9 Students create and solve equations and inequalities that are based on real-world situations. It may be beneficial for students to draw pictures that illustrate the equation in problem situations. Solving equations and inequalities using reasoning and prior knowledge should be required of students to allow them to develop effective strategies. Notice that the focus is on the operations of addition and multiplication of nonnegative values with the intent that students solve such problems using inverse operations.
Examples: • Meagan spent $56.58 on three pairs of jeans. If each pair of jeans costs the same amount, write an algebraic equation that
represents this situation and solve to determine how much one pair of jeans cost.
Sample Solution: Students might say: “I created the bar model to show the cost of the three pairs of jeans. Each bar labeled J is the same size because each pair of jeans costs the same amount of money. The bar model represents the equation 3J = $56.58. To solve the problem, I need to divide the total cost of 56.58 between the three pairs of jeans. I know that it will be more than $10 each because 10 × 3 is only 30 but less than $20 each because 20 × 3 is 60. If I start with $15 each, I am up to $45. I have $11.58 left. I then give each pair of jeans $3. That’s $9 more dollars. I only have $2.58 left. I continue until all the money is divided. I ended up giving each pair of jeans another $0.86. Each pair of jeans costs $18.86 (15 + 3 + 0.86). I double check that the jeans cost $18.86 each because $18.86 × 3 is $56.58.”
• Julio gets paid $20 for babysitting. He spends $1.99 on a package of trading cards and $6.50 on lunch. Write and solve an equation to show how much money Julio has left.
(Solution: 20 = 1.99 + 6.50 + 𝑥𝑥, 𝑥𝑥 = $11.51)
• Stephen has saved $45.75. The price for a pair of sneakers that he wants could increase before he saves enough money, but he knows he will need at least $60 to purchase the shoes at the current cost. Write and solve an inequality that will show the minimum amount that Stephen still needs to save to purchase the sneakers.
(Solution: $45.75 + 𝑥𝑥 ≥ $60, 𝑥𝑥 ≥ $14.25 Stephen will need at least $14.75. $14.75 will be enough the cost of the sneakers does not go up, but he might need more than $14.75.)

29
Louisiana Student Standards: Companion Document for Teachers
Grade 6 Math
6.EE.B.8 Write an inequality of the form x > c or x < c to represent a constraint or condition in a real-world or mathematical problem. Recognize that inequalities of the form x > c or x < c have infinitely many solutions; represent solutions of such inequalities on number line diagrams.
Component(s) of Rigor: Conceptual Understanding, Procedural Skill and Fluency Remediation - Previous Grade(s) Standard: none 6th Grade Standard Taught in Advance: none 6th Grade Standard Taught Concurrently: 6.EE.B.5 Many real-world situations are represented by inequalities. Inequalities do not use ≤ or ≥. Students write inequalities using “is greater than” or “is less than” to represent real-world and mathematical situations. Students use the number line to represent inequalities from various contextual and mathematical situations. Examples:
• The Flores family spent less than $200.00 last month on groceries. Write an inequality to represent this amount and graph this inequality on a number line.
Solution: 200 > 𝑥𝑥 𝑜𝑜𝑜𝑜 𝑥𝑥 < 200, where 𝑥𝑥 is the amount spent on groceries.
• Jonas spent more than $50 at an amusement park. Write an inequality to represent the amount of money Jonas spent. What are some possible amounts of money Jonas could have spent? Represent the situation on a number line.
30
Louisiana Student Standards: Companion Document for Teachers
Grade 6 Math
Expressions and Equations (EE) C. Represent and analyze quantitative relationships between dependent and independent variables. In this cluster, the terms students should learn to use with increasing precision are dependent variables and independent variables. Louisiana Standard Explanations and Examples
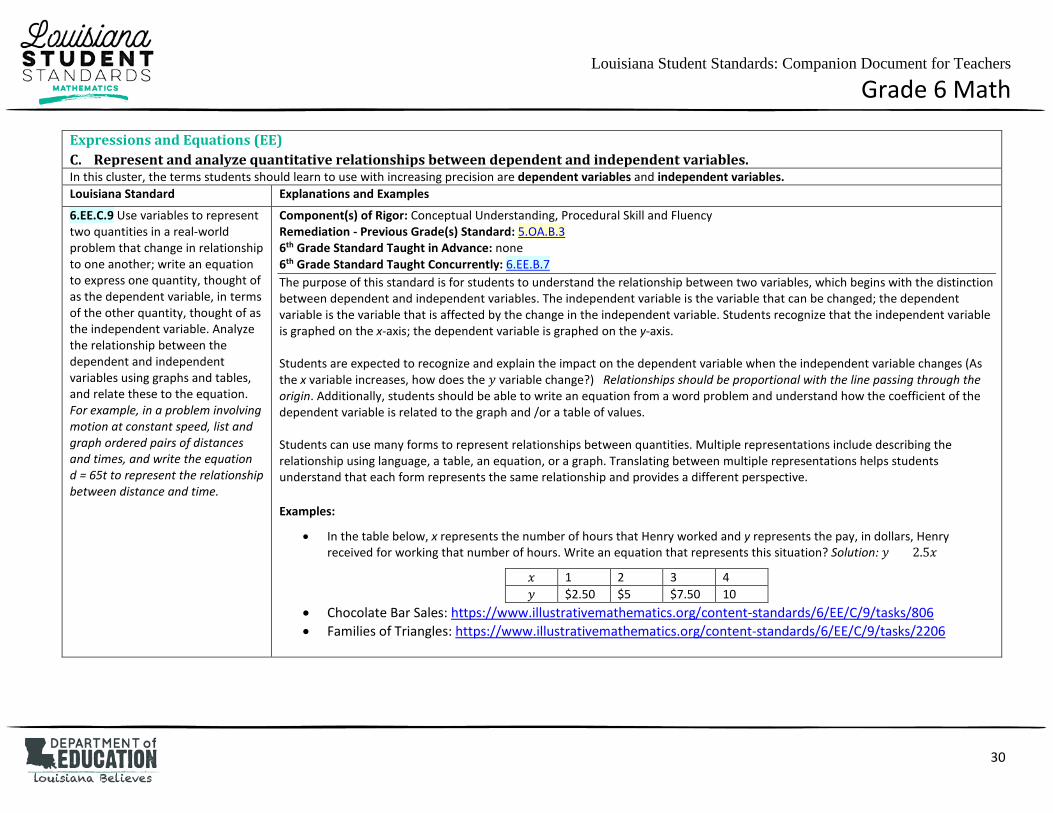
6.EE.C.9 Use variables to represent two quantities in a real-world problem that change in relationship to one another; write an equation to express one quantity, thought of as the dependent variable, in terms of the other quantity, thought of as the independent variable. Analyze the relationship between the dependent and independent variables using graphs and tables, and relate these to the equation. For example, in a problem involving motion at constant speed, list and graph ordered pairs of distances and times, and write the equation d = 65t to represent the relationship between distance and time.
Component(s) of Rigor: Conceptual Understanding, Procedural Skill and Fluency Remediation - Previous Grade(s) Standard: 5.OA.B.3 6th Grade Standard Taught in Advance: none 6th Grade Standard Taught Concurrently: 6.EE.B.7 The purpose of this standard is for students to understand the relationship between two variables, which begins with the distinction between dependent and independent variables. The independent variable is the variable that can be changed; the dependent variable is the variable that is affected by the change in the independent variable. Students recognize that the independent variable is graphed on the x-axis; the dependent variable is graphed on the y-axis. Students are expected to recognize and explain the impact on the dependent variable when the independent variable changes (As the x variable increases, how does the 𝑦𝑦 variable change?) Relationships should be proportional with the line passing through the origin. Additionally, students should be able to write an equation from a word problem and understand how the coefficient of the dependent variable is related to the graph and /or a table of values. Students can use many forms to represent relationships between quantities. Multiple representations include describing the relationship using language, a table, an equation, or a graph. Translating between multiple representations helps students understand that each form represents the same relationship and provides a different perspective. Examples:
• In the table below, x represents the number of hours that Henry worked and y represents the pay, in dollars, Henry received for working that number of hours. Write an equation that represents this situation? Solution: 𝑦𝑦 = 2.5𝑥𝑥
𝑥𝑥 1 2 3 4 𝑦𝑦 $2.50 $5 $7.50 10
• Chocolate Bar Sales: https://www.illustrativemathematics.org/content-standards/6/EE/C/9/tasks/806 • Families of Triangles: https://www.illustrativemathematics.org/content-standards/6/EE/C/9/tasks/2206

31
Louisiana Student Standards: Companion Document for Teachers
Grade 6 Math
Geometry (G) A. Solve real-world and mathematical problems involving area, surface area, and volume. In this cluster, the terms students should learn to use with increasing precision are area, surface area, volume, decomposing, edges, dimensions, net, vertices, face, base, height, trapezoid, isosceles, right triangle, quadrilateral, rectangles, squares, parallelograms, rhombi, kites, right rectangular prism, and diagonal.
Louisiana Standard Explanations and Examples 6.G.A.1 Find the area of right triangles, other triangles, special quadrilaterals, and polygons by composing into rectangles or decomposing into triangles and other shapes; apply these techniques in the context of solving real-world and mathematical problems.
Component(s) of Rigor: Conceptual Understanding, Procedural Skill and Fluency, Application Remediation - Previous Grade(s) Standard: 4.MD.A.3, 4.MD.D.8, 5.NF.B.4 6th Grade Standard Taught in Advance: none 6th Grade Standard Taught Concurrently: none Students continue to understand that area is the number of squares needed to cover a plane figure. Sixth grade students should know the formula for the area of a rectangle from having used in grade 4; however, “knowing the formula” does not mean memorization of the formula. To “know” means to have an understanding of why the formula works and how the formula relates to the measure (area) and the figure. This understanding should be for all students. In grade 6, finding the area of triangles is introduced in relationship to the area of rectangles – a rectangle can be decomposed into two congruent triangles. Therefore, the area of the triangle is ½ the area of the rectangle. The area of a rectangle can be found by multiplying base × height; therefore, the area of the triangle is ½ 𝑏𝑏ℎ or (𝑏𝑏 𝑥𝑥 ℎ)/2. The following site helps students to discover the area formula of triangles. http://illuminations.nctm.org/LessonDetail.aspx?ID=L577 Students decompose shapes into rectangles and triangles to determine the area. For example, a trapezoid can be decomposed into triangles and rectangles (see figures below). Using the trapezoid’s dimensions, the area of the individual triangle(s) and rectangle can be found and then added together. Special quadrilaterals include rectangles, squares, parallelograms, trapezoids, rhombi, and kites.
Students recognize the marks indicating that two sides of the same figure have equal lengths. This is the students’ first exposure to the term diagonal.
Isosceles trapezoid Right trapezoid
32
Louisiana Student Standards: Companion Document for Teachers
Grade 6 Math
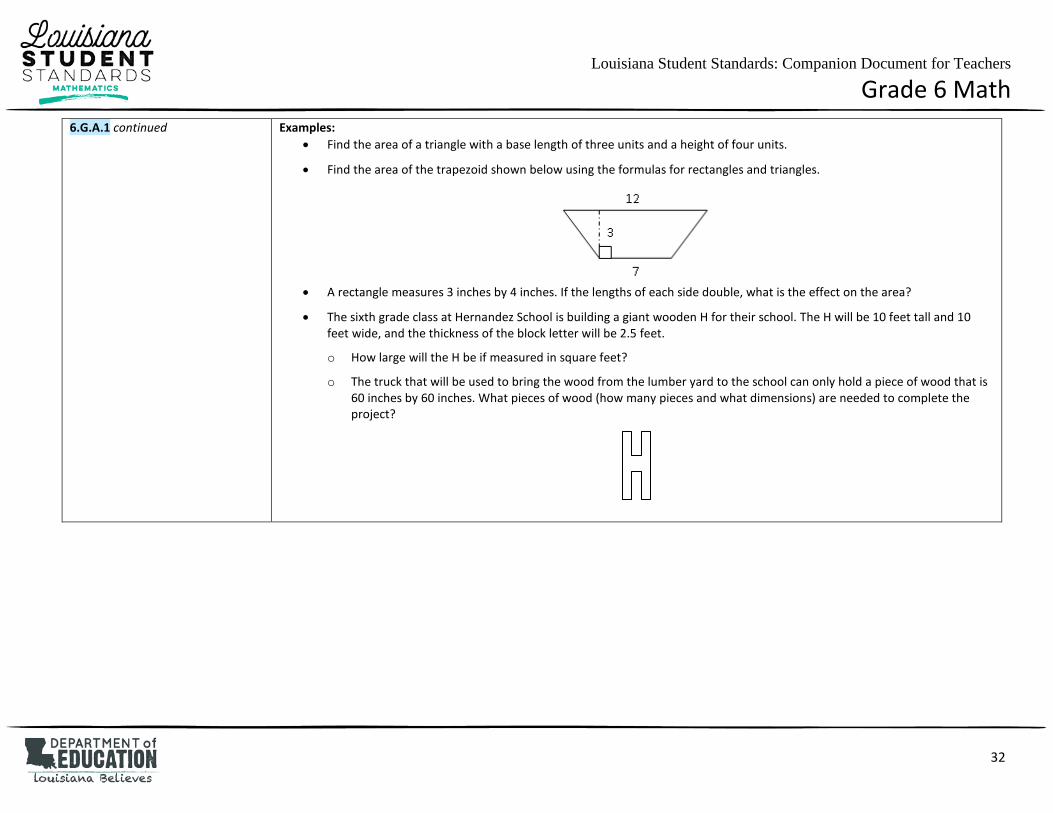
6.G.A.1 continued Examples: • Find the area of a triangle with a base length of three units and a height of four units.
• Find the area of the trapezoid shown below using the formulas for rectangles and triangles.
• A rectangle measures 3 inches by 4 inches. If the lengths of each side double, what is the effect on the area?
• The sixth grade class at Hernandez School is building a giant wooden H for their school. The H will be 10 feet tall and 10 feet wide, and the thickness of the block letter will be 2.5 feet.
o How large will the H be if measured in square feet?
o The truck that will be used to bring the wood from the lumber yard to the school can only hold a piece of wood that is 60 inches by 60 inches. What pieces of wood (how many pieces and what dimensions) are needed to complete the project?

33
Louisiana Student Standards: Companion Document for Teachers
Grade 6 Math
6.G.A.2 Find the volume of a right rectangular prism with fractional edge lengths by packing it with unit cubes of the appropriate unit fraction edge lengths, and show that the volume is the same as would be found by multiplying the edge lengths of the prism. Apply the formulas 𝑉𝑉 = 𝑙𝑙𝑤𝑤ℎ and 𝑉𝑉 = 𝑏𝑏ℎ to find volumes of right rectangular prisms with fractional edge lengths in the context of solving real-world and mathematical problems.
Component(s) of Rigor: Conceptual Understanding, Procedural Skill and Fluency, Application Remediation - Previous Grade(s) Standard: 5.MD.C.5 6th Grade Standard Taught in Advance: none 6th Grade Standard Taught Concurrently: none Previously students calculated the volume of right rectangular prisms (boxes) using whole number edges. In sixth grade the unit cube will have fractional edge lengths. (i.e., ½ • ½ • ½ ) Students find the volume of the right rectangular prism with these unit cubes. Students can draw diagrams to represent fractional side lengths, connecting with multiplication of fractions. This process is similar to composing and decomposing two dimensional shapes. Examples:
• The model shows a cubic foot filled with cubic inches. The cubic inches can also be labeled as a fractional cubic unit with
dimensions of 121 ft3.
• The models show a rectangular prism with dimensions 3 2
inches, 52 inches, and
52 inches. Each of
the cubic units in the model is 81 in3. Students work with the model to illustrate
3 2
× 52 × 52 =
(3 × 5 × 5) × 81 . Students reason that a small cube has volume of
81 cubic inch because each cube
has an edge length of 12 inch.

34
Louisiana Student Standards: Companion Document for Teachers
Grade 6 Math
6.G.A.3 Draw polygons in the coordinate plane given coordinates for the vertices; use coordinates to find the length of a side joining points with the same first coordinate or the same second coordinate. Apply these techniques in the context of solving real-world and mathematical problems.
Component(s) of Rigor: Conceptual Understanding, Procedural Skill and Fluency, Application Remediation - Previous Grade(s) Standard: 5.G.A.2 6th Grade Standard Taught in Advance: none 6th Grade Standard Taught Concurrently: 6.NS.C.8 Students are given the coordinates of polygons to draw in the coordinate plane. If both x-coordinates are the same (2, -1) and (2, 4), then students recognize that a vertical line has been created and the distance between these coordinates is the distance between -1 and 4, or 5. If both the y-coordinates are the same (-5, 4) and (2, 4), then students recognize that a horizontal line has been created and the distance between these coordinates is the distance between -5 and 2, or 7. Using this understanding, student solve real-world and mathematical problems, including finding the area and perimeter of geometric figures drawn on a coordinate plane. This standard can be taught in conjunction with 6.G.A.1 to help students develop the formula for the triangle by using the squares of the coordinate grid. Given a triangle, students can make the corresponding square or rectangle and realize the triangle is ½ the rectangle or square. Examples:
• On a map, the library is located at (-2, 2), the city hall building is located at (0,2), and the high school is located at (0,0). Represent the locations as points on a coordinate grid with a unit of 1 mile.
o What is the distance from the library to the city hall building? The distance from the city hall building to the high school? How do you know?
o What shape is formed by connecting the three locations? The city council is planning to place a city park in this area. How large is the area of the planned park?
• If the points on the coordinate plane below are the three vertices of a rectangle, what are the coordinates of the fourth vertex? How do you know? What are the length and width of the rectangle? Find the area and the perimeter of the rectangle.
Solution: The fourth vertex would be (2, -3). The area would be 5 × 6 or 30 units2. The perimeter would be 5 + 5 + 6 + 6 or 22 units

35
Louisiana Student Standards: Companion Document for Teachers
Grade 6 Math
6.G.A.4 Represent three-dimensional figures using nets made up of rectangles and triangles, and use the nets to find the surface area of these figures. Apply these techniques in the context of solving real-world and mathematical problems.
Component(s) of Rigor: Conceptual Understanding, Procedural Skill and Fluency, Application Remediation - Previous Grade(s) Standard: none 6th Grade Standard Taught in Advance: 6.G.A.1 6th Grade Standard Taught Concurrently: none A net is a two-dimensional representation of a three-dimensional figure. Students represent three-dimensional figures whose nets are composed of rectangles and triangles. Students recognize that parallel and perpendicular lines on a net form rectangles. Using the dimensions of the individual faces, students calculate the area of each rectangle and/or triangle and add these sums together to find the surface area of the figure. Students also create nets to form a specified three-dimensional figure.
Students can create nets of 3D figures with specified dimensions using the Dynamic Paper Tool on NCTM’s Illuminations (http://illuminations.nctm.org/ActivityDetail.aspx?ID=205).
Examples:
• Describe the shapes of the faces needed to construct a rectangular pyramid. Cut out the shapes and create a model. Did your faces work? Why or why not?
• Create the net for a given prism or pyramid, and then use the net to calculate the surface area.

36
Louisiana Student Standards: Companion Document for Teachers
Grade 6 Math
Statistics and Probability (SP) A. Develop understanding of statistical variability. In this cluster, the terms students should learn to use with increasing precision are statistics, data, variability, distribution, dot plot, histograms, box plots, median, mean, range, and spread (as it relates to data).
Louisiana Standard Explanations and Examples 6.SP.A.1 Recognize a statistical question as one that anticipates variability in the data related to the question and accounts for it in the answers. For example, “How old am I?” is not a statistical question, but “How old are the students in my school?” is a statistical question because one anticipates variability in students’ ages.
Component(s) of Rigor: Conceptual Understanding Remediation - Previous Grade(s) Standard: 5.MD.B.2 6th Grade Standard Taught in Advance: none 6th Grade Standard Taught Concurrently: none Statistics are numerical data relating to an aggregate of individuals; statistics is also the name for the science of collecting, analyzing and interpreting such data. A statistical question anticipates an answer that varies from one individual to the next and is written to account for the variability in the data. Data are the numbers produced in response to a statistical question. Data are frequently collected from surveys or other sources (e.g., documents).
Questions can result in a narrow or wide range of numerical values. For example, asking classmates “How old are the students in my class in years?” will result in less variability than asking “How old are the students in my class in months?”
Students might want to know about the fitness of the students at their school. Specifically, they want to know about the exercise habits of the students. So rather than asking "Do you exercise?" they should ask about the amount of exercise the students at their school get per week. A statistical question for this study could be: “How many hours per week on average do students at Jefferson Middle School exercise?”
To collect this information, students might design a survey question that anticipates variability by providing a variety of possible anticipated responses that have numerical answers, such as: 3 hours per week, 4 hours per week, and so on. Be sure that students ask questions that have specific numerical answers.
37
Louisiana Student Standards: Companion Document for Teachers
Grade 6 Math
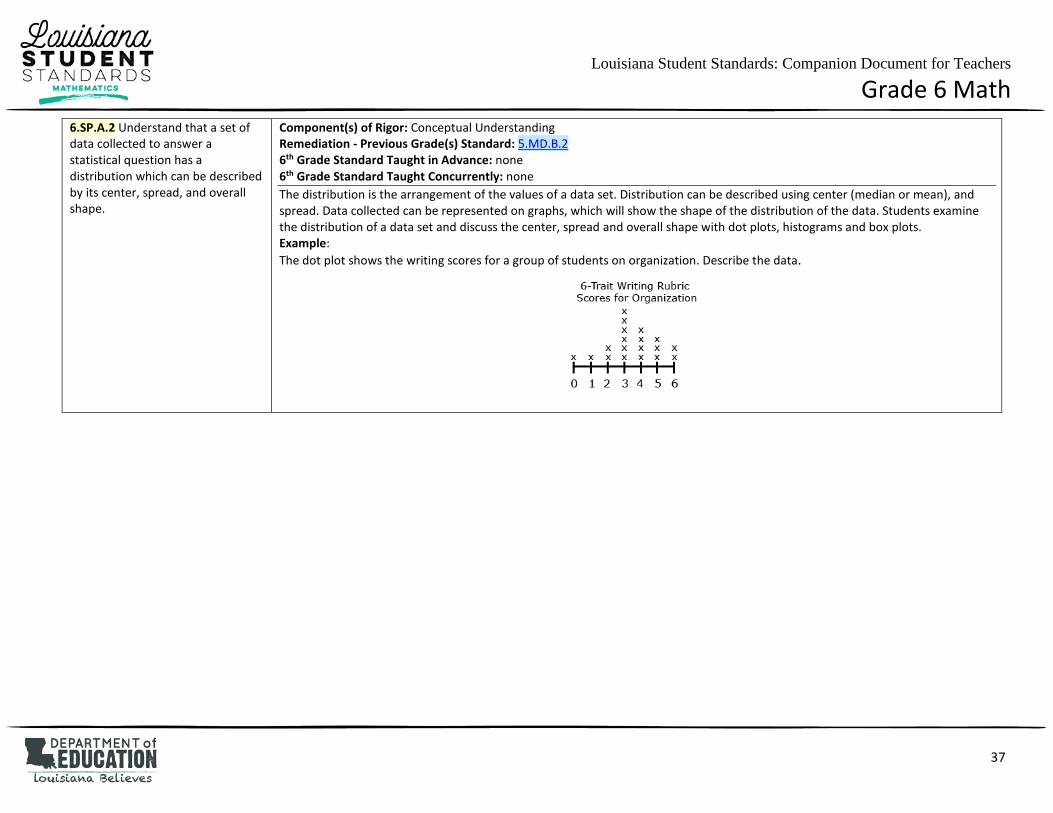
6.SP.A.2 Understand that a set of data collected to answer a statistical question has a distribution which can be described by its center, spread, and overall shape.
Component(s) of Rigor: Conceptual Understanding Remediation - Previous Grade(s) Standard: 5.MD.B.2 6th Grade Standard Taught in Advance: none 6th Grade Standard Taught Concurrently: none The distribution is the arrangement of the values of a data set. Distribution can be described using center (median or mean), and spread. Data collected can be represented on graphs, which will show the shape of the distribution of the data. Students examine the distribution of a data set and discuss the center, spread and overall shape with dot plots, histograms and box plots. Example: The dot plot shows the writing scores for a group of students on organization. Describe the data.

38
Louisiana Student Standards: Companion Document for Teachers
Grade 6 Math
6.SP.A.3 Recognize that a measure of center for a numerical data set summarizes all of its values with a single number, while a measure of variation describes how its values vary with a single number.
Component(s) of Rigor: Conceptual Understanding Remediation - Previous Grade(s) Standard: none 6th Grade Standard Taught in Advance: 6.SP.A.1, 6.SP.A.2 6th Grade Standard Taught Concurrently: none Data sets contain many numerical values that can be summarized by one number such as a measure of center. The measure of center gives a numerical value to represent the center of the data (i.e., midpoint of an ordered list or the balancing point). Another characteristic of a data set is the variability (or spread) of the values. Measures of variability are used to describe this characteristic. Example: Consider the data shown in the dot plot (sometimes called line plot) of the six trait scores for organization for a group of students.
• How many students are represented in the data set? • What are the mean and median of the data set? What do these values mean? How do they compare? • What is the range of the data? What does this value mean?
Solution: • 19 students are represented in the data set. • The mean of the data set is 3.5. The median is 3. The mean indicates that if the values were equally
distributed, all students would score a 3.5. The median indicates that 50% of the students scored a 3 or higher; 50% of the students scored a 3 or lower.
• The range of the data is 6, indicating that the values vary 6 points between the lowest and highest scores.

39
Louisiana Student Standards: Companion Document for Teachers
Grade 6 Math
Statistics and Probability (SP) B. Summarize and describe distributions In this cluster, the terms students should learn to use with increasing precision are box plots, dot plots, histograms, frequency tables, cluster, peak, gap, mean, median, interquartile range, measures of center, measures of variability, data, quartiles, lower quartile (1st quartile or Q1), upper quartile (3rd quartile or Q3), symmetrical, skewed, summary statistics, and extreme values.
Louisiana Standard Explanations and Examples 6.SP.B.4 Display numerical data in plots on a number line, including dot plots, histograms, and box plots.
Component(s) of Rigor: Procedural Skill and Fluency Remediation - Previous Grade(s) Standard: 5.MD.B.2 6th Grade Standard Taught in Advance: none 6th Grade Standard Taught Concurrently: 6.SP.B.5 In order to display numerical data in dot plots (sometimes called line plots), histograms or box plots, students need to make decisions and perform calculations. Students are expected to display data graphically in a format appropriate for that data set as well as reading data from graphs generated by others students or contained in reference materials. Students can use applets to create data displays. Examples of applets include the Box Plot Tool and Histogram Tool on NCTM’s Illuminations.
Box Plot Tool - http://illuminations.nctm.org/ActivityDetail.aspx?ID=77
Histogram Tool - http://illuminations.nctm.org/ActivityDetail.aspx?ID=78
Dot plots are simple plots on a number line where each dot represents a piece of data in the data set. Dot plots are suitable for small to moderate size data sets and are useful for highlighting the distribution of the data including clusters, gaps, and extreme values.
In most real data sets, there is a large amount of data and many numbers will be unique. A graph (such as a dot plot) that shows how many ones, how many twos, etc. would not be meaningful; however, a histogram can be used. Students organize the data into convenient ranges and use these intervals to generate a frequency table and histogram. Note that changing the size of the range changes the appearance of the graph and the conclusions you may draw from it.
Box plots are another useful way to display data and are plotted horizontally or vertically on a number line. Box plots are generated from the five number summaries of a data set consisting of the minimum, maximum, median, and two quartile values. Box plots display the degree of spread of the data and the skewness of the data.

40
Louisiana Student Standards: Companion Document for Teachers
Grade 6 Math
6.SP.B.4 continued
Examples: • Grade 6 students were collecting data for a math class project. They decided they would survey the other two grade 6
classes to determine how many DVDs each student owns. A total of 48 students were surveyed. The data are shown in the table below in no specific order. Create a data display. What are some observations that can be made from the data display?
11 21 5 12 10 31 19 13 23 33 10 11 25 14 34 15 14 29 8 5 22 26 23 12 27 4 25 15 7 2 19 12 39 17 16 15 28 16
A histogram using 5 ranges (0-9, 10-19, …30-39) to organize the data is displayed below.
• Ms. Wheeler asked each student in her class to write their age in months on a sticky note. The 28 students in the class brought their sticky note to the front of the room and posted them in order on the white board. The data set is listed below in order from least to greatest. Create a data display. What are some observations that can be made from the data display?
130 130 131 131 132 132 132 133 134 136 137 137 138 139 139 139 140 141 142 142 142 143 143 144 145 147 149 150
Five number summary Minimum – 130 months Quartile 1 (Q1) – (132 + 133) ÷ 2 = 132.5 months Median (Q2) – 139 months Quartile 3 (Q3) – (142 + 143) ÷ 2 = 142.5 months Maximum – 150 months

41
Louisiana Student Standards: Companion Document for Teachers
Grade 6 Math
6.SP.B.4 continued
This box plot shows that: o ¼ of the students in the class are from 130 to 132.5 months old o ¼ of the students in the class are from 142.5 months to 150 months old o ½ of the class are from 132.5 to 142.5 months old o the median class age is 139 months
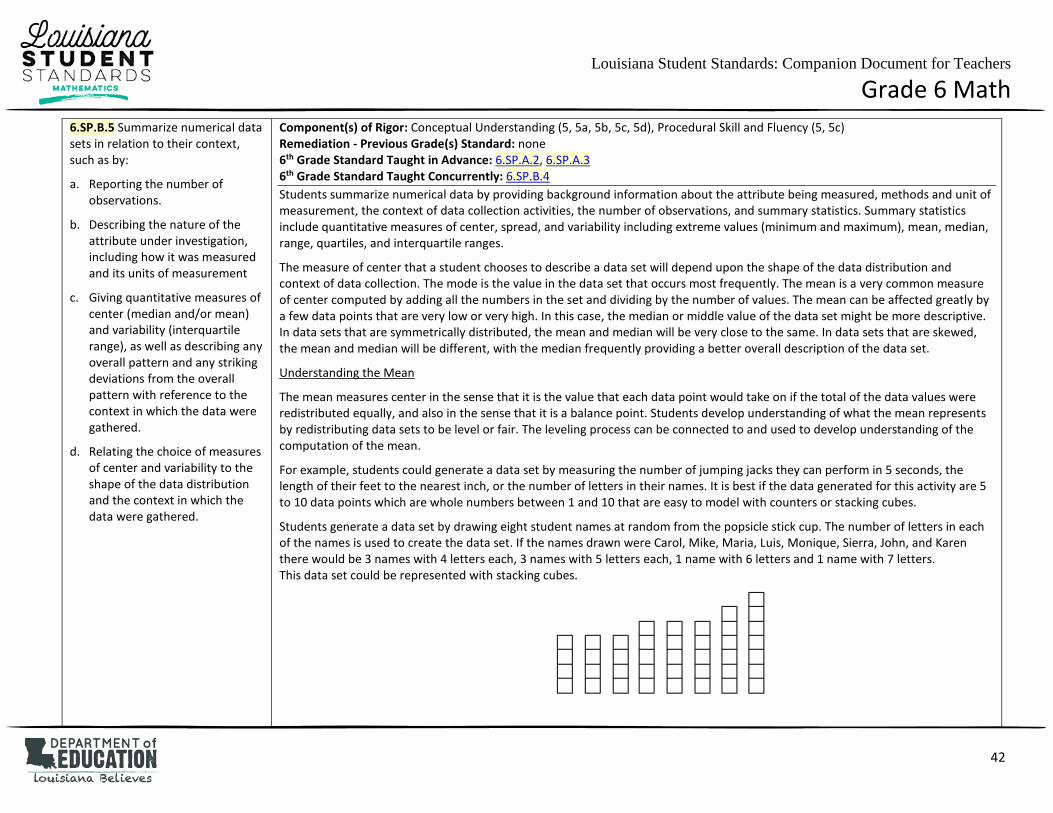
42
Louisiana Student Standards: Companion Document for Teachers
Grade 6 Math
6.SP.B.5 Summarize numerical data sets in relation to their context, such as by:
a. Reporting the number of observations.
b. Describing the nature of the attribute under investigation, including how it was measured and its units of measurement
c. Giving quantitative measures of center (median and/or mean) and variability (interquartile range), as well as describing any overall pattern and any striking deviations from the overall pattern with reference to the context in which the data were gathered.
d. Relating the choice of measures of center and variability to the shape of the data distribution and the context in which the data were gathered.
Component(s) of Rigor: Conceptual Understanding (5, 5a, 5b, 5c, 5d), Procedural Skill and Fluency (5, 5c) Remediation - Previous Grade(s) Standard: none 6th Grade Standard Taught in Advance: 6.SP.A.2, 6.SP.A.3 6th Grade Standard Taught Concurrently: 6.SP.B.4 Students summarize numerical data by providing background information about the attribute being measured, methods and unit of measurement, the context of data collection activities, the number of observations, and summary statistics. Summary statistics include quantitative measures of center, spread, and variability including extreme values (minimum and maximum), mean, median, range, quartiles, and interquartile ranges.
The measure of center that a student chooses to describe a data set will depend upon the shape of the data distribution and context of data collection. The mode is the value in the data set that occurs most frequently. The mean is a very common measure of center computed by adding all the numbers in the set and dividing by the number of values. The mean can be affected greatly by a few data points that are very low or very high. In this case, the median or middle value of the data set might be more descriptive. In data sets that are symmetrically distributed, the mean and median will be very close to the same. In data sets that are skewed, the mean and median will be different, with the median frequently providing a better overall description of the data set.
Understanding the Mean
The mean measures center in the sense that it is the value that each data point would take on if the total of the data values were redistributed equally, and also in the sense that it is a balance point. Students develop understanding of what the mean represents by redistributing data sets to be level or fair. The leveling process can be connected to and used to develop understanding of the computation of the mean.
For example, students could generate a data set by measuring the number of jumping jacks they can perform in 5 seconds, the length of their feet to the nearest inch, or the number of letters in their names. It is best if the data generated for this activity are 5 to 10 data points which are whole numbers between 1 and 10 that are easy to model with counters or stacking cubes.
Students generate a data set by drawing eight student names at random from the popsicle stick cup. The number of letters in each of the names is used to create the data set. If the names drawn were Carol, Mike, Maria, Luis, Monique, Sierra, John, and Karen there would be 3 names with 4 letters each, 3 names with 5 letters each, 1 name with 6 letters and 1 name with 7 letters. This data set could be represented with stacking cubes.

43
Louisiana Student Standards: Companion Document for Teachers
Grade 6 Math
6.SP.B.5 continued
Students can model the mean by “leveling” the stacks or distributing the blocks so the stacks are “fair.” Students are seeking to answer the question “If all of the students had the same number of letters in their name, how many letters would each person have?”
One block from the stack of six and two blocks from the stack of 7 can be moved down to the stacks of 4 and then all the stacks have five blocks. If all students had the same number of letters in their name, they would have five letters. The mean number of letters in a name in this data set is 5.
If it was not possible to make the stacks exactly even, students could begin to consider what part of the extra blocks each stack would have.
Students can also summarize and describe the center and variability in data sets using the median and a five number summary consisting of the minimum, quartiles, and maximum as seen in the box plot example in 6.SP.B.4. The median is the middle number of the data set with half the number below the median and half the numbers above the median. The quartiles partition the data set into four parts by dividing each of the halves of the data set into half again. Quartile 1 (Q1 or the lower quartile) is the middle value of the lower half of the data set and quartile 3 (Q3 or the upper quartile) is the middle value of the upper half of the data set. The median can also be referred to as quartile 2 (Q2). The range of the data is the difference between the minimum and maximum values. The interquartile range of the data is the difference between the lower and upper quartiles (Q3 – Q1). The interquartile range is a measure of the dispersion or spread of the data set: a small value indicates values that are clustered near the median whereas a larger value indicates values that are more distributed.
Consider the first data set again. Recall that the names drawn were Carol, Mike, Maria, Luis, Monique, Sierra, John, and Karen. The data set can be represented in a numerical list. To find the median and quartile, the values are placed in order from least to greatest.
5 4 5 4 7 6 4 5 4 4 4 5 5 5 6 7
The middle value in the ordered data set is the median. If there are even numbers of values, the median is the mean of the middle two values. In this case, the median would be 5 because 5 is the average of the 4th and 5th values which are both 5.

44
Louisiana Student Standards: Companion Document for Teachers
Grade 6 Math
6.SP.B.5 continued
Students find quartile 1 (Q1) by examining the lower half of the data. Again there are 4 values which is an even number of values. Q1 would be the average of the 2nd and 3rd value in the data set or 4. Students find quartile 3 (Q3) by examining the upper half of the data. Q3 would be the average of the 6th and 7th value in the data set or 5.5. The mean of the data set was 5 and the median is also 5, showing that the values are probably clustered close to the mean. The interquartile range is 1.5 (5.5 – 4). The interquartile range is small, showing little variability in the data.

45
Louisiana Student Standards: Companion Document for Teachers
Grade 6 Math
Grade 1 Standards 1.OA.B.3 Apply properties of operations to add and subtract. Examples: If 8 + 3 = 11 is known, then 3 + 8 = 11 is also known. (Commutative property of addition.) To add 2 + 6 + 4, the second two numbers can be added to make a ten, so 2 + 6 + 4 = 2 + 10 = 12. (Associative property of addition.) Return to 6.EE.A.3, 6.EE.A.4
Grade 3 Standards 3.OA.B.5 Apply properties of operations as strategies to multiply and divide.2 Examples: If 6 × 4 = 24 is known, then 4 × 6 = 24 is also known. (Commutative property of multiplication.) 3 × 5 × 2 can be found by 3 × 5 = 15, then 15 × 2 = 30, or by 5 × 2 = 10, then 3 × 10 = 30. (Associative property of multiplication.) Knowing that 8 × 5 = 40 and 8 × 2 = 16, one can find 8 × 7 as 8 × (5 + 2) = (8 × 5) + (8 × 2) = 40 + 16 = 56. (Distributive property.) Return to 6.EE.A.3, 6.EE.A.4
3.OA.B.6 Understand division as an unknown-factor problem. For example, find 32 ÷ 8 by finding the number that makes 32 when multiplied by 8. Return to 6.NS.A.1
3.NF.A.2 Understand a fraction with denominators 2, 3, 4, 6, and 8 as a number on the number line; represent fractions on a number line diagram. a. Represent a fraction 1/b on a number line diagram by defining the interval from 0 to 1 as the whole and partitioning it into b equal parts. Recognize that
each part has size 1/b and that the endpoint of the part based at 0 locates the number 1/b on the number line. b. Represent a fraction a/b on a number line diagram by marking off a lengths 1/b from 0. Recognize that the resulting interval has size a/b and that its
endpoint locates the number a/b on the number line. Return to 6.NS.C.6
Grade 4 Standards 4.OA.A.2 Multiply or divide to solve word problems involving multiplicative comparison, e.g., by using drawings and equations with a symbol for the unknown number to represent the problem, distinguishing multiplicative comparison from additive comparison (Example: 6 times as many vs. 6 more.) Return to 6. RP.A.1, 6.RP.A.2
4.OA.B.4 Using whole numbers in the range 1–100, a. Find all factor pairs for a given whole number. b. Recognize that a given whole number is a multiple of each of its factors. c. Determine whether a given whole number is a multiple of a given one-digit number. d. Determine whether a given whole number is prime or composite.
Return to 6.NS.B.4, 6.EE.A.1
4.MD.A.1 Know relative sizes of measurement units within one system of units including: ft, in; km, m, cm; kg, g; lb, oz.; l, ml; hr, min, sec. Within a single system of measurement, express measurements in a larger unit in terms of a smaller unit. (Conversions are limited to one-step conversions.) Record measurement equivalents in a two-column table. For example, know that 1 ft is 12 times as long as 1 in. Express the length of a 4 ft snake as 48 in. Generate a conversion table for feet and inches listing the number pairs (1, 12), (2, 24), (3, 36), ... Return to 6.RP.A.1
46
Louisiana Student Standards: Companion Document for Teachers
Grade 6 Math
4.MD.A.3 Apply the area and perimeter formulas for rectangles in real-world and mathematical problems. For example, find the width of a rectangular room given the area of the flooring and the length, by viewing the area formula as a multiplication equation with an unknown factor. Return to 6.G.A.1
4.MD.D.8 Recognize area as additive. Find areas of rectilinear figures by decomposing them into non-overlapping rectangles and adding the areas of the non-overlapping parts, applying this technique to solve real-world problems. Return to 6.G.A.1
Grade 5 Standards 5.OA.A.2 Write simple expressions that record calculations with whole numbers, fractions and decimals, and interpret numerical expressions without evaluating them. For example, express the calculation "add 8 and 7, then multiply by 2" as 2 × (8 + 7). Recognize that 3 × (18,932 + 9.21) is three times as large as 18,932 + 9.21, without having to calculate the indicated sum or product. Return to 6.NS.B.4, 6.EE.A.2, 6.EE.A.3, 6.EE.A.4
5.OA.B.3 Generate two numerical patterns using two given rules. Identify apparent relationships between corresponding terms. Form ordered pairs consisting of corresponding terms from the two patterns, and graph the ordered pairs on a coordinate plane. For example, given the rule "Add 3" and the starting number 0, and given the rule "Add 6" and the starting number 0, generate terms in the resulting sequences, and observe that the terms in one sequence are twice the corresponding terms in the other sequence. Explain informally why this is so. Return to 6.RP.A.1, 6.EE.A.2, 6.EE.C.9
5.NBT.A.2 Explain and apply patterns in the number of zeros of the product when multiplying a number by powers of 10. Explain and apply patterns in the values of the digits in the product or the quotient, when a decimal is multiplied or divided by a power of 10. Use whole-number exponents to denote powers of 10. For example, 100 = 1, 101 = 10 ... and 2.1 x 102 = 210. Return to 6.EE.A.1
5.NBT.B.5 Fluently multiply multi-digit whole numbers using the standard algorithm. Return to 6.NS.B.3
5.NBT.B.6 Find whole-number quotients of whole numbers with up to four-digit dividends and two-digit divisors, using strategies based on place value, the properties of operations, subtracting multiples of the divisor, and/or the relationship between multiplication and division. Illustrate and/or explain the calculation by using equations, rectangular arrays, area models, or other strategies based on place value. Return to 6.NS.B.2, 6.NS.B.3
5.NBT.B.7 Add, subtract, multiply, and divide decimals to hundredths, using concrete models or drawings and strategies based on place value, properties of operations, and/or the relationship between addition and subtraction; justify the reasoning used with a written explanation. Return to 6.NS.B.3
5.NF.A.1 Add and subtract fractions with unlike denominators (including mixed numbers) by replacing given fractions with equivalent fractions in such a way as to produce an equivalent sum or difference of fractions with like denominators. For example, 2/3 + 5/4 = 8/12 + 15/12 = 23/12. (In general, a/b + c/d = (ad + bc)/bd.) Return to 6.EE.B.7

47
Louisiana Student Standards: Companion Document for Teachers
Grade 6 Math
5.NF.B.3 Interpret a fraction as division of the numerator by the denominator (a/b = a ÷ b). Solve word problems involving division of whole numbers leading to answers in the form of fractions or mixed numbers, e.g., by using visual fraction models or equations to represent the problem. For example, interpret 3/4 as the result of dividing 3 by 4, noting that 3/4 multiplied by 4 equals 3, and that when 3 wholes are shared equally among 4 people each person has a share of size 3/4. If 9 people want to share a 50-pound sack of rice equally by weight, how many pounds of rice should each person get? Between what two whole numbers does your answer lie? Return to 6.RP.A.2
5.NF.B.4 Apply and extend previous understandings of multiplication to multiply a fraction or whole number by a fraction. a. Interpret the product (m/n) x q as m parts of a partition of q into n equal parts; equivalently, as the result of a sequence of operations, m x q ÷ n. For
example, use a visual fraction model to show understanding, and create a story context for (m/n) x q. b. Construct a model to develop understanding of the concept of multiplying two fractions and create a story context for the equation. [In general, (m/n) x
(c/d) = (mc)/(nd).] c. Find the area of a rectangle with fractional side lengths by tiling it with unit squares of the appropriate unit fraction side lengths, and show that the area
is the same as would be found by multiplying the side lengths. d. Multiply fractional side lengths to find areas of rectangles, and represent fraction products as rectangular areas.
Return to 6.EE.B.7, 6.G.A.1
5.NF.B.5 Interpret multiplication as scaling (resizing). a. Comparing the size of a product to the size of one factor on the basis of the size of the other factor, without performing the indicated multiplication. b. Explaining why multiplying a given number by a fraction greater than 1 results in a product greater than the given number (recognizing multiplication by
whole numbers greater than 1 as a familiar case). c. Explaining why multiplying a given number by a fraction less than 1 results in a product smaller than the given number; and relating the principle of
fraction equivalence a/b = (n × a)/(n × b) to the effect of multiplying a/b by 1. d. Relating the principle of fraction equivalence a/b = (n x a)/(n x b) to the effect of multiplying a/b by 1.
Return to 6.RP.A.1
5.NF.B.7 Apply and extend previous understandings of division to divide unit fractions by whole numbers and whole numbers by unit fractions. a. Interpret division of a unit fraction by a non-zero whole number, and compute such quotients. For example, create a story context for (1/3) ÷ 4, and use a
visual fraction model to show the quotient. Use the relationship between multiplication and division to explain that (1/3) ÷ 4 = 1/12 because (1/12) × 4 = 1/3.
b. Interpret division of a whole number by a unit fraction, and compute such quotients. For example, create a story context for 4 ÷ (1/5), and use a visual fraction model to show the quotient. Use the relationship between multiplication and division to explain that 4 ÷ (1/5) = 20 because 20 × (1/5) = 4.
c. Solve real-world problems involving division of unit fractions by non-zero whole numbers and division of whole numbers by unit fractions, e.g., by using visual fraction models and equations to represent the problem. For example, how much chocolate will each person get if 3 people share 1/2 lb of chocolate equally? How many 1/3-cup servings are in 2 cups of raisins?
Return to 6.RP.A.2, 6.NS.A.1

48
Louisiana Student Standards: Companion Document for Teachers
Grade 6 Math
5.MD.B.2 Make a line plot to display a data set of measurements in fractions of a unit (1/2, 1/4, 1/8). Use operations on fractions for this grade to solve problems involving information presented in line plots. For example, given different measurements of liquid in identical beakers, find the amount of liquid each beaker would contain if the total amount in all the beakers were redistributed equally. Return to 6.SP.A.1, 6.SP.A.2, 6.SP.B.4
5.MD.C.5 Relate volume to the operations of multiplication and addition and solve real-world and mathematical problems involving volume. a. Find the volume of a right rectangular prism with whole-number side lengths by packing it with unit cubes, and show that the volume is the same as
would be found by multiplying the edge lengths, equivalently by multiplying the height by the area of the base. Represent threefold whole-number products as volumes, e.g., to represent the associative property of multiplication.
b. Apply the formulas V = l × w × h and V = b × h for rectangular prisms to find volumes of right rectangular prisms with whole-number edge lengths in the context of solving real-world and mathematical problems.
c. Recognize volume as additive. Find volumes of solid figures composed of two non-overlapping right rectangular prisms by adding the volumes of the non-overlapping parts, applying this technique to solve real-world problems.
Return to 6.G.A.2
5.G.A.1 Use a pair of perpendicular number lines, called axes, to define a coordinate system, with the intersection of the lines (the origin) arranged to coincide with the 0 on each line and a given point in the plane located by using an ordered pair of numbers, called its coordinates. Understand that the first number in the ordered pair indicates how far to travel from the origin in the direction of one axis, and the second number in the ordered pair indicates how far to travel in the direction of the second axis, with the convention that the names of the two axes and the coordinates correspond (e.g., x-axis and x-coordinate, y-axis and y-coordinate). Return to 6.NS.C.6
5.G.A.2 Represent real-world and mathematical problems by graphing points in the first quadrant of the coordinate plane, and interpret coordinate values of points in the context of the situation. Return to 6.NS.C.8, 6.G.A.3