grade 300 prestressing strand and the effect of vertical
TRANSCRIPT

Grade 300 Prestressing Strand and the Effect of Vertical Casting Position
James Christopher Carroll
Dissertation submitted to the faculty of the Virginia Polytechnic Institute and State University in partial fulfillment of the requirements for the degree of
Doctor of Philosophy
In Civil Engineering
Tommy E. Cousins Carin L. Roberts-Wollmann
Elisa D. Sotelino Linbing Wang
August 20, 2009 Blacksburg, Virginia
Keywords: Transfer length, Development length, Prestressed concrete, Bond, Top-
strand effect, Grade 300 strand, Flexural strength

Grade 300 Prestressing Strand and the Effect of Vertical Casting Position
James Christopher Carroll
ABSTRACT
The purpose of this study was to investigate the influence an increase in strand
strength and the effect the as-cast vertical location had on transfer length, development
length, and flexural strength and to resolve the discrepancies regarding the definition of
the top-bar/strand effect. Two types of test specimens were fabricated and tested
investigating each respective item. The increase in strand strength was found to influence
transfer length, development length, and flexural strength, while the as-cast vertical
location was only found to influence transfer length, and in turn development length.
Contrary to the historical definition, the top-bar/strand effect was found to be more
dependent on the amount of concrete cast above the strand than the amount below it, with
transfer lengths showing a steady increase with a decrease in the amount of concrete cast
above the strand. As a result of the findings of this study, a new transfer length equation
was proposed and a previously proposed flexural bond length equation was
recommended for use in lieu of the current code provisions. The current equations for
flexural strength were found to give adequate estimates for flexural strength, although a
decrease in ductility was noted.

iii
DEDICATION
I would like to dedicate this dissertation to all those family members who have
given their continual support and encouragement during my pursuit of my Ph.D. at
Virginia Tech. I would also like to dedicate this to my Lord and Savior, Jesus Christ, for
without his guidance I would not be where I am today.

iv
ACKNOWLEDGEMENTS
First and foremost I would like to thank my Lord and Savior, Jesus Christ, for the
opportunity and ability to pursue a Ph.D. To my committee, Dr. Cousins, Dr. Wollmann,
Dr. Sotelino, and Dr. Wang, thank you for your continued guidance and support during
my time at Virginia Tech. A special thanks to Dr. Cousins and Dr. Wollmann for their
continued patience during my teaching endeavors and guidance in preparation for a
career in academia. Thank you to Dr. Sotelino for providing me the opportunity to work
with the History Channel.
I would like to thank the Department of Civil and Environmental Engineering and
the College of Engineering for the opportunities that were provided for me to further
prepare me for a career in academia. I would also like to thank the Virginia
Transportation Research Council for funding this project.
On another note, I would like to thank Brett Farmer and Dennis Huffman for all
their help during my time at the Structures Lab. I would also like to thank the numerous
fellow students that helped in the ever daunting task of measuring DEMEC points. A
special thanks to Hunter Hodges, Bryan Loflin, and Rob Cousins.
I would also like to thank my family for their continued support. I would
specifically like to thank my mother for her always positive encouragement, my sister
Felecia for her support, and my nephew Jacob for all the late nights he spent with me as I
neared the completion of my dissertation.
No acknowledgements are necessary for photos, as all photos were taken by the
author.

v
TABLE OF CONTENTS
1.0 INTRODUCTION……………………………………………………………... 1
1.1 Background………………………………………………………………… 1 1.2 Purpose Statement………………………………………………………….. 3 1.3 Objectives………………………………………………………………….. 3
2.0 BACKGROUND AND LITERATURE REVIEW……………………………. 5 2.1 Introduction………………………………………………………………… 5 2.2 Transfer Length…………………………………………………….. ……... 10
2.2.1 Introduction………………………………………………………… 10 2.2.2 (Prior to 1990)……………………………………………………… 12 2.2.3 (1990 – 1999)………………………………………………………. 15 2.2.4 (2000 – 2009)………………………………………………………. 20 2.2.5 End-slip…………………………………………………………….. 21 2.2.6 Summary…………………………………………………………… 25
2.3 Development Length……………………………………………………….. 28 2.3.1 Introduction………………………………………………………… 28 2.3.2 (Prior to 1990) ……………………………………………………... 30 2.3.3 (1990 – 1999)………………………………………………………. 31 2.3.4 (2000 – 2009)………………………………………………………. 35 2.3.5 Summary…………………………………………………………… 36
2.4 Bond Characteristics and Influential Factors………………………………. 39 2.4.1 Introduction………………………………………………………… 39 2.4.2 Strand Stress……………………………………………………….. 40 2.4.3 Strand Diameter……………………………………………………. 40 2.4.4 Spacing, Cover, and Confinement…………………………………. 41 2.4.5 Top-bar Effect ……………………………………………………... 42 2.4.6 Surface Condition………………………………………………….. 43 2.4.7 Concrete Strength…………………………………………………... 44 2.4.8 Release Method…………………………………………………….. 45 2.4.9 Additional Factors………………………………………………….. 46 2.4.10 Summary…………………………………………………………… 46
2.5 Bond Quality……………………………………………………….. ……... 47 2.6 Top-strand Effect…………………………………………………………... 51 2.7 Grade 300 Strand…………………………………………………………... 55 2.8 Flexural Strength…………………………………………………………… 57 2.9 Summary…………………………………………………………………… 60
3.0 METHODOLOGY…………………………………………………………….. 61 3.1 Test Specimen Design ……………………………………………………... 61 3.2 Fabrication of Test Specimens……………………………………………... 69 3.3 Formwork Design………………………………………………………….. 79 3.4 Initial Prestress……………………………………………………………... 82 3.5 Material Properties…………………………………………………………. 83

vi
3.6 Transfer Length Measurements……………………………………………. 87 3.7 Development Length Measurements………………………………………. 93 3.8 Flexural Strength…………………………………………………………… 96 3.9 Practical Modeling Technique for Transfer Length………………………... 99
4.0 RESULTS AND DISCUSSION……………………………………………….. 107 4.1 Transfer Length……………………………………………………………. 107
4.1.1 Introduction………………………………………………………… 107 4.1.2 Influence of Release Method………………………………………. 108 4.1.3 Influence of Strand Strength……………………………………….. 115 4.1.4 Influence of Strand Diameter/Area………………………………… 118 4.1.5 Influence of Effective Prestress……………………………………. 121 4.1.6 Influence of Concrete Strength…………………………………….. 123 4.1.7 Influence of Time…………………………………………………... 124 4.1.8 Influence of Casting Orientation…………………………………… 128 4.1.9 Current and Recommended Equations…………………...…………137 4.1.10 Proposed Transfer Length Equation……………………………….. 148
4.2 End-slip………………….…………………………………………………. 156 4.2.1 End-slip Measurements for Calculating Transfer Lengths………… 156 4.2.2 Transfer Length and Bond Stress…………………………………... 164
4.3 Practical Modeling Technique for Transfer Length………………... ……... 169 4.4 Development Length……………………………………………………….. 177
4.4.1 Introduction………………………………………………………… 177 4.4.2 Influence of Strand Strength……………………………………….. 180 4.4.3 Influence of Strand Diameter/Area………………………………… 181 4.4.4 Influence of Effective Prestress……………………………………. 182 4.4.5 Influence of (fps – fse)……………………………………………….. 183 4.4.6 Influence of Concrete Strength…………………………………….. 184 4.4.7 Influence of Casting Orientation…………………………………… 185 4.4.8 Current and Additional Recommended Equations………………… 189
4.5 Flexural Strength…………………………………………………………… 201 4.5.1 Introduction………………………………………………………… 201 4.5.2 Comparison of Flexural Strength…………………………………... 201
5.0 CONCLUSIONS AND RECOMMENDATIONS…………………………….. 203 5.1 Summary…………………………………………………………………… 203 5.2 Conclusions………………………………………………………………… 203
5.2.1 Initial Objectives…………………………………………………… 203 5.2.2 Grade 300 Strand…………………………………………………... 203 5.2.3 Effect of Vertical Casting Positions………………………………... 204 5.2.4 Practical Modeling Technique for Transfer Length………………... 205 5.2.5 Other Conclusions………………………………………………….. 205
5.3 Recommendations………………………………………………………….. 206 5.4 Future Research……………………………………………………………. 206
LIST OF REFERENCES………………………………………………………….. 208

vii
APPENDIX A (Nomenclature)……………………………………………………. 212 APPENDIX B (Surface Strain Plots)………………………………………………. 215 APPENDIX C (Moment versus Deflection and End-slip Plots)…………………... 277 APPENDIX D (Additional Tables)………………………………………………... 298 APPENDIX E (Additional Figures)………………………………………………...302 APPENDIX F (Bond Model Input Files)………………………………………….. 304

viii
LIST OF FIGURES
Figure 2.1. Internal Forces of a Reinforced Concrete Beam…………………… 6 Figure 2.2. Stress Behavior…………………………………………………….. 12 Figure 2.3. Concrete and Steel Strain versus Length…………………………... 22 Figure 2.4. Strain Distribution in the Transfer Zone…………………………… 23 Figure 2.5. Idealized Bilinear Steel Stress Relationship at Strength...…………. 29 Figure 2.6. LBPT Strand Pattern……………………………………………….. 47 Figure 2.7. NASP Test Specimen………………………………………………. 48 Figure 2.8. LBPT Specimen……………………………………………………. 50 Figure 2.9. Jeanty et al. General Test Specimen Orientation…………………... 52 Figure 2.10. Peterman Test Setup……………………………………………….. 54 Figure 2.11. Internal Forces of a Reinforced Concrete Beam…………………… 58 Figure 2.12. Concrete Stress-Strain Relationships……...……………………….. 59 Figure 2.13. Steel Stress-Strain Relationships…..………………………………. 59 Figure 3.1. T-beam Cross-sections……………………………………………... 62 Figure 3.2. Stirrup Placement………………………………………………….. 65 Figure 3.3. Typical Reinforcement Layout……………………………………. 65 Figure 3.4. Identification Scheme……………………………………………… 67 Figure 3.5. Top-strand Blocks………………………………………………….. 68 Figure 3.6. Stressing Abutment……………………………………………….... 70 Figure 3.7. Plan View of Typical Pour Layout………………………………… 71 Figure 3.8. Formwork Assembly (Exploded)…………………………………... 72 Figure 3.9. Formwork Assembly (Assembled)………………………………… 73 Figure 3.10. Formwork Prior to Casting………………………………………… 73 Figure 3.11. General Pour Layout……………………………………………….. 73 Figure 3.12. Stressing Apparatus………………………………………………... 74 Figure 3.13. Stressing Abutments……………………………………………….. 75 Figure 3.14. Top-strand Block Formwork Assembly (Exploded)……………….. 76 Figure 3.15. Top-strand Block Formwork Assembly (Assembled)……………... 76 Figure 3.16. Top-strand Block Formwork General Layout……………………... 77 Figure 3.17. Top-strand Block Stressing Abutments……………………………. 78 Figure 3.18. Layout of Stressing Abutments for Top-strand Blocks……………. 78 Figure 3.19. Formwork Studs……………………………………………………. 80 Figure 3.20. Original Formwork Assembly……………………………………... 80 Figure 3.21. Plywood Stud Assembly…………………………………………… 81 Figure 3.22. Revised Formwork Assembly ……………………………………... 82 Figure 3.23. T-beam Test Specimens Concrete Strength Gain………………….. 85 Figure 3.24. Top-strand Blocks Concrete Strength Gain………………………... 87 Figure 3.25. T-beam DEMEC Point Layout…………………………………….. 88 Figure 3.26. Top-strand Block DEMEC Point Layout…………………………... 89 Figure 3.27. Transfer Length Strain Profile……………………………………... 91 Figure 3.28. Detail View of Intersection………………………………………… 92 Figure 3.29. End-slip Measurements Setup……………………………………... 93 Figure 3.30. Single Point Bending Test Setup…………………………………... 94 Figure 3.31. Single Point Bending Test Schematic ……………………………... 94

ix
Figure 3.32. Flexural Failures…………………………………………………… 95 Figure 3.33. End-slip Measurement Setup………………………………………. 95 Figure 3.34. Typical Bond Failure………………………………………………. 96 Figure 3.35. Modified Confined Concrete Stress vs. Strain Diagram…………… 97 Figure 3.36. Support Displacement Monitoring…………………………………. 98 Figure 3.37. Typical Moment vs. Deflection Relationship……………………… 99 Figure 3.38. Two-dimensional Finite Element Model…………………………... 100 Figure 3.39. Three-dimensional Finite Element Model…………………………. 101 Figure 3.40. Generic Model…………..…………………………………………. 102 Figure 3.41. Temperature Load on Truss Member...……………………………. 102 Figure 3.42. Sample Spring Stiffnesses.………………………………………….104 Figure 3.43. Transfer Length versus Spring Stiffness...…………………………. 104 Figure 3.44. Strand Force vs. Distance from End of Member.………………….. 105 Figure 3.45. Transfer Length vs. Spring Stiffness…………..…………………... 106 Figure 4.1. Influence of Release Method on Transfer Length (T-beams)...……. 110 Figure 4.2. Influence of Release Method on Transfer Length (TSB-Pour 1)...... 113 Figure 4.3. Influence of Release Method on Transfer Length (TSB-Pour 2)...... 113 Figure 4.4. Influence of Release Method on Transfer Length (TSB-Pour 3)...... 114 Figure 4.5. Influence of Release Method on Transfer Length (TSB-Pour 4)...... 114 Figure 4.6. Influence of Strand Grade (T-beams – Normal Orientation)……… 117 Figure 4.7. Influence of Strand Grade (T-beams – Inverted Orientation) ……... 117 Figure 4.8. Influence of Strand Diameter………………………………………. 120 Figure 4.9. Influence of Strand Area…………………………………………… 120 Figure 4.10. Influence of Effective Prestress……………………………………. 122 Figure 4.11. Influence of Initial Prestress……………………………………….. 122 Figure 4.12. Influence of Concrete Strength…………………………………….. 124 Figure 4.13. Influence of Time (T-beams)………………………………………. 127 Figure 4.14. Influence of Time (Top-strand Blocks)……………………………. 128 Figure 4.15. Influence of Casting Orientation…………………………………… 130 Figure 4.16. Transfer Length vs. bcast (T-beams)………………………………... 131 Figure 4.17. Transfer Length vs. dcast (T-beams)………………………………... 132 Figure 4.18. Transfer Length Correlation with same bcast……………………….. 134 Figure 4.19. Transfer Length Correlation with same dcast...................................... 134 Figure 4.20. Transfer Length vs. bcast (All Test Specimens)…………………….. 136 Figure 4.21. Transfer Length vs. dcast (All Test Specimens)…………………….. 136 Figure 4.22. Measured Transfer Lengths vs. ACI (Eq. 2-3)…………………….. 141 Figure 4.23. Measured Transfer Lengths vs. Alt. ACI (Eq. 2-4)………………... 141 Figure 4.24. Measured Transfer Lengths vs. Martin and Scott (Eq. 2-6)……….. 142 Figure 4.25. Measured Transfer Lengths vs. Zia and Mostafa (Eq. 2-7)………... 142 Figure 4.26. Measured Transfer Lengths vs. Cousins et al. (Eq. 2-8)…………… 143 Figure 4.27. Measured Transfer Lengths vs. Shahawy et al. (Eq. 2-9)………….. 143 Figure 4.28. Measured Transfer Lengths vs. Mitchell et al. (Eq. 2-10)…………. 144 Figure 4.29. Measured Transfer Lengths vs. AASHTO (Eq. 2-13)……………... 144 Figure 4.30. Measured Transfer Lengths vs. Russell and Burns (Eq. 2-14)…….. 145 Figure 4.31. Measured Transfer Lengths vs. Lane (Eq. 2-15)…………………... 145 Figure 4.32. Measured Transfer Lengths vs. Barnes et al. (Eq. 2-16)…………... 146

x
Figure 4.33. Measured Transfer Lengths vs. Kose and Burkett (Eq. 2-17)……... 146 Figure 4.34. Measured Transfer Lengths vs. Peterman (Eq. 2-18)……………… 147 Figure 4.35. Measured Transfer Lengths vs. NCHRP (Eq. 2-19)……………….. 147 Figure 4.36. Average Predicted Transfer Length vs. dcast……………………… 149 Figure 4.37. Transfer Length – X(fsi/f’
ci1/2)db vs. (24 – dcast)……………………. 150
Figure 4.38. Measured Transfer Lengths vs. Equation (4-2)……………………. 151 Figure 4.39. Measured Transfer Lengths vs. Equation (4-3)……………………. 152 Figure 4.40. Measured Transfer Lengths from Prior Studies vs. Equation (4-3)... 153 Figure 4.41. Measured Transfer Lengths from Prior Studies vs. Equation (4-4)... 154 Figure 4.42. Measured Transfer Lengths from Prior Studies vs. Equation (4-5)... 155 Figure 4.43. Measured Transfer Lengths vs. End-slip Measurements…………... 160 Figure 4.44. Measured Transfer Lengths vs. Guyon (Eq. 2-24)………………… 160 Figure 4.45. Measured Transfer Lengths vs. Cousins et al. (Eq. 2-23)………….. 161 Figure 4.46. Measured Transfer Lengths vs. Balasz (Eq. 2-25)…………………. 161 Figure 4.47. Measured Transfer Lengths vs. Balasz (Eq. 2-26)…………………. 162 Figure 4.48. Measured Transfer Lengths vs. Balasz (Eq. 2-27)…………………. 162 Figure 4.49. Measured Transfer Lengths vs. Russell and Barnes (Eq. 2-29)……. 163 Figure 4.50. Measured Transfer Lengths vs. Logan (Eq. 2-30)…………………. 163 Figure 4.51. Measured Transfer Lengths vs. Peterman (Eq. 2-28)……………… 164 Figure 4.52. Bond Stress vs. dcast……………………………................................166 Figure 4.53. Measured Transfer Lengths vs. LBPT Values……………………... 167 Figure 4.54. Measured Transfer Lengths vs. NASP Test Values………………... 167 Figure 4.55. Measured Transfer Lengths vs. LBPT/(dcast*f’
c^0.5)………………. 168 Figure 4.56. Measured Transfer Lengths vs. NASP/(dcast*f’
c^0.5)…...…………. 168 Figure 4.57. LBPT Results vs. NASP Test Results......…………………………. 169 Figure 4.58. Transfer Length vs. Spring Stiffness (½ in. diameter regular)…….. 171 Figure 4.59. Transfer Length vs. Spring Stiffness (½ in. diameter super)………. 172 Figure 4.60. Transfer Length vs. Spring Stiffness (TSB-Pour 1)………………...173 Figure 4.61. Transfer Length vs. Spring Stiffness (TSB-Pour 2)………………...174 Figure 4.62. Transfer Length vs. Spring Stiffness (TSB-Pour 3)………………...174 Figure 4.63. Transfer Length vs. Spring Stiffness (TSB-Pour 4)………………...175 Figure 4.64. Selection of Spring Stiffnesses…………………………………….. 176 Figure 4.65. Normal Horizontal Stress Contours for TSB-Pour 4 Large Block… 176 Figure 4.66. Moment versus Deflection and End-slip (Flexural Failure)……….. 179 Figure 4.67. Moment versus Deflection and End-slip (Hybrid Failure)………… 179 Figure 4.68. Moment versus Deflection and End-slip (Bond Failure)…………... 180 Figure 4.69. Le – Lt versus Effective Prestress…………………………………... 183 Figure 4.70. Le – Lt versus (fps – fse)....................................................................... 184 Figure 4.71. Le – Lt versus Concrete Strength…………………………………... 185 Figure 4.72. Embedment Length versus bcast……………………………………..187 Figure 4.73. Le – Lt versus bcast………………………………………………... 187 Figure 4.74. Embedment Length versus dcast……………………………………..188 Figure 4.75. Le – Lt versus dcast………………………………………………….. 188 Figure 4.76a. Embedment Length versus ACI (Eq. 2-2)…………………………. 192 Figure 4.76b. (Le –Lt) versus ACI (Eq. 2-2)……………………………………… 192

xi
Figure 4.77a. Embedment Length versus Zia and Mostafa (Eq. 2-33)…………… 193 Figure 4.77b. (Le –Lt) versus Zia and Mostafa (Eq. 2-33)………………..………. 193 Figure 4.78a. Embedment Length versus Cousins et al. (Eq. 2-34)………….…… 194 Figure 4.78b. (Le –Lt) versus Cousins et al. (Eq. 2-34)……………...…………… 194 Figure 4.79a. Embedment Length versus Mitchell et al. (Eq. 2-36)……………… 195 Figure 4.79b. (Le –Lt) versus Mitchell et al. (Eq. 2-36)…………………………... 195 Figure 4.80a. Embedment Length versus Deatherage et al. (Eq. 2-37)…………... 196 Figure 4.80b. (Le –Lt) versus Deatherage et al. (Eq. 2-37)………………...……... 196 Figure 4.81a. Embedment Length versus Buckner (Eq. 2-38)…………….……… 197 Figure 4.81b. (Le –Lt) versus Buckner (Eq. 2-38)………………………………… 197 Figure 4.82a. Embedment Length versus Lane (Eq. 2-39)……………………….. 198 Figure 4.82b. (Le –Lt) versus Lane (Eq. 2-39)……………...…………………….. 198 Figure 4.83a. Embedment Length versus Kose and Burkett (2-40)………….…… 199 Figure 4.83b. (Le –Lt) versus Kose and Burkett (2-40)…………………………… 199 Figure 4.84a. Embedment Length versus NCHRP (Eq. 2-41)……………………. 200 Figure 4.84b. (Le –Lt) versus NCHRP (Eq. 2-41)……………...…………………. 200

xii
LIST OF TABLES
Table 2.1. Historical Transfer Length Equations……………………………… 26 Table 2.2. Historical Transfer Length Equations (End-slip)…………………... 27 Table 2.3. Historical Development Length Equations……………………….... 38 Table 2.4. Summary of LBPT Results……………………………………….... 50 Table 2.5. Summary of NASP Test Results…………………………………... 51 Table 2.6. Summary of Material Testing Results............................................... 56 Table 2.7. Constants for Stress-Strain Power Formulas………………………. 56 Table 3.1. Test Specimen Breakdown………………………………………… 61 Table 3.2. T-beam Section Properties…………………………………………. 63 Table 3.3. Amount of Concrete Cast Above and Below Strands ……………... 69 Table 3.4. Concrete Mix Proportions………………………………………….. 83 Table 3.5. Actual Concrete Mix Proportions………………………………….. 84 Table 3.6. T-beam Concrete Properties……………………………………….. 84 Table 3.7. Specified Concrete Mix Proportions………………………………. 86 Table 3.8. Actual Concrete Mix Proportions………………………………….. 86 Table 3.9. Top-strand Block Concrete Properties……………………………... 87 Table 4.1. Influence of Release Method (T-beam Test Specimens)…………...109 Table 4.2. Influence of Release Method (Top-strand Block Test Specimens)...112 Table 4.3. Influence of Strand Strength……………………………………….. 115 Table 4.4. Influence of Strand Diameter and Strand Area…………………….. 119 Table 4.5. Influence of Concrete Strength…………………………………….. 124 Table 4.6. Influence of Time (T-beams)………………………………………. 126 Table 4.7. Influence of Time (Top-strand Blocks)……………………………. 128 Table 4.8. Influence of Casting Orientation…………………………………… 129 Table 4.9. As-cast Vertical Location Correlations…………………………….. 137 Table 4.10. Historical Transfer Length Equations ……………………………... 140 Table 4.11. Historical Transfer Length Equations (End-slip)………………….. 157 Table 4.12. Transfer Lengths from End-slip Measurements (T-beams)……….. 158 Table 4.13. Transfer Lengths from End-slip Measurements (TSB-Pour 1)…….. 158 Table 4.14. Transfer Lengths from End-slip Measurements (TSB-Pour 2)…….. 158 Table 4.15. Transfer Lengths from End-slip Measurements (TSB-Pour 3)…….. 159 Table 4.16. Transfer Lengths from End-slip Measurements (TSB-Pour 4)…….. 159 Table 4.17. Experimentally Determined Bond Stresses………………………... 166 Table 4.18. Summary of Results for Strand Grade and Size………………….... 181 Table 4.19. Historical Development Length Equations………………………… 191 Table 4.20. Summary of Flexural Tests Compared to AASHTO……………… 202 Table 4.21. Summary of Calculated Flexural Strength for Casting Orientation... 202 Table 4.22. Summary of Calculated Curvature Comparison………………..….. 202

1
1.0 INTRODUCTION
1.1 Background
The nation’s transportation infrastructure is a system comprised of roads and
highways that interlock the eastern states to the western states, the northern states to the
southern states, and those in between. The interstate system, initiated by former
President Dwight D. Eisenhower in the mid 1950’s and first created for military
transport, has evolved into the primary arteries for the transportation of goods and people
within the United States, proving to be a vital part of the country’s continued success.
Although the interstate highways provide the primary routes for transportation, a vast
number of tributary routes consisting of state highways and local roads are also essential
to the country. With an assortment of intricate routes weaving from one city to the next
and an ever growing population and number of vehicles also comes the daunting task of
maintenance and expansion, resulting in required revenues far surpassing anything one
could have imagined 60 years ago.
The age of the overall system has far surpassed 50 years, with bridges beginning
to deteriorate and the traffic volumes outgrowing the current routes. As a result, the
nation’s transportation infrastructure has turned into an ongoing process of demolition
and reconstruction to ensure a continued efficient operation. No longer are two lanes in
each direction adequate to support the volume of vehicles in specific areas of the country.
Highways through major metropolitan areas require as many as 10 and 12 lanes in each
direction, while highways through rural areas may even require three lanes in each
direction. The expenses associated with such levels of maintenance and expansion have
called for the use of more efficient materials in an effort to reduce costs. More durable
asphalts and concretes have been created for road surfaces and more efficient designs
have been implemented for bridges. Longer bridge spans have required engineers to be
more innovative with their designs using steel plate girders, high-strength prestressed
concrete girders, post-tensioned segmental sections, cable-stayed systems, and
suspension bridges.
The use of prestressed concrete girders has become a common theme in bridge
construction; however, span lengths have been limited by concrete compressive strengths
and the maximum number of strands that can be placed in a section. In the past, high

2
concrete strengths have typically ranged between 6,000 psi and 8,000 psi, but recent
advancements have resulted in concrete strengths well in excess of 10,000 psi. With
higher concrete compressive strengths come increased allowable compressive and tensile
stresses at transfer and service loads, as well as a small increase in flexural strength.
Higher concrete compressive strengths also provide an opportunity for an increased
resultant tensile force, however, the prestressing strands traditionally used are also
limited by their cross-sectional areas and ultimate tensile strength. Historically, ½ in.
diameter (0.153 in.2) and ½ in. diameter super (0.167 in.2) strands with an ultimate tensile
strength of 270 ksi (Grade 270) have been used. In order to develop higher resultant
tensile forces, a 0.6 in. diameter (0.217 in.2) strand has been used in some cases, but has
also been limited by the ultimate tensile strength of 270 ksi. As with concrete
compressive strengths, recent developments have resulted in a higher strength strand with
an ultimate tensile strength of 300 ksi (Grade 300 strand).
The Grade 300 prestressing strand was expected to provide an 11 percent increase
in the available prestress force per strand, which in turn would provide two primary
benefits. The first benefit of an increase in available prestress force would be a reduction
in the number of strands needed in a member to provide the design prestress force of a
beam originally containing Grade 270 strands. Such a reduction would result in a lower
center of gravity of the strands, thus increasing the moment arm and flexural capacity of
the member. The second benefit of an increase in available prestress force per strand
would be an increased resultant tensile force using the same number of strands in a beam
originally designed with Grade 270 strands, thus increasing the magnitude of the internal
couple, and in turn increasing the flexural capacity. With an increase in flexural
capacities also come economic benefits. An increased flexural capacity could allow for
longer span lengths with the same number of girders in a bridge design compared to
girders originally containing Grade 270 strands. On the other hand, an increased flexural
capacity could also allow for a reduction in the number of girders transversely spaced in a
bridge design originally designed for a specific span with girders containing Grade 270
strands. In either case, the use of girders containing Grade 300 strands could have a
substantial economic impact on the bridge industry significantly reducing the costs
associated with materials and the fabrication and construction processes.

3
1.2 Purpose Statement
The purpose of this investigation was to compare the effects an increase in strand
strength had on transfer length, development length, and flexural strength in
pretensioned, prestressed concrete girders to the traditional Grade 270 strand and current
code equations. The current code provisions by the American Association of State
Highway and Transportation Officials (AASHTO) and the American Concrete Institute
(ACI) are based on years of experimental research on the traditional Grade 270 strand.
The primary question that arose in this investigation was the possible effects an increase
in strand strength might have on the existing provisions and if those provisions would
still be adequate. In addition to the Grade 300 strand, the purpose of this investigation
was also to consider the effect the as-cast vertical location of the strands (top-strand
effect) had on transfer length, development length, and flexural strength and the
importance of its recognition in the current codes for prestressed concrete.
1.3 Objectives
In an effort to fully determine the effects of the Grade 300 strand and the as-cast
vertical location on transfer length, development length, and flexural strength, two types
of test specimens were fabricated, each with varied objectives. The first type of test
specimens were 24 ft long T-shaped, pretensioned, prestressed concrete girders and the
second type of test specimens were groups of various sized 12 ft long, pretensioned,
prestressed rectangular concrete blocks, referred to as the top-strand blocks. The T-beam
test specimens had six objectives focused on their fabrication compared to the Grade 270
strand and current code provisions which were:
1. The effect the use of Grade 300 strand had on transfer length
2. The effect the use of Grade 300 strand had on development length
3. The effect the use of Grade 300 strand had on flexural strength
4. The effect a top-cast strand had on transfer length
5. The effect a top-cast strand had on development length
6. The effect a top-cast strand had on flexural strength
Contrary to the T-beam test specimens, the top-strand blocks had one primary
objective. For over 50 years ACI and AASHTO have defined the top-bar effect in
reinforced concrete to be dependent upon the amount of concrete cast beneath a bar

4
however, recent research has suggested otherwise. At the current time, neither ACI nor
AASHTO include the top-bar effect in prestressed concrete, though it was assumed to
have the same effect at the onset of this research. As a result of recent research, the
primary objective of the top-strand blocks was to determine whether the top-strand effect
was a factor of the amount of concrete cast below the strand or the amount of concrete
cast above the strand.
The following sections of this report include background information for each of
the aforementioned objectives, as well as a detailed description of research methodology.
A discussion of the results is also provided followed by the conclusions and
recommendations drawn from the study. Substantiation of current code provisions for
use with the Grade 300 strand and effect of the as-cast vertical location of the strand are
discussed as well as the recommended modifications as a result of the findings associated
with this investigation.

5
2.0 BACKGROUND AND LITERATURE REVIEW
2.1 Introduction
Concrete is a material that has been used for countless construction projects
throughout history. It is unique, in that concrete is placed in a plastic state, which allows
it to be formed and molded into nearly any desirable shape. It was first invented by the
Romans who mixed crushed stone with mortar to create small concrete panels. As this
technology advanced, the Romans were able to use the material for the construction of
larger, more ambitious projects such as the Pantheon. Concrete itself is a composite
material, made up of various components, when mixed together cause a chemical
reaction, resulting in a solidification of the mixture. With the application of load,
concrete exhibits very different behavior with respect to the type of loading. Under a
compressive load, concrete tends to have what is considered high strengths, typically
ranging from 3,000 psi to 8,000 psi, while newer innovations have resulted in concrete
compressive strengths in excess of 16,000 psi. On the other hand, when under tensile
loads, concrete behaves very poorly, with tensile strengths generally in the range of 10
percent the respective compressive strength.
For members consistently loaded in compression, concrete can be a very efficient
material due to its relatively high compressive strengths. However, when used in the
construction of flexural members, members subject to bending stresses, the performance
of concrete is limited by its low tensile strength. In order to compensate for the lack of
tensile strength of the concrete, various types of steel reinforcing are placed in the areas
expected to experience tensile stresses. This combination of concrete and steel is referred
to as reinforced concrete, which takes advantage of both the high compressive strength of
the concrete and the high tensile strength of the reinforcing steel creating an efficient
composite material, dating back to the nineteenth century. Since its creation by Joseph
Monier, reinforced concrete has seen much advancement in the use of reinforcement,
from the simple iron cages used in Monier’s early endeavors with flower pots, to the
standard reinforcing bars (rebar) used today. Rebar has also evolved over time as
continual research has led to the creation of more efficient deformation patterns as well as
higher strengths, most commonly 60 ksi.

6
Reinforced concrete resists externally applied moments by an internal couple
created from the resultant compressive force in the concrete and the resultant tensile force
in the steel as shown in Figure 2.1. In order to develop tensile forces in the steel, the
internal tensile stresses produced from bending must be transferred from the concrete to
the steel, which occurs through the chemical and mechanical bond between the steel
reinforcement and surrounding concrete. The chemical bond is the adhesion of the
concrete to the steel, which contributes only a small portion of the overall bond, while the
mechanical bond is the primary contributor, resulting from the shear interlock between
the concrete and deformations along the reinforcing steel. Without the bond between the
two materials, reinforced concrete would not be feasible.
As
fs ≤ fy
b
c
f’c
As
fs ≤ fy
b
c
f’c
Figure 2.1. Internal Forces of a Reinforced Concrete Beam
The ability for reinforcing steel to adequately bond to the surrounding concrete is
dependent upon a number of variables, the first of which being a sufficient embedment
length. If the reinforcing steel is not embedded in the concrete for a long enough
distance, under load, the bond stresses will exceed the bond strength of the concrete and

7
the reinforcing bar will simply pull through. ACI (2008) terms the minimum length
required to fully develop a reinforcing bar as the development length and provides an
empirical formula for its calculation shown as Equation (2-1).
( )'
340 b tr
b
y t e sd bc K
dc
fL d
fψ ψ ψ
λ +
⎛ ⎞⎜ ⎟=⎜ ⎟⎝ ⎠
Eq. (2-1)
In Equation (2-1), factors take into consideration the yield strength of the bar (fy),
the as-cast vertical location (ψt), coating (ψe), bar size (ψs), bar diameter (db), the effect
of using lightweight concrete (λ), the strength of the concrete (f’c), and the amount of
cover and confining reinforcement. The term (cb + Ktr)/db accounts for the effects of
cover and confinement, but the quantity is usually taken as 1.5 and in some cases 1.0 for
conservatism. Since the adoption of the reinforcement location factor in the 1951 ACI
Building Code, development lengths have been increased by a factor when bars are cast
with more than 12 in. of fresh concrete beneath them, which was reduced from 1.4 to 1.3
in the 1989 Code (Wan et al. 2002a). In addition to location, development lengths are
also increased by a factor to reflect the negative effect epoxy coating has on the bond
between the reinforcement and surrounding concrete. Lightweight concrete also has a
significant effect on development lengths, as well as the diameter of the bar. The use of
lightweight concrete and larger diameter bars both result in longer development lengths.
There is however, an additional factor (ψs), that accounts for the use of No. 6 bars and
smaller, which have been shown to exhibit better bond characteristics, resulting in a
decrease in development length (ACI 2008).
Reinforced concrete is an efficient use of the positive characteristics of both
concrete and steel. There is, however, a more efficient use of both materials, which is
becoming a more and more popular building material, prestressed concrete. With
reinforced concrete, only a percentage of the material within the cross-section is utilized.
Conventional analysis of reinforced concrete anticipates cracking of the cross-section. As
a result of a cracked cross-section, increased deflections occur due to a decrease in
stiffness. Prestressed concrete is similar to reinforced concrete, as it too relies on the
tensile strength of the reinforcing steel to produce one component of the internal couple
resisting externally applied loads; however, the concrete is precompressed prior to the

8
application of load thus reducing the amount of cracking under service loads. This
precompression is made possible by use of high strength steel reinforcement, most
notably, prestressing strands, which typically have ultimate tensile strengths of 270 ksi
with recent developments resulting in strengths as high as 300 ksi.
Two types of prestressed concrete exist, pretensioned and post-tensioned.
Pretensioned concrete, the focus of this research, relies on the bond of the prestressing
strands to the surrounding concrete much like the bond between the rebar and
surrounding concrete of reinforced concrete. Prior to casting structural members,
prestressing strands are pulled in tension between two bulkheads until a target stress is
reached in each strand, typically 75 percent of the strand’s ultimate tensile strength.
Following the stressing of the strands, the concrete is placed in the formwork around the
strands and left to cure for a period of time allowing the concrete to reach an adequate
strength for release. Upon sufficient strength gain, the prestressing strand is released and
the force in the strands is transferred to the member through the bond between the
prestressing strand and the surrounding concrete. In the case of flexural members, the
prestressing strands are placed such that the induced force generally counteracts the
expected moment, causing a precompression in the areas of the cross-section expected to
experience tension, resulting in a very efficient use of the concrete.
Post-tensioned concrete is similar to pretensioned, as it too is precompressed,
although the precompression of the concrete is induced after the structural member has
already been cast. This precompression is applied by placing prestressing strands, also
referred to as tendons, through ducts placed within the formwork prior to casting. Each
strand is anchored at one end by an anchorage and pulled in tension to a specified stress
on the opposite end. Subsequent to stressing the strands, the strands are anchored on the
end at which stressing occurred, relying on the end anchorage to transfer the stress in the
strand to the concrete.
As with reinforced concrete, pretensioned, prestressed concrete is also heavily
dependent on the bond between the reinforcing steel and surrounding concrete in order to
transfer the prestress forces and later the tensile stresses produced from external loadings.
The chemical bond is again produced by the adhesion of the concrete to the steel, but is
lost within the transfer zone during the transfer process, which is discussed with more

9
detail in Section 2.2 (Hanson and Kaar 1959). In addition to the mechanical bond,
friction also plays a vital role in the development of tensile stresses in the prestressing
strand due to external loadings.
Similar to reinforced concrete, the ability for prestressing steel to adequately bond
to the surrounding concrete is dependent upon a number of variables, some of which are
not taken into account by current building codes. Prestressing strand also must be
embedded over an adequate length in order to develop its full tensile strength. If not,
under load, the bond stresses will exceed the bond strength of the concrete and the
prestressing strand will simply pull through. This type of failure is referred to as a bond
failure, and is extremely undesirable in reinforced and prestressed concrete. The current
ACI Building Code (2008) and AASHTO LRFD Specification (2006) provide an
empirical formula for the calculation of the development length of prestressing strand
shown as Equation (2-2) with units of psi.
3000 1000
ps sesed b b
f ffL d d−⎛ ⎞⎛ ⎞= + ⎜ ⎟⎜ ⎟
⎝ ⎠ ⎝ ⎠ Eq. (2-2)
Equation (2-2) takes into consideration the effective prestress (fse), the stress in
the strand at the nominal moment capacity (fps), and the diameter of the strand (db) and is
broken up into two parts. The first term represents the transfer length and the second
term represents the flexural bond length, each of which is defined and discussed with
more detail in Sections 2.2 and 2.3, respectively. A number of researchers have shown
the transfer and development lengths of prestressing strand to be dependent on a number
of variables not included in Equation (2-2). Unlike the development length equation for
standard reinforcing steel, Equation (2-2) neglects the effect of cover and confinement,
the as-cast vertical location of the strand, the strength of the concrete, coating of the
strand (i.e. rust or epoxy), and the effect of using lightweight concrete. In addition to the
factors taken into consideration by Equation (2-1), the type of prestress release has also
been shown to influence transfer and development lengths, as well as the fluidity of the
concrete mixture, and possibly the water to cement ratio.
Equation (2-2) was adopted in the 1963 ACI Building Code and in the 1973
AASHTO Specification and is based on research conducted in the 1950’s and 1960’s by
Hanson and Kaar and Kaar, Lafraugh, and Mass, and was later derived by Alan H.

10
Mattock (Tabatabai and Dickson 1993). The research by Hanson and Kaar was
conducted on 250 ksi stress-relieved strand, with an initial prestress of 150 ksi, and a
gradual method of release used in the transfer process. Over the past 50 years, the
development length equation has remained for the most part constant, although numerous
advancements have been made in the prestressed concrete industry. The type of
prestressing strand has since evolved from the 250 ksi stress-relieved strand, to a more
favorable 270 ksi low-relaxation strand, which has been the industry standard for more
than 20 years and recent advancements have led to the development of a 300 ksi strand.
In addition to the type of prestressing steel, concrete has also shown a steady progression
to higher strengths and better quality. While materials have improved, a sudden release
of prestress release has also become the standard method used by most prestressed
concrete manufacturers. All of these changes over time contradict the parameters used in
the derivation of the current code provisions.
In the following sections, detail is given to various topics associated with the
research presented in this report. Sections 2.2 and 2.3 discuss the development and
historical research contributions associated with transfer and development lengths, while
Sections 2.4 and 2.5 discuss the bond characteristics of prestressed concrete and the
factors affecting such. Section 2.6 focuses on the phenomenon known as the top-bar
effect and its applicability to prestressed concrete. As previously discussed, adequate
bond between the prestressing steel and the surrounding concrete is an essential part of
prestressed concrete ensuring satisfactory performance, and is influenced by a number of
factors not taken into consideration by current building codes. Attention is also given to
the determination of the ultimate capacity of flexural members. As the primary objective
of this report is the use of Grade 300 prestressing strand in flexural members, Section 2.7
reviews the previous use of the Grade 300 strand and its behavior, while Section 2.8
discusses the various methods used to calculate ultimate flexural capacities.
2.2 Transfer Length
2.2.1 Introduction
Pretensioned, prestressed concrete members rely on a precompression applied via
internal bonded strands, which are tensioned prior to casting. Following the curing
process, the force in the strand is released, typically accomplished by flame cutting the
11
strand and sometimes by gradual release using a hydraulic mechanism. The standard
practice used by most prestressed manufacturers is the use of an acetylene torch to flame
cut the strands. It should be noted that the strands are not actually cut, but heated to a
point at which the strand yields in tension (Russell and Burns 1997). In either case, the
force in the strand is transferred from the prestressing strand to the surrounding concrete
via the chemical and mechanical bond between the two materials. Unlike nonprestressed
reinforcement, the chemical bond has no effect within the transfer zone. The adhesion is
lost with the violence associated with the transfer process, due to the tendency of the
strand to slip into the member (Janney 1954). Leaving only the mechanical bond as the
primary bond mechanism, the ability to transfer the prestress force from the prestressing
strand to the surrounding concrete is achieved through the mechanical interlock of the
strand within the concrete and the additional friction produced between the two materials
from the expansion of the strand following the transfer process.
When a prestressing strand is tensioned, the strand elongates parallel to the
direction of the applied load, causing a reduction in the cross-sectional area from the
Poisson Effect. The concrete is then placed in the formwork with the strand fully
tensioned, hardening around the strand with the reduced cross-sectional area. During the
transfer process, when the strand is released, the strand tries to return to its original length
and back to its original cross-sectional area. As the strand tries to pull through the
concrete, the chemical bond, or adhesion, between the prestressing strand and
surrounding concrete is broken. At the same time, the strand tries to expand, causing
circumferential stresses along the length of the strand, commonly known as the Hoyer
Effect (Janney 1954). Coupled with the mechanical interlock provided by the helical
shape of the 7-wire strand, the friction forces produced from the Hoyer Effect add to the
resistance of the strand to pull through the concrete, thus creating the bond between the
strand and surrounding concrete. The distance required to obtain full bond of the
prestressing strand to the surrounding concrete is the transfer length, formally defined by
ACI as the distance over which the strand should be bonded to the concrete to develop
the effective prestress in the prestressing steel, fse (ACI 2008). The transfer length is
assumed to vary linearly from zero bond at the end of the member to full bond, full
transfer of the effective prestress, at the transfer length, where the strand ceases to slip

12
and the chemical component again contributes to the total bond between the two
materials. However, the transfer length can be broken into a plastic and elastic zone, with
a linear variation in strand stress and constant bond stress within the plastic zone and a
parabolic variation in stress and descending bond stress within the elastic zone as shown
in Figure 2.2.
x
fse
Strand Stress
Distance from Member End (L)
Stre
ss
Ut
Bond Stress
B = Slope
x
fse
Strand Stress
Distance from Member End (L)
Stre
ss
Ut
Bond Stress
B = Slope
Figure 2.2. Stress behavior (Cousins et al. 1990b)
2.2.2 (Prior to 1990)
Criteria exist for transfer length calculations in both ACI and AASHTO with only
slight variations between the two. As previously mentioned, the development length
equation for prestressing strands is made up of two components, with the first term
representing the transfer length and the second term representing the flexural bond
length. The expression for transfer length in both ACI and AASHTO is shown as
Equation (2-3) with fse in units of ksi. Equation (2-3) is based on research performed in
the late 1950’s and early 1960’s using 250 ksi stress-relieved strand coupled with a
method of gradual release (Hanson and Kaar 1959).
3se
t bfL d⎛ ⎞= ⎜ ⎟
⎝ ⎠ Eq. (2-3)
Within the shear provisions of both codes, a value of 150 ksi is assumed for the
effective prestress, fse, after all losses, reducing Equation (2-3) to 50db (Equation 2-4).
This assumption provides designers with a simplified method for obtaining the force in

13
the strand at any distance within the transfer zone and has generally been considered a
conservative assumption. AASHTO increased this value by twenty percent to 60db,
accounting for higher jacking stresses typically used in industry as recommended by
Buckner (1995).
Over the past 55 years, transfer length research has been an ongoing process with
new equations proposed time and time again to no avail, with no significant changes
being made to the code provisions. Some researchers claim transfer length to only be
dependent on the effective stress in the strand and the diameter of the strand, while others
say transfer lengths are dependent on a number of variables in addition to the two.
Section 2.4 discusses, in detail, those variables shown to affect the bond between
prestressing strand and surrounding concrete, while located at the end of Section 2.1,
Table 2.1 and Table 2.2 list the proposed equations for transfer length and the
contributing party associated with each from the past five decades.
Prior to 1960, the behavior of the bond between prestressing steel and concrete
was not well understood. In an investigation published in 1954, Janney concluded that
the stress along a concrete prism was directly proportional to the tensile stresses in the
pretensioned wire, even though strain compatibility failed to exist in the end region
(transfer zone) as a result of slip. Janney also concluded that the length of embedment
necessary for the transfer of prestress increased with wire diameter (Janney 1954).
In response to questions associated with transfer and development length,
significant studies were conducted in the late 1950’s and early 1960’s, leading to the
development of the current ACI and AASHTO transfer and development length
equations, the most significant by Hanson and Karr and Kaar et al. Hanson and Kaar
investigated the bond characteristics in pretensioned, prestressed concrete beams
containing 250 ksi stress-relieved strands, the industry standard at the time. The average
bond stress for test specimens was found to be 400 psi, based on average transfer length
measurements for ¼ in., ⅜ in., and ½ in. diameter strands pretensioned to 150 ksi. A
gradual method of release was used in the transfer process and the test specimens
contained concrete with a slump of 2 in. and a 1 ½ in. maximum size aggregate. Based
on a 400 psi average bond stress, an equation could be derived calculating the transfer

14
length for 250 ksi stress relieved strand, shown as Equation (2-5) (Hanson and Kaar
1959).
2.94
set b
fL d⎛ ⎞= ⎜ ⎟⎝ ⎠
Eq. (2-5)
In addition to the work on bond, Kaar et al. looked at the influence of concrete
strength on transfer length. Again, 250 ksi stress-relieved strand was used for the
investigation. The strands were flame cut; however, a period of preheating was
conducted prior to transfer, gradually relieving a portion of the force in the strand.
Variability did exist between cut and dead end transfer lengths, but the study showed no
significant change in transfer lengths of strands up to ½ in. diameter for concrete
strengths up to 5,000 psi (Kaar et al. 1963). Concurrent to the study by Kaar et al., a
newer, high strength (270 ksi) strand was used in a transfer length study, which
concluded, regardless of a 26 percent higher jacking stress, there was no significant
increase in transfer length compared to conventional (250 ksi) strands (Janney 1963).
Based on the studies of Hanson and Kaar and Kaar et al., the transfer length was shown
to only be affected by the stress in the strand and the diameter of the strand, neglecting
any effect concrete strength might have. As previously discussed, Alan Mattock of the
Portland Cement Association (PCA) aided in the development and implementation of
Equation (2-5) into the 1963 ACI Building Code, which was simplified into Equation (2-
3) by what is now Committee 423 (Tabatabai and Dickson 1993).
Subsequent to the research basis for the ACI provisions, a number of factors were
found to influence transfer lengths, and the original provisions were found to be
unconservative with transfer lengths estimated to be 80 strand diameters (80db) (Equation
2-6) by Martin and Scott (1976). Zia and Mostafa further investigated transfer length
also listing numerous factors influencing actual values, the majority of which are not
included by the ACI provisions. With development length as the primary objective in the
study, Zia and Mostafa focused on both components, deriving new expressions for the
transfer and flexural bond lengths, with attention given to the type of release used for
prestress transfer. Equations for transfer lengths were derived from linear regression for
both release methods (sudden and gradual), selecting the equation for data having a
sudden release as the final proposed equation, shown as Equation (2-7), which takes into

15
account the stress in the strand, strand diameter, and strength of the concrete at the time
of release (Zia and Mostafa 1977). Selecting the equation for data having a sudden
release ensured a conservative estimate for transfer lengths.
'1.5 4.6sit b
ci
fL df
= − Eq. (2-7)
2.2.3 (1990 – 1999)
As prestressing strand advancements continued, concerns were raised about the
amount of corrosion present in prestressed bridge girders, creating a high level of interest
in epoxy-coated strand. Referring back to the development length equation for standard
reinforcing bars, development lengths are known to increase for epoxy-coated rebar, thus
questions arose regarding the effect epoxy coating may have on the bond of prestressing
strand. In response to the concerns, a research project at North Carolina State University
focused on the bond behavior of epoxy-coated prestressing strand, also using uncoated
strands in control specimens.
Cousins et al. found transfer lengths for epoxy-coated strand to be less than
transfer lengths for uncoated strand. Results showed transfer lengths for epoxy-coated
strands, also heavily dependent on impregnated grit density, to be fairly well represented
by the ACI/AASHTO equation (Equation 2-3) and Equation (2-7) proposed by Zia and
Mostafa. On the other hand, the same equations were unconservative for uncoated
strand. In response to the longer transfer lengths for uncoated strands, Cousins et al.
proposed Equation (2-8), with recommended values of 6.7 and 300 psi/in. for U’t and B,
respectively for uncoated strands (Cousins et al. 1990b).
' '
' '0.5 se pst ci
t
b t ci
f AU fL
B d U fπ
⎛ ⎞⎜ ⎟= +⎜ ⎟⎝ ⎠
Eq. (2-8)
The strands used by Cousins et al. were seven-wire, 270 ksi low-relaxation
strands, stressed to approximately 80 percent of their ultimate tensile strength, about five
percent higher than is typically used in industry today. The compressive strength of the
concrete used was slightly higher than 4,000 psi for all test specimens. For the majority
of the test specimens, a sudden release of prestress was used resulting in longer transfer
lengths at the cut ends of test specimens (Cousins et al. 1990c). In all likelihood, the

16
combination of higher initial prestress values coupled with relatively low concrete
strengths and a sudden release, would result in a worst case scenario with respect to those
parameters.
In response to the work of Cousins et al., the Federal Highway Administration
(FHWA) issued a memorandum in 1988 with various restrictions on the use of
prestressing steel, one of which included the ban of 0.6 in. diameter strand for use in
pretensioned, prestressed concrete girders, due to excessive transfer and development
lengths (FHWA 1988). Additional restrictions were included in the memorandum,
discussed further in Section 2.3 in relation to development length. Subsequent to the
investigations performed in the late 1950’s and early 1960’s, few investigations were
conducted related to transfer and development length between 1965 and 1985. In
response to the 1988 FHWA Memorandum, the interest level of prestressed concrete
related research shifted its focus to the bond characteristics between prestressing steel and
concrete, resulting in a number of investigations looking at all aspects of transfer and
development lengths.
In the early 1990’s, a substantial amount of research was conducted on the
transfer and development length of prestressing strand. Cousins continued work on the
bond characteristics of prestressing strand, developing a simplified test representing the
typical behavior between prestressing steel and concrete during the transfer process and
the effect of varying strand spacing and cover. Cousins et al. looked at ½ in. diameter
270 ksi, low-relaxation prestressing strand, with varying surface conditions (clean, lightly
rusted, and epoxy-coated) with results showing coated strand to have shorter transfer
lengths and higher bond stresses, which sometimes have been shown to result in splitting
of the concrete (Cousins et al. 1992). In the latter study, the influence of cover and
spacing on transfer lengths of epoxy-coated, 270 ksi low-relaxation prestressing strand
was also investigated. Transfer lengths of epoxy-coated strands were, again, found to be
shorter than the ACI/AASHTO calculated values. This was attributed to the better bond
with increased level of impregnated grit densities. Spacings less than those
recommended by ACI/AASHTO resulted in significant cracking of the test specimens,
resulting in considerably longer transfer lengths (Cousins et al. 1993). Additional

17
research was completed on the influence of reduced spacing of uncoated strands, but
showed no significant impact on transfer length values (Cousins et al. 1994).
Concurrent to the work by Cousins et al., a number of studies were also in
progress, including work by the Florida Department of Transportation (FDOT) and
McGill University in Montreal, Quebec. The FDOT investigation focused on transfer
lengths in full scale AASHTO girders, which is revisited by Deatherage et al. in a later
study. FDOT researchers investigated the transfer lengths of AASHTO Type II girders
containing ½ in. and 0.6 in. diameter strands with center-to-center spacings of 2 in. Some
test specimens contained debonded strands, which is beyond the scope of this project.
The authors found transfer lengths for both ½ in. and 0.6 in. diameter strands to exceed
values specified by ACI and AASHTO, Equation (2-3). Strand spacing showed no
significant effect on the results. However, based on the test results, it was recommended
that the initial prestress, fsi, be substituted for the effective prestress, fse, in Equation (2-3),
which better estimated the experimental values (Shahawy et al. 1992). Similar results
were found by Deatherage et al., with the same modifications presented for Equation (2-
3), shown by Equation (2-9). Deatherage et al. did, however, find transfer lengths to be
significantly shorter for the 0.6 in. diameter strands (Deatherage et al. 1994).
3si
t bfL d⎛ ⎞= ⎜ ⎟
⎝ ⎠ Eq. (2-9)
As previously discussed, the basis for Equation (2-3) was from tests completed on
test specimens with a relatively low concrete strength in comparison with today’s
materials. Mitchell et al. investigated the influence of concrete strength on transfer and
development length, looking at concrete strengths at the time of transfer from 3050 psi to
7250 psi and strand diameters of ⅜ in., ½ in., and 0.62 in. The ⅜ in. diameter strand was
stress-relieved, while the ½ in. and 0.62 in. diameter strand was low-relaxation, and all
strands were released using a gradual method of prestress release, which does fail to
show the effects of sudden release. Based on the test results, Mitchell et al. concluded
that transfer length did decrease with an increase in concrete strength regardless of strand
diameter and proposed Equation (2-10) with fpi being the stress in the strand immediately
following transfer (Mitchell et al. 1993).

18
'
30.33t pi bci
L f df
= Eq. (2-10)
In response to the recommendations of research performed across the United
States and Canada as a result of the 1988 FHWA Memorandum, the FHWA was forced
to conduct an independent review of recent research efforts, clarifying discrepancies.
Buckner noted the current ACI transfer length equation was derived based on a stress-
relieved 250 ksi prestressing strand and a average bond stress of 400 psi and the actual
area of a Grade 250 strand is 0.725*(πdb/4), while the actual area of the newer 270 ksi
low-relaxation prestressing strand is approximately 6 percent larger, 0.7685*(πdb/4).
Based on the equilibrium of forces over the transfer length of a 250 ksi strand, the
following relationship is developed, where 4/3(πdb) is the perimeter of a 7-wire strand
with respect to the nominal diameter.
240.400 0.725
3 4b b
t sed dL fπ π⎛ ⎞⎛ ⎞ = ⎜ ⎟⎜ ⎟
⎝ ⎠ ⎝ ⎠ Eq. (2-11)
Solving Equation (2-11) yields Equation (2-5) for transfer length. As previously stated,
by assuming an effective prestress of 150 ksi, Equation (2-3) reduces to 50db. However,
substituting the area of a 270 ksi strand into Equation (2-11), and again solving for the
transfer length, Lt, yields Equation (2-12). Assuming an effective prestress of 150 ksi
would reduce Equation (2-12) to 54db, which is slightly larger than the previous value of
50db for the 250 ksi strand.
2.78
se bt
f dL = Eq. (2-12)
Based on this comparison, Buckner stated that Equation (2-3) became invalid with
the introduction of the 270 ksi low-relaxation strand, going on to recommend the use of
Equation (2-9) for transfer length calculations, previously recommended by Shahawy et
al. and Deatherage et al. Buckner also recommended that the assumed value for transfer
length in shear design be increased by 20 percent to 60db (Equation 2-13), accounting for
longer transfer lengths of Grade 270 strands.
For the most part, past research has been primarily focused on the use of ½ in.
diameter prestressing strands. Prior studies by Cousins et al., Shahawy et al., Mitchell et

19
al., and Deatherage et al. have included the determination of transfer length for 0.6 in.
diameter prestressing strands in their investigations, but not as the primary objective.
The use of the larger 0.6 in diameter prestressing strand at the typical 2 in. spacing allows
a 40 percent higher level of prestress than a typical ½ in. diameter strand and almost 30
percent higher level of prestress than a ½ in. diameter special strand. From an economic
stand point, higher levels of prestress without an increase in the number of strands is
extremely beneficial to the efficient use of higher strength concretes. With the
moratorium placed on the use of 0.6 in. diameter prestressing strands, due to excessive
transfer length measurements, a high level of attention was given to the ability of the 0.6
in. strand to sufficiently transfer its prestressing forces within a reasonable length
(Russell and Burns 1997).
A study by Russell and Burns focused on the on the ability of the 0.6 in. strand to
transfer its prestressing forces and the influence of flame cutting during the transfer
process on transfer length measurements. Russell and Burns found 0.6 in. diameter
strands to have a significantly longer transfer length and that transfer lengths at the ends
adjacent to the cut end are generally much longer than those at the dead end. They note
the ratio of average transfer lengths for 0.6 in. diameter strands to ½ in. diameter strands
is approximately equal to the ratio of corresponding diameters. Russell and Burns found
average transfer lengths to be 66.6db which, if compared to the recommendation of
Buckner, correspond to transfer lengths calculated by Equation (2-9). Russell and Burns
go on to recommend Equation (2-14) for the calculation of transfer lengths, noting
modification could be made for the influence of concrete strength. Assuming an effective
prestress of 160 ksi, Equation (2-14) reduces to 80db (Equation 2-6), which is
approximately the average plus one standard deviation (Russell and Burns 1997).
Subsequent to the work by Russell and Burns, Lane also proposed Equation (2-15) for the
calculation of transfer lengths (Lane 1998).
2
se bt
f dL = Eq. (2-14)
'
45pt
t bc
fL d
f= − Eq. (2-15)

20
2.2.4 (2000 – 2009)
Contradictory to the findings of Russell and Burns and those from previous
studies, Barnes et al. found little difference in transfer length measurements from cut and
dead ends, except for those containing rusted strands, which significantly increased at the
cut end (Barnes et al. 2003). Also contrary to previous work, Kose and Burkett later
found transfer lengths to decrease with an increase in strand diameter. In addition to
strand diameter, Kose and Burkett also looked at the influence of concrete strength and
effective prestress on transfer lengths, concluding an increase in concrete strength
decreased the transfer length, while an increase in effective prestress increased the
transfer length (Kose and Burkett 2005). With the three contributing factors taken into
consideration, Barnes et al. proposed Equation (2-16) for the calculation of transfer
lengths, while Kose and Burkett proposed Equation (2-17).
'
ptt b
ci
fL d
fα= Eq. (2-16)
( )2
'
195 pi b
t
c
f dL
f
−= Eq. (2-17)
As previously mentioned, numerous factors have been shown to influence transfer
lengths, which are discussed in Section 2.4 with more detail. As research has progressed,
transfer length equations have evolved from the ACI/AASHTO equation including only
effective prestress and strand diameter to containing other factors, most notably concrete
strength. In addition to the three primary contributing factors, one of the most influential
may be the location of the strand within the cross-section. Petrou et al. (2000b) found
top-strands to have significantly longer transfer lengths in prestressed concrete piles
containing traditional concrete, while a recent study by Peterman has shown the vertical
as-cast location to also strongly influence transfer lengths in Self Consolidating Concrete
(SCC). As a result of the study by Peterman, Equation (2-18) was proposed for the
calculation of transfer length, containing only strand diameter and as-cast vertical
location where dcast is the amount of concrete cast above the strand (Peterman 2007).
For dcast < 8” ( )90 90 5t cast bL d d= −
For dcast ≥ 8” 50t bL d= Eq. (2-18)

21
In a recent NCHRP report, researchers found concrete strength to strongly
influence transfer length. As a result of the experimental testing in the NCHRP study, a
simplified transfer length equation was proposed containing only strand diameter and
concrete strength, shown as Equation (2-19). The recommended equation takes into
account concrete strengths up to 6,000 psi. At a concrete strength of 4,000 psi the
equation becomes equal to the current AASHTO recommended value of 60db. As
concrete strength increases, the calculated transfer lengths decrease, but are limited to a
minimum value of 40db, which corresponds to a concrete strength of 9,000 psi (NCHRP
2008).
'
120 40t b b
ci
L d df
= ≥ Eq. (2-19)
2.2.5 End-slip
For the most part, transfer length studies discussed herein have relied on the
measurements of concrete surface strains, but transfer lengths can be determined by
measuring the amount of slip occurring between the end of the strand and the end of the
test specimen. End-slip measurements provide an easy way to obtain data for the
calculation of transfer lengths, requiring less time and effort as opposed to concrete
surface strain measurements. However, end-slip measurements sometimes are not always
as reliable as measurements taken using surface mounted gauge points (Russell and
Burns 1997).
At the onset of prestress release, the strand tries to slip through the concrete, but is
resisted by the mechanical bond produced from the helical shape of the strand and the
increased friction forces produced from the Hoyer Effect. The strand does, however, slip
over the transfer length, until full bond is obtained. Figure 2.3 shows the relationship of
concrete and steel strain with respect to the distance from the end of the member as
discussed by Cousins et al (1990c). It is assumed that the strains have a linear variation
from the end of the member to the end of the transfer length.

22
Lt
εsj
εs(x)
εc(x)
Distance from Member End (x)
Stra
in (i
n./in
.)
εs(max)
εc(max)
Lt
εsj
εs(x)
εc(x)
Distance from Member End (x)
Stra
in (i
n./in
.)
εs(max)
εc(max)
Figure 2.3. Concrete and Steel Strain versus Length (Cousins et al. 1990c)
Assuming a linear distribution of strains, the amount of elastic shortening
occurring from the end of the specimen to the end of the transfer length in the specimen
itself is equal to the area under the εc(x) curve calculated by Equation (2-20), while the
amount the strand shortens is equal to the area under the εs(x) curve calculated by
Equation (2-21). If perfect bond existed between the concrete and steel, the amount the
concrete and the steel shorten would be equal, but because the strand slips along the
transfer length, a discrepancy exists, referred to as end-slip, Les, therefore the end slip is
equal to the difference in δs and δc as shown in Equation (2-22).
( ) (max)
0 2tL c t
c c
Lx dx
εδ ε= =∫ Eq. (2-20)
( ) (max)
0 2tL s t
s s
Lx dx
εδ ε= =∫ Eq. (2-21)
( )(max) (max)(max) (max)2 2 2
s t c t tes s c
L L LLε ε
ε ε= − = − Eq. (2-22)
By substituting the steel stress and the modulus of elasticity of the strand into Equation
(2-22) in place of the steel strain, the transfer length can be solved for as shown in
Equation (2-23) based on the assumption of linear variation for both concrete and steel
strains.
23
2 es ps
tsi ps ci
L EL
f E ε=
− Eq. (2-23)
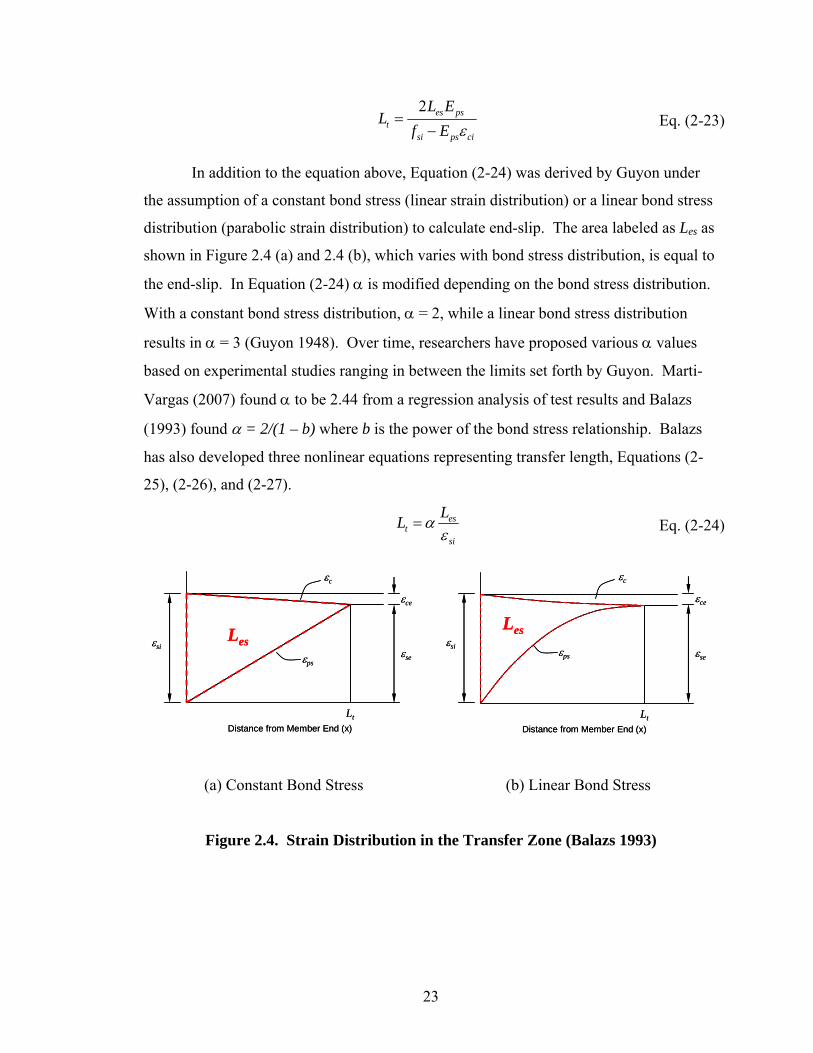
In addition to the equation above, Equation (2-24) was derived by Guyon under
the assumption of a constant bond stress (linear strain distribution) or a linear bond stress
distribution (parabolic strain distribution) to calculate end-slip. The area labeled as Les as
shown in Figure 2.4 (a) and 2.4 (b), which varies with bond stress distribution, is equal to
the end-slip. In Equation (2-24) α is modified depending on the bond stress distribution.
With a constant bond stress distribution, α = 2, while a linear bond stress distribution
results in α = 3 (Guyon 1948). Over time, researchers have proposed various α values
based on experimental studies ranging in between the limits set forth by Guyon. Marti-
Vargas (2007) found α to be 2.44 from a regression analysis of test results and Balazs
(1993) found α = 2/(1 – b) where b is the power of the bond stress relationship. Balazs
has also developed three nonlinear equations representing transfer length, Equations (2-
25), (2-26), and (2-27).
est
si
LL αε
= Eq. (2-24)
Lt
εsi
εps
εc
Distance from Member End (x)
εse
εce
Les
Lt
εsi
εps
εc
Distance from Member End (x)
εse
εce
Les
Lt
Distance from Member End (x)
εsi εps
εc
εse
εce
Les
LtDistance from Member End (x)
εsi εps
εc
εse
εce
Les
(a) Constant Bond Stress (b) Linear Bond Stress
Figure 2.4. Strain Distribution in the Transfer Zone (Balazs 1993)

24
3
4'218 es
t bci
LL d
f= Eq. (2-25)
0.625
' 0.15 0.424.7 est
ci si
LLf ε
= Eq. (2-26)
'0.158 si
t
ci es
fLf L
= Eq. (2-27)
Similar to the derivation of previous equations, Peterman derived Equation (2-28)
by integrating under the strand stress versus transfer length curve and assuming a linear
ascending branch of the curve. However, Peterman does not take into account the effect
of the concrete strain, but the equation correlates very well with other expressions. If the
stress and modulus of elasticity are changed to strain, Equation (2-28) is identical to
Equation (2-24) by Guyon with α = 2, which assumes a constant bond stress. In addition
to the correlation to the equation by Guyon, assumed values of Eps = 29,000 ksi and fsi =
197.4 ksi, Equation (2-28) is close to the expression by Russell and Burns (Equation 2-
29) and Logan (Equation 2-30).
2
293.8es pst es
si
L EL L
f= = Eq. (2-28)
294.9t esL L= Eq. (2-29) 308t esL L= Eq. (2-30) End-slip measurements are somewhat controversial, but can be very beneficial in
the determination of transfer lengths if completed with a great deal of precision. Cousins
et al. (1993) found transfer lengths calculated from end-slip measurements to have a good
correlation to those calculated from concrete surface strains. Marti-Vargas et al. (2007),
on the other hand, noted that a great variability existed with transfer lengths calculated
from end-slip measurements and that, although transfer length calculations are relatively
easy, it can lead to a false perception of variable transfer lengths.

25
2.2.6 Summary
Transfer length is an important aspect of pretensioned, prestressed concrete,
especially with respect to shear design. Over the past five decades research has shown
transfer lengths to be more complex than initially thought. The current ACI/AASHTO
provisions calculate transfer lengths based on the effective prestress, after all losses, and
the strand diameter, assuming a constant bond stress of 400 psi. Numerous researchers
have shown transfer length results exceeding those calculated by current provisions and
have made numerous recommendations from their conclusions. As previously stated,
transfer length is a portion of the development length of prestressing strands. Looking
back at Equation (2-1), numerous factors are included in the development length
calculation for standard reinforcing bars, while the majority of these are neglected for
prestressed concrete. It is evident from the literature that the current ACI/AASHTO
provisions are insufficient for the calculations of transfer length, requiring additional
research and revisions to the current code provisions.

26
Table 2.1. Historical Transfer Length Equations
Contributor Year Equation Eq. No.
Hanson & Kaar 1959 2.94
set b
fL d= 2-5
3se
t bfL d= 2-3
ACI 1963 50t bL d= 2-4
Martin & Scott 1976 80t bL d= 2-6
Zia & Mostafa 1977 '1.5 4.6sit b
ci
fL df
= − 2-7
Cousins et al. 1990 ' '
' '0.5 se pst ci
t
b t ci
f AU fL
B d U fπ
⎛ ⎞⎜ ⎟= +⎜ ⎟⎝ ⎠
2-8
Shahawy et al. 1992 3si
t bfL d= 2-9
Mitchell et al. 1993 '
30.33t pi bci
L f df
= 2-10
Deatherage et al. 1994 3si
t bfL d= 2-9
Buckner 1995 3si
t bfL d= 2-9
AASHTO 1995 60t bL d= 2-13
2se
t bfL d= 2-14
Russell & Burns 1997 80t bL d= 2-6
Lane 1998 '
45pt
t bc
fL d
f= − 2-15
Barnes et al. 2003 '
ptt b
ci
fL d
fα= 2-16
Kose & Burkett 2005 ( )2
'
195 pi b
t
c
f dL
f
−= 2-17
Peterman 2007 For dcast < 8” ( )90 90 5t cast bL d d= −
For dcast ≥ 8” 50t bL d= 2-18
NCHRP 2008 '
120 40t b b
ci
L d df
= ≥ 2-19

27
Table 2.2. Historical Transfer Length Equations (End-Slip)
Contributor Year Equation Eq. No.
Guyon 1948 est
si
LL αε
= 2-24
Cousins et al. 1990 2 es ps
tsi ps ci
L EL
f E ε=
− 2-23
Balasz 1992 3
4'218 es
t bci
LL d
f= 2-25
Balasz 1993 0.625
' 0.15 0.424.7 est
ci si
LLf ε
= 2-26
Balasz 1993 '0.158 si
t
ci es
fLf L
= 2-27
Russell & Burns 1996 294.9t esL L= 2-29 Logan 1997 308t esL L= 2-30
Peterman 2007 2
293.8es pst es
si
L EL L
f= = 2-28

28
2.3 Development Length
2.3.1 Introduction
Pretensioned, prestressed concrete members resist externally applied moments by
an internal couple similar to the behavior of reinforced concrete, where the concrete
ultimately takes the compressive force, while the prestressing strands take the tensile
force. In order to develop that tensile force in the strands, the tensile stresses must be
transferred from the concrete to the strand, which, again, occurs through the chemical and
mechanical bond between the strand and the surrounding concrete. Beyond the transfer
length, slip between the strand and surrounding concrete has not yet occured, therefore,
the chemical bond is still present, but contributes very little to the overall bond.
As previously mentioned, the bond between the strand and the surrounding
concrete is mainly dependent on an adequate embedment length in order to develop the
full tensile strength of the strand. AASHTO defines the development length as the length
required to anchor the strand to fully develop the stress in the strand at the nominal
moment capacity of the member (AASHTO 2006). ACI and AASHTO provisions use
Equation (2-2) for the calculation of the development length, with a 1.6 multiplier in
AASHTO placed on development lengths for pretensioned members with a depth greater
than or equal to 24 in.
3000 1000
ps sesed b b
f ffL d d−⎛ ⎞⎛ ⎞= + ⎜ ⎟⎜ ⎟
⎝ ⎠ ⎝ ⎠ Eq. (2-2)
Equation (2-2) is made of two components, the first term being the transfer
length, discussed in Section 2.2, and the second term being the flexural bond length. The
flexural bond length, Lfb, is the distance required to sufficiently increase the stress in the
strand from the effective prestress to the stress in the strand at the nominal moment
capacity, fps. Figure 2.5 shows an idealized relationship between the steel stress and
distance from the free end of the beam at strength.

29
Ld
( fse /3000)db [( fps - fse )/1000]db
fse
fps
Ld = distance from free end of strand
Steel stress
Prestress only
At nominal strength of member
Ld
( fse /3000)db [( fps - fse )/1000]db
fse
fps
Ld = distance from free end of strand
Steel stress
Prestress only
At nominal strength of member
Figure 2.5. Idealized Bilinear Steel Stress Relationship at Strength (ACI 2008)
Subsequent to the transfer process, the tensile stress in the strand is converted to a
compressive stress in the concrete via the bond between the strand and surrounding
concrete as the strand becomes somewhat wedged in the concrete as a result of the Hoyer
Effect. At this time, the entire cross-section may be subjected to an axial compression,
depending on the cross-section, the amount of prestress, and eccentricity of the strands.
As the member is subjected to externally applied moments, resulting in bending stresses
(compression in the top and tension in the bottom), the compressive stress in the top
portion of the cross-section will increase, while the compressive stress in the bottom
portion of the cross-section will decrease. As the load is increased, the compressive
stress in the bottom of the cross-section produced by the prestress force is overcome by
the tensile stresses produced from bending, approaching the tensile strength of the
concrete, resulting in flexural cracking. Upon overcoming the effective prestress in the
cross-section, the prestressing strands are left to take all the tensile forces. When the
tensile force is increased, the strain in the prestressing strand also increases, causing an
elongation of the strand (Hanson and Kaar 1959). With an elongation of the strand also
comes a slight reduction of the cross-sectional area due to the Poisson Effect. As the
30
cross-sectional area of the strand continues to reduce, the friction produced from the
transfer process decreases, making the mechanical interlock of the strand within the
concrete the primary contributor to bond (Janney 1954) (Cousins et al. 1990b). If the
embedment length is shorter than the required development length, the bond stresses will
exceed the bond strength of the surrounding concrete resulting in a bond failure in the
end region of the beam and the strand being pulled through the concrete. If the
embedment length is longer than the required development length, the strand will be
capable of developing the stress required to reach the nominal moment capacity of the
member.
2.3.2 (Prior to 1990)
ACI states in the commentary that provisions are based on tests of members with
normal weight concrete and that tests may not be representative of low water-
cementitious material ratios. ACI also states that the bond of the strand is a function of
numerous factors, discussed with more detail in Section 2.4 and the test data was also
based on tests performed in the late 1950’s and early 1960’s, primarily by Hanson and
Kaar and Kaar et al. The research performed on transfer length over the past 55 years
was generally part of research focused on development length beginning with Janney
whose 1954 publication focused on the bond between pretensioned wire used in concrete
members. Janney concluded that bond failures were a result of inadequate embedment
lengths causing high bond stresses in excess of the resistance provided by the concrete.
Janny also stated that rusted wire tended to perform better than clean wire as the clean
wire slipped at lower bond stresses (Janney 1954). Hanson and Kaar also noted that
slightly rusted strand did have better bond characteristics (Hanson and Kaar 1959).
Hanson and Kaar performed flexural bond tests of pretensioned, prestressed
beams containing seven-wire strand, with a primary objective focused on the
determination of the maximum diameter of seven-wire strand that could be safely used in
a flexural member. They attribute bond failures of flexural members to a progressive
wave propagating towards the ends of the beams. If the wave reaches the transfer zone,
the reduction in cross-sectional area of the strand reduces the frictional resistance to an
extent precipitating general bond slip. The helical shape of the strand does provide
additional resistance following general bond slip, allowing for further application of load.

31
However, if the bond stresses exceed the strength of the surrounding concrete, a complete
bond failure will occur, and the strand will pull through the concrete. Based on the
results of Hanson and Kaar, Equation (2-2) was developed only after modifications of
Mattock’s original recommendation shown as Equation (2-31) with units of ksi
(Tabatabai and Dickson 1993).
( )1.11 0.77d su se bL f f d= − Eq. (2-31) Zia and Mostafa revisited development length following work by Martin and
Scott and Anderson and Anderson. Martin and Scott, who first recommended transfer
length to be increased to 80db, also recommended flexural bond lengths of 160db
(Equation 2-32a), 187db (Equation 2-32b),, and 200db (Equation 2-32c), for ¼ in., ⅜ in.,
and ½ in. diameter strand, respectively, far exceeding values from the ACI provisions
(Martin and Scott 1976). However, Anderson and Anderson found no significant
differences in experimental results when compared to the ACI provisions (Anderson and
Anderson 1976). Zia and Mostafa noted that when looking at the equation for flexural
bond length, Lfb = (fps – fse)db, an assumed bond stress of 250 psi was used, while the
actual value computed from Hanson and Kaar test data was 233 psi, which indicates the
flexural bond length portion of Equation (2-2) to be slightly unconservative. Zia and
Mostafa recommended the average bond stress used for calculation purposes to be 200
psi (Zia and Mostafa 1977). As a result of their recommendation, the flexural bond
length portion of Equation (2-2) was increased by 25 percent, when coupled with transfer
length recommendations results in Equation (2-33).
( )'1.5 4.6 1.25sid b ps se b
ci
fL d f f df
= − + − Eq. (2-33)
2.3.3 (1990 – 1999)
Discussed in Section 2.2, corrosion in prestressed bridge girders became an area
of concern resulting in the development of epoxy-coated prestressing strand.
Development lengths of standard reinforcing bars with epoxy-coating are known to
increase and this is taken into account in Equation (2-1). The anticipated use of epoxy-
coated strand provided a level of uncertainty related to the bond integrity of the strand
leading to a study conducted on the transfer and development length of epoxy-coated

32
strand at North Carolina State University. Hanson and Kaar described a bond failure as
an increase in stress progressing as a wave. Cousins et al. also mentions this progression,
noting that “as the moment increases, the stress in the strand increases and proceeds
towards the end of the transfer length as a wave.” If the stress wave reaches the transfer
zone prior to the development of the ultimate moment capacity, a general bond failure
will occur.
Cousins et al. breaks the flexural bond length into a plastic and elastic zone as was
the model for transfer length, but assumes the plastic zone over the entire length of the
flexural bond length. Based on this assumption, an equation was derived from
equilibrium for the flexural bond length, resulting in Equation (2-34) for the calculation
of development length, with recommended values of 6.7, 300 psi/in., and 1.32 for U’t, B,
and U’d, respectively for uncoated strands (Cousins et al. 1990b). The constants were
based on experimental results and derived from calculated transfer and flexural bond
lengths. Flexural bond lengths were taken as the embedment length minus the
corresponding calculated transfer length for each test, while the final development length
was taken as the shortest embedment length resulting in a flexural failure. Test results
showed experimental development lengths for uncoated strands to exceed the provisions
provided by ACI and AASHTO, while development lengths for coated strands were
below values calculated by ACI and AASHTO provisions (Cousins et al. 1990a).
( )' '
' ' ' '0.5 se ps ps bt ci
d ps se
b t ci d c
f A A dU fL f f
B d U f U f
π
π
⎛ ⎞ ⎛ ⎞⎜ ⎟ ⎜ ⎟= + + −⎜ ⎟ ⎜ ⎟⎝ ⎠ ⎝ ⎠
Eq. (2-34)
In response to the work of Cousins et al., the FHWA issued a memorandum in
1988 with various restrictions on the use of prestressing steel. Those restrictions included
the ban of 0.6 in. diameter strand for use in pretensioned, prestressed concrete girders, a
minimum strand spacing of 4db, all calculated development lengths be multiplied by 1.6,
and where a strand is debonded at the end of a member, the development should be two
times the calculated value (FHWA 1988). As a result of the FHWA Memorandum, a
number or research projects were taken underway focusing on the transfer and
development length of prestressing strand.

33
With the 1.6 multiplier for development lengths imposed by AASHTO, some
questions arose as to its applicability to piles. An FDOT study investigated the effect of
pile embedment on the development length of prestressing strand. The construction of
pile supported structures generally includes the use of pile caps, resulting in an
embedment of the pile into the pile cap over a distance of 12 in. Shahawy and Issa state
that shrinkage of the pile cap creates a confining force along the embedded portion of the
pile, in turn reducing the development lengths. The tests performed by FDOT showed a
decrease in development length due to the confining force (Shahawy and Issa 1992).
However, in a later review of the development length of prestressing strands, Buckner
disagreed with the initial assumption for the presence of confining forces as a result of
shrinkage. FDOT later submitted a revised version of the current development length
equation to AASHTO Committee T-10, to no avail. Equation (2-35) is the development
equation proposed by FDOT, where kb is a dimensionless constant for type of structural
member and μave is an assumed bond stress of 250 psi (Buckner 1995).
( )
( )3sif
b ps se bd
b ave
d f f dL
k μ
⎡ ⎤+ −⎣ ⎦= Eq. (2-35)
Concurrent to the study by FDOT, Mitchell et al. was investigating the influence
of high strength concrete on transfer and development lengths at McGill University. The
investigation by Mitchell et al. looked at concrete strengths at the time of transfer from
3050 psi to 7250 psi and 4500 psi to 12,900 psi at the time of testing and strand diameters
of ⅜ in., ½ in., and 0.62 in. With an increase in concrete strength, transfer lengths
decreased, the effective prestress increased, and the development lengths decreased
(Mitchell et al. 1993). Although, it should be noted, a gradual method of release was
used, however, Mitchell et al. proposed a modified version of the ACI equation for the
condition of gradual release as shown in Equation (2-36) taking into account the
influence of concrete strength on transfer and development length.
( )' '
3 4.50.33d pi b ps se bci c
L f d f f df f
= + − Eq. (2-36)
In addition to the influence of concrete strength and confinement, the effect of
strand spacing was the focus of research projects by Cousins et al. and Deatherage et al.

34
Cousins et al. looked at test specimens with strand spacings of 1.75 and 2 in. coupled
with both a normal and high strength concrete mix. Tested embedment lengths for
specimens with normal strength concrete resulted in a range of development lengths
between 114 and 126 in. for strand spacings of 1.75 and 2 in, while development lengths
for test specimens with high strength concrete were found to be less than 108 in. It was
concluded that reducing the spacing of ½ in. diameter prestressing strands from 2 in. to
1.75 in. did not significantly affect the development length, though an increase in
concrete strength did result in a decrease in development lengths. For the test specimens
containing normal strength concrete, the test results did show the development lengths to
be approximately 60 to 70 percent larger than those predicted by ACI (Cousins et al.
1994).
Deatherage et al. evaluated the transfer lengths of four different strand diameters
as well as the effect of reducing strand spacing from 4db to 3.5db for ½ in. diameter
strands. Results showed the flexural bond length of prestressing strand to be
underestimated by the ACI and AASHTO equations by approximately 42 percent
(Deatherage et al. 1994). It was recommended that the development length equation be
modified as shown in Equation (2-37) including transfer length modifications as
previously discussed and a 50 percent increase in the flexural bond length, later
discounted by Buckner, due to erroneously large values of effective prestress. In
agreement with the results of Cousins et al., a reduction in strand spacing did not
significantly affect development lengths.
( )1.503si
d b ps se bfL d f f d⎛ ⎞= + −⎜ ⎟
⎝ ⎠ Eq. (2-37)
As the main focus of a FHWA report, Buckner reviewed the research subsequent
to the 1988 FHWA Memorandum pertaining to the development length of prestressing
strand. In the review, an effort was made to resolve discrepancies among the
recommendations from various studies. The report states that experimental results from
most test programs showed lower bond strengths with an increase in strand strain. In test
specimens with strand strains near the yield strain (0.010 in./in.), typical test results
showed the ACI/AASHTO equation to adequately predict the development lengths, while
test specimens having larger strand strains at failure (0.027 – 0.036 in./in.) experienced

35
strand slippage with embedment lengths as large as 1.7 times the ACI/AASHTO
predicted values and in some cases failed to reach their expected moment capacities when
tested at shorter embedment lengths. Thus, Buckner recommended that the development
length be dependent on the level of strain in the strand at the time of failure. Coupled
with the prior recommendations for transfer length, Buckner proposed a modification
factor for the flexural bond length, taking the strain into consideration. Equation (2-38)
shows the recommended equation for development length, where λ = (0.6 + 40εps)
(Buckner 1995). Lane also recommended Equation (2-39) from research completed at
the FHWA (Lane 1998).
( )3si
d b ps se bfL d f f dλ⎛ ⎞= + −⎜ ⎟
⎝ ⎠ Eq. (2-38)
( )
' '
6.445 15ps se bpt
d bc c
f f dfL d
f f−
= − + + Eq. (2-39)
2.3.4 (2000 – 2009)
The studies following the 1988 FHWA Memorandum concentrated on the transfer
and development length of prestressing strand, looking at various strand diameters,
concrete strengths, and spacings. Results showed development lengths to increase with
increasing strand diameter and to decrease with increasing concrete strength, while
reduced spacings showed no significant effect on development lengths. Deatherage et al.
(1994) did note that development lengths of 0.6 in. diameter strand failed to follow the
trend of increasing development lengths with increasing strand diameters. Amongst the
previous studies, the primary focus was never given to the 0.6 in. diameter strand,
although the FHWA placed a moratorium on its use in the 1988 Memorandum.
Kose and Burkett later studied the behavior of 0.6 in. diameter strand, concluding
that transfer and development lengths actually decreased with an increase in strand
diameter. They also noted that transfer and development lengths decreased with
increasing concrete strength. It should be noted that only ½ in. and 0.6 in. diameter
strands were used in the study. Kose and Burkett showed no decrease in flexural bond
lengths as concrete strengths increased; however, previous studies have shown flexural
bond lengths to decrease. The development length was taken as the shortest embedment

36
length resulting in a flexural failure. Each flexural bond length was then determined by
subtracting the average transfer length. In addition to the data obtained by test specimens
of the study, additional test data were used from previous studies from the FHWA,
Florida A&M/Florida State, Auburn University, University of Texas at Austin, and the
University of Tennessee at Knoxville. As the primary objective, Equation (2-40) was
derived from a linear regression model, for use with 270 ksi low-relaxation strand, with
diameters ranging from ½ to 0.6 in. and concrete strengths ranging from 4000 to 14,000
psi. It was also assumed that initial prestress was taken as 75 percent of the ultimate
tensile strength of the strand (Kose and Burkett 2005).
( ) ( )( )22
' '
1195 8 400 pu pi bpi b
d
c c
f f df dL
f f
⎡ ⎤⎡ ⎤ − −−⎢ ⎥⎢ ⎥= + +⎢ ⎥⎢ ⎥⎣ ⎦ ⎣ ⎦
Eq. (2-40)
In a recent NCHRP study, as with transfer length, the results indicated concrete
strength to be very influential on the determination of development length. As a result of
the experimental testing, Equation (2-41) was proposed for the calculation of
development length, accounting only for strand diameter and concrete strength. Based on
the current AASHTO provisions, development length is approximately equal to 150db. In
the NCHRP study, the researchers assume transfer lengths equal to 60db, which would
correspond to a flexural bond length of 90db. Assuming a concrete strength of 6,000 psi,
the flexural bond length portion of Equation (2-41) reduces to 90db. As with transfer
length, an increase in concrete strength also results in a decrease in flexural bond length,
however, a lower limit of 60db is placed on the flexural bond length, which corresponds
to a concrete strength of 14,000 psi. As a result of the minimum allowable values for
transfer and flexural bond lengths, the lower limit for development length is specified to
be 100db (NCHRP 2008).
' '
120 225 100d b b
ci c
L d df f
⎡ ⎤⎢ ⎥= + ≥⎢ ⎥⎣ ⎦
Eq. (2-41)
2.3.5 Summary
The development length of prestressing strand is a vital factor in the behavior of
pretensioned, prestressed concrete. As with transfer length, research from the past five

37
decades has shown development lengths to be more complex than initially thought. The
current ACI/AASHTO provisions only show development length to be dependent on
strand stress at various times and the diameter of the strand. In some situations, the
research discussed herein has shown development lengths to far exceed the predicted
values. In response to inadequate predictions, multiple researchers have proposed new
development length equations taking into account, concrete strength, strand diameter,
stress level in the strand, strand strain at the time of failure, and type of structural
member. Of the equations, summarized in Table 2.3, discrepancies exist among a
number of them. Based on the evidence of conducted research, it is apparent the existing
provisions for development length set forth by ACI and AASHTO are inadequate for a
number of situations, requiring additional research and the development of more
consistent equations.

38
Table 2.3. Historical Development Length Equations
Contributor Year Equation Eq. No. Hanson & Kaar 1959 ( )1.11 0.77d su se bL f f d= − 2-31
ACI 1963 3000 1000
ps sesed b b
f ffL d d−⎛ ⎞⎛ ⎞= + ⎜ ⎟⎜ ⎟
⎝ ⎠ ⎝ ⎠ 2-2
160t bL d= for ¼ in. dia. strand 2-32a 187t bL d= for ⅜ in. dia. strand 2-32b Martin & Scott 1976 200t bL d= for ½ in. dia. strand 2-32c
Zia & Mostafa 1977 ( )'1.5 4.6 1.25sid b ps se b
ci
fL d f f df
= − + − 2-33
Cousins et al. 1990 ( )' '
' ' ' '0.5 se ps ps bt ci
d ps se
b t ci d c
f A A dU fL f f
B d U f U f
π
π
⎛ ⎞ ⎛ ⎞⎜ ⎟ ⎜ ⎟= + + −⎜ ⎟ ⎜ ⎟⎝ ⎠ ⎝ ⎠
2-34
Shahawy et al. 1992 ( )
( )3sif
b ps se bd
b ave
d f f dL
k μ
⎡ ⎤+ −⎣ ⎦= 2-35
Mitchell et al. 1993 ( )' '
3 4.50.33d pi b ps se bci c
L f d f f df f
= + − 2-36
Deatherage et al. 1994 ( )1.503si
d b ps se bfL d f f d⎛ ⎞= + −⎜ ⎟
⎝ ⎠ 2-37
Buckner 1995 ( )3si
d b ps se bfL d f f dλ⎛ ⎞= + −⎜ ⎟
⎝ ⎠ 2-38
Lane 1998 ( )
' '
6.445 15ps se bpt
d bc c
f f dfL d
f f−
= − + + 2-39
Kose & Burkett 2005 ( ) ( )( )22
' '
1195 8 400 pu pi bpi b
d
c c
f f df dL
f f
⎡ ⎤⎡ ⎤ − −−⎢ ⎥⎢ ⎥= + +⎢ ⎥⎢ ⎥⎣ ⎦ ⎣ ⎦
2-40
NCHRP 2008 ' '
120 225 100d b b
ci c
L d df f
⎡ ⎤⎢ ⎥= + ≥⎢ ⎥⎣ ⎦
2-41

39
2.4 Bond Characteristics and Influential Factors
2.4.1 Introduction
The bond between prestressing steel and the surrounding concrete is the most
significant component of pretensioned, prestressed concrete. Without the bond between
the prestressing steel and surrounding concrete, pretensioned, prestressed concrete would
not be feasible. In the calculation of the development length for standard reinforcing
bars, the influence of cover and confining reinforcement, as-cast vertical location,
coating, bar size, and effects of using lightweight concrete are taken into consideration.
On the contrary, in the calculation of the development length (transfer and flexural bond
lengths) for prestressing strand, only the stress in the strand and the strand diameter are
taken into account, neglecting the effect of cover and confinement, as-cast vertical
location, coating of the strand (i.e. rust or epoxy), effects of lightweight concrete, strength
of the concrete, the type of prestress release, and the fluidity of the concrete mix. Over
the past five decades, research has shown a number if not all of these factors to
significantly effect the transfer and development length of prestressing strand.
The bond between the concrete and the prestressing strand is made up of three
components, briefly discussed in previous sections. Janney first noted the factors
contributing to bond to be the adhesion between the steel and concrete, friction between
the steel and concrete, and the mechanical resistance of the deformations of the steel.
With the transfer process, the adhesion is lost, which can only be present if no slip has
occurred. If there was no slip between the concrete and steel, the reduction in steel strain
would be equal to the increase in concrete strain within a member (Janney 1954).
Hanson and Kaar later noted that seven-wire strand can further contribute to the
mechanical bond allowing for additional strength of a flexural member after general bond
slip has occurred (Hanson and Kaar 1959).
Section R12.9 of the ACI Commentary states the following:
“The bond of strand is a function of a number of factors, including the
configuration and surface condition of the steel, the stress in the steel, the depth of
concrete beneath the strand, and the method used to transfer the force in the strand
to the concrete. For bonded applications, quality assurance procedures should be
used to confirm that the strand is capable of adequate bond. The precast concrete

40
manufacturer may rely on certification from the strand manufacturer that the
strand has bond characteristics that comply with this section. Strand with a
slightly rusted surface can have an appreciably shorter transfer length than clean
strand. Gentle release of the strand will permit a shorter transfer length than
abruptly cutting the strands (ACI 2008).”
2.4.2 Strand Stress
The transfer and development lengths have been shown to increase with an
increase in strand stress. Janney first noted this increase in a study investigating a high
strength strand (270 ksi) with respect to the conventional strand (250 ksi), stating that
transfer length was greater by a small amount because of the high strength strand, but was
thought to be an insignificant increase (Janney 1954). Cousins et al. later found an
increase in strand stress to significantly increase transfer and development lengths well
beyond the values predicted by the ACI/AASHTO provisions, with initial strand stresses
up to 80 percent of the ultimate tensile strength of the strands (Cousins et al. 1990c).
Studies by Shahawy et al. (1992) and Russell and Burns (1997) also indicated longer
transfer lengths for larger values of strand stress, shown in the proposed equations,
Equation (2-9) and Equation (2-14). More recent studies also recognize there to be a
general agreement that strand stress does have a significant effect on transfer and
development lengths, with proposed equation modifications consistently recommending
the use of the initial prestress in lieu of the effective prestress used in the current
ACI/AASHTO provisions.
2.4.3 Strand Diameter
The diameter of the strand has also been shown to be an influential factor on
transfer and development lengths with a general consensus that transfer and development
length increase with an increase in strand diameter. Early research by Hanson and Kaar
(1959) showed increasing transfer lengths for increasing strand diameters up to ½ in. Zia
and Mostafa (1977) showed development length to increase with increasing strand
diameter, again for up to ½ in. diameter strands. Resulting from work by Cousins et al.,
0.6 in. diameter strands were found to have excessive transfer and development lengths
(Cousins et al. 1990b). In response to the findings, the FHWA placed a ban on the use of
0.6 in. diameter strands in the 1988 FHWA Memorandum. Further investigations later

41
coincided with the previous results, showing transfer and development length to increase
with increasing strand diameter including 0.6 in. diameter strands. Contrary to the
general agreement of increasing transfer and development lengths with increases in
strand diameter, Deatherage et al. and Kose and Burkett found the transfer and
development lengths to decrease for 0.6 in. diameter strands. Deatherage et al. found the
historical trend to hold true up through strand diameters of 9/16 in., but stated that the
relationship did not hold true for 0.6 in. diameter strands (Deatherage et al. 1994). In the
development of Equation (2-17), Kose and Burkett noticed a general trend showing
transfer length to decrease as strand diameters ranged from ½ in. to 0.6 in. (Kose and
Burkett 2005). Therefore, there is some disagreement as to the relationship between
transfer and development lengths and strand diameters.
2.4.4 Spacing, Cover, and Confinement
The influence of spacing, cover, and confinement of prestressing strands has been
the focus of numerous studies. During the transfer process and flexural testing, it is
assumed there is a sufficient amount of concrete surrounding the strand to develop the
bond between the strand and concrete. In situations where there is not adequate
coverage, bond failures may occur as a result of splitting. Most precast manufacturers
use a center-to-center spacing of 2 in., which is generally preferred. This spacing is
based on the recommended values for strand spacing of 4db for ½ in. diameter strands.
Research has proven a 1.75 in. and 2 in. spacing to be adequate for use with ½ in. and 0.6
in. diameter strands, respectively.
Cousins et al. looked at the influence of strand spacing and cover for epoxy-
coated strand. Results of the study showed epoxy-coated strand to cause significant
cracking at spacings and covers less than those recommended by ACI, while subsequent
studies by Cousins et al. (1993) and Deatherage et al. (1994) found decreases in strand
spacings to 1.75 in. had no significant effect on transfer and development length of ½ in.
diameter, uncoated prestressing strand. One study, however, did show transfer lengths to
increase with a reduction in bottom cover (Oh and Kim 2000). Zia and Mostafa noted
that standard reinforcing bars were used to resist bursting in the end regions of test
specimens, slightly reducing the transfer length, but not to a significant degree. Shahawy
et al. (1992) looked at the influence of confinement on development lengths, showing a

42
significant decrease in development length with an applied confinement, later discounted
by Buckner due to an unrealistic test situation. As research has shown, smaller spacings
and small amounts of cover can result in bond issues, although the majority of these
issues were at extreme limits or occurred with epoxy-coated strands due to excessive
bond stresses. As the industry standard, a 2 in. spacing seems to be sufficient for all
strand diameters up to 0.6 in. and does not appear to significantly influence transfer and
development lengths of uncoated strands.
2.4.5 Top-bar Effect
Since the acknowledgement of the top-bar effect in the 1951 ACI Building Code,
the development length of standard reinforcing bars have been multiplied by a factor
when a horizontal bar is placed where there is more than 12 in. of concrete cast beneath
it. Conversely, there currently are no provisions for prestressing strands with the same
situation, although in the ACI commentary as previously stated, says that the bond of
strand is a function of the depth of concrete beneath the strand. Traditionally, the top-bar
effect has been accepted as the aforementioned definition, but recent research has
resulted in questions surrounding the actual definition of the top-bar effect.
Research has shown top-cast bars to have less favorable bond characteristics than
bottom-cast bars. A study by Jeanty et al. concluded that, in pairs of test specimens, one
containing bottom-cast bars and the other containing top-cast bars, the development
length of top-cast bars were approximately 20 percent larger than those of bottom-cast
bars (Jeanty et al. 1988). In addition to research focused on standard reinforcement, the
top-bar effect has also been seen in prestressed concrete applications, referred to as the
top-strand effect, most notably in prestressed piles. As a result of excessive end-slip
measurements found in prestressed concrete piles by the South Carolina Department of
Transportation (SCDOT), a research project was launched to investigate the top-strand
effect in prestressed concrete piles. Research by Petrou et al. (2000b) and Wan et al.
(2002a) showed excessive strand end-slip measurements in both the top-cast and bottom-
cast strands of prestressed concrete piles, with the top-cast strands exhibiting much
higher end-slips than the bottom-cast strands. Although ACI and AASHTO define a top-
cast bar as a horizontal bar with more than 12 in. of fresh concrete cast beneath it, Petrou
et al. summarizes the top-strand definition defined by the EUROCODE, which refers to a

43
top-cast bar as one cast near the top as-cast surface of the member. Subsequent to the
research by Petrou et al. and Wan et al., a study by Peterman (2007) revealed that the top-
strand effect may in fact be dependent on the amount of concrete above the strand and not
the amount of concrete beneath it. With this discovery comes a number of questions
regarding the true definition of the top-strand effect, which is discussed in more detail in
Section 2.6.
2.4.6 Surface Condition
The surface condition of the strand can highly influence the frictional component
of the bond between the prestressing strand and surrounding concrete, increasing or
decreasing the transfer and development length, depending on the level of friction
between the strand and surrounding concrete. Strands are typically delivered in a
“bright” condition, indicating the absence of rust, while an exposure to weather, may
result in a slight rusting of the strand. As previously mentioned, corrosion became a
concern in the bridge industry, resulting in the development of an epoxy-coated strand.
Epoxy-coated rebar have been shown to have longer development lengths than uncoated
rebar, resulting in the application of a modification factor. With the history of decreased
bond in epoxy-coated rebar, an investigation was conducted with the surface condition of
the strand as the primary variable.
Janney first noticed an improved bond behavior in rusted wire with respect to
clean wire in a 1954 publication and later noted a significant decrease in transfer length
of rusted strands (Janney 1954) (Janney 1963). Hanson and Kaar also noted improved
bond characteristics resulting in an average increase in the moment at general bond slip
of 30 percent (Hanson and Kaar 1959). Several other researchers recognized the
increased bond characteristics from slightly rusted strand, although one study did show
transfer lengths to greatly increase for strands with excessive rust located at the cut end of
a test specimen. In an investigation of the bond characteristics of epoxy-coated strand,
Cousins et al. found epoxy-coated strand without impregnated grit to have virtually no
bond. However, as the density of impregnated grit increased, the transfer and
development lengths decreased, having much more favorable bond characteristics than
uncoated strand (Cousins et al. 1990b). In a later study, epoxy-coated strands were again
observed to have smaller transfer lengths than uncoated strands (Cousins et al. 1993).

44
The bond between prestressing steel and surrounding concrete can be strongly
influenced by the surface condition of the strand. The worst case can be assumed to be a
clean, bright strand free of rust, excluding an epoxy-coated strand without impregnated
grit. Rusted strand has been shown to have better bonding capabilities than clean, bright
strand, but the level of rust would be difficult to measure and carelessly allowing strand
to rust is strongly discouraged. Therefore, it is not recommended that the rusting of
strands be taken into consideration for the calculation of transfer and development
lengths. On the other hand, epoxy-coated strands with impregnated grit do have the
potential for a reduction in transfer and development length, but should be investigated in
more detail before any modification factors can be developed.
2.4.7 Concrete Strength
The compressive strength of the concrete is not included in the current ACI and
AASHTO provisions for transfer and development length, while it may be one of the
most influential factors. Research has shown a steady trend for transfer and development
lengths to decrease with an increase in concrete strength. Kaar et al. (1963) claimed
concrete strength to have little effect on transfer lengths for strand of up to ½ in.
diameter, but it should be noted that concrete strengths were no higher than 5000 psi.
Contrary to the results by Kaar et al., Zia and Mostafa proposed a transfer and
development length equation incorporating concrete strength, reflecting a decrease in
transfer length with increasing concrete strengths (Zia and Mostafa 1977). In later
investigations, the influence of high strength concrete on transfer and development length
of prestressing strand was studied. Concrete strengths ranged from 3050 to 7250 psi in
one study resulting in a decrease in transfer length with increasing concrete strengths
(Mitchell et al. 1993). In a second study, a 5300 psi mix and 8000 psi mix at transfer
resulted in average transfer lengths of 56 and 37 in., respectively (Cousins et al. 1994).
Additional studies by Oh and Kim (2000), Petrou et al. (2000b), and Wan et al. (2002b)
also note concrete strength as a very influential factor, stating that excessive end-slip
measurements of top-strands in piles could be a result of lower concrete strength in the
top portion of the cross-section. In a more recent study, little correlation was found with
relationships that omitted concrete strength in their development (Barnes et al. 2003).
45
Kose and Burkett also found transfer lengths to decrease with an increase in concrete
strength (Kose and Burkett 2005).
Research has consistently shown concrete strength to significantly influence
transfer and development lengths. Early work by Hanson and Kaar, from which the
current ACI/AASHTO provisions are based, only considered concrete strengths up to
5000 psi, showing no significant impact (Hanson and Kaar 1959). The current
ACI/AASHTO provisions fail to consider the concrete strength in calculations of transfer
and development lengths, although numerous researchers have proposed equations doing
so. Based on previous research, there is a clear indication that the influence of concrete
strength should be taken into consideration with respect to bond.
2.4.8 Release Method
The force in the strands is transferred to the concrete using either a gradual or
sudden release. ACI states that a gentle release will permit a shorter transfer length than
abruptly cutting the strands. Although a gradual release does usually result in shorter
transfer lengths, a sudden release has, for the most part, become the industry standard
among precast manufacturers. Is it generally accepted that transfer lengths adjacent to
the cut end are longer than transfer lengths adjacent to the dead end, and this conclusion
is consistently supported by research.
Kaar et al. was the first to recognize an increase in transfer lengths adjacent to the
cut end of test specimens, noting a 20 to 30 percent increase with respect to the dead end
values (Kaar et al. 1963). Zia and Mostafa derived transfer length equations for both
sudden and gradual prestress release, selecting only the equation for sudden release for a
conservative estimate (Zia and Mostafa 1977). In subsequent studies, Cousins et al.
(1994) found transfer lengths for ½ in. 270 ksi, low-relaxation strands to be 38 and 31 in.
at the cut and dead ends, respectively, while Russell and Burns (1997) found similar
results, 38.5 in. at the cut end and 28.7 in. at the dead end. Oh and Kim later found
similar increases (Oh and Kim 2000).
Various researchers have proposed modified transfer length equations from tests
having a gradual release as well as a sudden release, while proposed equations from tests
using a gradual release may be unconservative for transfer lengths adjacent to cut ends.
Two such equations are Equation (2-2), the current ACI transfer length equation, and

46
Equation (2-10) proposed by Mitchell et al. Taking into consideration the type of
prestress release can be beneficial in the calculation of shear resistance in a flexural
member, but for conservatism, as with the coating of the strand, it is recommended that
all transfer length calculations assume a sudden release.
2.4.9 Additional Factors
In addition to the strand stress, diameter, spacing, cover and confinement, as-cast
vertical location, coating, strength of concrete, and type of release, a number of other
factors have been shown to influence transfer and development lengths. These additional
factors include the effects of lightweight concrete, fluidity of the mix, admixtures, time
effects, and cross-section size. The use of lightweight concrete has been shown to have a
negative effect on bond as does an increased fluidity of the mix, typically in self
consolidating concrete (SCC) (Peterman 2007). The influence of admixtures, such as
retarder and superplasticizer, on transfer and development length are of interest, but are
beyond the scope of this project. Transfer lengths have been shown by a number of
researchers to increase with time, and Russell and Burns (1997) concluded transfer and
development lengths are also dependent on the size of the cross-section.
2.4.10 Summary
Upon reviewing the literature to date with respect to bond, it is apparent there are
multiple factors affecting bond in addition to the stress in the strand and strand diameter
used in the ACI/AASHTO provisions. Typical spacing and cover requirements have
been shown to be satisfactory to obtain adequate bond, while confinement has been
shown to have little effect on transfer and development lengths. Unless coated with an
epoxy containing impregnated grit, assuming the strand coating to benefit the bond of the
strand may be unconservative. In addition, relying on a method of gradual release may
also result in an unconservative estimate of transfer and development lengths. Therefore,
the effects of spacing, cover, and confinement are assumed to be constant based on
industry standards and any consideration of coating and gradual method of release will be
neglected in the development of any equations for transfer and development length. The
factors shown by previous research to most significantly influence the transfer and
development lengths are the stress in the strand, the diameter of the strand, the strength of
the concrete, and the as-cast vertical location of the strand.
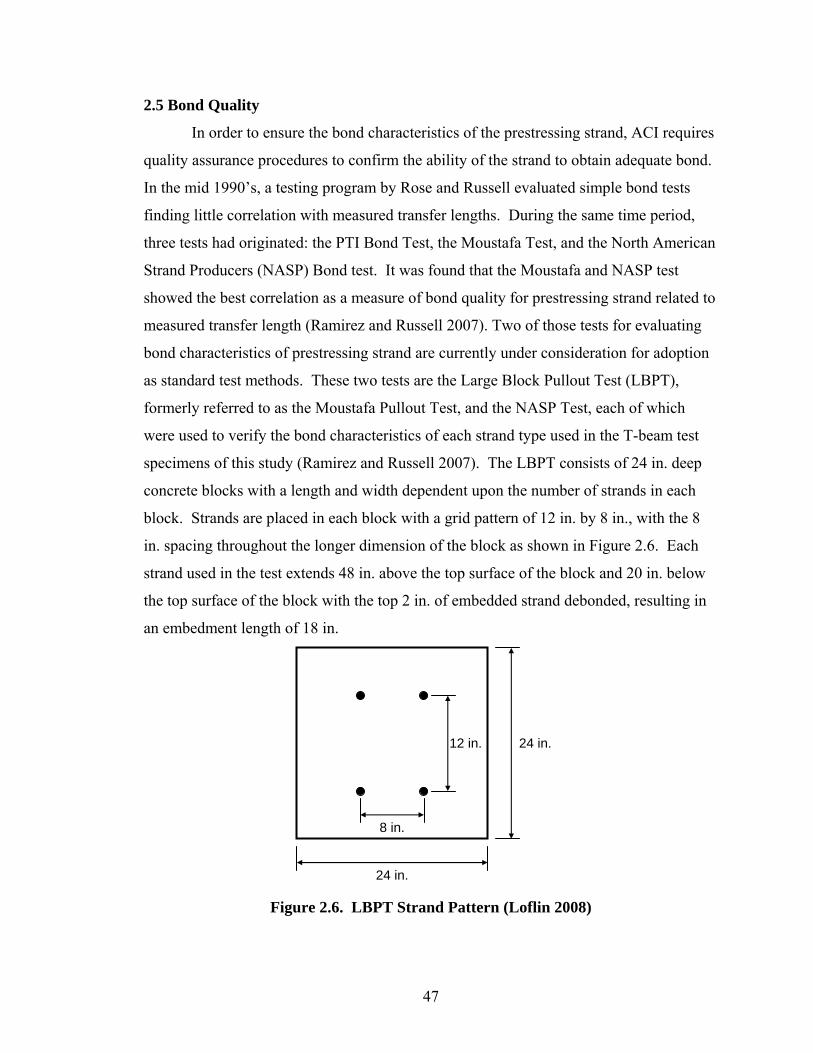
47
2.5 Bond Quality
In order to ensure the bond characteristics of the prestressing strand, ACI requires
quality assurance procedures to confirm the ability of the strand to obtain adequate bond.
In the mid 1990’s, a testing program by Rose and Russell evaluated simple bond tests
finding little correlation with measured transfer lengths. During the same time period,
three tests had originated: the PTI Bond Test, the Moustafa Test, and the North American
Strand Producers (NASP) Bond test. It was found that the Moustafa and NASP test
showed the best correlation as a measure of bond quality for prestressing strand related to
measured transfer length (Ramirez and Russell 2007). Two of those tests for evaluating
bond characteristics of prestressing strand are currently under consideration for adoption
as standard test methods. These two tests are the Large Block Pullout Test (LBPT),
formerly referred to as the Moustafa Pullout Test, and the NASP Test, each of which
were used to verify the bond characteristics of each strand type used in the T-beam test
specimens of this study (Ramirez and Russell 2007). The LBPT consists of 24 in. deep
concrete blocks with a length and width dependent upon the number of strands in each
block. Strands are placed in each block with a grid pattern of 12 in. by 8 in., with the 8
in. spacing throughout the longer dimension of the block as shown in Figure 2.6. Each
strand used in the test extends 48 in. above the top surface of the block and 20 in. below
the top surface of the block with the top 2 in. of embedded strand debonded, resulting in
an embedment length of 18 in.
Figure 2.6. LBPT Strand Pattern (Loflin 2008)
12 in.
8 in.
24 in.
24 in.

48
Subsequent to adequate concrete strength development, typically ranging from
3500 to 5000 psi, each strand is loaded individually in tension using a hollow hydraulic
ram at a load rate of 20 kips per minute until failure (Mote 2001). In addition to those
used by Mote, similar test methods were used by Logan (1997) and Rose and Russell
(1997). It is recommended that the minimum pullout force be 36 kips for a ½ in.
diameter regular strand ensuring adequate bond characteristics for transfer and
development lengths. Should the strand size increase, the minimum pullout force should
also be increased by a factor equal to the ratio of the larger area to that of a ½ in. diameter
regular strand, resulting in minimum pullout forces of 39 kips and 51 kips for a ½ in.
diameter super strand and 0.6 in. diameter strand, respectively (Logan 1997).
The NASP Test consists of a 5 in. diameter steel pipe, 18 in. long with a ½ in.
thick steel plate welded to one end used as a bearing surface. Each pipe contains a single
concentrically placed prestressing strand placed throughout the entire length of the pipe,
protruding approximately 20 in. through a ⅝ in. diameter hole located in the center of the
bearing plate. As with the LBPT, the strand is debonded along the bottom 2 in. within
the pipe (Loflin 2008). Figure 2.7 shows a typical NASP Test specimen.
Figure 2.7. NASP Test Specimen (Loflin 2008)
20 in.
18 in.
5 in.
½ in.
2 in. debonded strand
Concentric strand
Pipe

49
The NASP Test uses a mortar consisting of Type III cement, sand, and water. At
the time of casting, the mortar is required to have a flow between 100 and 125, while the
strength is required to be between 4500 and 5000 psi at 24 hours (Ramirez and Russell
2007). The flow and strength limitations were selected to ensure consistent material
properties in an attempt to provide uniformity across a spectrum of tests.
At approximately 24 hours each pipe was tested by loading the protruding strand
in tension at a load rate of 7500 lbs per minute until failure. Failures being defined as the
inability to carry any additional load or an end-slip value exceeding 1.5 in., with a
minimum required average pullout force prior to 0.1 in. slip for a ½ in. diameter regular
strand of 10.5 kips and a minimum pullout force of 9.0 kips for an individual test. As
with the LBPT, these values were also increased by a factor equal to the ratio of the
larger area to that of a ½ in. diameter regular strand for increased strand size. This
increase resulted in an average minimum pullout force of 11.5 kips and 12.6 kips for a ½
in. diameter super and 0.6 in. strand, respectively, and a minimum pullout force for an
individual test of 9.8 kips and 10.8 kips for a ½ in. diameter super and 0.6 in. diameter
strand, respectively (Loflin 2008).
Both LBPT’s and NASP tests were performed on each strand type used in the T-
beam test specimens. The strand types investigated included Grade 270 and Grade 300 ½
in. diameter regular, Grade 270 and Grade 300 ½ in. diameter super, and Grade 270 0.6
in. diameter strands from Producer A, as well as Grade 270 ½ in. diameter super from
Producer A2. LBPT specimens for each strand type were cast individually in groups of
four strands in a single 24 in. cube as shown in Figure 2.8. All strands from Producer A
performed with satisfactory results, each exceeding the minimum values as previously
discussed, however, the ½ in. diameter super strand from Producer A2 fell slightly below
the minimum required average pullout force of 39 kips. Table 2.4 lists a summary of the
results for all strand types used in the LBPT’s (Loflin 2008).
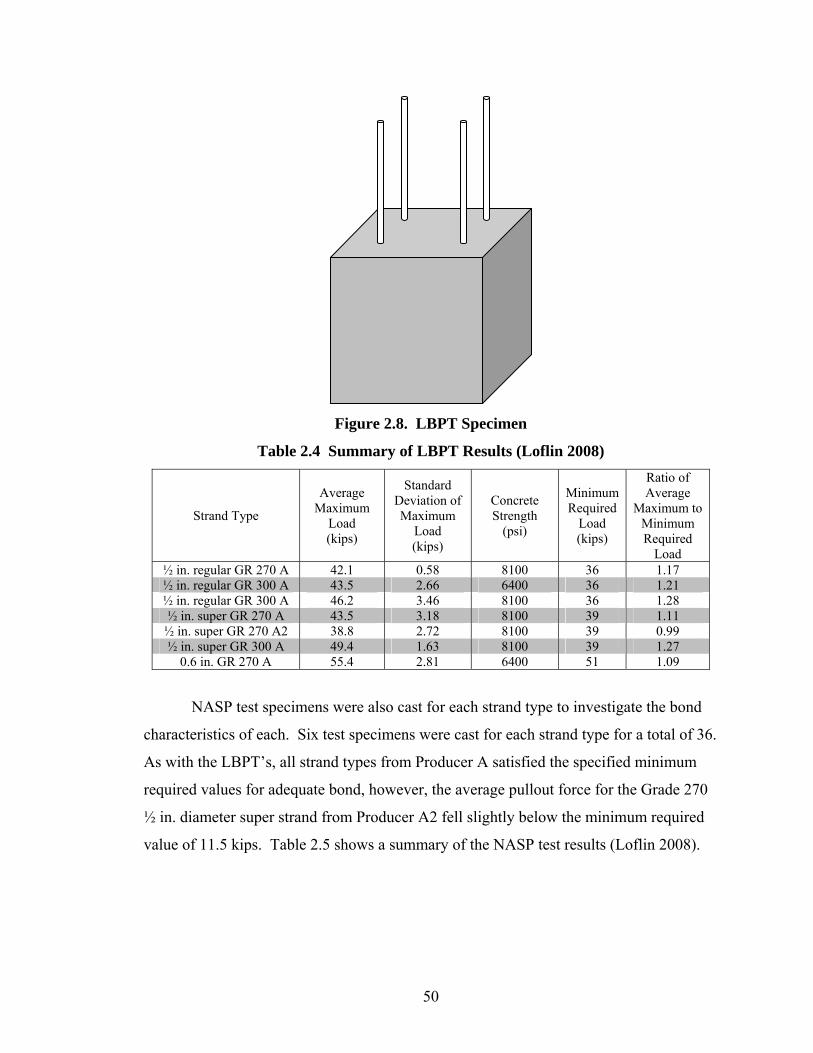
50
Figure 2.8. LBPT Specimen
Table 2.4 Summary of LBPT Results (Loflin 2008)
Strand Type
Average Maximum
Load (kips)
Standard Deviation of Maximum
Load (kips)
Concrete Strength
(psi)
Minimum Required
Load (kips)
Ratio of Average
Maximum to Minimum Required
Load ½ in. regular GR 270 A 42.1 0.58 8100 36 1.17 ½ in. regular GR 300 A 43.5 2.66 6400 36 1.21 ½ in. regular GR 300 A 46.2 3.46 8100 36 1.28 ½ in. super GR 270 A 43.5 3.18 8100 39 1.11 ½ in. super GR 270 A2 38.8 2.72 8100 39 0.99 ½ in. super GR 300 A 49.4 1.63 8100 39 1.27
0.6 in. GR 270 A 55.4 2.81 6400 51 1.09
NASP test specimens were also cast for each strand type to investigate the bond
characteristics of each. Six test specimens were cast for each strand type for a total of 36.
As with the LBPT’s, all strand types from Producer A satisfied the specified minimum
required values for adequate bond, however, the average pullout force for the Grade 270
½ in. diameter super strand from Producer A2 fell slightly below the minimum required
value of 11.5 kips. Table 2.5 shows a summary of the NASP test results (Loflin 2008).

51
Table 2.5. Summary of NASP Test Results (Loflin 2008)
Strand Average NASP Value (kips)
Grout Strength (psi)
Normalized NASP Value
(kips)
Required NASP Value
(kips)
Ratio of Normalized to
Required Value½ in. regular GR 270 A 14.6 4500 14.6 10.5 1.39 ½ in. regular GR 300 A 12.5 4300 12.7 10.5 1.21 ½ in. super GR 270 A 14.0 4400 14.2 11.5 1.23 ½ in. super GR 270 A2 10.0 4000 10.6 11.5 0.92 ½ in. super GR 300 A 14.6 4500 14.6 11.5 1.27
0.6 in. GR 270 A 16.6 4300 16.9 12.6 1.34
2.6 Top-strand Effect
As previously discussed, the as-cast vertical location of standard reinforcing bars
has been shown by numerous researchers to influence development length. Known as the
top-bar effect, it is generally understood that a larger amount of concrete cast below a
horizontal bar will increase this effect. The top-bar effect is attributed to a decrease in
concrete strength due to the upward migration of water toward the top of a specimen
during the curing process and the effect of aggregate settlement underneath a horizontally
cast bar, allowing lighter elements, such as cement, water, and entrapped air to rise to the
top of the specimen. Settlement of the concrete is also thought to occur underneath the
top-bars as a result of aggregate settlement. However, research has shown aggregate
settlement to only occur under vibration, as the aggregate does not sink in typical
concrete mixtures (Petrou et al. 2000a).
A top-bar is defined by ACI as a horizontal bar cast with more than 12 in. of fresh
concrete beneath the bar (Jeanty et al. 1988). On the contrary, the EUROCODE (1992-1-
1) defines a top-bar as a bar in the top half of a member with a thickness of more than 10
in. or within the top 12 in. of a member more than 24 in. in depth. The top-bar effect has
been recognized since 1913 with modification factors first implemented in the 1951 ACI
Building Code based on research by Clark (1946). For bond applications, the 1951 Code
used allowable bond stresses, with a 0.7 modification factor applied to the allowable
bond stress of top-cast bars. In the 1971 ACI Building Code, the allowable stress
calculations were replaced by a development length equation. In addition to the
development length equation, the top-bar modification factor was modified to be 1.4,
resulting in a 40 percent increase in development length, analogous to the 30 percent
reduction in bond strength from the 0.7 modification factor.

52
In the 1989 ACI Building Code , the modification factor was again revised,
reducing from 1.4 to 1.3 based on research by Jirsa and Breen (1981) and Jeanty et al.
(1988), while AASHTO retained the 1.4 modification factor for use in its designs. Jirsa
and Breen recommended development length modification factors vary with concrete
slump, while Jeanty et al. (1988) simply recommended a top-bar factor of 1.20 based on
research performed on test specimens as shown in Figure 2.9. They also noted that the
top-cast specimens displayed flexural cracking at lower loads than the counterpart
bottom-cast specimens, indicating a reduction in concrete strength at the top of the
casting.
a
b
b
a
Normal Orientation Inverted Orientation
a
b
b
a
Normal Orientation Inverted Orientation
Figure 2.9. Jeanty et al. General Test Specimen Orientation
The current ACI provisions only consider the top-bar effect in the development
length calculations for standard reinforcing steel, although the top-bar effect has been
shown to exist in prestressed applications as well. In a review of development length
research by the FHWA, Buckner noted that the top-bar effect, referred to as the top-
strand effect in prestressed concrete, could influence the development length of
prestressing strand. Buckner further recommends that development lengths of strands
cast with more than 12 in. of concrete beneath them be increased by a factor of 1.3
similar to the current provisions for the development length of standard reinforcing bars
(Buckner 1995).
In the late 1990’s the South Carolina Department of Transportation (SCDOT)
reported excessive strand end-slip values in prestressed concrete piles, with top-strands
slipping as much as 1.5 in., significantly greater than estimated values of 0.1 in. In
response to the SCDOT discovery, a research project on prestressed concrete piles was

53
undertaken, investigating the top-strand effect in prestressed concrete piles. The ratios of
top-strand end-slip measurements to bottom-strand end-slip measurements in 24 in.
prestressed concrete piles ranged between 1.15 and 5.15 with an average ratio of 2.12.
The influence of concrete strength was one factor thought to contribute to the excessive
end-slip measurements as concrete strength in the top portion of members is thought to be
reduced as a result of aggregate settlement during vibration. It was recommended that
the 1.3 modification factor used for the development length of standard reinforcing bars
also be applied to prestressing strand considered as top-strands (Petrou et al. 2000b).
Subsequent research showed similar trends, resulting in an average top-strand
end-slip of 0.140 in. and an average bottom-strand end-slip of 0.058 in., much less than
previously reported values, but still in excess of typical accepted values. Ratios of end-
slip measurements between top and bottom strands ranged from 1.17 to 3.36, verifying
the presence of the top-strand effect (Wan et al. 2002a). In a later paper, the presence of
retarder and confining reinforcement were mentioned as influential factors on top-strand
effect. The use of spiral reinforcement may prevent adequate consolidation of the
concrete around the top-strands (Wan et al. 2002b). In addition to the work on
prestressed concrete piles, recent work by Larson et al. (2007) has shown transfer and
development lengths in beams to increase for strands with more than 12 in. of fresh
concrete cast beneath them.
For decades, the top-bar effect has been understood to be solely dependent on the
amount of concrete cast beneath the bar. Research has shown the phenomenon to
regularly occur in reinforced concrete (top-bar effect) and within the past ten years, has
appeared to significantly impact the transfer and development length of prestressing
strand (top-strand effect). A recent study has shown the top-strand effect to be more
dependent on the amount of concrete cast above the strand rather than the amount of
concrete cast below the strand, which has brought about concern regarding the historical
definition of the top-bar/top-strand effect (Peterman 2007). Peterman investigated “The
Effects of As-Cast Depth and Concrete Fluidity on Strand Bond” looking at the effects of
vertical strand location and the use of high fluidity mixes, namely SCC, have on the
transfer and development length of prestressing strand.

54
In order to investigate the effect of vertical casting position on transfer length,
Peterman conducted a series of tests on rectangular blocks as shown in Figure 2.10. The
test specimens allowed for a head-to-head comparison of the effect the amount of
concrete cast above and below the strand had on transfer length. Both blocks were 12 ft
in length and were 4 in. wide, containing no confining reinforcement. Block A was 28 in.
tall, while Block B was only 16 in. tall. Using this type of test setup, the transfer lengths
of the bottom three strands in Block A could be compared to the three strands in Block B,
looking at the strands with the same amount of concrete cast below. In addition, the test
setup also allowed for the comparison of the transfer lengths of the top three strands in
Block A to the three strands in Block B, looking at strands with the same amount of
concrete cast above. Results showed strands with the same amount of concrete cast
above to have a better correlation than strands with the same amount of concrete cast
below. In conclusion, Peterman recommended Equation (2-18) calculating the average
transfer length, taking into consideration the distance from the as-cast top surface.
Concurring with previous research, Peterman found transfer lengths in strands located in
the top portion of test specimens to far exceed the provisions of ACI and AASHTO.
12 ft 12 ft
Block A Block B
28”
4”
2”
6”
6”
6”
6”
2”
2”
6”
6”
2”
16”
4”
12 ft 12 ft
Block A Block B
28”28”
4”
2”
6”
6”
6”
6”
2”
2”
6”
6”
2”
16”16”
4”
Figure 2.10. Peterman Test Setup (Peterman 2007)

55
For dcast < 8” ( )90 90 5t cast bL d d= −
For dcast ≥ 8” 50t bL d= Eq. (2-18)
The as-cast vertical locations of standard reinforcing steel and prestressing strand
have been shown to significantly influence the bond between the steel and surrounding
concrete resulting in longer development lengths. ACI and AASHTO currently have
modification factors for the development length of standard reinforcing steel, but fail to
recognize the influence of vertical casting position in the calculation of strand transfer
and development lengths. A number of researchers have recommended modification
factors similar to those used with standard reinforcing steel, and have yet to see any
implementation. Recent research has challenged the historical definition of the top-
bar/top-strand effect, concluding it is more dependent on the amount of concrete cast
above the steel than below it. Regardless of the definition, the top-strand effect is of
particular interest in the prestressed concrete industry, resulting in the need for additional
research as well as more investigations focused on the determination of the actual top-
bar/top-strand effect definition.
2.7 Grade 300 Strand
In the prestressed concrete industry, Grade 270 low-relaxation prestressing strand
has been the industry standard for decades. ASTM A416 specifies that the ultimate stress
for all tests completed on a Grade 270 strand must be no less than 270 ksi. It is also
specified that the minimum yield stress be no less than 90 percent of the required ultimate
stress at a strain of 0.01 in./in. and the ultimate elongation be at least 3.5 percent (A416-
05/A416M-05 2005). There are currently no provisions for the Grade 300 strand;
however, the ASTM limits were used as guidelines during material testing, thus the
minimum required ultimate stress for a Grade 300 strand is 300 ksi, which corresponds to
a minimum yield stress of 270 ksi at a strain of 0.01 in./in. The ultimate elongation limit
of 3.5 percent was still used with the Grade 300 strand (Loflin 2008).
Material testing focused on a the development of the full stress/strain relationship
for both the Grade 270 and Grade 300 strand used throughout this study. Table 2.6
shows a summary of the results for yield stress, ultimate stress, and ultimate elongation,
which were used to create stress-strain curves for each strand type, and was used in the
calculation of nominal moment capacities for beams tested in flexure.

56
Table 2.6. Summary of Material Testing Results (Loflin 2008)
Strand Average
Yield Stress (ksi)
Average Ultimate
Stress (ksi)
Average Ultimate
Elongation ½ in. regular GR 270 A 248 279 7.5% ½ in. regular GR 300 A 270 301 7.1% ½ in. regular GR 300 B 275 296 6.3% ½ in. super GR 270 A 239 268 7.2% ½ in. super GR 270 A2 236 273 7.4% ½ in. super GR 300 A 270 296 7.2%
0.6 in. GR 270 A 242 276 7.5%
Equation (2-42) was used to create an idealized stress-strain curve for Grade 270
low relaxation ½ in. diameter prestressing strand and was developed based on the results
from 28 individual tensile tests. The coefficients, A, B, C, and D used in the equation
were calculated to be 887, 27613, 112.4, and 7.360, respectively for those specific tests.
It was noted that a large number of significant figures are necessary because the values of
strand stress are sensitive to these constants (Devalapura and Tadros 1992). The
coefficients used in the development of the stress-strain curves for strand used in this
study were also calculated and are listed in Table 2.7.
Table 2.7. Constants for Stress-Strain Power Formulas (Loflin 2008)
Strand A B C D ½ in. regular GR 270 A 375.2 30162 118.2 5.306 ½ in. regular GR 300 A 366.4 34132 122.5 5.466 ½ in. regular GR 300 B 195.6 34224 120.2 5.148 ½ in. super GR 270 A 410.6 35730 147.6 4.163 ½ in. super GR 270 A2 448.9 25454 104.0 8.082 ½ in. super GR 300 A 226.6 33078 117.8 5.427
0.6 in. GR 270 A 448.7 28845 116.6 6.905
( )( )
1
1ps ps pu
D D
ps
Bf A fC
εε
⎡ ⎤⎢ ⎥
= + ≤⎢ ⎥⎢ ⎥+⎢ ⎥⎣ ⎦
Eq. (2-42)

57
2.8 Flexural Strength
The flexural strength of a member, also referred to as the nominal moment
capacity, is a member’s ability to resist externally applied moments with equal and
opposite internal forces, again shown for a reinforced concrete member in Figure 2.11.
The internal resultant compressive force is provided by the concrete and is calculated by
integrating under the concrete stress distribution and multiplying by the appropriate
width, essentially calculating a volume represented by the red shape. The internal
resultant tensile force is provided by the steel and is calculated by multiplying the stress
in the steel by the area of the steel, again essentially calculating a volume represented by
the blue shape. The nominal moment capacity is equal to the internal couple produced by
the two resultant forces. Various techniques can be used to calculate the flexural strength
of the member and are based on some key assumptions (MacGregor and Wight 2005).
1. Plane sections before bending remain plane after bending.
2. The strain in the steel is equal to the strain in the concrete at the level of the steel
(perfect bond).
3. The stresses in the concrete and steel can be computed from the strain using the
stress-strain relationship for each material.
4. Concrete has no tensile strength.
With these assumptions made, the flexural strength of a member can be
determined using various techniques. Both ACI and AASHTO have simplified
calculation methods with AASHTO used in this study for comparative purposes.
However, other techniques, such as strain compatibility can more accurately predict the
behavior of a flexural member.

58
As
fs ≤ fy
b
c
f’c
As
fs ≤ fy
b
c
f’c
Figure 2.11. Internal Forces of a Reinforced Concrete Beam
The stress-strain relationship of concrete can be modeled in a variety of ways.
Experimental tests have shown concrete to have a somewhat parabolic stress-strain
behavior, which is idealized by two Hognestad models shown as Figure 2.12 (a) and 2.12
(b) (Park and Paulay 1975). In an effort to simply the calculation process, the stress-
strain relationship for concrete is at times idealized with a bilinear relationship as shown
in Figure 2.12 (c). In addition to those in Figure 2.12, an even more simplified approach
is the equivalent rectangular stress block, used by ACI and AASHTO, where an average
constant stress distribution is used over a specified depth, rather than the actual parabolic
or idealized stress distribution.

59
fc
εc
fc
εc
fc
εc
fc
εc
fc
εc
fc
εc
(a) (b) (c)
Figure 2.12. Concrete Stress-Strain Relationships
The stress-strain relationship of prestressing steel can also be modeled in a variety
of ways. Experimental tests have shown both standard reinforcing steel and prestressing
steel to have a linear relationship as the stress approaches yield. ACI limits the stress-
strain relationship of standard reinforcing steel to be bilinear as shown in Figure 2.13 (a),
neglecting any effect of strain hardening. Prestressing steel on the other hand can be
modeled using either relationship shown in Figure 2.13 (b) and 2.13 (c). Figure 2.13 (b)
shows a bilinear stress-strain relationship, while Figure 2.13 (c) shows the actual stress-
strain relationship for prestressing steel. Both ACI and AASHTO have relationships for
the calculation of the stress in the strand at the nominal moment capacity, shown as
Equation (2-43) and Equation (2-44), respectively. fs
εc
fs
εc
fs
εc
fs
εc
fs
εc
fs
εc
(a) (b) (c)
Figure 2.13. Steel Stress-Strain Relationships
( )''
1
1 p pups pu p
c p
f df ff d
γρ ω ω
β
⎧ ⎫⎡ ⎤⎪ ⎪= − + −⎢ ⎥⎨ ⎬⎢ ⎥⎪ ⎪⎣ ⎦⎩ ⎭
Eq. (2-43)
1ps pup
cf f kd
⎛ ⎞= −⎜ ⎟⎜ ⎟
⎝ ⎠ Eq. (2-44)
60
Historically, nominal moment capacities have been calculated using the ACI and
AASHTO provisions for comparative purposes in research. When predicting the actual
flexural behavior, a more detailed approach is typically taken, using strain compatibility,
taking into consideration the actual stress-strain behavior of the concrete and the steel. In
addition to the stress-strain relationships discussed herein, an additional factor sometimes
needing consideration in theoretical models is confinement of the concrete depending on
the experimental testing method.
2.9 Summary
ACI and AASHTO currently have provisions for the calculation of transfer and
development length. The current provisions have been in place for over five decades,
while numerous advancements have been made in both prestressing steel and concrete.
However, over the past few decades, a number of researchers have shown those equations
to be unconservative. Research has shown multiple factors to affect transfer and
development length that are not taken into consideration by the current code provisions,
including the concrete strength and as-cast vertical location of the strand. Various
equations have included either the concrete strength or as-cast vertical location, but an
equation still fails to exist that incorporates all affecting factors at once.
In addition to the increase in knowledge regarding transfer and development
length, materials have also advanced. With the development of the newer Grade 300
prestressing strand also come a number of questions surrounding its behavior in flexural
members. Those questions include the effects of strand strength on transfer length,
development length, and flexural capacity. To the knowledge of the author, research has
not been completed on the Grade 300 strand prior to this study. There is a need for
further verification of the behavior of the Grade 300 strand and the applicability of
current code provisions for its implementation.

61
3.0 METHODOLOGY
3.1 Test Specimen Design
The scope of this project focused on the fabrication and testing of two specimen
types in the investigation of the transfer length, development length, top-strand effect,
and flexural strength for both Grade 270 and Grade 300 prestressing strands. The
objective of the first portion of the investigation was to compare the behavior of test
specimens containing the newer Grade 300 strand to those containing the traditional
Grade 270 strand, which required the fabrication of twenty, 24 ft long T-beam test
specimens. The objective of the second portion of the investigation was to study the top-
strand effect which required the fabrication of four sets of top-strand blocks similar to
those used in a previous investigation by Peterman (2007). Overall, 36 individual test
specimens were constructed and tested in the Structures and Materials Laboratory at
Virginia Tech from August 2005 to September 2008. Table 3.1 breaks down the test
specimens into the groups in which they were constructed.
Table 3.1. Test Specimen Breakdown
Pour No. of Specimens Strand Type Strand Grade fsi Description
1 2 0.5 in. 270 ksi 300 ksi 0.67*fpu T-beams
2 4 0.5 in. 270 ksi 300 ksi 0.67*fpu T-beams
3 4 0.5 in. super 270 ksi 300 ksi 0.67*fpu T-beams
4 2 0.5 in. super 270 ksi 300 ksi 0.67*fpu T-beams
5 4 0.5 in. super 270 ksi 300 ksi 0.75*fpu T-beams
6 2 2
0.5 in. super 0.6 in. 270 ksi 0.75*fpu T-beams
1 4 0.5 in. 270 ksi 0.75*fpu Top-strand blocks 2 4 0.5 in. 270 ksi 0.75*fpu Top-strand blocks 3 4 0.5 in. super 270 ksi 0.75*fpu Top-strand blocks 4 4 0.5 in. super 270 ksi 0.75*fpu Top-strand blocks
The T-beam specimens were 24 ft long, allowing for two flexural tests per
specimen. The specimens included a transfer zone at each end of each specimen, which
provided a total of 40 transfer zones. One of the transfer zones was lost due to a flash

62
setting of the concrete while casting the specimen. Of the twenty T-beam test specimens,
the size of the cross-section varied with strand type: including low-relaxation ½ in.
diameter regular, ½ in. diameter super, and 0.6 in. diameter strands each having a cross-
sectional area of 0.153 in.2, 0.167 in.2, and 0.217 in.2, respectively. With an increase in
cross-sectional area, also comes an increase in the initial prestress force. Therefore, the
prestress force in the beams containing 0.6 in. diameter strands was significantly higher
than in those containing ½ in. diameter super strands and the prestress force in beams
containing ½ in. diameter super strands was significantly higher than in those containing
½ in. diameter regular strands. For this reason, the size of the cross section varied with
the strand type. In addition to the strand type, the size and shape of the cross-section was
also influenced by the desired tensile strain in the strand at the ultimate flexural capacity
of the member. Tests have shown development length to be dependent on the strain in
the strand at the time of failure, thus as recommended by Buckner (1995), the cross
section was designed such that the strain in the strand at the ultimate flexural capacity
would be greater than the minimum required elongation of 3.5 percent. The relatively
wide flanges of the T-beam specimens reduced the depth to the neutral axis, resulting in a
high level of strain in the prestressing strands as recommended. The increase in tensile
strain also provided a high level of ductility in the test specimens. The three cross
sections used throughout the project are shown in Figure 3.1, while the section properties
are shown in Table 3.2. The small, medium, and large beams each contained ½ in.
diameter regular, ½ in. diameter super, and 0.6 in. diameter strands, respectively.
Figure 3.1. T-beam Cross-sections
30 in.
4 in.
5 in.
24 in.
2 in.
8 in.
Large
3 in.
19 in.
2 in.
4 in.
24 in.
Medium 8 in.
24 in.
2 in.
17 in.
2 in.
4 in.
Small 8 in.
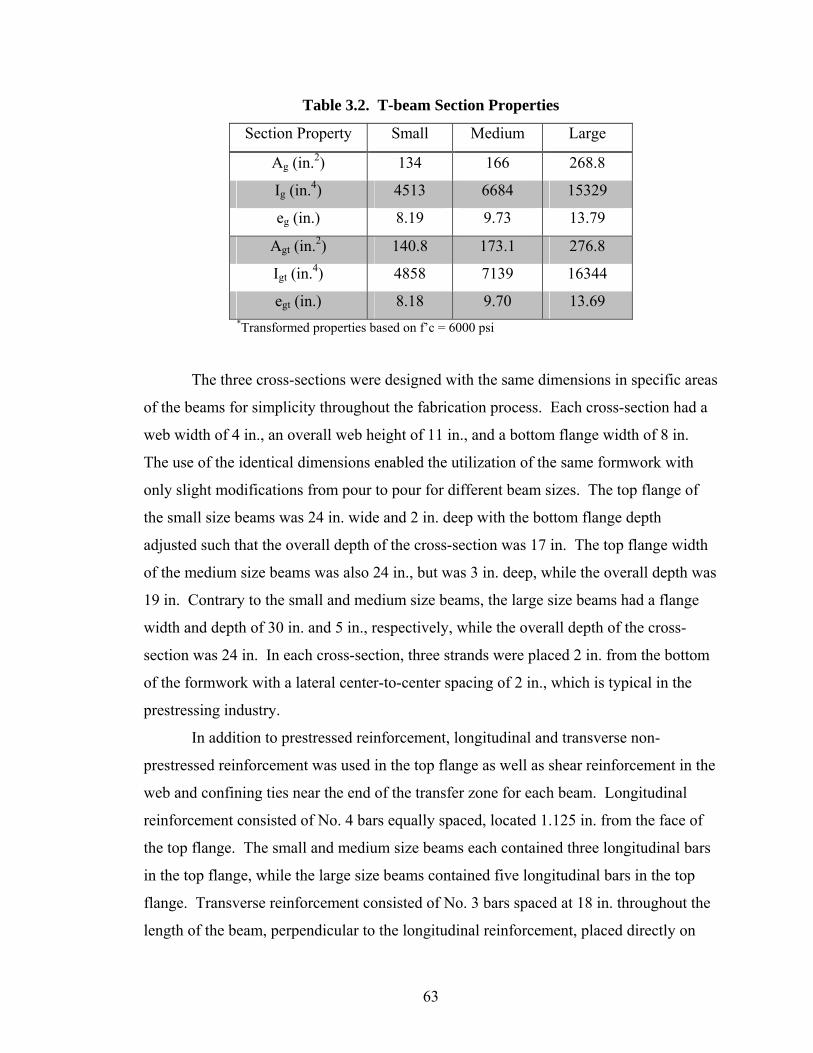
63
Table 3.2. T-beam Section Properties
Section Property Small Medium Large
Ag (in.2) 134 166 268.8
Ig (in.4) 4513 6684 15329
eg (in.) 8.19 9.73 13.79
Agt (in.2) 140.8 173.1 276.8
Igt (in.4) 4858 7139 16344
egt (in.) 8.18 9.70 13.69 *Transformed properties based on f’c = 6000 psi
The three cross-sections were designed with the same dimensions in specific areas
of the beams for simplicity throughout the fabrication process. Each cross-section had a
web width of 4 in., an overall web height of 11 in., and a bottom flange width of 8 in.
The use of the identical dimensions enabled the utilization of the same formwork with
only slight modifications from pour to pour for different beam sizes. The top flange of
the small size beams was 24 in. wide and 2 in. deep with the bottom flange depth
adjusted such that the overall depth of the cross-section was 17 in. The top flange width
of the medium size beams was also 24 in., but was 3 in. deep, while the overall depth was
19 in. Contrary to the small and medium size beams, the large size beams had a flange
width and depth of 30 in. and 5 in., respectively, while the overall depth of the cross-
section was 24 in. In each cross-section, three strands were placed 2 in. from the bottom
of the formwork with a lateral center-to-center spacing of 2 in., which is typical in the
prestressing industry.
In addition to prestressed reinforcement, longitudinal and transverse non-
prestressed reinforcement was used in the top flange as well as shear reinforcement in the
web and confining ties near the end of the transfer zone for each beam. Longitudinal
reinforcement consisted of No. 4 bars equally spaced, located 1.125 in. from the face of
the top flange. The small and medium size beams each contained three longitudinal bars
in the top flange, while the large size beams contained five longitudinal bars in the top
flange. Transverse reinforcement consisted of No. 3 bars spaced at 18 in. throughout the
length of the beam, perpendicular to the longitudinal reinforcement, placed directly on

64
top of the longitudinal reinforcement. The shear reinforcement varied among the three
cross-sections and was dependent upon the nominal moment capacity of each beam, with
the maximum shear force calculated under the assumption each beam would reach its full
nominal moment capacity during flexural testing. Applied loads were expected to be as
close to the supports as 4 ft, which would result in significantly high shear forces in the
end region of the beams. Modified compression field theory was used for the calculation
of the concrete component of shear resistance (Collins et al. 1996). As for the steel
component of shear resistance, No. 3 and No. 4 single leg stirrups were used with
spacings adjusted accordingly. The small size beams contained No. 4 single leg stirrups
placed every 4 in. over a distance of 8 ft from each end of each beam, while the middle 8
ft contained No. 3 single leg stirrups placed every 8 in. The medium size beams also
contained No. 4 single leg stirrups placed every 4 in. in the end portions of the beams,
however, No. 4 single leg stirrups were also used in the middle portion of the beam at a
spacing of 8 in for added simplicity during the fabrication process. The large size beams
were capable of supporting significantly higher loads, resulting in smaller stirrup
spacings. The large beams contained No. 4 single leg stirrups placed every 3 in. over the
end two-thirds of the beams, while the middle third contained No. 4 single leg stirrups
placed every 6 in.
Single leg stirrups were selected because ACI spacing and cover requirements
cannot be satisfied using double leg stirrups within a 4 in. web, considering a minimum
inside bend diameter of 4db. Use of double leg stirrups would have provided
approximately ½ in. cover on each side, which is greater than the required cover of ⅜ in.
specified by ACI, but that is assuming a perfectly bent stirrup, which was typically not
the case. With such small tolerances, single leg stirrups were selected to ensure adequate
cover of the shear reinforcing. It was desirable for the single leg stirrups to be located in
the center of the web; however, this was not possible due to the location of the middle
longitudinal bar forcing the leg of the stirrups to be slightly off-centered. For this reason,
stirrups were alternately placed on each side of the middle longitudinal bar and slightly
turned throughout the length of each beam, locating the leg of each stirrup as close to the
web center as possible providing a symmetric layout of reinforcement as shown in Figure
3.2. In addition to longitudinal, transverse, and shear reinforcement, confining ties were

65
also placed at each end of each beam. Three triangular ties were placed within 1 ft of the
end of each beam to prevent bursting during the transfer process. Figure 3.3 shows the
typical reinforcement layout for the medium size beams.
Figure 3.2. Stirrup Placement
Figure 3.3. Typical Reinforcement Layout
The twenty T-beam test specimens were cast is six groups, each designated by
pour, from Pour 1 to Pour 6. Each of the six groups included two types of strands, with

66
variations in cross-section and casting orientation from pour to pour. Cross-section
variations were dependent on the strand type under investigation for a specific pour and
the casting orientation was used to further investigate the influence of the top-strand
effect on transfer and development length of flexural members. In an effort to investigate
the top-strand effect, eight of the T-beam test specimens were cast up-side-down
(inverted). Casting of the test specimens with an inverted orientation resulted in more
than 12 in. of fresh concrete beneath the strand, which categorizes a strand as a “top-
strand” based on the definition provided in the 2008 ACI Building Code for top
reinforcing bars. Inverted orientations of small, medium, and large size beams resulted in
respective depths of concrete cast beneath the strands of 15 in., 17 in., and 22 in., while
maintaining a constant depth of 2 in. of concrete cast above the strand. In pours
containing inverted beams, each inverted beam was cast on the same line of strands in
succession with a counterpart beam having a normal orientation. This ensured a direct
head-to-head comparison of beams cast with normal and inverted orientations. In
addition to a head-to-head comparison, the variations in depths of concrete cast beneath
the strands coupled with the constant depth of concrete cast above the strands also led to
an analysis of the results with respect to reports claiming the top-strand effect to be
dependent on the amount of concrete cast above the strand rather than the amount of
concrete cast beneath the strand.
The small size beams were cast in Pours 1 and 2, containing ½ in. diameter
regular strands stressed to an initial prestress of 0.67fpu. Pour 1 included two beams, one
containing Grade 270 strands and one containing Grade 300 strands, both of which were
cast with a normal orientation. Pour 2 included four beams, two containing Grade 270
strands and two containing Grade 300 strands. Of the four beams, one beam for each
strand type was cast with an inverted orientation. The medium size beams were cast in
Pours 3, 4, and 5 containing ½ in. diameter super strands. Strands from Pours 3 and 4
were stressed to an initial prestress of 0.67fpu, while strands from Pour 5 were stressed to
an initial prestress of 0.75fpu. Pours 3 and 5 contained four beams, two in each containing
Grade 270 strands and two in each containing Grade 300 strands, while Pour 4 contained
only two beams, one cast with Grade 270 strands and one cast with Grade 300 strands.
Both beams cast in Pour 4 were cast with a normal orientation, while one containing each

67
strand type was cast with an inverted orientation in Pours 3 and 5. Pour 6 differed
slightly as it contained two different sizes of strand (½ in. diameter super and 0.6 in.
diameter) having the same strength, Grade 270, due to the inability of obtaining 0.6 in.
diameter Grade 300 strand from the strand manufacturer. As with previous pours, each
type of strand was used in two beams, one of each cast with an inverted orientation, all of
which were cast with an initial prestress of 0.75fpu. In order to distinguish each
individual transfer length measurement location, a unique identification scheme was
created, with an example shown in Figure 3.4. The identification scheme designates
pour, strand grade, strand size, casting orientation, beam end, and beam side. It should be
noted that the beam side is dependent on the beam end. The right and left sides of each
beam are denoted by looking from the live, or cut end, towards the dead end.
Figure 3.4. Identification Scheme
The top-strand block test specimens, similar to those used by Peterman (2007),
were cast in groups of four blocks, each containing one large block, one small block, and
two control blocks. The large block was 12 ft long, 24 in. tall and 4 in. wide. The small
block was 12 ft long, 14 in. tall and 4 in. wide, and the two control blocks were 12 ft long
and had a 4 in. by 4 in. cross-section. The 24 in. tall block was referred to as Block A
and the 14 in. tall block was referred to as Block B, while the two 4 in. by 4 in. blocks
were referred to as the control blocks. The design of the test specimens allowed for a
dual comparison of transfer length for strands having the same amount of concrete cast
above or below each. In the blocks used by Peterman, a vertical spacing of 6 in. was
1.270.5N.RALPour No. 1 = Pour One 2 = Pour Two 3 = Pour Three 4 = Pour Four 5 = Pour Five 6 = Pour Six
Strand Grade 270 = Grade 270 300 = Grade 300
Strand Size 5N = 0.5 in. Diameter; 0.153 in.2 Area 5S = 0.5 in. Diameter; 0.167 in.2 Area 6N = 0.6 in. Diameter; 0.217 in.2 Area
Casting Orientation R = Right Side-Up U = Upside Down
Beam End A = Live End B = Dead End
Beam Side L = Left Side R = Right Side

68
used in between strands, while the blocks used in this investigation had a vertical spacing
of 5 in. due to limitations of the existing stressing abutments. Block A contained five
strands, Block B contained three strands, and each control block contained a single
concentric strand. Figure 3.5 shows the strand layout for Blocks A and B. The strands
located within Block A were labeled A – E from top to bottom and the strands in Block B
were labeled F – H from top to bottom, while the strand in the two control specimens was
labeled I and J (same strand in two control blocks placed in succession). Table 3.3 lists
each strand and the amount of concrete cast above and below the strand.
Figure 3.5. Top-strand Blocks
12 ft 12 ft Block A Block B
24”
4”
2”5”
5”
5”
5”2”
2” 5”
5” 2”
14”
4”
A
B
C
D
E
F
G
H

69
Table 3.3. Amount of Concrete Cast Above and Below Strands
Block Strand Distance from Top of Specimen (in.)
Distance from Bottom of Specimen (in.)
A 2 22 B 7 17 C 12 12 D 17 7
A
E 22 2 F 2 12 G 7 7 B H 12 2
C* I 2 2 C* J 2 2
*C denotes Control Block
Of the four sets of top-strand blocks two variables were selected in addition to
strand location for the investigation, the water to cement ratio and the size of strand (½
in. diameter regular and ½ in. diameter super). Pours 1 and 2 contained ½ in. diameter
regular strands, while Pours 3 and 4 contained ½ in. diameter super strands. Although
the concrete compressive strength was chosen to remain constant for all top-strand block
specimens with a target release strength of 4500 psi and a target 28 day strength of 6000
psi, the water to cement ratios were varied to investigate the effect, if any, the amount of
water in each mix had on transfer length. Pours 1 and 3 each had a design water to
cement ratio of 0.40, while Pours 2 and 4 each had a design water to cement ratio of 0.45.
The mix designs are discussed in more detail in Section 3.5.
3.2 Fabrication of Test Specimens
The fabrication of all test specimens was completed in the Structures and
Materials Laboratory at Virginia Tech. In order to fabricate the pretensioned, prestressed
concrete beams, two prestressing beds were created on a portion of the reaction floor
inside the laboratory. The reaction floor consists of 60 ft long, 36 in. deep wide flange
steel girders fully embedded in concrete, two of which were used for the creation of the
prestressing beds. At each end of the two floor beams, one of four steel abutments was
bolted to the floor beam as shown in Figure. 3.6.

70
Figure 3.6. Stressing Abutment
Since the test specimens were cast in a laboratory setting rather than by a precast
manufacturer, an effort was made to replicate as closely as possible the casting process
typically used in industry. The industry casting procedure usually entails stressing of the
strands during the first part of the day, followed by the addition of mild reinforcement,
and finally formwork prior to casting on the same day. In the laboratory setting, this
process is not feasible because of time constraints and lack of manpower; therefore, slight
modifications were made to the casting process. In addition to time constraints and lack
of manpower, the fabrication of the inverted beams also added to the complexity of the
overall process. For the purposes of direct comparisons of normal and inverted beams, it
was desirable for each beam cast with a normal orientation to have a nearly identical
counterpart beam cast with an inverted orientation. As previously mentioned, two types
of strand were used with each set of beams, each on a corresponding floor beam,
typically with one beam having a normal orientation and one beam having an inverted
orientation. In order to fabricate beams with normal and inverted orientations along the
same line of strands, the beams with a normal orientation were elevated. Figure 3.7
shows the plan view of a typical pour along with sections of both beam orientations.

71
Figure 3.7. Plan View of Typical Pour Layout
The fabrication process for the T-beams generally took about four weeks from
initial setup to prestress transfer with the assembly of formwork being the first step. The
formwork for the T-beam specimens included four parts, base boards, L-shaped side
forms, flange forms, and Styrofoam. Each L-shaped side form was 8 ft long and was
constructed of 2x4 studs, ¾ in. plyform, and sheetrock screws. Three of the L-shaped
side forms were joined together for each side prior to casting and remained together
throughout the duration of the fabrication process. A number of problems arose with the
L-shaped side forms, which are discussed with more detail in Section 3.3. The base
boards were also 8 ft long, three of which were spliced together for a total length of 24 ft
at the beginning of the formwork assembly. For the beams cast with a normal
orientation, the L-shaped side forms were then joined to the base boards, held in place by
sheetrock screws. Steel angles were then attached to the top of the L-shaped side forms
and ¼ in. diameter threaded rods were placed through the angles later aiding in the
placement of reinforcement also providing added lateral strength during casting. The
prestressing strands were then placed through the formwork, unstressed, followed by
longitudinal reinforcing bars, placed by hanging the bars from the threaded rods, with the
lateral reinforcement later placed on top of the longitudinal bars. Stirrups were then
placed, hanging from the middle longitudinal bar, hooked underneath the middle
prestressing strand. Following the addition of the non-prestressed reinforcement,
A
A
B
B
Grade 300
Grade 270
A-A
B-B
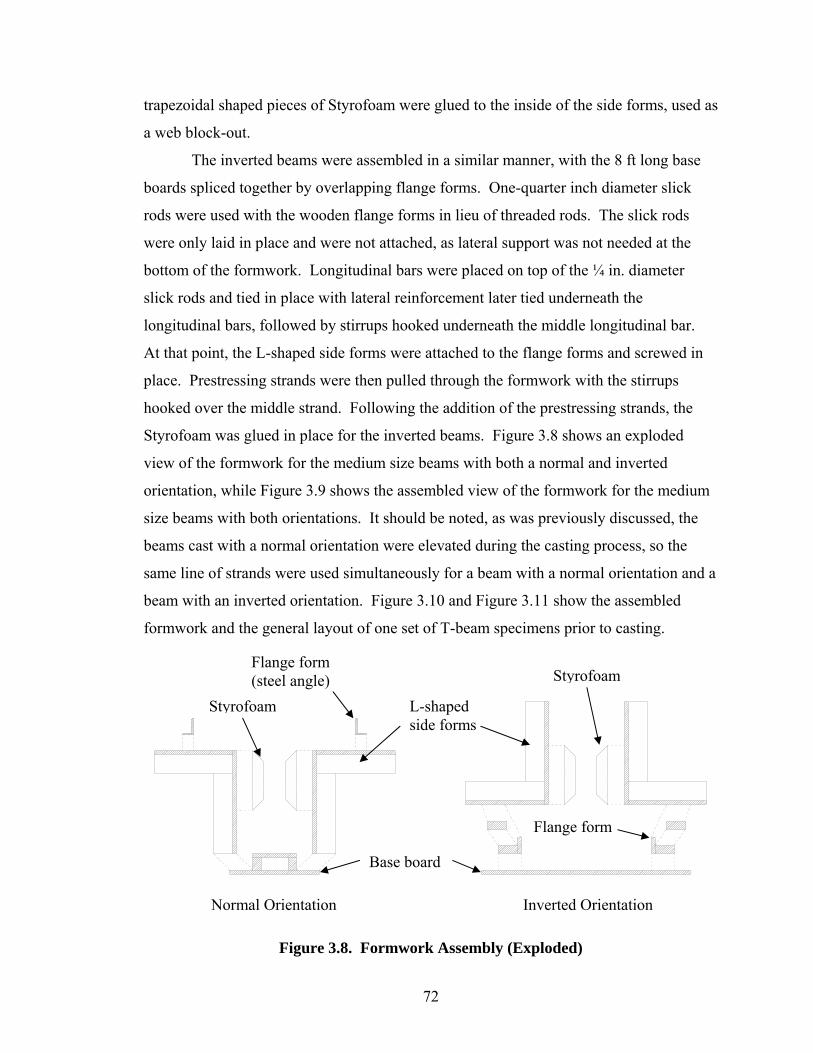
72
trapezoidal shaped pieces of Styrofoam were glued to the inside of the side forms, used as
a web block-out.
The inverted beams were assembled in a similar manner, with the 8 ft long base
boards spliced together by overlapping flange forms. One-quarter inch diameter slick
rods were used with the wooden flange forms in lieu of threaded rods. The slick rods
were only laid in place and were not attached, as lateral support was not needed at the
bottom of the formwork. Longitudinal bars were placed on top of the ¼ in. diameter
slick rods and tied in place with lateral reinforcement later tied underneath the
longitudinal bars, followed by stirrups hooked underneath the middle longitudinal bar.
At that point, the L-shaped side forms were attached to the flange forms and screwed in
place. Prestressing strands were then pulled through the formwork with the stirrups
hooked over the middle strand. Following the addition of the prestressing strands, the
Styrofoam was glued in place for the inverted beams. Figure 3.8 shows an exploded
view of the formwork for the medium size beams with both a normal and inverted
orientation, while Figure 3.9 shows the assembled view of the formwork for the medium
size beams with both orientations. It should be noted, as was previously discussed, the
beams cast with a normal orientation were elevated during the casting process, so the
same line of strands were used simultaneously for a beam with a normal orientation and a
beam with an inverted orientation. Figure 3.10 and Figure 3.11 show the assembled
formwork and the general layout of one set of T-beam specimens prior to casting.
Figure 3.8. Formwork Assembly (Exploded)
Normal Orientation Inverted Orientation
L-shaped side forms
Styrofoam
Flange form (steel angle)
Flange form
Base board
Styrofoam

73
Figure 3.9. Formwork Assembly (Assembled)
Normal Orientation Inverted Orientation
Figure 3.10. Formwork Prior to Casting
Figure 3.11. General Pour Layout
Normal Orientation Inverted Orientation
¼ in. threaded rod
¼ in. slick rod
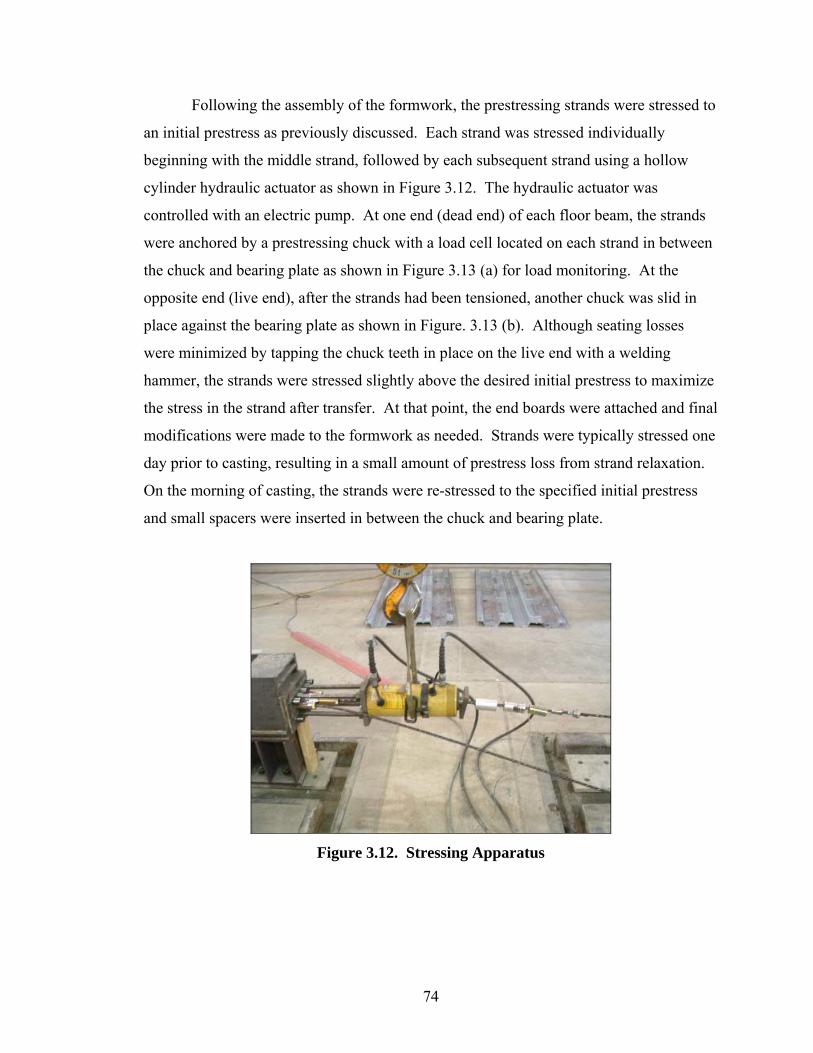
74
Following the assembly of the formwork, the prestressing strands were stressed to
an initial prestress as previously discussed. Each strand was stressed individually
beginning with the middle strand, followed by each subsequent strand using a hollow
cylinder hydraulic actuator as shown in Figure 3.12. The hydraulic actuator was
controlled with an electric pump. At one end (dead end) of each floor beam, the strands
were anchored by a prestressing chuck with a load cell located on each strand in between
the chuck and bearing plate as shown in Figure 3.13 (a) for load monitoring. At the
opposite end (live end), after the strands had been tensioned, another chuck was slid in
place against the bearing plate as shown in Figure. 3.13 (b). Although seating losses
were minimized by tapping the chuck teeth in place on the live end with a welding
hammer, the strands were stressed slightly above the desired initial prestress to maximize
the stress in the strand after transfer. At that point, the end boards were attached and final
modifications were made to the formwork as needed. Strands were typically stressed one
day prior to casting, resulting in a small amount of prestress loss from strand relaxation.
On the morning of casting, the strands were re-stressed to the specified initial prestress
and small spacers were inserted in between the chuck and bearing plate.
Figure 3.12. Stressing Apparatus

75
(a) (b)
Figure 3.13. Stressing Abutments
Subsequent to the assembly of the formwork and stressing of the strands, the test
specimens were cast beginning with the inverted beams. It was found to simplify the
casting process by casting the inverted beams first, as the workability of the concrete
decreased with time. The concrete used in the T-beam test specimens was provided by a
local ready mix batch plant and was internally vibrated during the casting process. The
top surface of each beam was leveled using a vibrating screed and later floated to obtain
the desired finish. Following casting, wet burlap was placed on each beam, covered with
plastic up to the point of transfer. During this time, the formwork was removed and
preparations made for transfer length measurements, which are discussed in Section 3.6.
The casting process for the top-strand blocks was very similar to that of the T-
beam specimens. The fabrication process generally took approximately two weeks from
initial setup to the transfer of prestress and formwork was again constructed in sections
prior to casting, consisting of three parts, the side forms, base boards, and end boards.
Each section of formwork was 12 ft long and was constructed of 2x4 studs, ¾ in.
plyform, and sheetrock screws, having various heights dependent upon block type. With
no additional reinforcement, the formwork assembly of the top-strand blocks was
relatively easy, usually taking two days. The side forms were attached to the base boards
with three or four sheetrock screws per side. The end boards were then screwed to the
end of the side forms and were used to square-up the formwork. Subsequent to the
addition of the end boards, additional screws were added to the connection of the side
forms and the base boards. As with the T-beam test specimens, ¼ in. diameter threaded
rods were used as cross-ties adding lateral restraint to the formwork during casting.

76
Following the formwork assembly, prestressing strands were pulled through the
formwork and prestressing abutments. Figure 3.14 shows an exploded view of the
formwork for the small and large blocks, while Figure. 3.15 shows the assembled view of
the formwork for both blocks. Figure 3.16 shows the general layout of the top-strand
blocks.
Figure 3.14. Top-strand Block Formwork Assembly (Exploded)
Figure 3.15. Top-strand Block Formwork Assembly (Assembled)
Small Block Large Block
Small Block Large Block
Base board
Side forms
¼ in. threaded rods
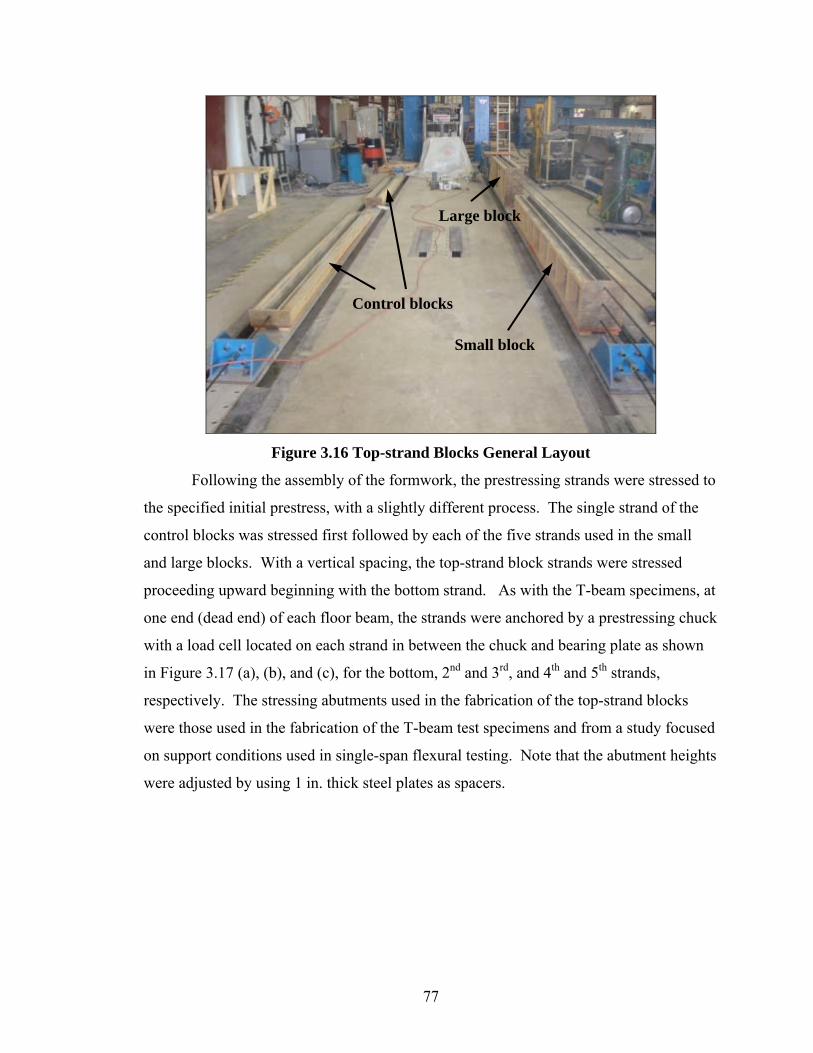
77
Figure 3.16 Top-strand Blocks General Layout
Following the assembly of the formwork, the prestressing strands were stressed to
the specified initial prestress, with a slightly different process. The single strand of the
control blocks was stressed first followed by each of the five strands used in the small
and large blocks. With a vertical spacing, the top-strand block strands were stressed
proceeding upward beginning with the bottom strand. As with the T-beam specimens, at
one end (dead end) of each floor beam, the strands were anchored by a prestressing chuck
with a load cell located on each strand in between the chuck and bearing plate as shown
in Figure 3.17 (a), (b), and (c), for the bottom, 2nd and 3rd, and 4th and 5th strands,
respectively. The stressing abutments used in the fabrication of the top-strand blocks
were those used in the fabrication of the T-beam test specimens and from a study focused
on support conditions used in single-span flexural testing. Note that the abutment heights
were adjusted by using 1 in. thick steel plates as spacers.
Control blocks
Small block
Large block

78
(a) (b) (c)
Figure 3.17. Top-strand Blocks Stressing Abutments
Because of existing abutment limitations, the abutments were used in sequence
along one floor beam. Figure 3.18 (a) shows the three abutments located at the dead end
(anchored end) of the test specimens, spaced approximately 12 to 18 in. apart. At the live
end (stressing end), shown in Figure 3.18 (b), the abutments were placed in the same
order, but with approximately six feet in between each abutment. A larger spacing was
used allowing adequate space for the stressing apparatus, previously shown in Figure
3.12, to fit in between abutments during the stressing of the bottom, and the 2nd and 3rd
strands from the bottom.
(a) (b)
Figure 3.18. Layout of Stressing Abutments for Top-strand Blocks
Contrary to the T-beam test specimens, the concrete used in the fabrication of the
top-strand blocks was mixed in the laboratory to ensure a higher level of quality control

79
of the mix proportions. The total volume used in the fabrication of each set of top-strand
blocks was approximately 18 ft3. However, the mixer used in the batching process had a
capacity of only 7 ft3; therefore, three batches of 6.25 ft3 were mixed continuously during
the casting process with special care given to the material proportions used in each batch.
Prior to the batching process, the material proportions were weighed out to speed up
mixing and to provide a somewhat continuous supply of fresh concrete. In each batch,
the coarse and fine aggregates were first mixed with a small amount of water, while the
additional water and cement were simultaneously added in small amounts. Although the
super plasticizer was added last, the air entrainment was combined with the water prior to
mixing, and was thus added throughout the mixing process. As each batch finished
mixing, the concrete was emptied from the mixer into a concrete bucket attached to the
overhead crane, then transported and placed in the formwork. Internal vibration was
again used ensuring adequate consolidation of the concrete around each strand.
Following casting, wet burlap was placed on each block and covered with plastic for
seven days up to the point of transfer. During this time, as with the T-beam test
specimens, the formwork was removed and preparations were made for transfer length
measurements.
3.3 Formwork Design
The formwork used in the fabrication of the T-beam test specimens was designed
using traditional 2x4 studs and plyform. Throughout the fabrication of the T-beam test
specimens, the formwork was extremely difficult to remove. Initially, the formwork was
designed to have a ¼ in. drop from the bottom edge of the flange to the face of the web.
This was accomplished by slightly rotating upward the horizontal 2x4 of the inverted L-
shaped stud shown in Figure 3.19 (a). With the horizontal 2x4 rotated, four sheetrock
screws were placed in the joint of horizontal and vertical 2x4’s. These L-shaped studs
were then attached, at a spacing of 16 in. on center, to 8 ft long, longitudinal 2x4’s, later
covered with plyform sheets. Figure 3.20 shows a small section of the assembled frame.
The use of that design resulted in two significant problems in the removal of the
formwork following casting. The first problem arose from the lack of rigidity in the L-
shaped stud joint. Even with the use of four screws and a ¼ in. drop, the formwork was
still unable to adequately support the weight of the overhanging flange. As a result, the

80
formwork became wedged underneath the flange of the beams and was extremely
difficult to remove. The second problem was the way the plyform was attached to the
frame. The vertical piece of plyform overlapped the edge of the horizontal piece and in
some cases, the top surface of the vertical piece extended above the top surface of the
horizontal piece causing the concrete to entrap the top edge of the vertical piece.
(a) (b)
Figure 3.19. Formwork Studs
Figure 3.20. Original Formwork Assembly
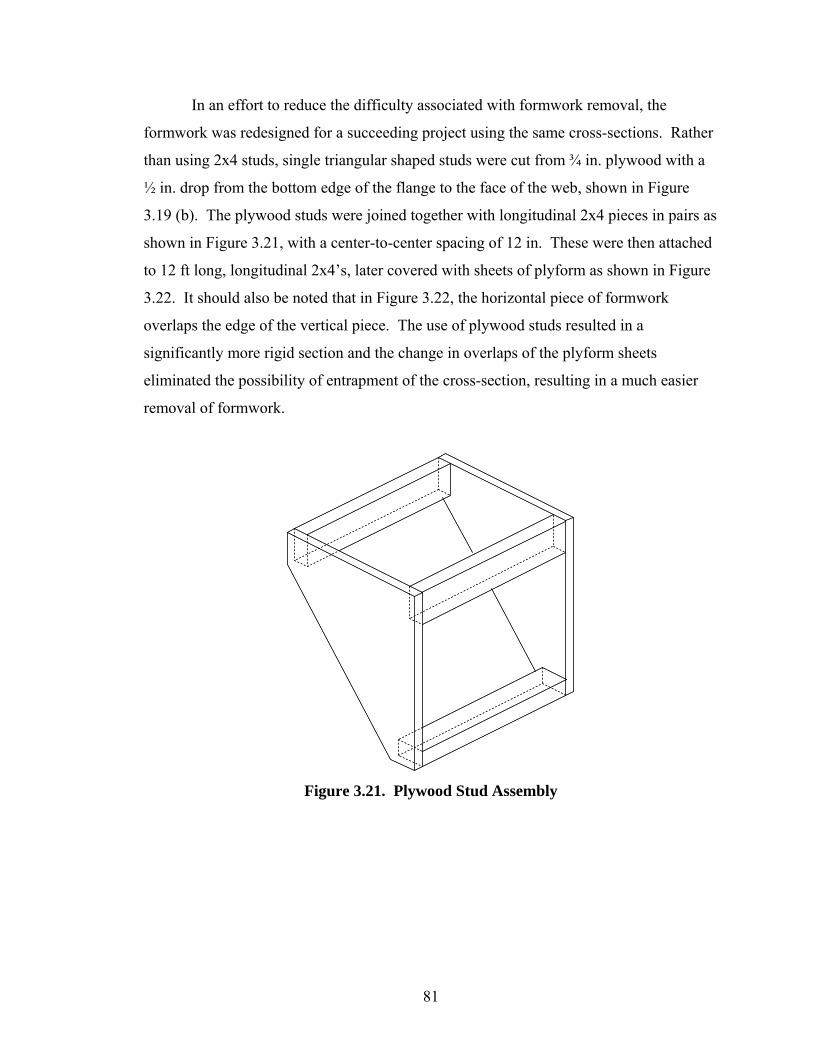
81
In an effort to reduce the difficulty associated with formwork removal, the
formwork was redesigned for a succeeding project using the same cross-sections. Rather
than using 2x4 studs, single triangular shaped studs were cut from ¾ in. plywood with a
½ in. drop from the bottom edge of the flange to the face of the web, shown in Figure
3.19 (b). The plywood studs were joined together with longitudinal 2x4 pieces in pairs as
shown in Figure 3.21, with a center-to-center spacing of 12 in. These were then attached
to 12 ft long, longitudinal 2x4’s, later covered with sheets of plyform as shown in Figure
3.22. It should also be noted that in Figure 3.22, the horizontal piece of formwork
overlaps the edge of the vertical piece. The use of plywood studs resulted in a
significantly more rigid section and the change in overlaps of the plyform sheets
eliminated the possibility of entrapment of the cross-section, resulting in a much easier
removal of formwork.
Figure 3.21. Plywood Stud Assembly

82
Figure 3.22. Revised Formwork Assembly
3.4 Initial Prestress
Initial prestress has been shown to affect both transfer and development lengths of
prestressing strand. A number of studies have used initial prestress values anywhere
from 0.60fpu to 0.80fpu, resulting in an increase in transfer length with an increase in
initial prestress. While the industry standard is to use an initial prestress equal to 0.75fpu,
two levels of initial prestress were selected for this study, 0.67fpu and 0.75fpu. The T-
beam test specimens in Pours 1, 2, 3, and 4 were fabricated with an initial prestress of
0.67fpu, while those in Pours 5 and 6 were fabricated with an initial prestress of 0.75fpu.
Two levels of initial prestress resulted in an additional variable in the investigation of
transfer and development length. The researchers were able to compare the effect strand
stress coupled with casting position had on the transfer and development lengths of Grade
270 and 300 strands. With only four sets of top-strand blocks, it was decided to limit the
number of variables in addition to casting position to as few as possible. The water to
cement ratio and strand size were chosen to be those additional variables, therefore, the
initial prestress selected for the top-strand blocks was a constant 0.75fpu throughout
testing.

83
3.5 Material Properties
The concrete mixture used in the T-beam test specimens was designed to be a
normal weight concrete with a target compressive strength of 4500 psi at transfer and a
28 day compressive strength of 6000 psi. The mix consisted of a ⅜ in. maximum
aggregate, natural sand, Portland cement, fly ash, water, and various admixtures. The
initial mix design, as shown in Table 3.4 had a water to cement ratio of 0.38 and called
for the use of a super plasticizer. Following a flash set during the first pour, the initial
mix design was slightly modified, also shown in Table 3.4, increasing the water to
cement ratio to 0.40 and adding a retarding admixture.
Table 3.4. Concrete Mix Proportions
Quantity (per yd3) Component Initial Revised
No. 78 Stone 1443 lb 1443 lb Natural Sand 1083 lb 1083 lb Portland Cement 600 lb 600 lb Fly Ash 150 lb 150 lb Water 34 gal 36 gal Air Entrainment 3-5% 3-5% Super Plasticizer 19 oz.* 19 oz.* Retartder None 19 oz.#
W:C 0.38 0.40 *Not used in Pours 2-5 #Used in Pours 2-6
The concrete supplier provided batch information with each delivery, allowing for
on-site manipulation of the mix to more accurately control the water to cement ratio.
Throughout the duration of the project, there was little correlation between slump
measurements and the amount of super plasticizer used. The provided batch information
was based on moisture contents for coarse and fine aggregates calculated by the concrete
supplier. It was thought that these moisture contents lacked a high level of accuracy and
overestimated the amount of water in each mix. When manipulating each batch of
concrete, water to cement ratios were adjusted to match those shown in Table 3.4,
providing a constant water to cement ratio throughout the project with the exception of
Pour 1 where a water to cement ratio of 0.38 was intended. Again, adjustments were
made based on provided batch information and the accuracy of the calculated moisture
contents. Table 3.5 lists the “actual” amounts of water and water to cement ratios for
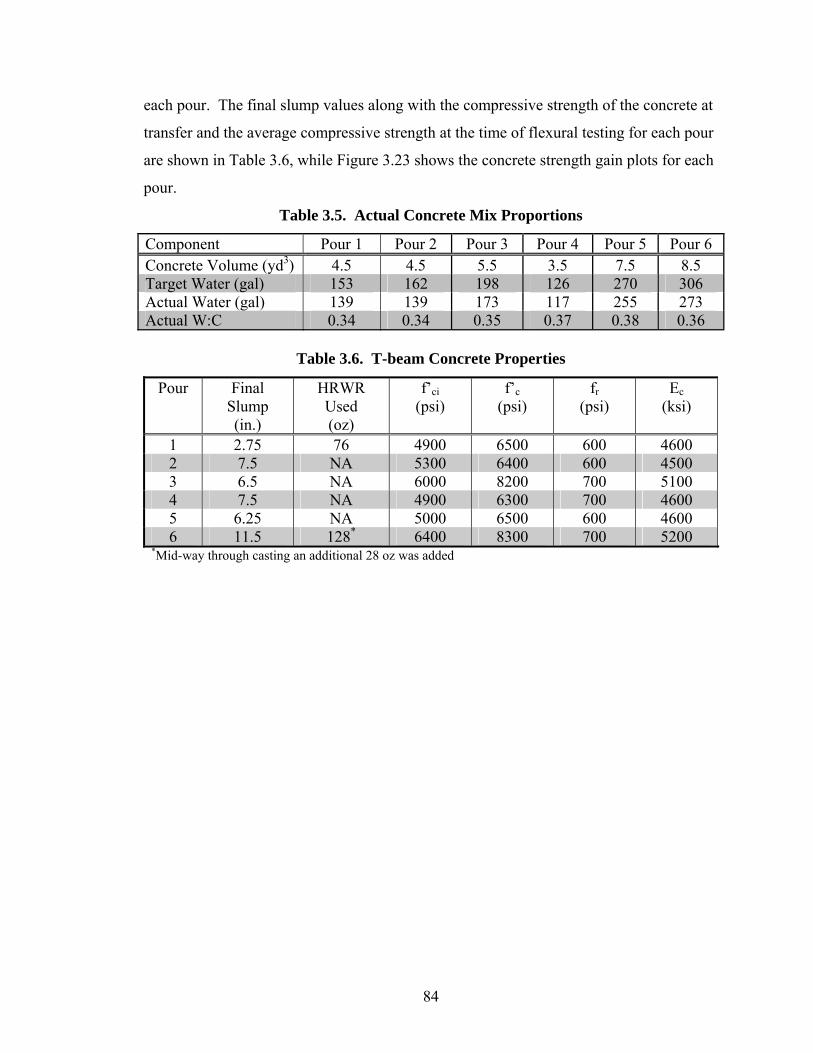
84
each pour. The final slump values along with the compressive strength of the concrete at
transfer and the average compressive strength at the time of flexural testing for each pour
are shown in Table 3.6, while Figure 3.23 shows the concrete strength gain plots for each
pour.
Table 3.5. Actual Concrete Mix Proportions
Component Pour 1 Pour 2 Pour 3 Pour 4 Pour 5 Pour 6 Concrete Volume (yd3) 4.5 4.5 5.5 3.5 7.5 8.5 Target Water (gal) 153 162 198 126 270 306 Actual Water (gal) 139 139 173 117 255 273 Actual W:C 0.34 0.34 0.35 0.37 0.38 0.36
Table 3.6. T-beam Concrete Properties
Pour Final Slump (in.)
HRWR Used (oz)
f’ci (psi)
f’c (psi)
fr (psi)
Ec (ksi)
1 2.75 76 4900 6500 600 4600 2 7.5 NA 5300 6400 600 4500 3 6.5 NA 6000 8200 700 5100 4 7.5 NA 4900 6300 700 4600 5 6.25 NA 5000 6500 600 4600 6 11.5 128* 6400 8300 700 5200
*Mid-way through casting an additional 28 oz was added

85
0
1000
2000
3000
4000
5000
6000
7000
8000
9000
10000
0 10 20 30 40 50 60 70 80Time (days)
Con
cret
e St
reng
th (p
si)
Pour 1
Pour 2Pour 3
Pour 4Pour 5
Pour 6
Figure 3.23. T-beam Test Specimens Concrete Strength Gain
The concrete mixture used for the top-strand block test specimens was similar to
that used for the T-beam test specimens, with target values of 4500 to 5000 psi at transfer
and 6000 psi at 28 days. As previously discussed, the variables used in the fabrication of
the top-strand blocks were limited to strand type and water to cement ratio in addition to
the as-cast vertical location of the strands, while all other possible variables remained as
constant as possible. Two water to cement ratios were used to examine the effect, if any,
the amount of water in a mix had on transfer lengths. Given that the compressive
strength of concrete is generally dependent on the water to cement ratio, other
modifications to the material proportions were necessary to obtain a relatively constant
compressive strength for each mix. These modifications were made using an air
entraining admixture, when added to a mix has been shown to decrease the compressive
strength of the concrete. Table 3.7 and Table 3.8 show the specified and actual batch
proportions for mixes with a 0.40 and 0.45 water to cement ratio.

86
Table 3.7. Specified Concrete Mix Proportions
Quantity (per yd3) Component 0.40 W:C 0.45 W:C
No. 78 Stone 1677 lb 1677 lb Natural Sand 1112 lb 1112 lb Portland Cement 926 lb 926 lb Water 44.4 gal 49.9 gal Air Entrainment 5.5 oz. 3.7 oz. Super Plasticizer 22.8 oz. 22.8 oz.
Table 3.8. Actual Concrete Mix Proportions
Quantity (per yd3) Component Pour 1 Pour 2 Pour 3 Pour 4
No. 78 Stone 1677 lb 1677 lb 1677 lb 1677 lb Natural Sand 1112 lb 1112 lb 1112 lb 1112 lb Portland Cement 926 lb 926 lb 926 lb 926 lb Water 44.4 gal 49.9 gal 44.4 gal 49.9 gal Air Entrainment 5.5 oz. 3.7 oz. 5.5 oz. 3.7 oz. Super Plasticizer 22.8 oz. 22.8 oz. 32.9 oz. 22.8 oz. W:C 0.40 0.45 0.40 0.45
Mixing the concrete used for the top-strand blocks in the laboratory allowed for a
high level of quality control as was shown with the actual mix proportions in Table 3.8.
Other than the super plasticizer used in Pour 3, all components remained constant
throughout casting. Concrete strength was monitored up to and following the transfer
process, testing cylinders at 1, 4, 7, 14, 21, and 28 days for each pour. The concrete
strengths were fairly consistent throughout testing with the strength gain plots for each
pour shown in Figure 3.24. In addition to the strength gain plot, Table 3.9 lists the
measured slump and air content for each pour with amount of super plasticizer used as
well as concrete strengths at transfer and 28 days.

87
0
1000
2000
3000
4000
5000
6000
7000
8000
0 5 10 15 20 25 30
Time (days)
Con
cret
e St
reng
th (p
si)
Pour 1 (0.40 W:C)
Pour 2 (0.45 W:C)
Pour 3 (0.40 W:C)
Pour 4 (0.45 W:C)
Figure 3.24. Top-strand Block Concrete Strength Gain
Table 3.9. Top-strand Block Concrete Properties
Pour Average Slump (in.)
MRWR Used (oz/yd3)
Average Air %
f’ci (psi)
f’c (psi)
1 6.25 22.8 8.3 4800 5900 2 3.75 22.8* 5.2** 5700 6600 3 5.75 32.9 7.7 6100 7000 4 8.75 22.8 6.3 5000 6100
*an additional 1.7 oz. was added to the third batch **only two air contents were taken of the three batches
3.6 Transfer Length Measurements
Transfer length measurements were taken at each end of each T-beam and each
end of each top-strand block for each strand, corresponding to the live and dead end of
each test specimen. The live end of the specimen was the end at which the strand was
torch cut (in between two test specimens cast on the same line of strands), while the dead
end of the specimen was the end at which the strand was anchored to the supporting
abutments. Transfer length measurements were taken using two techniques. The primary
method used was to measure the concrete surface strain at the level of the strand in each

88
specimen, while the secondary method used was to measure end-slip of the strand. A
total of 39 transfer zones were studied for the T-beams, while a total of 80 transfer zones
were studied for the top-strand blocks.
Concrete surface strains were measured using a DEmountable MEChanical
(DEMEC) strain gauge and surface mounted gauge points. The DEMEC gauge had a
gauge length of 7.874 in. (200 mm) and the gauge points were approximately ¼ in. in
diameter with a small, fine point indention located at the approximate center. These
points were placed on the test specimens at the level of the strands at a spacing of 1.969
in. (50 mm) and 3.937 in. (100 mm). A spacing of 1.969 in. was used in areas expected
to be within the anticipated transfer zone, ensuring a defined ascending branch of the
strain plot. The remaining points located beyond the anticipated transfer zone,
corresponding to the strain plateau were spaced at 3.937 in. Each individual strain
reading was based on the total gauge length of 7.874 in., so adjacent strain readings
would overlap aiding in the development of a smooth strain plot. Figure 3.25 and Figure
3.26 show the typical layout of DEMEC points used on a T-beam specimen and a top-
strand block specimen.
50 mmspacing
100 mmspacing
50 mmspacing
100 mmspacing
Figure 3.25. T-beam DEMEC Point Layout

89
50 mmspacing
100 mmspacing
50 mmspacing
100 mmspacing
Figure 3.26. Top-strand Block DEMEC Point Layout
DEMEC points were attached in the days leading up to transfer. On average,
approximately 25 points were placed on each side of each T-beam end, for a total of 100
per beam, while the top-strand blocks used approximately 800 DEMEC points per pour.
Demec points were attached by hand using a five minute epoxy and then labeled. Prior to
the transfer process, it is extremely important to define the initial distances between each
set of points therefore the initial distance between each set of points was measured three
times and then averaged to ensure an accurate starting point for all future measurements.
During the initial measurements, a tolerance of 0.005 mm was used with each set of
measurements allowing for the elimination of any outlying measurements. When a
spurious measurement was recorded, a fourth measurement was taken to provide a more
accurate starting point.
Subsequent to the initial readings, the strands were flame cut using an acetylene
torch. It should be noted, as previously mentioned, the strands are not physically cut, but
are gradually heated until the strands yield in tension. For the T-beam test specimens, the
middle strand was cut first followed by each of the two outer strands. This pattern of
cutting was used to first apply a uniform compressive stress along the middle of the
cross-section to resist any possible weak axis bending resulting from the lateral
eccentricity of the outside strands. For the top-strand block test specimens, previously

90
shown in Figure 3.5, the strand located within the control blocks (I and J) was first cut
followed by strands D/G, B, C/F, E/H, and A of the large and small blocks. Strand D/G
was cut first applying a uniform compressive stress to the small block, and coupled with
the release of strand B created a uniform compressive stress on the large block.
Subsequent strands, C/F, E/H, and A were then cut. Following the transfer of prestress,
T-beams or top-strand blocks, the DEMEC points were again measured and recorded.
The difference between the two readings (before and after transfer) at any one location
provided the change in length from the point at which zero prestress force was applied to
the point at which the entire prestress force was applied. The change in length was then
divided by the gauge length, resulting in the average strain across the gauge length for
that location. A number of researchers have shown transfer lengths to increase over time
by approximately ten percent, therefore, additional measurements are usually taken. For
the T-beam specimens, the second set of readings were taken one to two weeks after
transfer, while the second set of readings were taken seven days after transfer for the top-
strand blocks.
Based on each set of concrete surface strains recorded using the DEMEC gauge, a
strain profile similar to Figure 3.27 was created for each transfer zone and the 95 percent
Average Maximum Strain (AMS) method was used with slight modifications to estimate
initial and the second set of transfer lengths (Russell and Burns 1993). The point at
which the strain plateau began (apex) was visually identified and the AMS was
determined based on those points beyond the apex of the ascending branch. The AMS
was then reduced by five percent and a horizontal line plotted. Using the apex point, a
linear trend line was fit to the data located between the end of the beam and that apex.
Using the equation produced by the trend line, the intersection of the 95 percent AMS
line and the best fit ascending line was determined, which corresponds to the transfer
length. Equation (3-1) shows this equation.
int 95%tm L y AMS⋅ + = Eq. (3-1)

91
y = 24.165x - 111.77R2 = 0.9652
y = 25.287x - 145.04R2 = 0.9936
y = 30.299x - 37.6R2 = 0.9776
y = 36.88x - 184.75R2 = 0.9947
0
200
400
600
800
1000
1200
0 10 20 30 40 50 60
Distance from End of Beam, in.
Stra
in, i
n./in
. *10
^6
Figure 3.27. Transfer Length Strain Profile
The slope of the ascending branch of the strain plot was used rather than the
intersection of the strain profile to the 95% AMS because there exists the possibility of
spurious strain values. Shown in Figure 3.28 is a detailed view of the intersection of both
the best fit line and the line of connected data points to the 95% AMS for a specific
transfer zone. A discrepancy can be noted between the two methods for the red line. If
the line of connected data points was used, a longer transfer length would be calculated.
In the case of overestimation of transfer lengths, added conservatism is not of concern,
but in the case of underestimation of transfer lengths, a lack of conservatism would be of
concern. Therefore, the use of a best fit line to the ascending branch of each strain profile
was used and was expected to give the most accurate and consistent results.
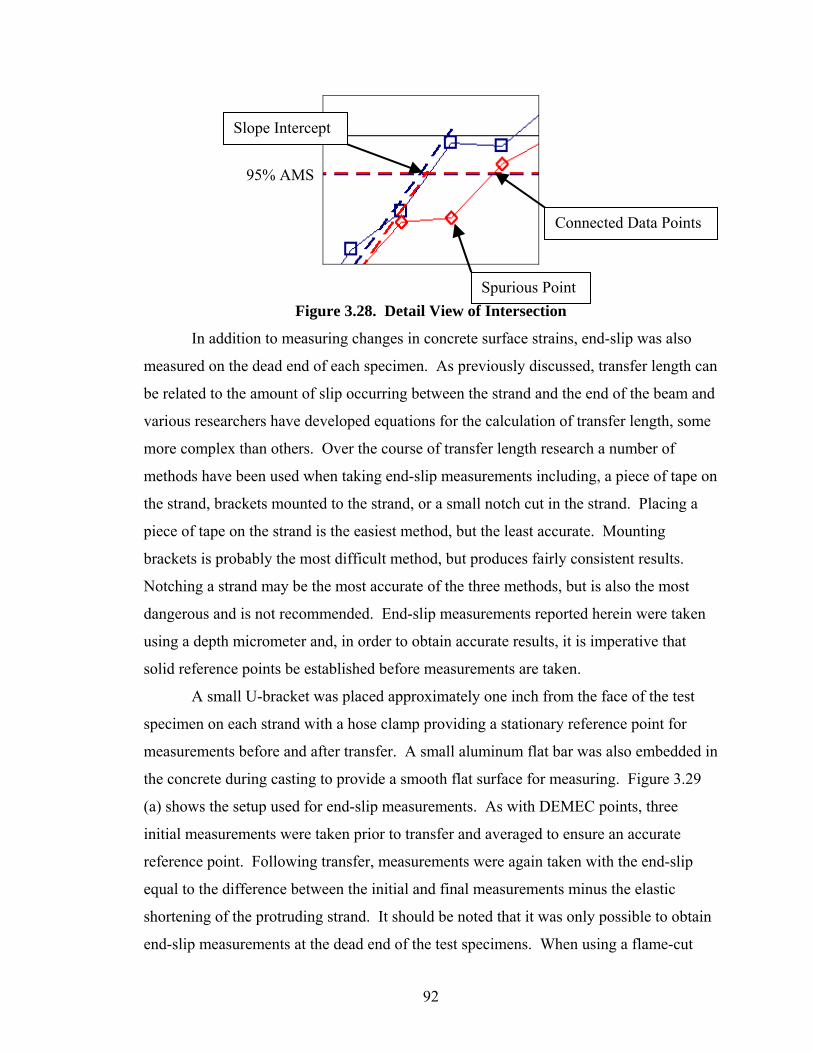
92
Figure 3.28. Detail View of Intersection
In addition to measuring changes in concrete surface strains, end-slip was also
measured on the dead end of each specimen. As previously discussed, transfer length can
be related to the amount of slip occurring between the strand and the end of the beam and
various researchers have developed equations for the calculation of transfer length, some
more complex than others. Over the course of transfer length research a number of
methods have been used when taking end-slip measurements including, a piece of tape on
the strand, brackets mounted to the strand, or a small notch cut in the strand. Placing a
piece of tape on the strand is the easiest method, but the least accurate. Mounting
brackets is probably the most difficult method, but produces fairly consistent results.
Notching a strand may be the most accurate of the three methods, but is also the most
dangerous and is not recommended. End-slip measurements reported herein were taken
using a depth micrometer and, in order to obtain accurate results, it is imperative that
solid reference points be established before measurements are taken.
A small U-bracket was placed approximately one inch from the face of the test
specimen on each strand with a hose clamp providing a stationary reference point for
measurements before and after transfer. A small aluminum flat bar was also embedded in
the concrete during casting to provide a smooth flat surface for measuring. Figure 3.29
(a) shows the setup used for end-slip measurements. As with DEMEC points, three
initial measurements were taken prior to transfer and averaged to ensure an accurate
reference point. Following transfer, measurements were again taken with the end-slip
equal to the difference between the initial and final measurements minus the elastic
shortening of the protruding strand. It should be noted that it was only possible to obtain
end-slip measurements at the dead end of the test specimens. When using a flame-cut
Slope Intercept
Connected Data Points
95% AMS
Spurious Point

93
release, the strand tends to fray, as shown in Figure 3.29 (b), at the live end causing the
U-brackets to bend or the hose clamps to break. Therefore, measurements at the live end
were not possible. Following end-slip measurements, transfer lengths were calculated
using various equations as discussed in Section 2.2 and compared to transfer lengths
calculated from concrete surface strain profiles.
(a) (b)
Figure 3.29. End-slip Measurements Setup
3.7 Development Length Measurements
The development length tests were designed to establish the minimum
development length for each of the five strand types used throughout the duration of the
project. A single point bending test was performed on each end of the 24 ft long T-beam
test specimens with a test span of 16 ft, allowing for two tests per beam. Figure 3.30
shows the test setup for one of the single point bending tests. The initial location of the
point load (P), and the embedment length (Le) from the end of the beam was based upon
the calculated development length. A schematic diagram of the test setup is shown in
Figure 3.31.

94
Figure 3.30. Single Point Bending Test Setup
Figure 3.31. Single Point Bending Test Schematic
With each test arose the possibility of three failure types, flexural, bond, or in
some cases a combination thereof. A flexural failure is defined by either crushing the
concrete in the compression zone or by rupturing the strands in very ductile test
specimens, both of which are easily discernable and shown in Figure 3.32. Leading up to
each type of failure, a test specimen will typically see very little increase in applied load
with substantial increases in deflection. At this point, some tests were considered
flexural failures, while in other cases, load application was continued until complete
failure of the specimen. It should be noted that with a single point load, the concrete was
confined by the load itself, resulting in an increase in compressive strength of the
concrete. The impacts of confined concrete on the compressive strength are discussed in
more detail in Section 3.8. A bond failure was defined by the amount of average slip
occurring between the end of the strand and the end of the test specimen, with a limit of
0.01 in., also usually resulting in the formation of shear cracks. End-slip measurements
during flexural testing were measured with linear variable differential transducers
(LVDT’s), with an accuracy of 0.001 in. Three LVDT’s were attached to the end of the
16 ft
P Le

95
test specimen corresponding to the embedment length in question, mounted with a small
frame constructed of small aluminum channel as shown in Figure 3.33. In most cases, a
full bond failure would allow the strand to pull into the end of the test specimen, pulling
away from the tip of the LVDT’s. Figure 3.34 shows a typical bond failure where the
strands are no longer in contact with the LVDT’s.
Concrete Crushing Strands Fractured
Figure 3.32. Flexural Failures
Figure 3.33. End-slip Measurement Setup

96
Figure 3.34. Typical Bond Failure
The application of load during the single point bending tests were conducted in 2
kip increments until cracking, then 5 kip increments thereafter. During the single point
bending tests, a flexural failure would indicate that the selected embedment length was
longer than the actual development length, in which case the succeeding test of a new
specimen would incorporate a shorter embedment length. A test resulting in a bond
failure, an average slip of 0.01 in. or greater, would indicate that the selected embedment
length was shorter than the actual development length, in which case the succeeding test
of a new specimen would incorporate a larger embedment length. This process was
repeated for each strand type with the intention of determining the minimum flexural
bond length to result in a flexural failure. Upon the completion of each test, the flexural
bond length was taken as the tested embedment length minus the corresponding transfer
length.
3.8 Flexural Strength
The flexural strength, also referred to as the nominal moment capacity and
ultimate flexural capacity, was determined experimentally by single point bending tests
used in the determination of the development length as well as theoretically based on the
provisions of ACI and AASHTO, and strain compatibility. The flexural strength was
determined experimentally for each test specimen assuming the strand was fully
developed. When calculating the nominal flexural capacity of a section using the ACI or
AASHTO provisions, the assumption of perfect bond between the strand and surrounding
concrete is made, although that may not be true in every situation. Therefore, the value
obtained by ACI or AASHTO provisions for each test specimen is the maximum nominal

97
moment capacity. Strain compatibility also makes the assumption of perfect bond and
will also result in a maximum nominal moment capacity, slightly higher than that
calculated by ACI or AASHTO. As mentioned in Section 3.7, the application of load
used in the single point bending tests added a confinement in the compression zone of the
test specimen, resulting in an increase in compressive strength of the concrete. Taking
this confinement into consideration, the calculated nominal moment capacities based on
strain compatibility used a concrete stress-strain relationship as shown in Figure 3.35.
fc
εc
f’c
0.004
fc
εc
f’c
0.004 Figure 3.35. Modified Confined Concrete Stress vs. Strain Diagram
In addition to the monitoring of end-slip during flexural testing, the applied load
and deflection directly under the load point were measured. The applied load was
measured using a strain gauge type load cell having a precision of approximately 100 lb,
while the deflection was determined using a single wire pot, with a precision of
approximately 0.001 in. The support conditions were assumed to be simply supported
using neoprene bearing pads at each end of the beam, typically used in industry, which
incur a small amount of displacement under the applied load as well as some rotation as a
result of vertical deflection in the beam during loading. In order to take into
consideration the vertical displacement and displacement from rotation in the pad, large
scale LVDT’s were used to monitor the support displacements as shown in Figure 3.36.
Some concern was raised about the possibility of the neoprene bearing pads supplying
horizontal restraint to the beam creating an arching action rather than a truly simply
supported condition. Therefore, an independent study was conducted on the support
conditions of simply supported flexural tests, which showed no significant differences in
the flexural capacity of rectangular beams supported with neoprene bearing pads versus a

98
traditional pin and roller support system. Based on the test results, the applied moment
versus deflection was plotted for each test specimen with the displacements of the
neoprene bearing pads taken into account and the end-slip relationship with moment is
also shown in Figure 3.37
Figure 3.36. Support Displacement Monitoring
Neoprene Bearing Pad
LVDT

99
0
50
100
150
200
250
0.0 0.5 1.0 1.5 2.0 2.5 3.0 3.5 4.0
Deflection (in.)
Mom
ent (
kip-
feet
)
0 0.01 0.02 0.03 0.04 0.05 0.06 0.07 0.08
End Slip (in.)
Moment vs DeflectionMn (AASHTO LRFD)Mn (Strain Compatibility)Moment vs End Slip
Lt = 16.71 in.Le = 6.5 ft (78 in.)Failure: Flexural
Figure 3.37. Typical Moment versus Deflection Relationship
3.9 Practical Modeling Technique for Transfer Length
A practical modeling technique for transfer length was developed for use in finite
element analyses of pretensioned, prestressed concrete members. The modeling
technique included the use of nonlinear springs in an effort to model the force versus slip
relationship between prestressing strand and the surrounding concrete. As previously
discussed, the strand tends to slip along the transfer length until full bond of the strand
and concrete is present. However, the force versus slip behavior of the prestressing
strand and surrounding concrete was unknown and found to be dependent on the size of
the strand and the jacking stress. Two and three-dimensional models were constructed in
the analysis and later compared to verify the use of two-dimensional elements with a
plane-stress condition. In addition to the type of element used, the size of the elements
was varied to verify the mesh size. Although the models were small, only half of each
test specimen was modeled since each was symmetrical about its center-line. Figure 3.38
shows a two-dimensional model of one end of the 4 in. by 4 in. control blocks of the top-
strand block test specimens, while Figure 3.39 shows a three-dimensional model of the
same test specimen. In order to verify the use of two-dimensional elements and the size

100
of the mesh, a number of two and three-dimensional models with various element sizes
were constructed and the results compared. The results showed models with two-
dimensional elements to have nearly identical results compared to the three-dimensional
models. The results also showed meshes with 2 in., 1 in. and ½ in. elements to have
nearly identical results, indicating either of the three mesh sizes to be adequate in the
analyses.
Figure 3.38. Two-dimensional Finite Element Model
C.L.

101
Figure 3.39. Three-dimensional Finite Element Model
As previously mentioned, the force versus slip relationship between the
prestressing strand and surrounding concrete was modeled using nonlinear springs. In
order to adequately model this behavior, the prestressing strand (represented by truss
members) could not be directly attached to nodes connected to the finite elements. This
was accomplished by generating a line of duplicate nodes along the line of the
prestressing strand. The duplicate nodes were then joined to their counterparts with a
longitudinal nonlinear spring. To prevent instabilities, each duplicate node was tied to its
counterpart in the vertical direction with master and slave commands. Each model was
supported in the longitudinal direction at all nodes located along the center-line of the test
specimen. However, only the bottom node was supported in the vertical direction. These
boundary conditions allowed for the lateral expansion associated with the Poisson Effect
resulting from an axially applied load. Figure 3.40 shows the boundary conditions and
the layout of duplicate nodes and corresponding truss members for a generic model. The
large arrows represent supports, while the small arrows represent joint ties.
C.L.

102
Figure 3.40. Generic Model
The prestressed force was applied to the model using a temperature load added to
each of the truss members representing the prestressing strand. When a prestressing
strand is pulled in tension, it develops a level of axial tensile strain that is constant
throughout its length. Subsequent to the transfer process, the strand tries to contract, but
is restrained by the surrounding concrete. If slip between the strand and surrounding
concrete did not occur and elastic shortening of the concrete did not take place, the tensile
strain in the strand would remain constant. Likewise, a truss member fixed at both ends
subjected to a change in temperature also develops a level of constant strain. In the
presence of a temperature reduction, the truss member tries to contract, but develops
tensile strains because of the restraints at each end. Figure 3.41 shows an example of a
temperature load on a truss member with two fixed supports.
( )( )( )( )51100 6.5 10 28500 0.153 31.2kips
P A EAT
P T EA
P x
σ εε α
α−
= == Δ= Δ
= − ≈
Figure 3.41. Temperature Load on Truss Member
Assuming a fixed-fixed condition at the ends of the truss member, a temperature
change of approximately -1100 ºF would produce a strain in the member equivalent to the
strain produced from an axial tensile force of 31.2 kips. If perfect bond was present, each
truss member representing the prestressing strand would have a force equal to the initial

103
prestress force minus the loss of force from the elastic shortening of the elements
representing the concrete. However, prestressing strand does not have full bond
throughout its entire length due to the slip associated with the transfer process. For that
reason, the truss member is allowed to shorten and displace relative to the concrete
elements, which is represented by the nonlinear springs. At the end of the member, a
large amount of slip between the strand and the surrounding concrete would result in a
significant loss of prestress force in the strand, but would result in a significant force
increase in the nonlinear spring. Moving along the transfer length, the amount of slip
between the strand and surrounding concrete reduces, resulting in an increase of force in
the stand and a force decrease in the nonlinear spring.
The nonlinear springs used in the finite element models have the capability for
nonlinear force versus displacement relationships, however, linear force versus slip
relationships were used throughout this study. In order to determine the spring stiffness
corresponding to a specific transfer length, a relationship for transfer length and spring
stiffness was established. This was accomplished by using a range of spring stiffnesses
for each model. Figure 3.42 shows a sample of the linear spring stiffnesses used in this
development. It was found that a reduction in spring stiffness resulted in an increase in
distance required for the force in the strand to reach its maximum as shown in Figure
3.43. ACI states the transfer length to be the distance required to fully transfer the force
in the strand to the member. However, to obtain reasonable results, the transfer length for
the models herein was taken as the distance required for the truss member to obtain 99
percent of the maximum force in any one truss member. Figure 3.44 shows a typical plot
for the force in the strand against the distance from the end of the member. The
horizontal dashed line shows 99 percent of the maximum force in the strand, while the
vertical dashed line shows the point at which the force versus location curve intersects the
99 percent plateau, or the transfer length.

104
50 kip/in.
100 kip/in.
150 kip/in.
200 kip/in.
250 kip/in.P
δ
50 kip/in.
100 kip/in.
150 kip/in.
200 kip/in.
250 kip/in.P
δ
Figure 3.42. Sample Spring Stiffnesses
0
5
10
15
20
25
30
35
0 10 20 30 40 50 60 70 80
Distance from End of Specimen (in.)
Stra
nd F
orce
(kip
s)
400 kip/in.350 kip/in.300 kip/in.250 kip/in.200 kip/in.150 kip/in.100 kip/in.50 kip/in.
Figure 3.43. Transfer Length versus Spring Stiffness
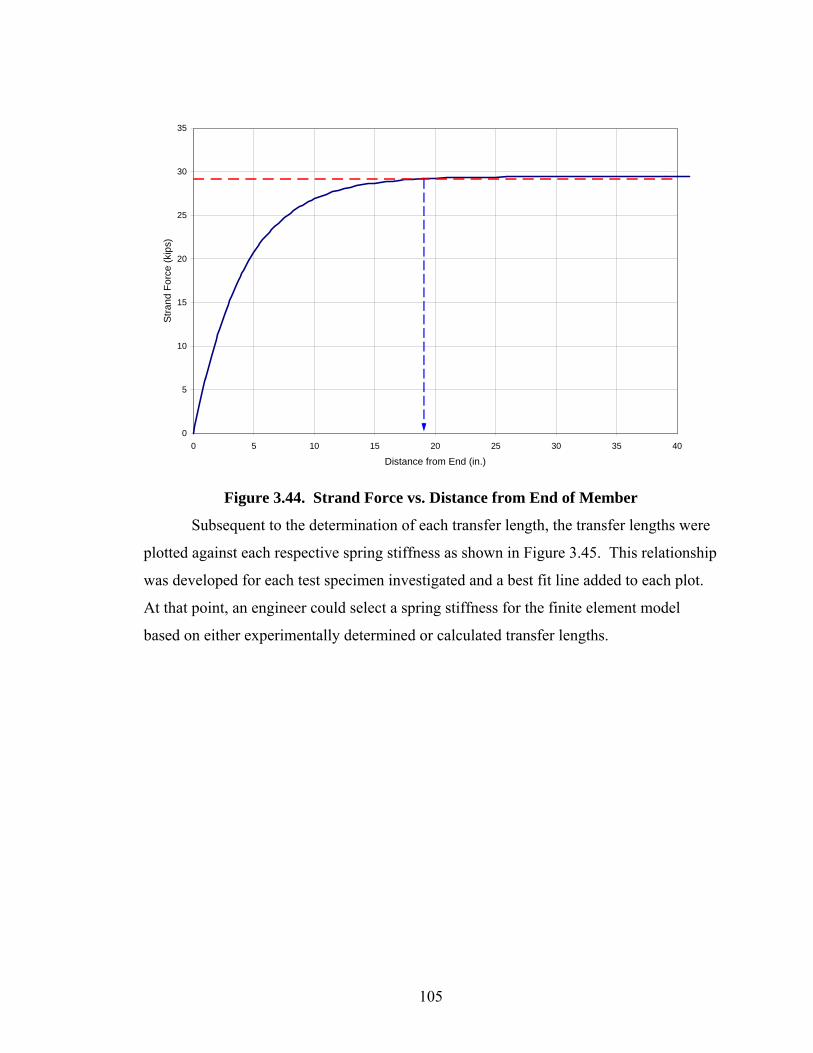
105
0
5
10
15
20
25
30
35
0 5 10 15 20 25 30 35 40
Distance from End (in.)
Stra
nd F
orce
(kip
s)
Figure 3.44. Strand Force vs. Distance from End of Member
Subsequent to the determination of each transfer length, the transfer lengths were
plotted against each respective spring stiffness as shown in Figure 3.45. This relationship
was developed for each test specimen investigated and a best fit line added to each plot.
At that point, an engineer could select a spring stiffness for the finite element model
based on either experimentally determined or calculated transfer lengths.

106
y = 299.61x-0.4308
R2 = 0.9935
0
10
20
30
40
50
60
0 50 100 150 200 250 300 350 400 450
Spring Stiffness (kip/in.)
Tran
sfer
Len
gth
(in.)
Figure 3.45. Transfer Length versus Spring Stiffness
The nonlinear analysis used in this study was based on the Newton Raphson-
Method of convergence. A tolerance of 0.001 and a maximum number of iterations set at
10 were specified. To verify the tolerance used throughout this study, a few models were
ran with a tolerance of 0.0001 and were found to have the same results. As previously
mentioned, a linear force versus displacement relationship was used for the nonlinear
springs, therefore, each analysis was essentially linear, converging in two or three
iterations.
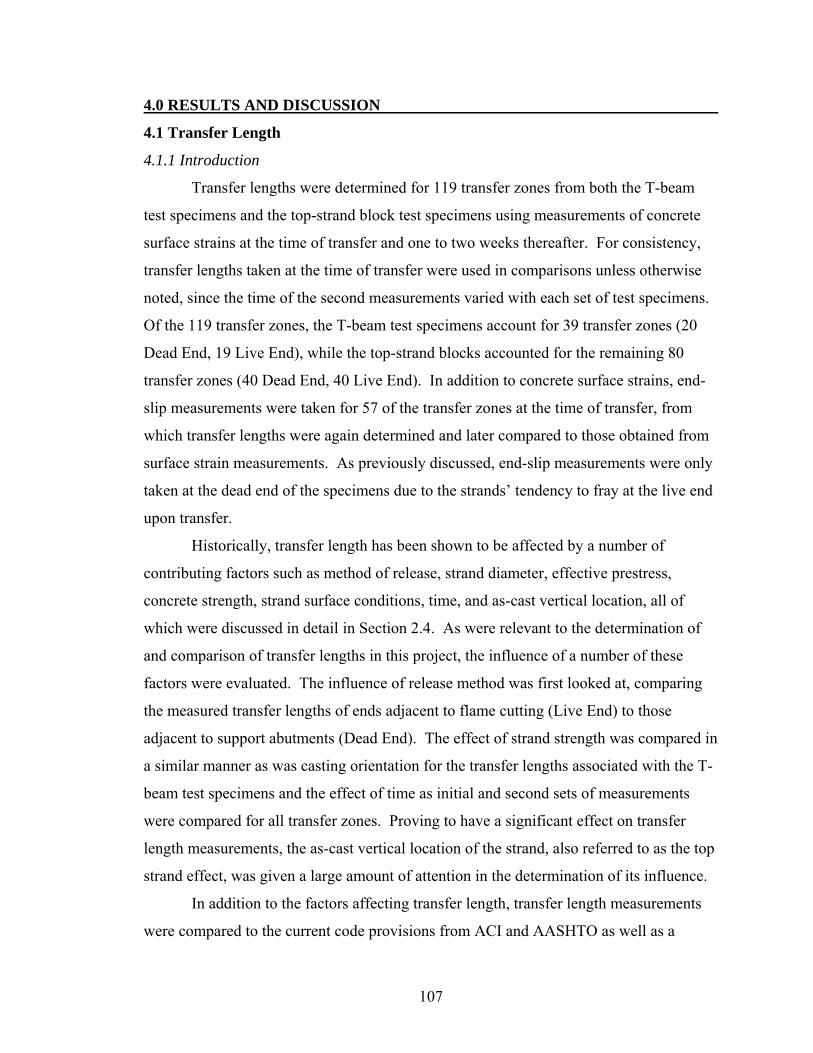
107
4.0 RESULTS AND DISCUSSION
4.1 Transfer Length
4.1.1 Introduction
Transfer lengths were determined for 119 transfer zones from both the T-beam
test specimens and the top-strand block test specimens using measurements of concrete
surface strains at the time of transfer and one to two weeks thereafter. For consistency,
transfer lengths taken at the time of transfer were used in comparisons unless otherwise
noted, since the time of the second measurements varied with each set of test specimens.
Of the 119 transfer zones, the T-beam test specimens account for 39 transfer zones (20
Dead End, 19 Live End), while the top-strand blocks accounted for the remaining 80
transfer zones (40 Dead End, 40 Live End). In addition to concrete surface strains, end-
slip measurements were taken for 57 of the transfer zones at the time of transfer, from
which transfer lengths were again determined and later compared to those obtained from
surface strain measurements. As previously discussed, end-slip measurements were only
taken at the dead end of the specimens due to the strands’ tendency to fray at the live end
upon transfer.
Historically, transfer length has been shown to be affected by a number of
contributing factors such as method of release, strand diameter, effective prestress,
concrete strength, strand surface conditions, time, and as-cast vertical location, all of
which were discussed in detail in Section 2.4. As were relevant to the determination of
and comparison of transfer lengths in this project, the influence of a number of these
factors were evaluated. The influence of release method was first looked at, comparing
the measured transfer lengths of ends adjacent to flame cutting (Live End) to those
adjacent to support abutments (Dead End). The effect of strand strength was compared in
a similar manner as was casting orientation for the transfer lengths associated with the T-
beam test specimens and the effect of time as initial and second sets of measurements
were compared for all transfer zones. Proving to have a significant effect on transfer
length measurements, the as-cast vertical location of the strand, also referred to as the top
strand effect, was given a large amount of attention in the determination of its influence.
In addition to the factors affecting transfer length, transfer length measurements
were compared to the current code provisions from ACI and AASHTO as well as a

108
number of previously recommended transfer length equations, each of which was
discussed in Section 2.2. The values of effective and initial prestress used in the
comparisons were determined by subtracting the amount of prestress losses calculated by
current AASHTO provisions. Historically, ACI and AASHTO have only included
effective prestress and the strand diameter in the calculation of transfer lengths.
However, over the past 35 years, a number of researchers have recommended various
equations also taking into account concrete strength and recently Peterman (2007) has
recommended an equation incorporating the as-cast vertical location and strand diameter,
but neglects stress in the strand and concrete strength. With the absence of an equation
incorporating the four main contributing factors, an equation was also developed taking
into account effective prestress, concrete strength, strand diameter, and the as-cast
vertical location.
4.1.2 Influence of Release Method
A number of researchers have shown transfer lengths of strands released by and
adjacent to a flame cutting process to be longer with respect to those located away from
the flame cutting process or adjacent to support abutments. This increase is important in
the development of transfer length equations. In the past, some equations have been
derived based on a gradual release method, while the standard method of release used in
the prestressing industry is typically the flame cutting process. Thus, the influence of
release method is vital in the derivation of a conservative transfer length equation, which
is shown in Table 4.1 for the T-beam test specimens with both casting orientations.
The average increase of transfer lengths at the live ends versus transfer lengths at
the dead ends for the T-beam test specimens cast with a normal orientation was 45
percent, while those cast with an inverted orientation increased by 49 percent. Note that
transfer lengths for members 2.300.5N.U and 2.300.5S.U, both containing Grade 300
prestressing strands and cast with an inverted orientation, increased by 84 and 95 percent,
respectively. There is a possibility these excessively long values were influenced by the
high levels of bleed water, as transfer lengths have been shown to increase with highly
fluid mixes. This only occurred with the beams containing Grade 300 strands and may be
a result of the larger prestress force coupled with a mix of high fluidity. Because of the
excessive transfer lengths, there was speculation of inadequate consolidation of the

109
concrete around the strand. For verification purposes, autopsies were performed on
beams from Pour 1 and Pour 2 to compare the interface between the prestressing steel
and surrounding concrete. No differences were observed between the concrete around
the strands following the autopsies. Therefore, it was concluded that the concrete
surrounding the strands had adequate consolidation.
Table 4.1. Influence of Release Method (T-beam Test Specimens) fsj fsi fse f'ci f'c
Beam ksi ksi ksi psi psi Live Dead Live/Dead1.270.5N.R 180.9 168.4 157.0 4900 6500 16.7 12.3 1.362.270.5N.R 180.9 168.4 162.3 5300 6400 18.1 12.5 1.463.270.5S.R 180.9 169.1 158.6 6000 8200 21.1 13.6 1.554.270.5S.R 180.9 168.3 157.8 4900 6300 17.5 15.5 1.135.270.5S.R 202.5 187.5 162.5 5000 6500 20.2 12.8 1.586.270.5S.R 202.5 188.8 174.3 6400 8300 20.7 16.7 1.241.300.5N.R 201.0 186.9 175.8 4900 6500 NA 14.6 NA2.300.5N.R 201.0 187.0 180.0 5300 6400 21.2 14.2 1.503.300.5S.R 201.0 187.7 176.2 6000 8200 20.8 13.5 1.534.300.5S.R 201.0 186.9 175.5 4900 6300 18.4 14.1 1.305.300.5S.R 225.0 208.1 181.2 5000 6500 20.6 13.9 1.476.270.6N.R 202.5 188.4 173.0 6400 8300 19.3 10.7 1.80
Average Increase 1.452.270.5N.U 180.9 168.4 161.7 5300 6400 30.2 24.5 1.233.270.5S.U 180.9 169.1 157.5 6000 8200 25.6 19.8 1.295.270.5S.U 202.5 187.5 162.4 5000 6500 26.3 19.9 1.326.270.5S.U 202.5 188.8 173.6 6400 8300 21.3 17.8 1.202.300.5N.U 201.0 187.0 179.3 5300 6400 43.3 23.6 1.843.300.5S.U 201.0 187.7 175.1 6000 8200 41.1 21.1 1.955.300.5S.U 225.0 208.1 180.9 5000 6500 24.3 19.2 1.276.270.6N.U 202.5 188.4 172.4 6400 8300 23.1 12.9 1.79
Average Increase 1.49
Nor
mal
Inve
rted
Transfer Length (in.)
In addition to the tabulated values, Figure 4.1 also shows the relationship of
transfer lengths at the live end of a test specimen compared to the transfer lengths at the
dead end of a test specimen with transfer lengths measured in strand diameters. Again, a
general increase is shown for all T-beam test specimens with the largest differences in
live and dead end measurements shown in the inverted beams. All live and dead end
transfer lengths for beams cast with a normal orientation fall below current code
provisions of ACI and AASHTO, 50db, fse/3, and 60db, and although all of the dead end
transfer lengths of the inverted beams fall below code values, five live end transfer
lengths exceed the 50db value from ACI, three of which exceeded the 60db value from
AASHTO. These excessive transfer lengths could prove problematic in the design for
shear in prestressed concrete members.

110
0
10
20
30
40
50
60
70
80
90
100
1.270
.5N.R
2.270
.5N.R
3.270
.5S.R
4.270
.5S.R
5.270
.5S.R
6.270
.5S.R
1.300
.5N.R
2.300
.5N.R
3.300
.5S.R
4.300
.5S.R
5.300
.5S.R
6.270
.6N.R
2.270
.5N.U
3.270
.5S.U
5.270
.5S.U
6.270
.5S.U
2.300
.5N.U
3.300
.5S.U
5.300
.5S.U
6.270
.6N.U
Beam Designation
Tran
sfer
Len
gth
(stra
nd d
iam
eter
s)Live EndDead Endfse/3
50db
60db
Normal Inverted
Figure 4.1. Influence of Release Method on Transfer Length (T-beams)
In addition to the T-beam test specimens, the transfer lengths at the live and dead
ends of the top-strand blocks were also compared and plotted versus current code
provisions. Table 4.2 lists the transfer lengths for both the live and dead ends of each set
of top-strand blocks as well as the corresponding steel stresses and concrete strengths.
The average increase in transfer length was one percent for Pour 1, 19 percent for Pour 2,
9 percent for Pour 3, and 13 percent for Pour 4. The largest increase among all top-strand
transfer zones was Strand H in Pour 2. This strand was located 2 in. from the bottom of
the specimen, while the two strands in the T-beam test specimens exhibiting excessive
increases in transfer length were located 2 in. from the top of the as-cast specimen. It is
unknown as to the cause of the increase, as the top-strand blocks were typically cast with
a much stiffer concrete.
Complimenting Table 4.2, Figures 4.2 though 4.5 give a graphical presentation of
the data compared with current code provisions. As with the T-beam test specimens, a
general increase was seen for live end transfer lengths compared to dead end transfer
lengths, with only a few exceptions. Contrary to the T-beam test specimens, the majority
of the transfer lengths fell at or below current code provisions. However, values do not

111
remain constant and show an additional trend of decreasing transfer length from left to
right on the plots. This is discussed with greater detail in Section 4.1.8.
Overall, the comparison of transfer lengths for live and dead ends was in
agreement with previous research. An average overall increase in transfer length of 22
percent was seen between live and dead ends, showing the necessity of measurements
taken adjacent to the ends of test specimens having a sudden release to be incorporated in
the development of transfer length equations.

112
Table 4.2. Influence of Release Method (Top-strand Block Test Specimens) fsj fsi fse f'ci f'c
Strand ksi ksi ksi psi psi Live Dead Live/DeadA 202.5 188.7 178.0 4800 5900 21.2 17.8 1.19B 202.5 188.7 178.0 4800 5900 19.6 16.3 1.20C 202.5 188.7 178.0 4800 5900 18.3 17.7 1.04D 202.5 188.7 178.0 4800 5900 19.0 16.4 1.16E 202.5 188.7 178.0 4800 5900 18.8 15.8 1.18F 202.5 188.4 177.5 4800 5900 28.9 46.8 0.62G 202.5 188.4 177.5 4800 5900 25.7 30.2 0.85H 202.5 188.4 177.5 4800 5900 25.4 24.7 1.03I 202.5 186.7 174.6 4800 5900 23.7 30.8 0.77J 202.5 186.7 174.6 4800 5900 25.4 24.2 1.05
Average Increase 1.01A 202.5 189.6 179.9 5700 6600 19.4 15.9 1.22B 202.5 189.6 179.9 5700 6600 19.6 15.5 1.26C 202.5 189.6 179.9 5700 6600 18.3 16.1 1.13D 202.5 189.6 179.9 5700 6600 15.0 14.5 1.04E 202.5 189.6 179.9 5700 6600 16.1 14.5 1.11F 202.5 189.3 179.4 5700 6600 23.4 20.4 1.15G 202.5 189.3 179.4 5700 6600 21.7 18.9 1.15H 202.5 189.3 179.4 5700 6600 22.4 14.3 1.57I 202.5 187.7 176.8 5700 6600 21.5 19.6 1.09J 202.5 187.7 176.8 5700 6600 19.2 16.3 1.18
Average Increase 1.19A 202.5 189.0 179.4 6100 7000 22.6 21.1 1.07B 202.5 189.0 179.4 6100 7000 23.5 17.3 1.36C 202.5 189.0 179.4 6100 7000 19.0 16.7 1.14D 202.5 189.0 179.4 6100 7000 18.5 16.4 1.13E 202.5 189.0 179.4 6100 7000 17.6 16.2 1.08F 202.5 188.8 179.0 6100 7000 21.3 34.2 0.62G 202.5 188.8 179.0 6100 7000 24.0 24.0 1.00H 202.5 188.8 179.0 6100 7000 22.6 17.4 1.30I 202.5 187.0 176.2 6100 7000 25.2 21.8 1.15J 202.5 187.0 176.2 6100 7000 25.4 24.4 1.04
Average Increase 1.09A 202.5 188.0 177.2 5000 6100 29.3 30.9 0.95B 202.5 188.0 177.2 5000 6100 23.2 21.4 1.08C 202.5 188.0 177.2 5000 6100 20.7 19.0 1.09D 202.5 188.0 177.2 5000 6100 20.0 17.3 1.16E 202.5 188.0 177.2 5000 6100 18.8 16.5 1.14F 202.5 187.7 176.7 5000 6100 25.0 25.7 0.97G 202.5 187.7 176.7 5000 6100 25.5 21.3 1.20H 202.5 187.7 176.7 5000 6100 30.5 19.1 1.60I 202.5 185.8 173.7 5000 6100 28.7 30.8 0.93J 202.5 185.8 173.7 5000 6100 29.7 25.5 1.17
Average Increase 1.13
Pou
r 4Po
ur 3
Pour
2Po
ur 1
Transfer Length (in.)

113
0
10
20
30
40
50
60
70
80
90
100
A B C D E F G H I J
Strand
Tran
sfer
Len
gth
(stra
nd d
iam
eter
s)
Live EndDead Endfse/3
50db
60db
Figure 4.2. Influence of Release Method on Transfer Length (TSB-Pour 1)
0
10
20
30
40
50
60
70
80
90
100
A B C D E F G H I J
Strand
Tran
sfer
Len
gth
(stra
nd d
iam
eter
s)
Live EndDead Endfse/3
50db
60db
Figure 4.3. Influence of Release Method on Transfer Length (TSB-Pour 2)

114
0
10
20
30
40
50
60
70
80
90
100
A B C D E F G H I J
Strand
Tran
sfer
Len
gth
(stra
nd d
iam
eter
s)
Live EndDead Endfse/3
50db
60db
Figure 4.4. Influence of Release Method on Transfer Length (TSB-Pour 3)
0
10
20
30
40
50
60
70
80
90
100
A B C D E F G H I J
Strand
Tran
sfer
Len
gth
(stra
nd d
iam
eter
s)
Live EndDead Endfse/3
50db
60db
Figure 4.5. Influence of Release Method on Transfer Length (TSB-Pour 4)

115
4.1.3 Influence of Strand Strength
As the primary objective, the anticipated industry use of the Grade 300 strand
relied on a number of items in question, one of which was the transfer length of Grade
300 prestressing strands compared to the traditionally used Grade 270 strand and more
importantly, the current code provisions. As with the influence of release method on
transfer length, it was believed that an increase in strand strength, which resulted in larger
effective prestress values, would also result in an increase in transfer lengths. Grade 300
strand allows for an 11 percent increase in initial prestress as compared to the traditional
Grade 270 strand, which was expected to increase transfer lengths. Table 4.3 lists the
transfer lengths of both the Grade 300 and Grade 270 strands also giving ratios of the
results for each. It should be noted that Pour 6 did not include Grade 300 strands, but
used Grade 270, 0.6 in. diameter strands instead and was not included in average
calculations. The average increase of transfer lengths for Grade 300 strands versus Grade
270 strands of the T-beam test specimens cast with a normal orientation was 6 percent for
both the live and dead ends, respectively. The average increase of transfer lengths for
Grade 300 strands verses Grade 270 strand of the T-beams cast with an inverted
orientation was 32 percent at the live ends, but failed to show an increase at the dead
ends. Note that increases of 43 percent and 61 percent were seen in Pour 2 and Pour 3 for
the inverted beams. As was discussed in the previous section, it is unknown as to the
cause of this behavior, but is believed to be a combination of an increase in strand
strength coupled with the fluidity of the concrete mix.
Table 4.3. Influence of Strand Strength
f'ci f'c Live DeadPour psi psi 300 270 300 270 300/270 300/270
1 4900 6500 NA 16.7 14.6 12.3 NA 1.192 5300 6400 21.2 18.1 14.2 12.5 1.17 1.143 6000 8200 20.8 21.1 13.5 13.6 0.98 0.994 4900 6300 18.4 17.5 14.1 15.5 1.05 0.915 5000 6500 20.6 20.2 13.9 12.8 1.02 1.096 6400 8300 19.3 20.7 10.7 16.7 0.93 0.64
Average Increase 1.05 1.062 5300 6400 43.3 30.2 23.6 24.5 1.43 0.963 6000 8200 41.1 25.6 21.1 19.8 1.61 1.065 5000 6500 24.3 26.3 19.2 19.9 0.92 0.976 6400 8300 23.1 21.3 12.9 17.8 1.08 0.73
Average Increase 1.32 1.00
Inve
rted
Nor
mal
RatiosDead
Transfer Length (in.)Live

116
In conjunction with Table 4.3, Figures 4.6 and 4.7 show the comparison of
transfer lengths, in strand diameters, for the T-beam test specimens cast with a normal
and inverted orientation, respectively. The transfer lengths shown in Figure 4.6 all fall
below both ACI and AASHTO values, with transfer lengths of Grade 300 strands having
slightly larger values. Contrary to the transfer length of the T-beam test specimens cast
with a normal orientation, five of the transfer lengths for the T-beam test specimens cast
with an inverted orientation exceeded the ACI provision of 50db, three of which exceeded
the AASHTO provision of 60db. As previously mentioned, the live end transfer lengths
of the Grade 300 strand in Pour 2 and Pour 3 far exceed other measurements as well as
code provisions. As shown on Figures 4.6 and 4.7, Pours 1 through 4 used a jacking
stress of 0.67fpu, while Pours 5 and 6 used a jacking stress of 0.75fpu. It is reasonable to
recommend that if the Grade 300 strands used in Pour 2 and Pour 3 were initially stressed
to 0.75fpu, the transfer lengths could have very well been 97db and 92db, respectively, by
multiplying the original values by the ratio of initial prestresses.
Overall, an average increase of 10 percent was shown for all transfer lengths of
Grade 300 strand compared to transfer lengths of the Grade 270 strand as expected. For
T-beam test specimens cast with a normal orientation, all measured values fell below
current code provisions however for T-beam test specimens cast with an inverted
orientation, some of the measured transfer lengths exceeded the current code provisions,
in the predicted cases of Pours 2 and 3, by almost 95 percent. Thus, results have shown
strands cast near the as-cast top of the test specimen to exhibit longer transfer lengths
regardless of strand grade or beam end.

117
0
10
20
30
40
50
60
70
80
90
100
1 2 3 4 5 6
Pour Number
Tran
sfer
Len
gth
(str
and
diam
eter
s)Grade 300 LiveGrade 270 LiveGrade 300 DeadGrade 270 Dead
f sj = 0.67f pu f sj = 0.75f pu
50db
60db
Figure 4.6. Influence of Strand Grade (T-beams – Normal Orientation)
0
10
20
30
40
50
60
70
80
90
100
2 3 5 6
Pour Number
Tran
sfer
Len
gth
(str
and
diam
eter
s)
Grade 300 LiveGrade 270 LiveGrade 300 DeadGrade 270 Dead
f sj = 0.67f pu f sj = 0.75f pu
50db
60db
Figure 4.7. Influence of Strand Grade (T-beams – Inverted Orientation)

118
4.1.4 Influence of Strand Diameter/Area
Strand diameter has been shown to influence transfer length by a number of
researchers. Most have found transfer length to increase with strand diameter, while
some have shown transfer lengths to decrease when using 0.6 in. diameter prestressing
strands. Three strand types were used throughout this study, including ½ in. regular, ½
in. super, and 0.6 in. diameter strands. The majority of the test specimens were
constructed with ½ in. regular or ½ in. super strands, with only two T-beam test
specimens containing 0.6 in. diameter strands, so no definitive conclusions with respect
to 0.6 in. diameter strands and their influence on transfer length could be made, although
transfer lengths did appear to decrease.
Table 4.4 lists the average transfer length measurements with respect to strand
area and diameter, along with standard deviation as a measure of variability for the data.
Maximum and minimum values for measurements taken at the live end, dead end, and
both ends combined were also included. Figure 4.8 shows each transfer length
measurement plotted with respect to strand diameter as well as averages plus and minus
two standard deviations denoted by the red bars. Assuming a normal distribution, the
range produced by the average plus and minus two standard deviations would include
approximately 95 percent of the data. The total average transfer length for the ½ in.
diameter strands was 21.3 in. with a standard deviation of 6.0 in. The total average
transfer length for the 0.6 in. diameter strands was 16.5 in. with a standard deviation of
5.0 in. While strand diameter may be a contributing factor in the determination of
transfer lengths, based on the scatter amongst transfer length measurements shown in
Figure 4.8, it is unreasonable to say transfer length is solely or primarily dependent on
strand diameter.
In addition to strand diameter, each transfer length measurement was also plotted
against the corresponding strand area as shown in Figure 4.9. Again average transfer
lengths plus and minus two standard deviations are also shown along with the
experimental data by the red bars. The total average transfer length for the ½ in. diameter
regular strands was 20.8 in. with a standard deviation of 6.7 in. The total average transfer
length for the ½ in. diameter super strands was 21.6 in. with a standard deviation of 5.3
in. and the total average transfer lengths for the 0.6 in. diameter strands was 16.5 in. with

119
a standard deviation of 5.0 in. As with strand diameter, there is no significant trend
indicating transfer length to be solely or primarily dependent on the area of the strand.
As previously discussed with other contributing factors, the effect of casting position
could be influential in the amount of scatter associated with the transfer length data
plotted against strand diameter and strand area. With respect to historical research that
has shown transfer length to be dependent upon strand diameter, the diameter of the
strand was still considered in the derivation of the proposed transfer length equation in
Section 4.1.10.
Table 4.4. Influence of Strand Diameter and Strand Area
0.153 0.167 0.217 0.5 0.6AVE 22.1 23.4 21.2 22.9 21.2STD 5.7 4.7 1.9 5.2 1.9MAX 43.3 41.1 23.1 43.3 23.1MIN 15.0 17.5 19.3 15.0 19.3AVE 19.6 19.8 11.8 19.7 11.8STD 7.3 5.2 1.1 6.2 1.1MAX 46.8 34.2 12.9 46.8 12.9MIN 12.3 12.8 10.7 12.3 10.7AVE 20.8 21.6 16.5 21.3 16.5STD 6.7 5.3 4.9 6.0 4.9MAX 46.8 41.1 23.1 46.8 23.1MIN 12.3 12.8 10.7 12.3 10.7
Transfer Lengths (in.)Diameter (in.)
Live
Dea
dTo
tal
Strand Area (in.2)

120
0
10
20
30
40
50
0.4 0.5 0.6 0.7
Strand Diameter (in.)
Tran
sfer
Len
gth
(in.)
mean
mean
+2σ
+2σ
-2σ
-2σ
Figure 4.8. Influence of Strand Diameter
0
10
20
30
40
50
0.100 0.150 0.200 0.250Strand Area (in.2)
Tran
sfer
Len
gth
(in.)
mean
+2σ
-2σ
mean
+2σ
-2σ
mean
+2σ
-2σ
Figure 4.9. Influence of Strand Area

121
4.1.5 Influence of Effective Prestress
The effective prestress fse (stress in the strand after all losses) has been used in the
calculation of transfer length since the implementation of Equation (2-2) in the ACI
Building Code, however, research over the past few decades has shown transfer lengths
to be more dependent on the initial prestress fsi (stress in the strand just after transfer)
rather than the effective prestress. In retrospect, using the initial prestress in place of the
effective prestress seems more logical, since the initial prestress is the stress in the strand
transferred to the surrounding concrete. In either case, a number of researchers have
shown transfer length to increase with effective and initial prestress. For that reason, two
levels of prestress were used throughout this study, 0.67fpu and 0.75fpu, for some level of
variability in the stress at transfer between test specimens. Figure 4.10 shows the
relationship between the effective prestress and transfer length while Figure 4.11 shows
the relationship between the initial prestress and transfer length. In either case, a
significant amount of scatter exists, failing to produce any definitive trends relating
transfer length to effective or initial prestress. As with strand diameter, transfer lengths
have shown a significant tendency to increase with increased levels of prestress.
Although no definitive trends exist from this study relating strand stress and transfer
length, the initial prestress remained a factor in the derivation of the proposed transfer
length equation in Section 4.1.10.
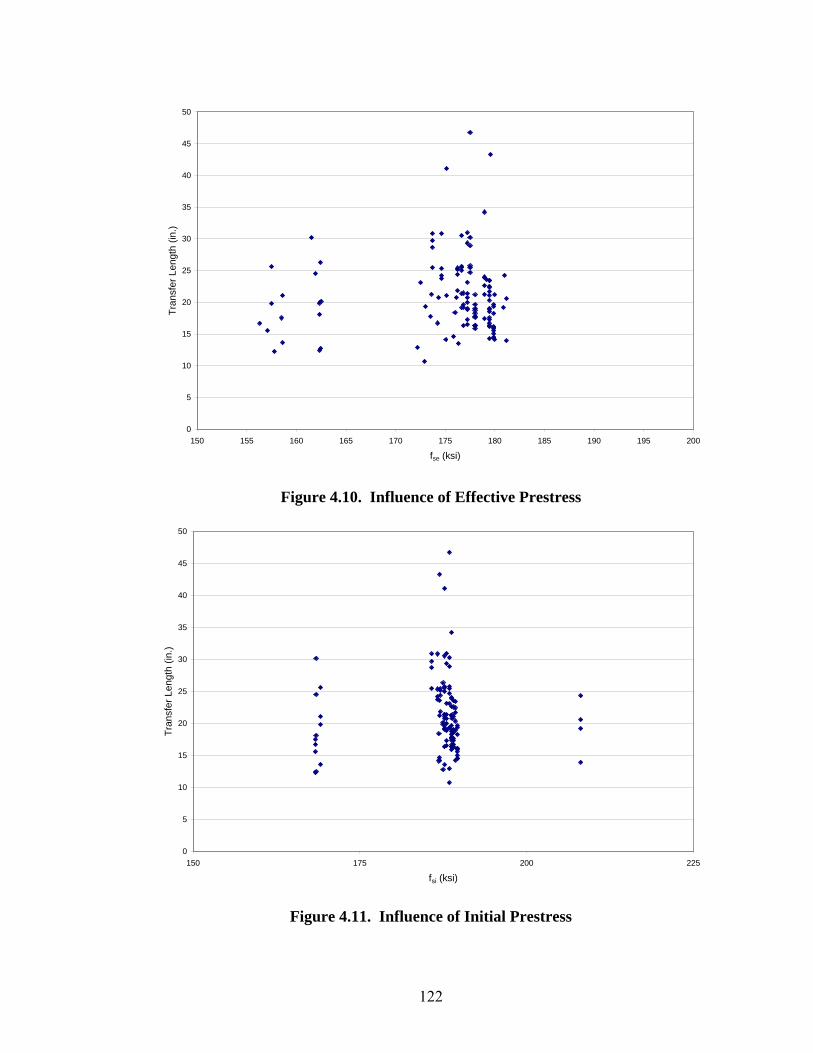
122
0
5
10
15
20
25
30
35
40
45
50
150 155 160 165 170 175 180 185 190 195 200
fse (ksi)
Tran
sfer
Len
gth
(in.)
Figure 4.10. Influence of Effective Prestress
0
5
10
15
20
25
30
35
40
45
50
150 175 200 225
fsi (ksi)
Tran
sfer
Len
gth
(in.)
Figure 4.11. Influence of Initial Prestress
123
4.1.6 Influence of Concrete Strength
Although the current code provisions do not account for the strength of concrete,
research has shown an increase in concrete strength reduces transfer length, especially
those in excess of 10,000 psi. Of the equations proposed by various researchers over the
past few decades, the majority incorporate the concrete strength at transfer or the square
root of the concrete strength at transfer in the denominator of each equation. Among the
10 sets of test specimens cast in this study, eight different concrete strengths existed at
the time of transfer as shown in Table 4.5. The concrete strengths ranged from 4800 psi
to 6400 psi. In comparison to the achievable concrete strengths, this range is somewhat
small, but was still considered in the evaluation of factors influencing transfer lengths
Average transfer lengths ranged from 14.1 in. to 28.2 in. with standard deviations
as high as 9.8 in. Table 4.5 lists the average transfer length for each concrete strength at
the live end, the dead end, and both ends combined. The standard deviations as well as
the maximum and minimum values are also listed showing the level of variability in the
measurements. In conjunction with Table 4.5, Figure 4.12 plots each transfer length
measurement against the square root of each corresponding concrete strength. The data
shows a significant amount of scatter, but does show a slight trend of decreasing transfer
length with an increase in concrete strength at transfer. As previously noted, the range of
concrete strengths was very small, but considered typical with respect to those used in the
bridge industry therefore the effect of high strength concretes was not investigated in this
study. Based on prior research, as with the stress in the strand and strand diameter, the
concrete strength was included in the derivation of the proposed transfer length equation
in Section 4.1.10.

124
Table 4.5. Influence of Concrete Strength
4800 4900 5000 5300 5700 6000 6100 6400AVE 22.6 17.5 24.5 28.2 19.6 27.1 22.0 21.1
STDEV 3.5 0.7 3.9 9.8 2.6 8.3 2.6 1.4MAX 28.9 18.4 30.5 43.3 23.4 41.1 25.4 23.1MIN 18.3 16.7 18.8 18.1 15.0 20.8 17.6 19.3AVE 24.1 14.1 21.0 18.7 16.6 17.0 20.9 14.5
STDEV 9.3 1.2 5.4 5.4 2.1 3.5 5.3 2.9MAX 46.8 15.5 30.9 24.5 20.4 21.1 34.2 17.8MIN 15.8 12.3 12.8 12.5 14.3 13.5 16.2 10.7AVE 23.3 15.6 22.7 23.4 18.1 22.1 21.5 17.8
STDEV 7.1 2.0 5.0 9.2 2.8 8.1 4.2 4.0MAX 46.8 18.4 30.9 43.3 23.4 41.1 34.2 23.1MIN 15.8 12.3 12.8 12.5 14.3 13.5 16.2 10.7
Concrete Strength (psi)Transfer Lengths (in.)
Live
Dea
dTo
tal
y = -0.2581x + 40.111R2 = 0.0253
0
5
10
15
20
25
30
35
40
45
50
68 70 72 74 76 78 80 82
Tran
sfer
Len
gth
(in.)
'cif
Figure 4.12. Influence of Concrete Strength
4.1.7 Influence of Time
As with strand diameter, effective prestress, and method of release, transfer
lengths have also been shown to increase with time, usually occurring within the first few
weeks following transfer. Transfer length measurements in this study were taken at the
time of transfer and one to two weeks thereafter. Table 4.6 lists the initial and

125
succeeding, or last, transfer length measurements for the T-beam test specimens along
with ratios of the last to initial measurements. Transfer lengths at the live ends of the T-
beam test specimens with both normal and inverted casting orientations showed an
average increase of 4 percent, while the transfer lengths at the dead ends of the T-beam
test specimens with normal and inverted casting orientations showed an average increase
of 13 and 11 percent, respectively, while the overall average increase of initial to last
transfer length measurements was 8 percent. Figure 4.13 shows a graphical
representation of the data plotting the ratio of the last to initial measurements. As Figure
4.13 shows, transfer lengths at the dead ends of T-beam test specimens show a tendency
for a larger increase with time.
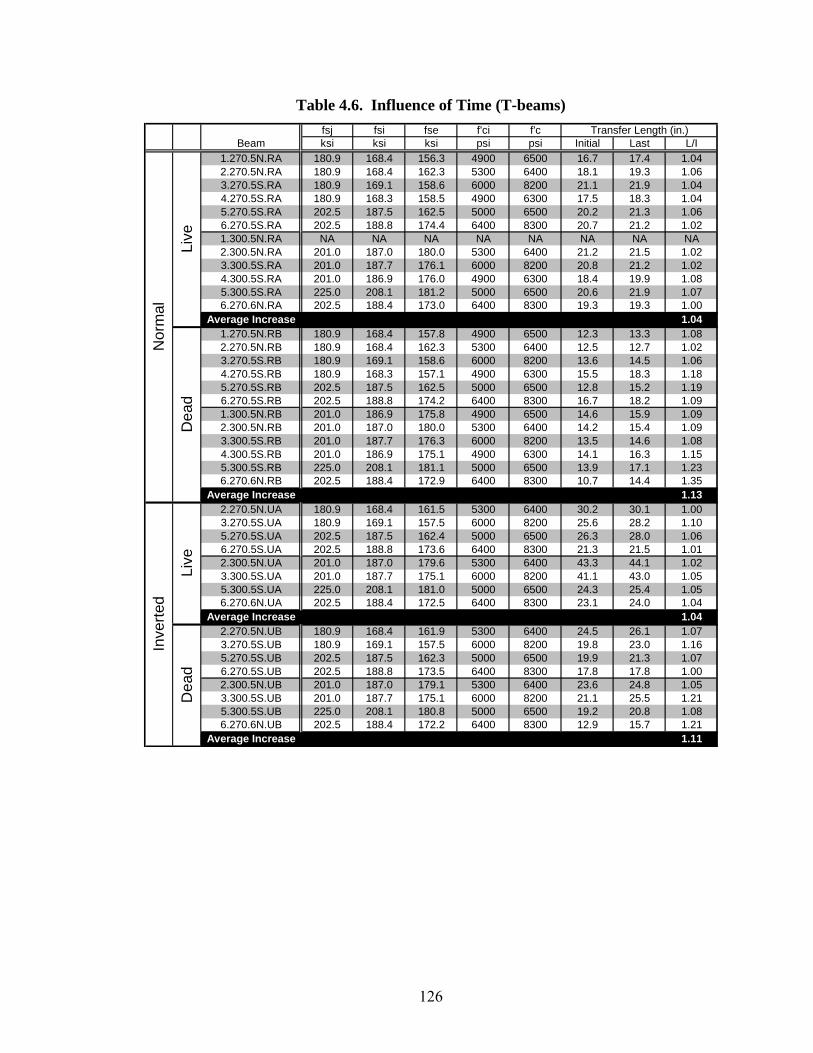
126
Table 4.6. Influence of Time (T-beams) fsj fsi fse f'ci f'c
Beam ksi ksi ksi psi psi Initial Last L/I1.270.5N.RA 180.9 168.4 156.3 4900 6500 16.7 17.4 1.042.270.5N.RA 180.9 168.4 162.3 5300 6400 18.1 19.3 1.063.270.5S.RA 180.9 169.1 158.6 6000 8200 21.1 21.9 1.044.270.5S.RA 180.9 168.3 158.5 4900 6300 17.5 18.3 1.045.270.5S.RA 202.5 187.5 162.5 5000 6500 20.2 21.3 1.066.270.5S.RA 202.5 188.8 174.4 6400 8300 20.7 21.2 1.021.300.5N.RA NA NA NA NA NA NA NA NA2.300.5N.RA 201.0 187.0 180.0 5300 6400 21.2 21.5 1.023.300.5S.RA 201.0 187.7 176.1 6000 8200 20.8 21.2 1.024.300.5S.RA 201.0 186.9 176.0 4900 6300 18.4 19.9 1.085.300.5S.RA 225.0 208.1 181.2 5000 6500 20.6 21.9 1.076.270.6N.RA 202.5 188.4 173.0 6400 8300 19.3 19.3 1.00
Average Increase 1.041.270.5N.RB 180.9 168.4 157.8 4900 6500 12.3 13.3 1.082.270.5N.RB 180.9 168.4 162.3 5300 6400 12.5 12.7 1.023.270.5S.RB 180.9 169.1 158.6 6000 8200 13.6 14.5 1.064.270.5S.RB 180.9 168.3 157.1 4900 6300 15.5 18.3 1.185.270.5S.RB 202.5 187.5 162.5 5000 6500 12.8 15.2 1.196.270.5S.RB 202.5 188.8 174.2 6400 8300 16.7 18.2 1.091.300.5N.RB 201.0 186.9 175.8 4900 6500 14.6 15.9 1.092.300.5N.RB 201.0 187.0 180.0 5300 6400 14.2 15.4 1.093.300.5S.RB 201.0 187.7 176.3 6000 8200 13.5 14.6 1.084.300.5S.RB 201.0 186.9 175.1 4900 6300 14.1 16.3 1.155.300.5S.RB 225.0 208.1 181.1 5000 6500 13.9 17.1 1.236.270.6N.RB 202.5 188.4 172.9 6400 8300 10.7 14.4 1.35
Average Increase 1.132.270.5N.UA 180.9 168.4 161.5 5300 6400 30.2 30.1 1.003.270.5S.UA 180.9 169.1 157.5 6000 8200 25.6 28.2 1.105.270.5S.UA 202.5 187.5 162.4 5000 6500 26.3 28.0 1.066.270.5S.UA 202.5 188.8 173.6 6400 8300 21.3 21.5 1.012.300.5N.UA 201.0 187.0 179.6 5300 6400 43.3 44.1 1.023.300.5S.UA 201.0 187.7 175.1 6000 8200 41.1 43.0 1.055.300.5S.UA 225.0 208.1 181.0 5000 6500 24.3 25.4 1.056.270.6N.UA 202.5 188.4 172.5 6400 8300 23.1 24.0 1.04
Average Increase 1.042.270.5N.UB 180.9 168.4 161.9 5300 6400 24.5 26.1 1.073.270.5S.UB 180.9 169.1 157.5 6000 8200 19.8 23.0 1.165.270.5S.UB 202.5 187.5 162.3 5000 6500 19.9 21.3 1.076.270.5S.UB 202.5 188.8 173.5 6400 8300 17.8 17.8 1.002.300.5N.UB 201.0 187.0 179.1 5300 6400 23.6 24.8 1.053.300.5S.UB 201.0 187.7 175.1 6000 8200 21.1 25.5 1.215.300.5S.UB 225.0 208.1 180.8 5000 6500 19.2 20.8 1.086.270.6N.UB 202.5 188.4 172.2 6400 8300 12.9 15.7 1.21
Average Increase 1.11
Inve
rted
Dea
dLi
ve
Nor
mal
Dea
dLi
ve
Transfer Length (in.)

127
0
0.2
0.4
0.6
0.8
1
1.2
1.4
1.6
1.270
.5N.R
2.270
.5N.R
3.270
.5S.R
4.270
.5S.R
5.270
.5S.R
6.270
.5S.R
1.300
.5N.R
2.300
.5N.R
3.300
.5S.R
4.300
.5S.R
5.300
.5S.R
6.270
.6N.R
2.270
.5N.U
3.270
.5S.U
5.270
.5S.U
6.270
.5S.U
2.300
.5N.U
3.300
.5S.U
5.300
.5S.U
6.270
.6N.U
Beam Designation
Rat
io o
f Las
t to
Initi
al T
rans
fer L
engt
hsLive End
Dead End
Normal Orientation Inverted Orientation
Figure 4.13. Influence of Time (T-beams)
In addition to the comparisons drawn with the T-beam test specimens, the initial
and last set of transfer lengths were also compared for each set of transfer length
measurements associated with the top-strand blocks. Table 4.7 compares initial and last
transfer length measurements for the top-strand block test specimens, while Figure 4.14
shows the average ratios between initial and last transfer length measurements for each
set of test specimens. Additional tables with individual results can be seen in Appendix
D, while additional figures with individual comparisons can be seen in Appendix E. The
transfer lengths at both ends of all top-strand block test specimens showed an average
increase of 8 percent, consistent with the average increase in transfer length for the T-
beam test specimens.

128
Table 4.7. Influence of Time (Top-strand Blocks) fsj fsi fse f'ci f'c
Pour ksi ksi ksi psi psi Initial Last L/I1 202.5 Varied Varied 4800 5900 22.6 24.4 1.082 202.5 Varied Varied 5700 6600 19.6 21.3 1.083 202.5 Varied Varied 6100 7000 22.0 23.3 1.064 202.5 Varied Varied 5000 6100 25.2 27.8 1.10
Average Increase 1.081 202.5 Varied Varied 4800 5900 24.1 25.4 1.062 202.5 Varied Varied 5700 6600 16.6 18.1 1.093 202.5 Varied Varied 6100 7000 20.9 22.8 1.094 202.5 Varied Varied 5000 6100 22.8 25.2 1.11
Average Increase 1.08
Dea
d
Average Transfer Length (in.)
Live
0
0.2
0.4
0.6
0.8
1
1.2
1.4
1.6
Pour 1 Pour 2 Pour 3 Pour 4
Beam Designation
Rat
io o
f Las
t to
Initi
al T
rans
fer L
engt
hs
Live End
Dead End
Figure 4.14. Influence of Time (Top Strand Blocks)
4.1.8 Influence of Casting Orientation
The influence of the top-bar effect has been seldom investigated in prestressed
concrete, but has been an area of concern in reinforced concrete. As defined in the
current ACI and AASHTO codes, the top-bar effect has been thought to be dependent on
the amount of concrete cast beneath the bar. In the case of prestressed concrete, it was
also expected to be dependent on the amount of concrete cast beneath the strand. Initially
a secondary objective of the project, the top-strand effect was investigated by casting
eight of the twenty T-beam test specimens with an inverted orientation. Table 4.8 lists
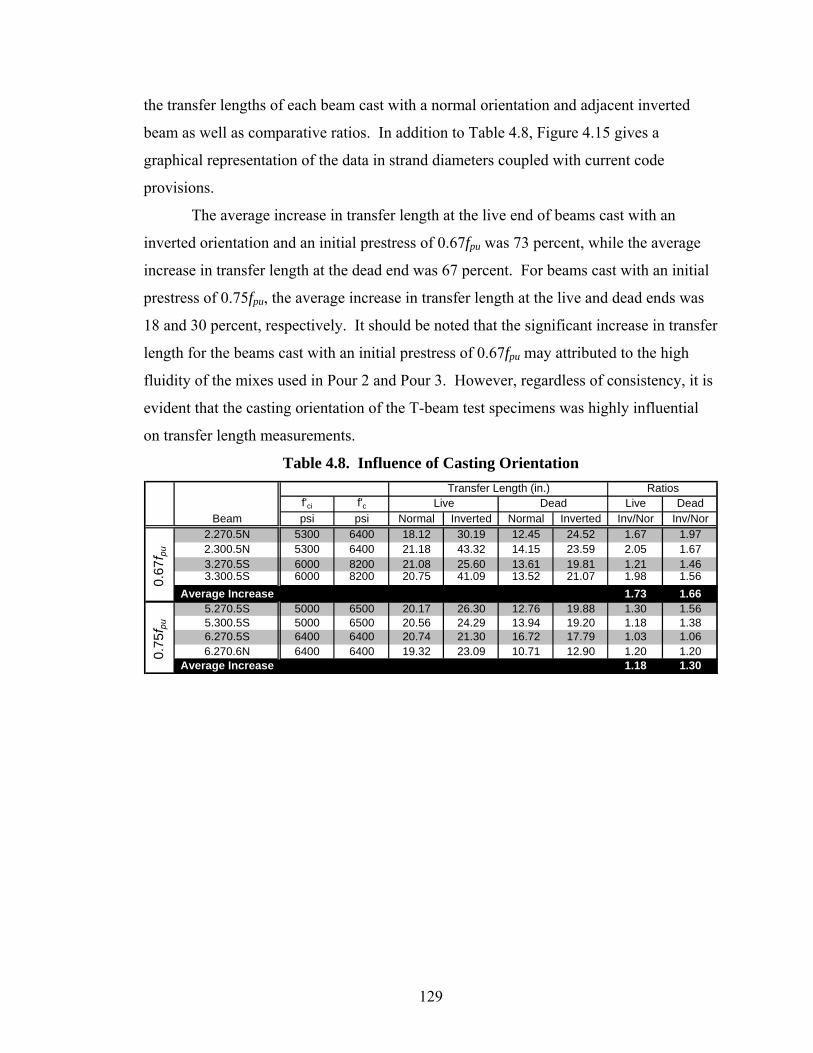
129
the transfer lengths of each beam cast with a normal orientation and adjacent inverted
beam as well as comparative ratios. In addition to Table 4.8, Figure 4.15 gives a
graphical representation of the data in strand diameters coupled with current code
provisions.
The average increase in transfer length at the live end of beams cast with an
inverted orientation and an initial prestress of 0.67fpu was 73 percent, while the average
increase in transfer length at the dead end was 67 percent. For beams cast with an initial
prestress of 0.75fpu, the average increase in transfer length at the live and dead ends was
18 and 30 percent, respectively. It should be noted that the significant increase in transfer
length for the beams cast with an initial prestress of 0.67fpu may attributed to the high
fluidity of the mixes used in Pour 2 and Pour 3. However, regardless of consistency, it is
evident that the casting orientation of the T-beam test specimens was highly influential
on transfer length measurements.
Table 4.8. Influence of Casting Orientation
f'ci f'c Live DeadBeam psi psi Normal Inverted Normal Inverted Inv/Nor Inv/Nor
2.270.5N 5300 6400 18.12 30.19 12.45 24.52 1.67 1.972.300.5N 5300 6400 21.18 43.32 14.15 23.59 2.05 1.673.270.5S 6000 8200 21.08 25.60 13.61 19.81 1.21 1.463.300.5S 6000 8200 20.75 41.09 13.52 21.07 1.98 1.56
Average Increase 1.73 1.665.270.5S 5000 6500 20.17 26.30 12.76 19.88 1.30 1.565.300.5S 5000 6500 20.56 24.29 13.94 19.20 1.18 1.386.270.5S 6400 6400 20.74 21.30 16.72 17.79 1.03 1.066.270.6N 6400 6400 19.32 23.09 10.71 12.90 1.20 1.20
Average Increase 1.18 1.30
DeadTransfer Length (in.) Ratios
Live
0.67
f pu0.
75f pu

130
0
10
20
30
40
50
60
70
80
90
100
2.270.5N 2.300.5N 3.270.5S 3.300.5S 5.270.5S 5.300.5S 6.270.5S 6.270.6N
Beam Designation
Tran
sfer
Len
gth
(stra
nd d
iam
eter
s)Live End NormalLive End InvertedDead End NormalDead End Invertedfse/3
f sj = 0.67f pu f sj = 0.75f pu
50db
60db
Figure 4.15. Influence of Casting Orientation
Concurrent to this investigation, another study revealed that the top-strand effect
may be more dependent on the amount of concrete cast above the strand rather than the
amount of concrete cast beneath the strand, thus raising a number of questions associated
with the true definition of the top-strand effect (Peterman 2007). In an effort to
determine the correlation of transfer lengths and the amount of concrete cast above and
beneath the strand, the transfer length for each of the T-beam test specimens was first
plotted against the amount of concrete cast below the strand and again plotted against the
amount of concrete cast above the strand.
Figure 4.16 shows each transfer length plotted against the amount of concrete cast
beneath the strand (bcast), showing a slight correlation between transfer length and depth
of concrete. Looking at Figure 4.16 alone, a conclusion could be drawn supporting the
traditional definition of the top-strand effect claiming transfer lengths to increase with an
increase in the depth of concrete cast beneath the strand. However, in the inverted T-
beam test specimens, as the amount of concrete beneath the strand increased, the amount
of concrete above the strand remained constant at 2 in. Contrary to Figure 4.16 and the
traditional definition of the top-strand effect, Figure 4.17 shows each transfer length

131
plotted against the amount of concrete cast above the strand (dcast) with a better
correlation existing than was shown in Figure 4.16. In addition to the representation of
the data in Figure 4.16 and 4.17, the data was separated with respect to strand type, but
no conclusions were drawn. Although, there seemed to be a better correlation between
measured transfer lengths and dcast than measured transfer lengths and bcast, an overall
definitive conclusion could not be drawn from the T-beam test specimens alone.
Therefore, a series of top-strand blocks were cast to further investigate the top-strand
effect in prestressed concrete.
y = 0.4722x + 15.942R2 = 0.2734
0
5
10
15
20
25
30
35
40
45
50
0 5 10 15 20 25
bcast (in.)
Tran
sfer
Len
gth
(in.)
1/2 in. Regular1/2 in. Super0.6 in.
Figure 4.16. Transfer Length vs. bcast (T-beams)

132
y = -0.5311x + 25.523R2 = 0.3347
0
5
10
15
20
25
30
35
40
45
50
0 5 10 15 20 25
dcast (in.)
Tran
sfer
Len
gth
(in.)
1/2 in. Regular1/2 in. Super0.6 in.
Figure 4.17. Transfer Length vs. dcast (T-beams)
Four sets of top-strand block test specimens were cast, which allowed for two
comparisons. The first compared the transfer lengths in two separate specimens with the
same amount of concrete cast beneath the strand, while having different amounts of
concrete cast above the strand. The second compared the transfer lengths in two separate
specimens with the same amount of concrete cast above the strand, while having different
amounts of concrete cast below the strand. Figure 4.18 compares the transfer lengths of
strands having the same amount of concrete cast beneath them. Transfer lengths at both
the live and dead ends for strands F, G, and H were compared to the transfer lengths for
strands C, D, and E, respectively, corresponding to concrete depths of 12 in., 7 in., and 2
in. below the strands. On the contrary, Figure 4.19 compares the transfer lengths of
strands having the same amount of concrete cast above them. Transfer lengths at both the
live and dead ends for strands F, G, and H were compared to the transfer lengths for
strands A, B, and C, respectively, corresponding to concrete depths of 2 in, 7 in., and 12
in. above the strands. Figure 4.18 and Figure 4.19 did seem to have more scatter than
previous studies and is attributed to possible material variations in fabrication. Although
a high level of quality control was used in the fabrication of the test specimens, some
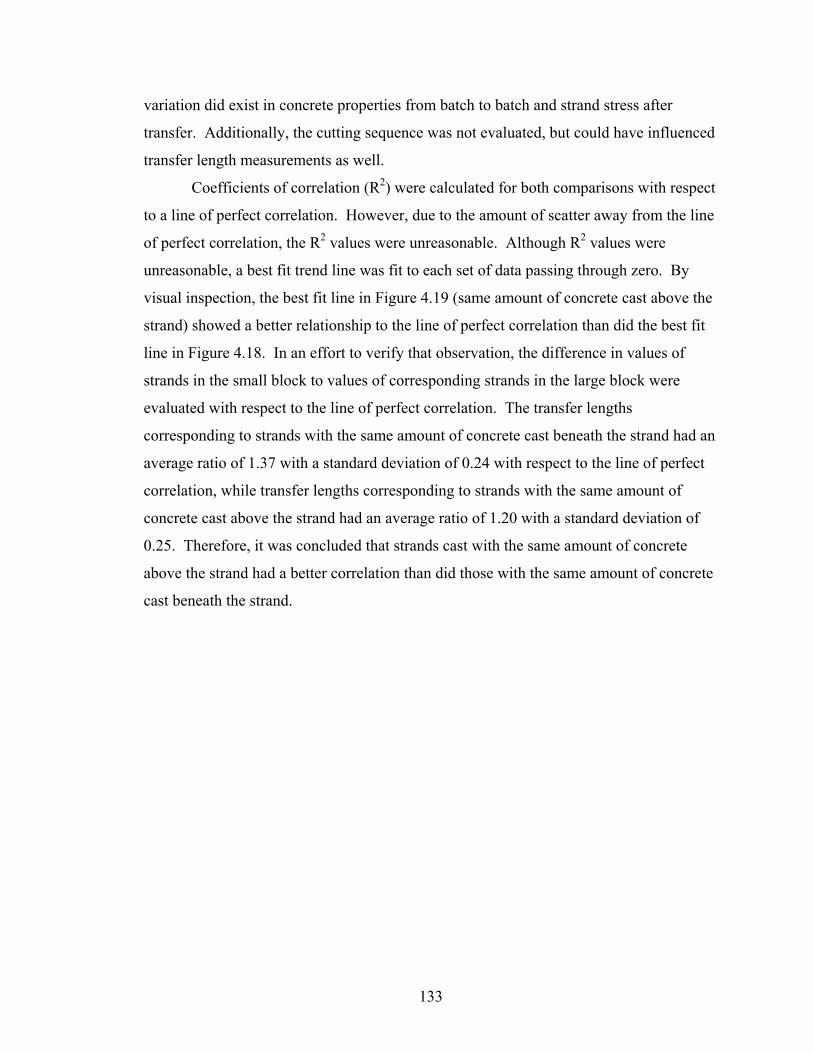
133
variation did exist in concrete properties from batch to batch and strand stress after
transfer. Additionally, the cutting sequence was not evaluated, but could have influenced
transfer length measurements as well.
Coefficients of correlation (R2) were calculated for both comparisons with respect
to a line of perfect correlation. However, due to the amount of scatter away from the line
of perfect correlation, the R2 values were unreasonable. Although R2 values were
unreasonable, a best fit trend line was fit to each set of data passing through zero. By
visual inspection, the best fit line in Figure 4.19 (same amount of concrete cast above the
strand) showed a better relationship to the line of perfect correlation than did the best fit
line in Figure 4.18. In an effort to verify that observation, the difference in values of
strands in the small block to values of corresponding strands in the large block were
evaluated with respect to the line of perfect correlation. The transfer lengths
corresponding to strands with the same amount of concrete cast beneath the strand had an
average ratio of 1.37 with a standard deviation of 0.24 with respect to the line of perfect
correlation, while transfer lengths corresponding to strands with the same amount of
concrete cast above the strand had an average ratio of 1.20 with a standard deviation of
0.25. Therefore, it was concluded that strands cast with the same amount of concrete
above the strand had a better correlation than did those with the same amount of concrete
cast beneath the strand.

134
y = 1.421x
0
10
20
30
40
50
0 10 20 30 40 50
Large Block Transfer Lengths (in.)
Sm
all B
lock
Tra
nsfe
r Len
gths
(in.
)
Figure 4.18. Transfer Length Correlation with same bcast
y = 1.200x
0
10
20
30
40
50
0 10 20 30 40 50
Large Block Transfer Lengths (in.)
Sm
all B
lock
Tra
nsfe
r Len
gths
(in.
)
Figure 4.19. Transfer Length Correlation with same dcast
Strand G
Strand D D G

135
In an effort to further verify the relationship between transfer length and the as-
cast vertical location, each of the 119 transfer length measurements were plotted against
the amount of concrete cast beneath the strand and the amount of concrete cast above the
strand. Figure 4.20 shows the relationship between transfer length measurements and the
amount of concrete cast beneath the strand, while Figure 4.21 shows the relationship
between transfer length measurements and the amount of concrete cast above the strand.
The data plotted in Figure 4.21 showed a much better correlation than did the data in
Figure 4.20 with a significantly better value for the coefficient of correlation. Table 4.9
further summarizes and verifies these relationships with average transfer lengths for each
amount of concrete cast below and above the strands as well as standard deviations for
each amount of concrete. The average standard deviation for transfer lengths compared
to the amount of concrete cast below the strand was 5.58 in. The average standard
deviation for transfer lengths compared to the amount of concrete cast above the strand
was 3.58 in. A smaller standard deviation indicates there was a better correlation for
transfer lengths of strands compared to the amount of concrete cast above the strand than
those compared to the amount of concrete cast below the strand.

136
y = 0.3384x + 39.158R2 = 0.0382
0
10
20
30
40
50
60
70
80
90
100
0 4 8 12 16 20 24bcast (in.)
Tran
sfer
Len
gth
(Stra
nd D
iam
eter
s)
50db
60db
Figure 4.20. Transfer Length vs. bcast (All Test Specimens)
y = -0.9707x + 50.967R2 = 0.317
0
10
20
30
40
50
60
70
80
90
100
0 4 8 12 16 20 24dcast (in.)
Tran
sfer
Len
gth
(Stra
nd D
iam
eter
s)
50db
60db
Figure 4.21. Transfer Length vs. dcast (All Test Specimens)

137
Table 4.9. As-cast Vertical Location Correlations
2 7 12 15 17 22AVE 21.7 21.2 21.9 36.8 24.9 23.1
STDEV 3.8 3.5 3.5 6.6 6.1 3.4MAX 30.5 25.7 28.9 43.3 41.1 29.3MIN 16.1 15.0 18.3 30.2 19.6 19.4AVE 17.7 19.9 24.6 24.1 18.7 19.7
STDEV 5.4 4.8 10.1 0.5 1.9 6.2MAX 30.8 30.2 46.8 24.5 21.4 30.9MIN 10.7 14.5 16.1 23.6 15.5 12.9AVE 19.7 20.5 23.2 30.4 21.8 21.4
STDEV 5.1 4.3 7.7 7.9 5.5 5.3MAX 30.8 30.2 46.8 43.3 41.1 30.9MIN 10.7 14.5 16.1 23.6 15.5 12.9AVE 26.0 22.9 22.2 18.7 19.2 18.1
STDEV 5.8 2.2 3.9 1.9 1.7 1.2MAX 43.3 25.7 30.5 21.2 21.1 19.3MIN 19.2 19.6 18.3 16.7 15.0 16.1AVE 23.5 20.6 18.1 13.4 15.0 14.8
STDEV 7.1 4.5 2.9 1.0 1.5 2.1MAX 46.8 30.2 24.7 14.6 17.3 16.5MIN 12.9 15.5 14.3 12.3 12.8 10.7AVE 24.8 21.7 20.1 15.6 17.1 16.4
STDEV 6.6 3.7 4.0 3.0 2.7 2.4MAX 46.8 30.2 30.5 21.2 21.1 19.3MIN 12.9 15.5 14.3 12.3 12.8 10.7
Transfer Lengths (in.)Depth of Concrete (in.)
Live
Dea
d
Con
cret
e B
elow
Con
cret
e A
bove
Tota
lLi
veD
ead
Tota
l
4.1.9 Current and Recommended Equations
Since the 1963 ACI Building Code was published, transfer length has been
calculated by Equation (2-3). Equation (2-3) takes into consideration the strand diameter
and the effective prestress in the strand after all losses. However, Equation (2-3) fails to
account for the strength of the concrete and the vertical casting location.
3se
t bfL d⎛ ⎞= ⎜ ⎟
⎝ ⎠ Eq. (2-3)
Over the past 35 years, a number of researchers have proposed various equations
incorporating concrete strength and have recommended using the prestress just after
transfer in place of the effective prestress. Some equations have proved to be adequate in
the estimation of transfer length, while others have failed to reproduce conservative
values. Taking into consideration the recommendations of past researchers, the transfer
lengths calculated in this study were compared to 14 different transfer length equations,

138
shown again in Table 4.10. Figure 4.22 through Figure 4.35 show this comparison to
each of those equations with a line of perfect correlation. Actual values were plotted on
the ordinate axis while the predicted values from each equation were plotted on the
abscissa axis with a line of perfect correlation aiding in interpretation of the data. If the
predicted value for a specimen is larger than the measured value, a conservative estimate,
the point would fall below the line of perfect correlation. However, if the predicted value
for a specimen is smaller than the measured value, an unconservative estimate, the point
would fall above the line of perfect correlation.
The first equation evaluated, shown in Figure 4.22, was the traditional equation
from ACI (Equation 2-3). Figure 4.22 indicated Equation (2-3) gives a relatively
constant transfer length, which in some cases exhibited unconservative estimations. In a
similar manner, Equation (2-4), shown in Figure 4.23, provided even more constant
values for transfer length, proving to be even more unconservative with respect to the
data from this study. On the contrary, Equation (2-6) by Martin and Scott (Figure 4.24)
produced extremely conservative results even though the predicted values again remained
relatively constant.
Equation (2-7), shown in Figure 4.25, proposed by Zia and Mostafa, was one of
the first equations to account for concrete strength, producing very good average results.
Average results are satisfactory if all data points fall on or close to the line of perfect
correlation, but in this case, a number of data points were above the line of perfect
correlation, indicating a lack of conservatism. On the other hand, Equation (2-8), shown
in Figure 4.26, produced a conservative estimation of transfer lengths, also showing a
good range in the estimations. Equation (2-9) goes back to only including the stress in
the stand and diameter of the strand, but replaces the effective prestress with the initial
prestress. However, as shown in Figure 4.27, the results again produce a relatively
constant value for transfer length, which may be too conservative in favorable situations,
but also may be unconservative in highly fluid mixes or members subject to the top-
strand effect.
Of the additional equations shown in Figure 4.28 through Figure 4.35, Equation
(2-10) and Equation (2-16) prove to be unconservative in their estimation of transfer
lengths as compared to those measured in this study. Equations (2-13), (2-14), (2-18),

139
and (2-19) provide conservative estimates, but also produce relatively constant values
with a very small range in predicted values. Equations (2-15) and (2-17) produced
acceptable estimations for this data, with Equation (2-17) by Kose and Burkett estimating
the transfer lengths of the 0.6 in. diameter strands much better than previous equations.
Through this comparison, it is evident that transfer length is dependent upon more
than just effective prestress and strand diameter. Of the 14 equations examined, six used
the initial prestress instead of the effective prestress, seven included the strength of the
concrete, and one included the influence of casting position. Of the 14 equations and the
various factors considered, none of the 14 takes into account the initial prestress, the
concrete strength, the strand diameter, and the casting position simultaneously. Based on
the previous comparisons of the factors affecting transfer length and the evaluation of the
current code provisions and recommended transfer length equations, an equation
incorporating each of these four factors is proposed.
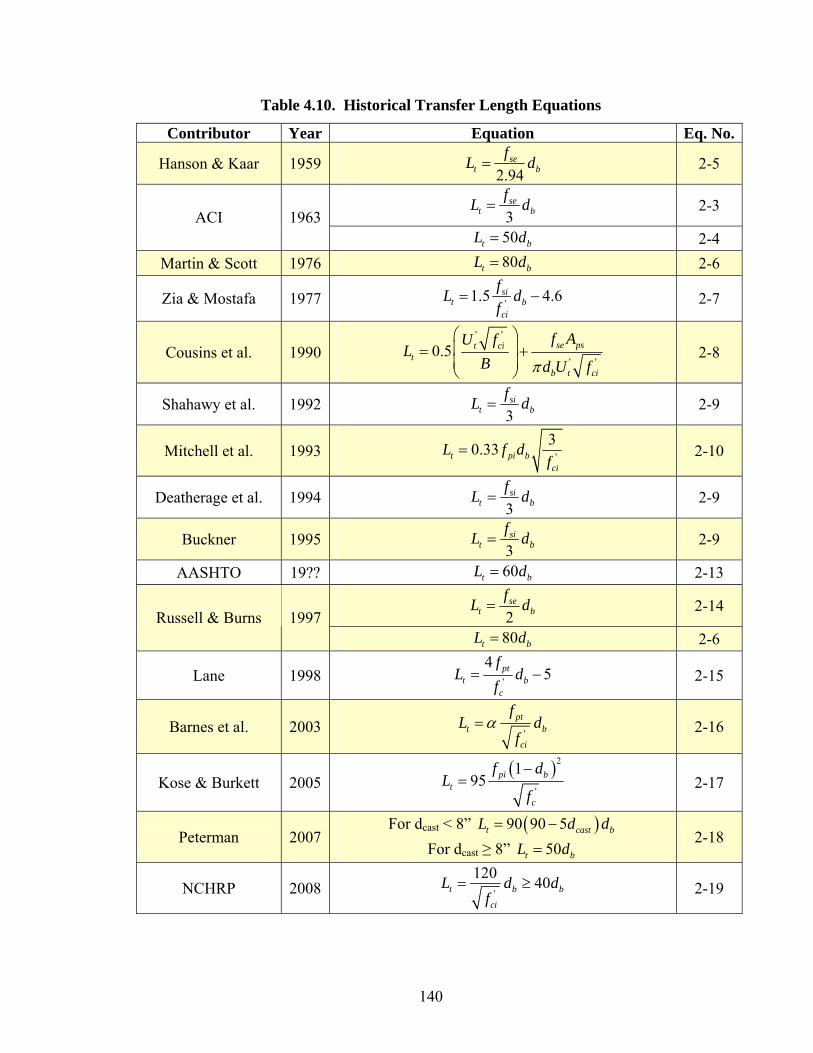
140
Table 4.10. Historical Transfer Length Equations
Contributor Year Equation Eq. No.
Hanson & Kaar 1959 2.94
set b
fL d= 2-5
3se
t bfL d= 2-3
ACI 1963 50t bL d= 2-4
Martin & Scott 1976 80t bL d= 2-6
Zia & Mostafa 1977 '1.5 4.6sit b
ci
fL df
= − 2-7
Cousins et al. 1990 ' '
' '0.5 se pst ci
t
b t ci
f AU fL
B d U fπ
⎛ ⎞⎜ ⎟= +⎜ ⎟⎝ ⎠
2-8
Shahawy et al. 1992 3si
t bfL d= 2-9
Mitchell et al. 1993 '
30.33t pi bci
L f df
= 2-10
Deatherage et al. 1994 3si
t bfL d= 2-9
Buckner 1995 3si
t bfL d= 2-9
AASHTO 19?? 60t bL d= 2-13
2se
t bfL d= 2-14
Russell & Burns 1997 80t bL d= 2-6
Lane 1998 '
45pt
t bc
fL d
f= − 2-15
Barnes et al. 2003 '
ptt b
ci
fL d
fα= 2-16
Kose & Burkett 2005 ( )2
'
195 pi b
t
c
f dL
f
−= 2-17
Peterman 2007 For dcast < 8” ( )90 90 5t cast bL d d= −
For dcast ≥ 8” 50t bL d= 2-18
NCHRP 2008 '
120 40t b b
ci
L d df
= ≥ 2-19
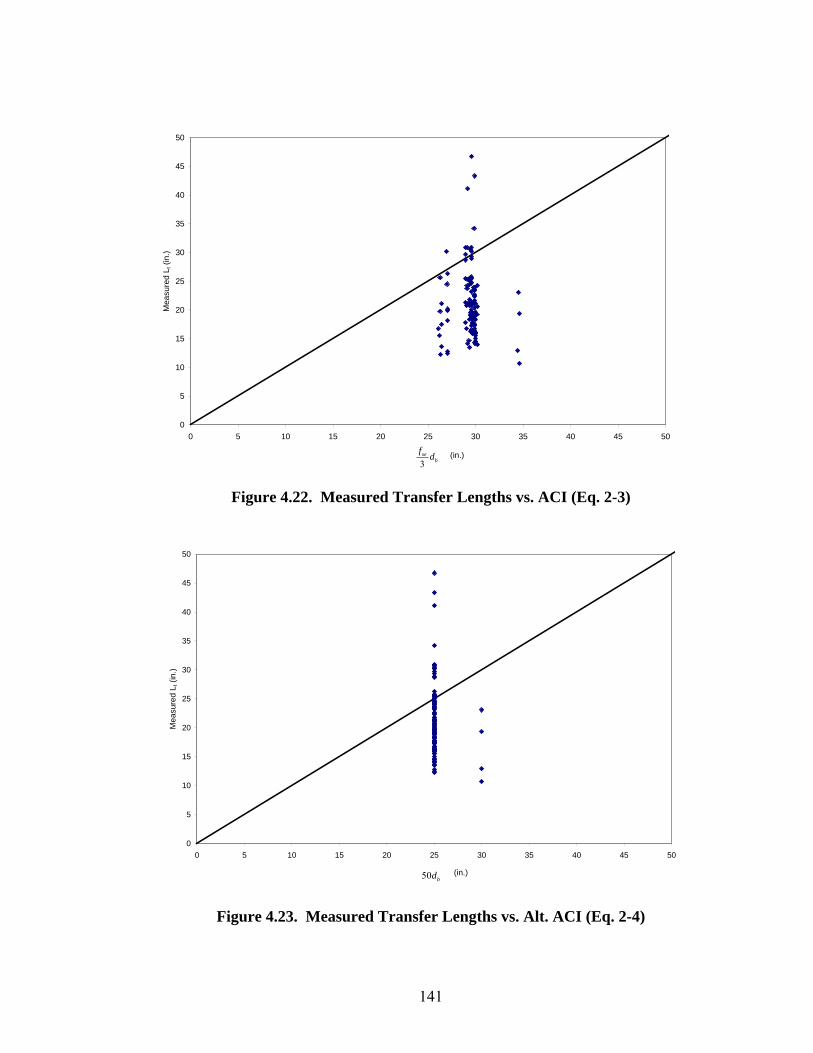
141
0
5
10
15
20
25
30
35
40
45
50
0 5 10 15 20 25 30 35 40 45 50
(in.)
Mea
sure
d L t
(in.
)
3se
bf d
Figure 4.22. Measured Transfer Lengths vs. ACI (Eq. 2-3)
0
5
10
15
20
25
30
35
40
45
50
0 5 10 15 20 25 30 35 40 45 50
(in.)
Mea
sure
d L t
(in.
)
50 bd
Figure 4.23. Measured Transfer Lengths vs. Alt. ACI (Eq. 2-4)

142
0
5
10
15
20
25
30
35
40
45
50
0 5 10 15 20 25 30 35 40 45 50
(in.)
Mea
sure
d L t
(in.
)
80 bd
Figure 4.24. Measured Transfer Lengths vs. Martin and Scott (Eq. 2-6)
0
5
10
15
20
25
30
35
40
45
50
0 5 10 15 20 25 30 35 40 45 50
(in.)
Mea
sure
d L t
(in.
)
'1.5 4.6sib
ci
f df
−
Figure 4.25. Measured Transfer Lengths vs. Zia and Mostafa (Eq. 2-7)

143
0
5
10
15
20
25
30
35
40
45
50
0 5 10 15 20 25 30 35 40 45 50
(in.)
Mea
sure
d L t
(in.
)
' '
' '0.5 se pst ci
b t ci
f AU fB d U fπ
⎛ ⎞⎜ ⎟ +⎜ ⎟⎝ ⎠
Figure 4.26. Measured Transfer Lengths vs. Cousins et al. (Eq. 2-8)
0
5
10
15
20
25
30
35
40
45
50
0 5 10 15 20 25 30 35 40 45 50
(in.)
Mea
sure
d L t
(in.
)
3si
bf d
Figure 4.27. Measured Transfer Lengths vs. Shahawy et al. (Eq. 2-9)

144
0
5
10
15
20
25
30
35
40
45
50
0 5 10 15 20 25 30 35 40 45 50
(in.)
Mea
sure
d L t
(in.
)
'
30.33 pi bci
f df
Figure 4.28. Measured Transfer Lengths vs. Mitchell et al. (Eq. 2-10)
0
5
10
15
20
25
30
35
40
45
50
0 5 10 15 20 25 30 35 40 45 50
(in.)
Mea
sure
d L t
(in.
)
60 bd
Figure 4.29. Measured Transfer Lengths vs. AASHTO (Eq. 2-13)

145
0
5
10
15
20
25
30
35
40
45
50
0 5 10 15 20 25 30 35 40 45 50
(in.)
Mea
sure
d L t
(in.
)
2se
bf d
Figure 4.30. Measured Transfer Lengths vs. Russell and Burns (Eq. 2-14)
0
10
20
30
40
50
60
70
0 10 20 30 40 50 60 70
(in.)
Mea
sure
d L t
(in.
)
'
45pt
bc
fd
f−
Figure 4.31. Measured Transfer Length vs. Lane (Eq. 2-15)

146
0
5
10
15
20
25
30
35
40
45
50
0 5 10 15 20 25 30 35 40 45 50
(in.)
Mea
sure
d L t
(in.
)
'
ptb
ci
fd
fα
Figure 4.32. Measured Transfer Lengths vs. Barnes et al. (Eq. 2-16)
0
10
20
30
40
50
60
70
0 10 20 30 40 50 60 70
(in.)
Mea
sure
d L t
(in.
)
( )2
'
195 pi b
c
f d
f
−
Figure 4.33. Measured Transfer Lengths vs. Kose and Burkett (Eq. 2-17)

147
0
5
10
15
20
25
30
35
40
45
50
0 5 10 15 20 25 30 35 40 45 50
(in.)
Mea
sure
d L t
(in.
)
( )8", 90 58",50
cast cast b
cast b
d d dd d
< −
≥ Figure 4.34. Measured Transfer Lengths vs. Peterman (Eq. 2-18)
0
10
20
30
40
50
60
70
0 10 20 30 40 50 60 70
(in.)
Mea
sure
d L t
(in.
)
'
120 40b b
ci
d df
≥
Figure 4.35. Measured Transfer Lengths vs. NCHRP (Eq. 2-19)

148
4.1.10 Proposed Transfer Length Equation
The derivation of the proposed transfer length equation, shown as Equation (4-1),
was a step-by-step process involving a number of iterations and statistical analyses for
the final determination of coefficients X, Y, and Z and the later addition of ζ.
Figure 4.21 showed the relationship of the measured transfer lengths and the amount of
concrete cast above the strand. Transfer lengths were found to be heavily dependent on
the amount of concrete cast above the strand. In Figure 4.21, a linear best fit line was
used in lieu of a polynomial equation to maintain simplicity. Using a polynomial
equation did result in an insignificant increase in the coefficient of correlation. Had a
polynomial equation been used as shown by the dashed line in Figure 4.36, it could be
noted that the average transfer lengths tended to level off when dcast reached
approximately 24 in. It was assumed that a strand cast with more than 24 in. of concrete
above it would not experience any top-strand effect. The proposed equation is broken up
into two terms because the effect of vertical casting position appeared to be independent
of the initial prestress, strand diameter, and concrete strength after evaluation of those
factors. The first term in the proposed equation is the basic transfer length equation for
the calculation for bottom-cast strands (dcast > 24 in.). The second term is the top-strand
factor that accounts for the increases in transfer length associated with a decrease in dcast.
The relationship of the two equations can be seen in Figure 4.36, where the horizontal
line is from the first term where there was more than 24 in. of concrete cast above the
strand and the sloped line is from the second term where transfer length tends to increase
with less than 24 in. of concrete cast above the strand.
The first step in the derivation was to determine the coefficient X or where the
two lines intersect. In other words, by plotting the transfer length minus the basic
transfer length equation of strands with less than 24 in. of concrete cast above the strand
against (24 – dcast), the best fit line would intersect at point B in Figure 4.36. Focusing on
For dcast < 24 in. ( )'
24 Ycastsi
t b
ci
dfL X dZf
ζ−
= +
For dcast ≥ 24 in. '
sit b
ci
fL X df
= Eq. (4-1)

149
the sloped portion of the solid line in Figure 4.36, Figure 4.37 plots all of the data from
this study, which had less than 24 in. of concrete cast above the strand. This was
accomplished by subtracting the first term in Equation (4-1) from the existing transfer
length measurements by iterating X until the y-intercept was equal to zero, resulting in X
= 10.89. It can also be observed in Figure 4.37 that average transfer length measurements
tend to increase approximately ½ in. with a 1 in. decrease of dcast. Therefore, for the data
reported herein, the average transfer lengths could be approximated by Equation (4-2)
with X rounded to 11 and the slope of the best fit line in Figure 4.37 rounded to ½ or Z =
2 and Y = 1 as shown in Equation (4-1).
'si
b
ci
fX df
12 in.
24castd >24castd = 0castd =
1
Z
Tran
sfer
Len
gth
A B
C
Amount of Concrete Above the Strand
'si
b
ci
fX df
12 in.
24castd >24castd = 0castd =
1
Z
Tran
sfer
Len
gth
A B
C
Amount of Concrete Above the Strand Figure 4.36. Average Predicted Transfer Length vs. dcast

150
y = 0.49x - 0.00R2 = 0.32
-10
0
10
20
30
40
0 4 8 12 16 20 24
(24 - d cast ) (in.)
(in.)'si
t b
ci
fL X df
−
Figure 4.37. Transfer Length – X(fsi/f’
ci1/2)db vs. (24 – dcast)
For dcast < 24 in. ( )'
2411
2castsi
t b
ci
dfL df
−= +
For dcast ≥ 24 in. '
11 sit b
ci
fL df
= Eq. (4-2)
The transfer lengths from this study were plotted against Equation (4-2) as shown
in Figure 4.38. The bold line in Figure 4.38 is the best fit linear regression line, which is
nearly aligned with the line of perfect correlation, showing a very good representation of
an average estimate for transfer length. As shown in Figure 4.38, about half the data is
above the line of perfect correlation showing unconservative estimations by Equation (4-
2). It is unreasonable to expect an equation to result in 100 percent conservative
estimates. Therefore, a 95 percent limit was selected for estimated values to be
considered conservative, similar to the derivation of other equations in the past that have
used the 95 percent confidence interval. Equation (4-2) was modified to Equation (4-3)
by trial and error. Note that the (24 – dcast) term was squared in the transition, which
tended to show a slightly better correlation for the data, especially for situations where
Note: X was iterated until the linear regression line had a y-intercept equal to zero. X was found to be 10.89 for the data in this study.

151
dcast was extremely small. Figure 4.39 shows the measured transfer lengths plotted
against predicted values using Equation (4-3), which resulted in a conservative estimation
for 96.6 percent of the data.
y = 0.9454x + 0.8118R2 = 0.3237
0
10
20
30
40
50
0 10 20 30 40 50
(in.)
Mea
sure
d L t
(in.
)
( )'
2411
2castsi b
c
df df
−+
Figure 4.38. Measured Transfer Length vs. Equation (4-2)
For dcast < 24 in. ( )2
'
2420
40castsi
t b
ci
dfL df
−= +
For dcast ≥ 24 in. '
20 sit b
ci
fL df
= Eq. (4-3)

152
y = 0.6638x - 0.3282R2 = 0.3189
0
10
20
30
40
50
0 10 20 30 40 50
(in.)
Mea
sure
d L t
(in.
)
( )2
'
2420
40castsi b
c
df df
−+
Figure 4.39. Measured Transfer Length vs. Equation (4-3)
Subsequent to the derivation of Equation (4-3), transfer length measurements
from seven previous studies were also compared to the estimates from the modified
equation. Figure 4.40 shows the measured transfer lengths from all seven studies plotted
against Equation (4-3) with a best fit linear regression line shown by the red line. The
relationship showed a small range along the abscissa, giving unconservative estimates for
25.3 percent of the data, while having a coefficient of correlation of only 0.179,
indicating a poor fit of the data with the current form of the equation. In order to better
estimate transfer lengths, it was imperative for the proposed equation to incorporate a
larger data set from various researchers. Therefore, the coefficients were again modified
until a reasonable amount of the data fell below the line of perfect correlation. The X
coefficient was changed from 20 to 35 accounting for a number of longer reported
transfer lengths for strands with more than 24 in. of concrete cast above the strand, while
the Y and Z coefficients remained the same. The further modified equation is listed as
Equation (4-4).

153
For dcast < 24 in. ( )2
'
2435
40castsi
t b
ci
dfL df
−= +
For dcast ≥ 24 in. '
35 sit b
ci
fL df
= Eq. (4-4)
Figure 4.41 shows the measured transfer lengths from the seven previous studies plotted
against Equation (4-4). Each data set is plotted separately to distinguish differences
among sets. All of the data except the measurements taken by Peterman were for mixes
using conventional concrete, while Peterman used mixes with high fluidity. Overall, 6
percent of the data fell above the line of perfect correlation, indicating a somewhat
unconservative relationship. In addition to the amount of data in excess of the predicted
values, the coefficient of correlation was 0.176. As shown by Peterman, the transfer
lengths for the mixes with high levels of fluidity had transfer lengths far surpassing those
reported herein with respect to casting position. For that reason, the factor ζ was added
to Equation (4-4) resulting in Equation (4-5).
y = 1.0162x - 5.1389R2 = 0.1791
0
20
40
60
80
100
0 20 40 60 80 100
(in.)
Tran
sfer
Len
gth
(in.)
( )2
'
2420
40castsi b
c
df df
−+
Figure 4.40. Measured Transfer Length from Prior Studies vs. Equation (4-3)

154
0
20
40
60
80
100
0 20 40 60 80 100
(in.)
Mea
sure
d L t
(in.
)
Cousins et al.Deatherage et al.PetermanRussell & Burns 1Russell & Burns 2Mitchell et al.*Lane
( )2
'
2435
40castsi
t b
ci
dfL df
−= +
Figure 4.41. Measured Transfer Length from Prior Studies vs. Equation (4-4)
For dcast < 24 in. ( )2
'
2435
40castsi
t b
ci
dfL df
ζ−
= +
For dcast ≥ 24 in. '
35 sit b
ci
fL df
= Eq. (4-5)
Of the 6 percent of the data falling above the line of perfect correlation, almost
half of those data points were from the Peterman data for mixes of high fluidity. It
should also be noted that the Peterman data was obtained using end-slip measurements.
The incorporation of the ζ factor allows for the increased influence of the top-strand
effect in members containing mixes of high fluidity. For the data used in this report,
mixes of high fluidity are limited to those used by Peterman where self consolidating
concrete was used. The data in Figure 4.41 was plotted again in Figure 4.42 using
Equation (4-5) and corresponding ζ values. A value of ζ = 1 was used for the data using
a conventional concrete mix and a value of ζ = 2 was applied to the Peterman data
associated with the high fluidity mixes. At the current time, high fluidity mixes are
defined as the SCC mixes used by Peterman. As a result of the modification, only 4.2
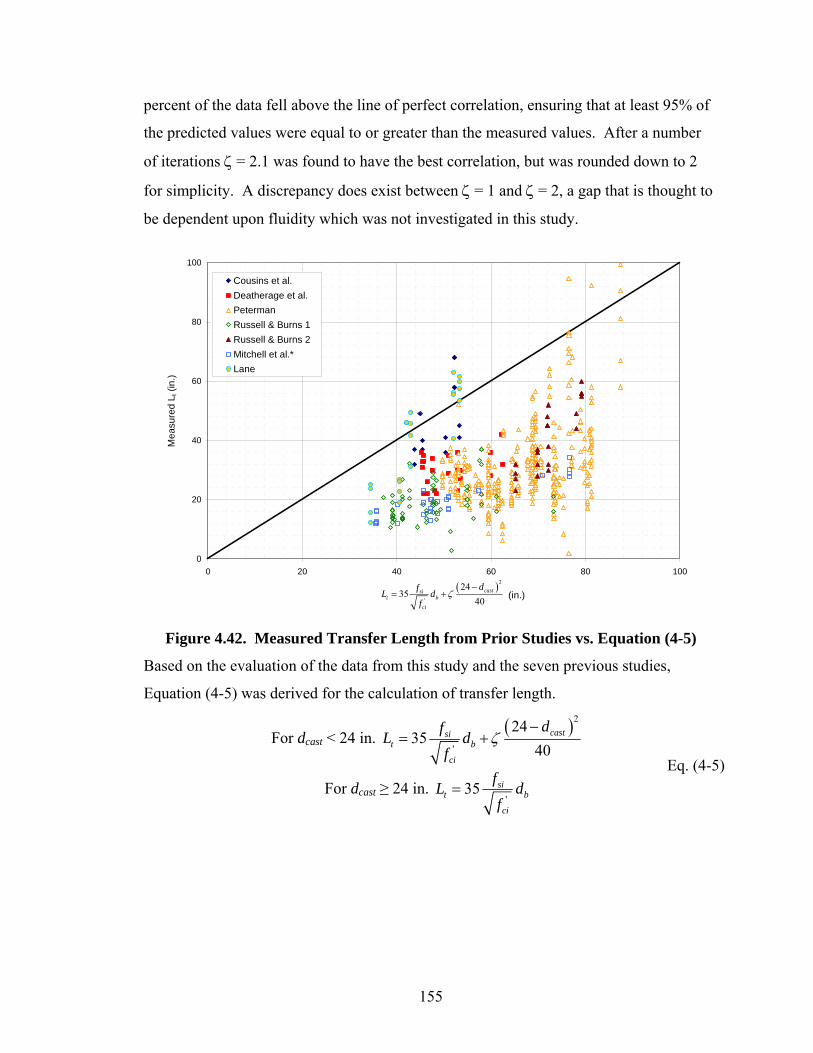
155
percent of the data fell above the line of perfect correlation, ensuring that at least 95% of
the predicted values were equal to or greater than the measured values. After a number
of iterations ζ = 2.1 was found to have the best correlation, but was rounded down to 2
for simplicity. A discrepancy does exist between ζ = 1 and ζ = 2, a gap that is thought to
be dependent upon fluidity which was not investigated in this study.
0
20
40
60
80
100
0 20 40 60 80 100
(in.)
Mea
sure
d L t
(in.
)
Cousins et al.Deatherage et al.PetermanRussell & Burns 1Russell & Burns 2Mitchell et al.*Lane
( )2
'
2435
40castsi
t b
ci
dfL df
ζ−
= +
Figure 4.42. Measured Transfer Length from Prior Studies vs. Equation (4-5)
Based on the evaluation of the data from this study and the seven previous studies,
Equation (4-5) was derived for the calculation of transfer length.
For dcast < 24 in. ( )2
'
2435
40castsi
t b
ci
dfL df
ζ−
= +
For dcast ≥ 24 in. '
35 sit b
ci
fL df
= Eq. (4-5)

156
4.2 End-slip
4.2.1 End-slip Measurements for Calculating Transfer Lengths
In addition to the use of concrete surface strains in the determination of transfer
lengths, end-slip measurements were also taken for 57 transfer zones and used in various
equations to calculate transfer lengths. The transfer length equations for use with end-
slip are shown again in Table 4.11. As previously noted, end-slip measurements were
only taken at the dead end of each test specimen as a result of fraying of the strand at the
live end upon transfer. The transfer lengths calculated from concrete surface strains are
listed in Table 4.12 along side the measured end-slips (Les) for the T-beam test
specimens. Also included are the calculated transfer lengths based on eight different
equations relating end-slip to transfer length. Table 4.13 through Table 4.16 list the
transfer lengths calculated from concrete surface strains, corresponding end-slip values,
and the eight different end-slip based transfer length calculations for each of the four sets
of top-strand block test specimens.
Transfer lengths were plotted against end-slip values as shown in Figure 4.43,
which shows an approximately linear relationship. In addition to the tabulated values, the
transfer lengths calculated from concrete surface strains are plotted against each of the
eight equations using end-slip measurements for the calculation of transfer lengths along
with best fit lines, shown in Figures 4.44 through 4.51. In the past, transfer lengths
calculated form concrete surface strains have shown better consistency (Russell and
Burns 1993) (Marti-Vargas et al. 2007). Of the eight equations, all but one showed a
good correlation between surface strain based transfer lengths and end-slip based transfer
lengths. The average ratio of calculated to measured transfer lengths was computed for
each equation, shown in Table 4.11. Equation (2-29), used by Russell and Barnes had the
lowest ratio, 1.01, Equations by Peterman and Logan had ratios of 1.04 and 1.06,
respectively, while the equation by Cousins et al. had a ratio of 1.11. Guyon’s equation
had a ratio of 1.21, while the three equations by Balasz failed to show a favorable
correlation having much higher ratios. Low average ratios of calculated to measured
transfer lengths indicated end-slip measurements to be a reliable method for the
determination of transfer lengths with the use of the correct equation. It should be noted,
however, that some equations fail to include the compressive strain in the concrete.

157
Neglecting the strain in the concrete could lead to false estimations of transfer lengths.
Thus, it is recommended that equations including the strain in the concrete be used for the
calculation of transfer lengths based on end-slips measurements.
Table 4.11. Historical Transfer Length Equations (End-Slip)
Contributor Year Equation Eq. No. ( )
( )
t Calc
t Meas
LL
Guyon 1948 est
si
LL αε
= 2-24 1.21
Cousins et al. 1990 2 es ps
tsi ps ci
L EL
f E ε=
− 2-23 1.11
Balasz 1992 3
4'218 es
t bci
LL d
f= 2-25 1.38
Balasz 1993 0.625
' 0.15 0.424.7 est
ci si
LLf ε
= 2-26 1.37
Balasz 1993 '0.158 si
t
ci es
fLf L
= 2-27 1.40
Russell & Burns 1996 294.9t esL L= 2-29 1.01 Logan 1997 308t esL L= 2-30 1.06
Peterman 2007 2
293.8es pst es
si
L EL L
f= = 2-28 1.04

158
Table 4.12. Transfer Lengths from End-slip Measurements (T-beams)
Lt Ave. Les
Beam (in.) (in.) Eq. 2-23 Eq. 2-24 Eq. 2-25 Eq. 2-26 Eq. 2-27 Eq. 2-28 Eq. 2-29 Eq. 2-302.270.5N.RB 12.5 0.0341 12.4 14.6 20.2 18.1 26.9 10.1 10.5 11.63.270.5S.RB 13.6 0.0401 14.5 16.5 20.8 19.7 24.4 11.8 12.4 13.54.270.5S.RB 15.5 0.0491 18.2 19.6 23.7 23.1 25.5 14.5 15.1 16.65.270.5S.RB 12.8 0.0451 14.8 16.7 22.8 20.9 28.7 13.3 13.9 13.76.270.5S.RB 16.7 0.0511 16.6 18.4 22.5 21.7 24.8 15.1 15.7 15.43.300.5S.RB 13.5 0.0461 15.1 17.0 22.0 20.6 26.1 13.6 14.2 14.04.300.5S.RB 14.1 0.0552 18.4 19.8 24.7 23.8 27.5 16.3 17.0 16.85.300.5S.RB 13.9 0.0490 14.5 16.4 23.5 21.1 31.3 14.5 15.1 13.46.270.6N.RB 10.7 0.0501 16.4 18.2 26.8 21.4 24.9 14.8 15.4 15.22.270.5N.UB 24.5 0.0581 21.3 22.7 24.7 25.3 23.5 17.1 17.9 19.73.270.5S.UB 19.8 0.0581 21.2 22.6 24.0 24.8 22.2 17.1 17.9 19.65.270.5S.UB 19.9 0.0631 20.8 22.2 25.9 25.7 26.4 18.6 19.4 19.26.270.5S.UB 17.8 0.0611 19.7 21.4 24.0 24.2 23.7 18.0 18.8 18.42.300.5N.UB 23.6 0.0892 29.5 30.2 29.0 31.7 23.5 26.3 27.5 27.23.300.5S.UB 21.1 0.0781 25.4 26.7 26.8 28.6 22.9 23.0 24.1 23.75.300.5S.UB 19.2 0.0670 20.0 21.4 26.5 25.6 28.9 19.8 20.6 18.46.270.6N.UB 12.9 0.0571 18.8 20.3 28.1 23.3 24.1 16.8 17.6 17.3
CalculatedMeasured
Table 4.13. Transfer Lengths from End-slip Measurements (TSB-Pour 1)
Lt Ave. Les
Strand (in.) (in.) Eq. 2-23 Eq. 2-24 Eq. 2-25 Eq. 2-26 Eq. 2-27 Eq. 2-28 Eq. 2-29 Eq. 2-30A 17.8 0.0641 20.3 22.4 26.3 26.1 27.1 18.9 19.7 19.4B 16.3 0.0494 15.6 17.9 23.8 22.2 28.9 14.6 15.2 14.9C 17.7 0.0714 22.6 24.6 27.4 27.9 26.3 21.1 22.0 21.6D 16.4 0.0657 20.8 22.9 26.5 26.5 26.9 19.4 20.2 19.9E 15.8 0.0617 19.5 21.6 25.9 25.5 27.3 18.2 19.0 18.6F 46.8 0.1497 48.1 48.3 36.1 44.4 21.8 44.2 46.1 45.3G 30.2 0.1044 33.3 34.6 31.6 35.4 23.9 30.8 32.2 31.6H 24.7 0.0717 23.1 24.7 27.4 28.0 26.3 21.2 22.1 21.7I 30.8 0.1122 36.4 37.3 32.4 37.2 23.3 33.1 34.6 34.3J 24.2 0.0705 22.8 24.5 27.2 27.8 26.1 20.8 21.7 21.5
MeasuredCalculated
Table 4.14. Transfer Lengths from End-slip Measurements (TSB-Pour 2)
Lt Ave. Les
Strand (in.) (in.) Eq. 2-23 Eq. 2-24 Eq. 2-25 Eq. 2-26 Eq. 2-27 Eq. 2-28 Eq. 2-29 Eq. 2-30A 15.9 0.0310 9.8 12.3 19.2 16.1 29.9 9.1 9.6 9.3B 15.5 0.0297 9.3 11.9 18.9 15.7 30.2 8.8 9.1 8.9C 16.1 0.0447 14.1 16.4 22.0 20.3 27.3 13.2 13.8 13.4D 14.5 0.0504 15.8 18.1 23.0 21.8 26.5 14.8 15.5 15.1E 14.5 0.0607 19.1 21.2 24.7 24.5 25.3 17.9 18.7 18.2F 20.4 0.0584 18.3 20.6 24.3 23.9 25.5 17.2 18.0 17.6G 18.9 0.0487 15.3 17.7 22.7 21.4 26.7 14.4 15.0 14.7H 14.3 0.0477 15.0 17.4 22.5 21.1 26.8 14.1 14.7 14.4I 19.6 0.0685 21.9 23.8 25.8 26.5 24.3 20.2 21.1 20.8J 16.3 0.0588 18.9 20.9 24.4 24.1 25.2 17.3 18.1 17.9
MeasuredCalculated

159
Table 4.15. Transfer Lengths from End-slip Measurement (TSB-Pour 3)
Lt Ave. Les
Strand (in.) (in.) Eq. 2-23 Eq. 2-24 Eq. 2-25 Eq. 2-26 Eq. 2-27 Eq. 2-28 Eq. 2-29 Eq. 2-30A 21.1 0.0807 25.7 27.3 27.0 29.0 22.7 23.8 24.9 24.3B 17.3 0.0651 20.7 22.6 24.9 25.4 23.9 19.2 20.0 19.6C 16.7 0.0581 18.5 20.5 23.9 23.6 24.6 17.1 17.9 17.5D 16.4 0.0591 18.8 20.8 24.0 23.9 24.5 17.4 18.2 17.8E 16.2 0.0651 20.7 22.6 24.9 25.4 23.9 19.2 20.0 19.6F 34.2 0.1234 39.4 40.3 31.6 37.9 20.4 36.4 38.0 37.3G 24.0 0.0741 23.7 25.4 26.1 27.5 23.1 21.8 22.8 22.4H 17.4 0.0741 23.7 25.4 26.1 27.5 23.1 21.8 22.8 22.4I 21.8 0.0688 22.4 24.0 25.4 26.4 23.4 20.3 21.2 21.0J 24.4 0.0645 21.0 22.7 24.8 25.4 23.7 19.0 19.9 19.7
CalculatedMeasured
Table 4.16. Transfer Lengths from End-slip Measurement (TSB-Pour 4)
Lt Ave. Les
Strand (in.) (in.) Eq. 2-23 Eq. 2-24 Eq. 2-25 Eq. 2-26 Eq. 2-27 Eq. 2-28 Eq. 2-29 Eq. 2-30A 30.9 0.1101 35.5 36.4 31.9 36.4 23.1 32.5 33.9 33.4B 21.4 0.0658 21.2 22.9 26.3 26.4 26.2 19.4 20.3 19.9C 19.0 0.0731 23.5 25.2 27.3 28.2 25.5 21.6 22.5 22.2D 17.3 0.0628 20.2 22.0 25.8 25.6 26.5 18.5 19.3 19.0E 16.5 0.0684 22.0 23.8 26.7 27.1 26.0 20.2 21.1 20.8F 25.7 0.0898 29.2 30.3 29.5 32.1 24.2 26.5 27.7 27.3G 21.3 0.0768 24.9 26.3 27.8 29.1 25.2 22.6 23.7 23.3H 19.1 0.0851 27.5 28.9 28.9 31.0 24.6 25.1 26.2 25.9I 30.8 0.1206 39.9 40.0 33.0 38.7 22.3 35.6 37.1 37.0J 25.5 0.0759 25.1 26.3 27.7 29.0 25.0 22.4 23.4 23.3
MeasuredCalculated

160
y = 249.12x + 3.0023R2 = 0.8016
0
10
20
30
40
50
0.00 0.02 0.04 0.06 0.08 0.10 0.12 0.14 0.16
End-slip (in.)
Trna
sfer
Len
gth
(in.)
Figure 4.43. Measured Transfer Length vs. End-slip Measurements
0
10
20
30
40
50
0 10 20 30 40 50
(in.)
Mea
sure
d L t
(in.
)
es
si
Lαε
Figure 4.44. Measured Transfer Lengths vs. Guyon (Eq. 2-24)
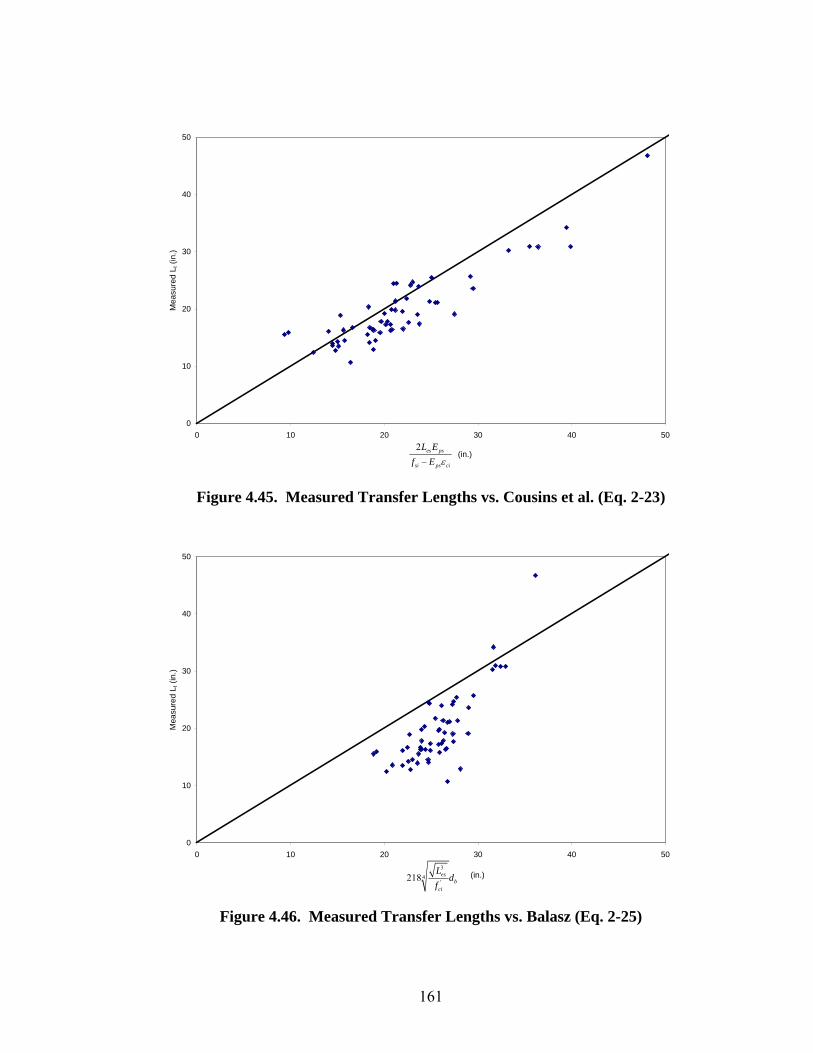
161
0
10
20
30
40
50
0 10 20 30 40 50
(in.)
Mea
sure
d L t
(in.
)
2 es ps
si ps ci
L Ef E ε−
Figure 4.45. Measured Transfer Lengths vs. Cousins et al. (Eq. 2-23)
0
10
20
30
40
50
0 10 20 30 40 50
(in.)
Mea
sure
d L t
(in.
)
3
4'218 es
bci
Ld
f Figure 4.46. Measured Transfer Lengths vs. Balasz (Eq. 2-25)

162
0
10
20
30
40
50
0 10 20 30 40 50
(in.)
Mea
sure
d L t
(in.
)
0.625
' 0.15 0.424.7 es
ci si
Lf ε
Figure 4.47. Measured Transfer Lengths vs. Balasz (Eq. 2-26)
0
10
20
30
40
50
0 10 20 30 40 50
(in.)
Mea
sure
d L t
(in.
)
'0.158 si
ci es
f
f L
Figure 4.48. Measured Transfer Lengths vs. Balasz (Eq. 2-27)

163
0
10
20
30
40
50
0 10 20 30 40 50
(in.)
Mea
sure
d L t
(in.
)
294.9 esL
Figure 4.49. Measured Transfer Lengths vs. Russell and Barnes (Eq. 2-29)
0
10
20
30
40
50
0 10 20 30 40 50
(in.)
Mea
sure
d L t
(in.
)
308 esL
Figure 4.50. Measured Transfer Lengths vs. Logan (Eq. 2-30)

164
0
10
20
30
40
50
0 10 20 30 40 50
(in.)
Mea
sure
d L t
(in.
)
2 es ps
si
L Ef
Figure 4.51. Measured Transfer Lengths vs. Peterman (Eq. 2-28)
4.2.2 Transfer Length and Bond Stress
During the transfer process, as the strand tries to slip within the concrete, causing
end-slip, bond stresses develop between each individual strand and the surrounding
concrete creating a resistance to the strands tendency to slip. As the distance from the
end of the specimen increases, the amount of slip between the strand and concrete
decreases until the slip reaches zero at the end of the transfer zone and the stress in the
strand is fully transferred to the surrounding concrete. In the current provisions for the
calculation of transfer length, ACI assumes a constant bond stress of 400 psi. The ACI
value is assumed to be conservative and a number of researchers have reported bond
stresses far surpassing the assumed value of 400 psi.
Bond stresses were calculated for each transfer zone using the relationship from
Equation (2-11), which assumes a linear relationship in steel stress from the end of the
member to the end of the transfer length and the perimeter of a strand equal to 4/3πdb
(Buckner 1995). A summary of calculated bond stresses are listed in Table 4.17. When
previously comparing transfer length to casting position, transfer length was shown to be
highly dependent on the amount of concrete cast above the strand. Plotting bond stresses

165
against the amount of concrete above the strand as shown in Figure 4.52 also showed the
same trend, indicating that as dcast is increased, bond stresses increase, thus reducing
transfer lengths. In addition to bond stresses, the bond quality of each strand type used in
the T-beam test specimens was also compared to transfer length measurements and is
shown in Figures 4.53 and 4.54 for the LBPT and NASP test, respectively (Loflin 2008).
All of the strands considered to be bottom-cast strands had satisfactory transfer length
results, but when plotted against LBPT and NASP test values, as previous studies have
done (Ramirez and Russell 2007), no correlation existed between transfer lengths and
LBPT and NASP test values. Taking into consideration the relationships previously
discussed with respect to the amount of concrete cast above the strand, the transfer
lengths were again plotted against LBPT and NASP test values normalized with dcast and
the concrete strength. Figures 4.55 and 4.56 show the transfer lengths potted against
LBPT and NASP values, respectively, with casting position and concrete strength taken
into consideration. The data in Figure 4.55 and 4.56 both show a linear trend indicating
transfer lengths to be directly proportional to LBPT and NASP test values. Of the strand
tested, one strand did not meet the minimum values for each test, however, the strand did
have satisfactory transfer lengths. LBPT results were also plotted against NASP test
results which did show a good correlation as shown in Figure 4.57.
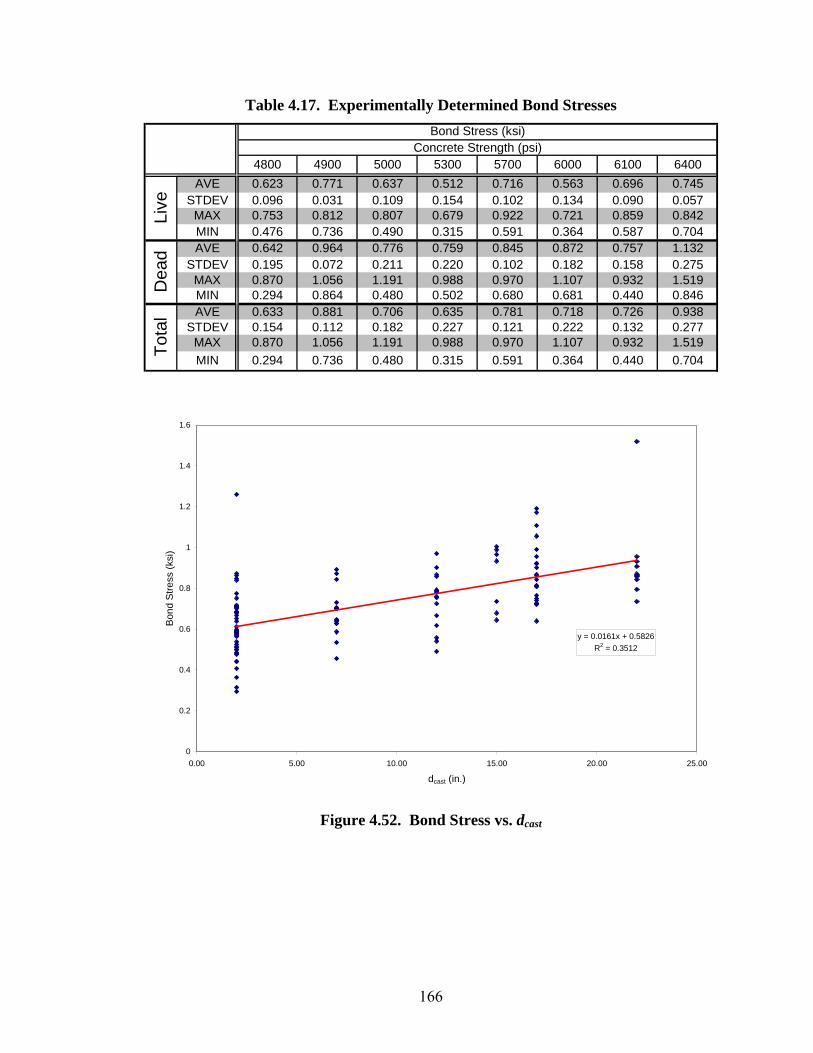
166
Table 4.17. Experimentally Determined Bond Stresses
4800 4900 5000 5300 5700 6000 6100 6400AVE 0.623 0.771 0.637 0.512 0.716 0.563 0.696 0.745
STDEV 0.096 0.031 0.109 0.154 0.102 0.134 0.090 0.057MAX 0.753 0.812 0.807 0.679 0.922 0.721 0.859 0.842MIN 0.476 0.736 0.490 0.315 0.591 0.364 0.587 0.704AVE 0.642 0.964 0.776 0.759 0.845 0.872 0.757 1.132
STDEV 0.195 0.072 0.211 0.220 0.102 0.182 0.158 0.275MAX 0.870 1.056 1.191 0.988 0.970 1.107 0.932 1.519MIN 0.294 0.864 0.480 0.502 0.680 0.681 0.440 0.846AVE 0.633 0.881 0.706 0.635 0.781 0.718 0.726 0.938
STDEV 0.154 0.112 0.182 0.227 0.121 0.222 0.132 0.277MAX 0.870 1.056 1.191 0.988 0.970 1.107 0.932 1.519MIN 0.294 0.736 0.480 0.315 0.591 0.364 0.440 0.704
Bond Stress (ksi)Concrete Strength (psi)
Live
Dea
dTo
tal
y = 0.0161x + 0.5826R2 = 0.3512
0
0.2
0.4
0.6
0.8
1
1.2
1.4
1.6
0.00 5.00 10.00 15.00 20.00 25.00
dcast (in.)
Bon
d S
tress
(ksi
)
Figure 4.52. Bond Stress vs. dcast
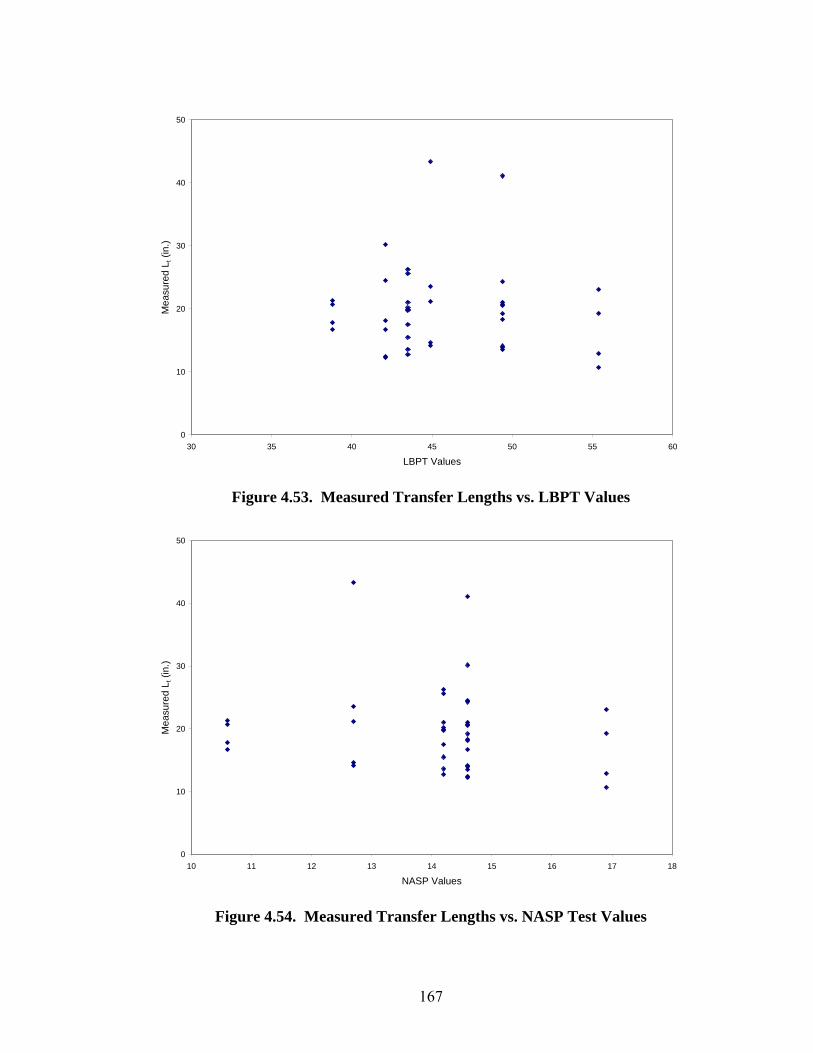
167
0
10
20
30
40
50
30 35 40 45 50 55 60
LBPT Values
Mea
sure
d L t
(in.
)
Figure 4.53. Measured Transfer Lengths vs. LBPT Values
0
10
20
30
40
50
10 11 12 13 14 15 16 17 18
NASP Values
Mea
sure
d L t
(in.
)
Figure 4.54. Measured Transfer Lengths vs. NASP Test Values

168
y = 29.648x + 15.453R2 = 0.338
0
10
20
30
40
50
0 0.05 0.1 0.15 0.2 0.25 0.3 0.35 0.4
Mea
sure
d L t
(in.
)
( )'cast ci
LBPT
d f
Figure 4.55. Measured Transfer Lengths vs. LBPT/(dcast*f’
c^0.5)
y = 95.078x + 15.519R2 = 0.329
0
10
20
30
40
50
0 0.02 0.04 0.06 0.08 0.1 0.12
Mea
sure
d L t
(in.
)
( )'cast ci
NASP
d f
Figure 4.56. Measured Transfer Lengths vs. NASP/(dcast*f’
c^0.5)

169
y = 2.33x + 13.18R2 = 0.70
30
35
40
45
50
55
60
10 11 12 13 14 15 16 17 18
NASP Test Results (kips)
LBPT
Res
ults
(kip
s)
Figure 4.57. LBPT Results vs. NASP Test Results
4.3 Practical Modeling Technique for Transfer Length
As previously discussed, transfer length increased with a decrease in the amount
of concrete cast above the strand. With an increase in transfer lengths also came a
decrease in bond stress and an increase in end-slip between the concrete and strand.
Therefore, it can be concluded that transfer length is directly proportional to end-slip and
the force versus displacement relationship between the strand and the surrounding
concrete. In common practice, the stresses from the prestress force within a member are
of concern at transfer and various other times throughout the life of the member. Stresses
are calculated at the time of transfer to ensure no cracking of the concrete will occur and
the transfer length is later used in the determination of the shear resistance of the
member. The transfer length is calculated using either Equation (2-3), (2-4), or (2-13),
depending on the code used and is typically estimated by Equation (2-4) or (2-13) in the
calculation of shear strength.
In most cases, conventional methods could be used for the calculations of stresses
and shear strength with code assumed transfer length values. In other cases, such as deep
beams or members containing various voids, traditional methods may not be sufficient

170
and may require the use of measured transfer length values and a more detailed analysis
method, such as strut and tie models or finite element analysis. In the case of finite
element models, to accurately predict the behavior within the end-zone of the member,
the slip between the strand and the surrounding concrete must be modeled. This behavior
was successfully determined with the details of its development described herein.
The development of the strand-slip behavior was determined based on the
experimental results from this study for strands with a jacking stress of 0.75fpu, but can be
modified for any strand size, jacking stress, and concrete strength with sufficient model
verification. To effectively use the modeling technique, the transfer length must be
known prior to the model development. Ideally, the transfer length would be from
experimentally determined values, via concrete surface strains or strand end-slips, but in
some cases transfer lengths may be needed for design prior to member fabrication. When
the transfer length is unknown or needed prior to member fabrication, it should be
calculated using Equation (4-5) taking into consideration, the initial prestress, concrete
strength, strand size, and the amount of concrete cast above the strand. As mentioned in
other sections, there is a force versus displacement relationship between the strand and
the surrounding concrete, which is unknown and the first item in need of determination.
Finite element models were constructed for the 12 ft long, 4 in. by 4 in. concrete
prisms from the top-strand blocks in Pours 1 through 4. Using the actual material
properties of the concrete and prestressing steel, four individual models were constructed
and transfer length versus spring stiffness curves developed for each. The first two
models contained ½ in. diameter 270 ksi prestressing strands with concrete compressive
strengths of 4800 psi and 5700 psi, respectively. The third and fourth models contained
½ in. diameter super 270 ksi prestressing strands with concrete compressive strengths of
6100 psi and 5000 psi, respectively. Shown in Figure 4.58 and Figure 4.59 are the
relationships for transfer length versus spring stiffness for the ½ in. diameter and ½ in.
diameter super strands, respectively. It was determined that the small range of concrete
strengths in this study had little to no effect on the transfer length versus spring stiffness
behavior as the two curves on each plot nearly overlapped. However, there was a slight
difference as a result of strand size. In other cases, a wider range of concrete strengths
may affect the relationship shown in Figure 4.58 and Figure 4.59, but this would be

171
determined when developing that relationship for a specific model, since concrete
strength is a required property of the finite element model. With concrete strength having
little effect on these models, an average best fit curve was fit to the data resulting in
Equation (4-6) for calculating transfer length as a function of spring stiffness for the ½ in.
diameter regular strand, while Equation (4-7) was fit to the data for the ½ in. diameter
super strand.
y = 285.62x-0.4899
R2 = 0.9982
y = 286.88x-0.4891
R2 = 0.9978
0
10
20
30
40
50
0 50 100 150 200 250 300
Spring Stiffness (kip/in.)
Tran
sfer
Len
gth
(in.)
Pour 1Pour 2
Figure 4.58. Transfer Length vs. Spring Stiffness (½ in. diameter regular)
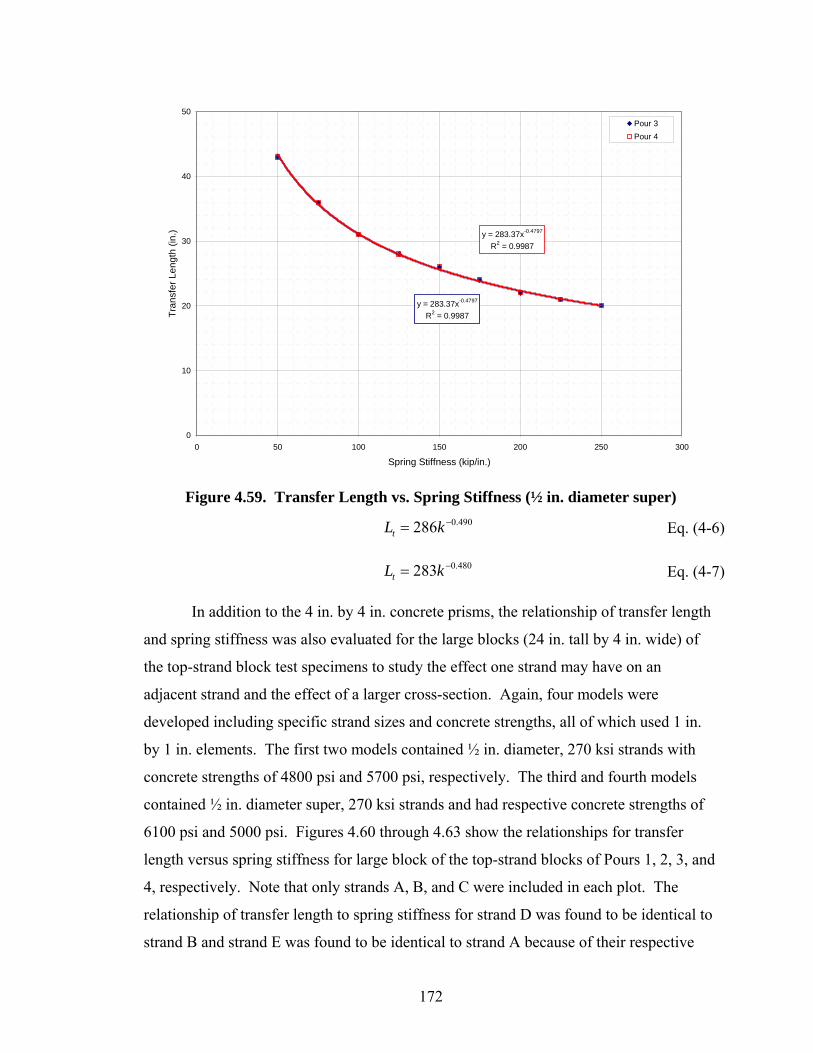
172
y = 283.37x-0.4797
R2 = 0.9987
y = 283.37x-0.4797
R2 = 0.9987
0
10
20
30
40
50
0 50 100 150 200 250 300
Spring Stiffness (kip/in.)
Tran
sfer
Len
gth
(in.)
Pour 3Pour 4
Figure 4.59. Transfer Length vs. Spring Stiffness (½ in. diameter super)
0.490286tL k −= Eq. (4-6) 0.480283tL k −= Eq. (4-7) In addition to the 4 in. by 4 in. concrete prisms, the relationship of transfer length
and spring stiffness was also evaluated for the large blocks (24 in. tall by 4 in. wide) of
the top-strand block test specimens to study the effect one strand may have on an
adjacent strand and the effect of a larger cross-section. Again, four models were
developed including specific strand sizes and concrete strengths, all of which used 1 in.
by 1 in. elements. The first two models contained ½ in. diameter, 270 ksi strands with
concrete strengths of 4800 psi and 5700 psi, respectively. The third and fourth models
contained ½ in. diameter super, 270 ksi strands and had respective concrete strengths of
6100 psi and 5000 psi. Figures 4.60 through 4.63 show the relationships for transfer
length versus spring stiffness for large block of the top-strand blocks of Pours 1, 2, 3, and
4, respectively. Note that only strands A, B, and C were included in each plot. The
relationship of transfer length to spring stiffness for strand D was found to be identical to
strand B and strand E was found to be identical to strand A because of their respective

173
locations within the model. As with the 4 in. by 4 in. prisms, the ½ in. diameter regular
strands and the ½ in. diameter super strands had a different relationship between transfer
length and spring stiffness and the small range of concrete strengths were again found to
have little effect. Average best fit curves were fit to the data for each strand size resulting
in Equations (4-8) and (4-9) for calculating transfer length as a function of spring
stiffness for the ½ in. diameter regular strand and ½ in. diameter super strand,
respectively.
y = 276.67x-0.4811
R2 = 0.9964
y = 259.12x-0.467
R2 = 0.9978
y = 290.65x-0.4919
R2 = 0.9974
0
5
10
15
20
25
30
35
40
45
50
0 50 100 150 200 250 300 350 400 450
Spring Stiffness (kip/in.)
Tran
sfer
Len
gth
(in.)
Strand A
Strand B
Strand C
Figure 4.60. Transfer Length vs. Spring Stiffness (TSB-Pour 1)

174
y = 259.12x-0.467
R2 = 0.9978
y = 259.12x-0.467
R2 = 0.9978
y = 290.65x-0.4919
R2 = 0.9974
0
5
10
15
20
25
30
35
40
45
50
0 50 100 150 200 250 300 350 400 450
Spring Stiffness (kip/in.)
Tran
sfer
Len
gth
(in.)
Strand A
Strand B
Strand C
Figure 4.61. Transfer Length vs. Spring Stiffness (TSB-Pour 2)
y = 284.31x-0.4781
R2 = 0.9974
y = 274.72x-0.4723
R2 = 0.9977
y = 293.37x-0.4854
R2 = 0.9974
0
5
10
15
20
25
30
35
40
45
50
0 50 100 150 200 250 300 350 400 450
Spring Stiffness (kip/in.)
Tran
sfer
Len
gth
(in.)
Strand A
Strand B
Strand C
Figure 4.62. Transfer Length vs. Spring Stiffness (TSB-Pour 3)

175
y = 283.05x-0.4804
R2 = 0.999
y = 274.31x-0.4731
R2 = 0.9981
y = 283.05x-0.4804
R2 = 0.999
0
5
10
15
20
25
30
35
40
45
50
0 50 100 150 200 250 300 350 400 450
Spring Stiffness (kip/in.)
Tran
sfer
Len
gth
(in.)
Strand A
Strand B
Strand C
Figure 4.63. Transfer Length vs. Spring Stiffness (TSB-Pour 4)
0.478272tL k −= Eq. (4-7) 0.478282tL k −= Eq. (4-8) With the transfer length versus spring stiffness relationships known for each
strand type, the correct stiffness for the nonlinear springs was then chosen corresponding
to the measured transfer lengths as shown in Figure 4.64 for the dead end of the large
block of the top-strand blocks in Pour 4. Each respective stiffness was then applied to
each strand in the model and an additional nonlinear analysis performed as with previous
models. Individual transfer lengths were recalculated for each strand to verify the same
conditions in the analytical model as the experimental test specimen. Subsequent to
verification of the finite element based transfer lengths, the model was in a completed
stage and could be used for the analysis of stresses and strains. Figure 4.65 shows the
stress contours in the X-direction as a result of the various prestressing strands in the
model. As previously noted, if the transfer lengths were unknown, the transfer lengths
should be determined using Equation (4-5).
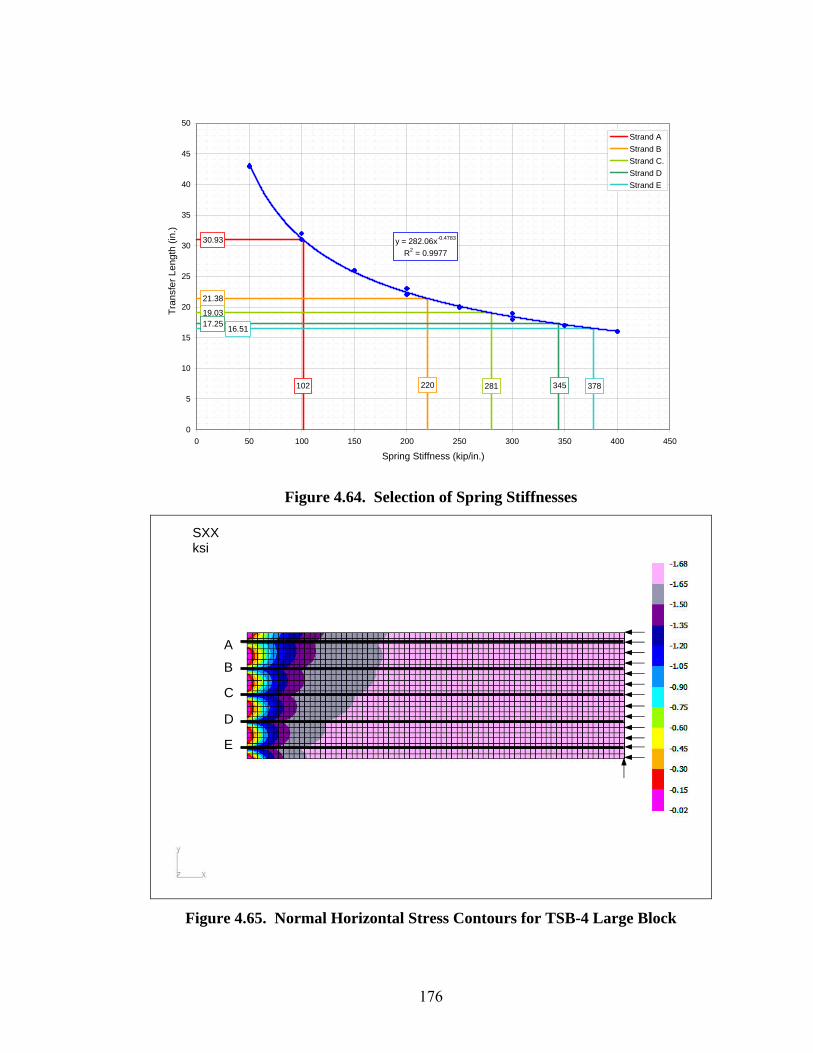
176
102
30.93
220
21.38
281
19.03
345
17.25
378
16.51
y = 282.06x-0.4783
R2 = 0.9977
0
5
10
15
20
25
30
35
40
45
50
0 50 100 150 200 250 300 350 400 450
Spring Stiffness (kip/in.)
Tran
sfer
Len
gth
(in.)
Strand AStrand BStrand C.Strand DStrand E
Figure 4.64. Selection of Spring Stiffnesses
Figure 4.65. Normal Horizontal Stress Contours for TSB-4 Large Block
A
B
C
D
E
SXX ksi
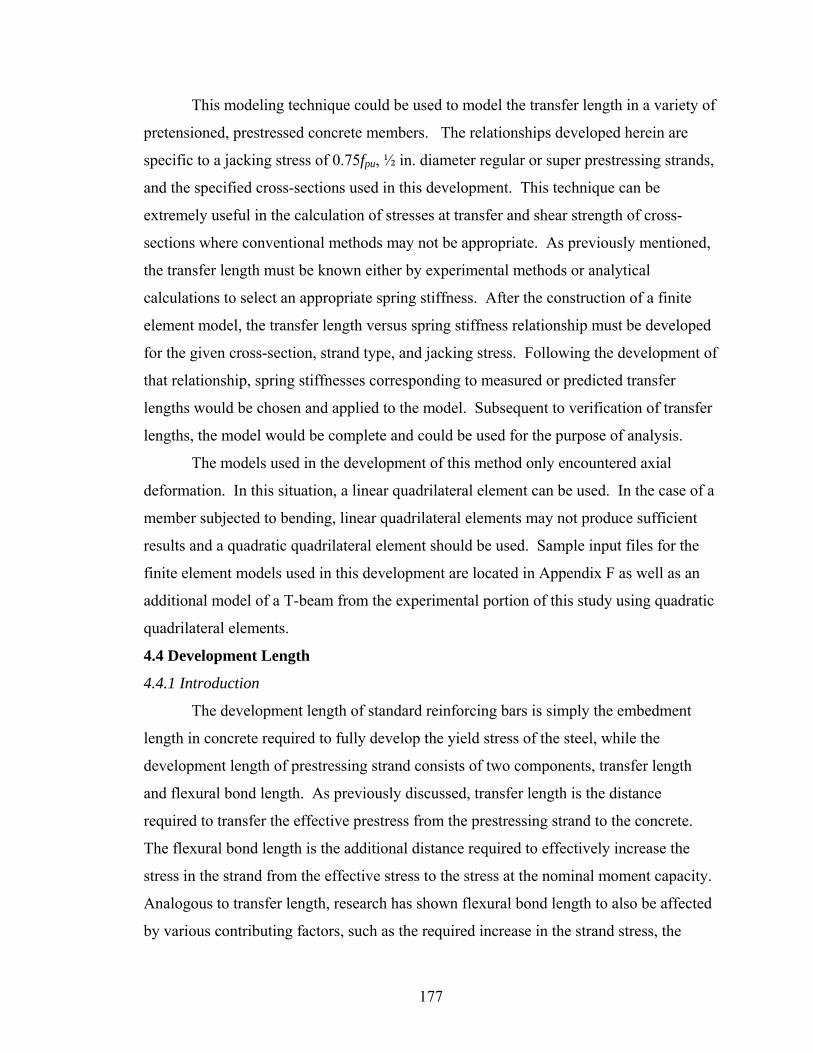
177
This modeling technique could be used to model the transfer length in a variety of
pretensioned, prestressed concrete members. The relationships developed herein are
specific to a jacking stress of 0.75fpu, ½ in. diameter regular or super prestressing strands,
and the specified cross-sections used in this development. This technique can be
extremely useful in the calculation of stresses at transfer and shear strength of cross-
sections where conventional methods may not be appropriate. As previously mentioned,
the transfer length must be known either by experimental methods or analytical
calculations to select an appropriate spring stiffness. After the construction of a finite
element model, the transfer length versus spring stiffness relationship must be developed
for the given cross-section, strand type, and jacking stress. Following the development of
that relationship, spring stiffnesses corresponding to measured or predicted transfer
lengths would be chosen and applied to the model. Subsequent to verification of transfer
lengths, the model would be complete and could be used for the purpose of analysis.
The models used in the development of this method only encountered axial
deformation. In this situation, a linear quadrilateral element can be used. In the case of a
member subjected to bending, linear quadrilateral elements may not produce sufficient
results and a quadratic quadrilateral element should be used. Sample input files for the
finite element models used in this development are located in Appendix F as well as an
additional model of a T-beam from the experimental portion of this study using quadratic
quadrilateral elements.
4.4 Development Length
4.4.1 Introduction
The development length of standard reinforcing bars is simply the embedment
length in concrete required to fully develop the yield stress of the steel, while the
development length of prestressing strand consists of two components, transfer length
and flexural bond length. As previously discussed, transfer length is the distance
required to transfer the effective prestress from the prestressing strand to the concrete.
The flexural bond length is the additional distance required to effectively increase the
stress in the strand from the effective stress to the stress at the nominal moment capacity.
Analogous to transfer length, research has shown flexural bond length to also be affected
by various contributing factors, such as the required increase in the strand stress, the

178
strand diameter, the concrete strength, and as-cast vertical location. As were relevant to
the determination of and comparison of flexural bond lengths, the influence of these
factors were evaluated.
In order to determine the minimum embedment length required to fully develop
each strand type, single-point bending tests were performed on 39 T-beam test
specimens, each test resulting in one of three types of failure: flexural, hybrid, or bond.
A flexural failure was defined as a beam exceeding the nominal moment capacity
calculated by AASHTO provisions with less than 0.01 in. of average end-slip. A hybrid
failure was defined as a beam with more than 0.01 in. of average end-slip occurring after
the nominal moment capacity was reached and a bond failure was defined as a beam
having more than 0.01 in. average end-slip prior to reaching the calculated nominal
moment capacity. The moment versus deflection and end-slip was plotted for each test.
Each plot also included the nominal moment capacity calculated by the current AASHTO
LRFD provisions and by strain compatibility. Figure 4.66 shows the aforementioned
relationships for a typical flexural failure. Figure 4.67 shows the same relationships for a
typical hybrid failure and Figure 4.68 shows the same relationships for a typical bond
failure. Plots for each of the 39 tests are located in Appendix C. In addition to individual
plots, a table of overall results is located in Appendix D listing the results for all test
specimens.

179
0
50
100
150
200
250
0.0 0.5 1.0 1.5 2.0 2.5 3.0 3.5 4.0
Deflection (in.)
Mom
ent (
kip-
feet
)
0 0.01 0.02 0.03 0.04 0.05 0.06 0.07 0.08
End Slip (in.)
Moment vs DeflectionMn (AASHTO LRFD)Mn (Strain Compatibility)Moment vs End Slip
Lt = 16.71 in.Le = 6.5 ft (78 in.)Failure: Flexural
Figure 4.66. Moment versus Deflection and End-slip (Flexural Failure)
0
50
100
150
200
250
0.0 0.5 1.0 1.5 2.0 2.5 3.0 3.5 4.0
Deflection (in.)
Mom
ent (
kip-
feet
)
0 0.01 0.02 0.03 0.04 0.05 0.06 0.07 0.08
End Slip (in.)
Moment vs DeflectionlMn (AASHTO LRFD)Mn (Strain CompatibilityMoment vs End Slip
Lt = 30.19 in.Le = 5.5 ft (66 in.)Failure: Hybrid
Figure 4.67. Moment versus Deflection and End-slip (Hybrid Failure)

180
0
50
100
150
200
250
0.0 0.5 1.0 1.5 2.0 2.5 3.0 3.5 4.0
Deflection (in.)
Mom
ent (
kip-
feet
)
0 0.01 0.02 0.03 0.04 0.05 0.06 0.07 0.08
End Slip (in.)
Moment vs DeflectionMn (AASHTO LRFD)Mn (Strain Compatibility)Moment vs End Slip
Lt = 21.18 in.Le = 4.0 ft (48 in.)Failure: Bond
Figure 4.68. Moment versus Deflection and End-slip (Bond Failure)
4.4.2 Influence of Strand Strength
As with transfer length, the primary objective was the development of the Grade
300 strand relying on a number of items in question, the second of which was the
development length. With the Grade 300 strand, there was a slight increase in the
difference between the effective prestress and the stress in the strand at the nominal
moment capacity, which was expected to increase the flexural bond length. Historically,
development length equations separate transfer length and flexural bond length.
Therefore, for each test specimen, the transfer length was subtracted from the tested
embedment length (Le – Lt) to focus on the determination of the flexural bond length.
When (Le – Lt) was equal to or greater than the minimum required flexural bond length, a
flexural failure occurred. On the contrary, when (Le – Lt) was less than the minimum
flexural bond length, a bond or hybrid failure would occur. Of the test specimens
containing ½ in. diameter regular Grade 300 strands, the minimum flexural bond length
resulting in a flexural failure was 45.9 in., while the minimum flexural bond length
resulting in a flexural failure for the test specimens containing ½ in. diameter regular
Grade 270 strands was 47.6 in., showing relatively no difference in flexural bond length.

181
The test specimen containing the Grade 300 strand did have 0.003 in. of slip, while the
test specimen containing the Grade 270 strand had no slip. This possibly indicated that
the required flexural bond length for the test specimen containing Grade 300 strand may
have been somewhat longer than the flexural bond length for the test specimen containing
Grade 270 strand. For the test specimens containing ½ in. diameter super Grade 300
strands, the minimum flexural bond length resulting in a flexural failure was 45.4 in.,
while the minimum flexural bond length resulting in a flexural failure for the test
specimens containing ½ in. diameter super Grade 270 strands was 46.1 in. Both test
specimens had less than 0.001 in. of slip, but the beam containing the Grade 270 strands
was an inverted beam, which may have increased the flexural bond length. Comparisons
for beams containing Grade 300 0.6 in. diameter strands were not possible because the
Grade 300, 0.6 in. diameter strands was not being manufactured at the time. Overall, the
Grade 300 strand performed very similarly to the Grade 270 strand. A summary of the
results for strand type are shown in Table 4.18. Although the Grade 300 strand may have
a slightly higher flexural bond length, it was not possible to determine this with anymore
precision as the interval of embedment lengths tested was 6 in. It should be noted that
one test specimen containing Grade 300 ½ in. diameter super strands with a (Le – Lt)
value of 47.6 in. did encounter a hybrid/shear failure.
Table 4.18. Summary of Results for Strand Grade and Size
Minimum Determined Flexural Bond Length (in.) Strand Strength ½ in. diameter ½ in. diameter super 0.6 in. diameter
Grade 270 47.6 46.1 46.7 Grade 300 45.9 45.4 NA
4.4.3 Influence of Strand Diameter/Area
Strand diameter has been shown by a number of researchers to affect the flexural
bond length of prestressing strand. As with transfer length, most have found flexural
bond length to increase with strand diameter, while some have shown flexural bond
length to decrease when using 0.6 in. diameter prestressing strand. As previously
mentioned, three types of strand were used throughout the study, including ½ in. regular,
½ in. super, and 0.6 in. diameter strands. All but two beams contained ½ in. diameter
strands, with the majority being ½ in. diameter super strands, so, as with transfer length,

182
no conclusions were made with respect to 0.6 in. diameter strand and their influence on
flexural bond length.
The minimum flexural bond length resulting in a flexural failure for the ½ in.
diameter strands, including both Grade 270 and Grade 300 strand, was 45.4 in., while the
minimum flexural bond length resulting in a flexural failure for the 0.6 in. diameter
Grade 270 strand was 46.7 in. As with the influence of strand strength, the strand
diameter showed only a small increase in flexural bond length for an increase in strand
diameter, but only four tests were performed with 0.6 in. diameter strands. In addition to
strand diameter, flexural bond lengths were also evaluated for each corresponding strand
area. The minimum flexural bond length resulting in a flexural failure for the ½ in.
diameter regular strand was 45.9 in., while the minimum flexural bond length resulting in
a flexural failure for the ½ in. diameter super strand was 45.4 in. The minimum flexural
bond length resulting in a flexural failure for the 0.6 in. diameter strand was 46.7 in. as
previously stated. Again, no definitive trend was shown between strand type or strand
grade in this study, which can be seen in multiple comparisons of the data in Table 4.18.
4.4.4 Influence of Effective Prestress
Transfer length has been shown to increase with an increase in effective prestress.
Since two levels of initial prestress and two strengths of strand were used resulting in
various levels of effective prestress, (Le – Lt) for each test was plotted against each
corresponding effective prestress, as shown in Figure 4.69. As was shown in Table 4.18,
it can be observed in Figure 4.69 that the minimum flexural bond lengths required for
flexural failures are in the range of 45 to 50 in. regardless of strand size or grade. A
significant amount of scatter existed in the plot among those test specimens failing in
flexure indicating there to be no definitive trend.

183
0
10
20
30
40
50
60
70
155 160 165 170 175 180 185
fse (in.)
L e -
L t (
in.)
Flexural Normal
Hybrid Normal
Bond Normal
Flexural Inverted
Hybrid Inverted
Bond Inverted
Figure 4.69. (Le - Lt) versus Effective Prestress
4.4.5 Influence of (fps – fse)
The difference in the stress in the strand at the nominal moment capacity fps and
the effective prestress fse has been used in the calculation of the flexural bond length since
the implementation of Equation (2-2) in the ACI Building Code and has been
incorporated into numerous proposed equations for the calculation of the flexural bond
length. Figure 4.70 shows the relationship of (Le – Lt) for various failure types and (fps –
fse). As with strand diameter, although (fps – fse) has been shown to influence the flexural
bond length, neither an increase nor decrease was observed for values of (Le – Lt)
resulting in a flexural failure when compared to variations in (fps – fse). It appeared the
flexural bond length for all strand types was in the range of 45 to 50 in.

184
0
10
20
30
40
50
60
70
80 85 90 95 100 105 110 115 120 125 130
fps - fse (in.)
L e -
L t (
in.)
Flexural Normal
Hybrid Normal
Bond Normal
Flexural Inverted
Hybrid Inverted
Bond Inverted
Figure 4.70. (Le – Lt) versus (fps – fse)
4.4.6 Influence of Concrete Strength
As with transfer length, the current code provisions do not account for the
strength of the concrete in the calculation of flexural bond length. Although the strength
of concrete is not accounted for, some researchers have shown flexural bond length to
decrease with an increase in concrete strength, while others have shown very little
correlation. Among the six sets of test specimens cast in this study for the development
length tests, five different concrete strengths existed at the time of testing, ranging from
6300 to 8300 psi, which was representative of concrete strengths typically used in the
bridge industry. Figure 4.71 plots (Le – Lt) values against the square root of each
corresponding concrete strength. Again the flexural bond lengths appear to be between
45 and 50 in. for all test specimens. There does however, appear to be a trend of
increasing flexural bond length with an increase in concrete strength. This goes against
other studies and is attributed to the small amount of data points for higher concrete
strengths in this study.
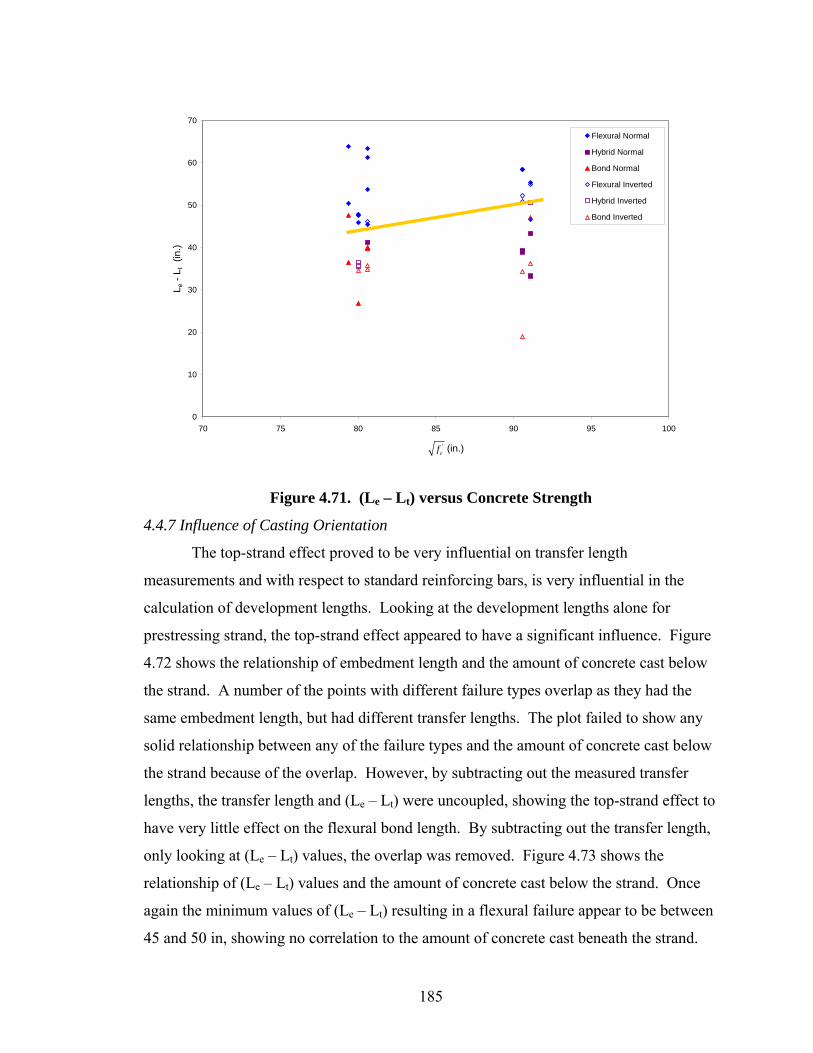
185
0
10
20
30
40
50
60
70
70 75 80 85 90 95 100
(in.)
L e -
L t (
in.)
Flexural Normal
Hybrid Normal
Bond Normal
Flexural Inverted
Hybrid Inverted
Bond Inverted
'cf
Figure 4.71. (Le – Lt) versus Concrete Strength
4.4.7 Influence of Casting Orientation
The top-strand effect proved to be very influential on transfer length
measurements and with respect to standard reinforcing bars, is very influential in the
calculation of development lengths. Looking at the development lengths alone for
prestressing strand, the top-strand effect appeared to have a significant influence. Figure
4.72 shows the relationship of embedment length and the amount of concrete cast below
the strand. A number of the points with different failure types overlap as they had the
same embedment length, but had different transfer lengths. The plot failed to show any
solid relationship between any of the failure types and the amount of concrete cast below
the strand because of the overlap. However, by subtracting out the measured transfer
lengths, the transfer length and (Le – Lt) were uncoupled, showing the top-strand effect to
have very little effect on the flexural bond length. By subtracting out the transfer length,
only looking at (Le – Lt) values, the overlap was removed. Figure 4.73 shows the
relationship of (Le – Lt) values and the amount of concrete cast below the strand. Once
again the minimum values of (Le – Lt) resulting in a flexural failure appear to be between
45 and 50 in, showing no correlation to the amount of concrete cast beneath the strand.
186
As previously discussed, transfer lengths were found to be more dependent on the
amount of concrete cast above the strand than the amount of concrete cast below the
strand. Therefore, the embedment length and (Le – Lt) values from each test were plotted
against the amount of concrete cast above the strand. Figure 4.74 shows the relationship
of the embedment length and the amount of concrete cast above the strand. A number of
the points, again, overlapped from having the same embedment lengths, showing no
correlation between any of the failure types and the amount of concrete cast above the
strand. Again, the transfer lengths were subtracted out of each corresponding embedment
length, resulting in (Le – Lt) values. Figure 4.75 shows the relationship of the (Le – Lt)
values and the amount of concrete cast above the strand. The overlap was removed, but
there was no correlation between (Le – Lt) values resulting in flexural failures and the
amount of concrete cast above the strand. Again, the range of minimum flexural bond
lengths appears to be between 45 and 50 in.
By evaluation of the development length only, the top-strand effect appeared
evident, however, by also evaluating the flexural bond lengths for each test, unlike
transfer lengths, it was determined that the top-strand effect failed to have a significant
influence on the flexural bond length. However, the development length equation
consists of both the transfer and flexural bond lengths therefore the top-strand effect does
influence the development length through the transfer length.

187
0
10
20
30
40
50
60
70
80
90
0 5 10 15 20 25
bcast (in.)
Em
bedm
ent L
engt
h (in
.)
Flexural Normal
Hybrid Normal
Bond Normal
Flexural Inverted
Hybrid Inverted
Bond Inverted
Figure 4.72. Embedment Length versus bcast
0
10
20
30
40
50
60
70
0 5 10 15 20 25
bcast (in.)
L e -
L t (i
n.)
Flexural Normal
Hybrid Normal
Bond Normal
Flexural Inverted
Hybrid Inverted
Bond Inverted
Figure 4.73. (Le - Lt) versus bcast

188
0
10
20
30
40
50
60
70
80
90
0 5 10 15 20 25
dcast (in.)
Em
bedm
ent L
engt
h (in
.)
Flexural Normal
Hybrid Normal
Bond Normal
Flexural Inverted
Hybrid Inverted
Bond Inverted
Figure 4.74. Embedment Length versus dcast
0
10
20
30
40
50
60
70
0 5 10 15 20 25
dcast (in.)
L e -
L t (i
n.)
Flexural Normal
Hybrid Normal
Bond Normal
Flexural Inverted
Hybrid Inverted
Bond Inverted
Figure 4.75. (Le - Lt) versus dcast

189
4.4.8 Current and Additional Recommended Equations
Since the 1963 ACI Building Code, development length has been calculated by
Equation (2-2) taking into consideration the effective prestress in the strand after all
losses, stress in the strand at the nominal moment capacity, and the diameter of the
strand. Over the past 35 years, as with transfer length, the proposed equations have
evolved to include the strength of the concrete. Again, as with transfer lengths, some
equations have proved to be adequate estimators of development length, while others
have not. Similar to Kose and Burkett (2005) the embedment lengths and (Le – Lt) values
were compared to nine different development length/flexural bond length equations for
comparative purposes. Figure 4.76 through Figure 4.84 show the comparison to each of
those equations with a line of perfect correlation. Actual values were plotted on the
ordinate axis while the predicted values were plotted on the abscissa axis with a line of
perfect correlation aiding in visual observation of the data. Contrary to the transfer
length comparisons, all of the data points for the embedment length and (Le – Lt) values
did not have to fall below the line of perfect correlation for conservatism. Ideally, the
points for a flexural failure would fall just above the line of perfect correlation, while the
bond failure would fall below the line and the hybrid failures would fall nearly on the
line. However, that was not the case with most comparisons and would show no
conservatism. The equations are listed again in Table 4.19.
The first equation evaluated, shown in Figure 4.76, was the traditional equation
from ACI (Equation 2-2). Figure 4.76a showed that all values were conservative
however there is very little range in the data. Figure 4.76b showed very good correlation
and had an increased range of data. Equation (2-33), shown in Figure 4.77 also showed
very clustered predictions for development length, but showed very favorable predictions
for the flexural bond length. Comparably, Equation (2-34) and Equation (2-37) also
showed very conservative predictions for the development length and showed
conservative predictions for the flexural bond length also with good correlation as shown
in Figure 4.78 and Figure 4.80, respectively.
Contrary to the four equations already mentioned, Equation (2-36) proposed by
Mitchell et al. and Equation (2-41) of a recent NCHRP report showed unconservative
predictions for both development length and flexural bond length as shown in Figure 4.79

190
and Figure 4.84, respectively. The remaining equations, by Buckner and Lane had good
correlations, while the proposed equation by Kose and Burkett seemed to excessively
overestimate both the development length and flexural bond length.
Although, most of the equations did not produce predicted development length
values with good correlations, overall, all but three equations predicted reasonable
flexural bond lengths with adequate levels of conservatism. Even though, a number of
researchers have found flexural bond length to be influenced by concrete strength, the
results in this study failed to support that trend. Of the proposed equations, Equation (2-
38) by Buckner seemed to be the most logical for the data presented herein. The λ factor
included in Equation (2-38) takes into account the strain in the strand at the nominal
moment capacity of the member. With transfer length, the Hoyer Effect causes the strand
to expand increasing the bond. Development length has a behavior quite the opposite
with the strand contracting as the stress is increased and if the embedment length was
smaller than the required development length, the bond between the prestressing steel and
surrounding concrete would fail resulting in a bond failure. Buckner’s equation proved to
have the most relevance to the data presented herein, thus there was no derivation of an
equation for the flexural bond length. The second portion of Equation (2-38), shown as
Equation (4-6) is recommended for the calculation of flexural bond length, where λ is
taken as (0.6 + 40εps) with lower and upper bounds of 1.0 and 2.0, respectively.
( )fb ps se bL f f dλ= − Eq. (4-6)

191
Table 4.19. Historical Development Length Equations
Contributor Year Equation Eq. No. Hanson & Kaar 1959 ( )1.11 0.77d su se bL f f d= − 2-31
ACI 1963 3000 1000
ps sesed b b
f ffL d d−⎛ ⎞⎛ ⎞= + ⎜ ⎟⎜ ⎟
⎝ ⎠ ⎝ ⎠ 2-2
160t bL d= for 1/4 in. dia. strand 2-32a 187t bL d= for 3/8 in. dia. strand 2-32b Martin & Scott 1976 200t bL d= for 1/2 in. dia. strand 2-32c
Zia & Mostafa 1977 ( )'1.5 4.6 1.25sid b ps se b
ci
fL d f f df
= − + − 2-33
Cousins et al. 1990 ( )' '
' ' ' '0.5 se ps ps bt ci
d ps se
b t ci d c
f A A dU fL f f
B d U f U f
π
π
⎛ ⎞ ⎛ ⎞⎜ ⎟ ⎜ ⎟= + + −⎜ ⎟ ⎜ ⎟⎝ ⎠ ⎝ ⎠
2-34
Shahawy et al. 1992 ( )
( )3sif
b ps se bd
b ave
d f f dL
k μ
⎡ ⎤+ −⎣ ⎦= 2-35
Mitchell et al. 1993 ( )' '
3 4.50.33d pi b ps se bci c
L f d f f df f
= + − 2-36
Deatherage et al. 1994 ( )1.503si
d b ps se bfL d f f d⎛ ⎞= + −⎜ ⎟
⎝ ⎠ 2-37
Buckner 1995 ( )3si
d b ps se bfL d f f dλ⎛ ⎞= + −⎜ ⎟
⎝ ⎠ 2-38
Lane 1998 ( )
' '
6.445 15ps se bpt
d bc c
f f dfL d
f f−
= − + + 2-39
Kose & Burkett 2005 ( ) ( )( )22
' '
1195 8 400 pu pi bpi b
d
c c
f f df dL
f f
⎡ ⎤⎡ ⎤ − −−⎢ ⎥⎢ ⎥= + +⎢ ⎥⎢ ⎥⎣ ⎦ ⎣ ⎦
2-40
NCHRP 2008 ' '
120 225 100d b b
ci c
L d df f
⎡ ⎤⎢ ⎥= + ≥⎢ ⎥⎣ ⎦
2-41
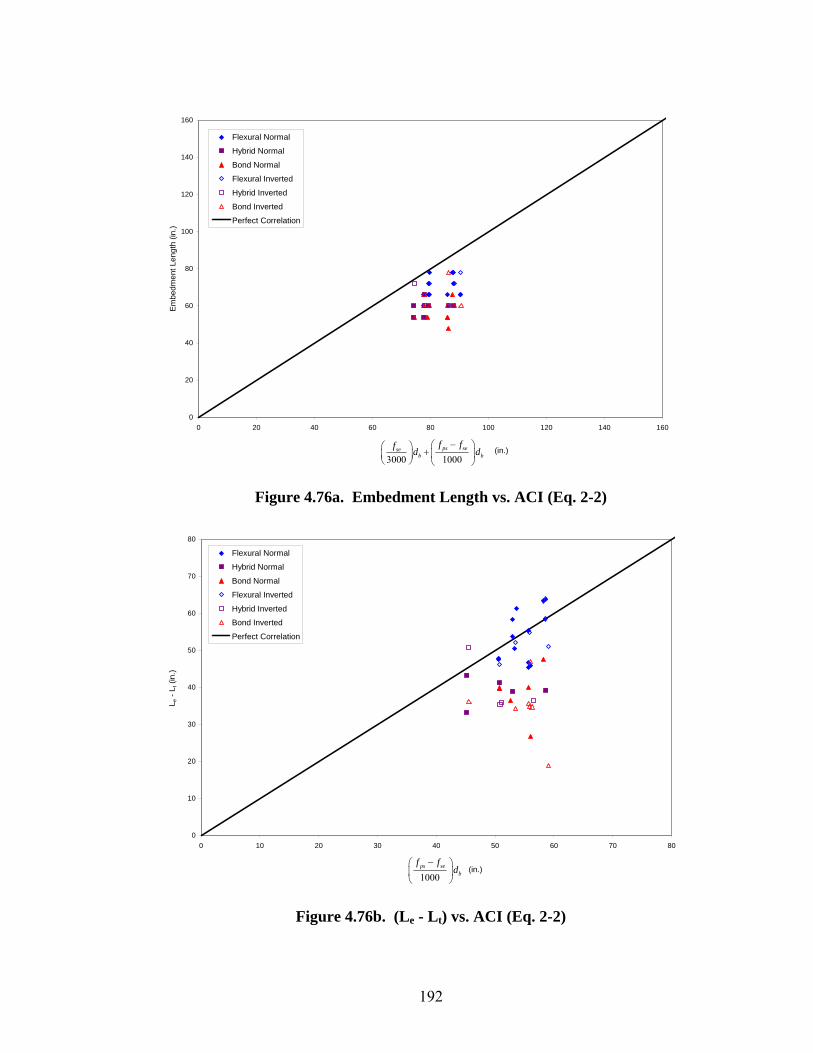
192
0
20
40
60
80
100
120
140
160
0 20 40 60 80 100 120 140 160
(in.)
Embe
dmen
t Len
gth
(in.)
Flexural Normal
Hybrid Normal
Bond Normal
Flexural Inverted
Hybrid Inverted
Bond Inverted
Perfect Correlation
3000 1000ps sese
b b
f ff d d−⎛ ⎞⎛ ⎞ + ⎜ ⎟⎜ ⎟
⎝ ⎠ ⎝ ⎠
Figure 4.76a. Embedment Length vs. ACI (Eq. 2-2)
0
10
20
30
40
50
60
70
80
0 10 20 30 40 50 60 70 80
(in.)
L e -
L t (i
n.)
Flexural Normal
Hybrid Normal
Bond Normal
Flexural Inverted
Hybrid Inverted
Bond Inverted
Perfect Correlation
1000ps se
b
f fd
−⎛ ⎞⎜ ⎟⎝ ⎠
Figure 4.76b. (Le - Lt) vs. ACI (Eq. 2-2)

193
0
20
40
60
80
100
120
140
160
0 20 40 60 80 100 120 140 160
(in.)
Em
bedm
ent L
engt
h (in
.)
Flexural Normal
Hybrid Normal
Bond Normal
Flexural Inverted
Hybrid Inverted
Bond Inverted
Perfect Correlation
( )'1.5 4.6 1.25sib ps se b
ci
f d f f df
− + −
Figure 4.77a. Embedment Length vs. Zia and Mostafa (Eq. 2-33)
0
10
20
30
40
50
60
70
80
0 10 20 30 40 50 60 70 80
(in.)
Embe
dmen
t Len
gth
(in.)
Flexural Normal
Hybrid Normal
Bond Normal
Flexural Inverted
Hybrid Inverted
Bond Inverted
Perfect Correlation
( )1.25 ps se bf f d−
Figure 4.77b. (Le - Lt) vs. Zia and Mostafa (Eq. 2-33)

194
0
20
40
60
80
100
120
140
160
0 20 40 60 80 100 120 140 160
(in.)
Em
bedm
ent L
engt
h (in
.)
Flexural Normal
Hybrid Normal
Bond Normal
Flexural Inverted
Hybrid Inverted
Bond Inverted
Perfect Correlation
( )' '
' ' ' '0.5 se ps ps bt ci
ps se
b t ci d c
f A A dU ff f
B d U f U f
π
π
⎛ ⎞ ⎛ ⎞⎜ ⎟ ⎜ ⎟+ + −⎜ ⎟ ⎜ ⎟⎝ ⎠ ⎝ ⎠
Figure 4.78a. Embedment Length vs. Cousins et al. (Eq. 2-34)
0
20
40
60
80
100
120
140
160
0 20 40 60 80 100 120 140 160
(in.)
Em
bedm
ent L
engt
h (in
.)
Flexural Normal
Hybrid Normal
Bond Normal
Flexural Inverted
Hybrid Inverted
Bond Inverted
Perfect Correlation
( )' '
ps bps se
d c
A df f
U f
π⎛ ⎞⎜ ⎟−⎜ ⎟⎝ ⎠
Figure 4.78b. (Le - Lt) vs. Cousins et al. (Eq. 2-34)

195
0
20
40
60
80
100
120
140
160
0 20 40 60 80 100 120 140 160
(in.)
Embe
dmen
t Len
gth
(in.)
Flexural Normal
Hybrid Normal
Bond Normal
Flexural Inverted
Hybrid Inverted
Bond Inverted
Perfect Correlation
( )' '
3 4.50.33 pi b ps se bci c
f d f f df f
+ −
Figure 4.79a. Embedment Length vs. Mitchell et al. (Eq. 2-36)
0
10
20
30
40
50
60
70
80
0 10 20 30 40 50 60 70 80
(in.)
Em
bedm
ent L
engt
h (in
.)
Flexural Normal
Hybrid Normal
Bond Normal
Flexural Inverted
Hybrid Inverted
Bond Inverted
Perfect Correlation
( ) '
4.5ps se b
c
f f df
−
Figure 4.79b. (Le - Lt) vs. Mitchell et al. (Eq. 2-36)

196
0
20
40
60
80
100
120
140
160
0 20 40 60 80 100 120 140 160
(in.)
Embe
dmen
t Len
gth
(in.)
Flexural Normal
Hybrid Normal
Bond Normal
Flexural Inverted
Hybrid Inverted
Bond Inverted
Perfect Correlation
( )1.503si
b ps se bf d f f d⎛ ⎞ + −⎜ ⎟
⎝ ⎠
Figure 4.80a. Embedment Length vs. Deatherage et al. (Eq. 2-37)
0
10
20
30
40
50
60
70
80
90
100
0 10 20 30 40 50 60 70 80 90 100
(in.)
Embe
dmen
t Len
gth
(in.)
Flexural Normal
Hybrid Normal
Bond Normal
Flexural Inverted
Hybrid Inverted
Bond Inverted
Perfect Correlation
( )1.50 ps se bf f d−
Figure 4.80b. (Le - Lt) vs. Deatherage et al. (Eq. 2-37)

197
0
20
40
60
80
100
120
140
160
0 20 40 60 80 100 120 140 160
(in.)
Embe
dmen
t Len
gth
(in.)
Flexural Normal
Hybrid Normal
Bond Normal
Flexural Inverted
Hybrid Inverted
Bond Inverted
Perfect Correlation
( )3si
b ps se bf d f f dλ⎛ ⎞ + −⎜ ⎟
⎝ ⎠
Figure 4.81a. Embedment Length vs. Buckner (Eq. 2-38)
0
20
40
60
80
100
120
140
160
0 20 40 60 80 100 120 140 160
(in.)
Em
bedm
ent L
engt
h (in
.)
Flexural Normal
Hybrid Normal
Bond Normal
Flexural Inverted
Hybrid Inverted
Bond Inverted
Perfect Correlation
( )ps se bf f dλ −
Figure 4.81b. (Le - Lt) vs. Buckner (Eq. 2-38)

198
0
20
40
60
80
100
120
140
160
0 20 40 60 80 100 120 140 160
(in.)
Embe
dmen
t Len
gth
(in.)
Flexural Normal
Hybrid Normal
Bond Normal
Flexural Inverted
Hybrid Inverted
Bond Inverted
Perfect Correlation
( )' '
6.445 15ps se bpt
bc c
f f dfd
f f−
− + +
Figure 4.82a. Embedment Length vs. Lane (Eq. 2-39)
0
10
20
30
40
50
60
70
80
0 10 20 30 40 50 60 70 80
(in.)
Embe
dmen
t Len
gth
(in.)
Flexural Normal
Hybrid Normal
Bond Normal
Flexural Inverted
Hybrid Inverted
Bond Inverted
Perfect Correlation
( )'
6.415ps se b
c
f f df−
+
Figure 4.82b. (Le - Lt) vs. Lane (Eq. 2-39)
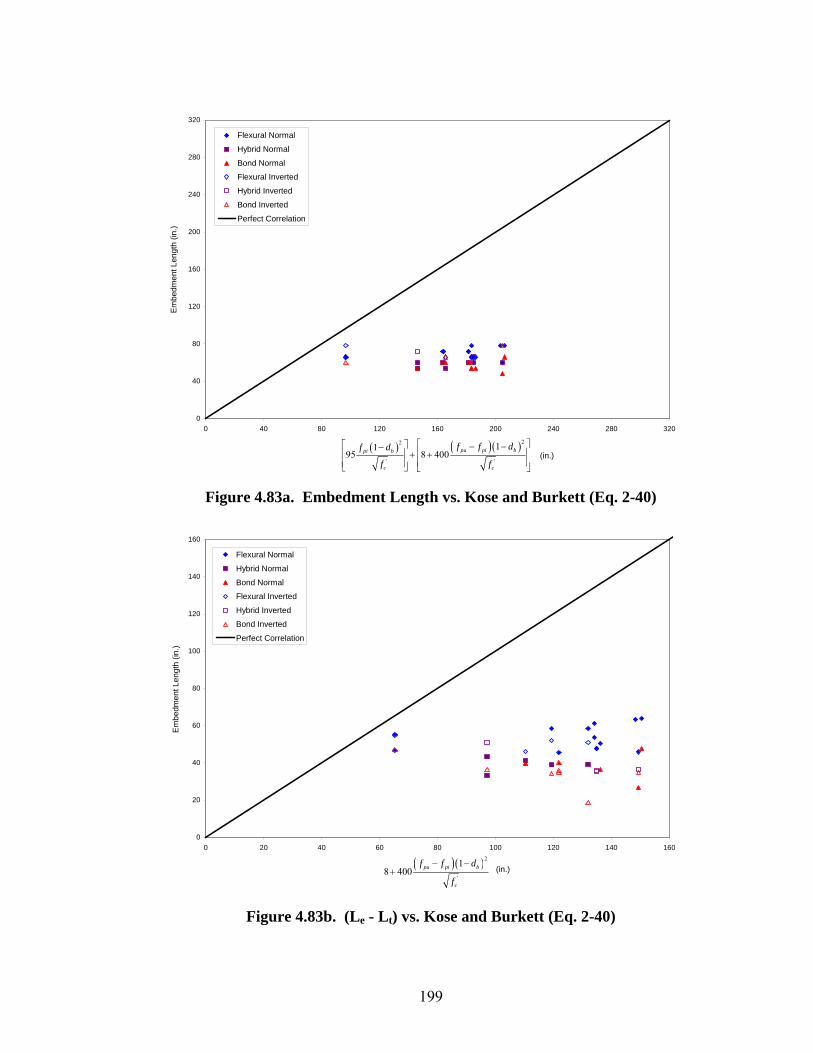
199
0
40
80
120
160
200
240
280
320
0 40 80 120 160 200 240 280 320
(in.)
Em
bedm
ent L
engt
h (in
.)
Flexural Normal
Hybrid Normal
Bond Normal
Flexural Inverted
Hybrid Inverted
Bond Inverted
Perfect Correlation
( ) ( )( )22
' '
1195 8 400 pu pi bpi b
c c
f f df d
f f
⎡ ⎤⎡ ⎤ − −−⎢ ⎥⎢ ⎥ + +⎢ ⎥⎢ ⎥⎣ ⎦ ⎣ ⎦
Figure 4.83a. Embedment Length vs. Kose and Burkett (Eq. 2-40)
0
20
40
60
80
100
120
140
160
0 20 40 60 80 100 120 140 160
(in.)
Em
bedm
ent L
engt
h (in
.)
Flexural Normal
Hybrid Normal
Bond Normal
Flexural Inverted
Hybrid Inverted
Bond Inverted
Perfect Correlation
( )( )2
'
18 400 pu pi b
c
f f d
f
− −+
Figure 4.83b. (Le - Lt) vs. Kose and Burkett (Eq. 2-40)
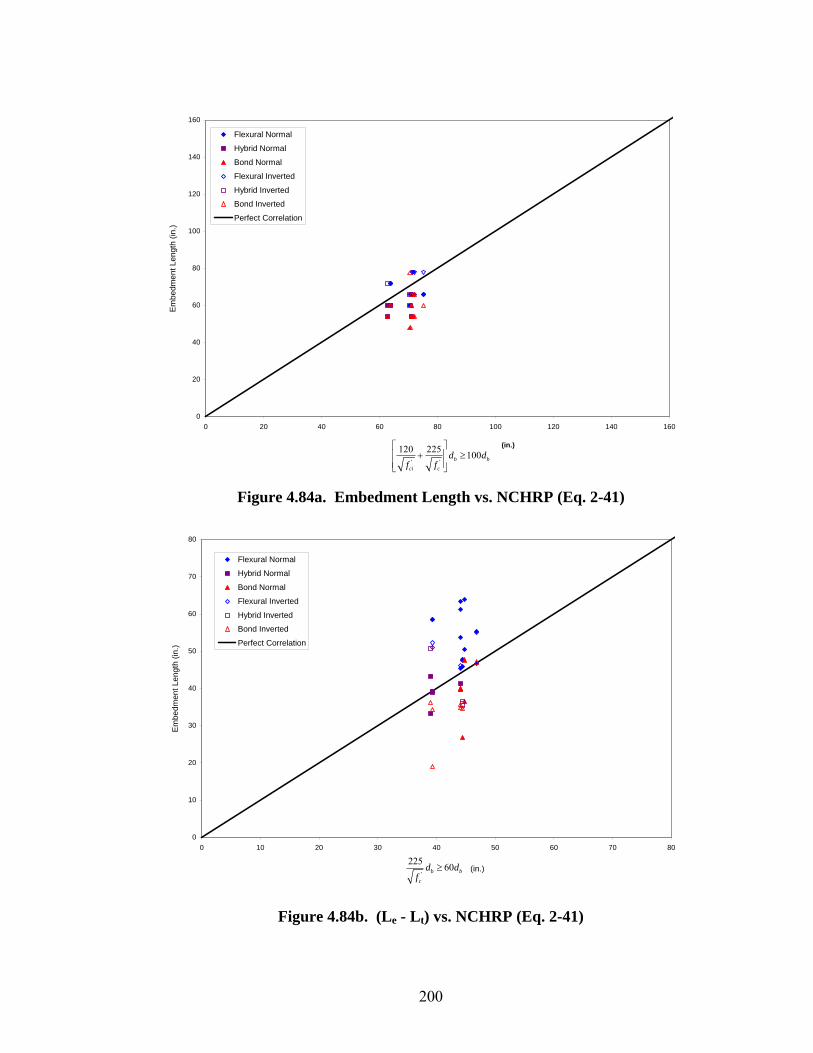
200
0
20
40
60
80
100
120
140
160
0 20 40 60 80 100 120 140 160
(in.)
Em
bedm
ent L
engt
h (in
.)
Flexural Normal
Hybrid Normal
Bond Normal
Flexural Inverted
Hybrid Inverted
Bond Inverted
Perfect Correlation
' '
120 225 100b b
ci c
d df f
⎡ ⎤⎢ ⎥+ ≥⎢ ⎥⎣ ⎦
Figure 4.84a. Embedment Length vs. NCHRP (Eq. 2-41)
0
10
20
30
40
50
60
70
80
0 10 20 30 40 50 60 70 80
(in.)
Em
bedm
ent L
engt
h (in
.)
Flexural Normal
Hybrid Normal
Bond Normal
Flexural Inverted
Hybrid Inverted
Bond Inverted
Perfect Correlation
'
225 60b b
c
d df
≥
Figure 4.84b. (Le - Lt) vs. NCHRP (Eq. 2-41)

201
4.5 Flexural Strength
4.5.1 Introduction
The single-point bending development length tests served two purposes, not only
evaluating development lengths, but also the flexural strength of each member for cases
where the prestressing strand was fully developed. The primary objective in the
evaluation of flexural strength was to determine the applicability of the current code
provisions for use with the newer, higher strength Grade 300 strand. The flexural
strength was also compared for beams containing Grade 300 strands and beams
containing Grade 270 strands, as well as the flexural strength of beams cast with a normal
orientation and beams cast with an inverted orientation. In addition to flexural strength
evaluation, analytical curvature values were also determined and compared based on an
assumed ultimate compressive strain in the concrete of 0.004.
4.5.2 Comparison of Flexural Strength
Each of the experimentally determined values for flexural capacity was compared
to the code calculated value. Table 4.20 lists a general summary of the flexural tests,
including the ratio of MACTUAL/MAASHTO for each type of strand. In addition to Table
4.20, plots similar to Figures 4.66 through 4.68 are located in Appendix C for each T-
beam test specimen. Of the beams having less than 0.01 in. of slip prior to reaching the
nominal moment capacity based on current AASHTO provisions (flexural or hybrid
failure), the average overstrength of the T-beam test specimens was 15 percent and the
maximum overstrength was 26 percent. For beams containing Grade 300 strands, the
average overstrength was 16 percent while those containing Grade 270 strands had an
overstrength of 14 percent. The maximum overstrength for beams containing Grade 300
strands was 21 percent, while the beams containing Grade 270 strands had a maximum
overstrength of 26 percent. As for the beams cast with a normal orientation, the average
overstrength was 14 percent and the average overstrength was 16 percent for the beams
cast with an inverted orientation, while both beams cast with a normal and inverted
orientation had a maximum overstrength of 26 percent.

202
Table 4.20. Summary of Flexural Tests Compared to AASHTO
Average Ratio of MACTUAL/MAASHTO Strand Strength ½ in. diameter ½ in. diameter super 0.6 in. diameter
Grade 270 1.14 1.15 1.13 Grade 300 1.16 1.15 NA
As the primary objective of the study, the calculated flexural capacities for each
strand grade were compared. As expected, the Grade 300 strand produced an average
increase in nominal flexural capacity of 11 percent. On the contrary, members containing
Grade 300 strands showed about a 6 percent decrease in curvature, or ductility at the
nominal moment capacity. Experimental comparisons were not made because identical
members having different strand strengths were not always tested at the same embedment
lengths and did not provide identical flexural failures for comparisons. Calculated
ductilities were also the only values compared as ductility was also not measured
experimentally. Tables 4.21 and 4.22 show the tabulated values discussed herein for the
flexural tests. Overall the T-beam test specimens performed very well in comparison to
the current AASHTO provisions. The beams containing Grade 300 strands showed no
significant differences with respect to the beams containing Grade 270 strands and the
beams cast with an inverted orientation also showed similar behavior to those cast with a
normal orientation.
Table 4.21 Summary of Calculated Flexural Strength for Casting Orientation
Average Ratio of M300L/M270 ½ in. diameter ½ in. diameter super 0.6 in. diameter
1.11 1.11 NA
Table 4.22. Summary of Calculated Curvature Comparison
Ratio of Calculated Curvatures Pour Strand Size Concrete Strength φ300/φ270
1 ½ in. regular 6500 0.941 2 ½ in. regular 6400 0.941 3 ½ in. super 8200 0.946 4 ½ in. super 6300 0.938 5 ½ in. super 6500 0.934 6 ½ in. super/0.6 in. 8300 NA

203
5.0 CONCLUSIONS AND RECOMMENDATIONS
5.1 Summary
Twenty pretensioned, prestressed concrete T-beam test specimens and four sets of
top-strand block test specimens were fabricated and tested over the course of three years.
Transfer lengths were determined for 119 individual transfer zones, including three strand
sizes, two strand strengths, two levels of initial prestress, and various amounts of concrete
cast above and below each strand. Thirty-nine flexural tests were performed for the
purpose of development length and flexural strength determination. Minimum
embedment lengths and flexural bond lengths were determined for each strand size and
grade, while the effect of vertical casting position was also evaluated. Of the parameters
taken into consideration, the amount of concrete cast above the strand was found to have
the most influence on transfer length, but showed no significant effect on flexural bond
lengths or flexural strength. Test specimens containing the Grade 300 strands proved to
have considerably longer transfer lengths and development lengths, as well as an increase
in flexural strength compared to test specimens containing the traditional Grade 270
strands.
5.2 Conclusions
5.2.1 Initial Objectives
The purpose of this study was to investigate the effects an increase in strand
strength and the as-cast vertical location of the strand had on transfer length, development
length, and flexural strength in pretensioned, prestressed concrete girders and to resolve
the discrepancies regarding the definition of the top-strand effect.
5.2.2 Grade 300 Strand
Transfer lengths of the Grade 300 strand had an average increase of 10 percent
compared to the transfer lengths of the Grade 270 strand. Development lengths for the
Grade 300 strand were also shown to increase compared to the Grade 270 strand.
However, flexural bond lengths were found to be relatively the same for both strand
strengths, indicating the increase to be primarily dependent on the increase in transfer
length. Minimum flexural bond lengths that resulted in flexural failures were found to be
in the range of 45 to 50 in. for both strand strengths. The influence of strand strength on
flexural strength was also evaluated. As expected, members cast with ½ in. diameter,

204
Grade 300 strands had about 11 percent higher nominal moment capacities than did those
cast with ½ in. diameter, Grade 270 strands. Although increases were seen in nominal
moment capacities, reductions in calculated ductilities were also noted in beams cast with
Grade 300 strands, on average about 6 percent lower than beams cast with Grade 270
strands.
5.2.3 Effect of Vertical Casting Position
The effect of vertical casting position proved to be the primary conclusion drawn
from this study. The results from this study showed the top-strand effect to be more
dependent on the amount of concrete cast above the strand than the amount of concrete
cast beneath the strand. The amount of concrete cast above the strand had the maximum
impact on transfer length, resulting in an average increase of ½ in. for every 1 in.
reduction in the amount of concrete cast above a strand. As a result of the findings
associated with this study, the current code provisions for the calculation of transfer
lengths were found to be unconservative mainly due to the effect of the as-cast vertical
location, which was found to be significantly more dependent upon the amount of
concrete cast above the strand rather than the amount of concrete cast below the strand.
Following a comparison of the results from this study and a number of previous studies,
Equation (4-5) was derived for the calculation of transfer length, taking into account the
initial prestress, the concrete strength at the time of transfer, the strand diameter, and the
amount of concrete cast above the strand.
As with transfer length, the development length was also found to be highly
influenced by a number of the same factors. However, the flexural bond length was not
shown to be affected by those same factors, indicating any influence on development
length to be primarily from the initial impact of those factors on transfer lengths. As
with strand strength, the minimum flexural bond lengths resulting in flexural failures
were in the range of 45 to 50 in. When comparing beams cast with normal orientations to
For dcast < 24 in. ( )2
'
2435
40castsi
t b
ci
dfL df
ζ−
= +
For dcast ≥ 24 in. '
35 sit b
ci
fL df
= Eq. (4-5)
205
those cast with inverted orientations, no definitive conclusions were made, but based on
the ratios of actual to calculated flexural strengths, beams cast with an inverted
orientation had very similar results as those cast with a normal orientation.
5.2.4 Practical Modeling Technique for Transfer Length
In addition to the proposed transfer length equation, a method for modeling
transfer length within a finite element model was also developed. The modeling
technique was established using nonlinear springs. Relationships between transfer length
and spring stiffness were developed for two strand types and cross sections in this study.
The technique was developed for use with any member type. However, measured or
calculated transfer length values are required and it should be noted that the technique
does use an idealized linear force versus slip relationship between the prestressing strand
and the surrounding concrete.
5.2.5 Other Conclusions
In addition to the primary objectives associated with this study, a number of items
were evaluated and notable conclusions established. In addition to strand strength and
the as-cast vertical location, transfer length was found to increase with a sudden release, a
decrease in concrete strength, and time, while previously defined influencing factors,
strand diameter and effective/initial prestress, showed no significant impact on transfer
length. Transfer lengths showed an average increase of 22 percent for strands having a
sudden release compared to those with a gradual release. A decrease in concrete strength
resulted in a slight increase in transfer length, while the influence of time proved to
extend transfer lengths by an average of about 8 percent. End-slip measurements were
also used for the calculation of transfer lengths and were compared to transfer lengths
calculated from concrete surface strains, showing a very good correlation. When
calculated from end-slip measurements, equations by Cousins et al., Russell and Barnes,
Logan, and Peterman all showed high levels of accuracy in the calculation of transfer
lengths, confirming the reliability of end-slip measurements.
As with transfer length, a number of equations were evaluated for development
length including the current code provisions and those recommended by various
researchers. The current code expressions used by ACI and AASHTO had a lack of
conservatism looking at the flexural bond length portion of the equation, however

206
equations by Zia and Mostafa, Cousins et al., Deatherage et al., and Buckner all showed a
reasonable level of conservatism while still having an appropriate trend. Of the four,
equations proposed by Zia and Mostafa, Deatherage et al., and Buckner used factors
applied to (fps – fse) of 1.25, 1.50, and λ, respectively, which proved adequate in the
estimation of flexural bond lengths. Of the three, the equation by Buckner is the only
equation that takes into account the effect of an increased level of tensile strain in the
strand at the ultimate flexural capacity of the member.
5.3 Recommendations
As a result of this investigation, the following recommendations were made:
1. The current ACI and AASHTO provisions for the calculation of nominal moment
capacity be used for flexural members containing Grade 300 prestressing strands.
2. The proposed Equation (4-5), which takes into account the initial prestress,
concrete strength, strand diameter, and as-cast vertical location, be implemented
into the provisions of ACI and AASHTO for the calculation of transfer length as
current equations were shown to be unconservative.
3. The modeling technique developed herein be used in finite element analyses of
pretensioned, prestressed concrete members. If experimentally determined
transfer length measurements are unavailable, Equation (4-5) should be used for
the calculation of transfer lengths.
4. The proposed Equation (2-38), by Buckner, which takes into account the level of
strain in the strand at the nominal moment capacity, be used for the calculation of
the flexural bond length portion of the development length.
5.4 Future Research
Although the Grade 300 strand showed favorable results, the ductility of members
containing the newer high strength strand was not investigated with great depth in this
study. With standard reinforcing, an increase in strength tends to result in a decrease in
ductility. Therefore, to ensure an adequate level of ductility for members containing
Grade 300 prestressing strands, additional research is recommended on the flexural
strength of members containing Grade 300 prestressing strands with an additional focus
on the ductility associated with an increase in strand strength.

207
Equation (4-5) takes into account the level of prestress in the strand just after
transfer, the concrete strength, the strand diameter, and the amount of concrete cast above
the strand. The first term of the equation correlated very well with transfer length
measurements of members with at least 24 in. of concrete cast above the strand. For
members with less than 24 in. of concrete cast above the strand, the second term engages,
increasing transfer lengths with a reduction in dcast. The term ζ takes into consideration
the fluidity of the concrete and ranges from 1 to 2, increasing with fluidity. At the
current time, it is recommended that a value of 2 be used for highly fluid mixes, although,
the relationship between values of 1 and 2 is not yet known. It is reasonable to assume ζ
may be a factor of slump, thus it is recommended that further research by conducted on
the relationship between the top-strand effect and the slump of the concrete.
The modeling technique presented herein is a practical method for modeling
transfer length in a finite element analysis of pretensioned, prestressed concrete members
and allows engineers the ability to accurately account for the effect of transfer length in
those models. As previously noted, this technique is simplified for practical use by
assuming the force versus slip relationship of the strand and surrounding concrete to be
linear. In a continued effort to more accurately predict the effects of transfer length on
the end-zones of pretensioned, prestressed concrete members, it is recommended that
further attention be given to the force versus slip relationship between the prestressing
strand and surrounding concrete.

208
LIST OF REFERENCES
A416-05/A416M-05, A. (2005). Standard Specification for Steel Strand, Uncoated Seven-wire for Prestressed Concrete, American Society for Testing and Materials, West Conshohocken, PA.
AASHTO. (2006). AASHTO LRFD Bridge Design Specification, Washington, D.C. ACI, A. C. I. (2008). Building Code Requirements for Structural Concrete and
Commentary, Farmington Hills, Michigan. Anderson, A. R., and Anderson, R. G. (1976). "An Assurance Criterion for Flexural Bond
in Pretensioned Hollow Core Units." ACI Journal, 73(8), 457-464. Balazs, G. L. (1993). "Transfer Length of Prestressing Strand as a Function of Draw-In
and Initial Prestress." PCI Journal, 38(2), 86-93. Barnes, R. W., Grove, J. W., and Burns, N. H. (2003). "Experimental Assessment of
Factors Affecting Transfer Length." ACI Structural Journal, 100(6), 740-748. Buckner, C. D. (1995). "A Review of Strand Development Length for Pretensioned
Concrete Members." PCI Journal, 40(2), 84-105. Clark, A. P. (1946). "Comparative Bond Efficiency of Deformed Concrete Reinforcing
Bars." ACI Journal, 43(4), 381-400. Collins, M. P., Mitchell, D., Adebar, P., and Vecchio, F. J. (1996). "A General Shear
Design Method." PCI Journal, 93(1), 36-45. Cousins, T. E., Badeaux, M. H., and Moustafa, S. (1992). "Proposed Test for
Determining Bond Characteristics of Prestressing Strand." PCI Journal, 37(1), 66-73.
Cousins, T. E., Francis, L. H., Stallings, J. M., and Gopu, V. (1993). "Spacing and
Concrete Cover Requirements for Epoxy-Coated Prestressing Strand in Unconfined Sections." PCI Journal, 38(5), 76-84.
Cousins, T. E., Johnston, D. W., and Zia, P. (1990a). "Development Length of Epoxy-
Coated Prestressing Strand." ACI Materials Journal, 87(4), 309-318. Cousins, T. E., Johnston, D. W., and Zia, P. (1990b). "Transfer and Development Length
of Epoxy Coated and Uncoated Prestressing Strand." PCI Journal, 35(4), 92-103. Cousins, T. E., Johnston, D. W., and Zia, P. (1990c). "Transfer Length of Epoxy-Coated
Prestressing Strand." ACI Materials Journal, 87(3), 193-203.

209
Cousins, T. E., Stallings, J. M., and Simmons, M. B. (1994). "Reduced Strand Spacing in Pretensioned, Prestressed Members." ACI Structural Journal, 91(3), 277-286.
Deatherage, J. H., Burdette, E. G., and Chew, C. K. (1994). "Development Length and
Lateral Spacing Requirements of Prestressing Strand for Prestressed Concrete Bridge Girders." PCI Journal, 39(1), 70-83.
Devalapura, R. K., and Tadros, M. K. (1992). "Stress-Strain Modeling of 270 ksi Low-
Relaxation Prestressing Strands." PCI Journal, 37(2), 100-105*. ENV. (1992-1-1). Eurocode 2: Design of Concrete Structures. FHWA. (1988). Prestressing Strand for Pretension Applications - Development Length
Revisited, Chief, Bridge Division, Federal Highway Administration, McLean, VA.
Guyon, Y. (1948). Beton Precontraint, Gand, France. Hanson, N. W., and Kaar, P. H. (1959). "Flexural Bond Tests of Pretensioned Prestressed
Beams." ACI Journal, 56(1), 783-802. Janney, J. R. (1954). "Nature of Bond in Pre-Tensioned Prestressed Concrete." ACI
Journal, 50(9), 717-736. Janney, J. R. (1963). "Report of Stress Transfer Length Studies on 270 k Prestressing
Strand." PCI Journal, 8(1), 41-45. Jeanty, P. R., Mitchell, D., and Mirza, M. S. (1988). "Investigation of "Top Bar" Effects
in Beams." ACI Structural Journal, 85(3), 251-257. Jirsa, J. O., and Breen, J. E. (1981). "Influence of Casting Position and Shear on
Development and Splice Length - Design Recommendation." Center for Transportation Research, University of Texas at Austin.
Kaar, P. H., LaFraugh, R. W., and Mass, M. A. (1963). "Influence of Concrete Strength
on Strand Tranfer Length." PCI Journal, 8(5), 47-67. Kose, M. M., and Burkett, W. R. (2005). "Formulation of New Development Length
Equation for 0.6 in. Prestressing Strand." PCI Journal, 50(5), 96-105. Lane, S. H. (1998). A New Development Length Equation for Pretensioned Strands in
Bridge Beams and Piles, Structures Division, Federal Highway Administration, McLean, VA.
Larson, K. H., Peterman, R. J., and Esmaeily, A. (2007). "Bond Characteristics of Self-
consolidating Concrete for Prestressed Bridge Girders." PCI Journal, 52(4).

210
Loflin, B. J. (2008). Bond and Material Properties of Grade 270 and Grade 300 Prestressing Strands, Virgina Tech, Blacksburg, VA.
Logan, D. R. (1997). "Acceptance Criteria for Bond Quality of Strand for Pretensioned
Prestressed Concrete Applications." PCI Journal, 42(2), 52-90. MacGregor, J. C., and Wight, J. K. (2005). Reinforced Concrete, Mechanics and Design,
Pearson Prentice Hall, Upper Saddle River, NJ. Marti-Vargas, J. R., Arbelaez, C. A., Serna-Ros, P., and Castro-Bugallo, C. (2007).
"Reliability of Transfer Length Estimation from Strand End Slip." ACI Structural Journal, 104(4), 487-494.
Martin, A. R., and Scott, N. L. (1976). "Development of Prestressing Strand in
Pretensioned Member." ACI Journal, 73(8), 453-456. Mitchell, D., Cook, W. D., Khan, A. A., and Tham, T. (1993). "Influence of High
Strength Concrete on Transfer and Development Length of Pretensioning Strand." PCI Journal, 38(3), 52-66.
Mote, J. (2001). Bond Mechanics of Steel Prestressing Strand, University of Oklahoma,
Norman Oklahoma. NCHRP. (2008). "WAI 146 - Transfer and Development of PS Strand." Oh, B. H., and Kim, E. S. (2000). "Realistic Evaluation of Transfer Lengths in
Pretensioned, Prestressed Concrete Members." ACI Structural Journal, 97(6), 821-830.
Park, R., and Paulay, T. (1975). Reinforced Concrete Structures, John Wiley & Sons,
Inc., New York. Peterman, R. J. (2007). "The Effects of As-Cast Depth and Concrete Fluidity on Strand
Bond." PCI Journal, 52(3), 72-101. Petrou, M. F., Wan, B., Gadala-Maria, F., Kolli, V. G., and Harries, K. A. (2000a).
"Influence of Mortar Rheology on Aggregate Settlement." ACI Materials Journal, 97(3), 479-485.
Petrou, M. F., Wan, B., Joiner, W. S., Trezos, C. G., and Harries, K. A. (2000b).
"Excessive Strand End Slip in Prestressed Piles." ACI Structural Journal, 97(5), 774-782.
Ramirez, J. A., and Russell, B. W. (2007). "Draft Final Report NCHRP 12-60 - Transfer,
Development, and Splice Length for Strad/Reinforcement in High-Strength Concrete." Purdue University, School of Civil Engineering, West Lafayette, IN.

211
Rose, D. R., and Russell, B. W. (1997). "Investigation of Standardized Tests to Measure the Bond Perfomance of Prestressing Strand." PCI Journal, 42(4), 56-80.
Russell, B. W., and Burns, N. H. (1993). "Design Guidelines for Transfer, Development
and Debonding of Large Diameter Seven Wire Strands in Pretensioned Concrete Girders.", University of Texas at Austin, Austin, TX.
Russell, B. W., and Burns, N. H. (1997). "Measurement of Transfer Lengths on
Pretensioned Concrete Elements." Journal of Structural Engineering(May), 541-549.
Shahawy, M. A., and Issa, M. (1992). "Effect on Pile Embedment on the Development
Length of Prestressing Strands." PCI Journal, 37(6), 44-59. Shahawy, M. A., Issa, M., and Batchelor, B. d. (1992). "Strand Transfer Lengths in Full
Scale AASHTO Prestressed Concrete Girders." PCI Journal, 37(3), 84-96. Tabatabai, H., and Dickson, T. J. (1993). "The History of the Prestressing Strand
Development Length Equation." PCI Journal, 38(6), 64-75. Wan, B., Harries, K. A., and Petrou, M. F. (2002a). "Transfer Length of Strands in
Prestressed Concrete Piles." ACI Structural Journal, 99(5), 577-585. Wan, B., Petrou, M. F., Harries, K. A., and Hussein, A. A. (2002b). "Top Bar Effects in
Prestressed Concrete Piles." ACI Structural Journal, 99(2), 208-214. Zia, P., and Mostafa, T. (1977). "Development Length of Prestressing Strands." PCI
Journal, 22(5), 54-63.

212
APPENDIX A
Nomenclature

213
a = depth of equivalent rectangular stress block (in.) A = coefficient used in stress-strain development for prestressing strand Ag = gross area of concrete section (in.2) Agt = gross transformed area of concrete section (in.2) Aps = area of prestressing strand (in.2) A’s = are of compression reinforcement (in.2) b = width of compression face of member (in.) bcast = depth of concrete cast beneath the strand (in.) B = slope of the bond stress in the plastic zone (Cousins et al.) B = coefficient used in stress-strain development for prestressing strand c = distance from extreme compressive fiber to neutral axis (in.) cb = smaller of: (a) the distance from center of bar or wire to nearest concrete surface,
and (b) one-half the center-to-center spacing of bars or wires being developed C = coefficient used in stress-strain development for prestressing strand d = distance from extreme compressive fiber to centroid of tensile steel (in.) d’ = distance from extreme compression fiber to centroid of compression steel (in.) db = diameter of standard reinforcing bar or prestressing strand (in.) dcast = depth of concrete cast above the strand (in.) dp = distance from extreme compression fiber to centroid of prestressing steel (in.) D = coefficient used in stress-strain development for prestressing strand eg = eccentricity of prestressing strands in the gross section (in.) egt = eccentricity of prestressing strands in the gross transformed section (in.) Ec = modulus of elasticity of concrete (ksi) Eci = modulus of elasticity of concrete at the time of transfer (ksi) Eps = modulus of elasticity of prestressing strand (ksi) Es = modulus of elasticity of standard reinforcing steel (ksi) f’c = 28 day concrete compressive strength (psi) f’ci = concrete compressive strength at transfer (psi) fpi = stress in the prestressing strand just after transfer (ksi) fps = stress in the prestressing strand at nominal moment capacity (ksi) fpu = ultimate tensile strength of prestressing strand (ksi) fpt = stress in the prestressing strand just after transfer (ksi) fr = modulus of rupture of concrete (psi) fse = stress in the prestressing strand after all losses at the time of testing fsi = stress in the prestressing strand just after transfer (ksi) fsj = jacking stress of the prestressing strand (ksi) fsu = ultimate tensile strength of prestressing strand (ksi) fy = yield strength of standard reinforcing steel (ksi) h = overall height of member (in.) Ig = gross moment of inertia (in.4) Igt = gross transformed moment of inertia (in.4) k = nonlinear spring stiffness (kips/in.) k = strand type factor kb = factor for member type (Shahawy and Issa) Ktr = transverse reinforcement index

214
Ld = development length (in.) Le = embedment length (in.) Les = end-slip (in.) Lfb = flexural bond length (in.) Lt = transfer length (in.) m = slope of ascending branch of strain profile (in./in.) Mn = nominal moment capacity (kip-feet) U’d = development length constant (Cousins et al.) U’t = transfer length constant (Cousins et al.) X = basic transfer length equation constant yint = y-intercept of ascending branch of strain profile (in.) Y = top-strand factor exponent Z = top-strand factor constant α = transfer length constant (Barnes et al.) α = modifier for shape of bond stress distribution (Guyon) β1 = factor relating depth of equivalent rectangular stress block to neutral axis depth γp = factor for type of prestressing steel δc = deflection of concrete due to prestressing force (in.) δs = deflection of steel due to prestressing force (in.) ΔT = change in temperature (ºF) εc = strain in the concrete (in./in) εci = initial strain in the concrete (in./in.) εcu = ultimate compressive strain in the concrete (in./in.) εpu = ultimate tensile strain in the prestressing steel (in./in.) εps = strain in the prestressing steel at nominal moment capacity (in./in.) εs = stain in the prestressing steel (in./in.) εsi = initial strain in the prestressing steel (in./in.) λ = modification factor reflecting the reduced mechanical properties of lightweight
concrete all relative to normalweight concrete of the same compressive strength λ = modification factor for flexural bond length dependent upon the strain in the strand
at the nominal moment capacity (Buckner) ρp = ratio of Aps to bdp μave = average bond stress (psi) ψe = factor used to modify development length based on reinforcement coating ψs = factor used to modify development length based on reinforcement size ψt = factor used to modify development length based on reinforcement location ω = tension reinforcement index ω' = compression reinforcement index ζ = fluidity multiplier for top-strand factor

215
APPENDIX B
Surface Strain Plots

216
The following strain profiles were generated from transfer length measurements
taken throughout the duration of the project. In an effort to increase the clarity of each
plot, the legend was removed. The legend is consistent for all plots and is shown below.

217
y = 20.543x + 136.75R2 = 0.8631
y = 23.165x + 73.067R2 = 0.9842
y = 29.737x + 335.28R2 = 0.7134
y = 40.64x + 170.67R2 = 0.9952
0
200
400
600
800
1000
1200
0 10 20 30 40 50 60
Distance from End of Beam (in.)
Mic
rost
rain
Figure B.1 – 1.270.5N.RA
y = 27.601x + 156.78R2 = 0.9497
y = 30.311x + 120.33R2 = 0.9794
y = 52.493x + 155.78R2 = 0.9892
y = 52.663x + 173.67R2 = 0.9992
0
200
400
600
800
1000
1200
0 10 20 30 40 50 60
Distance from End of Beam (in.)
Mic
rost
rain
Figure B.2 – 1.270.5N.RB

218
0
200
400
600
800
1000
1200
0 10 20 30 40 50 60
Distance from End of Beam (in.)
Mic
rost
rain
Figure B.3 – 1.300.5N.RA
y = 31.191x + 37.933R2 = 0.9698
y = 30.006x + 120.93R2 = 0.9827
y = 36.873x + 296.55R2 = 0.9055
y = 47.079x + 257.54R2 = 0.9569
0
200
400
600
800
1000
1200
0 10 20 30 40 50 60
Distance from End of Beam (in.)
Mic
rost
rain
Figure B.4 – 1.300.5N.RB
Transfer Zone was lost due to Flash Set of the Concrete

219
y = 29.545x - 113.37R2 = 0.9772
y = 26.779x - 106.81R2 = 0.9906
y = 41.611x - 66.711R2 = 0.9698
y = 35.526x - 12.644R2 = 0.9778
0
200
400
600
800
1000
1200
0 10 20 30 40 50 60
Distance from End of Beam (in.)
Mic
rost
rain
Figure B.5 – 2.270.5N.RA
y = 22.623x + 126.33R2 = 0.9565
y = 22.826x + 93.467R2 = 0.9376
y = 42.333x + 171.33R2 = 0.9073
y = 43.349x + 114.67R2 = 0.9777
0
200
400
600
800
1000
1200
0 10 20 30 40 50 60
Distance from End of Beam (in.)
Mic
rost
rain
Figure B.6 – 2.270.5N.RB

220
y = 25.209x - 133.38R2 = 0.9865
y = 28.617x - 104.33R2 = 0.9939
y = 36.755x - 136.87R2 = 0.9863
y = 39.906x - 42.185R2 = 0.9798
0
200
400
600
800
1000
1200
0 10 20 30 40 50 60Distance from End of Beam (in.)
Mic
rost
rain
Figure B.7 – 2.300.5N.RA
y = 29.957x + 40.546R2 = 0.9703
y = 23.532x + 124.33R2 = 0.9444
y = 40.446x + 141.52R2 = 0.9603
y = 35.802x + 216.57R2 = 0.9727
0
200
400
600
800
1000
1200
0 10 20 30 40 50 60
Distance from End of Beam (in.)
Mic
rost
rain
Figure B.8 – 2.300.5N.RB

221
y = 16.537x - 84.902R2 = 0.9824
y = 15.189x - 28.067R2 = 0.9792
y = 23.093x - 0.651R2 = 0.9871
y = 25.993x + 52.364R2 = 0.989
0
200
400
600
800
1000
1200
0 10 20 30 40 50 60
Distance from End of Beam (in.)
Mic
rost
rain
Figure B.9 – 2.270.5N.UA
1.270.5N.UB
y = 12.019x + 120.34R2 = 0.9351
y = 15.434x + 74.084R2 = 0.9889
y = 20.26x + 232.03R2 = 0.9769
y = 20.283x + 249.27R2 = 0.9938
0
200
400
600
800
1000
1200
0 10 20 30 40 50 60
Distance from End of Beam (in.)
Mic
rost
rain
Figure B.10 – 2.270.5N.UB

222
y = 15.129x - 150.2R2 = 0.9707
y = 13.785x - 89.237R2 = 0.9762
y = 23.423x - 164.23R2 = 0.9819
y = 20.083x - 14.705R2 = 0.9868
0
200
400
600
800
1000
1200
0.00 10.00 20.00 30.00 40.00 50.00 60.00
Distance from End of Beam (in.)
Mic
rost
rain
Figure B.11 – 2.300.5N.UA
y = 14.323x + 154.21R2 = 0.9245
y = 15.72x + 102.01R2 = 0.9906
y = 26.231x + 257.26R2 = 0.9894
y = 23.87x + 212.59R2 = 0.9765
0
200
400
600
800
1000
1200
0 10 20 30 40 50 60
Distance from End of Beam (in.)
Mic
rost
rain
Figure B.12 – 2.300.5N.UB

223
y = 24.165x - 111.77R2 = 0.9652
y = 25.287x - 145.04R2 = 0.9936
y = 30.299x - 37.6R2 = 0.9776
y = 36.88x - 184.75R2 = 0.9947
0
200
400
600
800
1000
1200
0 10 20 30 40 50 60
Distance from End of Beam, in.
Stra
in, i
n./in
. *10
^6
Figure B.13 – 3.270.5S.RA
y = 23.803x + 44.508R2 = 0.9503
y = 20.591x + 105.96R2 = 0.9518
y = 33.044x + 85.714R2 = 0.9869
y = 32.435x + 177.73R2 = 0.9752
0
200
400
600
800
1000
1200
0 10 20 30 40 50 60
Distance from End of Beam, in.
Stra
in, i
n./in
. *10
^6
Figure B.14 – 3.270.5S.RB
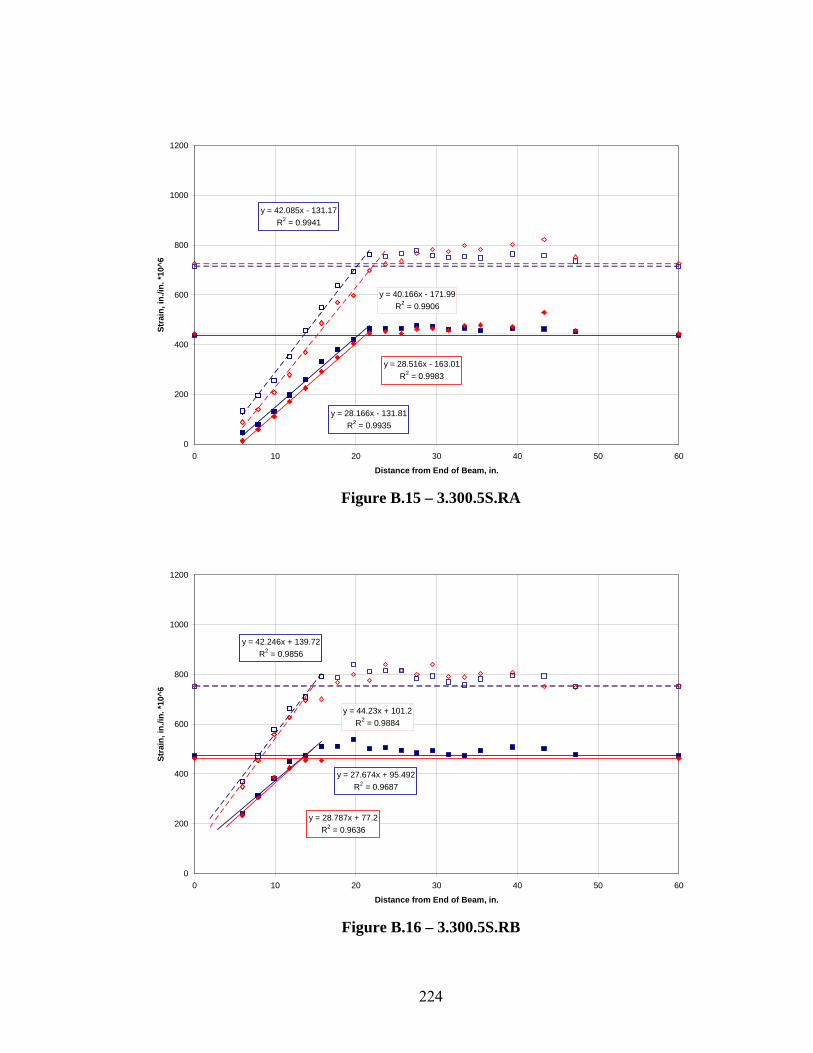
224
y = 28.166x - 131.81R2 = 0.9935
y = 28.516x - 163.01R2 = 0.9983
y = 42.085x - 131.17R2 = 0.9941
y = 40.166x - 171.99R2 = 0.9906
0
200
400
600
800
1000
1200
0 10 20 30 40 50 60
Distance from End of Beam, in.
Stra
in, i
n./in
. *10
^6
Figure B.15 – 3.300.5S.RA
y = 27.674x + 95.492R2 = 0.9687
y = 28.787x + 77.2R2 = 0.9636
y = 42.246x + 139.72R2 = 0.9856
y = 44.23x + 101.2R2 = 0.9884
0
200
400
600
800
1000
1200
0 10 20 30 40 50 60
Distance from End of Beam, in.
Stra
in, i
n./in
. *10
^6
Figure B.16 – 3.300.5S.RB
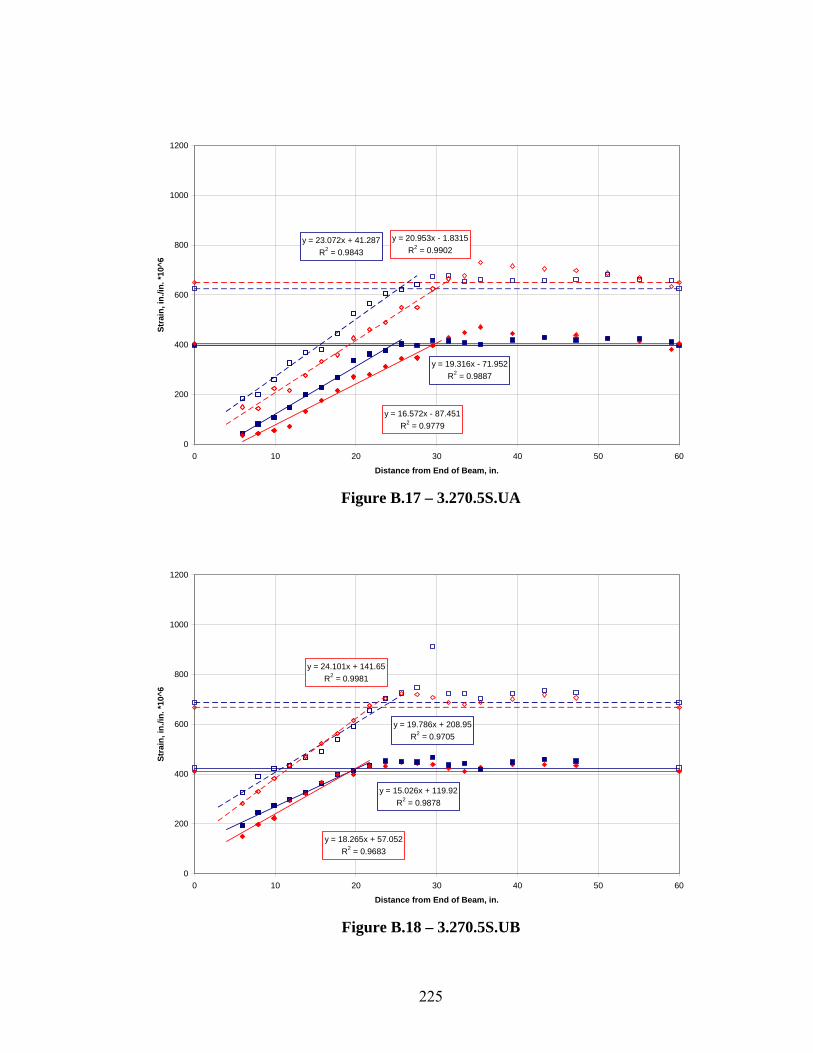
225
y = 19.316x - 71.952R2 = 0.9887
y = 16.572x - 87.451R2 = 0.9779
y = 23.072x + 41.287R2 = 0.9843
y = 20.953x - 1.8315R2 = 0.9902
0
200
400
600
800
1000
1200
0 10 20 30 40 50 60
Distance from End of Beam, in.
Stra
in, i
n./in
. *10
^6
Figure B.17 – 3.270.5S.UA
y = 15.026x + 119.92R2 = 0.9878
y = 18.265x + 57.052R2 = 0.9683
y = 19.786x + 208.95R2 = 0.9705
y = 24.101x + 141.65R2 = 0.9981
0
200
400
600
800
1000
1200
0 10 20 30 40 50 60
Distance from End of Beam, in.
Stra
in, i
n./in
. *10
^6
Figure B.18 – 3.270.5S.UB

226
y = 13.395x - 91.993R2 = 0.9748
y = 11.816x - 53.799R2 = 0.9837
y = 16.972x - 32.803R2 = 0.972
y = 16.259x - 2.9467R2 = 0.9794
0
200
400
600
800
1000
1200
0 10 20 30 40 50 60
Distance from End of Beam, in.
Stra
in, i
n./in
. *10
^6
Figure B.19 – 3.300.5S.UA
y = 13.397x + 162.39R2 = 0.9728
y = 13.3x + 121.24R2 = 0.9692
y = 16.811x + 278.04R2 = 0.9627
y = 18.499x + 217.03R2 = 0.9927
0
200
400
600
800
1000
1200
0 10 20 30 40 50 60
Distance from End of Beam, in.
Stra
in, i
n./in
. *10
^6
Figure B.20 – 3.300.5S.UB

227
y = 26.787x + 9.5873R2 = 0.9817
y = 25.803x + 25.508R2 = 0.985
y = 46.551x + 17.206R2 = 0.9857
y = 42.229x + 98.841R2 = 0.9929
0
200
400
600
800
1000
1200
0 10 20 30 40 50 60
Distance from End of Beam, in.
Stra
in, i
n./in
. *10
^6
Figure B.21 – 4.270.5S.RA
y = 23.997x + 117.14R2 = 0.9237
y = 22.787x + 134.48R2 = 0.9762
y = 37.56x + 181.08R2 = 0.953
y = 40.059x + 166.76R2 = 0.9906
0
200
400
600
800
1000
1200
0 10 20 30 40 50 60
Distance from End of Beam, in.
Stra
in, i
n./in
. *10
^6
Figure B.22 – 4.270.5S.RB

228
y = 33.205x - 155.21R2 = 0.9977
y = 31.141x + 11.873R2 = 0.9772
y = 55.225x - 203.94R2 = 0.9938
y = 47.278x + 73.57R2 = 0.991
0
200
400
600
800
1000
1200
0.00 10.00 20.00 30.00 40.00 50.00 60.00
Distance from End of Beam, in.
Stra
in, i
n./in
. *10
^6
Figure B.23 – 4.300.5S.RA
y = 33.286x + 40.952R2 = 0.9729
y = 28.254x + 146.54R2 = 0.9967
y = 48.381x + 79.429R2 = 0.9853
y = 37.519x + 270R2 = 0.9781
0
200
400
600
800
1000
1200
0 10 20 30 40 50 60
Distance from End of Beam, in.
Stra
in, i
n./in
. *10
^6
Figure B.24 – 4.300.5S.RB

229
y = 42.208x - 31.152R2 = 0.9893
y = 52.623x - 103.58R2 = 0.9917
y = 33.184x - 169.92R2 = 0.9776
y = 30.153x - 161.56R2 = 0.9773
0
200
400
600
800
1000
1200
0 10 20 30 40 50 60
Distance from End of Beam, in.
Stra
in, i
n./in
. *10
^6
Figure B.25 – 5.270.5S.RA
y = 28.313x + 102.67R2 = 0.9674
y = 22.352x + 158.4R2 = 0.9812
y = 42.478x + 244.76R2 = 0.9718
y = 51.342x + 150.58R2 = 0.9666
0
200
400
600
800
1000
1200
0 10 20 30 40 50 60
Distance from End of Beam, in.
Stra
in, i
n./in
. *10
^6
Figure B.26 – 5.270.5S.RB

230
y = 26.724x - 90.65R2 = 0.9905
y = 32.049x - 120.29R2 = 0.9619
y = 39.252x + 12.752R2 = 0.9863
y = 47.003x - 51.806R2 = 0.9724
0
200
400
600
800
1000
1200
0 10 20 30 40 50 60
Distance from End of Beam, in.
Stra
in, i
n./in
. *10
^6
Figure B.27 – 5.300.5S.RA
y = 29.822x + 68.902R2 = 0.9213
y = 32.609x + 79.175R2 = 0.9508
y = 48.913x + 129.14R2 = 0.9911
y = 54.985x + 113.05R2 = 0.9896
0
200
400
600
800
1000
1200
0 10 20 30 40 50 60
Distance from End of Beam, in.
Stra
in, i
n./in
. *10
^6
Figure B.28 – 5.300.5S.RB

231
y = 21.775x - 94.757R2 = 0.9721
y = 21.921x - 40.121R2 = 0.9401
y = 33.885x + 4.1148R2 = 0.9881
y = 27.736x + 229.95R2 = 0.9272
0
200
400
600
800
1000
1200
0.00 10.00 20.00 30.00 40.00 50.00 60.00
Distance from End of Beam, in.
Stra
in, i
n./in
. *10
^6
Figure B.29 – 5.270.5S.UA
y = 21.009x + 58.956R2 = 0.9665
y = 22.737x + 20.784R2 = 0.9877
y = 30.71x + 250.74R2 = 0.9858
y = 31.068x + 209.54R2 = 0.9733
0
200
400
600
800
1000
1200
0 10 20 30 40 50 60
Distance from End of Beam, in.
Stra
in, i
n./in
. *10
^6
Figure B.30 – 5.270.5S.UB

232
y = 25.566x - 124.56R2 = 0.9848
y = 27.5x - 117.19R2 = 0.9925
y = 34.378x + 58.133R2 = 0.9875
y = 38.306x + 39.539R2 = 0.9984
0
200
400
600
800
1000
1200
0 10 20 30 40 50 60
Distance from End of Beam, in.
Stra
in, i
n./in
. *10
^6
Figure B.31 – 5.300.5S.UA
y = 26.585x + 37.667R2 = 0.9866
y = 25.705x + 95.874R2 = 0.9892
y = 38.419x + 188.15R2 = 0.9882
y = 41.752x + 253.31R2 = 0.9896
0
200
400
600
800
1000
1200
0 10 20 30 40 50 60
Distance from End of Beam, in.
Stra
in, i
n./in
. *10
^6
Figure B.32 – 5.300.5S.UB
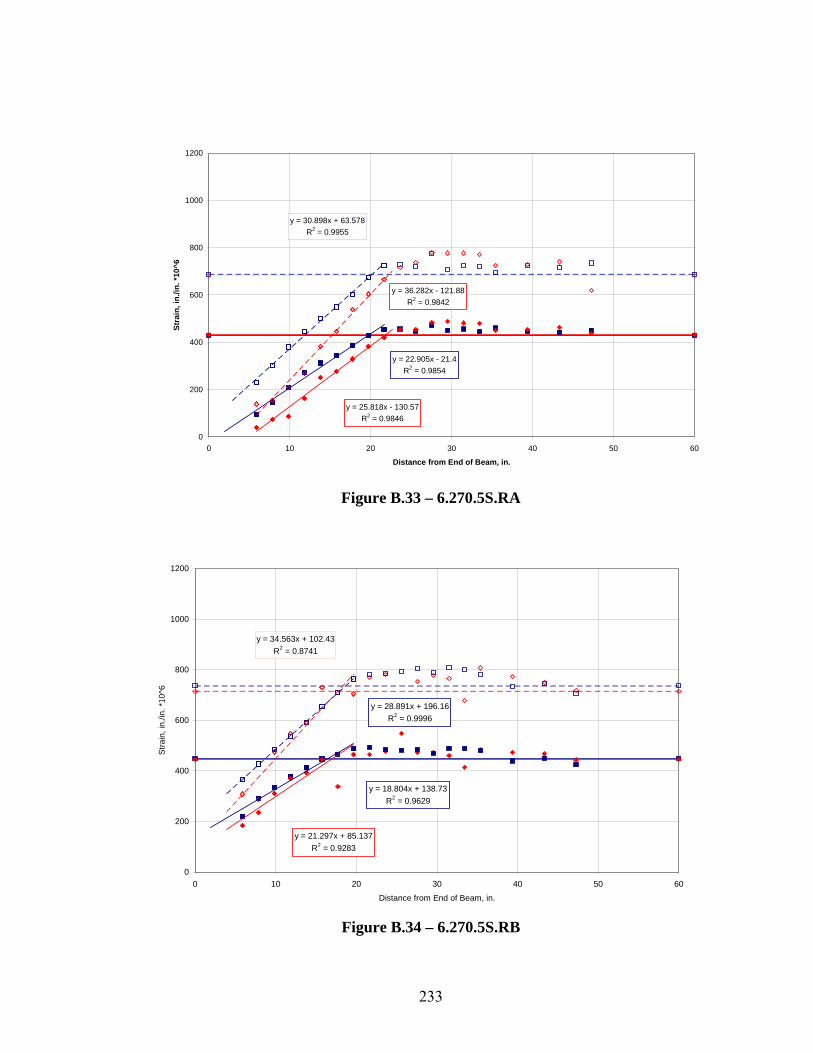
233
y = 22.905x - 21.4R2 = 0.9854
y = 25.818x - 130.57R2 = 0.9846
y = 30.898x + 63.578R2 = 0.9955
y = 36.282x - 121.88R2 = 0.9842
0
200
400
600
800
1000
1200
0 10 20 30 40 50 60
Distance from End of Beam, in.
Stra
in, i
n./in
. *10
^6
Figure B.33 – 6.270.5S.RA
y = 18.804x + 138.73R2 = 0.9629
y = 21.297x + 85.137R2 = 0.9283
y = 28.891x + 196.16R2 = 0.9996
y = 34.563x + 102.43R2 = 0.8741
0
200
400
600
800
1000
1200
0 10 20 30 40 50 60
Distance from End of Beam, in.
Stra
in, i
n./in
. *10
^6
Figure B.34 – 6.270.5S.RB

234
y = 28.948x - 75.73R2 = 0.983
y = 30.601x - 190.38R2 = 0.9655
y = 39.592x - 28.921R2 = 0.9919
y = 43.846x - 207.32R2 = 0.9891
0
200
400
600
800
1000
1200
0 10 20 30 40 50 60
Distance from End of Beam, in.
Stra
in, i
n./in
. *10
^6
Figure B.35 – 6.270.6N.RA
y = 36.034x + 116R2 = 0.9047
y = 34.002x + 88.533R2 = 0.9476
y = 39.116x + 249.05R2 = 0.9295
y = 37.302x + 210.29R2 = 0.9706
0
200
400
600
800
1000
1200
0 10 20 30 40 50 60
Distance from End of Beam, in.
Stra
in, i
n./in
. *10
^6
Figure B.36 – 6.270.6N.RA

235
y = 22.837x - 16.467R2 = 0.9539
y = 25.01x - 89.594R2 = 0.993
y = 26.547x + 190.33R2 = 0.9738
y = 34.391x + 16.301R2 = 0.9931
0
200
400
600
800
1000
1200
0 10 20 30 40 50 60
Distance from End of Beam, in.
Stra
in, i
n./in
. *10
^6
Figure B.37 – 6.270.5S.UA
y = 20.763x + 22.159R2 = 0.9408
y = 16.917x + 89.206R2 = 0.8994
y = 28.057x + 163.59R2 = 0.9831
y = 24.537x + 237.21R2 = 0.9718
0
200
400
600
800
1000
1200
0 10 20 30 40 50 60
Distance from End of Beam, in.
Stra
in, i
n./in
. *10
^6
Figure B.38 – 6.270.5S.UB

236
y = 28.308x - 138.47R2 = 0.988
y = 27.615x - 162.23R2 = 0.9776
y = 35.012x - 25.794R2 = 0.9767
y = 29.606x + 15.345R2 = 0.9774
0
200
400
600
800
1000
1200
0 10 20 30 40 50 60
Distance from End of Beam, in.
Stra
in, i
n./in
. *10
^6
Figure B.39 – 6.270.6N.UA
y = 26.919x + 131R2 = 0.9453
y = 26.126x + 214.92R2 = 0.8673
y = 31.141x + 270.21R2 = 0.9648
y = 23.584x + 502.28R2 = 0.9113
0
200
400
600
800
1000
1200
0 10 20 30 40 50 60
Distance from End of Beam, in.
Stra
in, i
n./in
. *10
^6
Figure B.40 – 6.270.6N.UB

237
y = 16.967x - 15.776R2 = 0.9908
y = 13.205x - 0.0501R2 = 0.9841
y = 19.125x + 115.32R2 = 0.9723
y = 26.017x + 83.39R2 = 0.9942
0
100
200
300
400
500
600
700
800
900
1000
0 10 20 30 40 50 60
Distance from End of Beam, in.
Stra
in, i
n./in
. *10
^6
Figure B.41. Pour 1 Strand A Live End Surface Strains
y = 14.78x + 15.333R2 = 0.8587
y = 19.643x - 16.571R2 = 0.9885
y = 18.687x + 133.63R2 = 0.9506
y = 25.274x + 111.73R2 = 0.9615
0
100
200
300
400
500
600
700
800
900
1000
0 10 20 30 40 50 60
Distance from End of Beam, in.
Stra
in, i
n./in
. *10
^6
Figure B.42. Pour 1 Strand A Dead End Surface Strains

238
y = 17.175x + 2.8571R2 = 0.989
y = 12.845x + 25.048R2 = 0.9888
y = 19.161x + 132.29R2 = 0.9653
y = 25.201x + 113.85R2 = 0.9812
0
100
200
300
400
500
600
700
800
900
1000
0 10 20 30 40 50 60
Distance from End of Beam, in.
Stra
in, i
n./in
. *10
^6
Figure B.43. Pour 1 Strand B Live End Surface Strains
y = 17.925x + 15.333R2 = 0.9634
y = 14.732x + 25.238R2 = 0.9812
y = 21.771x + 138.67R2 = 0.9846
y = 24.819x + 140.19R2 = 0.9851
0
100
200
300
400
500
600
700
800
900
1000
0 10 20 30 40 50 60
Distance from End of Beam, in.
Stra
in, i
n./in
. *10
^6
Figure B.44. Pour 1 Strand B Dead End Surface Strains

239
y = 17.32x + 17.714R2 = 0.9844
y = 12.434x + 44.571R2 = 0.9843
y = 15.711x + 183.94R2 = 0.9528
y = 23.299x + 157.31R2 = 0.9433
0
100
200
300
400
500
600
700
800
900
1000
0 10 20 30 40 50 60
Distance from End of Beam, in.
Stra
in, i
n./in
. *10
^6
Figure B.45. Pour 1 Strand C Live End Surface Strains
y = 13.377x + 66.571R2 = 0.9417
y = 15.022x + 27.333R2 = 0.9942
y = 21.046x + 121.9R2 = 0.9799
y = 24.336x + 145.14R2 = 0.968
0
100
200
300
400
500
600
700
800
900
1000
0 10 20 30 40 50 60
Distance from End of Beam, in.
Stra
in, i
n./in
. *10
^6
Figure B.46. Pour 1 Strand C Dead End Surface Strains

240
y = 15.845x + 39.714R2 = 0.9952
y = 10.692x + 58.095R2 = 0.9875
y = 15.349x + 176.82R2 = 0.9812
y = 22.094x + 170.03R2 = 0.9829
0
100
200
300
400
500
600
700
800
900
1000
0 10 20 30 40 50 60
Distance from End of Beam, in.
Stra
in, i
n./in
. *10
^6
Figure B.47. Pour 1 Strand D Live End Surface Strains
y = 15.482x + 57.333R2 = 0.9264
y = 14.418x + 40.571R2 = 0.9772
y = 25.303x + 80.571R2 = 0.9774
y = 24.553x + 113.05R2 = 0.9643
0
100
200
300
400
500
600
700
800
900
1000
0 10 20 30 40 50 60
Distance from End of Beam, in.
Stra
in, i
n./in
. *10
^6
Figure B.48. Pour 1 Strand D Dead End Surface Strains
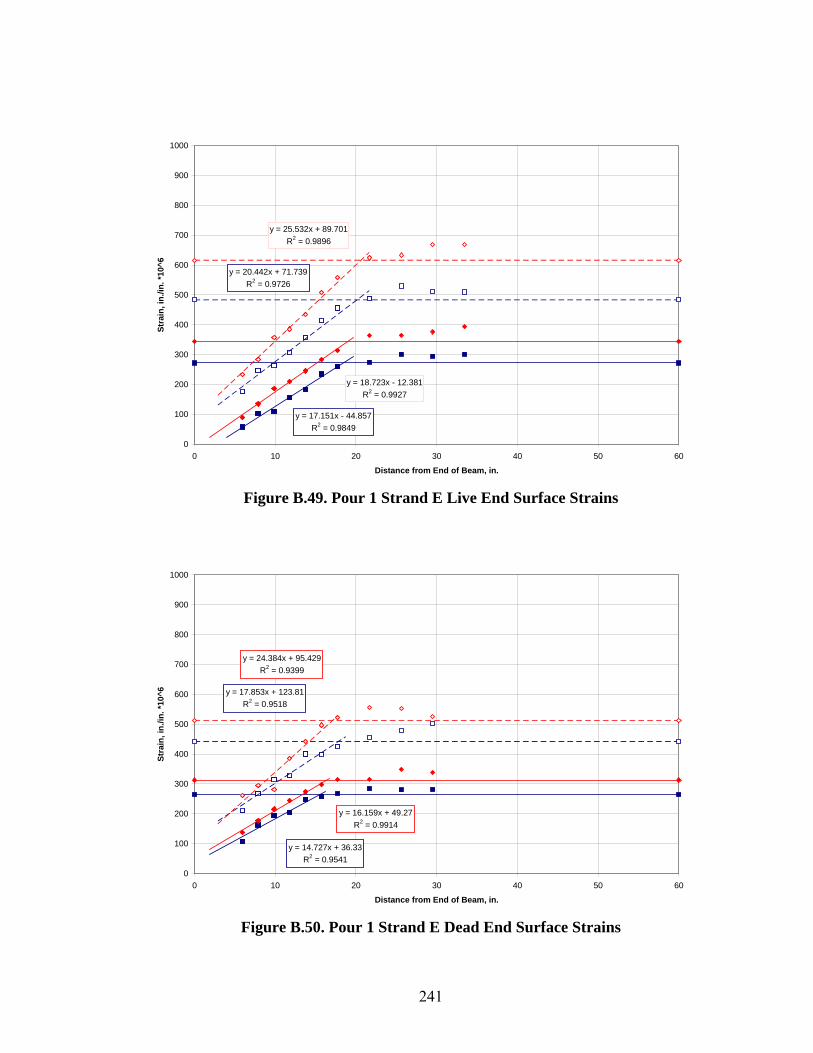
241
y = 18.723x - 12.381R2 = 0.9927
y = 17.151x - 44.857R2 = 0.9849
y = 20.442x + 71.739R2 = 0.9726
y = 25.532x + 89.701R2 = 0.9896
0
100
200
300
400
500
600
700
800
900
1000
0 10 20 30 40 50 60
Distance from End of Beam, in.
Stra
in, i
n./in
. *10
^6
Figure B.49. Pour 1 Strand E Live End Surface Strains
y = 16.159x + 49.27R2 = 0.9914
y = 14.727x + 36.33R2 = 0.9541
y = 17.853x + 123.81R2 = 0.9518
y = 24.384x + 95.429R2 = 0.9399
0
100
200
300
400
500
600
700
800
900
1000
0 10 20 30 40 50 60
Distance from End of Beam, in.
Stra
in, i
n./in
. *10
^6
Figure B.50. Pour 1 Strand E Dead End Surface Strains

242
y = 13.259x - 15.413R2 = 0.9553
y = 11.121x + 32.541R2 = 0.9132
y = 17.65x + 121.12R2 = 0.9758
y = 18.763x + 132.88R2 = 0.9813
0
100
200
300
400
500
600
700
800
900
1000
0 10 20 30 40 50 60
Distance from End of Beam, in.
Stra
in, i
n./in
. *10
^6
Figure B.51. Pour 1 Strand F Live End Surface Strains
y = 7.0154x + 2.7978R2 = 0.9834
y = 8.5972x - 1.116R2 = 0.9886
y = 12.299x + 145.5R2 = 0.9553
y = 11.919x + 118.35R2 = 0.95
0
100
200
300
400
500
600
700
800
900
1000
0 10 20 30 40 50 60
Distance from End of Beam, in.
Stra
in, i
n./in
. *10
^6
Figure B.52. Pour 1 Strand F Dead End Surface Strains

243
y = 13.25x - 19.866R2 = 0.9753
y = 11.811x + 17.199R2 = 0.9898
y = 17.585x + 67.001R2 = 0.9855
y = 15.794x + 135.01R2 = 0.9462
0
100
200
300
400
500
600
700
800
900
1000
0 10 20 30 40 50 60
Distance from End of Beam, in.
Stra
in, i
n./in
. *10
^6
Figure B.53. Pour 1 Strand G Live End Surface Strains
y = 8.4529x + 33.21R2 = 0.9739
y = 11.034x + 29.8R2 = 0.9915
y = 14.105x + 155.3R2 = 0.9835
y = 14.117x + 141.13R2 = 0.9912
0
100
200
300
400
500
600
700
800
900
1000
0 10 20 30 40 50 60
Distance from End of Beam, in.
Stra
in, i
n./in
. *10
^6
Figure B.54. Pour 1 Strand G Dead End Surface Strains

244
y = 15.581x - 66.408R2 = 0.9229
y = 14.116x - 40.817R2 = 0.9551
y = 17.763x + 11.432R2 = 0.9544
y = 18.677x + 16.91R2 = 0.9358
0
100
200
300
400
500
600
700
800
900
1000
0 10 20 30 40 50 60
Distance from End of Beam, in.
Stra
in, i
n./in
. *10
^6
Figure B.55. Pour 1 Strand H Live End Surface Strains
y = 17.842x - 12.817R2 = 0.9477
y = 10.89x + 47.835R2 = 0.9658
y = 23.276x + 70.067R2 = 0.9406
y = 17.537x + 124.76R2 = 0.963
0
100
200
300
400
500
600
700
800
900
1000
0 10 20 30 40 50 60
Distance from End of Beam, in.
Stra
in, i
n./in
. *10
^6
Figure B.56. Pour 1 Strand H Dead End Surface Strains
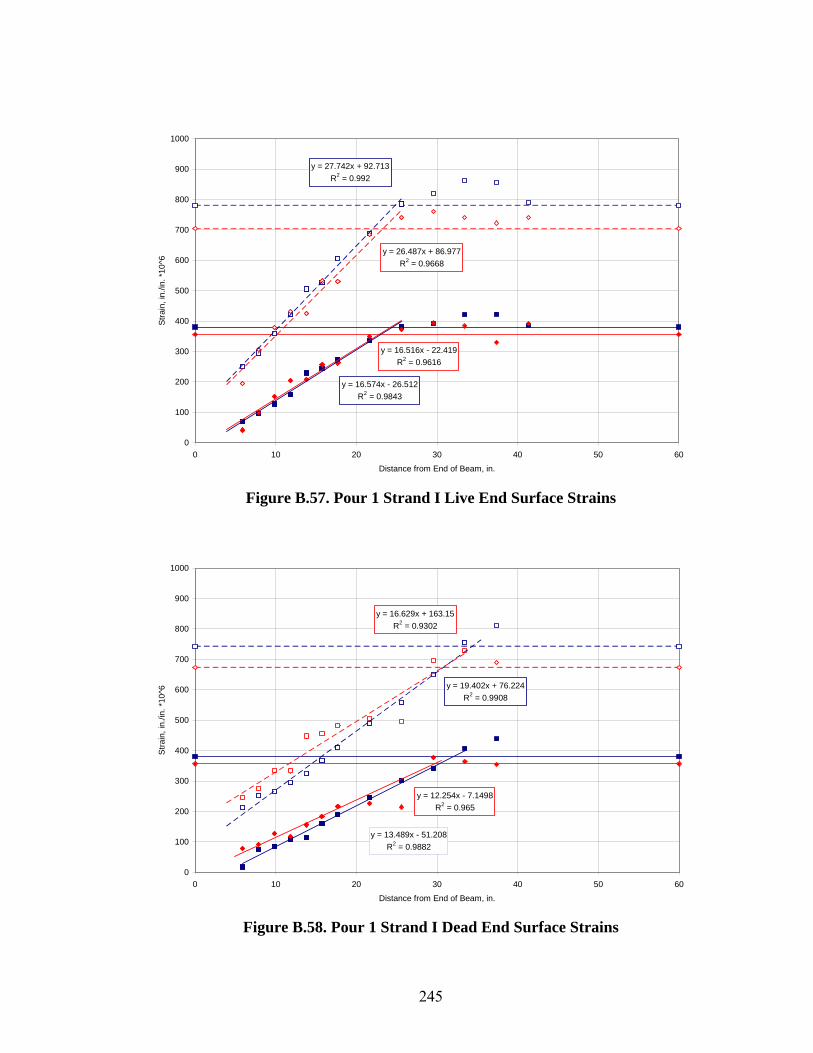
245
y = 16.516x - 22.419R2 = 0.9616
y = 16.574x - 26.512R2 = 0.9843
y = 27.742x + 92.713R2 = 0.992
y = 26.487x + 86.977R2 = 0.9668
0
100
200
300
400
500
600
700
800
900
1000
0 10 20 30 40 50 60
Distance from End of Beam, in.
Stra
in, i
n./in
. *10
^6
Figure B.57. Pour 1 Strand I Live End Surface Strains
y = 12.254x - 7.1498R2 = 0.965
y = 13.489x - 51.208R2 = 0.9882
y = 19.402x + 76.224R2 = 0.9908
y = 16.629x + 163.15R2 = 0.9302
0
100
200
300
400
500
600
700
800
900
1000
0 10 20 30 40 50 60
Distance from End of Beam, in.
Stra
in, i
n./in
. *10
^6
Figure B.58. Pour 1 Strand I Dead End Surface Strains
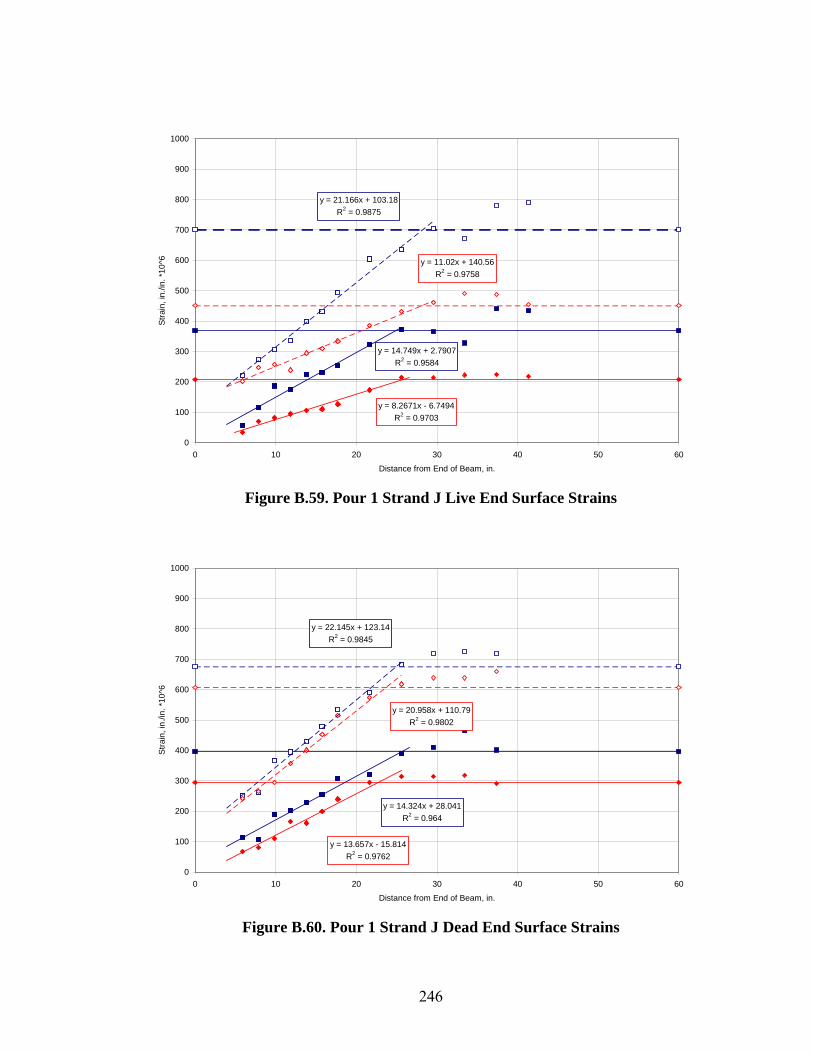
246
y = 8.2671x - 6.7494R2 = 0.9703
y = 14.749x + 2.7907R2 = 0.9584
y = 21.166x + 103.18R2 = 0.9875
y = 11.02x + 140.56R2 = 0.9758
0
100
200
300
400
500
600
700
800
900
1000
0 10 20 30 40 50 60
Distance from End of Beam, in.
Stra
in, i
n./in
. *10
^6
Figure B.59. Pour 1 Strand J Live End Surface Strains
y = 13.657x - 15.814R2 = 0.9762
y = 14.324x + 28.041R2 = 0.964
y = 22.145x + 123.14R2 = 0.9845
y = 20.958x + 110.79R2 = 0.9802
0
100
200
300
400
500
600
700
800
900
1000
0 10 20 30 40 50 60
Distance from End of Beam, in.
Stra
in, i
n./in
. *10
^6
Figure B.60. Pour 1 Strand J Dead End Surface Strains

247
y = 21.699x - 112.67R2 = 0.99
y = 18.409x - 123.9R2 = 0.9781
y = 23.345x - 3.1178R2 = 0.9338
y = 29.108x + 5.8881R2 = 0.9823
0
100
200
300
400
500
600
700
800
900
1000
0 10 20 30 40 50 60
Distance from End of Beam, in.
Stra
in, i
n./in
. *10
^6
Figure B.61. Pour 2 Strand A Live End Surface Strains
y = 12.579x + 67.429R2 = 0.9649
y = 13.014x + 84.571R2 = 0.9229
y = 21.796x + 211.71R2 = 0.9366
y = 24.118x + 159.71R2 = 0.9731
0
100
200
300
400
500
600
700
800
900
1000
0 10 20 30 40 50 60
Distance from End of Beam, in.
Stra
in, i
n./in
. *10
^6
Figure B.62. Pour 2 Strand A Dead End Surface Strains

248
y = 17.732x - 25.048R2 = 0.9882
y = 12.531x - 6.8571R2 = 0.9854
y = 17.626x + 96.555R2 = 0.9835
y = 22.944x + 132.11R2 = 0.9823
0
100
200
300
400
500
600
700
800
900
1000
0 10 20 30 40 50 60
Distance from End of Beam, in.
Stra
in, i
n./in
. *10
^6
Figure B.63. Pour 2 Strand B Live End Surface Strains
y = 14.224x + 53.333R2 = 0.9281
y = 13.208x + 80.762R2 = 0.8506
y = 22.062x + 196.19R2 = 0.957
y = 20.901x + 191.05R2 = 0.9565
0
100
200
300
400
500
600
700
800
900
1000
0 10 20 30 40 50 60
Distance from End of Beam, in.
Stra
in, i
n./in
. *10
^6
Figure B.64. Pour 2 Strand B Dead End Surface Strains

249
y = 17.998x + 7.0476R2 = 0.9571
y = 11.781x + 23.143R2 = 0.9473
y = 19.009x + 111.09R2 = 0.9553
y = 20.972x + 192.83R2 = 0.9231
0
100
200
300
400
500
600
700
800
900
1000
0 10 20 30 40 50 60
Distance from End of Beam, in.
Stra
in, i
n./in
. *10
^6
Figure B.65. Pour 2 Strand C Live End Surface Strains
y = 13.329x + 58.381R2 = 0.8989
y = 15.095x + 46.667R2 = 0.9616
y = 25.179x + 119.54R2 = 0.9613
y = 23.779x + 148.1R2 = 0.9662
0
100
200
300
400
500
600
700
800
900
1000
0 10 20 30 40 50 60
Distance from End of Beam, in.
Stra
in, i
n./in
. *10
^6
Figure B.66. Pour 2 Strand C Dead End Surface Strains
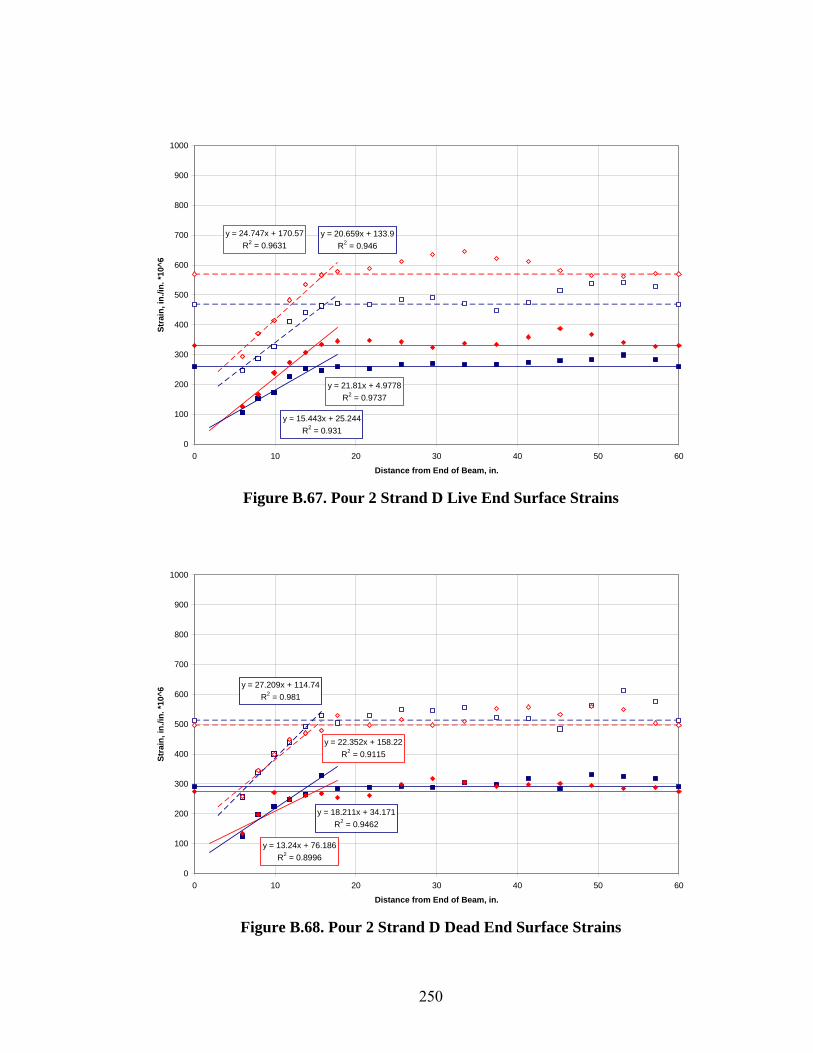
250
y = 21.81x + 4.9778R2 = 0.9737
y = 15.443x + 25.244R2 = 0.931
y = 20.659x + 133.9R2 = 0.946
y = 24.747x + 170.57R2 = 0.9631
0
100
200
300
400
500
600
700
800
900
1000
0 10 20 30 40 50 60
Distance from End of Beam, in.
Stra
in, i
n./in
. *10
^6
Figure B.67. Pour 2 Strand D Live End Surface Strains
y = 13.24x + 76.186R2 = 0.8996
y = 18.211x + 34.171R2 = 0.9462
y = 27.209x + 114.74R2 = 0.981
y = 22.352x + 158.22R2 = 0.9115
0
100
200
300
400
500
600
700
800
900
1000
0 10 20 30 40 50 60
Distance from End of Beam, in.
Stra
in, i
n./in
. *10
^6
Figure B.68. Pour 2 Strand D Dead End Surface Strains

251
y = 21.796x - 12.286R2 = 0.9777
y = 17.325x - 19.826R2 = 0.9884
y = 24.632x + 74.261R2 = 0.9883
y = 26.876x + 130R2 = 0.9733
0
100
200
300
400
500
600
700
800
900
1000
0 10 20 30 40 50 60
Distance from End of Beam, in.
Stra
in, i
n./in
. *10
^6
Figure B.69. Pour 2 Strand E Live End Surface Strains
y = 14.429x + 58.357R2 = 0.9378
y = 13.044x + 82.781R2 = 0.9706
y = 18.965x + 204.57R2 = 0.9744
y = 23.174x + 129.52R2 = 0.9732
0
100
200
300
400
500
600
700
800
900
1000
0 10 20 30 40 50 60
Distance from End of Beam, in.
Stra
in, i
n./in
. *10
^6
Figure B.70. Pour 2 Strand E Dead End Surface Strains

252
y = 11.507x + 21.891R2 = 0.8828
y = 7.0122x + 67.07R2 = 0.8154
y = 12.226x + 157.58R2 = 0.9375
y = 17.745x + 114.51R2 = 0.9876
0
100
200
300
400
500
600
700
800
900
1000
0 10 20 30 40 50 60
Distance from End of Beam, in.
Stra
in, i
n./in
. *10
^6
Figure B.71. Pour 2 Strand F Live End Surface Strains
y = 11.917x - 10.747R2 = 0.9805
y = 12.92x + 35.669R2 = 0.953
y = 17.769x + 144.44R2 = 0.9872
y = 16.478x + 95.034R2 = 0.988
0
100
200
300
400
500
600
700
800
900
1000
0 10 20 30 40 50 60
Distance from End of Beam, in.
Stra
in, i
n./in
. *10
^6
Figure B.72. Pour 2 Strand F Dead End Surface Strains

253
y = 14.616x - 28.281R2 = 0.9819
y = 12.905x - 37.965R2 = 0.9515
y = 16.954x + 61.734R2 = 0.9558
y = 16.799x + 104.16R2 = 0.9872
0
100
200
300
400
500
600
700
800
900
1000
0 10 20 30 40 50 60
Distance from End of Beam, in.
Stra
in, i
n./in
. *10
^6
Figure B.73. Pour 2 Strand G Live End Surface Strains
y = 8.8526x + 43.762R2 = 0.8856
y = 15.695x + 51.187R2 = 0.9408
y = 21.578x + 139.81R2 = 0.9448
y = 11.144x + 192.72R2 = 0.9507
0
100
200
300
400
500
600
700
800
900
1000
0 10 20 30 40 50 60
Distance from End of Beam, in.
Stra
in, i
n./in
. *10
^6
Figure B.74. Pour 2 Strand G Dead End Surface Strains

254
Strand H Live
y = 16.768x - 80.146R2 = 0.9732
y = 14.18x - 64.424R2 = 0.9705
y = 15.256x + 79.773R2 = 0.9741
y = 19.437x + 44.825R2 = 0.9895
0
100
200
300
400
500
600
700
800
900
1000
0 10 20 30 40 50 60
Distance from End of Beam, in.
Stra
in, i
n./in
. *10
^6
Figure B.75. Pour 2 Strand H Live End Surface Strains
y = 15.811x + 27.708R2 = 0.9552
y = 18.114x + 52.33R2 = 0.9105
y = 24.21x + 172.33R2 = 0.953
y = 18.946x + 183.1R2 = 0.9574
0
100
200
300
400
500
600
700
800
900
1000
0 10 20 30 40 50 60
Distance from End of Beam, in.
Stra
in, i
n./in
. *10
^6
Figure B.76. Pour 2 Strand H Dead End Surface Strains
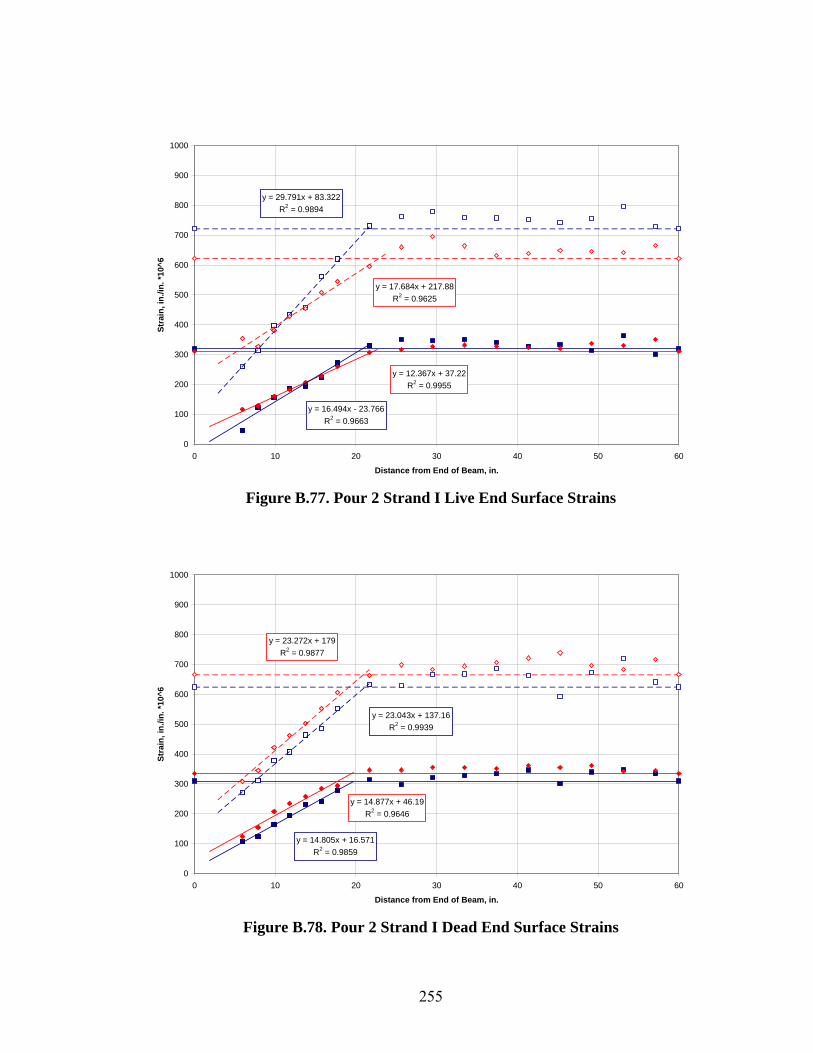
255
y = 12.367x + 37.22R2 = 0.9955
y = 16.494x - 23.766R2 = 0.9663
y = 29.791x + 83.322R2 = 0.9894
y = 17.684x + 217.88R2 = 0.9625
0
100
200
300
400
500
600
700
800
900
1000
0 10 20 30 40 50 60
Distance from End of Beam, in.
Stra
in, i
n./in
. *10
^6
Figure B.77. Pour 2 Strand I Live End Surface Strains
y = 14.877x + 46.19R2 = 0.9646
y = 14.805x + 16.571R2 = 0.9859
y = 23.043x + 137.16R2 = 0.9939
y = 23.272x + 179R2 = 0.9877
0
100
200
300
400
500
600
700
800
900
1000
0 10 20 30 40 50 60
Distance from End of Beam, in.
Stra
in, i
n./in
. *10
^6
Figure B.78. Pour 2 Strand I Dead End Surface Strains

256
y = 16.469x + 21.917R2 = 0.9013
y = 15.506x + 42.571R2 = 0.9243
y = 25.871x + 177.27R2 = 0.9558
y = 22.8x + 176.82R2 = 0.9841
0
100
200
300
400
500
600
700
800
900
1000
0 10 20 30 40 50 60
Distance from End of Beam, in.
Stra
in, i
n./in
. *10
^6
Figure B.79. Pour 2 Strand J Live End Surface Strains
y = 19.991x - 10.438R2 = 0.9885
y = 18.699x + 68.286R2 = 0.9756
y = 26.642x + 251.56R2 = 0.9789
y = 19.166x + 256.39R2 = 0.9893
0
100
200
300
400
500
600
700
800
900
1000
0 10 20 30 40 50 60
Distance from End of Beam, in.
Stra
in, i
n./in
. *10
^6
Figure B.80. Pour 2 Strand J Dead End Surface Strains
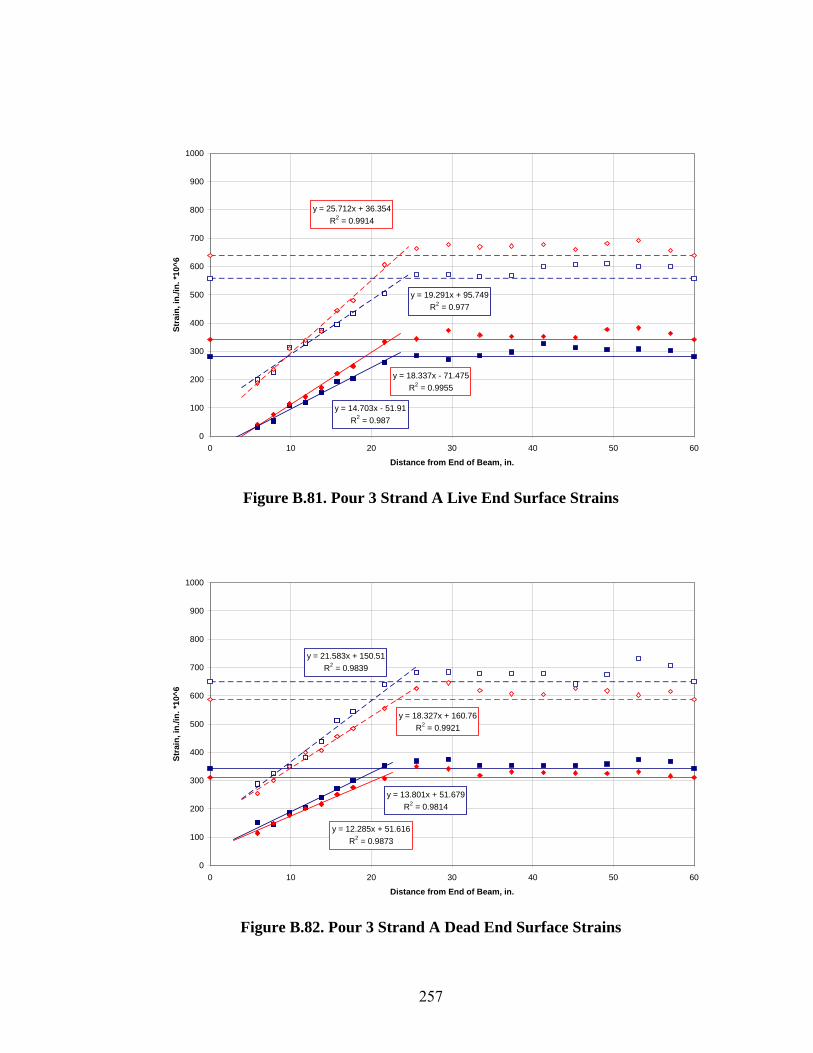
257
y = 18.337x - 71.475R2 = 0.9955
y = 14.703x - 51.91R2 = 0.987
y = 19.291x + 95.749R2 = 0.977
y = 25.712x + 36.354R2 = 0.9914
0
100
200
300
400
500
600
700
800
900
1000
0 10 20 30 40 50 60
Distance from End of Beam, in.
Stra
in, i
n./in
. *10
^6
Figure B.81. Pour 3 Strand A Live End Surface Strains
y = 12.285x + 51.616R2 = 0.9873
y = 13.801x + 51.679R2 = 0.9814
y = 21.583x + 150.51R2 = 0.9839
y = 18.327x + 160.76R2 = 0.9921
0
100
200
300
400
500
600
700
800
900
1000
0 10 20 30 40 50 60
Distance from End of Beam, in.
Stra
in, i
n./in
. *10
^6
Figure B.82. Pour 3 Strand A Dead End Surface Strains
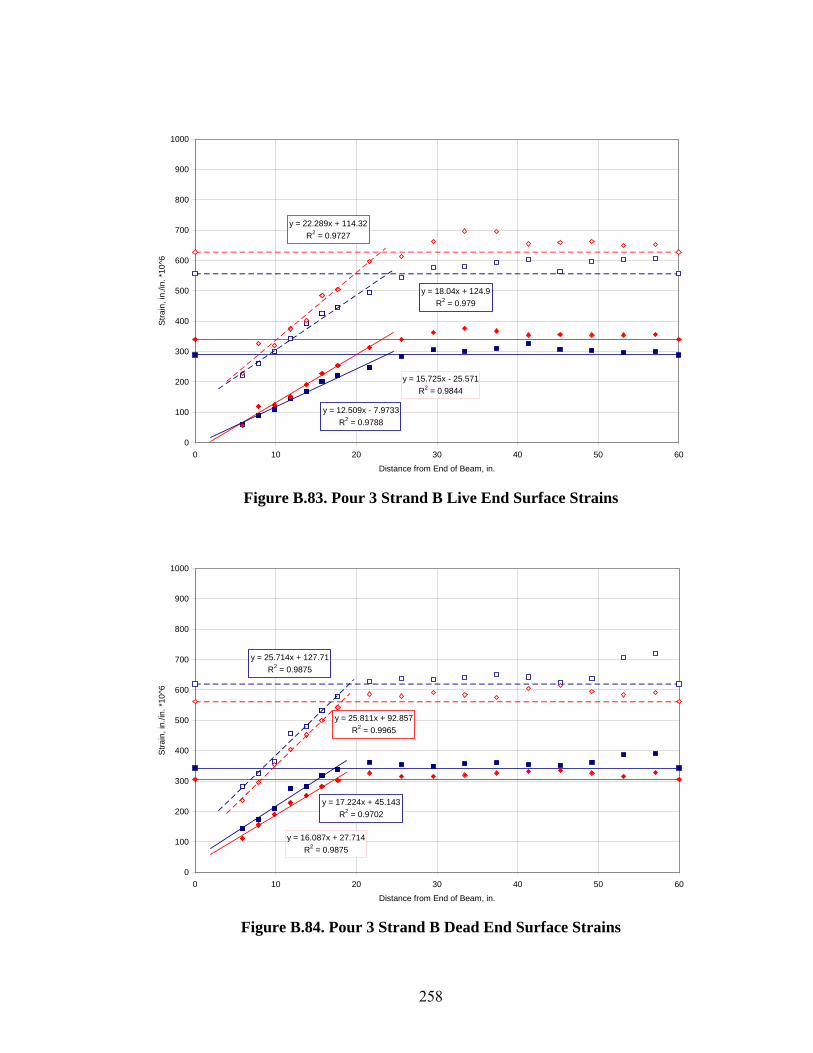
258
y = 15.725x - 25.571R2 = 0.9844
y = 12.509x - 7.9733R2 = 0.9788
y = 18.04x + 124.9R2 = 0.979
y = 22.289x + 114.32R2 = 0.9727
0
100
200
300
400
500
600
700
800
900
1000
0 10 20 30 40 50 60
Distance from End of Beam, in.
Stra
in, i
n./in
. *10
^6
Figure B.83. Pour 3 Strand B Live End Surface Strains
y = 16.087x + 27.714R2 = 0.9875
y = 17.224x + 45.143R2 = 0.9702
y = 25.714x + 127.71R2 = 0.9875
y = 25.811x + 92.857R2 = 0.9965
0
100
200
300
400
500
600
700
800
900
1000
0 10 20 30 40 50 60
Distance from End of Beam, in.
Stra
in, i
n./in
. *10
^6
Figure B.84. Pour 3 Strand B Dead End Surface Strains

259
y = 19.038x - 15.714R2 = 0.9711
y = 15.216x - 4.2857R2 = 0.9756
y = 24.215x + 86.571R2 = 0.9836
y = 27.166x + 80.857R2 = 0.9934
0
100
200
300
400
500
600
700
800
900
1000
0 10 20 30 40 50 60
Distance from End of Beam, in.
Stra
in, i
n./in
. *10
^6
Figure B.85. Pour 3 Strand C Live End Surface Strains
y = 14.926x + 66.571R2 = 0.9741
y = 16.183x + 68.476R2 = 0.9728
y = 28.521x + 98.19R2 = 0.9751
y = 25.521x + 116.86R2 = 0.9927
0
100
200
300
400
500
600
700
800
900
1000
0 10 20 30 40 50 60
Distance from End of Beam, in.
Stra
in, i
n./in
. *10
^6
Figure B.86. Pour 3 Strand C Dead End Surface Strains

260
y = 16.28x + 39.524R2 = 0.9772
y = 13.764x + 40.476R2 = 0.9887
y = 20.731x + 139.9R2 = 0.9974
y = 24.19x + 134.67R2 = 0.9987
0
100
200
300
400
500
600
700
800
900
1000
0 10 20 30 40 50 60
Distance from End of Beam, in.
Stra
in, i
n./in
. *10
^6
Figure B.87. Pour 3 Strand D Live End Surface Strains
y = 15.313x + 71.714R2 = 0.9272
y = 15.264x + 84.286R2 = 0.9152
y = 24.481x + 159.43R2 = 0.9714
y = 24.892x + 126R2 = 0.9773
0
100
200
300
400
500
600
700
800
900
1000
0 10 20 30 40 50 60
Distance from End of Beam, in.
Stra
in, i
n./in
. *10
^6
Figure B.88. Pour 3 Strand D Dead End Surface Strains

261
y = 25.231x - 86.381R2 = 0.9928
y = 21.505x - 73.238R2 = 0.9892
y = 31.23x - 25.81R2 = 0.9937
y = 35.246x - 25.81R2 = 0.9958
0
100
200
300
400
500
600
700
800
900
1000
0 10 20 30 40 50 60
Distance from End of Beam, in.
Stra
in, i
n./in
. *10
^6
Figure B.89. Pour 3 Strand E Live End Surface Strains
y = 15.675x + 69.333R2 = 0.9851
y = 15.942x + 78.571R2 = 0.9738
y = 23.054x + 170R2 = 0.9709
y = 24.094x + 136.76R2 = 0.9812
0
100
200
300
400
500
600
700
800
900
1000
0 10 20 30 40 50 60
Distance from End of Beam, in.
Stra
in, i
n./in
. *10
^6
Figure B.90. Pour 3 Strand E Dead End Surface Strains
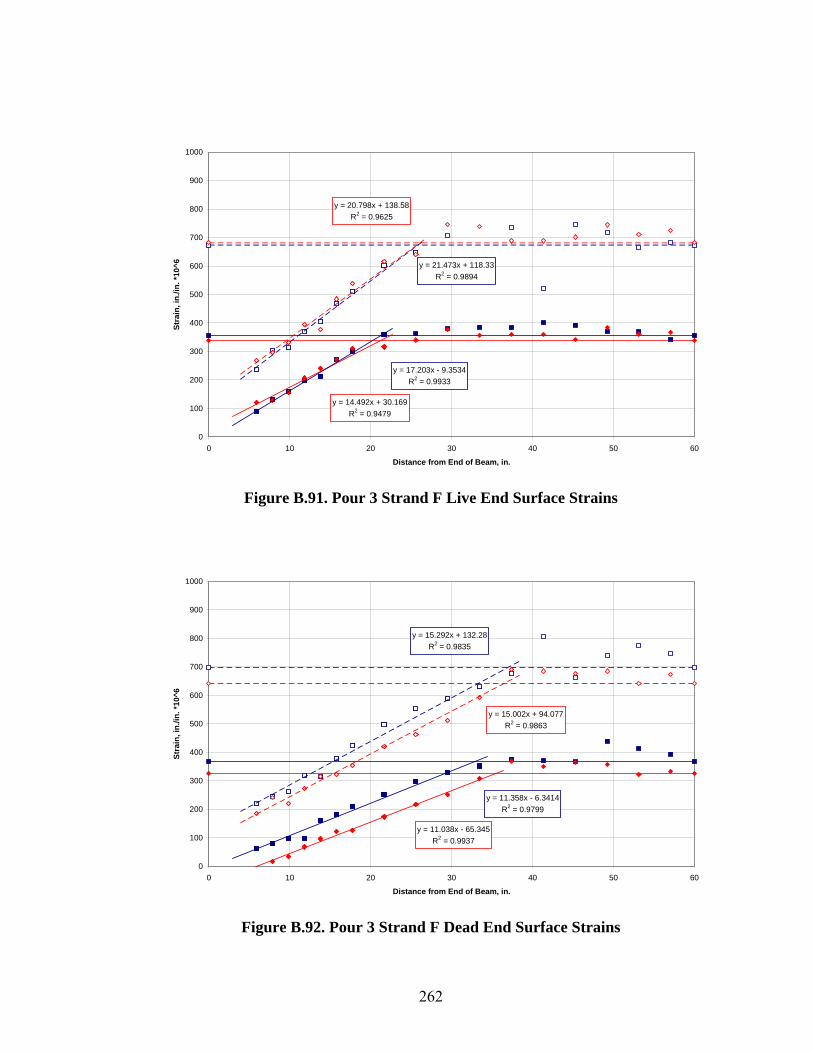
262
y = 14.492x + 30.169R2 = 0.9479
y = 17.203x - 9.3534R2 = 0.9933
y = 21.473x + 118.33R2 = 0.9894
y = 20.798x + 138.58R2 = 0.9625
0
100
200
300
400
500
600
700
800
900
1000
0 10 20 30 40 50 60
Distance from End of Beam, in.
Stra
in, i
n./in
. *10
^6
Figure B.91. Pour 3 Strand F Live End Surface Strains
y = 11.038x - 65.345R2 = 0.9937
y = 11.358x - 6.3414R2 = 0.9799
y = 15.292x + 132.28R2 = 0.9835
y = 15.002x + 94.077R2 = 0.9863
0
100
200
300
400
500
600
700
800
900
1000
0 10 20 30 40 50 60
Distance from End of Beam, in.
Stra
in, i
n./in
. *10
^6
Figure B.92. Pour 3 Strand F Dead End Surface Strains

263
y = 11.57x + 60.982R2 = 0.9732
y = 14.211x + 16.486R2 = 0.9678
y = 20.401x + 99.121R2 = 0.9885
y = 20.32x + 110.22R2 = 0.9943
0
100
200
300
400
500
600
700
800
900
1000
0 10 20 30 40 50 60
Distance from End of Beam, in.
Stra
in, i
n./in
. *10
^6
Figure B.93. Pour 3 Strand G Live End Surface Strains
y = 14.472x - 24.899R2 = 0.9835
y = 14.618x + 29.53R2 = 0.937
y = 20.753x + 115.52R2 = 0.9952
y = 18.032x + 125.18R2 = 0.9883
0
100
200
300
400
500
600
700
800
900
1000
0 10 20 30 40 50 60
Distance from End of Beam, in.
Stra
in, i
n./in
. *10
^6
Figure B.94. Pour 3 Strand G Dead End Surface Strains

264
y = 14.968x - 1.3634R2 = 0.9471
y = 15.787x - 22.556R2 = 0.9869
y = 24.668x + 7.0739R2 = 0.9944
y = 21.634x + 55.198R2 = 0.9911
0
100
200
300
400
500
600
700
800
900
1000
0 10 20 30 40 50 60
Distance from End of Beam, in.
Stra
in, i
n./in
. *10
^6
Figure B.95. Pour 3 Strand H Live End Surface Strains
y = 15.99x + 34.571R2 = 0.9602
y = 26.005x - 40.286R2 = 0.9959
y = 26.36x + 101.56R2 = 0.9897
y = 21.89x + 136.69R2 = 0.9636
0
100
200
300
400
500
600
700
800
900
1000
0 10 20 30 40 50 60
Distance from End of Beam, in.
Stra
in, i
n./in
. *10
^6
Figure B.96. Pour 3 Strand H Dead End Surface Strains
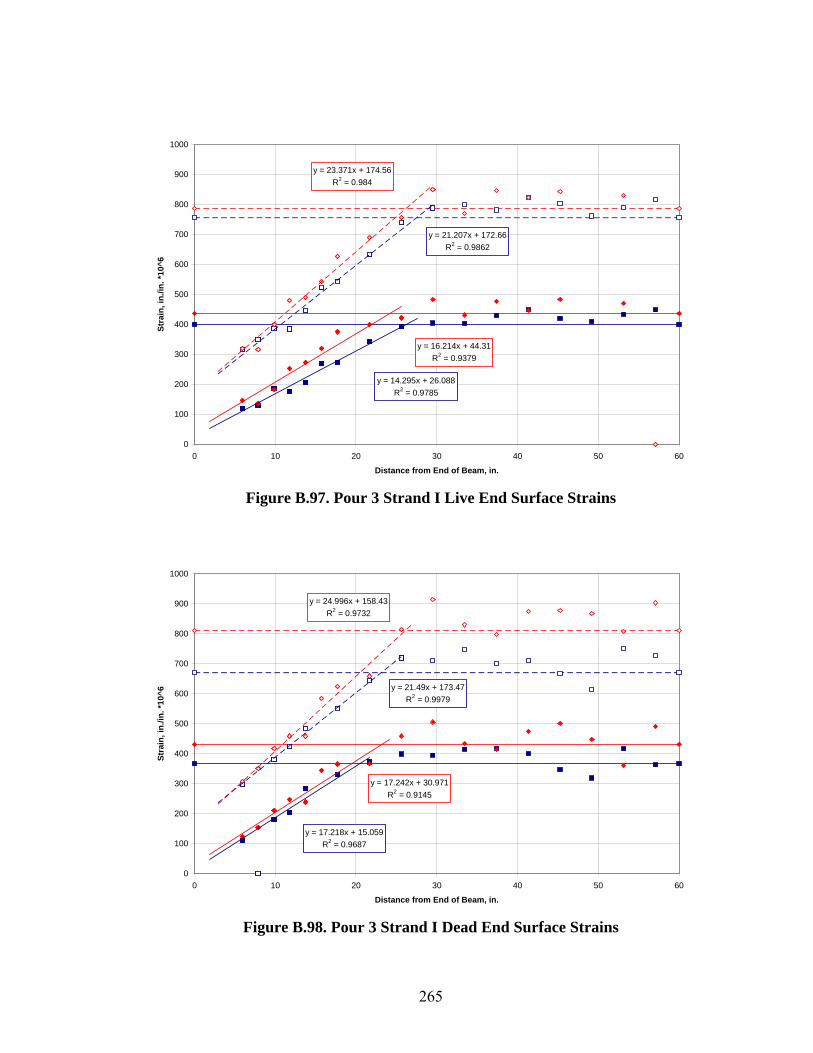
265
y = 16.214x + 44.31R2 = 0.9379
y = 14.295x + 26.088R2 = 0.9785
y = 21.207x + 172.66R2 = 0.9862
y = 23.371x + 174.56R2 = 0.984
0
100
200
300
400
500
600
700
800
900
1000
0 10 20 30 40 50 60
Distance from End of Beam, in.
Stra
in, i
n./in
. *10
^6
Figure B.97. Pour 3 Strand I Live End Surface Strains
y = 17.242x + 30.971R2 = 0.9145
y = 17.218x + 15.059R2 = 0.9687
y = 21.49x + 173.47R2 = 0.9979
y = 24.996x + 158.43R2 = 0.9732
0
100
200
300
400
500
600
700
800
900
1000
0 10 20 30 40 50 60
Distance from End of Beam, in.
Stra
in, i
n./in
. *10
^6
Figure B.98. Pour 3 Strand I Dead End Surface Strains

266
y = 17.359x + 37.86R2 = 0.9898
y = 10.299x + 61.695R2 = 0.9857
y = 14.655x + 203.71R2 = 0.9768
y = 28.322x + 119.6R2 = 0.9947
0
100
200
300
400
500
600
700
800
900
1000
0 10 20 30 40 50 60
Distance from End of Beam, in.
Stra
in, i
n./in
. *10
^6
Figure B.99. Pour 3 Strand J Live End Surface Strains
y = 14.158x + 44.207R2 = 0.9278
y = 12.221x + 100.18R2 = 0.9339
y = 18.36x + 210.25R2 = 0.974
y = 21.726x + 153.18R2 = 0.9836
0
100
200
300
400
500
600
700
800
900
1000
0 10 20 30 40 50 60
Distance from End of Beam, in.
Stra
in, i
n./in
. *10
^6
Figure B.100. Pour 3 Strand J Dead End Surface Strains

267
y = 15.457x - 24.723R2 = 0.9892
y = 9.4729x - 2.5112R2 = 0.9918
y = 13.102x + 101.74R2 = 0.9576
y = 24.177x + 51.024R2 = 0.9938
0
100
200
300
400
500
600
700
800
900
1000
0 10 20 30 40 50 60
Distance from End of Beam, in.
Stra
in, i
n./in
. *10
^6
Figure B.101. Pour 4 Strand A Live End Surface Strains
y = 11.636x + 48.476R2 = 0.9836
y = 8.9928x + 71.864R2 = 0.9675
y = 15.509x + 159.04R2 = 0.9834
y = 19.505x + 115.87R2 = 0.9758
0
100
200
300
400
500
600
700
800
900
1000
0 10 20 30 40 50 60
Distance from End of Beam, in.
Stra
in, i
n./in
. *10
^6
Figure B.102. Pour 4 Strand A Dead End Surface Strains

268
y = 18.057x - 24.072R2 = 0.9886
y = 12.387x - 5.8922R2 = 0.9733
y = 15.367x + 86.485R2 = 0.9836
y = 25.592x + 68.999R2 = 0.9902
0
100
200
300
400
500
600
700
800
900
1000
0 10 20 30 40 50 60
Distance from End of Beam, in.
Stra
in, i
n./in
. *10
^6
Figure B.103. Pour 4 Strand B Live End Surface Strains
y = 16.628x + 17.179R2 = 0.9725
y = 14.305x + 40.271R2 = 0.9945
y = 19.141x + 131.53R2 = 0.9864
y = 21.55x + 99.012R2 = 0.9379
0
100
200
300
400
500
600
700
800
900
1000
0 10 20 30 40 50 60
Distance from End of Beam, in.
Stra
in, i
n./in
. *10
^6
Figure B.104. Pour 4 Strand B Dead End Surface Strains

269
y = 18.118x + 41.547R2 = 0.6561
y = 14.756x - 0.381R2 = 0.9681
y = 22.594x + 35.619R2 = 0.962
y = 26.267x + 105.37R2 = 0.9887
0
100
200
300
400
500
600
700
800
900
1000
0 10 20 30 40 50 60
Distance from End of Beam, in.
Stra
in, i
n./in
. *10
^6
Figure B.105. Pour 4 Strand C Live End Surface Strains
y = 18.046x + 39.429R2 = 0.9918
y = 16.716x + 34.381R2 = 0.9733
y = 27.166x + 68.667R2 = 0.9651
y = 26.242x + 76.112R2 = 0.9929
0
100
200
300
400
500
600
700
800
900
1000
0 10 20 30 40 50 60
Distance from End of Beam, in.
Stra
in, i
n./in
. *10
^6
Figure B.106. Pour 4 Strand C Dead End Surface Strains

270
y = 19.643x + 22.095R2 = 0.9878
y = 14.853x + 11.619R2 = 0.9781
y = 20.254x + 81.363R2 = 0.9794
y = 27.711x + 107.27R2 = 0.99
0
100
200
300
400
500
600
700
800
900
1000
0 10 20 30 40 50 60
Distance from End of Beam, in.
Stra
in, i
n./in
. *10
^6
Figure B.107. Pour 4 Strand D Live End Surface Strains
y = 23.441x - 27.143R2 = 0.9415
y = 14.367x + 85.913R2 = 0.9678
y = 23.568x + 138.26R2 = 0.958
y = 28.303x + 69.143R2 = 0.9874
0
100
200
300
400
500
600
700
800
900
1000
0 10 20 30 40 50 60
Distance from End of Beam, in.
Stra
in, i
n./in
. *10
^6
Figure B.108. Pour 4 Strand D Dead End Surface Strains

271
y = 25.013x - 61.333R2 = 0.9965
y = 19.377x - 61.238R2 = 0.9881
y = 27.321x - 21.3R2 = 0.9866
y = 35.654x - 10.145R2 = 0.9894
0
100
200
300
400
500
600
700
800
900
1000
0 10 20 30 40 50 60
Distance from End of Beam, in.
Stra
in, i
n./in
. *10
^6
Figure B.109. Pour 4 Strand E Live End Surface Strains
y = 20.441x + 29.429R2 = 0.9962
y = 17.978x + 48.343R2 = 0.9817
y = 27.442x + 98.114R2 = 0.935
y = 31.254x + 56R2 = 0.9938
0
100
200
300
400
500
600
700
800
900
1000
0 10 20 30 40 50 60
Distance from End of Beam, in.
Stra
in, i
n./in
. *10
^6
Figure B.110. Pour 4 Strand E Dead End Surface Strains

272
y = 16.647x + 10.501R2 = 0.9794
y = 12.806x + 29.798R2 = 0.9818
y = 20.596x + 93.798R2 = 0.9797
y = 23.995x + 103.09R2 = 0.9771
0
100
200
300
400
500
600
700
800
900
1000
0 10 20 30 40 50 60
Distance from End of Beam, in.
Stra
in, i
n./in
. *10
^6
Figure B.111. Pour 4 Strand F Live End Surface Strains
y = 12.561x + 21.938R2 = 0.9794
y = 17.711x + 34.86R2 = 0.956
y = 23.919x + 129.37R2 = 0.9814
y = 17.238x + 111.87R2 = 0.9937
0
100
200
300
400
500
600
700
800
900
1000
0 10 20 30 40 50 60
Distance from End of Beam, in.
Stra
in, i
n./in
. *10
^6
Figure B.112. Pour 4 Strand F Dead End Surface Strains

273
y = 16.301x - 19.163R2 = 0.981
y = 14.872x - 13.065R2 = 0.9227
y = 18.839x + 56.688R2 = 0.9885
y = 20.996x + 77.616R2 = 0.9805
0
100
200
300
400
500
600
700
800
900
1000
0 10 20 30 40 50 60
Distance from End of Beam, in.
Stra
in, i
n./in
. *10
^6
Figure B.113. Pour 4 Strand G Live End Surface Strains
y = 17.292x - 25.838R2 = 0.9843
y = 17.921x + 47.693R2 = 0.9814
y = 24.691x + 93.788R2 = 0.9654
y = 23.647x + 3.2749R2 = 0.9814
0
100
200
300
400
500
600
700
800
900
1000
0 10 20 30 40 50 60
Distance from End of Beam, in.
Stra
in, i
n./in
. *10
^6
Figure B.114. Pour 4 Strand G Dead End Surface Strains

274
y = 14.11x - 4.9859R2 = 0.9628
y = 11.524x - 17.06R2 = 0.9841
y = 15.945x + 35.726R2 = 0.9929
y = 18.147x + 40.128R2 = 0.9879
0
100
200
300
400
500
600
700
800
900
1000
0 10 20 30 40 50 60
Distance from End of Beam, in.
Stra
in, i
n./in
. *10
^6
Figure B.115. Pour 4 Strand H Live End Surface Strains
y = 17.707x - 23.429R2 = 0.9771
y = 19.933x + 43.619R2 = 0.9464
y = 24.006x + 102.24R2 = 0.9826
y = 26x - 23.743R2 = 0.9809
0
100
200
300
400
500
600
700
800
900
1000
0 10 20 30 40 50 60
Distance from End of Beam, in.
Stra
in, i
n./in
. *10
^6
Figure B.116. Pour 4 Strand H Dead End Surface Strains

275
y = 15.151x - 12.786R2 = 0.9424
y = 16.949x - 74.005R2 = 0.9517
y = 21.263x + 53.288R2 = 0.9849
y = 21.358x + 59.566R2 = 0.9743
0
100
200
300
400
500
600
700
800
900
1000
0 10 20 30 40 50 60
Distance from End of Beam, in.
Stra
in, i
n./in
. *10
^6
Figure B.117. Pour 4 Strand I Live End Surface Strains
y = 11.27x + 25.266R2 = 0.9837
y = 19.118x - 29.5R2 = 0.9835
y = 25.019x + 50.802R2 = 0.9759
y = 16.326x + 112.55R2 = 0.9683
0
100
200
300
400
500
600
700
800
900
1000
0 10 20 30 40 50 60
Distance from End of Beam, in.
Stra
in, i
n./in
. *10
^6
Figure B.118. Pour 4 Strand I Dead End Surface Strains

276
y = 17.401x - 67.464R2 = 0.9606
y = 14.46x - 13.489R2 = 0.984
y = 21.138x + 54.027R2 = 0.992
y = 27.79x + 10.497R2 = 0.9638
0
100
200
300
400
500
600
700
800
900
1000
0 10 20 30 40 50 60
Distance from End of Beam, in.
Stra
in, i
n./in
. *10
^6
Figure B.119. Pour 4 Strand J Live End Surface Strains
y = 16.823x + 67.37R2 = 0.9884
y = 10.086x + 127.88R2 = 0.9047
y = 18.285x + 190.85R2 = 0.9613
y = 29.858x + 144.98R2 = 0.9957
0
100
200
300
400
500
600
700
800
900
1000
0 10 20 30 40 50 60
Distance from End of Beam, in.
Stra
in, i
n./in
. *10
^6
Figure B.120. Pour 4 Strand J Dead End Surface Strains

277
APPENDIX C
Moment versus Deflection and End-slip Plots

278
0
50
100
150
200
250
0.0 0.5 1.0 1.5 2.0 2.5 3.0 3.5 4.0
Deflection (in.)
Mom
ent (
kip-
feet
)
0 0.01 0.02 0.03 0.04 0.05 0.06 0.07 0.08
End Slip (in.)
Moment vs DeflectionMn (AASHTO LRFD)Mn (Strain Compatibility)Moment vs End Slip
Lt = 16.7 in.Le = 78 in.Failure: Flexural
Figure C.1. 1.270.5N.RA
0
50
100
150
200
250
0.0 0.5 1.0 1.5 2.0 2.5 3.0 3.5 4.0
Deflection (in.)
Mom
ent (
kip-
feet
)
0 0.01 0.02 0.03 0.04 0.05 0.06 0.07 0.08
End Slip (in.)
Moment vs DeflectionlMn (AASHTO LRFD)Mn (Strain Compatibility)Moment vs End Slip
Lt = 12.3 in.Le = 66 in.Failure: Flexural
Figure C.1. 1.270.5N.RB
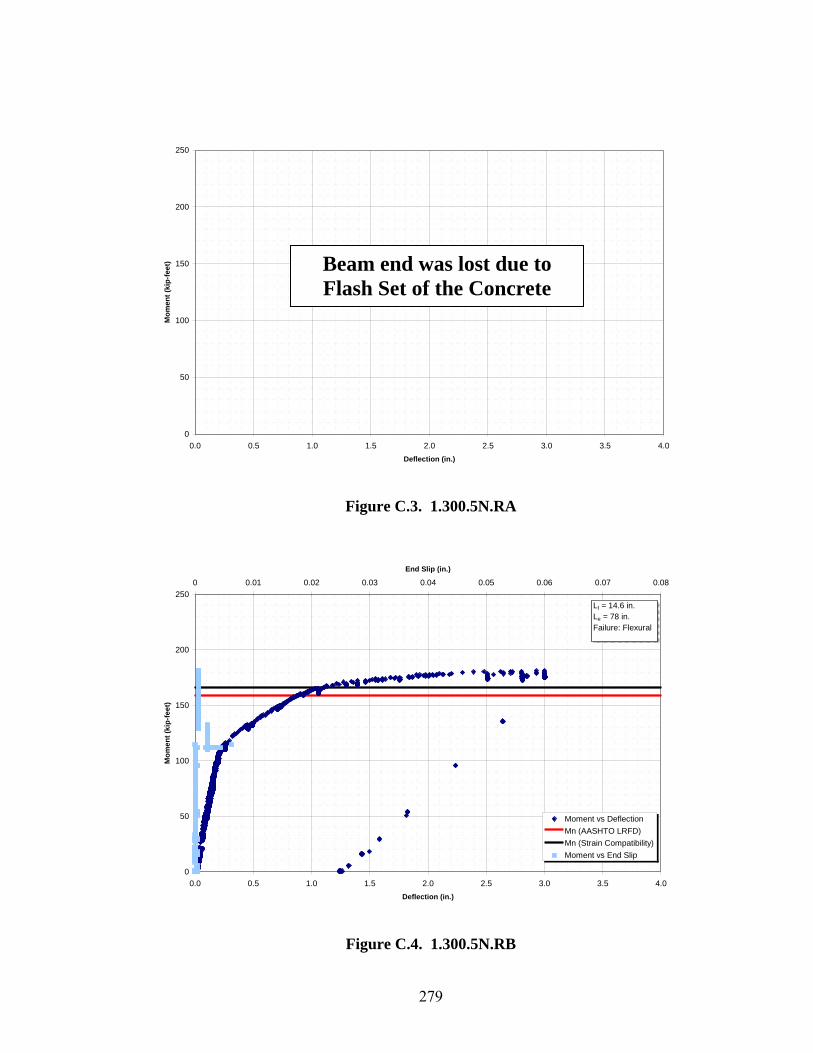
279
0
50
100
150
200
250
0.0 0.5 1.0 1.5 2.0 2.5 3.0 3.5 4.0Deflection (in.)
Mom
ent (
kip-
feet
)
Figure C.3. 1.300.5N.RA
0
50
100
150
200
250
0.0 0.5 1.0 1.5 2.0 2.5 3.0 3.5 4.0Deflection (in.)
Mom
ent (
kip-
feet
)
0 0.01 0.02 0.03 0.04 0.05 0.06 0.07 0.08
End Slip (in.)
Moment vs DeflectionMn (AASHTO LRFD)Mn (Strain Compatibility)Moment vs End Slip
Lt = 14.6 in.Le = 78 in.Failure: Flexural
Figure C.4. 1.300.5N.RB
Beam end was lost due to Flash Set of the Concrete

280
0
50
100
150
200
250
0.0 0.5 1.0 1.5 2.0 2.5 3.0 3.5 4.0
Deflection (in.)
Mom
ent (
kip-
feet
)
0 0.01 0.02 0.03 0.04 0.05 0.06 0.07 0.08
End Slip (in.)
Moment vs DeflectionlMn (AASHTO LRFD)Mn (Strain Compatibility)Moment vs End Slip
Lt = 18.1 in.Le = 66 in.Failure: Flexural
Figure C.5. 2.270.5N.RA
0
50
100
150
200
250
0.0 0.5 1.0 1.5 2.0 2.5 3.0 3.5 4.0
Deflection (in.)
Mom
ent (
kip-
feet
)
0 0.01 0.02 0.03 0.04 0.05 0.06 0.07 0.08
End Slip (in.)
Moment vs DeflectionlMn (AASHTO LRFD)Mn (Strain CompatibilityMoment vs End Slip
Lt = 12.5 in.Le = 60 in.Failure: Flexural
Figure C.6. 2.270.5N.RB
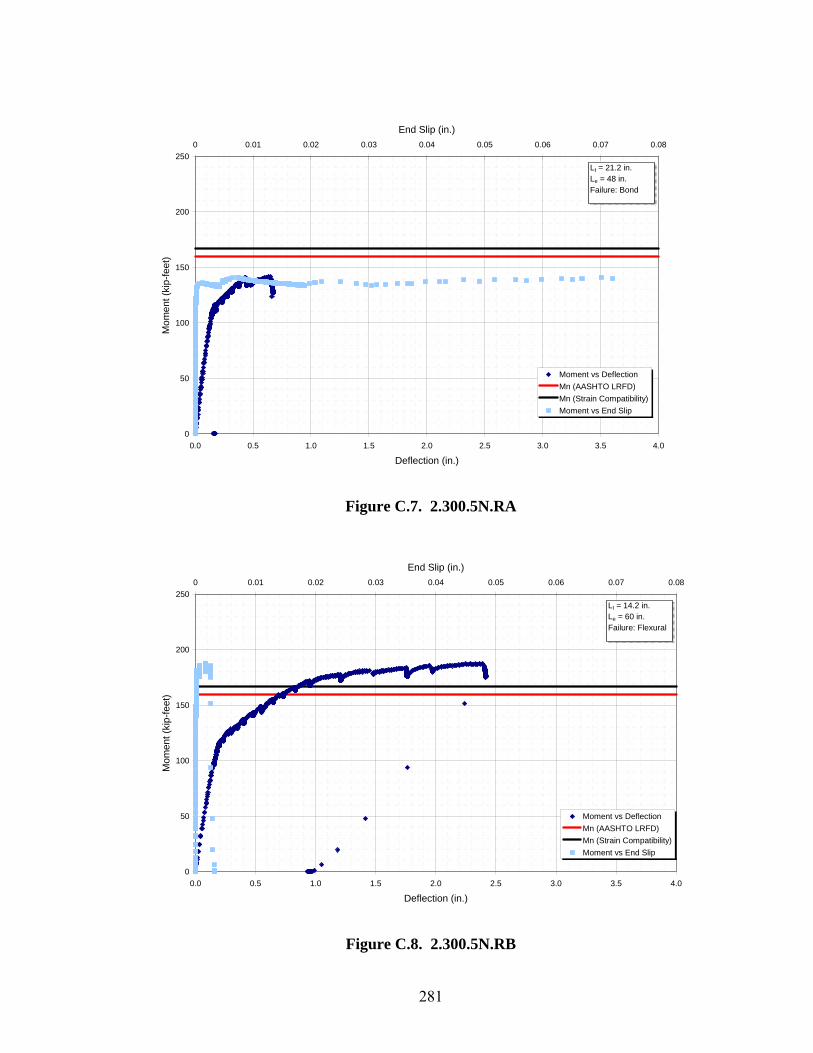
281
0
50
100
150
200
250
0.0 0.5 1.0 1.5 2.0 2.5 3.0 3.5 4.0
Deflection (in.)
Mom
ent (
kip-
feet
)
0 0.01 0.02 0.03 0.04 0.05 0.06 0.07 0.08
End Slip (in.)
Moment vs DeflectionMn (AASHTO LRFD)Mn (Strain Compatibility)Moment vs End Slip
Lt = 21.2 in.Le = 48 in.Failure: Bond
Figure C.7. 2.300.5N.RA
0
50
100
150
200
250
0.0 0.5 1.0 1.5 2.0 2.5 3.0 3.5 4.0
Deflection (in.)
Mom
ent (
kip-
feet
)
0 0.01 0.02 0.03 0.04 0.05 0.06 0.07 0.08
End Slip (in.)
Moment vs DeflectionMn (AASHTO LRFD)Mn (Strain Compatibility)Moment vs End Slip
Lt = 14.2 in.Le = 60 in.Failure: Flexural
Figure C.8. 2.300.5N.RB

282
0
50
100
150
200
250
0.0 0.5 1.0 1.5 2.0 2.5 3.0 3.5 4.0
Deflection (in.)
Mom
ent (
kip-
feet
)
0 0.01 0.02 0.03 0.04 0.05 0.06 0.07 0.08
End Slip (in.)
Moment vs DeflectionlMn (AASHTO LRFD)Mn (Strain CompatibilityMoment vs End Slip
Lt = 30.2 in.Le = 66 in.Failure: Hybrid
Figure C.9. 2.270.5N.UA
0
50
100
150
200
250
0.0 0.5 1.0 1.5 2.0 2.5 3.0 3.5 4.0
Deflection (in.)
Mom
ent (
kip-
feet
)
0 0.01 0.02 0.03 0.04 0.05 0.06 0.07 0.08
End Slip (in.)
Moment vs DeflectionMn (AASHTO LRFD)Mn (Strain Compatibility)Moment vs End Slip
Lt = 24.5 in.Le = 60 in.Failure: Hybrid
Figure C.10. 2.270.5N.UB

283
0
50
100
150
200
250
0.0 0.5 1.0 1.5 2.0 2.5 3.0 3.5 4.0
Deflection (in.)
Mom
ent (
kip-
feet
)
0 0.01 0.02 0.03 0.04 0.05 0.06 0.07 0.08
End Slip (in.)
Moment vs DeflectionMn (AASHTO LRFD)Mn (Strain Compatibility)Moment vs End Slip
Lt = 43.3 in.Le = 78 in.Failure: Hybrid
Figure C.11. 2.300.5N.UA
0
50
100
150
200
250
0.0 0.5 1.0 1.5 2.0 2.5 3.0 3.5 4.0
Deflection (in.)
Mom
ent (
kip-
feet
)
0 0.01 0.02 0.03 0.04 0.05 0.06 0.07 0.08
End Slip (in.)
Moment vs DeflectionMn (AASHTO LRFD)Mn (Strain Compatibility)Moment vs End Slip
Lt = 23.6 in.Le = 60 in.Failure: Hybrid
Figure C.12. 2.300.5N.UB
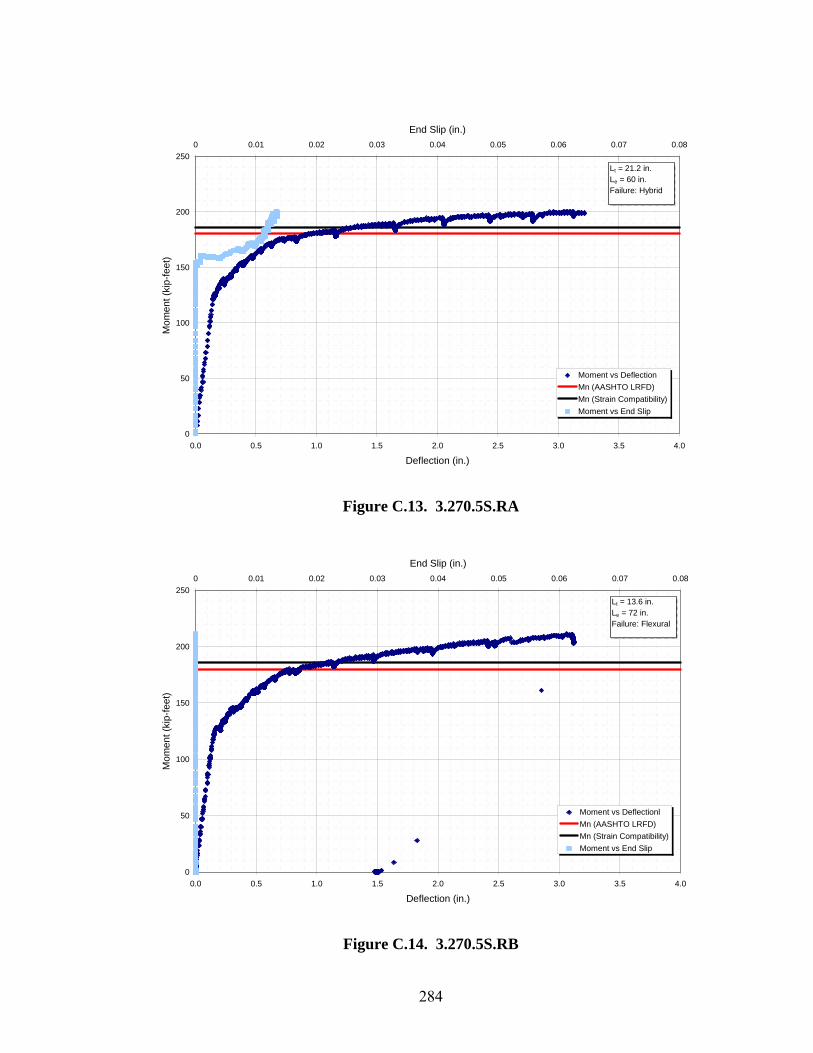
284
0
50
100
150
200
250
0.0 0.5 1.0 1.5 2.0 2.5 3.0 3.5 4.0
Deflection (in.)
Mom
ent (
kip-
feet
)
0 0.01 0.02 0.03 0.04 0.05 0.06 0.07 0.08
End Slip (in.)
Moment vs DeflectionMn (AASHTO LRFD)Mn (Strain Compatibility)Moment vs End Slip
Lt = 21.2 in.Le = 60 in.Failure: Hybrid
Figure C.13. 3.270.5S.RA
0
50
100
150
200
250
0.0 0.5 1.0 1.5 2.0 2.5 3.0 3.5 4.0
Deflection (in.)
Mom
ent (
kip-
feet
)
0 0.01 0.02 0.03 0.04 0.05 0.06 0.07 0.08
End Slip (in.)
Moment vs DeflectionlMn (AASHTO LRFD)Mn (Strain Compatibility)Moment vs End Slip
Lt = 13.6 in.Le = 72 in.Failure: Flexural
Figure C.14. 3.270.5S.RB

285
0
50
100
150
200
250
0.0 0.5 1.0 1.5 2.0 2.5 3.0 3.5 4.0
Deflection (in.)
Mom
ent (
kip-
feet
)
0 0.01 0.02 0.03 0.04 0.05 0.06 0.07 0.08
End Slip (in.)
Moment vs DeflectionMn (AASHTO LRFD)Mn (Strain Compatibility)Moment vs End Slip
Lt = 20.8 in.Le = 60 in.Failure: Hybrid
Figure C.15. 3.300.5S.RA
0
50
100
150
200
250
0.0 0.5 1.0 1.5 2.0 2.5 3.0 3.5 4.0
Deflection (in.)
Mom
ent (
kip-
feet
)
0 0.01 0.02 0.03 0.04 0.05 0.06 0.07 0.08
End Slip (in.)
Moment vs DeflectionMn (AASHTO LRFD)Mn (Strain Compatibility)Moment vs End Slip
Lt = 13.5 in.Le = 72 in.Failure: Flexural
Figure C.16. 3.300.5S.RB

286
0
50
100
150
200
250
0.0 0.5 1.0 1.5 2.0 2.5 3.0 3.5 4.0
Deflection (in.)
Mom
ent (
kip-
feet
)
0 0.01 0.02 0.03 0.04 0.05 0.06 0.07 0.08
End Slip (in.)
Moment vs DeflectionMn (AASHTO LRFD)Mn (Strain Compatibility)Moment vs End Slip
Lt = 25.6 in.Le = 60 in.Failure: Bond
Figure C.17. 3.270.5S.UA
0
50
100
150
200
250
0.0 0.5 1.0 1.5 2.0 2.5 3.0 3.5 4.0
Deflection (in.)
Mom
ent (
kip-
feet
)
0 0.01 0.02 0.03 0.04 0.05 0.06 0.07 0.08
End Slip (in.)
Moment vs DeflectionMn (AASHTO LRFD)Mn (Strain Compatibility)Moment vs End Slip
Lt = 19.8 in.Le = 72 in.Failure: Flexural
Figure C.18. 3.270.5S.UB

287
0
50
100
150
200
250
0.0 0.5 1.0 1.5 2.0 2.5 3.0 3.5 4.0
Deflection (in.)
Mom
ent (
kip-
feet
)
0 0.01 0.02 0.03 0.04 0.05 0.06 0.07 0.08
End Slip (in.)
Moment vs DeflectionMn (AASHTO LRFD)Mn (Strain Compatibility)Moment vs End Slip
Note: A bond failure occurred in the this beam while at the cracking load. The strand could have slipped during the additional loading explaining why there is a sudden jump in the deflection. This sudden failure may also be attributed to the extremly small (Le - Lt).
Lt = 41.1 in.Le = 60 in.Failure: Bond
Figure C.19. 3.300.5S.UA
0
50
100
150
200
250
0.0 0.5 1.0 1.5 2.0 2.5 3.0 3.5 4.0
Deflection (in.)
Mom
ent (
in.)
0 0.01 0.02 0.03 0.04 0.05 0.06 0.07 0.08
End Slip (in.)
Moment vs DeflectionMn (AASHTO LRFD)Mn (Strain Compatibility)Moment vs End Slip
Lt = 21.1 in.Le = 72 in.Failure: Flexural
Figure C.20. 3.300.5S.UB

288
0
50
100
150
200
250
0.0 0.5 1.0 1.5 2.0 2.5 3.0 3.5 4.0
Deflection (in.)
Mom
ent (
kip-
feet
)
0 0.01 0.02 0.03 0.04 0.05 0.06 0.07 0.08
End Slip (in.)
Moment vs DeflectionMn (AASHTO LRFD)Mn (Strain Compatibility)Moment vs End Slip
Lt = 17.5 in.Le = 54 in.Failure: Bond
Figure C.21. 4.270.5S.RA
0
50
100
150
200
250
0.0 0.5 1.0 1.5 2.0 2.5 3.0 3.5 4.0
Deflection (in.)
Mom
ent (
kip-
feet
)
0 0.01 0.02 0.03 0.04 0.05 0.06 0.07 0.08
End Slip (in.)
Moment vs DeflectionMn (AAHSTO LRFD)Mn (Strain Compatibility)Moment vs End Slip
Lt = 15.5 in.Le = 66 in.Failure: Flexural
Figure C.22. 4.270.5S.RB

289
0
50
100
150
200
250
0.0 0.5 1.0 1.5 2.0 2.5 3.0 3.5 4.0
Deflection (in.)
Mom
ent (
kip-
feet
)
0 0.01 0.02 0.03 0.04 0.05 0.06 0.07 0.08
End Slip (in.)
Moment vs DeflectionMn (AASHTO LRFD)Mn (Strain Compatibility)Moment vs End Slip
Lt = 18.4 in.Le = 66 in.Failure: Bond
Figure C.23. 4.300.5S.RA
0
50
100
150
200
250
0.0 0.5 1.0 1.5 2.0 2.5 3.0 3.5 4.0
Deflection (in.)
Mom
ent (
kip-
feet
)
0 0.01 0.02 0.03 0.04 0.05 0.06 0.07 0.08
End Slip (in.)
Moment vs DeflectionMn (AASHTO LRFD)Mn (Strain Compatibility)Moment vs End Slip
Lt = 14.1 in.Le = 78 in.Failure: Flexural
Figure C.24. 4.300.5S.RB
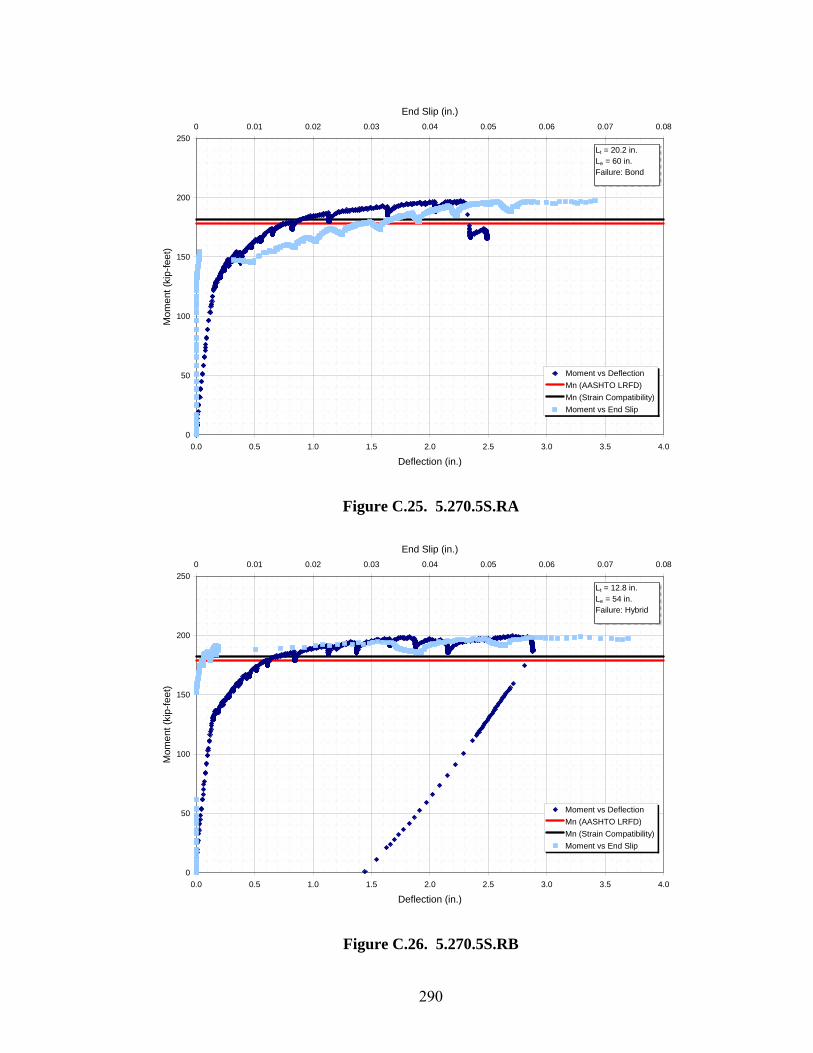
290
0
50
100
150
200
250
0.0 0.5 1.0 1.5 2.0 2.5 3.0 3.5 4.0
Deflection (in.)
Mom
ent (
kip-
feet
)
0 0.01 0.02 0.03 0.04 0.05 0.06 0.07 0.08
End Slip (in.)
Moment vs DeflectionMn (AASHTO LRFD)Mn (Strain Compatibility)Moment vs End Slip
Lt = 20.2 in.Le = 60 in.Failure: Bond
Figure C.25. 5.270.5S.RA
0
50
100
150
200
250
0.0 0.5 1.0 1.5 2.0 2.5 3.0 3.5 4.0
Deflection (in.)
Mom
ent (
kip-
feet
)
0 0.01 0.02 0.03 0.04 0.05 0.06 0.07 0.08
End Slip (in.)
Moment vs DeflectionMn (AASHTO LRFD)Mn (Strain Compatibility)Moment vs End Slip
Lt = 12.8 in.Le = 54 in.Failure: Hybrid
Figure C.26. 5.270.5S.RB
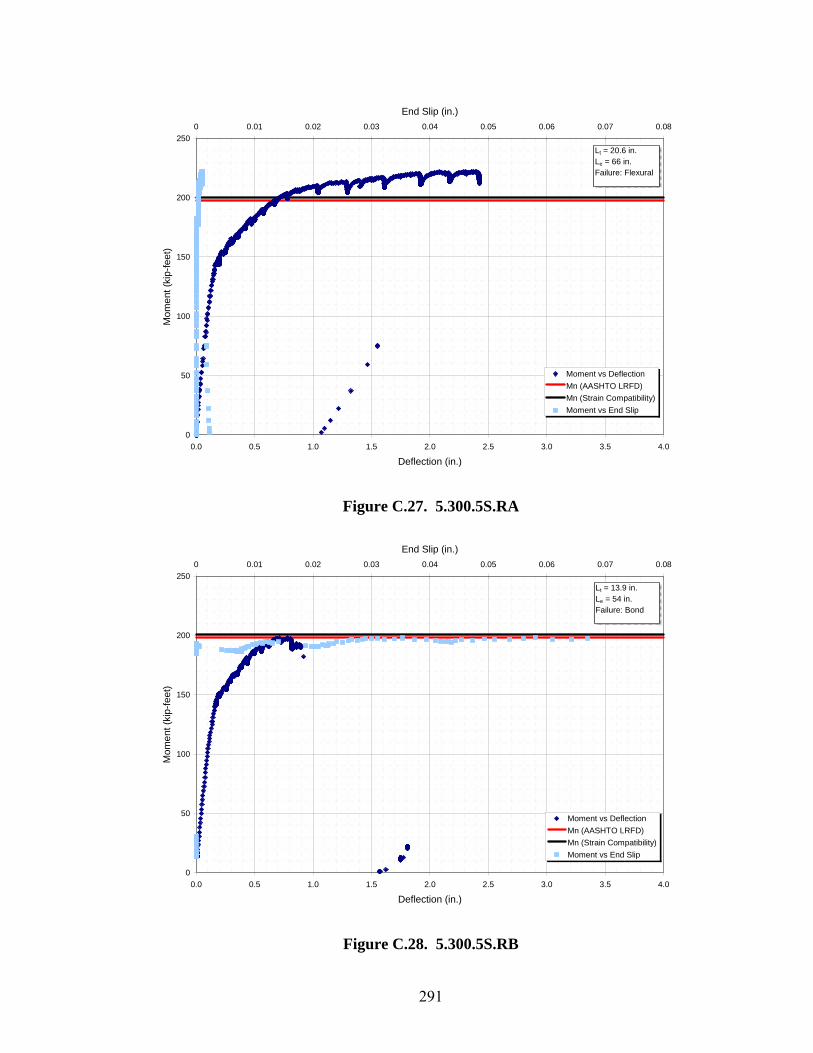
291
0
50
100
150
200
250
0.0 0.5 1.0 1.5 2.0 2.5 3.0 3.5 4.0
Deflection (in.)
Mom
ent (
kip-
feet
)
0 0.01 0.02 0.03 0.04 0.05 0.06 0.07 0.08
End Slip (in.)
Moment vs DeflectionMn (AASHTO LRFD)Mn (Strain Compatibility)Moment vs End Slip
Lt = 20.6 in.Le = 66 in.Failure: Flexural
Figure C.27. 5.300.5S.RA
0
50
100
150
200
250
0.0 0.5 1.0 1.5 2.0 2.5 3.0 3.5 4.0
Deflection (in.)
Mom
ent (
kip-
feet
)
0 0.01 0.02 0.03 0.04 0.05 0.06 0.07 0.08
End Slip (in.)
Moment vs DeflectionMn (AASHTO LRFD)Mn (Strain Compatibility)Moment vs End Slip
Lt = 13.9 in.Le = 54 in.Failure: Bond
Figure C.28. 5.300.5S.RB

292
0
50
100
150
200
250
0.0 0.5 1.0 1.5 2.0 2.5 3.0 3.5 4.0
Deflection (in.)
Mom
ent (
kip-
feet
)
0 0.01 0.02 0.03 0.04 0.05 0.06 0.07 0.08
End Slip (in.)
Moment vs DeflectionMn (AASHTO LRFD)Mn (Strain Compatibility)Moment vs End Slip
Lt = 26.3 in.Le = 66 in.Failure: Bond
Figure C.29. 5.270.5S.UA
0
50
100
150
200
250
0.0 0.5 1.0 1.5 2.0 2.5 3.0 3.5 4.0
Deflection (in.)
Mom
ent (
kip-
feet
)
0 0.01 0.02 0.03 0.04 0.05 0.06 0.07 0.08
End Slip (in.)
Moment vs DeflectionMn (AASHTO LRFD)Mn (Strain Compatibility)Moment vs End Slip
Lt = 19.9 in.Le = 66 in.Failure: Flexural
Figure C.30. 5.270.5S.UB
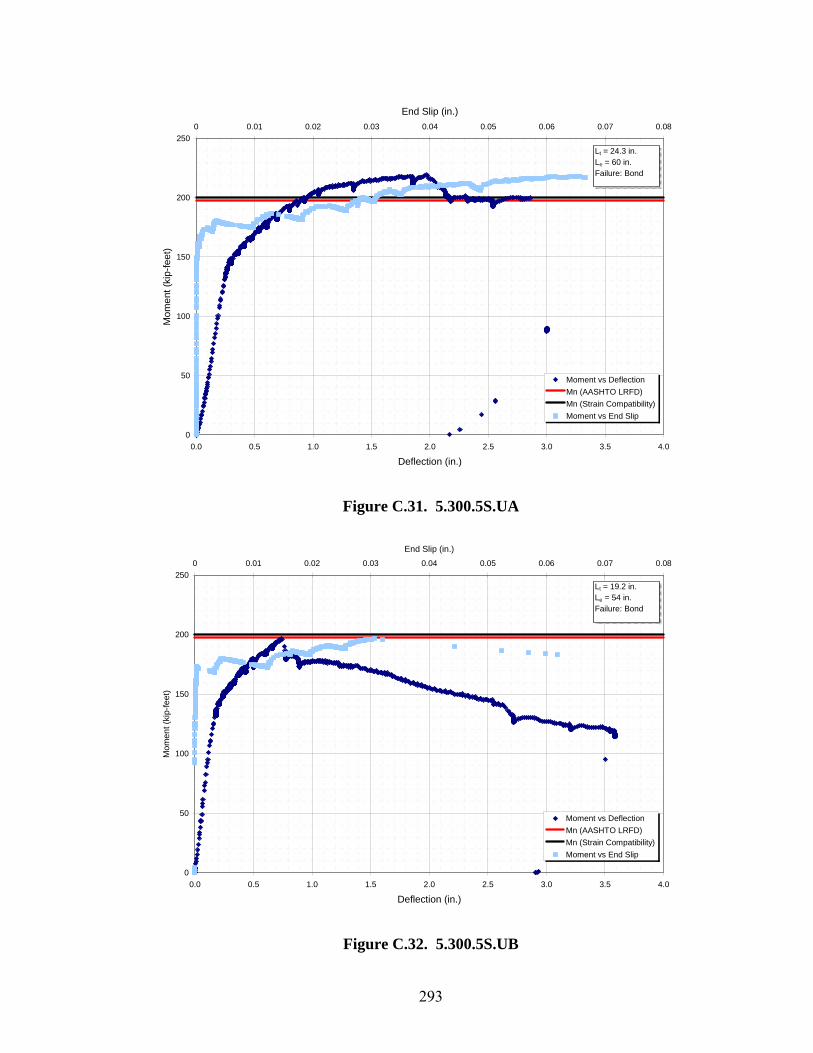
293
0
50
100
150
200
250
0.0 0.5 1.0 1.5 2.0 2.5 3.0 3.5 4.0
Deflection (in.)
Mom
ent (
kip-
feet
)
0 0.01 0.02 0.03 0.04 0.05 0.06 0.07 0.08
End Slip (in.)
Moment vs DeflectionMn (AASHTO LRFD)Mn (Strain Compatibility)Moment vs End Slip
Lt = 24.3 in.Le = 60 in.Failure: Bond
Figure C.31. 5.300.5S.UA
0
50
100
150
200
250
0.0 0.5 1.0 1.5 2.0 2.5 3.0 3.5 4.0
Deflection (in.)
Mom
ent (
kip-
feet
)
0 0.01 0.02 0.03 0.04 0.05 0.06 0.07 0.08
End Slip (in.)
Moment vs DeflectionMn (AASHTO LRFD)Mn (Strain Compatibility)Moment vs End Slip
Lt = 19.2 in.Le = 54 in.Failure: Bond
Figure C.32. 5.300.5S.UB
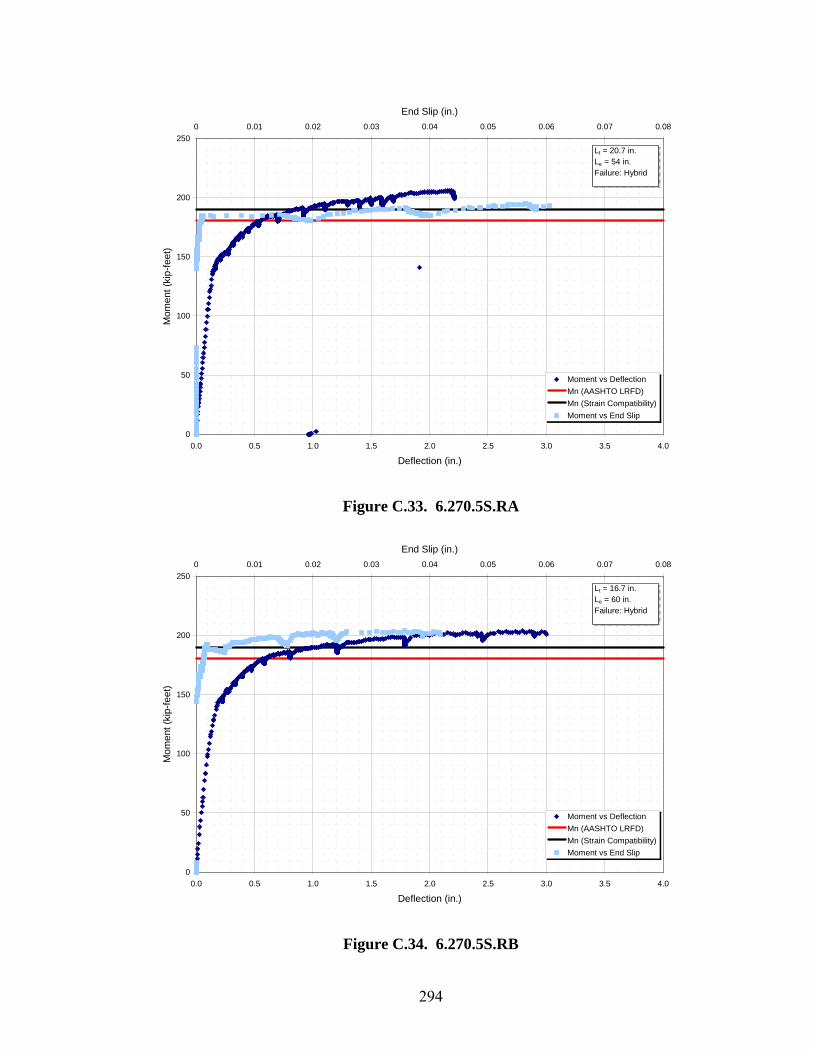
294
0
50
100
150
200
250
0.0 0.5 1.0 1.5 2.0 2.5 3.0 3.5 4.0
Deflection (in.)
Mom
ent (
kip-
feet
)
0 0.01 0.02 0.03 0.04 0.05 0.06 0.07 0.08
End Slip (in.)
Moment vs DeflectionMn (AASHTO LRFD)Mn (Strain Compatibility)Moment vs End Slip
Lt = 20.7 in.Le = 54 in.Failure: Hybrid
Figure C.33. 6.270.5S.RA
0
50
100
150
200
250
0.0 0.5 1.0 1.5 2.0 2.5 3.0 3.5 4.0
Deflection (in.)
Mom
ent (
kip-
feet
)
0 0.01 0.02 0.03 0.04 0.05 0.06 0.07 0.08
End Slip (in.)
Moment vs DeflectionMn (AASHTO LRFD)Mn (Strain Compatibility)Moment vs End Slip
Lt = 16.7 in.Le = 60 in.Failure: Hybrid
Figure C.34. 6.270.5S.RB

295
0
50
100
150
200
250
300
350
400
0.0 0.5 1.0 1.5 2.0 2.5 3.0 3.5 4.0
Deflection (in.)
Mom
ent (
kip-
feet
)
0 0.01 0.02 0.03 0.04 0.05 0.06 0.07 0.08
End Slip (in.)
Moment vs DeflectionMn (AASHTO LRFD)Mn (Strain Compatibility)Moment vs End Slip
Lt = 19.3 in.Le = 66 in.Failure: Flexural
Figure C.35. 6.270.6N.RA
0
50
100
150
200
250
300
350
400
0.0 0.5 1.0 1.5 2.0 2.5 3.0 3.5 4.0
Deflection (in.)
Mom
ent (
kip-
feet
)
0 0.01 0.02 0.03 0.04 0.05 0.06 0.07 0.08
End Slip (in.)
Moment vs DeflectionMn (AASHTO LRFD)Mn (Strain Compatibility)Moment vs End Slip
Lt = 10.7 in.Le = 66 in.Failure: Flexural
Figure C.36. 6.270.6N.RB

296
0
50
100
150
200
250
0.0 0.5 1.0 1.5 2.0 2.5 3.0 3.5 4.0
Deflection (in.)
Mom
ent (
kip-
feet
)
0 0.01 0.02 0.03 0.04 0.05 0.06 0.07 0.08
End Slip (in.)
Moment vs DeflectionMn (AASHTO LRFD)Mn (Strain Compatibility)Moment vs End Slip
Lt = 21.3 in.Le = 72 in.Failure: Hyrbid
Figure C.37. 6.270.5S.UA
0
50
100
150
200
250
0.0 0.5 1.0 1.5 2.0 2.5 3.0 3.5 4.0
Deflection (in.)
Mom
ent (
kip-
feet
)
0 0.01 0.02 0.03 0.04 0.05 0.06 0.07 0.08
End Slip (in.)
Moment vs DeflectionMn (AASHTO LRFD)Mn (Strain Compatibility)Moment vs End Slip
Lt = 17.8 in.Le = 54 in.Failure: Bond
Figure C.38. 6.270.5S.UB
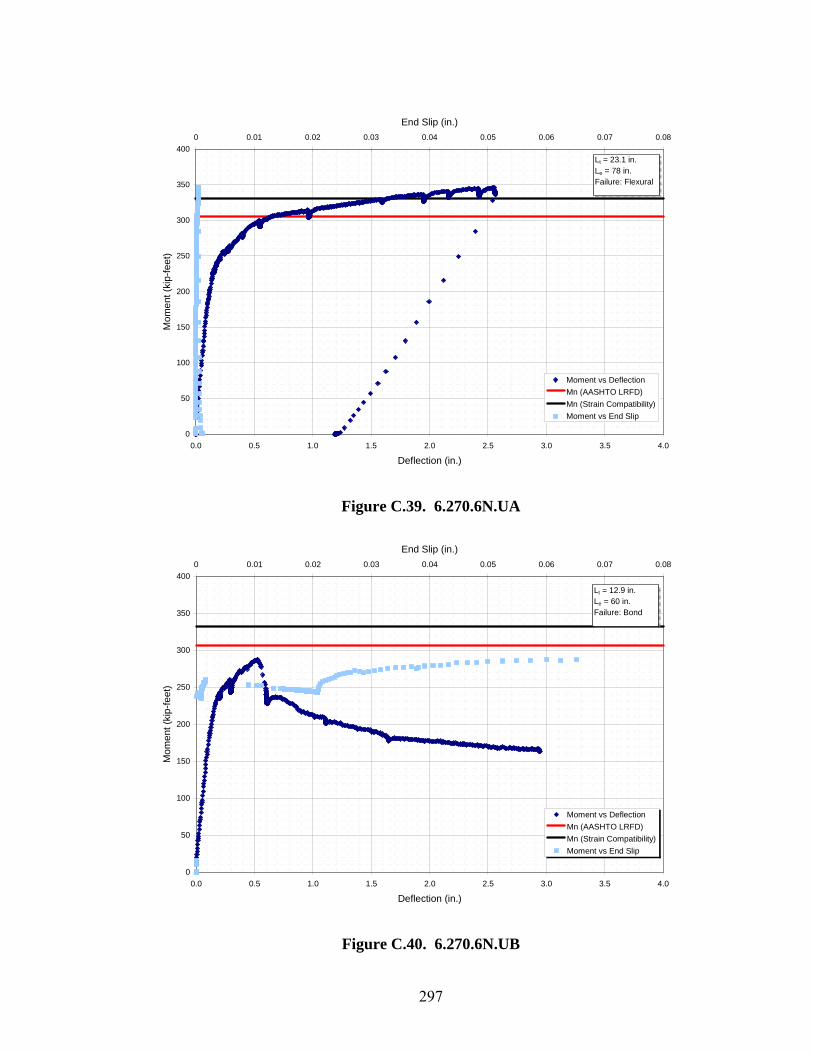
297
0
50
100
150
200
250
300
350
400
0.0 0.5 1.0 1.5 2.0 2.5 3.0 3.5 4.0
Deflection (in.)
Mom
ent (
kip-
feet
)
0 0.01 0.02 0.03 0.04 0.05 0.06 0.07 0.08
End Slip (in.)
Moment vs DeflectionMn (AASHTO LRFD)Mn (Strain Compatibility)Moment vs End Slip
Lt = 23.1 in.Le = 78 in.Failure: Flexural
Figure C.39. 6.270.6N.UA
0
50
100
150
200
250
300
350
400
0.0 0.5 1.0 1.5 2.0 2.5 3.0 3.5 4.0
Deflection (in.)
Mom
ent (
kip-
feet
)
0 0.01 0.02 0.03 0.04 0.05 0.06 0.07 0.08
End Slip (in.)
Moment vs DeflectionMn (AASHTO LRFD)Mn (Strain Compatibility)Moment vs End Slip
Lt = 12.9 in.Le = 60 in.Failure: Bond
Figure C.40. 6.270.6N.UB

298
APPENDIX D
Additional Tables

299
Table D.1. Influence of Time (TSB-Pour 11)
fsj fsi fse f'ci f'cStrand ksi ksi ksi psi psi Initial Last L/I
A 202.50 188.72 178.00 4800 5900 21.15 22.81 1.08B 202.50 188.72 178.00 4800 5900 19.63 20.22 1.03C 202.50 188.72 178.00 4800 5900 18.30 19.71 1.08D 202.50 188.72 178.00 4800 5900 18.97 19.63 1.03E 202.50 188.72 178.00 4800 5900 18.77 20.38 1.09F 202.50 188.42 177.50 4800 5900 28.89 32.10 1.11G 202.50 188.42 177.50 4800 5900 25.73 30.24 1.18H 202.50 188.42 177.50 4800 5900 25.43 27.09 1.07I 202.50 186.65 174.64 4800 5900 23.74 24.05 1.01J 202.50 186.65 174.64 4800 5900 25.36 28.13 1.11A 202.50 188.72 178.00 4800 5900 17.81 21.69 1.22B 202.50 188.72 178.00 4800 5900 16.32 17.57 1.08C 202.50 188.72 178.00 4800 5900 17.66 17.92 1.01D 202.50 188.72 178.00 4800 5900 16.37 16.91 1.03E 202.50 188.72 178.00 4800 5900 15.84 17.47 1.10F 202.50 188.42 177.50 4800 5900 46.76 47.87 1.02G 202.50 188.42 177.50 4800 5900 30.24 32.45 1.07H 202.50 188.42 177.50 4800 5900 24.70 25.39 1.03I 202.50 186.65 174.64 4800 5900 30.83 32.55 1.06J 202.50 186.65 174.64 4800 5900 24.19 24.29 1.00
Dea
dTransfer Length (in.)
Live
Table D.2. Influence of Time (TSB-Pour 2)
fsj fsi fse f'ci f'cStrand ksi ksi ksi psi psi Initial Last L/I
A 202.50 189.57 179.91 5700 6600 19.35 21.15 1.09B 202.50 189.57 179.91 5700 6600 19.63 21.01 1.07C 202.50 189.57 179.91 5700 6600 18.27 18.71 1.02D 202.50 189.57 179.91 5700 6600 15.02 16.17 1.08E 202.50 189.57 179.91 5700 6600 16.06 16.06 1.00F 202.50 189.30 179.45 5700 6600 23.41 26.51 1.13G 202.50 189.30 179.45 5700 6600 21.69 25.93 1.20H 202.50 189.30 179.45 5700 6600 22.39 24.82 1.11I 202.50 187.66 176.81 5700 6600 21.45 22.01 1.03J 202.50 187.66 176.81 5700 6600 19.19 20.77 1.08A 202.50 189.57 179.91 5700 6600 15.89 15.70 0.99B 202.50 189.57 179.91 5700 6600 15.53 16.10 1.04C 202.50 189.57 179.91 5700 6600 16.13 15.71 0.97D 202.50 189.57 179.91 5700 6600 14.50 14.92 1.03E 202.50 189.57 179.91 5700 6600 14.51 15.74 1.08F 202.50 189.30 179.45 5700 6600 20.35 23.82 1.17G 202.50 189.30 179.45 5700 6600 18.92 22.49 1.19H 202.50 189.30 179.45 5700 6600 14.26 15.07 1.06I 202.50 187.66 176.81 5700 6600 19.59 21.02 1.07J 202.50 187.66 176.81 5700 6600 16.31 20.53 1.26
Transfer Length (in.)
Live
Dea
d

300
Table D.3. Influence of Time (TSB-Pour 3)
fsj fsi fse f'ci f'cStrand ksi ksi ksi psi psi Initial Last L/I
A 202.50 189.04 179.43 6100 7000 22.55 23.71 1.05B 202.50 189.04 179.43 6100 7000 23.50 23.48 1.00C 202.50 189.04 179.43 6100 7000 19.04 18.96 1.00D 202.50 189.04 179.43 6100 7000 18.51 18.97 1.02E 202.50 189.04 179.43 6100 7000 17.55 17.68 1.01F 202.50 188.75 178.95 6100 7000 21.26 25.97 1.22G 202.50 188.75 178.95 6100 7000 23.98 26.00 1.08H 202.50 188.75 178.95 6100 7000 22.62 23.93 1.06I 202.50 187.03 176.23 6100 7000 25.15 26.82 1.07J 202.50 187.03 176.23 6100 7000 25.41 27.00 1.06A 202.50 189.04 179.43 6100 7000 21.12 23.20 1.10B 202.50 189.04 179.43 6100 7000 17.30 18.63 1.08C 202.50 189.04 179.43 6100 7000 16.72 17.37 1.04D 202.50 189.04 179.43 6100 7000 16.38 16.74 1.02E 202.50 189.04 179.43 6100 7000 16.18 17.04 1.05F 202.50 188.75 178.95 6100 7000 34.22 36.72 1.07G 202.50 188.75 178.95 6100 7000 23.95 26.51 1.11H 202.50 188.75 178.95 6100 7000 17.39 20.67 1.19I 202.50 187.03 176.23 6100 7000 21.80 24.61 1.13J 202.50 187.03 176.23 6100 7000 24.41 26.53 1.09
Transfer Length (in.)
Live
Dea
d
Table D.4. Influence of Time (TSB-Pour 4)
fsj fsi fse f'ci f'cStrand ksi ksi ksi psi psi Initial Last L/I
A 202.50 188.00 177.20 5000 6100 29.34 32.14 1.10B 202.50 188.00 177.20 5000 6100 23.17 27.07 1.17C 202.50 188.00 177.20 5000 6100 20.71 22.69 1.10D 202.50 188.00 177.20 5000 6100 20.01 21.90 1.09E 202.50 188.00 177.20 5000 6100 18.84 19.79 1.05F 202.50 187.68 176.67 5000 6100 25.03 27.64 1.10G 202.50 187.68 176.67 5000 6100 25.52 30.32 1.19H 202.50 187.68 176.67 5000 6100 30.52 33.25 1.09I 202.50 185.80 173.69 5000 6100 28.71 33.35 1.16J 202.50 185.80 173.69 5000 6100 29.72 29.44 0.99A 202.50 188.00 177.20 5000 6100 30.93 31.83 1.03B 202.50 188.00 177.20 5000 6100 21.38 25.78 1.21C 202.50 188.00 177.20 5000 6100 19.03 20.79 1.09D 202.50 188.00 177.20 5000 6100 17.25 18.60 1.08E 202.50 188.00 177.20 5000 6100 16.51 16.47 1.00F 202.50 187.68 176.67 5000 6100 25.70 31.10 1.21G 202.50 187.68 176.67 5000 6100 21.32 24.98 1.17H 202.50 187.68 176.67 5000 6100 19.11 22.70 1.19I 202.50 185.80 173.69 5000 6100 30.84 34.64 1.12J 202.50 185.80 173.69 5000 6100 25.47 25.46 1.00
Transfer Length (in.)
Live
Dea
d

301
Table D.5. Development Length/Flexural Test Results
Specimen fse fps fps - fse f'c Failure Type Curvature MAASHTO MACTUAL MACTUAL/MAASHTO
1.270.5N.RA 156 264 107 6500 Flexural 0.00376 144 171 1.192.270.5N.RA 162 264 101 6400 Flexural 0.00373 144 181 1.263.270.5S.RA 159 265 106 8200 Hybrid 0.00410 180 201 1.114.270.5S.RA 159 264 105 6300 Bond 0.00357 179 176 0.985.270.5S.RA 162 264 101 6500 Bond 0.00364 179 197 1.106.270.5S.RA 174 265 90 8300 Hybrid 0.00408 181 206 1.141.300.5N.RA 176 292 116 6500 NA 0.00000 NA NA NA2.300.5N.RA 180 292 112 6400 Bond 0.00351 160 142 0.893.300.5S.RA 176 293 117 8200 Hybrid 0.00388 200 226 1.134.300.5S.RA 176 292 116 6300 Bond* 0.00335 197 208 1.055.300.5S.RA 181 292 111 6500 Flexural 0.00340 198 222 1.136.270.6N.RA 173 266 93 8300 Flexural 0.00386 306 340 1.111.270.5N.RB 158 264 106 6500 Flexural 0.00376 144 165 1.152.270.5N.RB 162 264 101 6400 Flexural 0.00373 144 138 0.963.270.5S.RB 159 265 106 8200 Flexural 0.00410 180 211 1.174.270.5S.RB 157 264 107 6300 Flexural 0.00357 178 206 1.165.270.5S.RB 162 264 101 6500 Hybrid 0.00364 179 200 1.126.270.5S.RB 174 265 90 8300 Hybrid 0.00408 180 204 1.131.300.5N.RB 176 292 116 6500 Flexural 0.00354 159 181 1.142.300.5N.RB 180 292 112 6400 Flexural 0.00351 159 188 1.183.300.5S.RB 176 293 117 8200 Flexural 0.00388 200 230 1.154.300.5S.RB 175 292 117 6300 Flexural 0.00335 197 237 1.205.300.5S.RB 181 292 111 6500 Bond 0.00340 198 198 1.006.270.6N.RB 173 266 93 8300 Flexural 0.00386 306 351 1.152.270.5N.UA 162 264 102 6400 Hybrid 0.00373 144 181 1.263.270.5S.UA 158 265 107 8200 Bond 0.00410 180 182 1.015.270.5S.UA 162 264 101 6500 Bond 0.00364 179 189 1.066.270.5S.UA 174 265 91 8300 Hybrid 0.00408 180 205 1.142.300.5N.UA 180 292 113 6400 Bond 0.00351 159 190 1.203.300.5S.UA 175 293 118 8200 Bond 0.00388 200 153 0.765.300.5S.UA 181 292 111 6500 Bond 0.00340 198 219 1.116.270.6N.UA 173 266 93 8300 Flexural 0.00386 306 346 1.132.270.5N.UB 162 264 102 6400 Hybrid 0.00373 144 167 1.163.270.5S.UB 158 265 107 8200 Flexural 0.00410 180 203 1.135.270.5S.UB 162 264 102 6500 Flexural 0.00364 179 202 1.136.270.5S.UB 174 265 91 8300 Bond 0.00408 181 185 1.032.300.5N.UB 179 292 113 6400 Hybrid 0.00351 159 193 1.213.300.5S.UB 175 293 118 8200 Flexural 0.00388 200 225 1.135.300.5S.UB 181 292 112 6500 Bond 0.00340 198 197 1.006.270.6N.UB 172 266 93 8300 Bond 0.00386 306 287 0.94
Nor
mal
Live
Dea
d
Inve
rted
Live
Dea
d

302
APPENDIX E
Additional Figures

303
0
0.2
0.4
0.6
0.8
1
1.2
1.4
1.6
A B C D E F G H I J A B C D E F G H I J
Beam Designation
Tran
sfer
Len
gth
(stra
nd d
iam
eter
s)Live End
Dead End
Pour 1 Pour 2
Figure E.1. Influence of Time (TSB-Pours 1 and 2)
0
0.2
0.4
0.6
0.8
1
1.2
1.4
1.6
A B C D E F G H I J A B C D E F G H I J
Beam Designation
Tran
sfer
Len
gth
(stra
nd d
iam
eter
s)
Live End
Dead End
Pour 3 Pour 4
Figure E.2. Influence of Time (TSB-Pours 3 and 4)

304
APPENDIX F
Bond Model Input Files

305
$$===================================================================== $$ 4x4 Control Block with a jacking stress of 0.75fpu $$===================================================================== STRUDL ' ' UNITS INCH KIPS DEG FAH $$===================================================================== $$ SPECIFY JOINT COORDINATES $$===================================================================== JOINT COORDINATES GLOBAL GENERATE 73 JOINTS ID 'A1',1 X 0. - DIFF 0 72 AT 1. Y 0. Z 0. GENERATE 73 JOINTS ID 'B1',1 X 0. - DIFF 0 72 AT 1. Y 1. Z 0. GENERATE 73 JOINTS ID 'C1',1 X 0. - DIFF 0 72 AT 1. Y 2. Z 0. GENERATE 73 JOINTS ID 'D1',1 X 0. - DIFF 0 72 AT 1. Y 3. Z 0. GENERATE 73 JOINTS ID 'E1',1 X 0. - DIFF 0 72 AT 1. Y 4. Z 0. GENERATE 74 JOINTS ID 'Cd0',1 X 0. - DIFF -1 73 AT 1. Y 2. Z 0. $$===================================================================== $$ SPECIFY SUPPORT CONDITIONS $$===================================================================== STATUS SUPPORT - 'A73' 'B73' 'C73' 'D73' 'E73' - 'Cd0' TO 'Cd73' JOINT RELEASES 'A73' 'B73' 'D73' 'E73' FOR Y Z MOM X Y Z 'Cd0' TO 'Cd72' FOR X Z MOM X Y Z $$===================================================================== $$ SPECIFY STRAND PROPERTIES $$===================================================================== TYPE PLANE TRUSS GENERATE 73 MEMBERS ID 'STRND-0',1 FROM 'Cd0', 1 TO 'Cd1' MEMBER PROPERTIES PRISMATIC AX 0.153 'STRND-0' TO 'STRND-72' $$===================================================================== $$ SPECIFY BOND ELEMENT PROPERTIES $$=====================================================================

306
ELEMENT INC 'BOND-1' 'Cd1' 'C1' 'BOND-2' 'Cd2' 'C2' 'BOND-3' 'Cd3' 'C3' 'BOND-4' 'Cd4' 'C4' 'BOND-5' 'Cd5' 'C5' 'BOND-6' 'Cd6' 'C6' 'BOND-7' 'Cd7' 'C7' 'BOND-8' 'Cd8' 'C8' 'BOND-9' 'Cd9' 'C9' 'BOND-10' 'Cd10' 'C10' 'BOND-11' 'Cd11' 'C11' 'BOND-12' 'Cd12' 'C12' 'BOND-13' 'Cd13' 'C13' 'BOND-14' 'Cd14' 'C14' 'BOND-15' 'Cd15' 'C15' 'BOND-16' 'Cd16' 'C16' 'BOND-17' 'Cd17' 'C17' 'BOND-18' 'Cd18' 'C18' 'BOND-19' 'Cd19' 'C19' 'BOND-20' 'Cd20' 'C20' 'BOND-21' 'Cd21' 'C21' 'BOND-22' 'Cd22' 'C22' 'BOND-23' 'Cd23' 'C23' 'BOND-24' 'Cd24' 'C24' 'BOND-25' 'Cd25' 'C25' 'BOND-26' 'Cd26' 'C26' 'BOND-27' 'Cd27' 'C27' 'BOND-28' 'Cd28' 'C28' 'BOND-29' 'Cd29' 'C29' 'BOND-30' 'Cd30' 'C30' 'BOND-31' 'Cd31' 'C31' 'BOND-32' 'Cd32' 'C32' 'BOND-33' 'Cd33' 'C33' 'BOND-34' 'Cd34' 'C34' 'BOND-35' 'Cd35' 'C35' 'BOND-36' 'Cd36' 'C36' 'BOND-37' 'Cd37' 'C37' 'BOND-38' 'Cd38' 'C38' 'BOND-39' 'Cd39' 'C39' 'BOND-40' 'Cd40' 'C40' 'BOND-41' 'Cd41' 'C41' 'BOND-42' 'Cd42' 'C42' 'BOND-43' 'Cd43' 'C43' 'BOND-44' 'Cd44' 'C44' 'BOND-45' 'Cd45' 'C45' 'BOND-46' 'Cd46' 'C46' 'BOND-47' 'Cd47' 'C47' 'BOND-48' 'Cd48' 'C48' 'BOND-49' 'Cd49' 'C49' 'BOND-50' 'Cd50' 'C50' 'BOND-51' 'Cd51' 'C51' 'BOND-52' 'Cd52' 'C52' 'BOND-53' 'Cd53' 'C53' 'BOND-54' 'Cd54' 'C54' 'BOND-55' 'Cd55' 'C55'

307
'BOND-56' 'Cd56' 'C56' 'BOND-57' 'Cd57' 'C57' 'BOND-58' 'Cd58' 'C58' 'BOND-59' 'Cd59' 'C59' 'BOND-60' 'Cd60' 'C60' 'BOND-61' 'Cd61' 'C61' 'BOND-62' 'Cd62' 'C62' 'BOND-63' 'Cd63' 'C63' 'BOND-64' 'Cd64' 'C64' 'BOND-65' 'Cd65' 'C65' 'BOND-66' 'Cd66' 'C66' 'BOND-67' 'Cd67' 'C67' 'BOND-68' 'Cd68' 'C68' 'BOND-69' 'Cd69' 'C69' 'BOND-70' 'Cd70' 'C70' 'BOND-71' 'Cd71' 'C71' 'BOND-72' 'Cd72' 'C72' NONLINEAR SPRING PROPERTIES CURVE 'BOND' FORCE VS DISPL 0.0 0.0 -150.0 -1.0 END ELEMENT PROPS 'BOND-1' TO 'BOND-72' TYPE 'NLS' NONLINEAR SPRING ELEMENT DATA STIFFNESS 'BOND-1' TO 'BOND-72' X CURVE 'BOND' END $$===================================================================== $$ CONCRETE ELEMENT DATA $$===================================================================== TYPE PLANE STRESS GENERATE 72 ELEMENTS ID 'AB-1', 1 FROM 'A1',1 TO 'A2',1 TO 'B2',1 TO 'B1',1 GENERATE 72 ELEMENTS ID 'BC-1', 1 FROM 'B1',1 TO 'B2',1 TO 'C2',1 TO 'C1',1 GENERATE 72 ELEMENTS ID 'CD-1', 1 FROM 'C1',1 TO 'C2',1 TO 'D2',1 TO 'D1',1 GENERATE 72 ELEMENTS ID 'DE-1', 1 FROM 'D1',1 TO 'D2',1 TO 'E2',1 TO 'E1',1 ELEMENT PROPERTIES TYPE 'IPLQ' THICK 4 'AB-1' TO 'AB-72' 'BC-1' TO 'BC-72' 'CD-1' TO 'CD-72' 'DE-1' TO 'DE-72' $$===================================================================== $$ SPECIFY MATERIAL PROPERTIES $$=====================================================================

308
$$--------------------- $$ STEEL $$--------------------- CONSTANTS E 28500 - 'STRND-0' TO 'STRND-72' G 10962 - 'STRND-0' TO 'STRND-72' POI 0.3 - 'STRND-0' TO 'STRND-72' DEN 2.83E-04 - 'STRND-0' TO 'STRND-72' CTE 6.50E-06 - 'STRND-0' TO 'STRND-72' $$--------------------- $$ CONCRETE $$--------------------- CONSTANTS E 3949 - 'AB-1' TO 'AB-72' - 'BC-1' TO 'BC-72' - 'CD-1' TO 'CD-72' - 'DE-1' TO 'DE-72' G 1688 - 'AB-1' TO 'AB-72' - 'BC-1' TO 'BC-72' - 'CD-1' TO 'CD-72' - 'DE-1' TO 'DE-72' POI 0.17 - 'AB-1' TO 'AB-72' - 'BC-1' TO 'BC-72' - 'CD-1' TO 'CD-72' - 'DE-1' TO 'DE-72' DEN 8.40E-05 - 'AB-1' TO 'AB-72' - 'BC-1' TO 'BC-72' - 'CD-1' TO 'CD-72' - 'DE-1' TO 'DE-72' CTE 5.50E-06 - 'AB-1' TO 'AB-72' - 'BC-1' TO 'BC-72' - 'CD-1' TO 'CD-72' - 'DE-1' TO 'DE-72' $$===================================================================== $$ SPECIFY TEMPERATURE LOADINGS $$=====================================================================
309
LOADING 'TRANSFER' '-1100 TEMPERATURE CHANGE' MEMBER TEMPERATURE LOADS 'STRND-0' TO 'STRND-72' AXIAL -1100 $$===================================================================== $$ EXECUTE NONLINEAR ANALYSIS $$===================================================================== MAXIMUM NUMBER OF CYCLES 10 CONVERGENCE TOL 0.001 NONLINEAR ANALYSIS LIST FORCES EXISTING - 'STRND-0' TO 'STRND-72' LIST DISPLACEMENTS - 'C1' 'Cd1'

310
$$===================================================================== $$ Top-strand Large Block with a jacking stress of 0.75fpu $$===================================================================== STRUDL ' ' UNITS INCH KIPS DEG FAH $$===================================================================== $$ SPECIFY JOINT COORDINATES $$===================================================================== JOINT COORDINATES GLOBAL GENERATE 73 JOINTS ID 'A1',1 X 0. - DIFF 0 72 AT 1 Y 24. Z 0. GENERATE 73 JOINTS ID 'B1',1 X 0. - DIFF 0 72 AT 1 Y 23. Z 0. GENERATE 73 JOINTS ID 'C1',1 X 0. - DIFF 0 72 AT 1 Y 22. Z 0. GENERATE 73 JOINTS ID 'D1',1 X 0. - DIFF 0 72 AT 1 Y 21. Z 0. GENERATE 73 JOINTS ID 'E1',1 X 0. - DIFF 0 72 AT 1 Y 20. Z 0. GENERATE 73 JOINTS ID 'F1',1 X 0. - DIFF 0 72 AT 1 Y 19. Z 0. GENERATE 73 JOINTS ID 'G1',1 X 0. - DIFF 0 72 AT 1 Y 18. Z 0. GENERATE 73 JOINTS ID 'H1',1 X 0. - DIFF 0 72 AT 1 Y 17. Z 0. GENERATE 73 JOINTS ID 'I1',1 X 0. - DIFF 0 72 AT 1 Y 16. Z 0. GENERATE 73 JOINTS ID 'J1',1 X 0. - DIFF 0 72 AT 1 Y 15. Z 0. GENERATE 73 JOINTS ID 'K1',1 X 0. - DIFF 0 72 AT 1 Y 14. Z 0. GENERATE 73 JOINTS ID 'L1',1 X 0. - DIFF 0 72 AT 1 Y 13. Z 0. GENERATE 73 JOINTS ID 'M1',1 X 0. - DIFF 0 72 AT 1 Y 12. Z 0. GENERATE 73 JOINTS ID 'N1',1 X 0. - DIFF 0 72 AT 1 Y 11. Z 0. GENERATE 73 JOINTS ID 'O1',1 X 0. -

311
DIFF 0 72 AT 1 Y 10. Z 0. GENERATE 73 JOINTS ID 'P1',1 X 0. - DIFF 0 72 AT 1 Y 9. Z 0. GENERATE 73 JOINTS ID 'Q1',1 X 0. - DIFF 0 72 AT 1 Y 8. Z 0. GENERATE 73 JOINTS ID 'R1',1 X 0. - DIFF 0 72 AT 1 Y 7. Z 0. GENERATE 73 JOINTS ID 'S1',1 X 0. - DIFF 0 72 AT 1 Y 6. Z 0. GENERATE 73 JOINTS ID 'T1',1 X 0. - DIFF 0 72 AT 1 Y 5. Z 0. GENERATE 73 JOINTS ID 'U1',1 X 0. - DIFF 0 72 AT 1 Y 4. Z 0. GENERATE 73 JOINTS ID 'V1',1 X 0. - DIFF 0 72 AT 1 Y 3. Z 0. GENERATE 73 JOINTS ID 'W1',1 X 0. - DIFF 0 72 AT 1 Y 2. Z 0. GENERATE 73 JOINTS ID 'X1',1 X 0. - DIFF 0 72 AT 1 Y 1. Z 0. GENERATE 73 JOINTS ID 'Y1',1 X 0. - DIFF 0 72 AT 1 Y 0. Z 0. $$================================== GENERATE 74 JOINTS ID 'Cd0',1 X 0. - DIFF -1 73 AT 1 Y 22. Z 0. GENERATE 74 JOINTS ID 'Hd0',1 X 0. - DIFF -1 73 AT 1 Y 17. Z 0. GENERATE 74 JOINTS ID 'Md0',1 X 0. - DIFF -1 73 AT 1 Y 12. Z 0. GENERATE 74 JOINTS ID 'Rd0',1 X 0. - DIFF -1 73 AT 1 Y 7. Z 0. GENERATE 74 JOINTS ID 'Wd0',1 X 0. - DIFF -1 73 AT 1 Y 2. Z 0. $$===================================================================== $$ SPECIFY SUPPORT CONDITIONS $$===================================================================== STATUS SUPPORT - 'A73' 'B73' 'C73' 'D73' 'E73' 'F73' 'G73' 'H73' 'I73' 'J73' 'K73' 'L73' 'M73' 'N73' 'O73' 'P73' - 'Q73' 'R73' 'S73' 'T73' 'U73' 'V73' 'W73' 'X73' 'Y73'

312
JOINT RELEASES 'A73' 'B73' 'C73' 'D73' 'E73' 'F73' 'G73' 'H73' 'I73' 'J73' 'K73' 'L73' 'M73' 'N73' 'O73' 'P73' - 'Q73' 'R73' 'S73' 'T73' 'U73' 'V73' 'W73' 'X73' - FOR Y Z MOM X Y Z $$===================================================================== $$ SPECIFY MASTER AND SLAVE JOINTS $$===================================================================== JOINT TIES 'Cd1' TO 'Cd73' EQUAL 'C1' TO 'C73' 'Cd0' EQUAL 'C1' 'Hd1' TO 'Hd73' EQUAL 'H1' TO 'H73' 'Hd0' EQUAL 'H1' 'Md1' TO 'Md73' EQUAL 'M1' TO 'M73' 'Md0' EQUAL 'M1' 'Rd1' TO 'Rd73' EQUAL 'R1' TO 'R73' 'Rd0' EQUAL 'R1' 'Wd1' TO 'Wd73' EQUAL 'W1' TO 'W73' 'Wd0' EQUAL 'W1' SLAVE RELEASES 'Cd0' TO 'Cd72' 'Hd0' TO 'Hd72' 'Md0' TO 'Md72' 'Rd0' TO 'Rd72' 'Wd0' TO 'Wd72' FOR X Z MOM X Y Z 'Cd73' 'Hd73' 'Md73' 'Rd73' 'Wd73' FOR Z MOM X Y Z $$===================================================================== $$ SPECIFY STRAND PROPERTIES $$===================================================================== TYPE PLANE TRUSS GENERATE 73 MEMBERS ID 'STRNDA0',1 FROM 'Cd0', 1 TO 'Cd1' GENERATE 73 MEMBERS ID 'STRNDB0',1 FROM 'Hd0', 1 TO 'Hd1' GENERATE 73 MEMBERS ID 'STRNDC0',1 FROM 'Md0', 1 TO 'Md1' GENERATE 73 MEMBERS ID 'STRNDD0',1 FROM 'Rd0', 1 TO 'Rd1' GENERATE 73 MEMBERS ID 'STRNDE0',1 FROM 'Wd0', 1 TO 'Wd1' MEMBER PROPERTIES PRISMATIC AX 0.153 'STRNDA0' TO 'STRNDA72' 'STRNDB0' TO 'STRNDB72' 'STRNDC0' TO 'STRNDC72' 'STRNDD0' TO 'STRNDD72' 'STRNDE0' TO 'STRNDE72' $$===================================================================== $$ SPECIFY BOND ELEMENT PROPERTIES $$===================================================================== ELEMENT INC 'BOND-C1' 'Cd1' 'C1' 'BOND-C2' 'Cd2' 'C2'

313
'BOND-C3' 'Cd3' 'C3' 'BOND-C4' 'Cd4' 'C4' 'BOND-C5' 'Cd5' 'C5' 'BOND-C6' 'Cd6' 'C6' 'BOND-C7' 'Cd7' 'C7' 'BOND-C8' 'Cd8' 'C8' 'BOND-C9' 'Cd9' 'C9' 'BOND-C10' 'Cd10' 'C10' 'BOND-C11' 'Cd11' 'C11' 'BOND-C12' 'Cd12' 'C12' 'BOND-C13' 'Cd13' 'C13' 'BOND-C14' 'Cd14' 'C14' 'BOND-C15' 'Cd15' 'C15' 'BOND-C16' 'Cd16' 'C16' 'BOND-C17' 'Cd17' 'C17' 'BOND-C18' 'Cd18' 'C18' 'BOND-C19' 'Cd19' 'C19' 'BOND-C20' 'Cd20' 'C20' 'BOND-C21' 'Cd21' 'C21' 'BOND-C22' 'Cd22' 'C22' 'BOND-C23' 'Cd23' 'C23' 'BOND-C24' 'Cd24' 'C24' 'BOND-C25' 'Cd25' 'C25' 'BOND-C26' 'Cd26' 'C26' 'BOND-C27' 'Cd27' 'C27' 'BOND-C28' 'Cd28' 'C28' 'BOND-C29' 'Cd29' 'C29' 'BOND-C30' 'Cd30' 'C30' 'BOND-C31' 'Cd31' 'C31' 'BOND-C32' 'Cd32' 'C32' 'BOND-C33' 'Cd33' 'C33' 'BOND-C34' 'Cd34' 'C34' 'BOND-C35' 'Cd35' 'C35' 'BOND-C36' 'Cd36' 'C36' 'BOND-C37' 'Cd37' 'C37' 'BOND-C38' 'Cd38' 'C38' 'BOND-C39' 'Cd39' 'C39' 'BOND-C40' 'Cd40' 'C40' 'BOND-C41' 'Cd41' 'C41' 'BOND-C42' 'Cd42' 'C42' 'BOND-C43' 'Cd43' 'C43' 'BOND-C44' 'Cd44' 'C44' 'BOND-C45' 'Cd45' 'C45' 'BOND-C46' 'Cd46' 'C46' 'BOND-C47' 'Cd47' 'C47' 'BOND-C48' 'Cd48' 'C48' 'BOND-C49' 'Cd49' 'C49' 'BOND-C50' 'Cd50' 'C50' 'BOND-C51' 'Cd51' 'C51' 'BOND-C52' 'Cd52' 'C52' 'BOND-C53' 'Cd53' 'C53' 'BOND-C54' 'Cd54' 'C54' 'BOND-C55' 'Cd55' 'C55' 'BOND-C56' 'Cd56' 'C56' 'BOND-C57' 'Cd57' 'C57' 'BOND-C58' 'Cd58' 'C58' 'BOND-C59' 'Cd59' 'C59'

314
'BOND-C60' 'Cd60' 'C60' 'BOND-C61' 'Cd61' 'C61' 'BOND-C62' 'Cd62' 'C62' 'BOND-C63' 'Cd63' 'C63' 'BOND-C64' 'Cd64' 'C64' 'BOND-C65' 'Cd65' 'C65' 'BOND-C66' 'Cd66' 'C66' 'BOND-C67' 'Cd67' 'C67' 'BOND-C68' 'Cd68' 'C68' 'BOND-C69' 'Cd69' 'C69' 'BOND-C70' 'Cd70' 'C70' 'BOND-C71' 'Cd71' 'C71' 'BOND-C72' 'Cd72' 'C72' 'BOND-H1' 'Hd1' 'H1' 'BOND-H2' 'Hd2' 'H2' 'BOND-H3' 'Hd3' 'H3' 'BOND-H4' 'Hd4' 'H4' 'BOND-H5' 'Hd5' 'H5' 'BOND-H6' 'Hd6' 'H6' 'BOND-H7' 'Hd7' 'H7' 'BOND-H8' 'Hd8' 'H8' 'BOND-H9' 'Hd9' 'H9' 'BOND-H10' 'Hd10' 'H10' 'BOND-H11' 'Hd11' 'H11' 'BOND-H12' 'Hd12' 'H12' 'BOND-H13' 'Hd13' 'H13' 'BOND-H14' 'Hd14' 'H14' 'BOND-H15' 'Hd15' 'H15' 'BOND-H16' 'Hd16' 'H16' 'BOND-H17' 'Hd17' 'H17' 'BOND-H18' 'Hd18' 'H18' 'BOND-H19' 'Hd19' 'H19' 'BOND-H20' 'Hd20' 'H20' 'BOND-H21' 'Hd21' 'H21' 'BOND-H22' 'Hd22' 'H22' 'BOND-H23' 'Hd23' 'H23' 'BOND-H24' 'Hd24' 'H24' 'BOND-H25' 'Hd25' 'H25' 'BOND-H26' 'Hd26' 'H26' 'BOND-H27' 'Hd27' 'H27' 'BOND-H28' 'Hd28' 'H28' 'BOND-H29' 'Hd29' 'H29' 'BOND-H30' 'Hd30' 'H30' 'BOND-H31' 'Hd31' 'H31' 'BOND-H32' 'Hd32' 'H32' 'BOND-H33' 'Hd33' 'H33' 'BOND-H34' 'Hd34' 'H34' 'BOND-H35' 'Hd35' 'H35' 'BOND-H36' 'Hd36' 'H36' 'BOND-H37' 'Hd37' 'H37' 'BOND-H38' 'Hd38' 'H38' 'BOND-H39' 'Hd39' 'H39' 'BOND-H40' 'Hd40' 'H40' 'BOND-H41' 'Hd41' 'H41' 'BOND-H42' 'Hd42' 'H42' 'BOND-H43' 'Hd43' 'H43'

315
'BOND-H44' 'Hd44' 'H44' 'BOND-H45' 'Hd45' 'H45' 'BOND-H46' 'Hd46' 'H46' 'BOND-H47' 'Hd47' 'H47' 'BOND-H48' 'Hd48' 'H48' 'BOND-H49' 'Hd49' 'H49' 'BOND-H50' 'Hd50' 'H50' 'BOND-H51' 'Hd51' 'H51' 'BOND-H52' 'Hd52' 'H52' 'BOND-H53' 'Hd53' 'H53' 'BOND-H54' 'Hd54' 'H54' 'BOND-H55' 'Hd55' 'H55' 'BOND-H56' 'Hd56' 'H56' 'BOND-H57' 'Hd57' 'H57' 'BOND-H58' 'Hd58' 'H58' 'BOND-H59' 'Hd59' 'H59' 'BOND-H60' 'Hd60' 'H60' 'BOND-H61' 'Hd61' 'H61' 'BOND-H62' 'Hd62' 'H62' 'BOND-H63' 'Hd63' 'H63' 'BOND-H64' 'Hd64' 'H64' 'BOND-H65' 'Hd65' 'H65' 'BOND-H66' 'Hd66' 'H66' 'BOND-H67' 'Hd67' 'H67' 'BOND-H68' 'Hd68' 'H68' 'BOND-H69' 'Hd69' 'H69' 'BOND-H70' 'Hd70' 'H70' 'BOND-H71' 'Hd71' 'H71' 'BOND-H72' 'Hd72' 'H72' 'BOND-M1' 'Md1' 'M1' 'BOND-M2' 'Md2' 'M2' 'BOND-M3' 'Md3' 'M3' 'BOND-M4' 'Md4' 'M4' 'BOND-M5' 'Md5' 'M5' 'BOND-M6' 'Md6' 'M6' 'BOND-M7' 'Md7' 'M7' 'BOND-M8' 'Md8' 'M8' 'BOND-M9' 'Md9' 'M9' 'BOND-M10' 'Md10' 'M10' 'BOND-M11' 'Md11' 'M11' 'BOND-M12' 'Md12' 'M12' 'BOND-M13' 'Md13' 'M13' 'BOND-M14' 'Md14' 'M14' 'BOND-M15' 'Md15' 'M15' 'BOND-M16' 'Md16' 'M16' 'BOND-M17' 'Md17' 'M17' 'BOND-M18' 'Md18' 'M18' 'BOND-M19' 'Md19' 'M19' 'BOND-M20' 'Md20' 'M20' 'BOND-M21' 'Md21' 'M21' 'BOND-M22' 'Md22' 'M22' 'BOND-M23' 'Md23' 'M23' 'BOND-M24' 'Md24' 'M24' 'BOND-M25' 'Md25' 'M25' 'BOND-M26' 'Md26' 'M26' 'BOND-M27' 'Md27' 'M27'
316
'BOND-M28' 'Md28' 'M28' 'BOND-M29' 'Md29' 'M29' 'BOND-M30' 'Md30' 'M30' 'BOND-M31' 'Md31' 'M31' 'BOND-M32' 'Md32' 'M32' 'BOND-M33' 'Md33' 'M33' 'BOND-M34' 'Md34' 'M34' 'BOND-M35' 'Md35' 'M35' 'BOND-M36' 'Md36' 'M36' 'BOND-M37' 'Md37' 'M37' 'BOND-M38' 'Md38' 'M38' 'BOND-M39' 'Md39' 'M39' 'BOND-M40' 'Md40' 'M40' 'BOND-M41' 'Md41' 'M41' 'BOND-M42' 'Md42' 'M42' 'BOND-M43' 'Md43' 'M43' 'BOND-M44' 'Md44' 'M44' 'BOND-M45' 'Md45' 'M45' 'BOND-M46' 'Md46' 'M46' 'BOND-M47' 'Md47' 'M47' 'BOND-M48' 'Md48' 'M48' 'BOND-M49' 'Md49' 'M49' 'BOND-M50' 'Md50' 'M50' 'BOND-M51' 'Md51' 'M51' 'BOND-M52' 'Md52' 'M52' 'BOND-M53' 'Md53' 'M53' 'BOND-M54' 'Md54' 'M54' 'BOND-M55' 'Md55' 'M55' 'BOND-M56' 'Md56' 'M56' 'BOND-M57' 'Md57' 'M57' 'BOND-M58' 'Md58' 'M58' 'BOND-M59' 'Md59' 'M59' 'BOND-M60' 'Md60' 'M60' 'BOND-M61' 'Md61' 'M61' 'BOND-M62' 'Md62' 'M62' 'BOND-M63' 'Md63' 'M63' 'BOND-M64' 'Md64' 'M64' 'BOND-M65' 'Md65' 'M65' 'BOND-M66' 'Md66' 'M66' 'BOND-M67' 'Md67' 'M67' 'BOND-M68' 'Md68' 'M68' 'BOND-M69' 'Md69' 'M69' 'BOND-M70' 'Md70' 'M70' 'BOND-M71' 'Md71' 'M71' 'BOND-M72' 'Md72' 'M72' 'BOND-R1' 'Rd1' 'R1' 'BOND-R2' 'Rd2' 'R2' 'BOND-R3' 'Rd3' 'R3' 'BOND-R4' 'Rd4' 'R4' 'BOND-R5' 'Rd5' 'R5' 'BOND-R6' 'Rd6' 'R6' 'BOND-R7' 'Rd7' 'R7' 'BOND-R8' 'Rd8' 'R8' 'BOND-R9' 'Rd9' 'R9' 'BOND-R10' 'Rd10' 'R10' 'BOND-R11' 'Rd11' 'R11'

317
'BOND-R12' 'Rd12' 'R12' 'BOND-R13' 'Rd13' 'R13' 'BOND-R14' 'Rd14' 'R14' 'BOND-R15' 'Rd15' 'R15' 'BOND-R16' 'Rd16' 'R16' 'BOND-R17' 'Rd17' 'R17' 'BOND-R18' 'Rd18' 'R18' 'BOND-R19' 'Rd19' 'R19' 'BOND-R20' 'Rd20' 'R20' 'BOND-R21' 'Rd21' 'R21' 'BOND-R22' 'Rd22' 'R22' 'BOND-R23' 'Rd23' 'R23' 'BOND-R24' 'Rd24' 'R24' 'BOND-R25' 'Rd25' 'R25' 'BOND-R26' 'Rd26' 'R26' 'BOND-R27' 'Rd27' 'R27' 'BOND-R28' 'Rd28' 'R28' 'BOND-R29' 'Rd29' 'R29' 'BOND-R30' 'Rd30' 'R30' 'BOND-R31' 'Rd31' 'R31' 'BOND-R32' 'Rd32' 'R32' 'BOND-R33' 'Rd33' 'R33' 'BOND-R34' 'Rd34' 'R34' 'BOND-R35' 'Rd35' 'R35' 'BOND-R36' 'Rd36' 'R36' 'BOND-R37' 'Rd37' 'R37' 'BOND-R38' 'Rd38' 'R38' 'BOND-R39' 'Rd39' 'R39' 'BOND-R40' 'Rd40' 'R40' 'BOND-R41' 'Rd41' 'R41' 'BOND-R42' 'Rd42' 'R42' 'BOND-R43' 'Rd43' 'R43' 'BOND-R44' 'Rd44' 'R44' 'BOND-R45' 'Rd45' 'R45' 'BOND-R46' 'Rd46' 'R46' 'BOND-R47' 'Rd47' 'R47' 'BOND-R48' 'Rd48' 'R48' 'BOND-R49' 'Rd49' 'R49' 'BOND-R50' 'Rd50' 'R50' 'BOND-R51' 'Rd51' 'R51' 'BOND-R52' 'Rd52' 'R52' 'BOND-R53' 'Rd53' 'R53' 'BOND-R54' 'Rd54' 'R54' 'BOND-R55' 'Rd55' 'R55' 'BOND-R56' 'Rd56' 'R56' 'BOND-R57' 'Rd57' 'R57' 'BOND-R58' 'Rd58' 'R58' 'BOND-R59' 'Rd59' 'R59' 'BOND-R60' 'Rd60' 'R60' 'BOND-R61' 'Rd61' 'R61' 'BOND-R62' 'Rd62' 'R62' 'BOND-R63' 'Rd63' 'R63' 'BOND-R64' 'Rd64' 'R64' 'BOND-R65' 'Rd65' 'R65' 'BOND-R66' 'Rd66' 'R66' 'BOND-R67' 'Rd67' 'R67' 'BOND-R68' 'Rd68' 'R68'

318
'BOND-R69' 'Rd69' 'R69' 'BOND-R70' 'Rd70' 'R70' 'BOND-R71' 'Rd71' 'R71' 'BOND-R72' 'Rd72' 'R72' 'BOND-W1' 'Wd1' 'W1' 'BOND-W2' 'Wd2' 'W2' 'BOND-W3' 'Wd3' 'W3' 'BOND-W4' 'Wd4' 'W4' 'BOND-W5' 'Wd5' 'W5' 'BOND-W6' 'Wd6' 'W6' 'BOND-W7' 'Wd7' 'W7' 'BOND-W8' 'Wd8' 'W8' 'BOND-W9' 'Wd9' 'W9' 'BOND-W10' 'Wd10' 'W10' 'BOND-W11' 'Wd11' 'W11' 'BOND-W12' 'Wd12' 'W12' 'BOND-W13' 'Wd13' 'W13' 'BOND-W14' 'Wd14' 'W14' 'BOND-W15' 'Wd15' 'W15' 'BOND-W16' 'Wd16' 'W16' 'BOND-W17' 'Wd17' 'W17' 'BOND-W18' 'Wd18' 'W18' 'BOND-W19' 'Wd19' 'W19' 'BOND-W20' 'Wd20' 'W20' 'BOND-W21' 'Wd21' 'W21' 'BOND-W22' 'Wd22' 'W22' 'BOND-W23' 'Wd23' 'W23' 'BOND-W24' 'Wd24' 'W24' 'BOND-W25' 'Wd25' 'W25' 'BOND-W26' 'Wd26' 'W26' 'BOND-W27' 'Wd27' 'W27' 'BOND-W28' 'Wd28' 'W28' 'BOND-W29' 'Wd29' 'W29' 'BOND-W30' 'Wd30' 'W30' 'BOND-W31' 'Wd31' 'W31' 'BOND-W32' 'Wd32' 'W32' 'BOND-W33' 'Wd33' 'W33' 'BOND-W34' 'Wd34' 'W34' 'BOND-W35' 'Wd35' 'W35' 'BOND-W36' 'Wd36' 'W36' 'BOND-W37' 'Wd37' 'W37' 'BOND-W38' 'Wd38' 'W38' 'BOND-W39' 'Wd39' 'W39' 'BOND-W40' 'Wd40' 'W40' 'BOND-W41' 'Wd41' 'W41' 'BOND-W42' 'Wd42' 'W42' 'BOND-W43' 'Wd43' 'W43' 'BOND-W44' 'Wd44' 'W44' 'BOND-W45' 'Wd45' 'W45' 'BOND-W46' 'Wd46' 'W46' 'BOND-W47' 'Wd47' 'W47' 'BOND-W48' 'Wd48' 'W48' 'BOND-W49' 'Wd49' 'W49' 'BOND-W50' 'Wd50' 'W50' 'BOND-W51' 'Wd51' 'W51' 'BOND-W52' 'Wd52' 'W52'
319
'BOND-W53' 'Wd53' 'W53' 'BOND-W54' 'Wd54' 'W54' 'BOND-W55' 'Wd55' 'W55' 'BOND-W56' 'Wd56' 'W56' 'BOND-W57' 'Wd57' 'W57' 'BOND-W58' 'Wd58' 'W58' 'BOND-W59' 'Wd59' 'W59' 'BOND-W60' 'Wd60' 'W60' 'BOND-W61' 'Wd61' 'W61' 'BOND-W62' 'Wd62' 'W62' 'BOND-W63' 'Wd63' 'W63' 'BOND-W64' 'Wd64' 'W64' 'BOND-W65' 'Wd65' 'W65' 'BOND-W66' 'Wd66' 'W66' 'BOND-W67' 'Wd67' 'W67' 'BOND-W68' 'Wd68' 'W68' 'BOND-W69' 'Wd69' 'W69' 'BOND-W70' 'Wd70' 'W70' 'BOND-W71' 'Wd71' 'W71' 'BOND-W72' 'Wd72' 'W72' NONLINEAR SPRING PROPERTIES CURVE 'BOND-C' FORCE VS DISPL 0.0 0.0 -150.0 -1.0 CURVE 'BOND-H' FORCE VS DISPL 0.0 0.0 -150.0 -1.0 CURVE 'BOND-M' FORCE VS DISPL 0.0 0.0 -150.0 -1.0 CURVE 'BOND-R' FORCE VS DISPL 0.0 0.0 -150.0 -1.0 CURVE 'BOND-W' FORCE VS DISPL 0.0 0.0 -150.0 -1.0 END ELEMENT PROPS 'BOND-C1' TO 'BOND-C72' - 'BOND-H1' TO 'BOND-H72' - 'BOND-M1' TO 'BOND-M72' - 'BOND-R1' TO 'BOND-R72' - 'BOND-W1' TO 'BOND-W72' - TYPE 'NLS' NONLINEAR SPRING ELEMENT DATA STIFFNESS 'BOND-C1' TO 'BOND-C72' X CURVE 'BOND-C' 'BOND-H1' TO 'BOND-H72' X CURVE 'BOND-H' 'BOND-M1' TO 'BOND-M72' X CURVE 'BOND-M' 'BOND-R1' TO 'BOND-R72' X CURVE 'BOND-R' 'BOND-W1' TO 'BOND-W72' X CURVE 'BOND-W' END $$===================================================================== $$ CONCRETE ELEMENT DATA $$=====================================================================

320
TYPE PLANE STRESS GENERATE 72 ELEMENTS ID 'AB-1', 1 FROM 'B1',1 TO 'B2',1 TO 'A2',1 TO 'A1',1 GENERATE 72 ELEMENTS ID 'BC-1', 1 FROM 'C1',1 TO 'C2',1 TO 'B2',1 TO 'B1',1 GENERATE 72 ELEMENTS ID 'CD-1', 1 FROM 'D1',1 TO 'D2',1 TO 'C2',1 TO 'C1',1 GENERATE 72 ELEMENTS ID 'DE-1', 1 FROM 'E1',1 TO 'E2',1 TO 'D2',1 TO 'D1',1 GENERATE 72 ELEMENTS ID 'EF-1', 1 FROM 'F1',1 TO 'F2',1 TO 'E2',1 TO 'E1',1 GENERATE 72 ELEMENTS ID 'FG-1', 1 FROM 'G1',1 TO 'G2',1 TO 'F2',1 TO 'F1',1 GENERATE 72 ELEMENTS ID 'GH-1', 1 FROM 'H1',1 TO 'H2',1 TO 'G2',1 TO 'G1',1 GENERATE 72 ELEMENTS ID 'HI-1', 1 FROM 'I1',1 TO 'I2',1 TO 'H2',1 TO 'H1',1 GENERATE 72 ELEMENTS ID 'IJ-1', 1 FROM 'J1',1 TO 'J2',1 TO 'I2',1 TO 'I1',1 GENERATE 72 ELEMENTS ID 'JK-1', 1 FROM 'K1',1 TO 'K2',1 TO 'J2',1 TO 'J1',1 GENERATE 72 ELEMENTS ID 'KL-1', 1 FROM 'L1',1 TO 'L2',1 TO 'K2',1 TO 'K1',1 GENERATE 72 ELEMENTS ID 'LM-1', 1 FROM 'M1',1 TO 'M2',1 TO 'L2',1 TO 'L1',1 GENERATE 72 ELEMENTS ID 'MN-1', 1 FROM 'N1',1 TO 'N2',1 TO 'M2',1 TO 'M1',1 GENERATE 72 ELEMENTS ID 'NO-1', 1 FROM 'O1',1 TO 'O2',1 TO 'N2',1 TO 'N1',1 GENERATE 72 ELEMENTS ID 'OP-1', 1 FROM 'P1',1 TO 'P2',1 TO 'O2',1 TO 'O1',1 GENERATE 72 ELEMENTS ID 'PQ-1', 1 FROM 'Q1',1 TO 'Q2',1 TO 'P2',1 TO 'P1',1 GENERATE 72 ELEMENTS ID 'QR-1', 1 FROM 'R1',1 TO 'R2',1 TO 'Q2',1 TO 'Q1',1 GENERATE 72 ELEMENTS ID 'RS-1', 1 FROM 'S1',1 TO 'S2',1 TO 'R2',1 TO 'R1',1 GENERATE 72 ELEMENTS ID 'ST-1', 1 FROM 'T1',1 TO 'T2',1 TO 'S2',1 TO 'S1',1 GENERATE 72 ELEMENTS ID 'TU-1', 1 FROM 'U1',1 TO 'U2',1 TO 'T2',1 TO 'T1',1 GENERATE 72 ELEMENTS ID 'UV-1', 1 FROM 'V1',1 TO 'V2',1 TO 'U2',1 TO 'U1',1 GENERATE 72 ELEMENTS ID 'VW-1', 1 FROM 'W1',1 TO 'W2',1 TO 'V2',1 TO 'V1',1 GENERATE 72 ELEMENTS ID 'WX-1', 1 FROM 'X1',1 TO 'X2',1 TO 'W2',1 TO 'W1',1 GENERATE 72 ELEMENTS ID 'XY-1', 1 FROM 'Y1',1 TO 'Y2',1 TO 'X2',1 TO 'X1',1 ELEMENT PROPERTIES TYPE 'IPLQ' THICK 4 'AB-1' TO 'AB-72'

321
'BC-1' TO 'BC-72' 'CD-1' TO 'CD-72' 'DE-1' TO 'DE-72' 'EF-1' TO 'EF-72' 'FG-1' TO 'FG-72' 'GH-1' TO 'GH-72' 'HI-1' TO 'HI-72' 'IJ-1' TO 'IJ-72' 'JK-1' TO 'JK-72' 'KL-1' TO 'KL-72' 'LM-1' TO 'LM-72' 'MN-1' TO 'MN-72' 'NO-1' TO 'NO-72' 'OP-1' TO 'OP-72' 'PQ-1' TO 'PQ-72' 'QR-1' TO 'QR-72' 'RS-1' TO 'RS-72' 'ST-1' TO 'ST-72' 'TU-1' TO 'TU-72' 'UV-1' TO 'UV-72' 'VW-1' TO 'VW-72' 'WX-1' TO 'WX-72' 'XY-1' TO 'XY-72' $$===================================================================== $$ SPECIFY MATERIAL PROPERTIES $$===================================================================== $$--------------------- $$ STEEL $$--------------------- CONSTANTS E 28500 - 'STRNDA0' TO 'STRNDA72' - 'STRNDB0' TO 'STRNDB72' - 'STRNDC0' TO 'STRNDC72' - 'STRNDD0' TO 'STRNDD72' - 'STRNDE0' TO 'STRNDE72' G 10962 - 'STRNDA0' TO 'STRNDA72' - 'STRNDB0' TO 'STRNDB72' - 'STRNDC0' TO 'STRNDC72' - 'STRNDD0' TO 'STRNDD72' - 'STRNDE0' TO 'STRNDE72' POI 0.3 - 'STRNDA0' TO 'STRNDA72' - 'STRNDB0' TO 'STRNDB72' - 'STRNDC0' TO 'STRNDC72' - 'STRNDD0' TO 'STRNDD72' - 'STRNDE0' TO 'STRNDE72'

322
DEN 2.83E-04 - 'STRNDA0' TO 'STRNDA72' - 'STRNDB0' TO 'STRNDB72' - 'STRNDC0' TO 'STRNDC72' - 'STRNDD0' TO 'STRNDD72' - 'STRNDE0' TO 'STRNDE72' CTE 6.50E-06 - 'STRNDA0' TO 'STRNDA72' - 'STRNDB0' TO 'STRNDB72' - 'STRNDC0' TO 'STRNDC72' - 'STRNDD0' TO 'STRNDD72' - 'STRNDE0' TO 'STRNDE72' $$--------------------- $$ CONCRETE $$--------------------- CONSTANTS E 3949 - 'AB-1' TO 'AB-72' - 'BC-1' TO 'BC-72' - 'CD-1' TO 'CD-72' - 'DE-1' TO 'DE-72' - 'EF-1' TO 'EF-72' - 'FG-1' TO 'FG-72' - 'GH-1' TO 'GH-72' - 'HI-1' TO 'HI-72' - 'IJ-1' TO 'IJ-72' - 'JK-1' TO 'JK-72' - 'KL-1' TO 'KL-72' - 'LM-1' TO 'LM-72' - 'MN-1' TO 'MN-72' - 'NO-1' TO 'NO-72' - 'OP-1' TO 'OP-72' - 'PQ-1' TO 'PQ-72' - 'QR-1' TO 'QR-72' - 'RS-1' TO 'RS-72' - 'ST-1' TO 'ST-72' - 'TU-1' TO 'TU-72' - 'UV-1' TO 'UV-72' - 'VW-1' TO 'VW-72' - 'WX-1' TO 'WX-72' - 'XY-1' TO 'XY-72' G 1688 - 'AB-1' TO 'AB-72' - 'BC-1' TO 'BC-72' - 'CD-1' TO 'CD-72' - 'DE-1' TO 'DE-72' - 'EF-1' TO 'EF-72' -
323
'FG-1' TO 'FG-72' - 'GH-1' TO 'GH-72' - 'HI-1' TO 'HI-72' - 'IJ-1' TO 'IJ-72' - 'JK-1' TO 'JK-72' - 'KL-1' TO 'KL-72' - 'LM-1' TO 'LM-72' - 'MN-1' TO 'MN-72' - 'NO-1' TO 'NO-72' - 'OP-1' TO 'OP-72' - 'PQ-1' TO 'PQ-72' - 'QR-1' TO 'QR-72' - 'RS-1' TO 'RS-72' - 'ST-1' TO 'ST-72' - 'TU-1' TO 'TU-72' - 'UV-1' TO 'UV-72' - 'VW-1' TO 'VW-72' - 'WX-1' TO 'WX-72' - 'XY-1' TO 'XY-72' POI 0.17 - 'AB-1' TO 'AB-72' - 'BC-1' TO 'BC-72' - 'CD-1' TO 'CD-72' - 'DE-1' TO 'DE-72' - 'EF-1' TO 'EF-72' - 'FG-1' TO 'FG-72' - 'GH-1' TO 'GH-72' - 'HI-1' TO 'HI-72' - 'IJ-1' TO 'IJ-72' - 'JK-1' TO 'JK-72' - 'KL-1' TO 'KL-72' - 'LM-1' TO 'LM-72' - 'MN-1' TO 'MN-72' - 'NO-1' TO 'NO-72' - 'OP-1' TO 'OP-72' - 'PQ-1' TO 'PQ-72' - 'QR-1' TO 'QR-72' - 'RS-1' TO 'RS-72' - 'ST-1' TO 'ST-72' - 'TU-1' TO 'TU-72' - 'UV-1' TO 'UV-72' - 'VW-1' TO 'VW-72' - 'WX-1' TO 'WX-72' - 'XY-1' TO 'XY-72' DEN 8.40E-05 - 'AB-1' TO 'AB-72' -

324
'BC-1' TO 'BC-72' - 'CD-1' TO 'CD-72' - 'DE-1' TO 'DE-72' - 'EF-1' TO 'EF-72' - 'FG-1' TO 'FG-72' - 'GH-1' TO 'GH-72' - 'HI-1' TO 'HI-72' - 'IJ-1' TO 'IJ-72' - 'JK-1' TO 'JK-72' - 'KL-1' TO 'KL-72' - 'LM-1' TO 'LM-72' - 'MN-1' TO 'MN-72' - 'NO-1' TO 'NO-72' - 'OP-1' TO 'OP-72' - 'PQ-1' TO 'PQ-72' - 'QR-1' TO 'QR-72' - 'RS-1' TO 'RS-72' - 'ST-1' TO 'ST-72' - 'TU-1' TO 'TU-72' - 'UV-1' TO 'UV-72' - 'VW-1' TO 'VW-72' - 'WX-1' TO 'WX-72' - 'XY-1' TO 'XY-72' CTE 5.50E-06 - 'AB-1' TO 'AB-72' - 'BC-1' TO 'BC-72' - 'CD-1' TO 'CD-72' - 'DE-1' TO 'DE-72' - 'EF-1' TO 'EF-72' - 'FG-1' TO 'FG-72' - 'GH-1' TO 'GH-72' - 'HI-1' TO 'HI-72' - 'IJ-1' TO 'IJ-72' - 'JK-1' TO 'JK-72' - 'KL-1' TO 'KL-72' - 'LM-1' TO 'LM-72' - 'MN-1' TO 'MN-72' - 'NO-1' TO 'NO-72' - 'OP-1' TO 'OP-72' - 'PQ-1' TO 'PQ-72' - 'QR-1' TO 'QR-72' - 'RS-1' TO 'RS-72' - 'ST-1' TO 'ST-72' - 'TU-1' TO 'TU-72' - 'UV-1' TO 'UV-72' - 'VW-1' TO 'VW-72' -
325
'WX-1' TO 'WX-72' - 'XY-1' TO 'XY-72' $$===================================================================== $$ SPECIFY TEMPERATURE LOADINGS $$===================================================================== LOADING 'TRANSFER' '-1100 TEMPERATURE CHANGE' MEMBER TEMPERATURE LOADS 'STRNDA0' TO 'STRNDA72' - 'STRNDB0' TO 'STRNDB72' - 'STRNDC0' TO 'STRNDC72' - 'STRNDD0' TO 'STRNDD72' - 'STRNDE0' TO 'STRNDE72' AXIAL -1100 $$===================================================================== $$ EXECUTE NONLINEAR ANALYSIS $$===================================================================== MAXIMUM NUMBER OF CYCLES 10 CONVERGENCE TOL 0.001 NONLINEAR ANALYSIS LIST FORCES EXISTING - 'STRNDA0' TO 'STRNDA72' - 'STRNDB0' TO 'STRNDB72' - 'STRNDC0' TO 'STRNDC72' - 'STRNDD0' TO 'STRNDD72' - 'STRNDE0' TO 'STRNDE72' LIST DISPLACEMENTS - 'C1' 'Cd1' 'H1' 'Hd1' 'M1' 'Md1' 'R1' 'Rd1' 'W1' 'Wd1'

326
$$===================================================================== $$ Small T-beam with a jacking stress of 0.67fpu $$===================================================================== STRUDL ' ' UNITS INCH KIPS DEG FAH $$===================================================================== $$ SPECIFY JOINT COORDINATES $$===================================================================== JOINT COORDINATES GLOBAL GENERATE 193 JOINTS ID 'A1',1 X 0. - DIFF 0 192 AT 0.5 Y 17. Z 0. GENERATE 97 JOINTS ID 'B1',2 X 0. - DIFF 0 96 AT 1 Y 16.5 Z 0. GENERATE 193 JOINTS ID 'C1',1 X 0. - DIFF 0 192 AT 0.5 Y 16. Z 0. GENERATE 97 JOINTS ID 'D1',2 X 0. - DIFF 0 96 AT 1 Y 15.5 Z 0. GENERATE 193 JOINTS ID 'E1',1 X 0. - DIFF 0 192 AT 0.5 Y 15. Z 0. GENERATE 97 JOINTS ID 'F1',2 X 0. - DIFF 0 96 AT 1 Y 14.5 Z 0. GENERATE 193 JOINTS ID 'G1',1 X 0. - DIFF 0 192 AT 0.5 Y 14. Z 0. GENERATE 97 JOINTS ID 'H1',2 X 0. - DIFF 0 96 AT 1 Y 13.5 Z 0. GENERATE 193 JOINTS ID 'I1',1 X 0. - DIFF 0 192 AT 0.5 Y 13. Z 0. GENERATE 97 JOINTS ID 'J1',2 X 0. - DIFF 0 96 AT 1 Y 12.5 Z 0. GENERATE 193 JOINTS ID 'K1',1 X 0. - DIFF 0 192 AT 0.5 Y 12. Z 0. GENERATE 97 JOINTS ID 'L1',2 X 0. - DIFF 0 96 AT 1 Y 11.5 Z 0. GENERATE 193 JOINTS ID 'M1',1 X 0. - DIFF 0 192 AT 0.5 Y 11. Z 0. GENERATE 97 JOINTS ID 'N1',2 X 0. - DIFF 0 96 AT 1 Y 10.5 Z 0. GENERATE 193 JOINTS ID 'O1',1 X 0. -
327
DIFF 0 192 AT 0.5 Y 10. Z 0. GENERATE 97 JOINTS ID 'P1',2 X 0. - DIFF 0 96 AT 1 Y 9.5 Z 0. GENERATE 193 JOINTS ID 'Q1',1 X 0. - DIFF 0 192 AT 0.5 Y 9. Z 0. GENERATE 97 JOINTS ID 'R1',2 X 0. - DIFF 0 96 AT 1 Y 8.5 Z 0. GENERATE 193 JOINTS ID 'S1',1 X 0. - DIFF 0 192 AT 0.5 Y 8. Z 0. GENERATE 97 JOINTS ID 'T1',2 X 0. - DIFF 0 96 AT 1 Y 7.5 Z 0. GENERATE 193 JOINTS ID 'U1',1 X 0. - DIFF 0 192 AT 0.5 Y 7. Z 0. GENERATE 97 JOINTS ID 'V1',2 X 0. - DIFF 0 96 AT 1 Y 6.5 Z 0. GENERATE 193 JOINTS ID 'W1',1 X 0. - DIFF 0 192 AT 0.5 Y 6. Z 0. GENERATE 97 JOINTS ID 'X1',2 X 0. - DIFF 0 96 AT 1 Y 5.5 Z 0. GENERATE 193 JOINTS ID 'Y1',1 X 0. - DIFF 0 192 AT 0.5 Y 5. Z 0. GENERATE 97 JOINTS ID 'Z1',2 X 0. - DIFF 0 96 AT 1 Y 4.5 Z 0. GENERATE 193 JOINTS ID 'AA1',1 X 0. - DIFF 0 192 AT 0.5 Y 4. Z 0. GENERATE 97 JOINTS ID 'BB1',2 X 0. - DIFF 0 96 AT 1 Y 3.5 Z 0. GENERATE 193 JOINTS ID 'CC1',1 X 0. - DIFF 0 192 AT 0.5 Y 3. Z 0. GENERATE 97 JOINTS ID 'DD1',2 X 0. - DIFF 0 96 AT 1 Y 2.5 Z 0. GENERATE 193 JOINTS ID 'EE1',1 X 0. - DIFF 0 192 AT 0.5 Y 2. Z 0. GENERATE 97 JOINTS ID 'FF1',2 X 0. - DIFF 0 96 AT 1 Y 1.5 Z 0. GENERATE 193 JOINTS ID 'GG1',1 X 0. - DIFF 0 192 AT 0.5 Y 1. Z 0. GENERATE 97 JOINTS ID 'HH1',2 X 0. -

328
DIFF 0 96 AT 1 Y 0.5 Z 0. GENERATE 193 JOINTS ID 'II1',1 X 0. - DIFF 0 192 AT 0.5 Y 0. Z 0. $$================================== GENERATE 194 JOINTS ID 'EEd0',1 X 0. - DIFF -1 1 AT 1 192 AT 0.5 Y 2. Z 0. $$===================================================================== $$ SPECIFY SUPPORT CONDITIONS $$===================================================================== STATUS SUPPORT - 'A193' 'B193' 'C193' 'D193' 'E193' 'F193' 'G193' 'H193' 'I193' 'J193' - 'K193' 'L193' 'M193' 'N193' 'O193' 'P193' 'Q193' 'R193' 'S193' 'T193' - 'U193' 'V193' 'W193' 'X193' 'Y193' 'Z193' 'AA193' 'BB193' 'CC193' 'DD193' - 'EE193' 'FF193' 'GG193' 'HH193' 'II1' 'II193' JOINT RELEASES 'A193' 'B193' 'C193' 'D193' 'E193' 'F193' 'G193' 'H193' 'I193' 'J193' - 'K193' 'L193' 'M193' 'N193' 'O193' 'P193' 'Q193' 'R193' 'S193' 'T193' - 'U193' 'V193' 'W193' 'X193' 'Y193' 'Z193' 'AA193' 'BB193' 'CC193' 'DD193' - 'EE193' 'FF193' 'GG193' 'HH193' 'II193' - FOR Y Z MOM X Y Z JOINT RELEASES 'II1' - FOR X Z MOM X Y Z $$===================================================================== $$ SPECIFY MASTER AND SLAVE JOINTS $$===================================================================== JOINT TIES 'EEd1' TO 'EEd193' EQUAL 'EE1' TO 'EE193' 'EEd0' EQUAL 'EE1' SLAVE RELEASES 'EEd0' TO 'EEd192' FOR X Z MOM X Y Z 'EEd193' FOR Z MOM X Y Z $$=====================================================================$$ SPECIFY STRAND PROPERTIES $$===================================================================== TYPE PLANE TRUSS GENERATE 193 MEMBERS ID 'STRND0',1 FROM 'EEd0', 1 TO 'EEd1' GENERATE 192 MEMBERS ID 'REBAR1',1 FROM 'C1', 1 TO 'C2' MEMBER PROPERTIES PRISMATIC AX 0.459

329
'STRND0' TO 'STRND192' MEMBER PROPERTIES PRISMATIC AX 0.6 'REBAR1' TO 'REBAR192' $$===================================================================== $$ SPECIFY BOND ELEMENT PROPERTIES $$===================================================================== ELEMENT INC 'BOND-1' 'EEd1' 'EE1' 'BOND-2' 'EEd2' 'EE2' 'BOND-3' 'EEd3' 'EE3' 'BOND-4' 'EEd4' 'EE4' 'BOND-5' 'EEd5' 'EE5' 'BOND-6' 'EEd6' 'EE6' 'BOND-7' 'EEd7' 'EE7' 'BOND-8' 'EEd8' 'EE8' 'BOND-9' 'EEd9' 'EE9' 'BOND-10' 'EEd10' 'EE10' 'BOND-11' 'EEd11' 'EE11' 'BOND-12' 'EEd12' 'EE12' 'BOND-13' 'EEd13' 'EE13' 'BOND-14' 'EEd14' 'EE14' 'BOND-15' 'EEd15' 'EE15' 'BOND-16' 'EEd16' 'EE16' 'BOND-17' 'EEd17' 'EE17' 'BOND-18' 'EEd18' 'EE18' 'BOND-19' 'EEd19' 'EE19' 'BOND-20' 'EEd20' 'EE20' 'BOND-21' 'EEd21' 'EE21' 'BOND-22' 'EEd22' 'EE22' 'BOND-23' 'EEd23' 'EE23' 'BOND-24' 'EEd24' 'EE24' 'BOND-25' 'EEd25' 'EE25' 'BOND-26' 'EEd26' 'EE26' 'BOND-27' 'EEd27' 'EE27' 'BOND-28' 'EEd28' 'EE28' 'BOND-29' 'EEd29' 'EE29' 'BOND-30' 'EEd30' 'EE30' 'BOND-31' 'EEd31' 'EE31' 'BOND-32' 'EEd32' 'EE32' 'BOND-33' 'EEd33' 'EE33' 'BOND-34' 'EEd34' 'EE34' 'BOND-35' 'EEd35' 'EE35' 'BOND-36' 'EEd36' 'EE36' 'BOND-37' 'EEd37' 'EE37' 'BOND-38' 'EEd38' 'EE38' 'BOND-39' 'EEd39' 'EE39' 'BOND-40' 'EEd40' 'EE40' 'BOND-41' 'EEd41' 'EE41' 'BOND-42' 'EEd42' 'EE42' 'BOND-43' 'EEd43' 'EE43' 'BOND-44' 'EEd44' 'EE44' 'BOND-45' 'EEd45' 'EE45' 'BOND-46' 'EEd46' 'EE46' 'BOND-47' 'EEd47' 'EE47'

330
'BOND-48' 'EEd48' 'EE48' 'BOND-49' 'EEd49' 'EE49' 'BOND-50' 'EEd50' 'EE50' 'BOND-51' 'EEd51' 'EE51' 'BOND-52' 'EEd52' 'EE52' 'BOND-53' 'EEd53' 'EE53' 'BOND-54' 'EEd54' 'EE54' 'BOND-55' 'EEd55' 'EE55' 'BOND-56' 'EEd56' 'EE56' 'BOND-57' 'EEd57' 'EE57' 'BOND-58' 'EEd58' 'EE58' 'BOND-59' 'EEd59' 'EE59' 'BOND-60' 'EEd60' 'EE60' 'BOND-61' 'EEd61' 'EE61' 'BOND-62' 'EEd62' 'EE62' 'BOND-63' 'EEd63' 'EE63' 'BOND-64' 'EEd64' 'EE64' 'BOND-65' 'EEd65' 'EE65' 'BOND-66' 'EEd66' 'EE66' 'BOND-67' 'EEd67' 'EE67' 'BOND-68' 'EEd68' 'EE68' 'BOND-69' 'EEd69' 'EE69' 'BOND-70' 'EEd70' 'EE70' 'BOND-71' 'EEd71' 'EE71' 'BOND-72' 'EEd72' 'EE72' 'BOND-73' 'EEd73' 'EE73' 'BOND-74' 'EEd74' 'EE74' 'BOND-75' 'EEd75' 'EE75' 'BOND-76' 'EEd76' 'EE76' 'BOND-77' 'EEd77' 'EE77' 'BOND-78' 'EEd78' 'EE78' 'BOND-79' 'EEd79' 'EE79' 'BOND-80' 'EEd80' 'EE80' 'BOND-81' 'EEd81' 'EE81' 'BOND-82' 'EEd82' 'EE82' 'BOND-83' 'EEd83' 'EE83' 'BOND-84' 'EEd84' 'EE84' 'BOND-85' 'EEd85' 'EE85' 'BOND-86' 'EEd86' 'EE86' 'BOND-87' 'EEd87' 'EE87' 'BOND-88' 'EEd88' 'EE88' 'BOND-89' 'EEd89' 'EE89' 'BOND-90' 'EEd90' 'EE90' 'BOND-91' 'EEd91' 'EE91' 'BOND-92' 'EEd92' 'EE92' 'BOND-93' 'EEd93' 'EE93' 'BOND-94' 'EEd94' 'EE94' 'BOND-95' 'EEd95' 'EE95' 'BOND-96' 'EEd96' 'EE96' 'BOND-97' 'EEd97' 'EE97' 'BOND-98' 'EEd98' 'EE98' 'BOND-99' 'EEd99' 'EE99' 'BOND-100' 'EEd100' 'EE100' 'BOND-101' 'EEd101' 'EE101' 'BOND-102' 'EEd102' 'EE102' 'BOND-103' 'EEd103' 'EE103' 'BOND-104' 'EEd104' 'EE104'

331
'BOND-105' 'EEd105' 'EE105' 'BOND-106' 'EEd106' 'EE106' 'BOND-107' 'EEd107' 'EE107' 'BOND-108' 'EEd108' 'EE108' 'BOND-109' 'EEd109' 'EE109' 'BOND-110' 'EEd110' 'EE110' 'BOND-111' 'EEd111' 'EE111' 'BOND-112' 'EEd112' 'EE112' 'BOND-113' 'EEd113' 'EE113' 'BOND-114' 'EEd114' 'EE114' 'BOND-115' 'EEd115' 'EE115' 'BOND-116' 'EEd116' 'EE116' 'BOND-117' 'EEd117' 'EE117' 'BOND-118' 'EEd118' 'EE118' 'BOND-119' 'EEd119' 'EE119' 'BOND-120' 'EEd120' 'EE120' 'BOND-121' 'EEd121' 'EE121' 'BOND-122' 'EEd122' 'EE122' 'BOND-123' 'EEd123' 'EE123' 'BOND-124' 'EEd124' 'EE124' 'BOND-125' 'EEd125' 'EE125' 'BOND-126' 'EEd126' 'EE126' 'BOND-127' 'EEd127' 'EE127' 'BOND-128' 'EEd128' 'EE128' 'BOND-129' 'EEd129' 'EE129' 'BOND-130' 'EEd130' 'EE130' 'BOND-131' 'EEd131' 'EE131' 'BOND-132' 'EEd132' 'EE132' 'BOND-133' 'EEd133' 'EE133' 'BOND-134' 'EEd134' 'EE134' 'BOND-135' 'EEd135' 'EE135' 'BOND-136' 'EEd136' 'EE136' 'BOND-137' 'EEd137' 'EE137' 'BOND-138' 'EEd138' 'EE138' 'BOND-139' 'EEd139' 'EE139' 'BOND-140' 'EEd140' 'EE140' 'BOND-141' 'EEd141' 'EE141' 'BOND-142' 'EEd142' 'EE142' 'BOND-143' 'EEd143' 'EE143' 'BOND-144' 'EEd144' 'EE144' 'BOND-145' 'EEd145' 'EE145' 'BOND-146' 'EEd146' 'EE146' 'BOND-147' 'EEd147' 'EE147' 'BOND-148' 'EEd148' 'EE148' 'BOND-149' 'EEd149' 'EE149' 'BOND-150' 'EEd150' 'EE150' 'BOND-151' 'EEd151' 'EE151' 'BOND-152' 'EEd152' 'EE152' 'BOND-153' 'EEd153' 'EE153' 'BOND-154' 'EEd154' 'EE154' 'BOND-155' 'EEd155' 'EE155' 'BOND-156' 'EEd156' 'EE156' 'BOND-157' 'EEd157' 'EE157' 'BOND-158' 'EEd158' 'EE158' 'BOND-159' 'EEd159' 'EE159' 'BOND-160' 'EEd160' 'EE160' 'BOND-161' 'EEd161' 'EE161'

332
'BOND-162' 'EEd162' 'EE162' 'BOND-163' 'EEd163' 'EE163' 'BOND-164' 'EEd164' 'EE164' 'BOND-165' 'EEd165' 'EE165' 'BOND-166' 'EEd166' 'EE166' 'BOND-167' 'EEd167' 'EE167' 'BOND-168' 'EEd168' 'EE168' 'BOND-169' 'EEd169' 'EE169' 'BOND-170' 'EEd170' 'EE170' 'BOND-171' 'EEd171' 'EE171' 'BOND-172' 'EEd172' 'EE172' 'BOND-173' 'EEd173' 'EE173' 'BOND-174' 'EEd174' 'EE174' 'BOND-175' 'EEd175' 'EE175' 'BOND-176' 'EEd176' 'EE176' 'BOND-177' 'EEd177' 'EE177' 'BOND-178' 'EEd178' 'EE178' 'BOND-179' 'EEd179' 'EE179' 'BOND-180' 'EEd180' 'EE180' 'BOND-181' 'EEd181' 'EE181' 'BOND-182' 'EEd182' 'EE182' 'BOND-183' 'EEd183' 'EE183' 'BOND-184' 'EEd184' 'EE184' 'BOND-185' 'EEd185' 'EE185' 'BOND-186' 'EEd186' 'EE186' 'BOND-187' 'EEd187' 'EE187' 'BOND-188' 'EEd188' 'EE188' 'BOND-189' 'EEd189' 'EE189' 'BOND-190' 'EEd190' 'EE190' 'BOND-191' 'EEd191' 'EE191' 'BOND-192' 'EEd192' 'EE192' $$===================================================================== $$ NOTE: SPRING STIFFNESS MUST ACCOUNT FOR NUMBER OF STRANDS IN THIS CASE, k(3 STRANDS) = 3*k(1 STRAND) $$===================================================================== NONLINEAR SPRING PROPERTIES CURVE 'BOND' FORCE VS DISPL 0.0 0.0 -450.0 -1.0 END ELEMENT PROPS 'BOND-1' TO 'BOND-192' - TYPE 'NLS' NONLINEAR SPRING ELEMENT DATA STIFFNESS 'BOND-1' TO 'BOND-192' X CURVE 'BOND' END $$===================================================================== $$ CONCRETE ELEMENT DATA $$=====================================================================

333
TYPE PLANE STRESS GENERATE 96 ELEMENTS ID 'AC-1', 1 FROM 'C1',2 TO 'C3',2 TO 'A3',2 TO 'A1',2 TO 'C2',2 TO 'B3',2 TO 'A2',2 TO 'B1',2 GENERATE 96 ELEMENTS ID 'CE-1', 1 FROM 'E1',2 TO 'E3',2 TO 'C3',2 TO 'C1',2 TO 'E2',2 TO 'D3',2 TO 'C2',2 TO 'D1',2 GENERATE 96 ELEMENTS ID 'EG-1', 1 FROM 'G1',2 TO 'G3',2 TO 'E3',2 TO 'E1',2 TO 'G2',2 TO 'F3',2 TO 'E2',2 TO 'F1',2 GENERATE 96 ELEMENTS ID 'GI-1', 1 FROM 'I1',2 TO 'I3',2 TO 'G3',2 TO 'G1',2 TO 'I2',2 TO 'H3',2 TO 'G2',2 TO 'H1',2 GENERATE 96 ELEMENTS ID 'IK-1', 1 FROM 'K1',2 TO 'K3',2 TO 'I3',2 TO 'I1',2 TO 'K2',2 TO 'J3',2 TO 'I2',2 TO 'J1',2 GENERATE 96 ELEMENTS ID 'KM-1', 1 FROM 'M1',2 TO 'M3',2 TO 'K3',2 TO 'K1',2 TO 'M2',2 TO 'L3',2 TO 'K2',2 TO 'L1',2 GENERATE 96 ELEMENTS ID 'MO-1', 1 FROM 'O1',2 TO 'O3',2 TO 'M3',2 TO 'M1',2 TO 'O2',2 TO 'N3',2 TO 'M2',2 TO 'N1',2 GENERATE 96 ELEMENTS ID 'OQ-1', 1 FROM 'Q1',2 TO 'Q3',2 TO 'O3',2 TO 'O1',2 TO 'Q2',2 TO 'P3',2 TO 'O2',2 TO 'P1',2 GENERATE 96 ELEMENTS ID 'QS-1', 1 FROM 'S1',2 TO 'S3',2 TO 'Q3',2 TO 'Q1',2 TO 'S2',2 TO 'R3',2 TO 'Q2',2 TO 'R1',2 GENERATE 96 ELEMENTS ID 'SU-1', 1 FROM 'U1',2 TO 'U3',2 TO 'S3',2 TO 'S1',2 TO 'U2',2 TO 'T3',2 TO 'S2',2 TO 'T1',2 GENERATE 96 ELEMENTS ID 'UW-1', 1 FROM 'W1',2 TO 'W3',2 TO 'U3',2 TO 'U1',2 TO 'W2',2 TO 'V3',2 TO 'U2',2 TO 'V1',2 GENERATE 96 ELEMENTS ID 'WY-1', 1 FROM 'Y1',2 TO 'Y3',2 TO 'W3',2 TO 'W1',2 TO 'Y2',2 TO 'X3',2 TO 'W2',2 TO 'X1',2 GENERATE 96 ELEMENTS ID 'YAA-1', 1 FROM 'AA1',2 TO 'AA3',2 TO 'Y3',2 TO 'Y1',2 TO 'AA2',2 TO 'Z3',2 TO 'Y2',2 TO 'Z1',2 GENERATE 96 ELEMENTS ID 'AACC-1', 1 FROM 'CC1',2 TO 'CC3',2 TO 'AA3',2 TO 'AA1',2 TO 'CC2',2 TO 'BB3',2 TO 'AA2',2 TO 'BB1',2 GENERATE 96 ELEMENTS ID 'CCEE-1', 1 FROM 'EE1',2 TO 'EE3',2 TO 'CC3',2 TO 'CC1',2 TO 'EE2',2 TO 'DD3',2 TO 'CC2',2 TO 'DD1',2 GENERATE 96 ELEMENTS ID 'EEGG-1', 1 FROM 'GG1',2 TO 'GG3',2 TO 'EE3',2 TO 'EE1',2 TO 'GG2',2 TO 'FF3',2 TO 'EE2',2 TO 'FF1',2 GENERATE 96 ELEMENTS ID 'GGII-1', 1 FROM 'II1',2 TO 'II3',2 TO 'GG3',2 TO 'GG1',2 TO 'II2',2 TO 'HH3',2 TO 'GG2',2 TO 'HH1',2 ELEMENT PROPERTIES TYPE 'IPQQ' THICK 24 'AC-1' TO 'AC-96' 'CE-1' TO 'CE-96' ELEMENT PROPERTIES TYPE 'IPQQ' THICK 6 'EG-1' TO 'EG-96' 'GI-1' TO 'GI-96' ELEMENT PROPERTIES TYPE 'IPQQ' THICK 4 'IK-1' TO 'IK-96' 'KM-1' TO 'KM-96' 'MO-1' TO 'MO-96' 'OQ-1' TO 'OQ-96' 'QS-1' TO 'QS-96' 'SU-1' TO 'SU-96' 'UW-1' TO 'UW-96' ELEMENT PROPERTIES TYPE 'IPQQ' THICK 6

334
'WY-1' TO 'WY-96' 'YAA-1' TO 'YAA-96' ELEMENT PROPERTIES TYPE 'IPQQ' THICK 8 'AACC-1' TO 'AACC-96' 'CCEE-1' TO 'CCEE-96' 'EEGG-1' TO 'EEGG-96' 'GGII-1' TO 'GGII-96' $$===================================================================== $$ SPECIFY MATERIAL PROPERTIES $$===================================================================== MATERIAL STEEL - 'REBAR1' TO 'REBAR192' $$--------------------- $$ STEEL $$--------------------- CONSTANTS E 28500 - 'STRND0' TO 'STRND192' G 10962 - 'STRND0' TO 'STRND192' POI 0.3 - 'STRND0' TO 'STRND192' DEN 2.83E-04 - 'STRND0' TO 'STRND192' CTE 6.50E-06 - 'STRND0' TO 'STRND192' $$--------------------- $$ CONCRETE $$--------------------- CONSTANTS E 4150 - 'AC-1' TO 'AC-96' - 'CE-1' TO 'CE-96' - 'EG-1' TO 'EG-96' - 'GI-1' TO 'GI-96' - 'IK-1' TO 'IK-96' - 'KM-1' TO 'KM-96' - 'MO-1' TO 'MO-96' - 'OQ-1' TO 'OQ-96' - 'QS-1' TO 'QS-96' - 'SU-1' TO 'SU-96' - 'UW-1' TO 'UW-96' - 'WY-1' TO 'WY-96' - 'YAA-1' TO 'YAA-96' -

335
'AACC-1' TO 'AACC-96' - 'CCEE-1' TO 'CCEE-96' - 'EEGG-1' TO 'EEGG-96' - 'GGII-1' TO 'GGII-96' G 1773 - 'AC-1' TO 'AC-96' - 'CE-1' TO 'CE-96' - 'EG-1' TO 'EG-96' - 'GI-1' TO 'GI-96' - 'IK-1' TO 'IK-96' - 'KM-1' TO 'KM-96' - 'MO-1' TO 'MO-96' - 'OQ-1' TO 'OQ-96' - 'QS-1' TO 'QS-96' - 'SU-1' TO 'SU-96' - 'UW-1' TO 'UW-96' - 'WY-1' TO 'WY-96' - 'YAA-1' TO 'YAA-96' - 'AACC-1' TO 'AACC-96' - 'CCEE-1' TO 'CCEE-96' - 'EEGG-1' TO 'EEGG-96' - 'GGII-1' TO 'GGII-96' POI 0.17 - 'AC-1' TO 'AC-96' - 'CE-1' TO 'CE-96' - 'EG-1' TO 'EG-96' - 'GI-1' TO 'GI-96' - 'IK-1' TO 'IK-96' - 'KM-1' TO 'KM-96' - 'MO-1' TO 'MO-96' - 'OQ-1' TO 'OQ-96' - 'QS-1' TO 'QS-96' - 'SU-1' TO 'SU-96' - 'UW-1' TO 'UW-96' - 'WY-1' TO 'WY-96' - 'YAA-1' TO 'YAA-96' - 'AACC-1' TO 'AACC-96' - 'CCEE-1' TO 'CCEE-96' - 'EEGG-1' TO 'EEGG-96' - 'GGII-1' TO 'GGII-96' DEN 8.40E-05 - 'AC-1' TO 'AC-96' - 'CE-1' TO 'CE-96' - 'EG-1' TO 'EG-96' - 'GI-1' TO 'GI-96' -

336
'IK-1' TO 'IK-96' - 'KM-1' TO 'KM-96' - 'MO-1' TO 'MO-96' - 'OQ-1' TO 'OQ-96' - 'QS-1' TO 'QS-96' - 'SU-1' TO 'SU-96' - 'UW-1' TO 'UW-96' - 'WY-1' TO 'WY-96' - 'YAA-1' TO 'YAA-96' - 'AACC-1' TO 'AACC-96' - 'CCEE-1' TO 'CCEE-96' - 'EEGG-1' TO 'EEGG-96' - 'GGII-1' TO 'GGII-96' CTE 5.50E-06 - 'AC-1' TO 'AC-96' - 'CE-1' TO 'CE-96' - 'EG-1' TO 'EG-96' - 'GI-1' TO 'GI-96' - 'IK-1' TO 'IK-96' - 'KM-1' TO 'KM-96' - 'MO-1' TO 'MO-96' - 'OQ-1' TO 'OQ-96' - 'QS-1' TO 'QS-96' - 'SU-1' TO 'SU-96' - 'UW-1' TO 'UW-96' - 'WY-1' TO 'WY-96' - 'YAA-1' TO 'YAA-96' - 'AACC-1' TO 'AACC-96' - 'CCEE-1' TO 'CCEE-96' - 'EEGG-1' TO 'EEGG-96' - 'GGII-1' TO 'GGII-96' $$===================================================================== $$ SPECIFY TEMPERATURE LOADINGS NOTE: -980 F IS EQUIVALENT TO 0.67*fpu $$===================================================================== LOADING 'TRANSFER' '-980 TEMPERATURE CHANGE' MEMBER TEMPERATURE LOADS 'STRND0' TO 'STRND192' AXIAL -980 $$===================================================================== $$ EXECUTE NONLINEAR ANALYSIS $$===================================================================== MAXIMUM NUMBER OF CYCLES 10 CONVERGENCE TOL 0.001 NONLINEAR ANALYSIS LIST FORCES EXISTING -
337
'STRND0' TO 'STRND192' LIST DISPLACEMENTS - 'EE1' 'EEd1'