graad 12 national senior certificate grade 11...grade 11 economics p2 ar 2013 national senior...
TRANSCRIPT
Copyright reserved Please turn over
MARKS: 150 TIME: 2 hours
This question paper consists of 12 pages.
GRADE 11
ECONOMICS P2
EXEMPLAR 2013
NATIONAL SENIOR CERTIFICATE
GRAAD 12

Economics/P2 DBE/2013 NSC – Grade 11 Exemplar
Copyright reserved Please turn over
2
INSTRUCTIONS AND INFORMATION 1. Answer FOUR questions as follows in the ANSWER BOOK:
SECTION A: COMPULSORY SECTION B: Answer any TWO of the three questions. SECTION C: Answer ONE of the two questions.
2. Answer only the required number of questions. Answers in excess of the
required number will NOT be marked.
3. Answer the questions in full sentences and ensure that the format, content
and context of your responses comply with the cognitive requirements of the questions.
4. Number the answers correctly according to the numbering system used in this
question paper.
5. Write the question number above each answer. 6. 7.
Read the questions carefully. Start EACH question on a NEW page.
8. Leave 2–3 lines between subsections of questions. 9. Use only black or blue ink. 10. You may use a non-programmable pocket calculator. 11. Write neatly and legibly.

Economics/P2 DBE/2013 NSC – Grade 11 Exemplar
Copyright reserved Please turn over
3
SECTION A (COMPULSORY) QUESTION 1 30 MARKS – 15 MINUTES 1.1 Various options are provided as possible answers to the following questions.
Choose the correct answer and write only the letter (A–C) next to the question number (1.1.1–1.1.8) in the ANSWER BOOK.
1.1.1 The products of a monopolistic competitor is … A
B C
homogenous. differentiated. the same.
1.1.2 A decrease in the price of chicken will result in a … the demand
curve.
A
B C
movement on shift to the left of shift to the right of
1.1.3 The income elasticity of demand for an inferior good, for example
paraffin, will be …
A
B C
less than 0. less than 1. greater than 1.
1.1.4 An increase in the price of butter will result in the demand for
margarine …
A
B C
increasing. decreasing. remaining the same.
1.1.5 Which ONE of the following is responsible for the depletion of the
ozone layer?
A
B C
Ultraviolet rays Nitrogen Carbon dioxide
1.1.6 Income is most unequally distributed in … A
B C
Switzerland. South Africa. Germany.
Economics/P2 DBE/2013 NSC – Grade 11 Exemplar
Copyright reserved Please turn over
4
1.1.7 In South Africa the removal of household waste is the responsibility
of the … government.
A
B C
local provincial central
1.1.8 The cycle of poverty is often characterised by … A
B C
high crime rates. a high life expectancy. low mortality rates. (8 x 2)
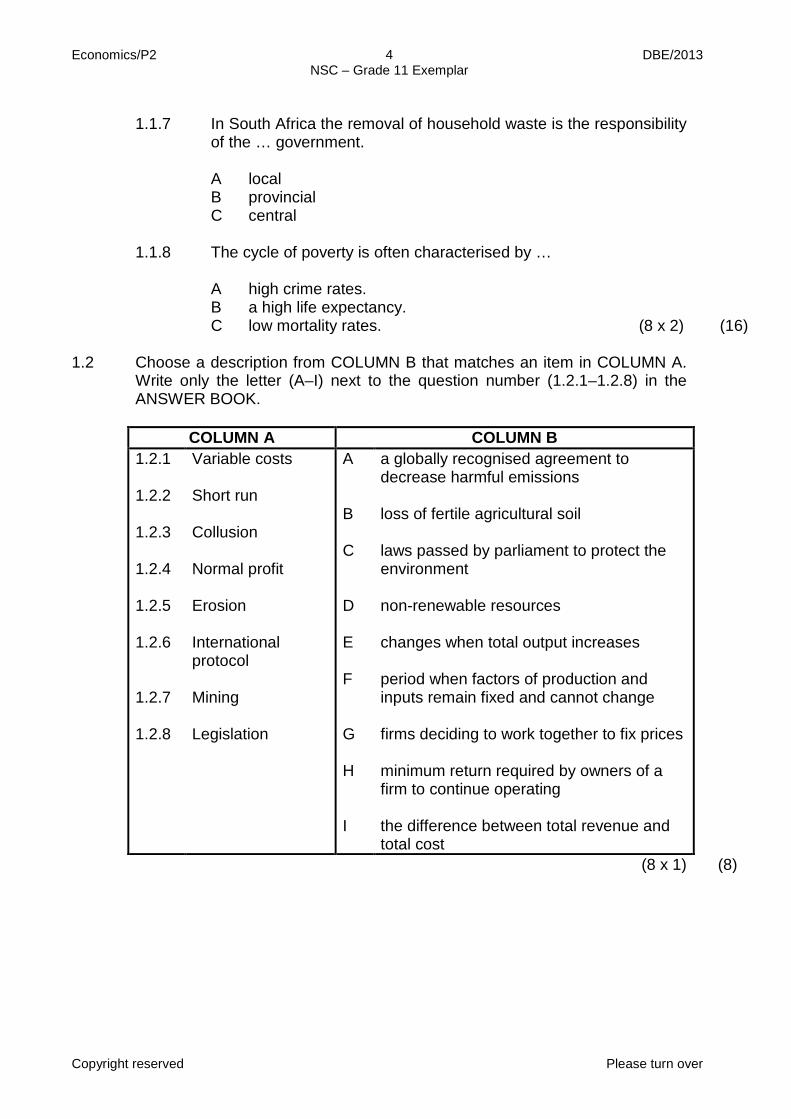
(16) 1.2 Choose a description from COLUMN B that matches an item in COLUMN A.
Write only the letter (A–I) next to the question number (1.2.1–1.2.8) in the ANSWER BOOK.
COLUMN A COLUMN B
1.2.1 1.2.2 1.2.3 1.2.4 1.2.5 1.2.6 1.2.7 1.2.8
Variable costs Short run Collusion Normal profit Erosion International protocol Mining Legislation
A B C D E F G H I
a globally recognised agreement to decrease harmful emissions loss of fertile agricultural soil laws passed by parliament to protect the environment non-renewable resources changes when total output increases period when factors of production and inputs remain fixed and cannot change firms deciding to work together to fix prices minimum return required by owners of a firm to continue operating the difference between total revenue and total cost
(8 x 1) (8)

Economics/P2 DBE/2013 NSC – Grade 11 Exemplar
Copyright reserved Please turn over
5
1.3 Give ONE word/term for each of the following descriptions. Write only the
word/term next to the question number (1.3.1–1.3.6) in the ANSWER BOOK.
1.3.1 Price wars are a characteristic of this type of market 1.3.2 It measures the responsiveness of consumers to price changes 1.3.3 Goods that are used jointly to satisfy a want 1.3.4 Greenhouse gases form part of this type of pollution 1.3.5 Measured in terms of absolute income levels 1.3.6 The removal of barriers to global trade (6 x 1) (6)
TOTAL SECTION A: 30
Economics/P2 DBE/2013 NSC – Grade 11 Exemplar
Copyright reserved Please turn over
6
SECTION B Answer any TWO of the three questions from this section in the ANSWER BOOK. QUESTION 2: MICROECONOMICS 40 MARKS – 25 MINUTES 2.1 Answer the following questions. 2.1.1 Name any TWO objectives of businesses. (2 x 1) (2) 2.1.2 Calculate the marginal cost if output increases from 60 to
80 and total cost increases from R1 000 to R2 000.
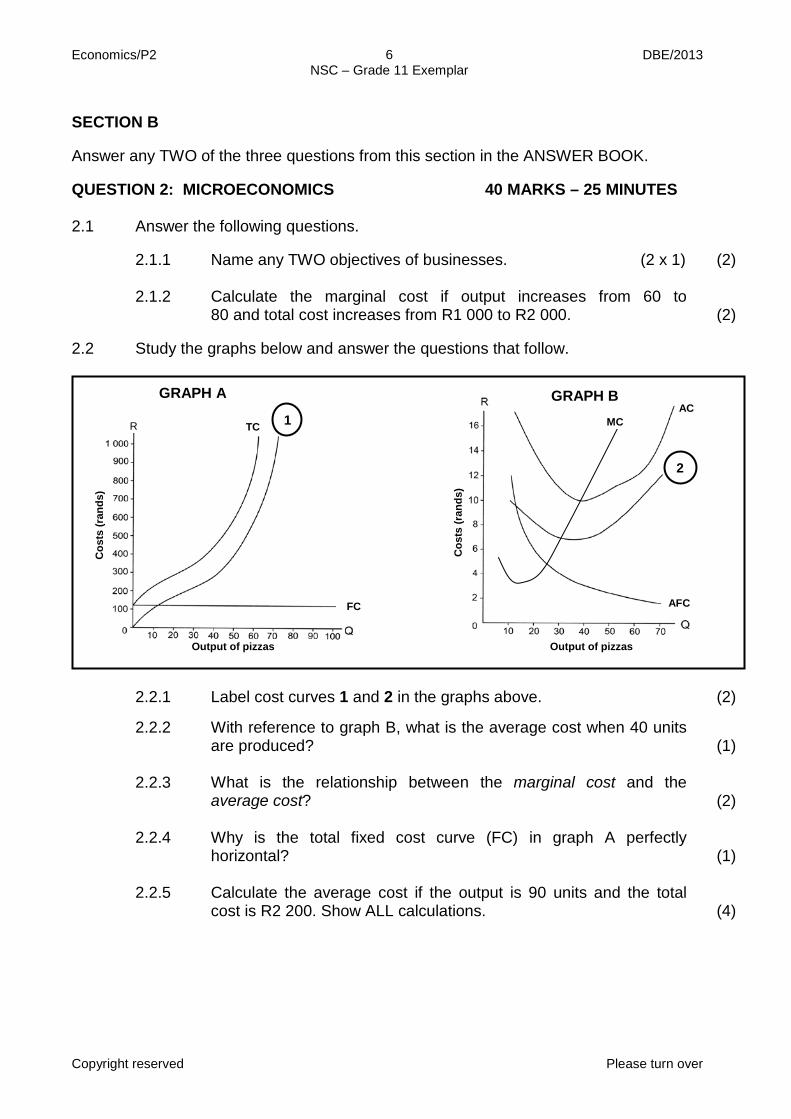
(2) 2.2 Study the graphs below and answer the questions that follow.
2.2.1 Label cost curves 1 and 2 in the graphs above. (2) 2.2.2
2.2.3
With reference to graph B, what is the average cost when 40 units are produced? What is the relationship between the marginal cost and the average cost?
(1) (2)
2.2.4 2.2.5
Why is the total fixed cost curve (FC) in graph A perfectly horizontal? Calculate the average cost if the output is 90 units and the total cost is R2 200. Show ALL calculations.
(1) (4)
1
2
GRAPH A GRAPH B
TC
FC
Cos
ts (r
ands
)
Cos
ts (r
ands
)
MC AC
Output of pizzas
AFC
R
Output of pizzas
Economics/P2 DBE/2013 NSC – Grade 11 Exemplar
Copyright reserved Please turn over
7
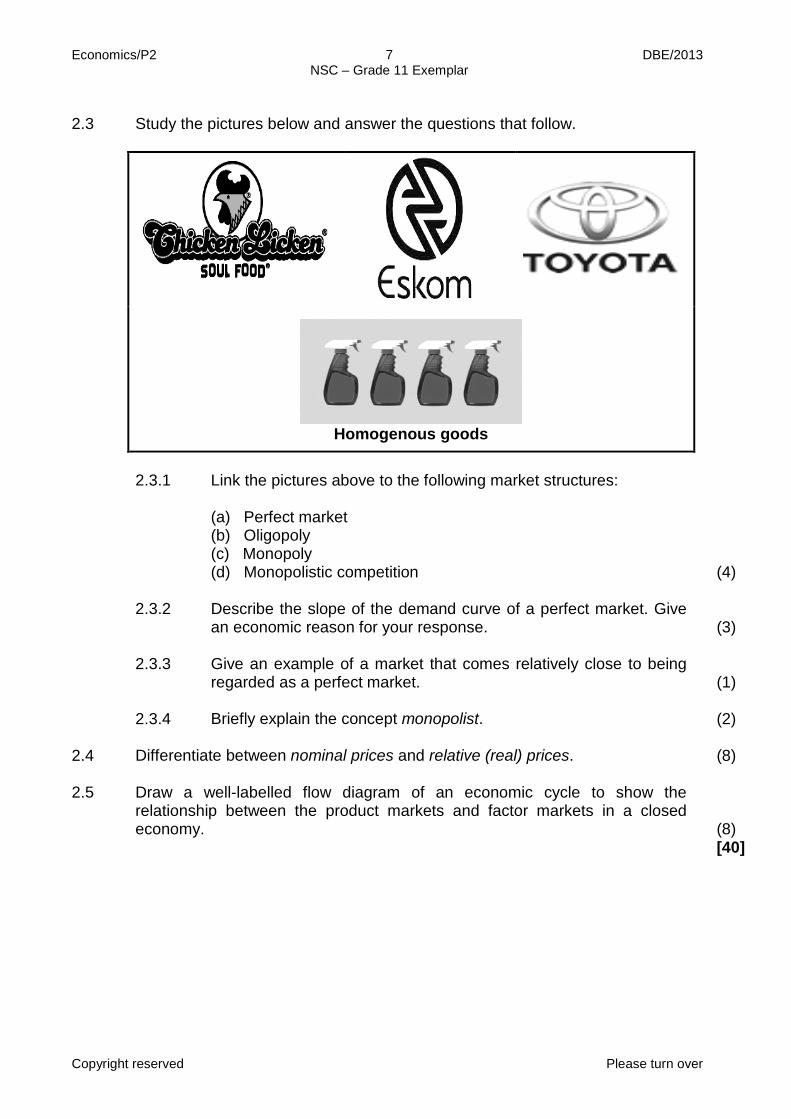
2.3 Study the pictures below and answer the questions that follow.
Homogenous goods
2.3.1 Link the pictures above to the following market structures:
(a) Perfect market (b) Oligopoly (c) Monopoly (d) Monopolistic competition
(4)
2.3.2 Describe the slope of the demand curve of a perfect market. Give
an economic reason for your response.
(3) 2.3.3 Give an example of a market that comes relatively close to being
regarded as a perfect market.
(1) 2.3.4 Briefly explain the concept monopolist. (2) 2.4 Differentiate between nominal prices and relative (real) prices. (8) 2.5 Draw a well-labelled flow diagram of an economic cycle to show the
relationship between the product markets and factor markets in a closed economy.
(8) [40]
Economics/P2 DBE/2013 NSC – Grade 11 Exemplar
Copyright reserved Please turn over
8
QUESTION 3: CONTEMPORARY ECONOMIC ISSUES 40 MARKS – 25 MINUTES 3.1 Answer the following questions. 3.1.1 Name any TWO disadvantages of free trade. (2 x 1) (2) 3.1.2 Why do you think the ethnic and indigenous groups suffer more
from poverty than other groups? (1 x 2)
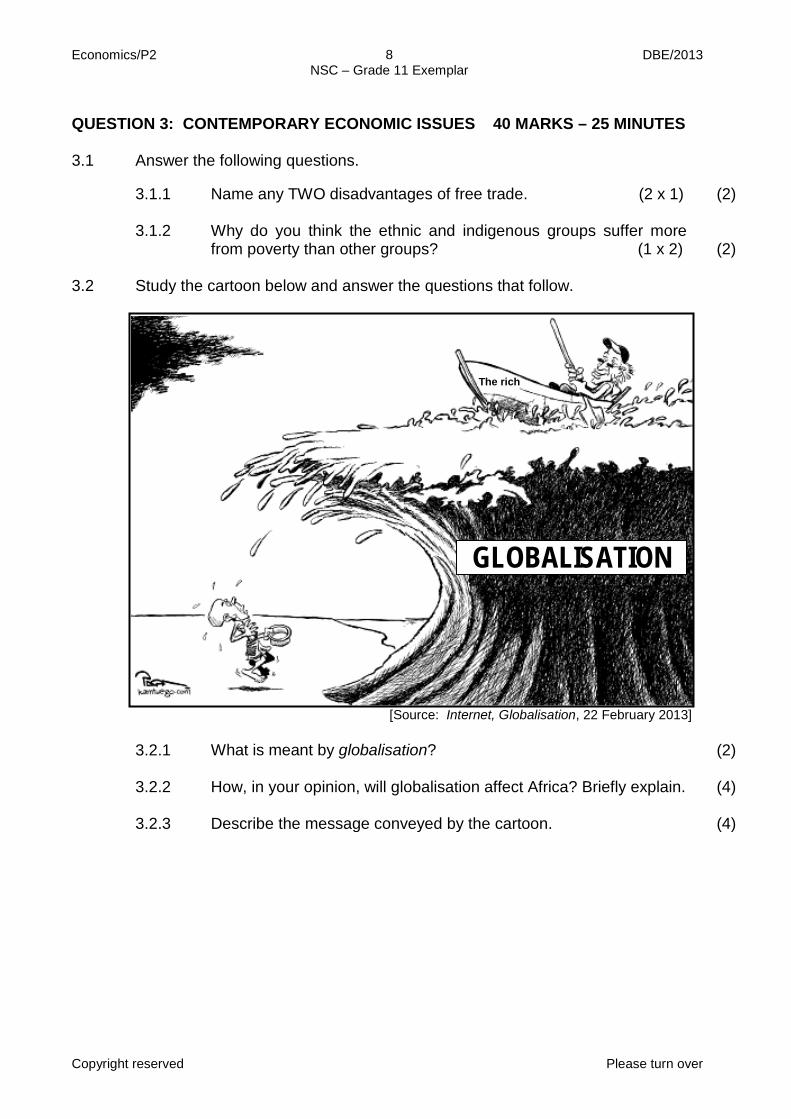
(2) 3.2 Study the cartoon below and answer the questions that follow.
[Source: Internet, Globalisation, 22 February 2013] 3.2.1 What is meant by globalisation? (2) 3.2.2 How, in your opinion, will globalisation affect Africa? Briefly explain. (4) 3.2.3 Describe the message conveyed by the cartoon. (4)
The rich
GLOBALISATION

Economics/P2 DBE/2013 NSC – Grade 11 Exemplar
Copyright reserved Please turn over
9
3.3 Study the extract below and answer the questions that follow.
FUEL FOR THOUGHT
Biofuel is an energy source that may help address the supply and demand dilemma versus modern world overdependence on petroleum and petroleum-based appliances. Biofuel also gives off cleaner emissions of carbon dioxide and sulphur oxide, two greenhouse gases that are responsible for climatic change and global warming. It is also seen as a renewable resource because it can be replenished in a short period of time. Brazil and Malaysia is currently responsible for the destruction of vast areas of rainforest to make way for palm-oil plantations. However, there is a current debate on food versus fuel. The question remains whether it is appropriate to use food crops to create alternative fuel instead of fulfilling world food demand. Failure to accord the importance of the agricultural sector, distorted agricultural markets and dismantling policies that support domestic markets in developing countries are by far more accountable for the present food crisis than biofuels.
[Adapted: Skyways, February 2013]
3.3.1 Define the concept renewable resource. (2)
3.3.2 How can biofuel as an energy source alleviate the demand for petroleum?
(2)
3.3.3 What effect will the destruction of rain forests in Brazil have on
climate change?
(2) 3.3.4 Briefly explain the cause of the present food crisis. (2 x 2) (4) 3.4 Briefly discuss any TWO groups that are most negatively affected by poverty.
(2 x 4)
(8) 3.5 Explain the negative effect of subsidies granted by developed countries on
the economies of developing countries. (2 x 4)
(8) [40]
Economics/P2 DBE/2013 NSC – Grade 11 Exemplar
Copyright reserved Please turn over
10
QUESTION 4: MICROECONOMICS AND CONTEMPORARY ECONOMIC ISSUES 40 MARKS – 25 MINUTES
4.1 Answer the following questions. 4.1.1 State any TWO factors that influence the supply of a product.
(2 x 1)
(2) 4.1.2 What will the producer do if total cost exceeds total revenue?
(1 x 2)
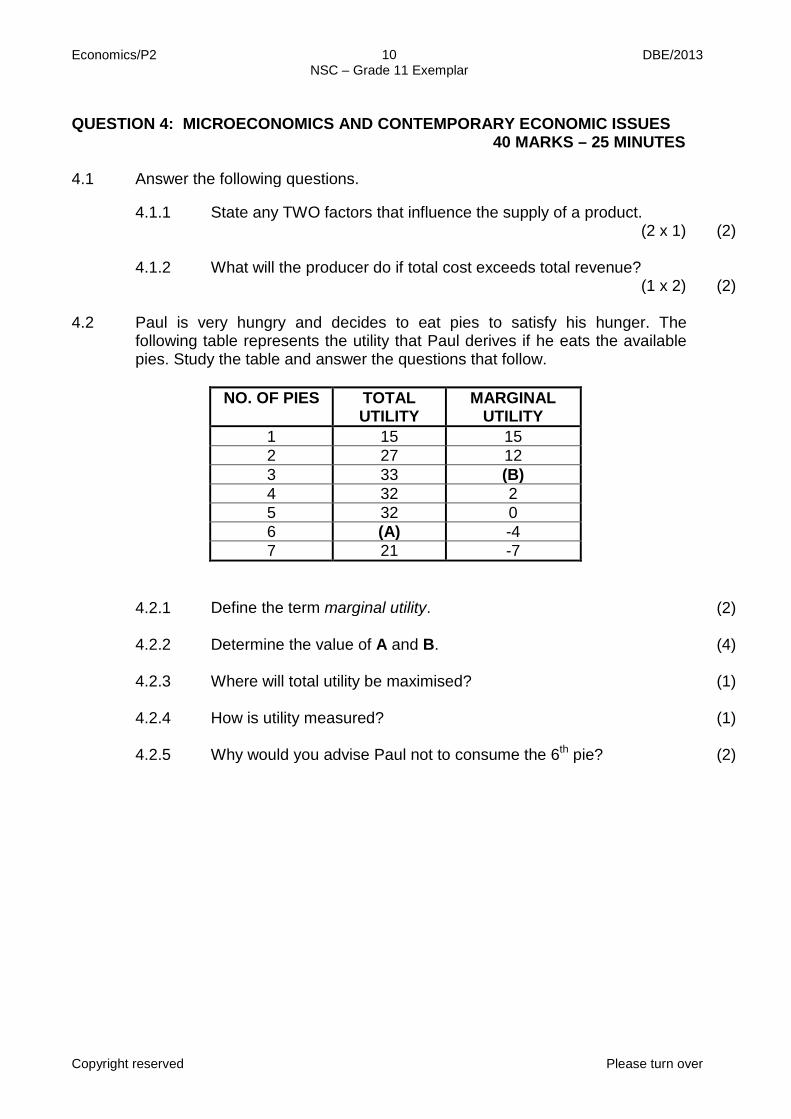
(2) 4.2 Paul is very hungry and decides to eat pies to satisfy his hunger. The
following table represents the utility that Paul derives if he eats the available pies. Study the table and answer the questions that follow.
NO. OF PIES TOTAL
UTILITY MARGINAL
UTILITY 1 15 15 2 27 12 3 33 (B) 4 32 2 5 32 0 6 (A) -4 7 21 -7
4.2.1 Define the term marginal utility. (2) 4.2.2 Determine the value of A and B. (4) 4.2.3 Where will total utility be maximised? (1) 4.2.4
4.2.5
How is utility measured? Why would you advise Paul not to consume the 6th pie?
(1) (2)

Economics/P2 DBE/2013 NSC – Grade 11 Exemplar
Copyright reserved Please turn over
11
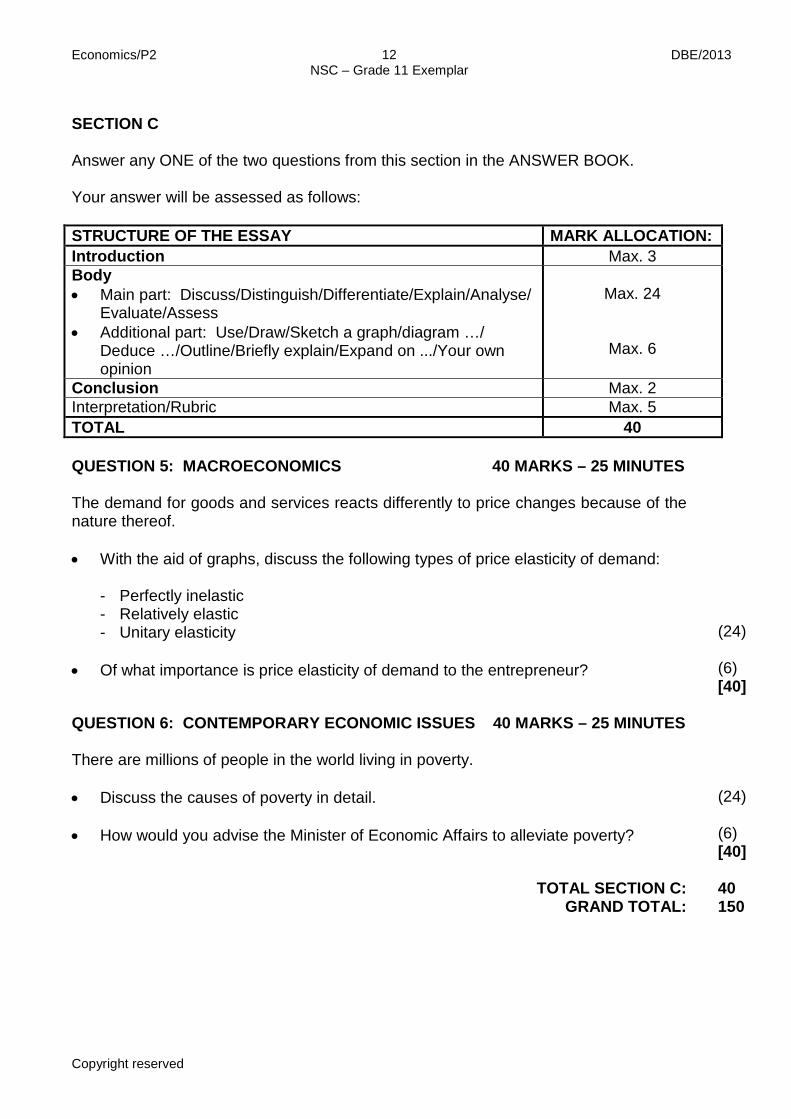
4.3 Study the cartoon below and answer the questions that follow.
[Source: Internet, Environmental Deterioration, 2013] 4.3.1 What is meant by environmental deterioration? (2) 4.3.2 What is the message conveyed by the cartoon? (2) 4.3.3 How can agricultural development contribute to deforestation? (4) 4.3.4 How can the Department of Education help to solve the problem of
environmental deterioration?
(2) 4.4 Explain the three phases of the firm's long-run cost curve indicated in the
graph below.
(4 x 2)
(8)
4.5 Explain how the International Monetary Fund and the World Bank contribute
to globalisation. (2 x 4)
(8) [40]
TOTAL SECTION B: 80
Output (period)
Cos
ts (u
nit)
Economies of scale Constant costs
Diseconomies of scale
Economics/P2 DBE/2013 NSC – Grade 11 Exemplar
Copyright reserved
12
SECTION C Answer any ONE of the two questions from this section in the ANSWER BOOK. Your answer will be assessed as follows:
STRUCTURE OF THE ESSAY MARK ALLOCATION: Introduction Max. 3 Body • Main part: Discuss/Distinguish/Differentiate/Explain/Analyse/
Evaluate/Assess • Additional part: Use/Draw/Sketch a graph/diagram …/
Deduce …/Outline/Briefly explain/Expand on .../Your own opinion
Max. 24
Max. 6
Conclusion Max. 2 Interpretation/Rubric Max. 5 TOTAL 40 QUESTION 5: MACROECONOMICS 40 MARKS – 25 MINUTES The demand for goods and services reacts differently to price changes because of the nature thereof. • With the aid of graphs, discuss the following types of price elasticity of demand:
- Perfectly inelastic - Relatively elastic - Unitary elasticity
• Of what importance is price elasticity of demand to the entrepreneur?
(24) (6) [40]
QUESTION 6: CONTEMPORARY ECONOMIC ISSUES 40 MARKS – 25 MINUTES There are millions of people in the world living in poverty. • Discuss the causes of poverty in detail.
• How would you advise the Minister of Economic Affairs to alleviate poverty?
(24) (6) [40]
TOTAL SECTION C: 40
GRAND TOTAL: 150