gps total electron content measurements at low … · gps total electron content measurements at...
TRANSCRIPT
GPS Total Electron Content measurements at low latitudes inBrazil for low solar activity
Aracy Mendes da Costa1, J. Williams Vilas Boas1 and Edvaldo S. da Fonseca Junior2
1 INPE, CP. 515, S. José dos Campos, SP-Brasil2 EPUSP, CP. 61548, São Paulo, SP-Brasil
Received: March 31, 2002; accepted: June 4, 2002
RESUMENSe calcularon las variaciones del número total de electrones en la ionosfera (TEC) usando datos de GPS, obtenidos en la
estación de baja latitud de Presidente Prudente, Brasil (22.1° S; 51.4° W) en 1997, un periodo de baja actividad solar. Se presentandos promedios horarios durante este periodo. Se discuten las variaciones diarias, estacionales, debidas a la actividad solar y laAnomalía Ecuatorial. Los promedios diurnos de TEC se comparan con las predicciones del modelo IRI-95 para los meses de losequinoccios y los solsticios y se muestra que IRI-95 sistemáticamente sobreestima los valores observados. Los aumentos pre-nocturnos de TEC se observaron durante todo el año excepto en mayo y junio. Los valores de TEC medidos reproducen la mismatendencia general de los valores TEC observados en Cachoeira Paulista, Brasil (22.5° S; 45° W). El efecto “fuente” parece sermás efectivo en Presidente Prudente debido a su menor latitud magnética. La correlación entre los valores experimentales de TECy el flujo solar durante la baja actividad (62 < F10.7 < 116 unidades de flujo) enfatiza que el modelo IRI para bajas latitudes yperiodos de baja actividad solar es inadecuado. Los resultados aquí presentados son los primeros obtenidos usando la técnicaTEC-GPS sobre la parte suroeste de Brasil.
PALABRAS CLAVE: GPS, Número Total de Electrones, Anomalía Ecuatorial.
ABSTRACTVariations of ionospheric Total Electron Content (TEC) have been calculated using GPS data at station Presidente Prudente,
Brazil (22.1° S; 51.4° W) in 1997, a period of low solar activity. Two hourly TEC averages are presented for the period. Diurnal,seasonal, solar activity variations and Equatorial Anomaly effects are discussed. TEC diurnal means compared with IRI 95 predic-tions for equinox and solstice months show that IRI-95 systematically overestimates the observed values. Pre-midnight TECenhancements were observed all over the year, except in May and June. The TEC values reproduce the same general trend of TECobservations over Cachoeira Paulista, Brazil (22.5° S; 45° W). The “fountain” effect seems to be more effective at PresidentePrudente because of its lower magnetic dip latitude. A correlation between TEC experimental values and low solar flux (62 <F10.7 < 116 flux units) emphasizes the inadequacy of IRI to model low latitude TEC values at low solar activity periods. These arethe first results obtained using TEC-GPS technique for total electron content measurement in southwestern Brazil.
KEY WORDS: GPS, Total Electron Content, Equatorial Anomaly.
nique (see Titheridge, 1973 and the references cited). As arule these measurements were restricted to the north hemi-sphere and to mid- to high latitudes. More recently, mea-surements have been extended to the south hemisphere andto low latitudes and a great variety of new results have beengathered (see for example: Ezquer and Adler, 1989; Balan etal., 1994; Batista et al., 1994; Huang and Cheng, 1995; Su etal., 1995; Abdu et al., 1996; Ganguly et al., 2001; Sethi etal., 2001).
Total electron content observations using Global Posi-tioning System (GPS) satellites are becoming a very power-ful and valuable tool for investigating global and local iono-spheric structures (Davies and Hartmann, 1997; Breed et al.,1998; Hernandez-Pajares, et al., 1999) because the world-
INTRODUCTION
The ionosphere is a dispersive medium for electromag-netic waves. The regular refraction of a radio signals passingthrough the ionosphere can be calculated provided that theionosphere has a symmetric distribution of electron density,the radio signal frequency is substantially above the F-layer’scritical frequency and the layer thickness is substantiallysmaller than its radius of curvature. Refraction then will de-pend on the radio signals frequency, on the total electroncontent (TEC) of the ionosphere and on the angle of inci-dence of the radio wave on the ionospheric layer.
Since 1958 measurements of the electron content ofthe ionosphere have been made using Faraday rotation tech-
129
Geofísica Internacional (2004), Vol. 43, Num. 1, pp. 129-137

A. Mendez da Costa et al.
130
wide coverage provided by the 27 satellites constellation andthe increasing number of networks available such as the In-ternational Geodynamics Service (IGS) for global survey andlocal networks as the Geographycal Survey Institute in Ja-pan (Saito et al., 1998), the Australian Surveying and LandInformation Group (AUSLIG) in Australia and the BrazilianNetwork for GPS Continuous Monitoring (RBMC) settledup and coordinated by the Brazilian Institute of Geographyand Statistics (IBGE) in operation since 1996 (Fortes et al.,1998).
The International Reference Ionosphere (IRI) is the in-ternational standard for the specification of ionospheric den-sities and temperatures. It was developed and is being im-proved-updated by a joint working group of the InternationalUnion of Radio Science (URSI) and the Committee on SpaceResearch (COSPAR) (Bilitza, 1997; Bilitza, 2001). For agiven location, time and date, IRI describes the electron den-sity, electron temperature, ion temperature, ion composition,and the electron content in the altitude range from 60 km to2000 km. It provides monthly averages in the non-auroralionosphere for magnetically quiet conditions.
The highest TEC in the world occurs in the equatorialregion. The maximum TEC values are not found at the equa-tor, but rather in the so-called Equatorial Anomaly regionlocated at approximately ± 17° from the magnetic equator.Several authors have reported the ionospheric instabilitiesobserved in the TEC measurements in this region, associ-ated to scintillations (Kumar and Gwal, 2000), nighttimeenhancements (Balan et al., 1994), solar cycle dependence(Huang and Cheng, 1995) and for the Brazilian region (Abduet al., 1996).
The purpose of this work is to describe the local iono-spheric conditions for a low latitude station in Brazil, usinga dual frequency GPS receiver to calculate the ionospherictotal electron content during a period of low solar activity,1997. GPS data received at Presidente Prudente (Brazil)(22.1° S; 51.4° W), were converted to vertical TEC valuesand compared to IRI-95 model for equinox, summer andwinter months. Diurnal, seasonal, and solar cycle depen-dences of TEC are clearly seen. The resulting plots were com-pared to TEC measurements obtained in Cachoeira Paulista- CP (Souza et al., 2002) and in Australia (Goodwin et al.,1995). An extensive search in the literature has revealed thatthese are the first results obtained to describe the ionosphereover the southwestern part of Brazil (Presidente Prudente),using GPS signals.
The solar radio flux (F10.7) values used in this studywere taken from Internet site NASA/NOAA. The minimumand maximum flux values recorded for 1997 were 62 and116 W/m2/Hz respectively.
EXPERIMENTAL DATA AND ANALYSIS
The RBMC network includes thirteen receivers, twoof them (Brasília and Fortaleza) are part of the IGS. TECmeasurements presented in this study were obtained fromGPS signals received in Presidente Prudente (dip latitude12.3° S) during 1997. This RBMC-GPS station started tooperate in 1996 and these were the first long term GPS datacontinuously recorded. Figure 1 shows the location of theGPS stations in Brazil. Presidente Prudente is indicated asPP and the magnetic dip equator is shown in the figure as areference.
Fig. 1. GPS location of dual-frequency receiver sites of the RBMCin Brazil. GPS signals analyzed in this study were received atPresidente Prudente (PP in the map). The approximate position of
the magnetic dipole equator is also indicated.
Although 1997 was at the beginning of the ascendingphase of the 23° solar cycle, there were only four severemagnetic storms (Dst index < -100 nT) reported in the pe-riod (April 22, May 15, October 11 and November 8). Be-cause of the magnetically quiet conditions all over the yearthe data were indistinctly analyzed without any further cor-rection for the four periods mentioned.
TEC Measurements
The vertical total electron content at a certain receivingstation is assumed to be mainly a function of the sphericaldistance to the Sun, which depends on both the incident so-lar radiation flux and the time, and the magnetic latitude ofthe station.
The differential time delay technique allows the calcu-lation of the slant TEC (Horvarth and Essex, 2000) of the

Electron content measurements in Brazil for low solar activity
131
combined ionosphere and plasmasphere up to 20,000 km.The measured slant TEC for each “visible” satellite at a givenpoint and time is then converted to vertical TEC following asimilar procedure given in details by Horvath and Essex(2000) and Breed et al. (1998). In the present study a singlethin shell of infinitesimal thickness situated at a median iono-spheric height of 400 km above the earth surface was as-sumed.
Values of TEC were obtained using differential phasemeasurements combined with the absolute differential timedelay measurements in order to improve the accuracy of theresulting values. Although differential phase measurementsare nonabsolute, they are much more precise than differen-tial time delay measurements which can carry inaccuraciesarising from the signal that contains pseudorandom noise codeand multipath reception (Breed et al., 1998).
Local ionospheric model
The ionospheric local model applied to the vicinitiesof the GPS station operating with dual frequency receiver(Schaer et al., 1995) can be represented by
E( ,s) s s whereβ β β= − −==
∑∑ Enm on
om
m
m
n
n
( ) ( ) ,maxmax
00
nmax and mmax represents the maximum degree of abidimensional expansion of Taylor series. Enm are unknowncoefficients of TEC (local model parameters to be estimated),βo and so are the receiver coordinates and β and s stand re-spectively for the latitude and longitude of the subionosphericpoints for a median ionospheric height of 400 km. (Thesubionospheric point is the projection on the ground imme-diately below the point where the line of sight from satelliteto receiver intersects the 400 km shell).
TEC data have been processed using a software knownas Bernese GPS Software, version 4.2, developed at BernUniversity (Switzerland) for geodetic purposes, allowing ahigh accuracy for positioning calculations (Rothacher et al.,1996). In the processing sequence the software checks theintegrity of daily files, splits the 24 hours Rinex format filesin two files of 12 hours each and converts the files to Berneseformat. The observing masking angle is then chosen (15°)and the TEC is calculated at two hours intervals to assuresmall rms (< 0.5 TECU). The TEC is computed in TEC units(TECU) where 1 TECU = 1 x 10¹⁶ electrons. m-16.
Diurnal variations
Two hourly diurnal means of TEC have been determinedas a function of time of day for Presidente Prudente, cen-
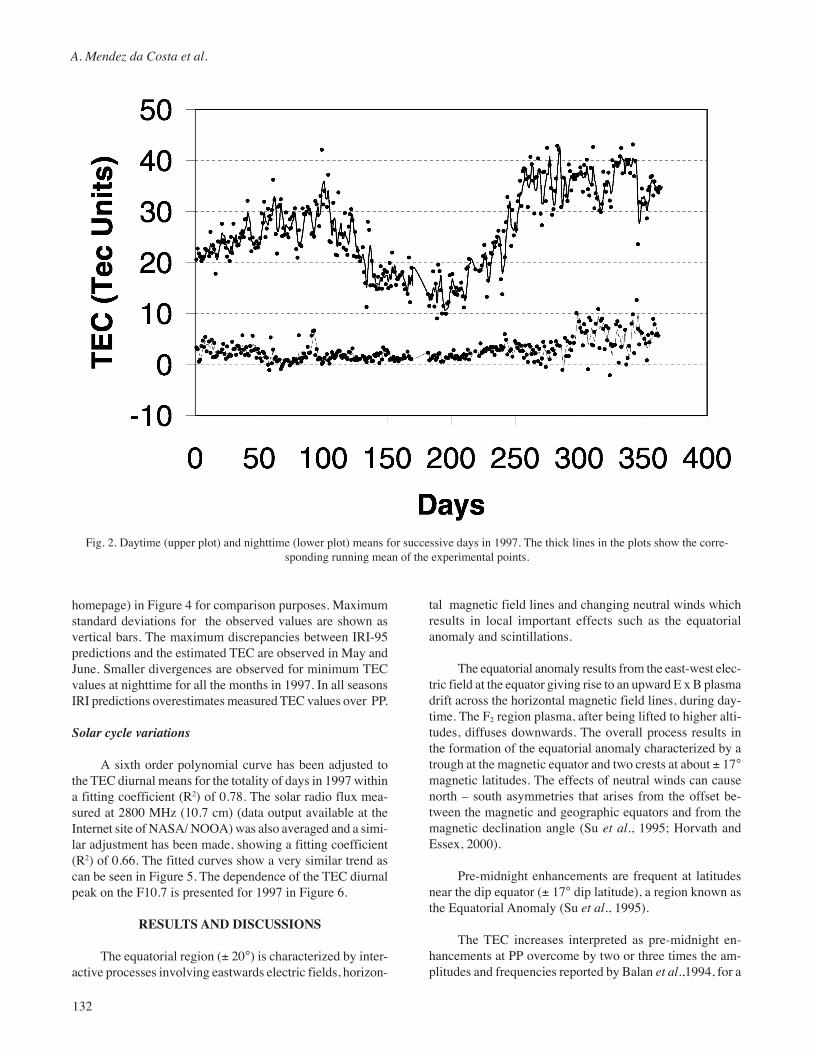
tered on 1200 and 2400 LT, i.e., (UT – 3) hours from Januaryto December, 1997. Figure 2 shows the daytime (upper plot)and nighttime (lower plot) daily means for 1997. The thicklines represent the corresponding running mean of the points.Diurnal peak values varied from a minimum of 10 TECU(July 12 - 17) to a maximum of 43 TECU (Nov. 25 – Dec. 5).In the plots, missing points due to technical problems, powerfailure or cycleslips due to loss of tracking signal representless than 10% of the days in 1997.
Diurnal TEC peaks occurrence varied slightly frommonth to month from 1700 to 1900 UT. In some summerdays, the peaks were displaced to 21 UT. After a previousvisualization of the diurnal dispersion taken from plots su-perposition each fifteen days, the peak to peak daytime varia-tion for a fortnight was obtained and this values used to de-fine the daytime interval of the TEC “plateau”. The samecriteria have been used to define the nighttime stable inter-vals. Figure 3 shows an example of the daytime variations(diurnal plots superposed) for 28 days in September, 1997,when the dispersion range from peak to peak reached a maxi-mum value of 10 TECU. In Figure 3 it can also be seen thatthe dispersion of diurnal plots shows a minimum just afterlocal sunrise.
Double peaked maximum of TEC values were observedin some days of equinoctial months or close to them (Febru-ary, March, April, October) and also in winter (June).
Nighttime minimum values rarely overcome 5 TECU,ranging as a rule from zero or very close to zero to 3 TECUall over the year. Minimum diurnal values in general occurredbetween 0700 and 0900 UT. Nighttime means are less reli-able because their magnitudes of approximately 5 TECU arecomparable with the limit accuracy of GPS-TEC, a fewTECU, after Davis and Harmann, 1997.
Pre-midnight enhancements have been observed sys-tematically all over the year (at least in 80% of the availabledays), with maximum amplitude of 10 TECU in September/October and minimum amplitude by the end of January andAugust (3-5 TECU). They are practically absent in May andJune.
Seasonal variations
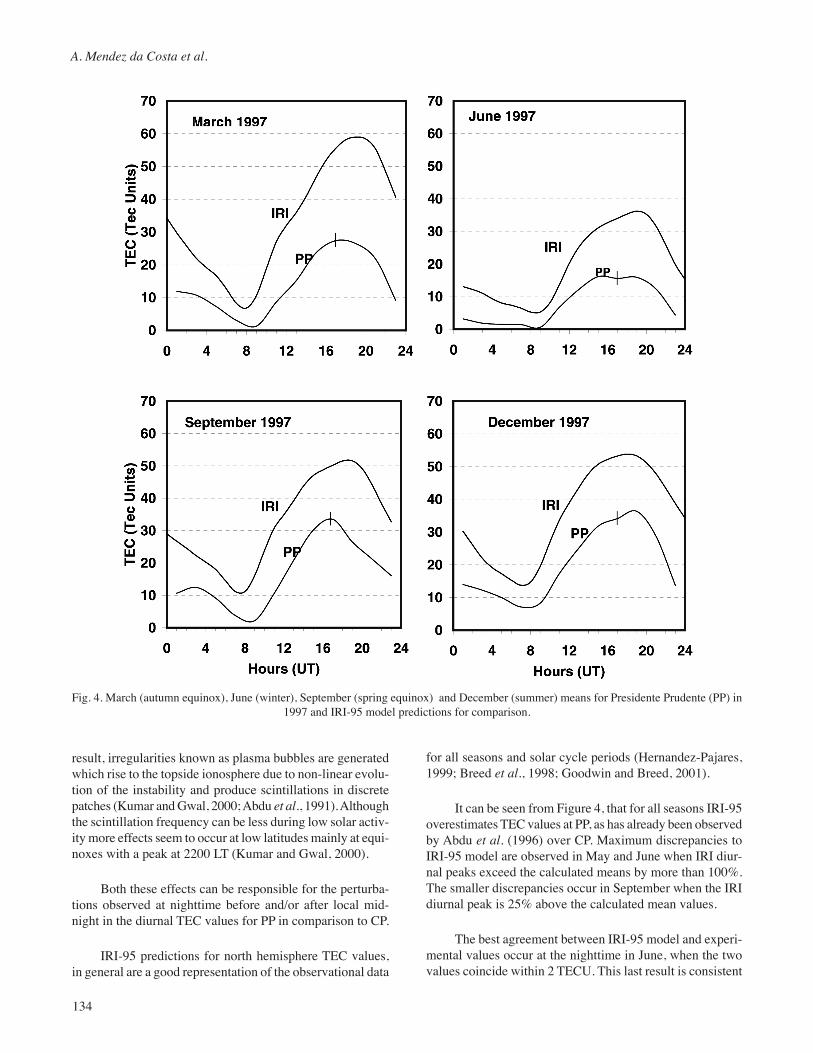
March, June, September and December were taken asrepresentative months for autumn equinox, winter, springequinox and summer respectively. Monthly TEC means havebeen calculated using the data available for each month: 25,14, 28 and 21 days respectively for March, June, Septemberand December.
Estimated values have been plotted together with IRI-95 predictions (data available from Internet NSSDC
A. Mendez da Costa et al.
132
homepage) in Figure 4 for comparison purposes. Maximumstandard deviations for the observed values are shown asvertical bars. The maximum discrepancies between IRI-95predictions and the estimated TEC are observed in May andJune. Smaller divergences are observed for minimum TECvalues at nighttime for all the months in 1997. In all seasonsIRI predictions overestimates measured TEC values over PP.
Solar cycle variations
A sixth order polynomial curve has been adjusted tothe TEC diurnal means for the totality of days in 1997 withina fitting coefficient (R2) of 0.78. The solar radio flux mea-sured at 2800 MHz (10.7 cm) (data output available at theInternet site of NASA/ NOOA) was also averaged and a simi-lar adjustment has been made, showing a fitting coefficient(R2) of 0.66. The fitted curves show a very similar trend ascan be seen in Figure 5. The dependence of the TEC diurnalpeak on the F10.7 is presented for 1997 in Figure 6.
RESULTS AND DISCUSSIONS
The equatorial region (± 20°) is characterized by inter-active processes involving eastwards electric fields, horizon-
tal magnetic field lines and changing neutral winds whichresults in local important effects such as the equatorialanomaly and scintillations.
The equatorial anomaly results from the east-west elec-tric field at the equator giving rise to an upward E x B plasmadrift across the horizontal magnetic field lines, during day-time. The F2 region plasma, after being lifted to higher alti-tudes, diffuses downwards. The overall process results inthe formation of the equatorial anomaly characterized by atrough at the magnetic equator and two crests at about ± 17°magnetic latitudes. The effects of neutral winds can causenorth – south asymmetries that arises from the offset be-tween the magnetic and geographic equators and from themagnetic declination angle (Su et al., 1995; Horvath andEssex, 2000).
Pre-midnight enhancements are frequent at latitudesnear the dip equator (± 17° dip latitude), a region known asthe Equatorial Anomaly (Su et al., 1995).
The TEC increases interpreted as pre-midnight en-hancements at PP overcome by two or three times the am-plitudes and frequencies reported by Balan et al.,1994, for a
Fig. 2. Daytime (upper plot) and nighttime (lower plot) means for successive days in 1997. The thick lines in the plots show the corre-sponding running mean of the experimental points.

Electron content measurements in Brazil for low solar activity
133
south hemisphere location in the equatorial anomaly (20° S)for a period of moderate solar activity. The authors also men-tion that enhancements are more frequent and stronger in thesouth hemisphere and that they occur mostly during Septem-ber to March. In PP, nighttime TEC enhancements are ob-served all over the year, but May and June. On the other hand,the nighttime enhancements observed in PP are of about thesame amplitude of those reported by Horvath and Essex (2000)for Guam (dip latitude 8° N) for low solar activity condi-tions.
Diurnal TEC values have been compared to measure-ments obtained at Cachoeira Paulista (CP) in Brazil (Souza etal., 2002). The TEC values at PP show a slightly higher am-plitude in all seasons for low solar activity. This behavior maybe a consequence of the particular location of CP (magneticdip latitude 12°). The latitudinal position of the anomaly crestdepends on the magnitude of the upward vertical drift at themagnetic equator. During low solar activity the anomaly crestmay be displaced northwards affecting more PP than CP.
The same seasonal asymmetry in the TEC diurnal peakvalues reported by Abdu et al. (1996) for CP is found in the
TEC observations at PP. The spring equinox shows largervalues than the autumn equinox, as can be seen from Figure4.
Although the protonospheric contribution to TEC ismostly noticeable at mid latitudes and during solar maximum,it is worthwhile to mention that a small amount of the TECestimated for PP may has build in a protonospheric contribu-tion not present in the ionospheric electron content (IEC).MacPherson et al. (2000) found a remarkable plasmasphericcontribution over Arecibo on a magnetically disturbed pe-riod (Jan. 9-10, 1997, Dst index of -78 nT). On the other hand,Makela et al. (2000) argue that for summer conditions, theplasmaspheric contribution to the TEC is of the order of 20%.MacPherson et al. (2000) believe that the reason for suchdifferences in plasmaspheric contributions is a seasonal ef-fect driven by the relative changes in the topside ion densi-ties which are reversed from winter to summer.
At latitudes closer to the magnetic equator, scintillationscan also occur during nighttime. The scintillation is basicallyassociated with spread-F occurrences. After local sunset, thebottom side of the F-region over the magnetic equator is sub-jected to gravitational Rayleigh-Taylor mechanisms. As a
Fig. 3. Superposition of the diurnal plots obtained in September, 1997 (28 days available). The maximum dispersion of plots is shown as abar at diurnal TEC peak.
A. Mendez da Costa et al.
134
result, irregularities known as plasma bubbles are generatedwhich rise to the topside ionosphere due to non-linear evolu-tion of the instability and produce scintillations in discretepatches (Kumar and Gwal, 2000; Abdu et al., 1991). Althoughthe scintillation frequency can be less during low solar activ-ity more effects seem to occur at low latitudes mainly at equi-noxes with a peak at 2200 LT (Kumar and Gwal, 2000).
Both these effects can be responsible for the perturba-tions observed at nighttime before and/or after local mid-night in the diurnal TEC values for PP in comparison to CP.
IRI-95 predictions for north hemisphere TEC values,in general are a good representation of the observational data
for all seasons and solar cycle periods (Hernandez-Pajares,1999; Breed et al., 1998; Goodwin and Breed, 2001).
It can be seen from Figure 4, that for all seasons IRI-95overestimates TEC values at PP, as has already been observedby Abdu et al. (1996) over CP. Maximum discrepancies toIRI-95 model are observed in May and June when IRI diur-nal peaks exceed the calculated means by more than 100%.The smaller discrepancies occur in September when the IRIdiurnal peak is 25% above the calculated mean values.
The best agreement between IRI-95 model and experi-mental values occur at the nighttime in June, when the twovalues coincide within 2 TECU. This last result is consistent
Fig. 4. March (autumn equinox), June (winter), September (spring equinox) and December (summer) means for Presidente Prudente (PP) in1997 and IRI-95 model predictions for comparison.

Electron content measurements in Brazil for low solar activity
135
with observations reported by Abdu et al. (1996) over CP.Similar discrepancies have also been observed by Sethi etal. (2001) for observations over Arecibo.
In Figure 5, the regularity in the general trend of thefitted curves is an indication of the sensibility of TEC tomodulations in the solar flux. Nevertheless, the relativelylarge and intense increases in solar flux that occurred on Sep-tember 9, November 4 and 28 did not show any additionalvariation in the corresponding total ionospheric electron con-tent. On November 8 a severe magnetic storm was reported(Dst index of - 110 nT at 0500 UT).
The TEC dependence on solar flux from 62 to 116 fluxunits, at 1700 UT, is shown in Figure 6, for 1997. In this caseit was not necessary to split the experimental points season-ally because of the low solar fluxes range. CorrespondingIRI-95 predictions, adjusted by the upper straight line, high-light an overestimation of about 20 TECU during all seasonsin 1997. These results show consistency with those presentedby Abdu et al. (1996) and expand largely the range for lowsolar fluxes.
FINAL REMARKS
• Estimated TEC values over PP during a low solar activityperiod are very similar to those measured over CachoeiraPaulista. Nevertheless, because of Presidente Prudentelower dip latitude, the diurnal averages over PresidentePrudente seem to be more disturbed than over CachoeiraPaulista.
• Nighttime enhancements associated to the equatorialanomaly crest have been observed all over 1997, except inMay and June.
• IRI-95 predictions overestimate TEC values at PresidentePrudente by 20 TECU in all seasons. The biggest discrep-ancies occur on winter months.
• IRI-95 seems to be inadequate to model the low latitudeionosphere at low solar activity.
• TEC behavior is a good indicator of the long term trend ofthe solar flux variability, for low solar activity periods.
Fig. 5. Solar flux (F10.7) daily means and TEC daily means adjustments by polynomial curves. Fitting coefficients (R2) are 0.66 and 0.78respectively. Note the general trend of the fits.

A. Mendez da Costa et al.
136
These are the first results obtained using TEC-GPS tech-nique for total electron content measurement over the south-western part of Brazil (Presidente Prudente). In future worksdifferent receivers will be included and higher solar activityconditions will be investigated.
ACKNOWLEDGEMENTS
The authors are grateful for the support received fromCNPq - Conselho Nacional de Desenvolvimento Científicoe Tecnológico (grant 380473/00-3).
BIBLIOGRAPHY
ABDU, M. A., I. S. BATISTA and J. R. de SOUZA, 1996.An overview of IRI- observational data comparison inAmerican (Brazilian) sector low latitude ionosphere. Adv.Space. Res. 18 (6), 13-22.
ABDU, M. A., P. MURALIKRISHNA, I. S. BATISTA andJ. H. A. SOBRAL, 1991. Rocket observations of equa-torial plasma bubbles over Natal, Brazil, using a HighFrequency Capacitance probe. J. Geophys. Res. 96,7689-7695.
BALAN, N., G. J. BAILEY, R. BALACHANDRAN NAIRand J. E. TITHERIDGE, 1994. Nighttime enhancementsin ionospheric electron content in the northern and south-ern hemispheres. J. Atmos. Terr. Phys. 56, 67-79.
BATISTA, I. S., J. R. de SOUZA, ABDU, M. A. and E. R. dePAULA, 1994. Total electron content at low latitudesand its comparison with the IRI90. Adv. Space. Res. 14(12), 87-90.
BILITZA, D., 1997. International Reference Ionosphere-Status 1995/1996. Adv. Space Res., 20(9), 1751-1754.
BILITZA, D., 2001. International Reference Ionosphere2000. Radio Sci. 36(2), 261-275.
BREED, A. M., G. L. GOODWIN and J. H. SILBY, 1998.Total electron content measurements in the southernhemisphere using GPS satellites, 1991 to 1995. RadioSci. 33(6), 1705-1726.
DAVIS, K. and G. K. HARTMANN, 1997. Studying the iono-sphere with the Global Positioning System. Radio Sci.32(4), 1695-1703.
Fig. 6. TEC dependence on solar flux (62< F10.7<116 flux units), at 1700 UT, maximum diurnal peak, for 1997. The upper straight linerepresents IRI-95 predictions.

Electron content measurements in Brazil for low solar activity
137
EZQUER, R. G. and N. O. ADLER, 1989. Electron Con-tent over Tucumán. J. Geophys. Res. 94(A7), 9029-9032.
FORTES, L. P., R. T. LUZ, K. D. PEREIRA, A. S. M.COSTA and D. BLITZKOW, 1998. The Brazilian net-work for Continuous Monitoring of GPS (RBMC):Operation and Products. Advances in Positioning andReference Frames, International Association of Geod-esy Symposia, Vol. 118, Springer-Verlag, Germany.
GANGULY, S., A. BROWN and A. DASGUPTA, 2001.Ionospheric reconstruction using Faraday rotation data:A new technique. Radio Sci. 36(4), 789-800.
GOODWIN, G. L., J. H. SILBY, K. L. W. LYNN, A. M.BREED and E. A. ESSEX, 1995. GPS satellite mea-surements: ionospheric slab thickness and total elec-tron content. J. Atmos. Terr. Phys. 57, 1723-1732.
GOODWIN, G. L. and A. M. BREED, 2001. Total electroncontent in Australia corrected for receiver/satellite off-set bias and compared with IRI and PIM predictions.International Reference Ionosphere – Workshop 1999,27(1) 49-60.
HERNANDEZ-PAJARES, M., J. M. JUAN and J. SANZ,1999. New approches in global ionospheric determina-tion using ground GPS data. J. Atmos. Terr. Phys. 61,237 1247.
HORVATH, I. and E. A. ESSEX, 2000. Using observationsfrom GPS and TOPEX satellites to investigate night-time TEC enhancements at mid-latitudes in the south-ern hemisphere during a low sunspot number period. J.Atmos. Terr. Phys. 62, 371-391.
HUANG, Y. and K. CHENG, 1995. Solar cycle variation ofthe total electron content around equatorial anomalycrest region in east Asia. J. Atmos. Terr. Phys. 52, 1503-1511.
KUMAR, S. and A. K. GWAL, 2000. VHF ionospheric scin-tillations near the equatorial anomaly crest:solar andmagnetic activity effects. J. Atmos. Terr. Phys. 62, 157-167.
MACPHERSON, B., S. A. GONZALEZ, X. PI, M.KELLEY, G. J. BAILEY, M. P. SULZER, G. HAJJ,M. BUONSANTO and C. WANG, 2000. Comparisonbetween SUPIM simulations and measured TEC for theJanuary, 1997 storm. Geophys. Res. Lett. 27(18), 2845-2848.
MAKELA, J. J., S. A. GONZALEZ, B. MACPHERSON,X. PI, M. C. KELLY and P. J. SULTAN, 2000.Intercomparisons of total electron content measurementsusing Arecibo incoherent scatter radar and GPS.Geophys. Res. Lett. 27(18), 2841-2844.
ROTHACHER, M. and L. MERVART, 1996. Bernese GPSSoftware, Version 4.0. Astronomical Institute, Univer-sity of Bern.
SAITO, A., S. FUKAO and M. MIYAZAKI, 1998. High reso-lution mapping of TEC perturbations with the GSI GPSnetwork over Japan. Geophys. Res. Lett. 25, 3079 3082.
SCHAER, S., G. BEUTLER, L. MERVART, M.ROTHACHER and U. WILD, 1995. Global and regionalionosphere models using the GPS double differencephase observable, Proc. of the IGS AC Workshop onSpecial Topics and News Directions, Postdam, Germany,May 15-17, 72-92.
SETHI, N. K., V. K. PANDEY and K. K. HAHAJAN, 2001.Comparative study of TEC with IRI model for solar mini-mum period at low latitude. International ReferenceIonosphere – Workshop 1999, 27(1) 45-48.
SOUZA, J. R., M. A. ABDU and I. S. BATISTA, 2002. Anempirical model for the ionosphere electron content atlow latitude in Brazil and a comparison with IRI 95.2002. Submitted to Adv. Space. Res.
SU, Y. Z., G. J. BAILEY and N. BALAN, 1995. Modelingstudies of the longitudinal variations in TEC at equato-rial-anomaly latitudes. J. Atmos. Terr. Phys. 57, 433 442.
TITHERIDGE, J. E., 1973. The electron content of the south-ern mid-latitude ionosphere,1965 -1971. J. Atmos. Terr.Phys. 35, 981-1001.
_____________
Aracy Mendes da Costa1, J. Williams Vilas Boas1
and Edvaldo S. da Fonseca Junior2
1 INPE, CP. 515, S. José dos Campos, CEP 12245- 970, SP-Brasil2 EPUSP, CP. 61548, São Paulo, CEP 05424-970, SP-BrasilEmail: [email protected],