government of western australia fire & emergency services ... · government of western...
TRANSCRIPT
Fire and Emergency Services Authority of Western Australia
Government of Western Australia Fire & Emergency Services Authority
2011/12Annual Report
Government of Western Australia Fire & Emergency Services Authority
Forward

2
Fire and Emergency Services Authority of Western Australia
Contact Details
In line with Western Australian Government requirements, this Annual Report is published in electronic format. In order to minimise download times and reduce printing, we have formatted the report in chapters. We encourage people to use recycled paper and to print double-sided if they print a copy of the report or sections of it.
Hard copies of this report have been digitally printed on chlorine free paper made from plantation grown timber. The paper manufacturer is certified to ISO 14001, the international standard for environmental management.
Limited hard copies are available from the Director, Risk, Planning and Reporting:
POSTAL ADDRESS STREET ADDRESS ELECTRONICGPO Box P1174 FESA House Email: [email protected] WA 6844 480 Hay Street Website: www.fesa.wa.gov.au Perth WA 6000 Telephone: [08] 9323 9300 Facsimile: [08] 9323 9470
From 29 October 2012 FESA will relocate to new premises at 20 Stockton Bend, Cockburn Central.
ISSN: 1442-8288
Feedback
We are keen to receive feedback on the content and relevance of this report in meeting your requirements. Please forward your comments to our email or postal address.
Back ForwardBack Forward
3
Fire and Emergency Services Authority of Western Australia
Contents
Contact Details ......................................................................................................2
Glossary ..................................................................................................................5
Statement of Legislative Compliance .................................................................7
1 Overview ...........................................................................................................8
Chairman’s Report ............................................................................................9
Chief Executive Officer’s Report ..................................................................10
Executive Summary ........................................................................................11
Financial Overview ....................................................................................11
Performance Highlights ............................................................................12
Quick Statistics...........................................................................................13
Operational Structure ....................................................................................15
Enabling Legislation ..................................................................................15
Responsible Minister .................................................................................15
Our Vision, Mission and Values ................................................................16
Our Roles and Responsibilities ................................................................16
Organisational Structure ...........................................................................17
Organisational Chart .................................................................................18
The FESA Board .........................................................................................19
Senior Officers ...........................................................................................19
Administered Legislation ..........................................................................21
Other Key Legislation Impacting on FESA Activities ...........................21
Performance Management Framework .......................................................22
Outcome Based Management Framework – Link to Government Goals ..22
Changes to Outcome Based Management Framework .......................23
Shared Responsibilities with Other Agencies ........................................23
2 Agency Performance ....................................................................................24
Report on Operations ....................................................................................25
Actual Results vs Budget Targets ............................................................25
Resource Agreement ................................................................................25
Financial Targets Summary .......................................................................26
Key Performance Indicators Summary ...................................................27
Report on Operations ...............................................................................28
Summary of Performance ..............................................................................29
Service 1: Prevention and Mitigation Services .....................................29
Service 2: Emergency Services ...............................................................32
3 Significant Issues Impacting on FESA ........................................................40
Current and Emerging Issues and Trends ..............................................41
Economic and Social Trends .....................................................................41
Changes to Written Law ...........................................................................41
Likely Developments and Forecast Results of Operations ..................43
Back ForwardBack Forward

4
Fire and Emergency Services Authority of Western Australia
4 Disclosures and Legal Compliance .............................................................44
Financial Statements ......................................................................................45
Key Performance Indicators ........................................................................100
Certification of Key Performance Indicators .....................................100
Detail on Key Performance Indicators ...............................................101
Independent Audit Opinion ........................................................................116
Ministerial Directives and Communication ................................................119
Other Financial Disclosures .........................................................................119
Pricing Policies of Services Provided ....................................................119
Natural Disaster Resilience Program ....................................................119
Indemnity Insurance ................................................................................120
Western Australia Natural Disaster Relief and Recovery Arrangements .. 120
Capital Works ...........................................................................................121
Employment and Industrial Relations ...................................................123
Staff Profile ...........................................................................................123
Workplace Management ....................................................................123
Recruitment .........................................................................................124
Equity and Diversity ............................................................................124
Staff Development ..............................................................................124
Governance Disclosures ..............................................................................125
Contracts with Senior Officers ...............................................................125
FESA Board Members .............................................................................125
Finance and Audit Committee ...............................................................129
Consultative Committees ............................................................................131
Bush Fire Service Consultative Committee ..........................................131
Fire and Rescue Service Consultative Committee ..............................132
State Emergency Service Consultative Committee ............................132
Volunteer Marine Rescue Services Consultative Committee ............132
Other Legal Requirements ..........................................................................133
Advertising ...............................................................................................133
Disability Access and Inclusion Plan Outcomes ..................................134
Compliance with Public Sector Standards and Ethical Codes ...........135
Record Keeping Plans .............................................................................136
Freedom of Information .........................................................................137
Government Policy Requirements ..............................................................138
Occupational Safety, Health and Injury Management ........................138
FESA Reconciliation Action Plan............................................................142
Back ForwardBack Forward

5
Fire and Emergency Services Authority of Western Australia
Glossary
AASB Australian Accounting Standards Board
AFSM Australian Fire Service Medal
APM Australian Police Medal
ATO Australian Taxation Office
AWARE All Western Australians Reducing Emergencies
BFB Bush Fire Brigade
BFSCC Bush Fire Service Consultative Committee
BFS Bush Fire Service
BMO Bushland Mitigation Officer
BoM Bureau of Meteorology
CBRN Chemical Biological Radiological and Nuclear
CEO Chief Executive Officer
CESM Community Emergency Services Manager
CHOGM Commonwealth Heads of Government Meeting
CLU Community Liaison Unit
CPSU/CSA Community and Public Sector Union / Civil Service Association of WA
DAF Department of Agriculture and Food
DAIP Disability Access and Inclusion Plan
DBA Direct Brigade Alarm
DCP Department for Child Protection
DEC Department of Environment and Conservation
DOAC District Operations Advisory Committee
DoT Department of Transport
DPC Department of the Premier and Cabinet
DSI Detailed Site Investigation
EBA Enterprise Bargaining Agreement
EMWA Emergency Management Western Australia
ESL Emergency Services Levy
FBT Fringe Benefits Tax
FESA Fire and Emergency Services Authority of Western Australia
FESSB Fire and Emergency Services Superannuation Board
FESSF Fire and Emergency Services Superannuation Fund
FRS Fire and Rescue Service
FRSCC Fire and Rescue Service Consultative Committee
FTE Full Time Equivalent
GESB Government Employees Superannuation Board
GESBS Government Employees Superannuation Board Super Scheme
GSS Gold State Superannuation Scheme
GST Goods and Services Tax
HAZMAT Hazardous Materials
Back ForwardBack Forward
6
Fire and Emergency Services Authority of Western Australia
Glossary
HMA Hazard Management Agency
IBMC Interagency Bushfire Management Committee
JAFFA Juvenile and Family Fire Awareness
LGA Local Government Areas
MIR Major Incident Review
NDRP National Disaster Resilience Program
NDRRA Natural Disaster Relief and Recovery Arrangements
OID Operational Improvement Database
OSH Occupational Safety and Health
PHBFR Perth Hills Bushfire February 2011 Review
PSGOGA Public Service and Government Officers General Agreement
RoGS Report on Government Services
RTO Registered Training Organisation
SDS Staff Deployment System
SEMC State Emergency Management Committee
SES State Emergency Service
SESCC State Emergency Service Consultative Committee
SPO Strategic Program Office
SSC State Supply Commission
TRIM Tower Records and Information Management
UFU United Firefighters Union of Australia
USAR Urban Search and Rescue
VERP Volunteer Employer Recognition Program
VES Volunteer Emergency Service
VFRS Volunteer Fire and Rescue Service
VFS Volunteer Fire Service
VMR Volunteer Marine Rescue
VMRS Volunteer Marine Rescue Services
VMRSCC Volunteer Marine Rescue Services Consultative Committee
VMRWA Volunteer Marine Rescue Western Australia
WAIRC Western Australian Industrial Relations Commission
WANDRRA Western Australian Natural Disaster Relief and Recovery Arrangements
WAPOL Western Australia Police
WATC Western Australian Treasury Corporation
WSS West State Superannuation Scheme
Back Forward
7
Fire and Emergency Services Authority of Western Australia
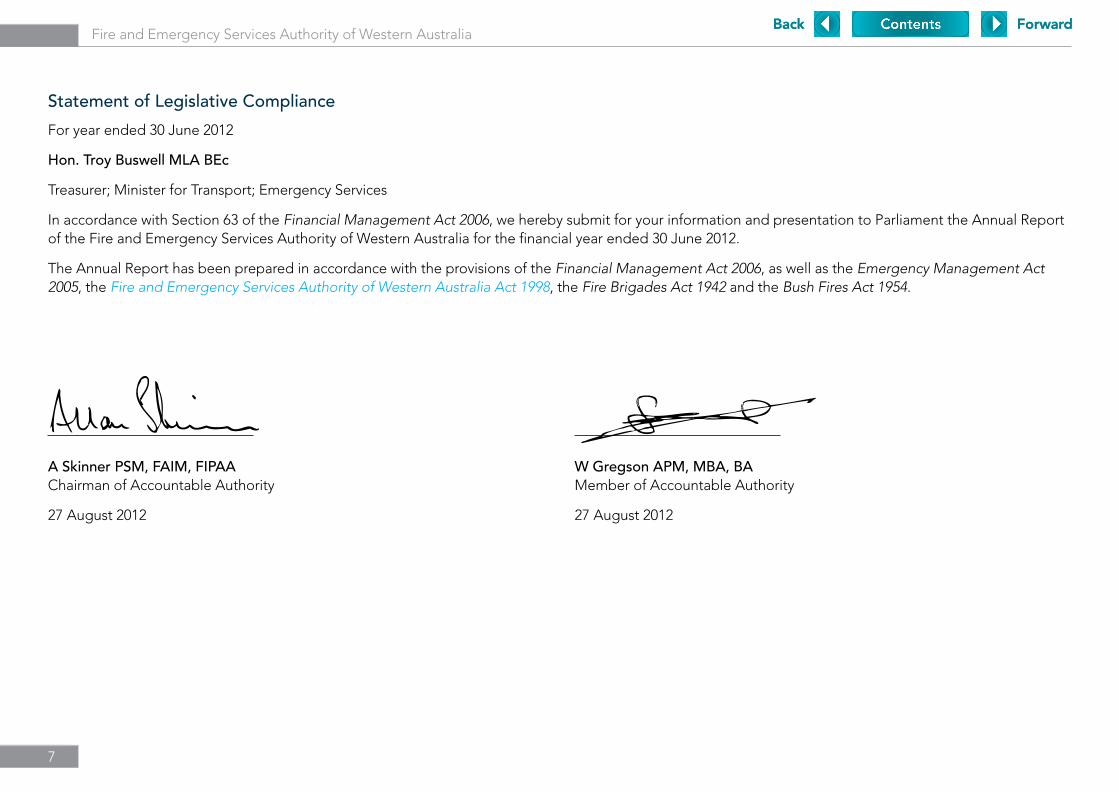
Statement of Legislative Compliance
For year ended 30 June 2012
Hon. Troy Buswell MLA BEc
Treasurer; Minister for Transport; Emergency Services
In accordance with Section 63 of the Financial Management Act 2006, we hereby submit for your information and presentation to Parliament the Annual Report of the Fire and Emergency Services Authority of Western Australia for the financial year ended 30 June 2012.
The Annual Report has been prepared in accordance with the provisions of the Financial Management Act 2006, as well as the Emergency Management Act 2005, the Fire and Emergency Services Authority of Western Australia Act 1998, the Fire Brigades Act 1942 and the Bush Fires Act 1954.
A Skinner PSM, FAIM, FIPAA W Gregson APM, MBA, BAChairman of Accountable Authority Member of Accountable Authority
27 August 2012 27 August 2012
Back ForwardBack Forward
8
Fire and Emergency Services Authority of Western Australia
8
Page 09 Chairman’s Report
Page 10 Chief Executive Officer’s Report
Page 11 Executive Summary
Page 15 Operational Structure
Page 22 Performance Management Framework
OverviewSection 1
Back ForwardBack Forward
Fire and Emergency Services Authority of Western Australia
9 Section 1 – Overview
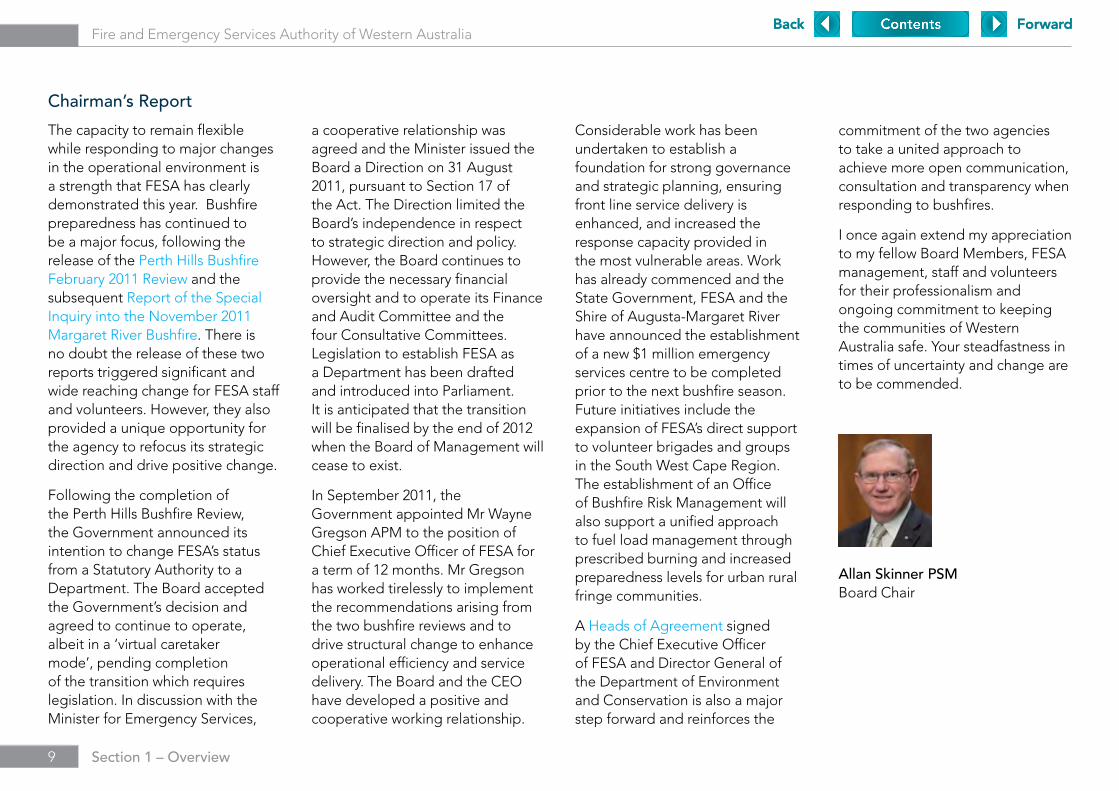
Chairman’s Report
The capacity to remain flexible while responding to major changes in the operational environment is a strength that FESA has clearly demonstrated this year. Bushfire preparedness has continued to be a major focus, following the release of the Perth Hills Bushfire February 2011 Review and the subsequent Report of the Special Inquiry into the November 2011 Margaret River Bushfire. There is no doubt the release of these two reports triggered significant and wide reaching change for FESA staff and volunteers. However, they also provided a unique opportunity for the agency to refocus its strategic direction and drive positive change.
Following the completion of the Perth Hills Bushfire Review, the Government announced its intention to change FESA’s status from a Statutory Authority to a Department. The Board accepted the Government’s decision and agreed to continue to operate, albeit in a ‘virtual caretaker mode’, pending completion of the transition which requires legislation. In discussion with the Minister for Emergency Services,
a cooperative relationship was agreed and the Minister issued the Board a Direction on 31 August 2011, pursuant to Section 17 of the Act. The Direction limited the Board’s independence in respect to strategic direction and policy. However, the Board continues to provide the necessary financial oversight and to operate its Finance and Audit Committee and the four Consultative Committees. Legislation to establish FESA as a Department has been drafted and introduced into Parliament. It is anticipated that the transition will be finalised by the end of 2012 when the Board of Management will cease to exist.
In September 2011, the Government appointed Mr Wayne Gregson APM to the position of Chief Executive Officer of FESA for a term of 12 months. Mr Gregson has worked tirelessly to implement the recommendations arising from the two bushfire reviews and to drive structural change to enhance operational efficiency and service delivery. The Board and the CEO have developed a positive and cooperative working relationship.
Considerable work has been undertaken to establish a foundation for strong governance and strategic planning, ensuring front line service delivery is enhanced, and increased the response capacity provided in the most vulnerable areas. Work has already commenced and the State Government, FESA and the Shire of Augusta-Margaret River have announced the establishment of a new $1 million emergency services centre to be completed prior to the next bushfire season. Future initiatives include the expansion of FESA’s direct support to volunteer brigades and groups in the South West Cape Region. The establishment of an Office of Bushfire Risk Management will also support a unified approach to fuel load management through prescribed burning and increased preparedness levels for urban rural fringe communities.
A Heads of Agreement signed by the Chief Executive Officer of FESA and Director General of the Department of Environment and Conservation is also a major step forward and reinforces the
commitment of the two agencies to take a united approach to achieve more open communication, consultation and transparency when responding to bushfires.
I once again extend my appreciation to my fellow Board Members, FESA management, staff and volunteers for their professionalism and ongoing commitment to keeping the communities of Western Australia safe. Your steadfastness in times of uncertainty and change are to be commended.
Allan Skinner PSMBoard Chair
Back ForwardBack Forward

Fire and Emergency Services Authority of Western Australia
1 0 Section 1 – Overview
Chief Executive Officer’s Report
The 2011/12 financial year will be remembered by FESA and its members as one of significant change and as the year progressed we laid the foundations for a new beginning. The release of the Perth Hills Bushfire February 2011 Review had significant implications for the way Western Australian emergency events are prepared for and managed. It has become the blueprint for reshaping FESA, remodelling our culture and enhancing frontline operations.
My primary focus in setting the organisation’s new strategic direction has been on the operational frontline; identifying opportunities to enhance and improve the way we support career firefighters and volunteers. Our new corporate structure provides a solid platform on which to continue building and improving operational capacity.
It includes a renewed commitment to training and conducting exercises to improve operational capability. Corporate governance has been strengthened through dedicated resourcing and increased representation of operational staff on the Corporate Leadership Team, which will ensure that decisions are focused on improving outcomes for operational personnel.
The FESA family is a diverse but integrated team of highly skilled and specialised people who share a common goal – community safety. This family is also a valuable source for producing new and innovative business ideas. A key achievement this year was the very successful implementation of the FESA Portal2Progress through which staff and volunteers can provide input into strategy development and continuous improvement.
The extraordinary effort and commitment of emergency services personnel involved in responding to and preparing for a wide range of emergency events including tropical cyclones, bushfires, floods and storms, was magnificent. What strikes me is the incredible commitment and dedication of volunteers and staff who are prepared to give up their time and risk their lives to protect others. My thanks also go to the many administration and support staff who assisted the operational teams during these times of crisis and also to employers of volunteers who release them from work commitments to support the community in times of need.
I have been heartened by positive feedback and responses received from volunteers and staff about the changes our organisation has undergone. It has been a challenging and difficult period, but together we have achieved some outstanding results and as the CEO of this remarkable organisation I am extremely proud of you all. I again reiterate my appreciation for your ongoing support and encouragement and I look forward to continuing to work closely with you to ensure our agency is ready to respond to the challenges ahead.
W Gregson APM, MBA BAChief Executive Officer
Back ForwardBack Forward
Fire and Emergency Services Authority of Western Australia
1 1 Section 1 – Overview
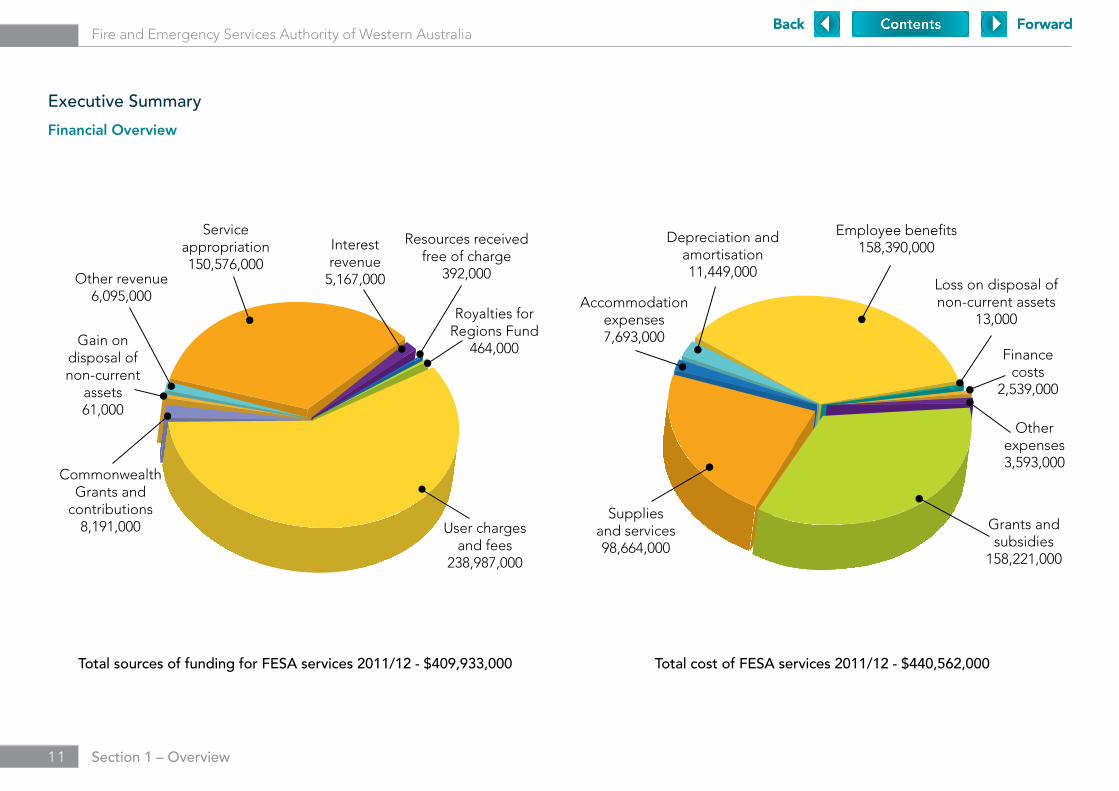
Executive Summary
Financial Overview
Employee benefits 158,390,000
Depreciation and amortisation 11,449,000
Accommodation expenses7,693,000
Suppliesand services98,664,000
Finance costs
2,539,000
Loss on disposal of non-current assets
13,000
Otherexpenses3,593,000
Grants and subsidies
158,221,000
Royalties forRegions Fund
464,000
User charges and fees
238,987,000
Resources received free of charge
392,000
Service appropriation150,576,000
Gain on disposal of non-current
assets61,000
Other revenue6,095,000
Interest revenue
5,167,000
Commonwealth Grants and
contributions8,191,000
Total cost of FESA services 2011/12 - $440,562,000Total sources of funding for FESA services 2011/12 - $409,933,000
Back ForwardBack Forward

Fire and Emergency Services Authority of Western Australia
1 2 Section 1 – Overview
Performance Highlights
FESA achieves its outcomes through the delivery of two services – Prevention and Mitigation Services and Emergency Services.
Key Achievements – Prevention and Mitigation Services
•EstablishmentofaCommunity Liaison Unit for deployment during major emergencies.
•Bushfire threat mitigation.
•AcommunityawarenesscampaigntoimprovecommunityunderstandingofTotal Fire Ban Regulations.
•Revision of community awareness information in relation to bushfire, flood and cyclones.
Key Achievements – Emergency Services
•AdditionofanErickson S64E Aircrane to the aerial suppression fleet.
•SupporttoWesternAustraliaPoliceinthecoordinationandsupportoftheCommonwealth Heads of Government Meeting.
•Improvedinformationmanagementduringincidentsthroughaweb-based emergency operations system.
•Developmentofaprofessionalpathwaysframeworktoimprovecompetency development for staff and volunteers.
•DevelopmentofaWA Marine Search and Rescue information management database to support incident response.
•Deploymentofnew water tanker appliances for the southern and northern fire seasons.
•Heads of Agreement signed between FESA and the Department of Environment and Conservation.
•Memorandum of Understanding signed between FESA and the Bureau of Meteorology.
Back ForwardBack Forward

Fire and Emergency Services Authority of Western Australia
1 3 Section 1 – Overview
Our People
At 30 June 2012, FESA had a staff allocation of 1,422. Actual employment comprised staff in 1,405 full time positions, including 1,123 firefighters, and 39 part time and casual staff. Our average full time equivalent during 2011/12 was 1,378.46.
We also support more than 30,000 volunteers across Western Australia. Our volunteers provide an invaluable contribution in a variety of roles in the delivery of operational services, administration and functional support. In recognition of the value of our volunteers, the 2011 FESA Volunteer Employer Recognition Program presented 69 awards at the Burswood Convention Centre on 2 August 2011.
In 2011/12 our overall volunteer turnover rate was eight percent.
Quick Statistics
FESA staff allocation as at 30 June 2012
Firefighters 1,123
Administration / support 299
Total 1,422
Cadets and Juniors as at 30 June 2012
Emergency Service Cadets 1,564
Juniors registered with brigades, groups and units 576
Total cadets and juniors 2,140
Emergency Services Cadet (ESC) Units 39
Junior Cadet Programs 83
Volunteers Number of Brigades,
Groups or Units
Volunteer Numbers as at 30 June 2012
Operational Support Total
Volunteer Bush Fire Service 583 24,244 895 25,139
Volunteer Fire and Rescue Service 88 2,047 155 2,202
State Emergency Service 64 1,881 46 1,927
Volunteer Marine Rescue Services 39 1,348 27 1,375
Volunteer Emergency Service 19 606 5 611
Volunteer Fire Service 9 395 7 402
FESA Education and Heritage Centre 1 0 18 18
Total 803 30,521 1,153 31,674
Note: Total volunteer numbers will not correlate with total regional volunteer numbers on page 14 as it includes volunteers who are dual registered.
Back ForwardBack Forward
Fire and Emergency Services Authority of Western Australia
1 4 Section 1 – Overview
Kimberley
Pilbara
Midwest Gascoyne
Goldfields Midlands
Great Southern
Lower South West
South West
Perth MetropolitanMetro North
CoastalMetro North East
Metro SouthCoastal
Metro South East
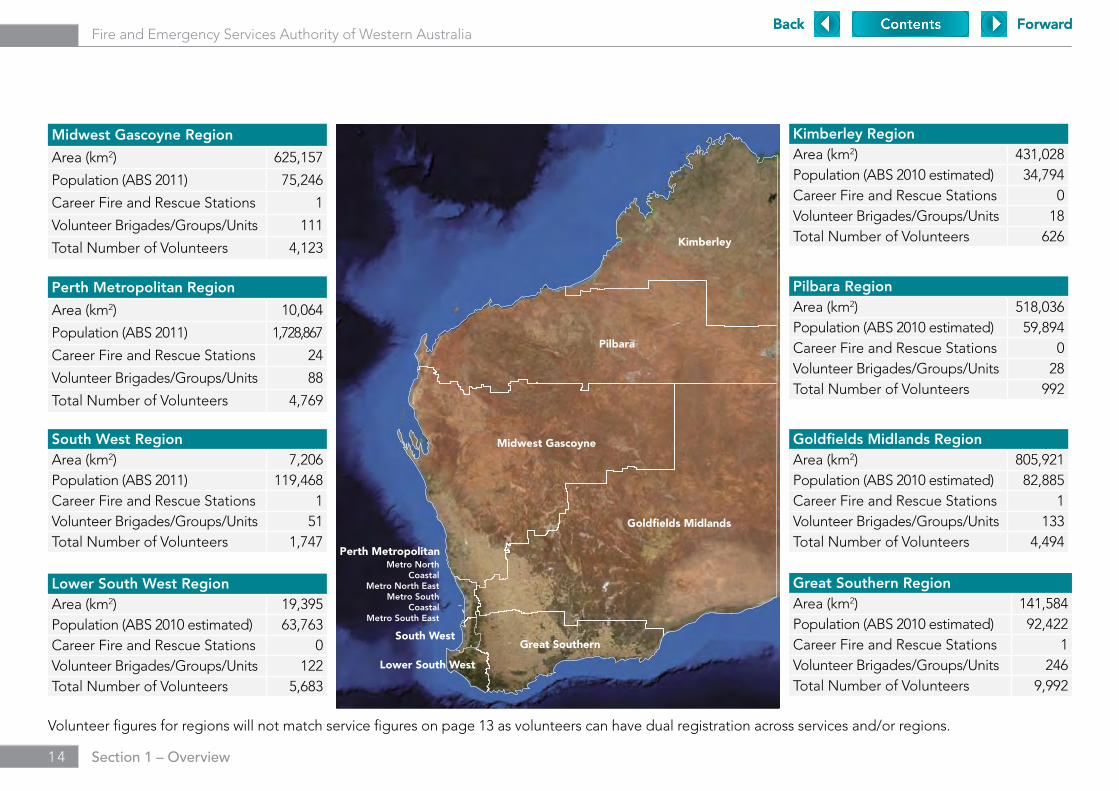
South West RegionArea (km2) 7,206Population (ABS 2011) 119,468Career Fire and Rescue Stations 1Volunteer Brigades/Groups/Units 51Total Number of Volunteers 1,747
Perth Metropolitan Region
Area (km2) 10,064
Population (ABS 2011) 1,728,867
Career Fire and Rescue Stations 24
Volunteer Brigades/Groups/Units 88
Total Number of Volunteers 4,769
Midwest Gascoyne Region
Area (km2) 625,157
Population (ABS 2011) 75,246
Career Fire and Rescue Stations 1
Volunteer Brigades/Groups/Units 111
Total Number of Volunteers 4,123
Lower South West RegionArea (km2) 19,395Population (ABS 2010 estimated) 63,763Career Fire and Rescue Stations 0Volunteer Brigades/Groups/Units 122Total Number of Volunteers 5,683
Volunteer figures for regions will not match service figures on page 13 as volunteers can have dual registration across services and/or regions.
Kimberley RegionArea (km2) 431,028Population (ABS 2010 estimated) 34,794Career Fire and Rescue Stations 0Volunteer Brigades/Groups/Units 18Total Number of Volunteers 626
Goldfields Midlands RegionArea (km2) 805,921Population (ABS 2010 estimated) 82,885Career Fire and Rescue Stations 1Volunteer Brigades/Groups/Units 133Total Number of Volunteers 4,494
Pilbara RegionArea (km2) 518,036Population (ABS 2010 estimated) 59,894Career Fire and Rescue Stations 0Volunteer Brigades/Groups/Units 28Total Number of Volunteers 992
Great Southern RegionArea (km2) 141,584Population (ABS 2010 estimated) 92,422Career Fire and Rescue Stations 1Volunteer Brigades/Groups/Units 246Total Number of Volunteers 9,992
Back ForwardBack Forward
Fire and Emergency Services Authority of Western Australia
1 5 Section 1 – Overview
Operational Structure
Enabling Legislation
The Fire and Emergency Services Authority of Western Australia (FESA) was established in 1999 under the Fire and Emergency Services Authority of Western Australia Act 1998 to improve the coordination and planning of emergency services in Western Australia.
FESA comprises the career and volunteer Fire and Rescue Service (FRS and VFRS), the Bush Fire Service (BFS), the State Emergency Service (SES) and Volunteer Marine Rescue Service (VMRS), Volunteer Emergency Service (VES) and Volunteer Fire Service (VFS) units. We also support the participation of young volunteers through our Emergency Services Cadets and Junior programs.
FESA also has responsibility for administering State resources to the metropolitan sea rescue groups and the service level agreement for Surf Life Saving Western Australia’s volunteer rescue operations. Surf Life Saving Western Australia has approximately 4,604 patrolling lifeguards who provide a range of essential services to the beachgoing community.
Responsible Minister
The Hon. Troy Buswell, MLA BEc, Treasurer; Minister for Transport; Emergency Services.
Bush Fire Service
Fire and Rescue Service (Career and Volunteer)
State Emergency Service
Volunteer Emergency Service
Volunteer Fire Services
Volunteer Marine Rescue Services
Back ForwardBack Forward
Fire and Emergency Services Authority of Western Australia
1 6 Section 1 – Overview
Our Vision
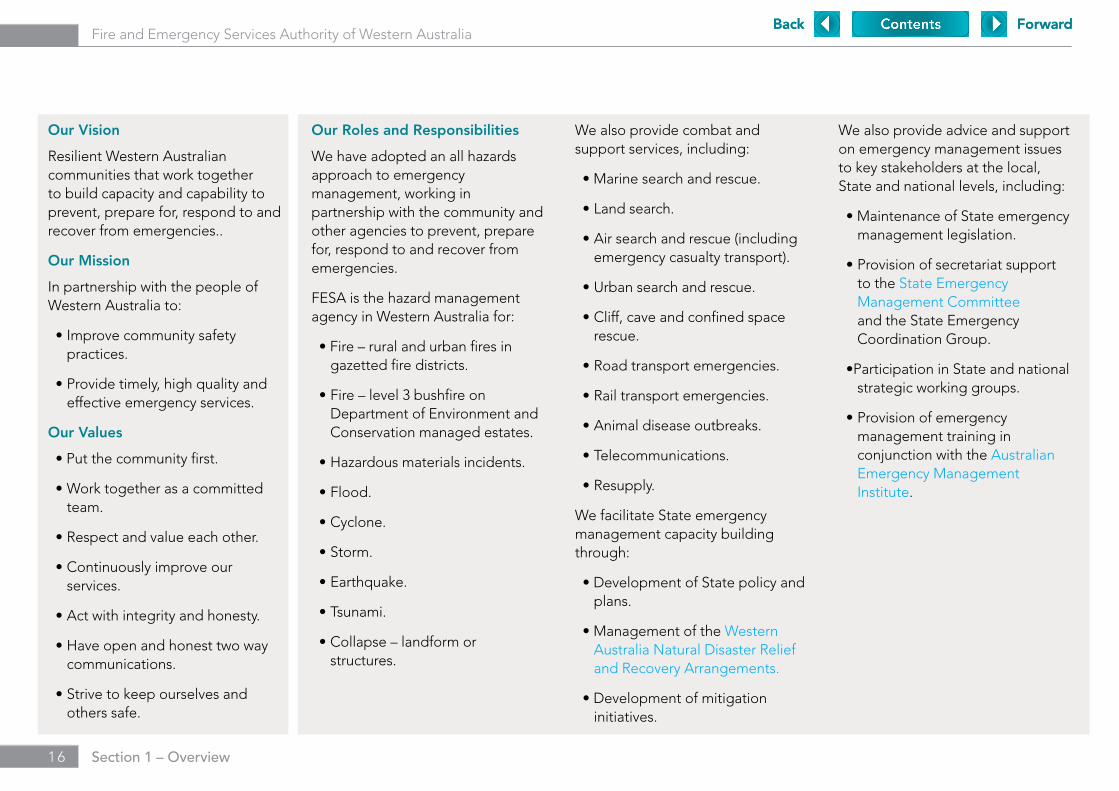
Resilient Western Australian communities that work together to build capacity and capability to prevent, prepare for, respond to and recover from emergencies..
Our Mission
In partnership with the people of Western Australia to:
•Improvecommunitysafetypractices.
•Providetimely,highqualityandeffective emergency services.
Our Values
•Putthecommunityfirst.
•Worktogetherasacommittedteam.
•Respectandvalueeachother.
•Continuouslyimproveourservices.
•Actwithintegrityandhonesty.
•Haveopenandhonesttwowaycommunications.
•Strivetokeepourselvesandothers safe.
Our Roles and Responsibilities
We have adopted an all hazards approach to emergency management, working in partnership with the community and other agencies to prevent, prepare for, respond to and recover from emergencies.
FESA is the hazard management agency in Western Australia for:
•Fire–ruralandurbanfiresingazetted fire districts.
•Fire–level3bushfireonDepartment of Environment and Conservation managed estates.
•Hazardousmaterialsincidents.
•Flood.
•Cyclone.
•Storm.
•Earthquake.
•Tsunami.
•Collapse–landformorstructures.
We also provide combat and support services, including:
•Marinesearchandrescue.
•Landsearch.
•Airsearchandrescue(includingemergency casualty transport).
•Urbansearchandrescue.
•Cliff,caveandconfinedspacerescue.
•Roadtransportemergencies.
•Railtransportemergencies.
•Animaldiseaseoutbreaks.
•Telecommunications.
•Resupply.
We facilitate State emergency management capacity building through:
•DevelopmentofStatepolicyandplans.
•ManagementoftheWestern Australia Natural Disaster Relief and Recovery Arrangements.
•Developmentofmitigationinitiatives.
We also provide advice and support on emergency management issues to key stakeholders at the local, State and national levels, including:
•MaintenanceofStateemergencymanagement legislation.
•Provisionofsecretariatsupportto the State Emergency Management Committee and the State Emergency Coordination Group.
•ParticipationinStateandnationalstrategic working groups.
•Provisionofemergencymanagement training in conjunction with the Australian Emergency Management Institute.
Back ForwardBack Forward
Fire and Emergency Services Authority of Western Australia
1 7 Section 1 – Overview
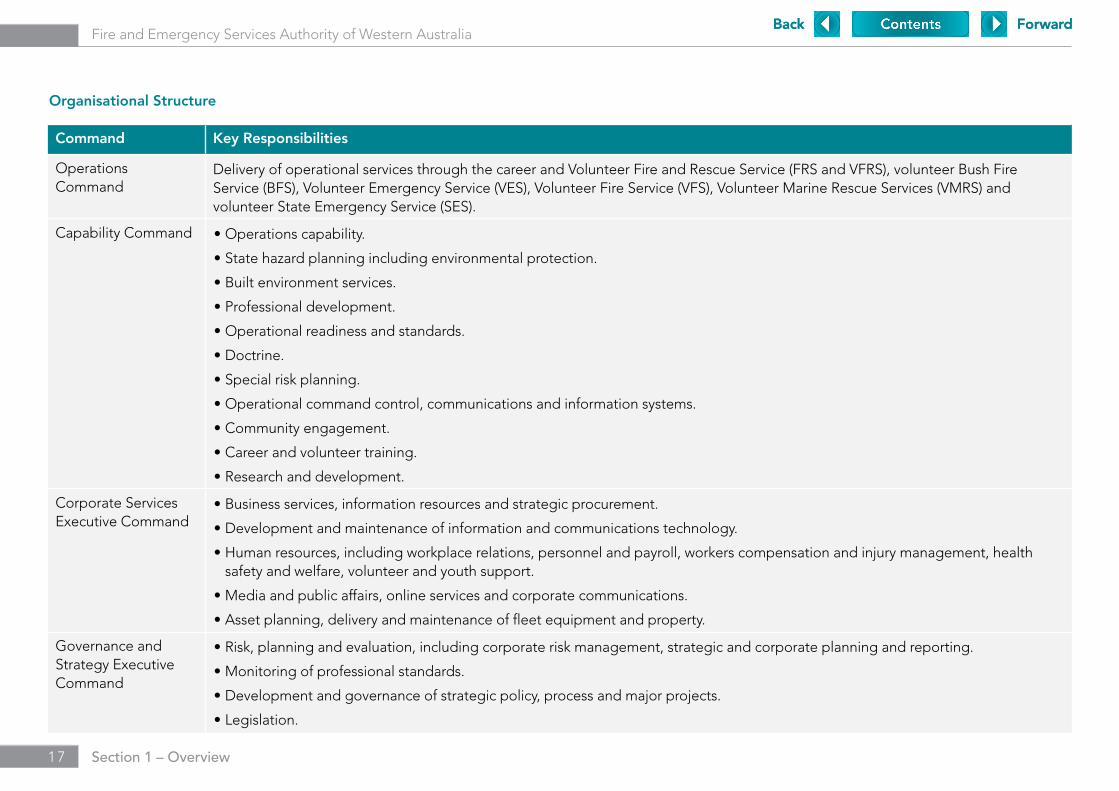
Command Key Responsibilities
Operations Command
Delivery of operational services through the career and Volunteer Fire and Rescue Service (FRS and VFRS), volunteer Bush Fire Service (BFS), Volunteer Emergency Service (VES), Volunteer Fire Service (VFS), Volunteer Marine Rescue Services (VMRS) and volunteer State Emergency Service (SES).
Capability Command •Operationscapability.
•Statehazardplanningincludingenvironmentalprotection.
•Builtenvironmentservices.
•Professionaldevelopment.
•Operationalreadinessandstandards.
•Doctrine.
•Specialriskplanning.
•Operationalcommandcontrol,communicationsandinformationsystems.
•Communityengagement.
•Careerandvolunteertraining.
•Researchanddevelopment.
Corporate Services Executive Command
•Businessservices,informationresourcesandstrategicprocurement.
•Developmentandmaintenanceofinformationandcommunicationstechnology.
•Humanresources,includingworkplacerelations,personnelandpayroll,workerscompensationandinjurymanagement,healthsafety and welfare, volunteer and youth support.
•Mediaandpublicaffairs,onlineservicesandcorporatecommunications.
•Assetplanning,deliveryandmaintenanceoffleetequipmentandproperty.
Governance and Strategy Executive Command
•Risk,planningandevaluation,includingcorporateriskmanagement,strategicandcorporateplanningandreporting.
•Monitoringofprofessionalstandards.
•Developmentandgovernanceofstrategicpolicy,processandmajorprojects.
•Legislation.
Organisational Structure
Back ForwardBack Forward
Fire and Emergency Services Authority of Western Australia
1 8 Section 1 – Overview
Organisational Chart
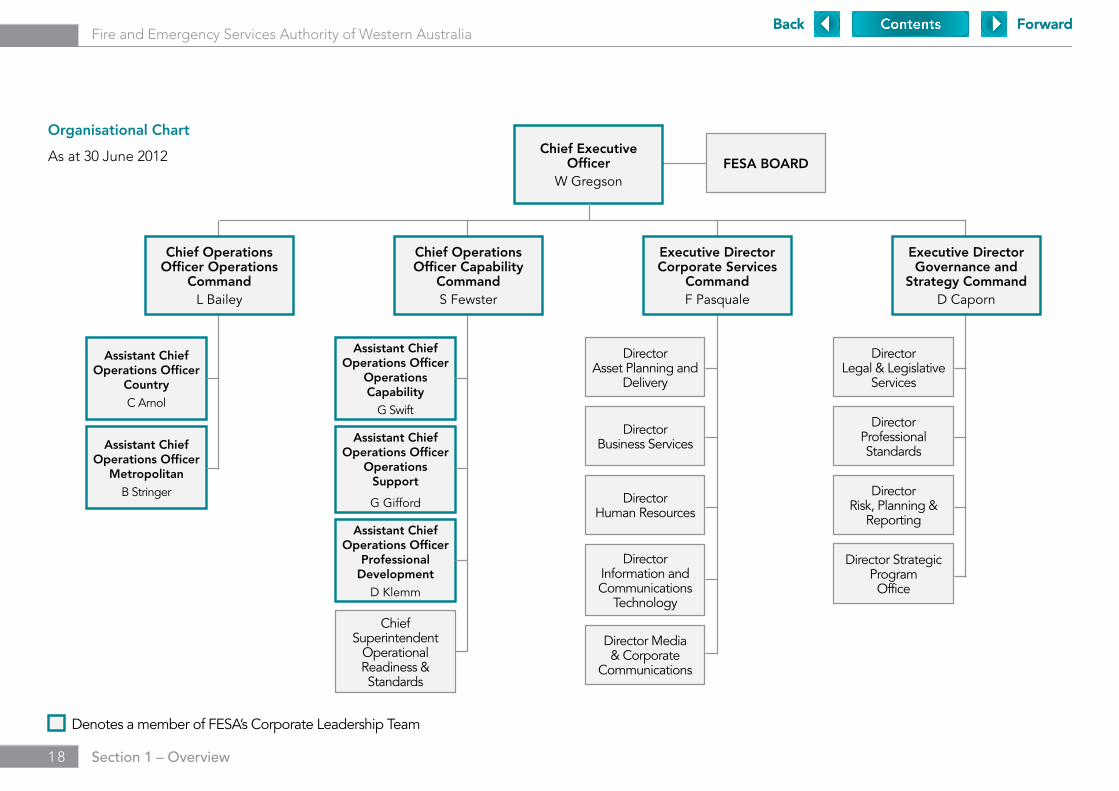
As at 30 June 2012 Chief Executive Officer
W GregsonFESA BOARD
Chief Operations Officer Operations
CommandL Bailey
Chief Operations Officer Capability
CommandS Fewster
Executive Director Corporate Services
CommandF Pasquale
Executive Director Governance and
Strategy Command D Caporn
Assistant Chief Operations Officer
Country
C Arnol
Assistant Chief Operations Officer
Metropolitan
B Stringer
Assistant Chief Operations Officer
Operations Capability
G Swift
Assistant Chief Operations Officer
Operations Support
G Gifford
Assistant Chief Operations Officer
Professional Development
D Klemm
Chief Superintendent
Operational Readiness & Standards
Director Legal & Legislative
Services
Director Professional Standards
Director Risk, Planning &
Reporting
Director Strategic Program Office
Director Business Services
Director Human Resources
Director Information and Communications
Technology
Director Media & Corporate
Communications
Director Asset Planning and
Delivery
Denotes a member of FESA’s Corporate Leadership Team
Back ForwardBack Forward
Fire and Emergency Services Authority of Western Australia
1 9 Section 1 – Overview
The FESA Board continues to be accountable to the Minister for Emergency Services and is responsible for:
•Determiningstrategicdirectionand overall performance.
•Ensuringcompliancewithkeylegislation.
•Endorsingmanagementinitiatives.
Responsibilities are delegated to the Chief Executive Officer under the provisions of the FESA Act, with all approved delegations held on a delegations register. Through this governance process, the FESA Board is able to devolve necessary authority and responsibility to staff and volunteers whilst preserving the controls necessary for accountability.
Members of the Board are appointed based on their experience in areas relevant to FESA activities. The profiles of current FESA Board members are provided in the Disclosure and Legal Compliance section of this report.
Senior Officers
FESA’s corporate structure comprises four commands that coordinate and deliver agreed services.
FESA’s senior leadership includes the Chief Executive Officer and the senior executive of the four commands. They are supported by Assistant Chief Operations Officers from the Operations and Capability Commands.
Wayne Gregson, APM, MBA, BA(Chief Executive Officer)
Mr Wayne Gregson was appointed as the Chief Executive Officer of FESA in September 2011 for a period of 12 months.
Mr Gregson joined FESA from Western Australia Police (WAPOL), where he held the rank of Assistant Commissioner within Judicial Services. He joined WAPOL as a cadet in 1979 and was promoted through the ranks to Assistant Commissioner level which he held for seven years.
Mr Gregson holds a Master of Business Administration from Edith Cowan University, Graduate Certificate in Applied Management
from the Australian Institute of Police Management and a Bachelor of Arts from the University of Western Australia.
Senior Executives of the Four Command Areas
Lloyd Bailey AFSM(Chief Operations Officer, Operations Command)
Chief Operations Officer Bailey has more than 37 years experience in fire and emergency services, having commenced as a volunteer firefighter before joining the WA Fire Brigades Board in 1980 as a recruit.
He has held a range of key roles and responsibilities at FESA and was awarded the Australian Fire Service Medal in 2003.
David Caporn, APM(Executive Director, Governance and Strategy Command)
Mr Caporn has more than 36 years experience in the public sector, including 32 years with Western Australia Police. He has a long history working in the areas of emergency, security and risk management.
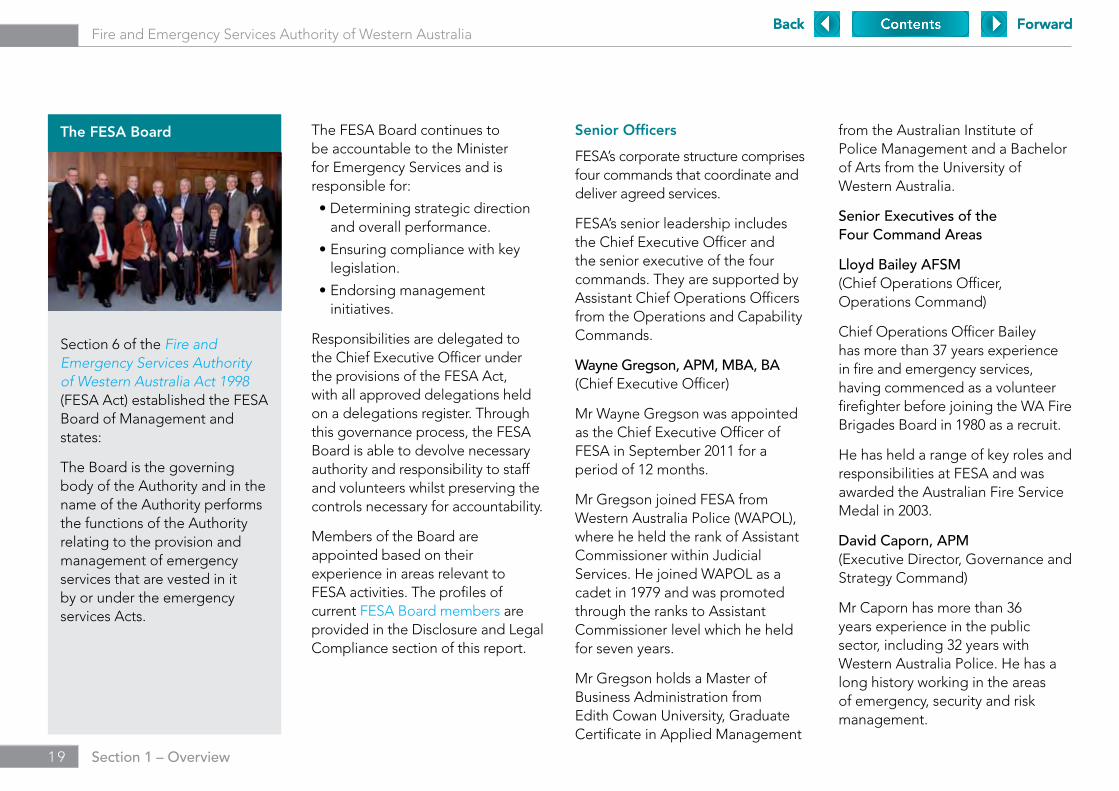
The FESA Board
Section 6 of the Fire and Emergency Services Authority of Western Australia Act 1998 (FESA Act) established the FESA Board of Management and states:
The Board is the governing body of the Authority and in the name of the Authority performs the functions of the Authority relating to the provision and management of emergency services that are vested in it by or under the emergency services Acts.
Back ForwardBack Forward

Fire and Emergency Services Authority of Western Australia
2 0 Section 1 – Overview
Stephen Fewster BA(Mil), MSc(Chief Operations Officer, Capability Command)
Chief Operations Officer Fewster has worked in both the State and Commonwealth Public Service for the past 35 years.
His roles include senior positions with the Departments of Defence, Justice, Attorney General and Premier and Cabinet. He has also held senior management positions with FESA in the State Emergency Service and Fire Services.
Frank Pasquale, BCom(Executive Director, Corporate Services Command)
Mr Pasquale has 23 years experience in the public sector, commencing at the Office of the Auditor General.
He was FESA’s Acting CEO between 17 August 2011 and 16 September 2011.
Assistant Chief Operations Officers
Chris Arnol(Assistant Chief Operations Officer, Country)
Assistant Chief Operations Officer Arnol has worked in the fire and emergency services for more than 34 years.
He holds a Masters Degree in Public Management, a Graduate Certificate in Applied Management, is a Member of the Institute of Fire Engineers, and was awarded a Churchill Fellowship for studies in urban interface firefighting.
Gary Gifford ESM(Assistant Chief Operations Officer, Hazard Planning and Operations Response)
Assistant Chief Operations Officer Gifford has 35 years experience in the defence and emergency services industry.
Having managed significant emergency situations in the Metropolitan, Midwest, Pilbara and Kimberley Regions of Western Australia, he has acquired broad experience and knowledge of government and non-government agencies in an emergency and the importance for them to recover their operations and maintain business continuity.
Darren Klemm (Assistant Chief Operations Officer, Professional Development)
Assistant Chief Operations Officer Klemm has more than 22 years experience in fire and emergency services.
Since joining the WA Fire Brigades Board in 1993, he has served at various metropolitan fire stations, followed by service in the Goldfields/ Midlands region as part of Country Operations.
Brad Stringer (Assistant Chief Operations Officer, Metropolitan)
Assistant Chief Operations Officer Stringer has 22 years experience in fire and emergency services. He has served thoughout the metropolitan region as a Firefighter, Station Officer, District Officer and Superintendent. He has also filled the role of Rural Operations Coordinator - North and South.
Graham Swift(Assistant Chief Operations Officer, Operations Capability)
Assistant Chief Operations Officer Swift has 32 years experience in fire and emergency services, having commenced as a volunteer firefighter in 1980, before moving to the Bush Fires Board of WA as a Regional Training Officer in 1994. He has served in both rural and metropolitan locations throughout Western Australia.
Back ForwardBack Forward

Fire and Emergency Services Authority of Western Australia
2 1 Section 1 – Overview
Administered Legislation
FESA administers the following Acts along with associated subsidiary legislation:
Bush Fires Act 1954 (and supporting Regulations)
Emergency Management Act 2005
Emergency Services Levy Act 2002
Fire and Emergency Services Authority of Western Australia Act 1998
Fire Brigades Act 1942 (and supporting Regulations)
Other Key Legislation Impacting on FESA Activities
Associations Incorporation Act 1987
Building Act 2011
Conservation and Land Management Act 1984
Contaminated Sites Act 2003
Country Areas Water Supply Act 1947
Dangerous Goods Safety Act 2004
Environmental Protection Act 1986
Freedom of Information Act 1992
Heritage of Western Australia Act 1990
Local Government Act 1995
Local Government (Miscellaneous Provisions) Act 1960
Metropolitan Water Supply, Sewerage and Drainage Act 1909
Occupational Safety and Health Act 1984
Road Traffic Act 1974
Workers’ Compensation and Injury Management Act 1981
Working with Children (Criminal Record Checking) Act 2004
Back Forward
Fire and Emergency Services Authority of Western Australia
2 2 Section 1 – Overview
Outcome Based Management Framework
Link to Government Goals
FESA’s core business is to support Government Goal 3 – Outcome Based Service Delivery: Greater focus on achieving results in key service delivery areas for the benefit of all Western Australians.
FESA’s community engagement approach also supports the achievement of other Government goals including:
A stronger focus on the regions
Services are delivered through a network of regionally based employees and volunteers.
Through the management of the Emergency Services Levy and volunteer support programs FESA assists local governments to maintain volunteer services appropriate to the level of risk in their communities.
Social and environmental responsibility
FESA supports the achievement of this goal through a commitment to develop sustainable emergency management strategies and programs targeted to meet the needs of local communities.
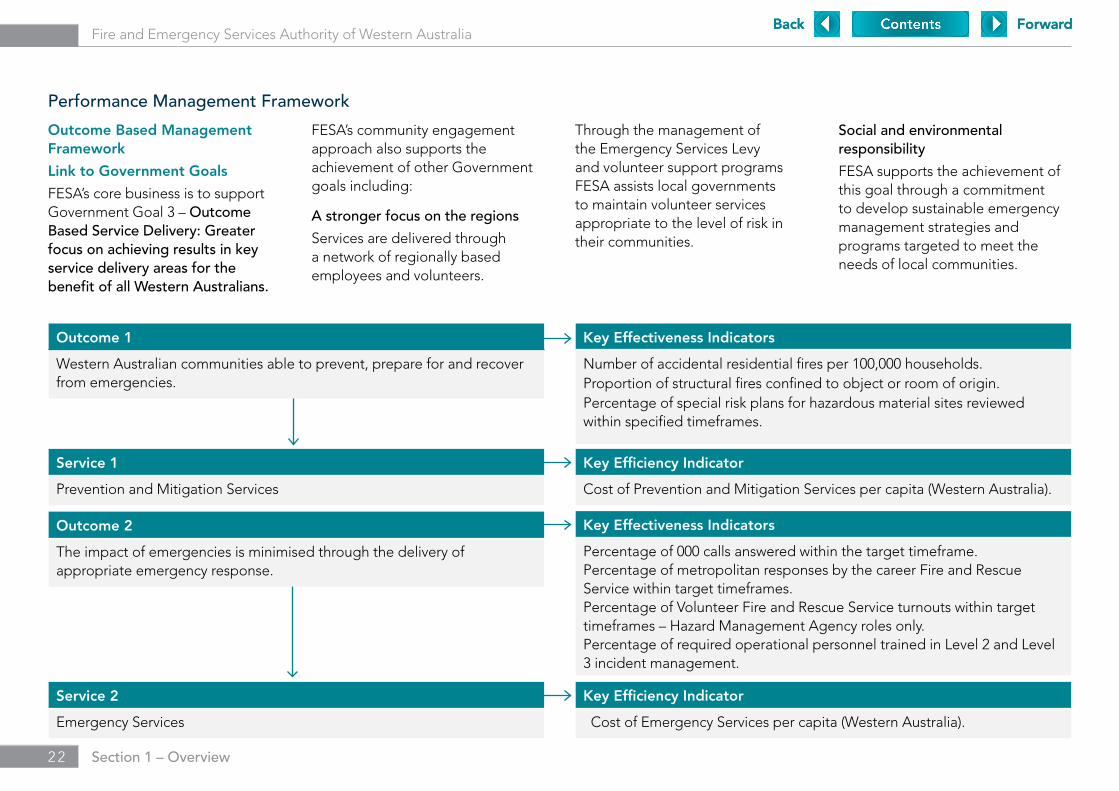
Performance Management Framework
Outcome 1
Western Australian communities able to prevent, prepare for and recover from emergencies.
Key Effectiveness Indicators
Number of accidental residential fires per 100,000 households.Proportion of structural fires confined to object or room of origin.Percentage of special risk plans for hazardous material sites reviewed within specified timeframes.
Key Effectiveness Indicators
Percentage of 000 calls answered within the target timeframe.Percentage of metropolitan responses by the career Fire and Rescue Service within target timeframes.Percentage of Volunteer Fire and Rescue Service turnouts within target timeframes – Hazard Management Agency roles only.Percentage of required operational personnel trained in Level 2 and Level 3 incident management.
Key Efficiency Indicator
Cost of Prevention and Mitigation Services per capita (Western Australia).
Outcome 2
The impact of emergencies is minimised through the delivery of appropriate emergency response.
Service 1
Prevention and Mitigation Services
Service 2
Emergency Services
Key Efficiency Indicator
Cost of Emergency Services per capita (Western Australia).
Back ForwardBack Forward
Fire and Emergency Services Authority of Western Australia
2 3 Section 1 – Overview
Changes to Outcome Based Management Framework
There were no changes to our framework in 2011/12.
Shared Responsibilities with Other Agencies
Bushfire Response
FESA is the hazard management agency for all fires within Western Australia, including areas where response is managed through local government bushfire brigades and in State forest by the Department of Environment and Conservation (DEC). Effective response is managed through agreed protocols between the agencies, combined operational response, exercises and shared training.
In November 2011, the Chief Executive Officer of FESA and Director General of DEC signed a Heads of Agreement outlining their agencies’ intention to work more collaboratively, specifically to support improved communication, consultation and transparency in the management of bushfire risk across Western Australia. The agreement was a key recommendation of
the Perth Hills Bushfire February 2011 Review. Through the Heads of Agreement, FESA and DEC have reinforced their commitment to providing joint, seamless and effective bushfire management services to the Western Australian community, based on the sharing of knowledge, resources and systems.
An Interagency Bushfire Management Committee (IBMC) was established in 2010 to ensure a common approach to the management of bushfire risk within Western Australia. Following the Perth Hills Bushfire February 2011 Review (PHBFR) recommendations the IBMC was suspended between August and November 2011. Some of the original objectives have been placed on hold pending the outcome of the Bushfire Risk Identification and Mitigation project, being led by the Department of the Premier and Cabinet.
The Office of Bushfire Risk Management, reporting to the Chief Executive Officer, has been established. The Office will support a unified approach to fuel load
management through prescribed burning and preparedness levels for urban rural fringe communities.
Weather Warnings
FESA and the Bureau of Meteorology each have a responsibility to ensure that Western Australian communities are informed and supported in preparing for emergencies caused by severe weather events. The agencies have a close working relationship, which is underpinned by a Memorandum of Understanding signed in December 2011. A meteorologist is based in the FESA State Operations Centre at FESA House and provides forecasting services to support incident management. The primary objective is to provide incident managers with an understanding of current and predicted weather conditions to improve response planning.
Arson Reduction
FESA works closely with the Western Australia Police (WAPOL) and DEC in reducing arson. A joint agency campaign launched in 2011/12 encourages the community, particularly those vulnerable to bushfire, to be vigilant against arsonists and report suspicious behaviour. The FESA Extinguish Arson Database is also an important tool that enables Fire Investigation Officers and WAPOL to identify trends and investigators to monitor suspicious fire activity and combat arson.
Back ForwardBack Forward

2 4
Fire and Emergency Services Authority of Western Australia
2 4
Page 25 Report on Operations
Page 29 Summary of Performance
Agency PerformanceSection 2
Back ForwardBack Forward

2 5 Section 2 - Agency Performance
Fire and Emergency Services Authority of Western Australia
Report on Operations
Actual Results vs Budget Targets
Resource Agreement
(Treasurer’s Instruction 808)
The following performance information (financial and non-financial) is the subject of a resource agreement signed by the Minister for Emergency Services, the Fire and Emergency Services Authority of Western Australia and the Treasurer under Part 3, Division 5 of the Financial Management Act 2006.
Resources are provided for the delivery of two services, which are linked to the two agency level outcomes.
Prevention and Mitigation Services – Western Australian communities able to prevent, prepare for and recover from emergencies.
Emergency Services – the impact of emergencies is minimised through the delivery of appropriate emergency response.
Back ForwardBack Forward
2 6 Section 2 - Agency Performance
Fire and Emergency Services Authority of Western Australia
2011/12 Target $000
2011/12 Actual $000
Variation Reason for Significant Variation between Target and Actual
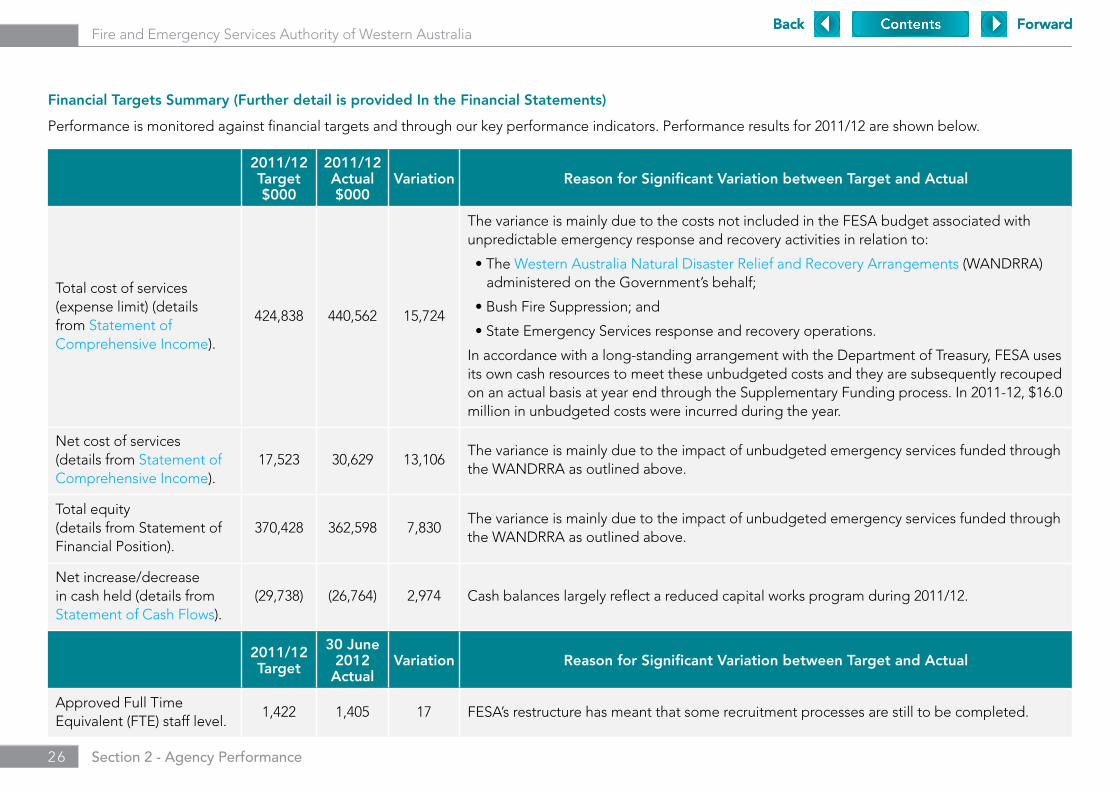
Total cost of services (expense limit) (details from Statement of Comprehensive Income).
424,838 440,562 15,724
The variance is mainly due to the costs not included in the FESA budget associated with unpredictable emergency response and recovery activities in relation to:
•TheWestern Australia Natural Disaster Relief and Recovery Arrangements (WANDRRA) administered on the Government’s behalf;
•BushFireSuppression;and
•StateEmergencyServicesresponseandrecoveryoperations.
In accordance with a long-standing arrangement with the Department of Treasury, FESA uses its own cash resources to meet these unbudgeted costs and they are subsequently recouped on an actual basis at year end through the Supplementary Funding process. In 2011-12, $16.0 million in unbudgeted costs were incurred during the year.
Net cost of services (details from Statement of Comprehensive Income).
17,523 30,629 13,106The variance is mainly due to the impact of unbudgeted emergency services funded through the WANDRRA as outlined above.
Total equity (details from Statement of Financial Position).
370,428 362,598 7,830The variance is mainly due to the impact of unbudgeted emergency services funded through the WANDRRA as outlined above.
Net increase/decrease in cash held (details from Statement of Cash Flows).
(29,738) (26,764) 2,974 Cash balances largely reflect a reduced capital works program during 2011/12.
2011/12 Target
30 June 2012
ActualVariation Reason for Significant Variation between Target and Actual
Approved Full Time Equivalent (FTE) staff level.
1,422 1,405 17 FESA’s restructure has meant that some recruitment processes are still to be completed.
Financial Targets Summary (Further detail is provided In the Financial Statements)
Performance is monitored against financial targets and through our key performance indicators. Performance results for 2011/12 are shown below.
Back ForwardBack Forward

2 7 Section 2 - Agency Performance
Fire and Emergency Services Authority of Western Australia
Key Performance Indicators Summary (Further detail is provided in Disclosures and Legal Compliance)
Our key effectiveness indicators measure the extent to which delivery of services contributes to the achievement of our desired outcomes. Our key efficiency indicators monitor the relationship between the service delivered and the resources used to deliver the service.
2011/12 Target
2011/12 Actual Variation
Outcome: Western Australian communities able to prevent, prepare for and recover from emergencies.
Service 1: Prevention and Mitigation Services
Key Effectiveness Indicators
Number of accidental residential fires per 100,000 households. Note: a lower result indicates a better performance.
70% 63.87% 6.13%
Proportion of structural fires confined to object or room of origin. 70% 77.74% 7.74%
Percentage of special risk plans for hazardous material sites reviewed within specified timeframes. 90% 90.16% 0.16%
Key Effectiveness Indicators
Cost of Prevention and Mitigation Services per capita (Western Australia). $13.00 $15.69 $2.69
Key Effectiveness Indicators
Service 2: Emergency Services
Key Effectiveness Indicators
Percentage of 000 calls answered within the target timeframe. 95% 96.63% 1.63%
Percentage of metropolitan responses by career Fire and Rescue Services within target timeframes 90% 89.73% (0.27%)
Percentage of Volunteer Fire and Rescue turnouts within target timeframes – Hazard Management Agency roles only. 90% 94.95% 4.95%
Percentage of required operational personnel trained in Level 2 incident management 90% 150% 1 60%
Percentage of required operational personnel trained in Level 3 incident management 90% 192% 2 102%
Key Effectiveness Indicators
Cost of Emergency Services per capita (Western Australia). $110.87 $104.76 ($6.11)1 72 Officers are deemed competent to manage Level 2 Incidents, with a target of 48 Officers2 23 Officers are deemed competent to manage Level 3 Incidents, with a target of 12 Officers
Back Forward
2 8 Section 2 - Agency Performance
Fire and Emergency Services Authority of Western Australia
Report on Operations
Chief Executive Officer, Mr Wayne Gregson APM, commenced with FESA on 16 September 2011. Under his direction, the organisation has commenced the implementation of a significant reform program to address recommendations from major emergency reviews to improve service delivery and emergency management in Western Australia.
Recommendations from the Perth Hills Bushfire February 2011 Review
The Perth Hills Bushfire February 2011 Review provided 55 recommendations for improving emergency management in Western Australia. Common themes, some of which had been highlighted in previous reviews, were evident. These included a need to define agency roles, responsibilities and processes during major emergency incidents, and for improved interoperability and cooperation between emergency service organisations.
FESA was the lead agency for 25 of the recommendations. At 30 June 2012, 20 had been implemented and five were still being progressed.
FESA specific priorities for 2011/12 included:
•ProgressthetransitionfromaStatutoryAuthoritytoaStateGovernmentDepartment.
•ProgressthedevelopmentofasingleEmergencyServicesAct.
•Commencetheimplementationofabroadercorporatereformprogram.
Becoming a Department
Legislation to create a State Government Department for emergency services has been drafted and is currently being considered by Cabinet. It is anticipated that FESA will become a Department by the end of 2012.
Emergency Services Act
The progression of a single Emergency Services Act is being managed through an interagency working group. Consolidation of existing emergency services legislation into one Emergency Services Act will ensure contemporary and relevant legislation for all emergency service
organisations. The Act will provide for greater interoperability and reflect new arrangements in relation to jurisdiction, functions and powers of agencies. Extensive stakeholder consultation is required and the project is likely to take several years to complete.
Corporate Reform
FESA’s broader reform program focuses on supporting and enhancing frontline operations, including improved support for volunteer groups and building interoperability with our emergency management partners.
A new corporate structure has been designed, and is based on the following principles:
•Operationallyfocused.
•Functionallybased.
•Communitycentred.
•Enabledandaccountableleadership.
•Resilientandtransparentgovernance.
•Buildsstrategiccapability.
The new structure is being implemented in phases. Key changes include a fully integrated geographical model for frontline service delivery, additional resources in the regions, renewed focus on training and improved operational capability.
The reform program includes the establishment of a Strategic Program Office (SPO) and improved communication and ideas management through the Portal2Progress.
The establishment of a Strategic Program Office supports a strategically aligned approach to service delivery improvement. Its objectives are to increase transparency in decision making, improve strategic alignment across the organisation through a holistic approach to the allocation of resourcing for projects and to support the change management process.
A Portal2Progress now supports increased frontline innovation and improve the involvement of staff and volunteers in setting strategic direction.
Back Forward

2 9 Section 2 - Agency Performance
Fire and Emergency Services Authority of Western Australia
Summary of Performance (Further detail is provided in Disclosures and Legal Compliance)
FESA’s performance is measured against nine key performance indicators linked to our two services. Our key effectiveness indicators measure the extent to which delivery of services contributes to the achievement of our desired outcomes. Our key efficiency indicators monitor the relationship between the service delivered and the resources used to deliver the service.
Service 1: Prevention and Mitigation Services
Outcome: Western Australian communities able to prevent, prepare for and recover from emergencies.
Our Prevention and Mitigation Services aim to increase community awareness of local hazards and encourage safer behaviours through the prevention and mitigation of risk. Higher risk awareness supports improved safety by reducing preventable emergencies and increasing preparedness for natural emergencies when they occur.
A targeted approach to the delivery of community awareness and education programs supports community stakeholders in reducing preventable emergencies, for example accidental fire, and in mitigating the risks of natural hazards specific to their location.
The 2011/12 results for our first two indicators show that awareness and education campaigns, such as Working Smoke Alarms and Fire Safety in Your Home are contributing to improved community safety.
In 2011/12 there were 1,442 structure fires, of which 570 were coded as accidental residential. This is eight percent fewer structure fires compared to the previous year. This reduction is a result of improvements in data coding and a real decrease in structure fire incidents.
There was an 11 percent decrease in the number of accidental residential fires in 2011/12 compared to the previous year. This decrease in the number of fires, together with a small increase since 2010/11 in the number of households in Western Australia (2.4 percent), has contributed to an improvement in our first performance indicator result.
Number of Accidental Residential Fires per 100,000 Households.Note: a lower figure indicates better performance.
Target 2007/08 2008/09 2009/10 2010/11 2011/12
70 75.83 77.73 75.70 72.80 63.87
2011/12 Results – Prevention and Mitigation Services
Back Forward
3 0 Section 2 - Agency Performance
Fire and Emergency Services Authority of Western Australia
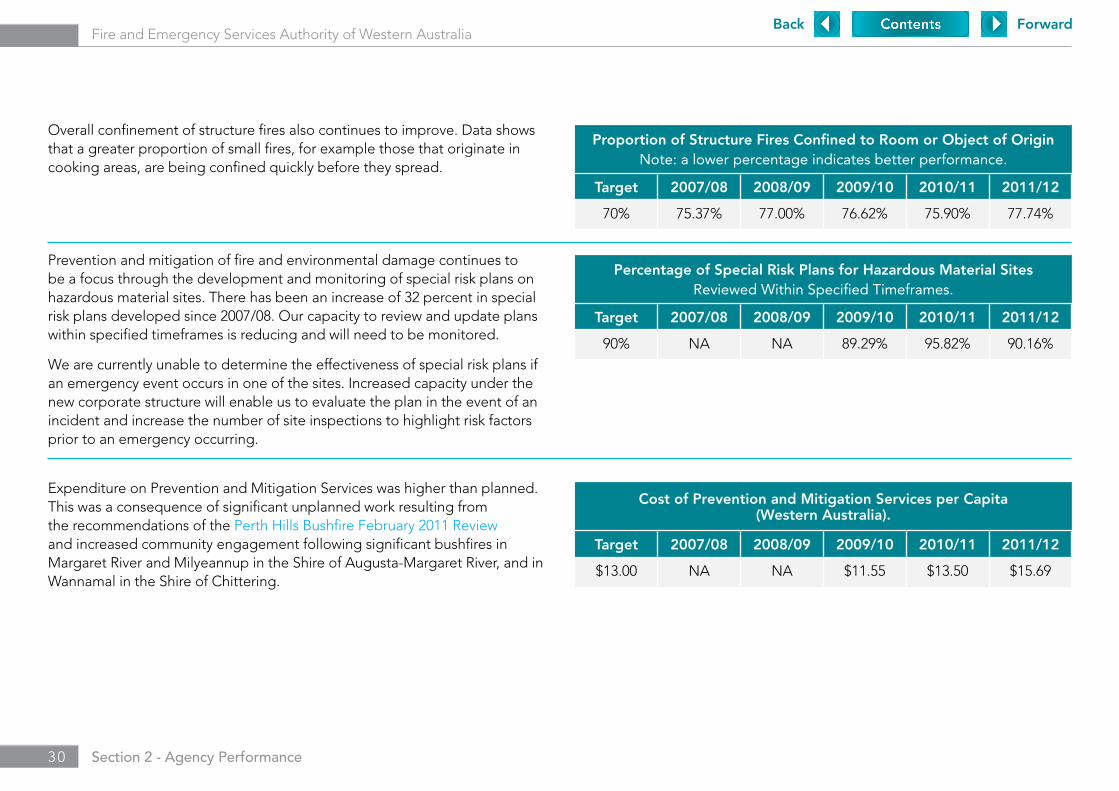
Overall confinement of structure fires also continues to improve. Data shows that a greater proportion of small fires, for example those that originate in cooking areas, are being confined quickly before they spread.
Proportion of Structure Fires Confined to Room or Object of OriginNote: a lower percentage indicates better performance.
Target 2007/08 2008/09 2009/10 2010/11 2011/12
70% 75.37% 77.00% 76.62% 75.90% 77.74%
Prevention and mitigation of fire and environmental damage continues to be a focus through the development and monitoring of special risk plans on hazardous material sites. There has been an increase of 32 percent in special risk plans developed since 2007/08. Our capacity to review and update plans within specified timeframes is reducing and will need to be monitored.
We are currently unable to determine the effectiveness of special risk plans if an emergency event occurs in one of the sites. Increased capacity under the new corporate structure will enable us to evaluate the plan in the event of an incident and increase the number of site inspections to highlight risk factors prior to an emergency occurring.
Percentage of Special Risk Plans for Hazardous Material SitesReviewed Within Specified Timeframes.
Target 2007/08 2008/09 2009/10 2010/11 2011/12
90% NA NA 89.29% 95.82% 90.16%
Expenditure on Prevention and Mitigation Services was higher than planned. This was a consequence of significant unplanned work resulting from the recommendations of the Perth Hills Bushfire February 2011 Review and increased community engagement following significant bushfires in Margaret River and Milyeannup in the Shire of Augusta-Margaret River, and in Wannamal in the Shire of Chittering.
Cost of Prevention and Mitigation Services per Capita (Western Australia).
Target 2007/08 2008/09 2009/10 2010/11 2011/12
$13.00 NA NA $11.55 $13.50 $15.69
Back Forward

3 1 Section 2 - Agency Performance
Fire and Emergency Services Authority of Western Australia
2011/12 Focus and Key Achievements – Prevention and Mitigation Services
Community Liaison Unit
A FESA Community Liaison Unit (CLU) has been established to ensure current incident information is available to affected communities and those under threat. When activated, it provides a conduit for timely and accurate information from emergency incident control centres to individuals, special interest groups, communities and support agencies to assist recovery.
The CLU provides current fire information updates, current bushfire warnings, road closures, weather updates, the latest fire map, incident photos, details of resources being used and contacts for recovery support.
Feedback from community members about the level of information and support provided has been extremely positive. The CLU also has an important role in gathering information from affected communities to better understand levels of community preparedness prior to the occurrence of emergencies and to support ongoing improvement to service delivery.
Bushfire Threat Mitigation
FESA and the Department of Regional Development and Lands have a formal Memorandum of Understanding that delegates the responsibility for the management of approximately 0.89 million hectares of unallocated Crown land and unmanaged reserves in town sites across Western Australia.
Bushland Mitigation Officers (BMOs) work on a ‘tenure blind’ basis to establish Bushfire Risk Management Plans in all high risk bushfire prone communities. These plans are developed in conjunction with key stakeholders such as local government, DEC, bushfire brigades and other groups. Critical infrastructure is also being identified and BMOs are working with the appropriate agencies to ensure treatment options are established.
FESA also provides significant support to local governments, bushfire volunteers, government agencies and private landowners in the management of their bushlands.
Total Fire Bans
Changes to Total Fire Ban regulations came into effect on 3 December 2011, and are designed to address feedback from agricultural industries and reduce fire ignition during high fire danger periods. A major community awareness campaign assisted the community, and farmers in particular, understand the changes and their impacts.
The campaign included:
•Theestablishmentofadedicatedinformationlineforthechangesandcurrent bans.
•Distributionofmagnetstofarmerspromotingtheinformationline.
•DevelopmentofaSafe Harvesting Practices brochure.
•Advertisementsinfarmingpublications.
•InclusionofuptodateinformationonTotalFireBans,FireDangerRatings,Media Releases, Active Incidents and Alerts and Warnings on the FESA website.
•Developmentofaquickreferencetooltoguidestaffandvolunteersinproviding advice on activity restrictions.
Revised Community Awareness Information
A range of community awareness information has been revised and improved to assist community members prepare for weather related emergencies such as bushfire, flood and cyclone:
•TheBushfire Travellers Checklist assists travellers in Western Australia to understand the risks of bushfire and what to do in a bushfire situation.
•ThetranslationoftheCyclone Smart Alert Card into six Asian languages supports understanding of the risk and preparedness activities for mitigating impact during cyclones.
•TherevisionoftheFlood Smart brochure to improve understanding of warnings and alerts, safe travel during flood events and provide a template for household flood planning.
Back Forward

3 2 Section 2 - Agency Performance
Fire and Emergency Services Authority of Western Australia
Service 2: Emergency Services
Outcome: The Impact of emergencies is minimised through the delivery of appropriate emergency services.
FESA Emergency Services focuses on providing all areas of Western Australia with timely and appropriate response when emergencies occur. This includes ensuring that we have adequate resources and our staff and volunteers are appropriately trained to undertake their roles to protect community safety and reduce life and property loss caused by emergencies.
During 2011/12, operational personnel responded to 29,843 incidents, a five percent increase compared to 2010/11. The major increase was in system initiated false alarms, which comprised more than 35 percent of FESA response compared to 32 percent in 2010/11. Although operational responses increased, the FESA Communication Centre received significantly fewer calls, recording a reduction of more than 13 percent compared to the previous year. This is likely to be a consequence of improved community information resulting in fewer duplicate calls. Fewer calls enabled us to meet our target for answering within 20 seconds.
Percentage of 000 Calls Answered Within the Target Timeframe.
Target 2007/08 2008/09 2009/10 2010/11 2011/12
95% 98.33% 97.82% 97.64% 96.89% 96.63%
Response time results were also encouraging with responses to life threatening emergencies, being structure fire and road crash rescue, meeting targets. Overall, metropolitan based career firefighters met their 50th percentile response time target and were marginally slower than their 90th percentile target.
Percentage of Metropolitan Responses by the Career Fire and Rescue Service Within Target Timeframes
Target 2007/08 2008/09 2009/10 2010/11 2011/12
90% 87.16% 87.20% 89.00% 89.60% 89.73%
Volunteer turnouts within 14 minutes exceeded the target with 94.95 percent of turnouts meeting this timeframe. Percentage of Volunteer Fire and Rescue Service Turnouts Within
Target Timeframes – Hazard Management Agency Roles Only.
Target 2007/08 2008/09 2009/10 2010/11 2011/12
90% 87.61% 86.41% 87.75% 95.23% 94.95%
2011/12 Results – Emergency Services
Back Forward

3 3 Section 2 - Agency Performance
Fire and Emergency Services Authority of Western Australia
1 72 Officers are deemed competent to manage Level 2 Incidents, with a target of 48 Officers 2 23 Officers are deemed competent to manage Level 3 Incidents, with a target of 12 Officers
The capacity to manage concurrent large scale incidents is a major factor for ensuring the State is prepared, particularly for bushfire. Significant work has been undertaken this year to audit operational training records and validate the competencies of managers across Western Australia. There has also been a focus on training volunteers as competent Level 2 incident managers and for other roles in incident management teams. This work will continue through the implementation of the professional pathways initiatives and cross agency training focus, which was a key recommendation from the Perth Hills Bushfire February 2011 Review.
Percentage of Required Operational Personnel Trained in Level 2 Incident Management.1
Target 2007/08 2008/09 2009/10 2010/11 2011/12
90% NA NA 92% 106% 150%
Percentage of Required Operational Personnel Trained in Level 3 Incident Management.2
Target 2007/08 2008/09 2009/10 2010/11 2011/12
90% NA NA 150% 133% 192%
The cost to provide Emergency Services this year was marginally lower than the target figure. It is important to note that relief and recovery payments associated with unprecedented emergency disasters in 2010/11 would distort the results for this indicator and have been excluded from the calculation on the advice of the Office of the Auditor General.
Cost of Emergency Services per Capita (Western Australia).
Target 2007/08 2008/09 2009/10 2010/11 2011/12
$110.87 NA NA $86.28 $99.84 $104.76
Back Forward
3 4 Section 2 - Agency Performance
Fire and Emergency Services Authority of Western Australia
Operational Overview
Record rainfall in autumn and winter 2011 and subsequent high fuel loads resulted in a particularly challenging bushfire season. Devastating fires in the Margaret River area in late November were followed by fires that came dangerously close to communities in Molloy Island and Augusta in early December.
The South West bushfires were the first time that all FESA operational services were involved in a major emergency with State Emergency Services supporting firefighters in logistical roles and volunteer Marine Rescue Services assisting with evacuation of tourists from Augusta using jet skis and rescue vessels.
Firefighters also attended large scale fires in the Midwest Gascoyne, Lower South West and areas in the urban fringes of the Perth metropolitan area.
Two large structure fires involving scrap metal caused health concerns as a result of the large volumes of smoke created.
Operational personnel were kept busy with the development of Tropical Cyclone Grant in December 2011. Less than three weeks later Tropical Cyclone Heidi and Tropical Cyclone Iggy crossed the Pilbara coast within two weeks of each other. They were later followed by Tropical Cyclone Lua. These four events caused widespread flooding associated with monsoonal rain and thunderstorms.
The State Emergency Service carried out several high profile rescues, including that of a youth who fell almost 40 metres down a cliff face at Ellendale Pool south of Geraldton and assisting an injured woman who broke her leg while conducting research on a remote island south west of Albany.
Volunteer Marine Rescue Services assisted boating communities across Western Australia, including providing aid to stricken vessels off the Christmas Island coastline which were allegedly carrying illegal entry immigrants.
2011/12 Focus and Key Achievements – Emergency Services
Our focus this year has been on improving interoperability, capability, preparedness and response through the following strategies.
Interoperability
Commonwealth Heads of Government Meeting
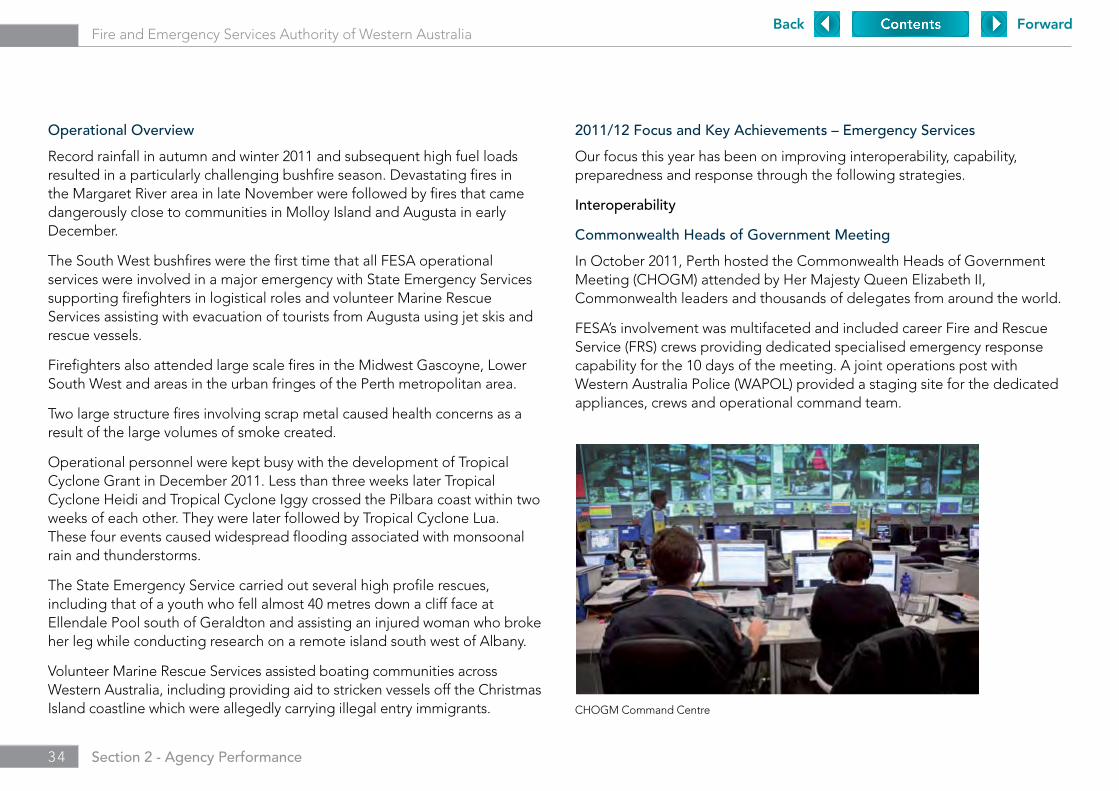
In October 2011, Perth hosted the Commonwealth Heads of Government Meeting (CHOGM) attended by Her Majesty Queen Elizabeth II, Commonwealth leaders and thousands of delegates from around the world.
FESA’s involvement was multifaceted and included career Fire and Rescue Service (FRS) crews providing dedicated specialised emergency response capability for the 10 days of the meeting. A joint operations post with Western Australia Police (WAPOL) provided a staging site for the dedicated appliances, crews and operational command team.
CHOGM Command Centre
Back Forward
3 5 Section 2 - Agency Performance
Fire and Emergency Services Authority of Western Australia
The FRS also provided specialised response to the various venues used for meetings and accommodation. Operational site liaison officers worked closely with the other security agencies to ensure rapid response to incidents.
The FESA Communications Centre and State Operations Centre were bolstered throughout the event with extra staff to deal with any issues occurring at a CHOGM site.
State Emergency Service (SES) volunteers assisted WAPOL ensure public safety during the Queen’s motorcade and during the Royal visit to the ‘Big Aussie Barbeque’ attended by more than 100,000 people. SES volunteers also provided communications support. In the months leading up to the event, exercises were held for the various FESA personnel involved, including a multiagency field exercise (Canister), mass decontamination drills, senior management discussion exercises, and a response and communications exercise.
FESA’s contribution to CHOGM also included specialised training sessions for all firefighters involved in the CHOGM Task Force.
Incident Information Management
FESA has implemented an interim web-based emergency operations centre hosted on Western Australia Police system infrastructure. Information boards have been developed to improve information sharing during major incidents.
The information boards also provide ‘real time’ views of regional and State level preparedness and the availability of operational and support staff to respond to emergencies.
The WebEOC has significantly improved the transparency of decision making during emergencies and provides greater access to timely information for planning and managing emergency response.
Western Australian Marine Search and Rescue
The development this year of a robust and secure reporting system for marine search and rescue incidents is a major step forward for improving the quality and accuracy of marine search and rescue data. The system was developed for Volunteer Marine Rescue Services (VMRS), Volunteer Marine Rescue (VMR) Groups, WA Water Police (WAWP) and the Department of Transport (DoT) through a joint agency funding arrangement. This is the first time that multiple emergency service agencies in Western Australia have stored and shared incident data through a single software system.
The system is accessed via the web and enables users from across Western Australia to capture and report accurate incident data in a timely manner. It significantly reduces the challenges and inconsistencies associated with collating information from discrete single agency systems.
Interagency Bushfire Management Committee
The Interagency Bushfire Management Committee (IBMC) was suspended in August 2011 following the commencement of the Department of the Premier and Cabinet (DPC) led implementation structure for the Perth Hills Bushfire February 2011 Review (PHBFR) recommendations.
The IBMC recommenced in November 2011 but due to the commitment of members to the implementation of the PHBFR the IBMC is not yet fully functional. The Fuel Load Management sub committee remains suspended as the members of that group are working in the DPC led Bushfire Risk Identification and Mitigation project.
Key elements of IBMC progress for the period during 2011/12 when the committee was operating included:
•Developmentofastatewideaccreditationandperformancereviewmodelfor Level 3 Incident Controllers.
Back Forward

3 6 Section 2 - Agency Performance
Fire and Emergency Services Authority of Western Australia
•DeliveryofaStateBushfireResearchForumattheUniversityofWesternAustralia in October 2011.
•Furtherdevelopmentofacommontoolboxofformsforoperationalprocedures.
•FacilitationofBushfireCooperativeResearchCentreHumanFactorsworkshops in June 2012.
•Asignificantincreaseinjointagencytrainingopportunitiesandevents.
Capability
Addition of Erickson Aircrane to Aviation Services
With the potential for above average bushfire danger in the South West, FESA welcomed the addition of an Erickson 64E Aircrane to assist aerial firefighting operations for the first time. Based at Jandakot, it was the largest firebombing aircraft in the State’s fleet with a tank capacity up to 9,500 litres. It can refill in as little as 20 seconds when it has access to the ocean. The Erickson Aircrane joins six rotary aircraft and two fixed wing aircraft in supporting and protecting ground crews to combat large bushfires.
Operational Resourcing
Four additional tanker appliances were delivered in time for the southern bushfire season. The new appliances were the outcome of a project to design a tanker that incorporated the best features of existing urban and rural appliances. Once the threat of major fires in the south had diminished, the new vehicles were relocated to the Kimberley and Pilbara regions for the northern fire season.
Erickson 64E Aircrane
One of four appliances that will be mobilised for both the northern and southern bushfire seasons
Back Forward
3 7 Section 2 - Agency Performance
Fire and Emergency Services Authority of Western Australia
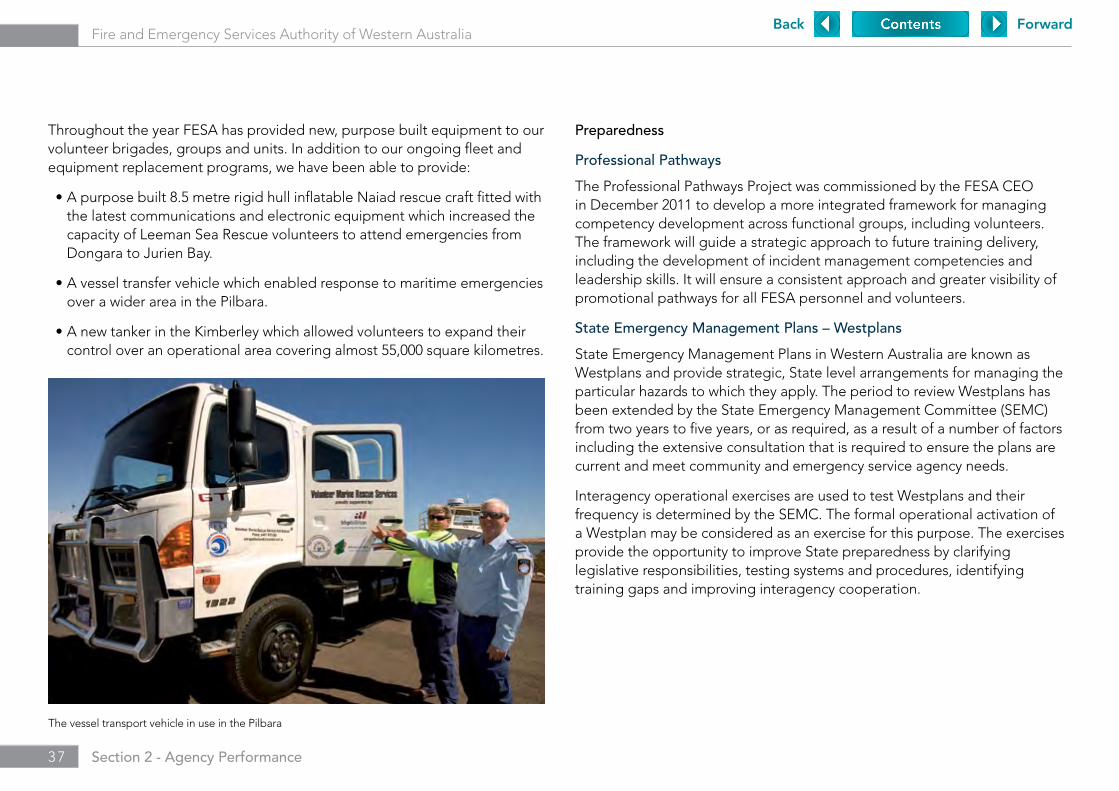
Throughout the year FESA has provided new, purpose built equipment to our volunteer brigades, groups and units. In addition to our ongoing fleet and equipment replacement programs, we have been able to provide:
•Apurposebuilt8.5metrerigidhullinflatableNaiadrescuecraftfittedwiththe latest communications and electronic equipment which increased the capacity of Leeman Sea Rescue volunteers to attend emergencies from Dongara to Jurien Bay.
•Avesseltransfervehiclewhichenabledresponsetomaritimeemergenciesover a wider area in the Pilbara.
•AnewtankerintheKimberleywhichallowedvolunteerstoexpandtheircontrol over an operational area covering almost 55,000 square kilometres.
Preparedness
Professional Pathways
The Professional Pathways Project was commissioned by the FESA CEO in December 2011 to develop a more integrated framework for managing competency development across functional groups, including volunteers. The framework will guide a strategic approach to future training delivery, including the development of incident management competencies and leadership skills. It will ensure a consistent approach and greater visibility of promotional pathways for all FESA personnel and volunteers.
State Emergency Management Plans – Westplans
State Emergency Management Plans in Western Australia are known as Westplans and provide strategic, State level arrangements for managing the particular hazards to which they apply. The period to review Westplans has been extended by the State Emergency Management Committee (SEMC) from two years to five years, or as required, as a result of a number of factors including the extensive consultation that is required to ensure the plans are current and meet community and emergency service agency needs.
Interagency operational exercises are used to test Westplans and their frequency is determined by the SEMC. The formal operational activation of a Westplan may be considered as an exercise for this purpose. The exercises provide the opportunity to improve State preparedness by clarifying legislative responsibilities, testing systems and procedures, identifying training gaps and improving interagency cooperation.
The vessel transport vehicle in use in the Pilbara
Back Forward

3 8 Section 2 - Agency Performance
Fire and Emergency Services Authority of Western Australia
Westplan Status 2011/12 Activations/ Exercises
Westplan – Bushfire Current.
Currently under review – to be completed prior to the 2012/13 southern bushfire season.
8 November 2011 – State Bushfire Exercise involving staff from metropolitan and regional FESA, DEC, WAPOL and local government in six regionally based exercises.
23 November 2011 – Shire of Augusta-Margaret River.
23 November 2011 – Milyeannup – Nannup.
29 January 2012 – Wannamal, Shire of Chittering.
20-29 February 2012 – Carnarvon complex of nine fires.
Westplan – CBRN (Chemical Biological Radiological and Nuclear
Current. 10 August 2011 (District Exercise) – Testing capabilities and working arrangements within FESA, Chemcentre and the Kwinana Industries Mutual Aid network to respond to a major chemical release at a Kwinana facility.
23 September 2011 – Incident involving 200 kilograms of ammonium nitrate spilled from four bulk bags onto Great Northern Highway, Wubin.
24 September 2011 – Field Exercise (multiagency) testing capability and response to a chemical release at a major sporting facility resulting in mass causalities and involving a dignitary.
21 October 2011 – Incident involving a suspect package containing white powder opened in Dianella.
25-27 June 2012 (District Exercise and Tabletop Chemical and Biological release) – Multiagency program to promote capabilities and response arrangements across agencies.
Westplan – Collapse Current. 17 and 29 May 2012 (Operation Validation) – Multiagency exercise without prior knowledge of the USAR Task Force, simulating a residential structure collapse to test USAR deployment capabilities.
Westplan – Earthquake Current. Nil
The current status of Westplans is as follows:
Back Forward

3 9 Section 2 - Agency Performance
Fire and Emergency Services Authority of Western Australia
Westplan Status 2011/12 Activations/ Exercises
Westplan – Tropical Cyclone Current. 21 December 2011 – Tropical Cyclone Grant.
10 January 2012 – Tropical Cyclone Heidi.
27 January-3 February 2012 – Tropical Cyclone Iggy.
12 March 2012 – Tropical Cyclone Lua.
Westplan – Flood Current. 12 December 2011 (Town of Williams) – Flooding following widespread thunderstorms during two major rain events.
Westplan – Hazmat Current. 13 January 2012 – Sims Scrap Metal Yard.
12 March 2012 – Vessel docked in Fremantle Harbour with suspicious odour.
13 April 2012 – Road tanker carrying 7,000 litres of unleaded petrol and 52,000 litres of diesel fuel rolled over requiring a multiagency response.
Westplan – Tsunami Current. 12 October 2011 (Indian Ocean Wave11) – International exercise to test the response procedures and communications across Joint Australian Warning Centre, BoM regional forecasting centres, Attorney General’s Department and Western Australian agencies.
Westplan – Urban Fire* Review required. 1 September 2011 (Atama Furniture) – Multiagency response to factory fire with structure collapse and threat of toxic smoke due to industrial manufacturing materials.
25 April 2012 – Multiagency response to a nine storey block of residential flats.
Westplan Telecommunications
Review required.
Westplan – Freight Subsidy Review required. FESA Internal operational procedures for this Westplan were reviewed in 2011. Future responsibility for the plan is currently being considered in the light of the broader responsibility for sustainability of food supply which now resides with the Department of Agriculture and Food (DAF). Consultation with DAF is currently underway to ascertain whether the responsibility for this Westplan could be transferred to them.
Westplan – Severe Storm Currently under review. 30-31 December 2011 – Shires of Katanning, Kent, Wandering, Cuballing, Wickepin and Dumbleyung.
10-14 June 2012 – Severe Storm across Perth and the South West.
* Previously ‘Structure Fire’
Back Forward
4 0
Fire and Emergency Services Authority of Western Australia
Significant Issues Impacting on FESASection 3Page 41 Current and Emerging Issues and Trends
Page 41 Economic and Social Trends
Page 41 Changes to Written Law
Page 43 Likely Developments and Forecast Results of Operations
Back ForwardBack Forward
4 1 Section 3 - Significant Issues Impacting on FESA
Fire and Emergency Services Authority of Western Australia
Current and Emerging Issues and Trends
• Improving emergency services through lessons learned:
− Implementation of the FESA reform program in line with the recommendations of the Perth Hills Bushfire February 2011 Review will see FESA restructured as a State Government Department. The new department’s structure will be more operationally focused, functionally based, underpinned by enabled and accountable leadership through resilient and transparent governance, building strategic capability and supported by increased community awareness. The review made 55 recommendations, and FESA is the lead agency for 25 of these. As at 30 June 2012, 20 had been implemented and five were still being progressed.
− FESA will focus on improved preparedness for a predicted increase in service delivery demands. A priority is to improve interoperability and information sharing with emergency management partners to ensure effective incident response regardless of concurrent large scale events. The restructure will support increased capacity for operational preparedness and capability planning and include the establishment of a fourth metropolitan region. Greater use of technology and increased technical support during incidents will improve intelligence and management planning. Evaluation of capacity to meet training demands resulting from increased operational capacity and structural reform will include a focus on the development of agreed training standards to support improved interoperability.
Economic and Social Trends
– The frequency and severity of natural hazards such as large scale bushfires, cyclones and floods is anticipated to increase. The development of a State Risk Register to assess the community’s vulnerability to hazard risks and resilience levels will support the prioritisation of mitigation strategies.
− Residential growth in the urban/rural interface is increasing the vulnerability of people and property. The establishment of an Office of Bushfire Risk Management will ensure appropriate risk assessment is undertaken prior to scheduling prescribed burning in locations that may affect residential areas. The extension of gazetted fire areas to match urban growth in the South West and Metropolitan regions will support improved emergency response and targeted community engagement programs will raise awareness of emergency risk responsibility and preparedness planning.
Changes to Written Law
Emergency Management Amendment Regulations 2011
The Emergency Management Amendment Regulations 2011 came into effect on 19 July 2011. Section 6 of the Emergency Management Act 2005 allows for the prescription of ‘combat agencies’ and ‘support organisations’. A combat agency is responsible for performing an emergency management activity prescribed by the regulations and a support organisation is responsible for providing support functions prescribed by the regulations.
The amendment regulations provided for the following combat agencies and support organisations within the Emergency Management Regulations 2006:
•Regulation26–DepartmentofHealth–combatagencyfortheprovisionof health services.
•Regulation27–StJohnAmbulanceAustralia(WesternAustralia)Incorporated – combat agency for the provision of health services.
•Regulation28–PoliceForceofWesternAustralia–combatagencyfortheprovision of disaster victim identity management.
•Regulation29–PoliceService–combatagencyfortheprovisionofdisaster victim identity management.
Back ForwardBack Forward
4 2 Section 3 - Significant Issues Impacting on FESA
Fire and Emergency Services Authority of Western Australia
•Regulation30–DepartmentofEnvironmentandConservation–combatagency for the provision of fire suppression.
•Regulation31–LocalGovernment–combatagencyfortheprovisionoffire suppression.
•Regulation32–DepartmentforChildProtection–supportorganisationfor the provision of welfare services.
The intent of the regulations is to provide clarity as to which entity may carry out particular functions, and ensure the information exchange and volunteer employment protection provisions of the Act operate effectively.
Bush Fires Amendment Regulations 2011
The Bush Fires Amendment Regulations 2011 came into effect on 2 December 2011. These regulations amended regulation 24A of the Bush Fires Regulations 1954 to delete the definitions of fire fighting vehicle and necessary agricultural activity. The intent was to broaden the allowable agricultural activities during a Total Fire Ban. The requirement under regulation 24C to cease activities when the bushfire danger index reaches or exceeds 35 will ensure activities can only be carried out when the weather conditions allow this to be done safely.
Regulation 24A(5A) was further amended to insert a clause to clarify that the exemption allowed under subregulation (5A), does not include an agricultural activity that involves a process or operation that has been specified for the purposes of section 27A(1)(a)(ii) as likely to create a bushfire danger.
Regulations 24C and 24A were also amended by removing the words vehicle movement. This is to distinguish a ban under regulation 24C from a ban under regulation 38A which has historically been known as a vehicle movement ban.
Emergency Management Amendment Regulations 2012
The Emergency Management Amendment Regulations 2012 came into effect on 13 March 2012. The regulations amended the Emergency Management Regulations 2006 to create a new hazard of heatwave. The State Health Coordinator, Department of Health was prescribed as the hazard management agency for the hazard of heatwave, for the emergency management aspect of response, for the whole of the State.
Further, regulation 21 of the Emergency Management Regulations 2006 was amended to replace all references to WestNet Rail Pty Ltd with Brookfield Rail Pty Ltd. This followed WestNet Rail Pty Ltd filing a Certificate of Registration on Change of Name with Australian Securities and Investments Commission to change their name to Brookfield Rail Pty Ltd.
Building Act 2011
The introduction in April 2012 of Western Australia’s Building Act 2011, and its supporting regulations, was intended to improve consistency in building application approvals and streamline a previously onerous process. Unfortunately, the implementation of new regulations has experienced a number of teething problems resulting in building approval and construction delays.
The regulations now require all building projects, regardless of project size, to obtain a building permit, including fire safety input from FESA. This has resulted in a significant increase in volume of submissions to FESA, which coupled with tight feedback turnaround timeframes, is creating workload pressures.
The Building Commission is working with stakeholders, including FESA, to amend the regulations to provide better clarity of approval processes.
Back ForwardBack Forward

4 3 Section 3 - Significant Issues Impacting on FESA
Fire and Emergency Services Authority of Western Australia
Likely Developments and Forecast of Results of Operations
The recommendations from major incident reviews continue to have a significant impact on the way that FESA and other emergency service agencies manage future major emergencies within Western Australia.
FESA has been allocated additional resourcing over the next four years to fund a range of initiatives that will increase State resourcing, preparedness levels and capacity to respond to incidents in high bushfire risk locations and further progress FESA’s corporate reform program. These include:
•Allocationofinformationtechnologyandspatialinformationspecialistsproviding increased support to incident management teams during significant incidents.
•Increasedcommunityengagementstrategiesforhighriskgroups,including dedicated resources in the South West, Lower South West and Great Southern regions, as well as ongoing support for the newly established Community Liaison Unit.
•EnhancedchangemanagementandgovernancefunctionswithinFESA.
•Structuralreform,includingthetransitionofFESAtoaGovernmentDepartment.
•ProvidingenhancedservicedeliverythroughthedeclarationofaSpecialCape Zone Response Area and expansion of gazetted response districts in the South West Cape and Metropolitan regions.
•RestructureoftheStateEmergencyManagementCommitteetoincludean independent Chairperson, improved processes for reporting to the Minister for Emergency Services on the State’s preparedness levels and the transition of Emergency Management Western Australia to become a secretariat for the Committee.
•TheestablishmentofanindependentOfficeofBushfireRiskManagementto manage prescribed burning approvals within the South West Bushfire Risk Zone and other high risk areas of the State.
•Enhancedoperationalpreparednessthroughdecentralisedtrainingdelivery across metropolitan and regional areas, development of a targeted operational exercise calendar that includes all stakeholders, community members and volunteers, and a robust, transparent review process for operational exercises.
FESA will relocate to the new Emergency Services Complex in Cockburn in October 2012. All staff currently located at FESA House, including the FESA Communication Centre, will move to the purpose built facility which features the latest in workplace design and meets strict environmental standards.
The new facility will provide a highly resilient telephony and information technology environment ensuring improved reliability and disaster recovery abilities.
The potential sale of the FESA House site in Hay Street, Perth is being considered through an expression of interest to purchase process being managed through Tourism Western Australia and the State Government.
The State Government recently endorsed the transfer of street hydrants from FESA and local governments to water service licence holders such as Water Corporation, AqWest and Busselton Water under the Water Services Bill 2011. Amendments to this Bill are currently being considered by Parliament.
This change was a key recommendation of the Perth Hills Bushfire February 2011 Review and recommendations from the Community Development and Justice Standing Committee 2006 Inquiry into Fire and Emergency Services Legislation. The Water Corporation has confirmed that it will assume responsibility for repair and maintenance of all fire hydrants connected to its network from 1 July 2012. The transfer of hydrants in areas managed by AqWest and Busselton Water will follow once the legislation is enacted.
Back ForwardBack Forward

4 4
Fire and Emergency Services Authority of Western Australia
Page 45 Financial Statements
Page 100 Key Performance Indicators
Page 116 Independent Audit Opinion
Page 119 Ministerial Directives and Communication
Page 119 Other Financial Disclosures
Page 125 Governance Disclosures
Page 133 Other Legal Requirements
Page 138 Government Policy Requirements
Disclosures and Legal ComplianceSection 4
Back ForwardBack Forward
4 5 Section 4 - Disclosures and Legal Compliance
Fire and Emergency Services Authority of Western Australia
Financial Statements
Certification of Financial Statements for the year ended 30 June 2012
The accompanying financial statements of the Fire and Emergency Services Authority of Western Australia have been prepared in compliance with the provisions of the Financial Management Act 2006 from proper accounts and records to present fairly the financial transactions for the financial year ended 30 June 2012 and the financial position as at 30 June 2012.
At the date of signing we are not aware of any circumstances which would render the particulars included in the financial statements misleading or inaccurate.
R Zatella W Gregson APM, MBA, BAChief Finance Officer Member of Accountable Authority
27 August 2012 27 August 2012
A Skinner PSM, FAIM, FIPAAChairman of Accountable Authority
27 August 2012
Back ForwardBack Forward
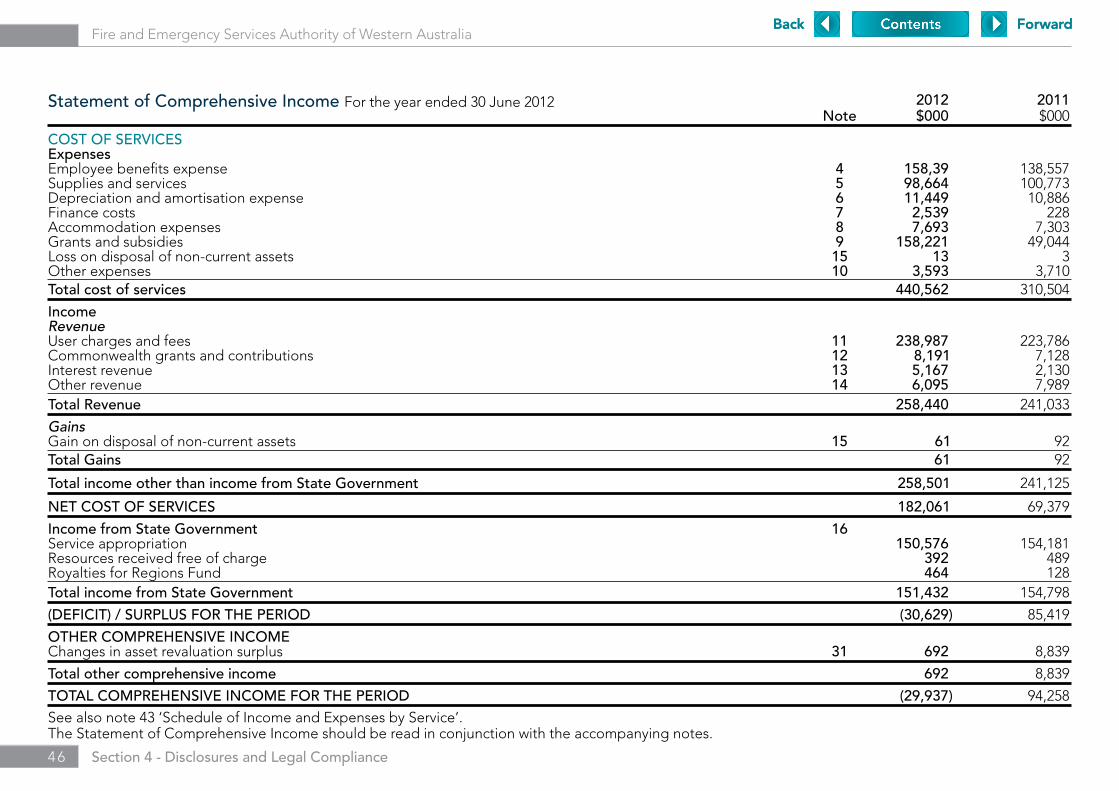
4 6 Section 4 - Disclosures and Legal Compliance
Fire and Emergency Services Authority of Western Australia
See also note 43 ‘Schedule of Income and Expenses by Service’. The Statement of Comprehensive Income should be read in conjunction with the accompanying notes.
Statement of Comprehensive Income For the year ended 30 June 2012 2012) 2011 Note $000) $000
COST OF SERVICES Expenses Employee benefits expense 4 158,39) 138,557 Supplies and services 5 98,664) 100,773 Depreciation and amortisation expense 6 11,449) 10,886 Finance costs 7 2,539) 228 Accommodation expenses 8 7,693) 7,303 Grants and subsidies 9 158,221) 49,044 Loss on disposal of non-current assets 15 13) 3 Other expenses 10 3,593) 3,710 Total cost of services 440,562) 310,504
Income Revenue User charges and fees 11 238,987) 223,786 Commonwealth grants and contributions 12 8,191) 7,128 Interest revenue 13 5,167) 2,130 Other revenue 14 6,095) 7,989 Total Revenue 258,440) 241,033
Gains Gain on disposal of non-current assets 15 61) 92 Total Gains 61) 92
Total income other than income from State Government 258,501) 241,125
NET COST OF SERVICES 182,061) 69,379
Income from State Government 16 Service appropriation 150,576) 154,181 Resources received free of charge 392) 489 Royalties for Regions Fund 464) 128 Total income from State Government 151,432) 154,798
(DEFICIT) / SURPLUS FOR THE PERIOD (30,629) 85,419
OTHER COMPREHENSIVE INCOME Changes in asset revaluation surplus 31 692) 8,839
Total other comprehensive income 692) 8,839
TOTAL COMPREHENSIVE INCOME FOR THE PERIOD (29,937) 94,258
Back ForwardBack Forward
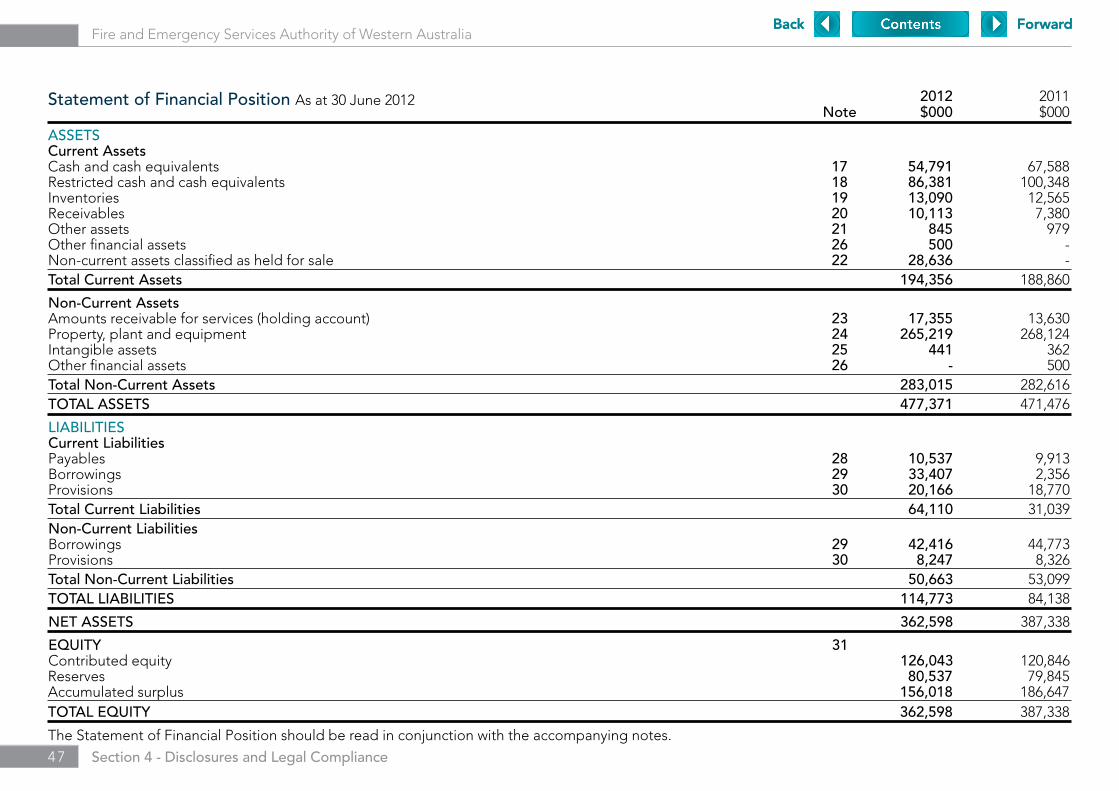
4 7 Section 4 - Disclosures and Legal Compliance
Fire and Emergency Services Authority of Western Australia
2012 2011 Note $000 $000
ASSETS Current Assets Cash and cash equivalents 17 54,791 67,588 Restricted cash and cash equivalents 18 86,381 100,348 Inventories 19 13,090 12,565 Receivables 20 10,113 7,380 Other assets 21 845 979 Other financial assets 26 500 - Non-current assets classified as held for sale 22 28,636 - Total Current Assets 194,356 188,860
Non-Current Assets Amounts receivable for services (holding account) 23 17,355 13,630 Property, plant and equipment 24 265,219 268,124 Intangible assets 25 441 362 Other financial assets 26 - 500 Total Non-Current Assets 283,015 282,616 TOTAL ASSETS 477,371 471,476
LIABILITIES Current Liabilities Payables 28 10,537 9,913 Borrowings 29 33,407 2,356 Provisions 30 20,166 18,770 Total Current Liabilities 64,110 31,039 Non-Current Liabilities Borrowings 29 42,416 44,773 Provisions 30 8,247 8,326 Total Non-Current Liabilities 50,663 53,099 TOTAL LIABILITIES 114,773 84,138
NET ASSETS 362,598 387,338
EQUITY 31 Contributed equity 126,043 120,846 Reserves 80,537 79,845Accumulated surplus 156,018 186,647 TOTAL EQUITY 362,598 387,338
Statement of Financial Position As at 30 June 2012
The Statement of Financial Position should be read in conjunction with the accompanying notes.
Back ForwardBack Forward
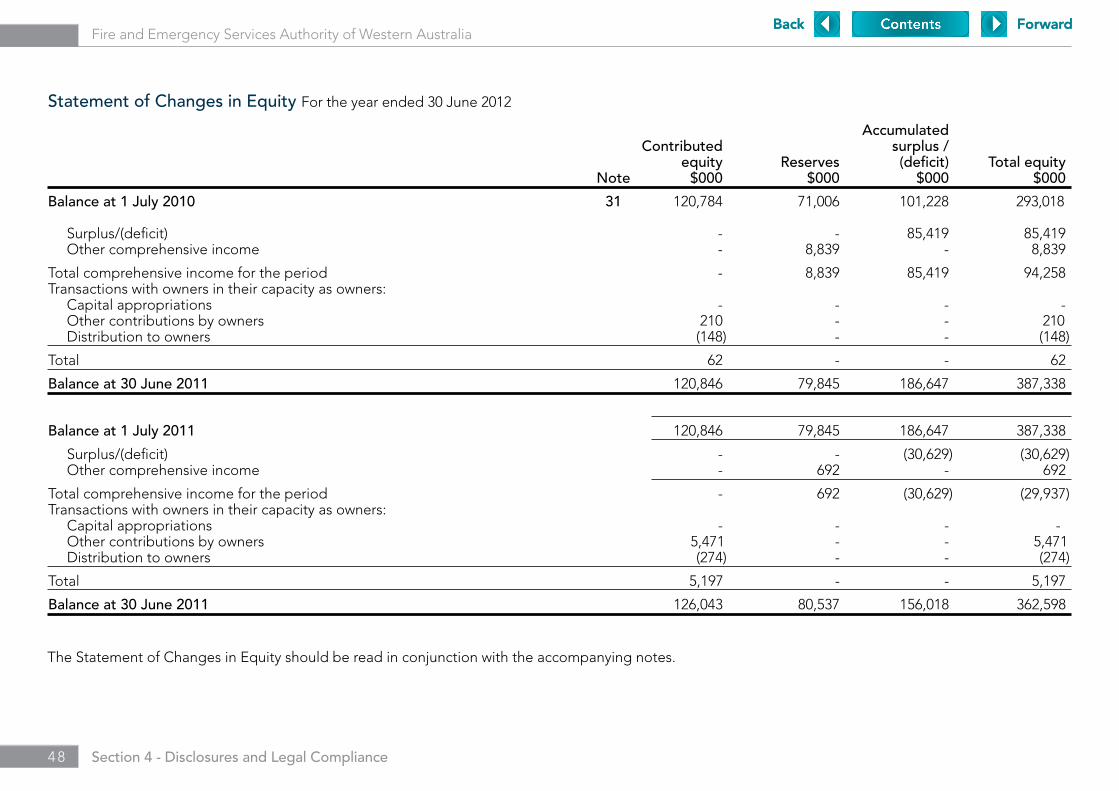
4 8 Section 4 - Disclosures and Legal Compliance
Fire and Emergency Services Authority of Western Australia
Statement of Changes in Equity For the year ended 30 June 2012
Accumulated) Contributed) surplus /) equity) Reserves (deficit)) Total equity) Note $000) $000 $000) $000)
Balance at 1 July 2010 31 120,784) 71,006 101,228) 293,018) Surplus/(deficit) -) - 85,419) 85,419) Other comprehensive income -) 8,839 -) 8,839)
Total comprehensive income for the period -) 8,839 85,419) 94,258) Transactions with owners in their capacity as owners: Capital appropriations -) - -) -) Other contributions by owners 210) - -) 210) Distribution to owners (148) - -) (148)
Total 62) - -) 62)
Balance at 30 June 2011 120,846) 79,845 186,647) 387,338)
Balance at 1 July 2011 120,846) 79,845 186,647) 387,338)
Surplus/(deficit) -) - (30,629) (30,629) Other comprehensive income -) 692 -) 692)
Total comprehensive income for the period -) 692 (30,629) (29,937)Transactions with owners in their capacity as owners: Capital appropriations -) - -) - Other contributions by owners 5,471) - -) 5,471) Distribution to owners (274) - -) (274)
Total 5,197) - -) 5,197)
Balance at 30 June 2011 126,043) 80,537 156,018) 362,598)
The Statement of Changes in Equity should be read in conjunction with the accompanying notes.
Back ForwardBack Forward
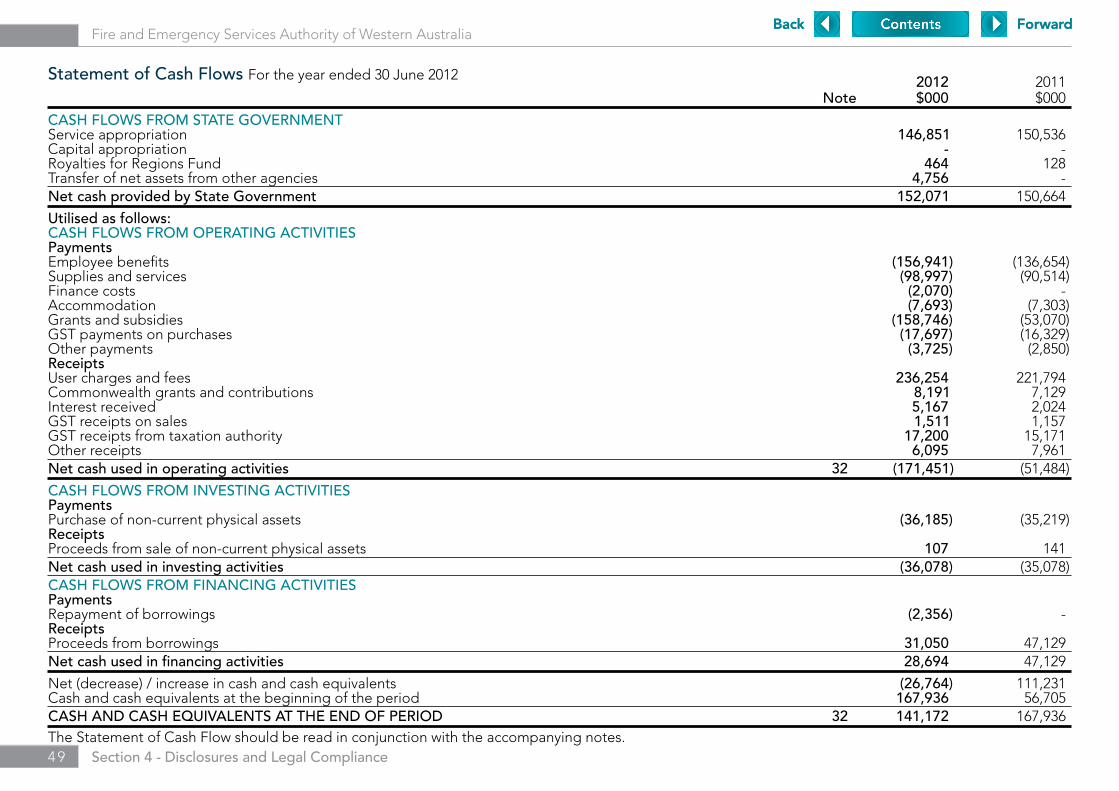
4 9 Section 4 - Disclosures and Legal Compliance
Fire and Emergency Services Authority of Western Australia
Statement of Cash Flows For the year ended 30 June 2012
The Statement of Cash Flow should be read in conjunction with the accompanying notes.
2012) 2011) Note $000) $000)
CASH FLOWS FROM STATE GOVERNMENT Service appropriation 146,851) 150,536) Capital appropriation -) -)Royalties for Regions Fund 464) 128) Transfer of net assets from other agencies 4,756) -) Net cash provided by State Government 152,071) 150,664) Utilised as follows: CASH FLOWS FROM OPERATING ACTIVITIES Payments Employee benefits (156,941) (136,654)Supplies and services (98,997) (90,514)Finance costs (2,070) -) Accommodation (7,693) (7,303)Grants and subsidies (158,746) (53,070)GST payments on purchases (17,697) (16,329)Other payments (3,725) (2,850)Receipts User charges and fees 236,254) 221,794) Commonwealth grants and contributions 8,191) 7,129) Interest received 5,167) 2,024) GST receipts on sales 1,511) 1,157) GST receipts from taxation authority 17,200) 15,171) Other receipts 6,095) 7,961) Net cash used in operating activities 32 (171,451) (51,484)
CASH FLOWS FROM INVESTING ACTIVITIES Payments Purchase of non-current physical assets (36,185) (35,219)Receipts Proceeds from sale of non-current physical assets 107) 141) Net cash used in investing activities (36,078) (35,078)CASH FLOWS FROM FINANCING ACTIVITIES Payments Repayment of borrowings (2,356) -) Receipts Proceeds from borrowings 31,050) 47,129) Net cash used in financing activities 28,694) 47,129) Net (decrease) / increase in cash and cash equivalents (26,764) 111,231)Cash and cash equivalents at the beginning of the period 167,936) 56,705) CASH AND CASH EQUIVALENTS AT THE END OF PERIOD 32 141,172) 167,936)
Back ForwardBack Forward
5 0 Section 4 - Disclosures and Legal Compliance
Fire and Emergency Services Authority of Western Australia
1 Australian Accounting Standards
General
The Authority’s financial statements for the year ended 30 June 2012 have been prepared in accordance with Australian Accounting Standards. The term ‘Australian Accounting Standards’ includes Standards and Interpretations issued by the Australian Accounting Standards Board (AASB).
The Authority has adopted any applicable, new and revised Australian Accounting Standards from their operative dates.
Early adoption of standards
The Authority cannot early adopt an Australian Accounting Standard unless specifically permitted by Treasurer’s Instruction 1101 Application of Australian Accounting Standards and Other Pronouncements. There has been no early adoption of Australian Accounting Standards that have been issued or amended (but not operative) by the Authority for the annual reporting period ended 30 June 2012.
2 Summary of significant accounting policies
(a) General statement
The Authority is a not-for-profit reporting entity that prepares general purpose financial statements in accordance with Australian Accounting Standards, the Framework, Statements of Accounting Concepts and other authoritative pronouncements of the AASB as applied by the Treasurer’s Instructions. Several of these are modified by the Treasurer’s Instructions to vary application, disclosure, format and wording.
The Financial Management Act 2006 and the Treasurer’s Instructions impose legislative provisions that govern the preparation of financial statements and take precedence over Australian Accounting Standards, the Framework, Statements of Accounting Concepts and other authoritative pronouncements of the AASB.
Where modification is required and has had a material or significant financial effect upon the reported results, details of that modification and the resulting financial effect are disclosed in the notes to the financial statements.
(b) Basis of preparation
The financial statements have been prepared on the accrual basis of accounting using the historical cost convention, except for land and buildings which have been measured at fair value.
The accounting policies adopted in the preparation of the financial statements have been consistently applied throughout all periods presented unless otherwise stated.
The financial statements are presented in Australian dollars and all values are rounded to the nearest thousand dollars ($’000).
Notes to the Financial Statements For the year ended 30 June 2012
Back ForwardBack Forward

5 1 Section 4 - Disclosures and Legal Compliance
Fire and Emergency Services Authority of Western Australia
2 Summary of significant accounting policies (continued)
(c) Reporting entity
The reporting entity comprises the Fire and Emergency Services Authority of Western Australia.
(d) Contributed equity
AASB Interpretation 1038 Contributions by Owners Made to Wholly-Owned Public Sector Entities requires transfers in the nature of equity contributions, other than as a result of a restructure of administrative arrangements, to be designated by the Government (the owner) as contributions by owners (at the time of, or prior to transfer) before such transfers can be recognised as equity contributions. Capital appropriations have been designated as contributions by owners by TI 955 Contributions by Owners made to Wholly Owned Public Sector Entities and have been credited directly to Contributed equity.
The transfers of net assets to/from other agencies, other than as a result of a restructure of administrative arrangements, are designated as contributions by owners where the transfers are non-discretionary and non-reciprocal. See note 31 ‘Equity’.
(e) Income
Revenue recognition
Revenue is recognised and measured at the fair value of consideration received or receivable. The following specific recognition criteria must also be met before revenue is recognised for the major business activities as follows:
Provision of services Revenue is recognised by reference to the stage of completion of the transaction.
Emergency Services LevyThe Emergency Services Levy (ESL) funds Western Australia’s fire and emergency services. The majority of the ESL is raised and collected by local government authorities (LGA) on behalf of the Authority by including it on their council rates notices. The ESL is calculated on the Gross Rental Value of most urban properties, with a fixed rate charge per property in rural and remote areas. The Authority raises assessment notices for the ESL directly for properties owned by the State Government (General Sector) in the first quarter, Local Governments in the second quarter and State Government instrumentalities (corporations) for large corporations in the third quarter.
LGAs either remit the ESL to the Authority on a monthly basis as they collect it (Option A), or enter into a memorandum of understanding (Option B) authorised by the Minister and pay the ESL they assess to FESA in four quarterly instalments (30%, 30%, 30% and 10%) or one annual instalment. The annual payment option is generally selected by local governments that raise a small amount of ESL and wish to further simplify the ESL administrative arrangements.
All LGAs submit a Declaration of Annual Emergency Services Levy Billing Assessment Profile Return (Form A) within 14 days of issue of rates notices. Revenue is recognised when an invoice is issued to the LGAs. See note 11 ‘User charges and fees’.
Notes to the Financial Statements For the year ended 30 June 2012
Back ForwardBack Forward
5 2 Section 4 - Disclosures and Legal Compliance
Fire and Emergency Services Authority of Western Australia
2 Summary of significant accounting policies (continued)
(e) Income (continued)
Revenue recognition (continued)
Sale of goodsRevenue is recognised from the sale of goods and disposal of other assets when the significant risks and rewards of ownership transfer to the purchaser and can be measured reliably.
InterestRevenue is recognised as the interest accrues.
Service appropriationsService appropriations are recognised as revenues at fair value in the period in which the Authority gains control of the appropriated funds. The Authority gains control of appropriated funds at the time those funds are deposited to the bank account or credited to the ‘Amounts receivable for services’ (holding account) held at Treasury. See note 16 ‘Income from State Government’.
Grants, donations, gifts and other non-reciprocal contributionsRevenue is recognised at fair value when the Authority obtains control over the assets comprising the contributions, usually when cash is received.
Other non-reciprocal contributions that are not contributions by owners are recognised at their fair value. Contributions of services are only recognised when a fair value can be reliably determined and the services would be purchased if not donated.
Royalties for Regions funds are recognised as revenue at fair value in the period in which the Authority obtains control over the funds. The Authority obtains control of the funds at the time the funds are deposited into the Authority’s bank account.
GainsRealised and unrealised gains are usually recognised on a net basis. These include gains arising on the disposal of non-current assets and some revaluations of non-current assets.
(f) Borrowing costs
Borrowing costs are expensed when incurred.
Notes to the Financial Statements For the year ended 30 June 2012
Back ForwardBack Forward

5 3 Section 4 - Disclosures and Legal Compliance
Fire and Emergency Services Authority of Western Australia
2 Summary of significant accounting policies (continued)
(g) Property, plant and equipment
Capitalisation/expensing of assetsItems of property, plant and equipment costing $5,000 or more are recognised as assets and the cost of utilising assets is expensed (depreciated) over their useful lives. Items of property, plant and equipment costing less than $5,000 are immediately expensed direct to the Statement of Comprehensive Income (other than where they form part of a group of similar items which are significant in total).
Initial recognition and measurementProperty, plant and equipment are initially recognised at cost.
For items of property, plant and equipment acquired at no cost or for nominal cost, the cost is the fair value at the date of acquisition.
Subsequent measurementSubsequent to initial recognition as an asset, the revaluation model is used for the measurement of land, buildings and historical cost for all other property, plant and equipment. Land and buildings are carried at fair value less accumulated depreciation on buildings and accumulated impairment losses. All other items of property, plant and equipment are stated at historical cost less accumulated depreciation and accumulated impairment losses.
Where market-based evidence is available, the fair value of land and buildings is determined on the basis of current market buying values determined by reference to recent market transactions. When buildings are revalued by reference to recent market transactions, the accumulated depreciation is eliminated against the gross carrying amount of the asset and the net amount restated to the revalued amount.
In the absence of market-based evidence, fair value of land and buildings is determined on the basis of existing use. This normally applies where buildings are specialised or where land use is restricted. Fair value for existing use assets is determined by reference to the cost of replacing the remaining future economic benefits embodied in the asset, i.e. the depreciated replacement cost. Where the fair value of buildings is determined on the depreciated replacement cost basis, the gross carrying amount and the accumulated depreciation are restated proportionately.
Land and buildings are independently valued annually by the Western Australian Land Information Authority (Valuation Services) and recognised annually to ensure that the carrying amount does not differ materially from the asset’s fair value at the end of the reporting period.
The most significant assumptions in estimating fair value are made in assessing whether to apply the existing use basis to assets and in determining estimated useful life. Professional judgement by the valuer is required where the evidence does not provide a clear distinction between market type assets and existing use assets. See note 24 ‘Property, plant and equipment’ for further information.
Notes to the Financial Statements For the year ended 30 June 2012
Back ForwardBack Forward

5 4 Section 4 - Disclosures and Legal Compliance
Fire and Emergency Services Authority of Western Australia
2 Summary of significant accounting policies (continued)
(g) Property, plant and equipment (continued)
DerecognitionUpon disposal or derecognition of an item of property, plant and equipment, any revaluation surplus relating to that asset is retained in the asset revaluation surplus.
Asset revaluation surplusThe asset revaluation surplus is used to record increments and decrements on the revaluation of non-current assets as described in note 24 ‘Property, plant and equipment’ and note 31 ‘Equity’.
DepreciationAll non-current assets having a limited useful life are systematically depreciated over their estimated useful lives in a manner that reflects the consumption of their future economic benefits.
Depreciation is calculated using the straight line method, using rates which are reviewed annually. Estimated useful lives for each class of depreciable asset are:
Building 20 - 40 yearsVehicles 2 - 20 yearsPlant and equipment 5 - 10 years
Works of art controlled by the Authority are classified as property, plant and equipment. These are anticipated to have indefinite useful lives. Their service potential has not, in any material sense, been consumed during the reporting period and consequently no depreciation has been recognised.
Leasehold improvements of a capital nature are classified as property, plant and equipment. The leasehold improvement is depreciated over the lease term.
Land is not depreciated.
Notes to the Financial Statements For the year ended 30 June 2012
Back ForwardBack Forward

5 5 Section 4 - Disclosures and Legal Compliance
Fire and Emergency Services Authority of Western Australia
2 Summary of significant accounting policies (continued)
(h) Intangible assets
Capitalisation/expensing of assets Acquisitions of intangible assets costing $5,000 or more and internally generated intangible assets costing $50,000 or more are capitalised. The cost of utilising the assets is expensed (amortised) over their useful lives. Costs incurred below these thresholds are immediately expensed directly to the Statement of Comprehensive Income.
Intangible assets are initially recognised at cost. For assets acquired at no cost or for nominal cost, the cost is their fair value at the date of acquisition.
The cost model is applied for subsequent measurement requiring the asset to be carried at cost less any accumulated amortisation and accumulated impairment losses.
Amortisation for intangible assets with finite useful lives is calculated for the period of the expected benefit (estimated useful life which is reviewed annually) on the straight line basis. All intangible assets controlled by the Authority have a finite useful life and zero residual value.
The expected useful lives for each class of intangible asset are:
Licences up to 10 years
Software(a) 3 to 5 years
(a) Software that is not integral to the operation of any related hardware.
Computer softwareSoftware that is an integral part of the related hardware is recognised as property, plant and equipment. Software that is not an integral part of the related hardware is recognised as an intangible asset. Software costing less than $5,000 is expensed in the year of acquisition.
Website costsWebsite costs are charged as expenses when they are incurred unless they relate to the acquisition or development of an asset when they may be capitalised and amortised. Generally, costs in relation to feasibility studies during the planning phase of a website, and ongoing costs of maintenance during the operating phase are expensed. Costs incurred in building or enhancing a website, to the extent that they represent probable future economic benefits that can be reliably measured, are capitalised.
Notes to the Financial Statements For the year ended 30 June 2012
Back ForwardBack Forward
5 6 Section 4 - Disclosures and Legal Compliance
Fire and Emergency Services Authority of Western Australia
2 Summary of significant accounting policies (continued)
(i) Impairment of assets
Property, plant and equipment, and intangible assets are tested for any indication of impairment at the end of each reporting period. Where there is an indication of impairment, the recoverable amount is estimated. Where the recoverable amount is less than the carrying amount, the asset is considered impaired and is written down to the recoverable amount and an impairment loss is recognised. As the Authority is a not-for-profit entity, unless an asset has been identified as a surplus asset, the recoverable amount is the higher of an asset’s fair value less costs to sell and depreciated replacement cost.
The risk of impairment is generally limited to circumstances where an asset’s depreciation is materially understated, where the replacement cost is falling or where there is a significant change in useful life. Each relevant class of assets is reviewed annually to verify that the accumulated depreciation/amortisation reflects the level of consumption or expiration of the asset’s future economic benefits and to evaluate any impairment risk from falling replacement costs.
Intangible assets with an indefinite useful life and intangible assets not yet available for use are tested for impairment at the end of each reporting period irrespective of whether there is any indication of impairment.
The recoverable amount of assets identified as surplus assets is the higher of fair value less costs to sell and the present value of future cash flows expected to be derived from the asset. Surplus assets carried at fair value have no risk of material impairment where fair value is determined by reference to market-based evidence. Where fair value is determined by reference to depreciated replacement cost, surplus assets are at risk of impairment and the recoverable amount is measured. Surplus assets at cost are tested for indications of impairment at the end of each reporting period. See note 27 ‘Impairment of assets’ for the outcome of impairment reviews and testing.
(j) Non-current assets (or disposal groups) classified as held for sale
Non-current assets (or disposal groups) held for sale are recognised at the lower of carrying amount and fair value less costs to sell, and are disclosed separately from other assets in the Statement of Financial Position. Assets classified as held for sale are not depreciated or amortised. See note 22 ‘Non-current assets classified as held for sale’.
(k) Leases
Operating leases are expensed on a straight line basis over the lease term as this represents the pattern of benefits derived from the leased items and services. See note 5 ‘Supplies and services’ and note 33 ‘Commitments’.
(l) Resources received free of charge or for nominal cost
Resources received free of charge or for nominal cost that can be reliably measured are recognised as income at fair value. Where the resources received represents a service that the Authority would otherwise pay for, a corresponding expense is recognised. Receipts of assets are recognised in the Statement of Financial Position. See note 16 ‘Income from State Government’.
Assets or services received from other State Government agencies, are separately disclosed under Income from State Government in the Statement of Comprehensive Income.
Notes to the Financial Statements For the year ended 30 June 2012
Back ForwardBack Forward
5 7 Section 4 - Disclosures and Legal Compliance
Fire and Emergency Services Authority of Western Australia
2 Summary of significant accounting policies (continued)
(m) Financial instruments
In addition to cash, the Authority has two categories of financial instrument:•Loansandreceivables;and•Financialliabilitiesmeasuredatamortisedcost.
Financial instruments have been disaggregated into the following classes:
Financial Assets•Cashandcashequivalents•Restrictedcashandcashequivalents•Receivables•Amountsreceivableforservices•Otherfinancialassets
Financial Liabilities•Payables•WesternAustralianTreasuryCorporationborrowings
Initial recognition and measurement of financial instruments is at fair value which normally equates to the transaction cost or the face value. Subsequent measurement is at amortised cost using the effective interest method.
The fair value of short-term receivables and payables is the transaction cost or the face value because there is no interest rate applicable and subsequent measurement is not required as the effect of discounting is not material. See note 2(s) for ‘Other financial assets’, note 37 ‘Financial instruments’ and note 29 ‘Borrowings’.
(n) Cash and cash equivalents
For the purpose of the Statement of Cash Flows, cash and cash equivalent (and restricted cash and cash equivalent) assets comprise cash on hand and short-term deposits with original maturities of three months or less that are readily convertible to a known amount of cash and which are subject to insignificant risk of changes in value. See note 17 ‘Cash and cash equivalents’.
(o) Accrued salaries
Accrued salaries represent the amount due to staff but unpaid at the end of the financial year. Accrued salaries are settled within a week of the financial year end. The Authority considers the carrying amount of accrued salaries to be equivalent to its net fair value. See note 28 ‘Payables’.
Notes to the Financial Statements For the year ended 30 June 2012
Back ForwardBack Forward

5 8 Section 4 - Disclosures and Legal Compliance
Fire and Emergency Services Authority of Western Australia
2 Summary of significant accounting policies (continued)
(p) Receivables
Receivables are recognised at original invoice amount less an allowance for any uncollectible amounts (i.e. impairment). The collectability of receivables is reviewed on an ongoing basis and any receivables identified as uncollectible are written-off against the allowance account. The allowance for uncollectible amounts (doubtful debts) is raised when there is objective evidence that the Authority will not be able to collect the debts. The carrying amount is equivalent to fair value as it is due for settlement within 30 days. See note 2(m) ‘Financial instruments’ and note 20 ‘Receivables’.
(q) Amounts receivable for services (holding account)
The Authority receives income from the State Government partly in cash and partly as an asset (holding account receivable). The accrued amount appropriated is accessible on the emergence of the cash funding requirement to cover leave entitlements and asset replacement. See note 16 ‘Income from State Government’ and note 23 ’Amounts receivable for services’.
(r) Inventories
Inventories are measured at the lower of cost and net realisable value. Costs are assigned by the method most appropriate for each particular class of inventory, with the majority being measured on a weighted average cost basis.
Inventories not held for resale are measured at cost unless they are no longer required, in which case they are measured at net realisable value. See note 19 ‘Inventories’.
(s) Other financial assets
The Authority has classified its investment as a held-to-maturity investment.
The classification depends on the purpose for which the investments were acquired. Management determines the classification of its investments at initial recognition and re-evaluates this designation at the end of each reporting period. Investments not at fair value are initially recognised at cost being the fair value of consideration given, including directly attributable transaction costs.
The Authority assesses at the end of each reporting period whether there is objective evidence that a financial asset is impaired. See note 26 ‘Other financial assets’.
(t) Payables
Payables are recognised when the Authority becomes obliged to make future payments as a result of a purchase of assets or services. The carrying amount is equivalent to fair value, as settlement is generally within 30 days. See note 2(m) ‘Financial instruments’ and note 28 ‘Payables’.
(u) Borrowings
All loans payable are initially recognised at fair value, being the net proceeds received. Subsequent measurement is at amortised cost using the effective interest rate method. See note 2(m) ‘Financial instruments’ and note 29 ‘Borrowings’.
Notes to the Financial Statements For the year ended 30 June 2012
Back ForwardBack Forward

5 9 Section 4 - Disclosures and Legal Compliance
Fire and Emergency Services Authority of Western Australia
2 Summary of significant accounting policies (continued)
(v) Provisions
Provisions are liabilities of uncertain timing or amount and are recognised where there is a present legal or constructive obligation as a result of a past event and when the outflow of resources embodying economic benefits is probable and a reliable estimate can be made of the amount of the obligation. Provisions are reviewed at the end of each reporting period. See note 30 ‘Provisions’.
Provisions - employee benefits
All annual leave and long service leave provisions are in respect of employees’ services up to the end of the reporting period.
Annual leave
The liability for annual leave that is expected to be settled within 12 months after the end of the reporting period is recognised and measured at the undiscounted amounts expected to be paid when the liability is settled.
Annual leave that is not expected to be settled within 12 months after the end of the reporting period is recognised and measured at the present value of amounts expected to be paid when the liabilities are settled using the remuneration rate expected to apply at the time of settlement.
When assessing expected future payments consideration is given to expected future wage and salary levels including non-salary components such as employer superannuation contributions, as well as the experience of employee departures and periods of service. The expected future payments are discounted using market yields at the end of the reporting period on national government bonds with terms to maturity that match, as closely as possible, the estimated future cash outflows.
The provision for annual leave is classified as a current liability as the Authority does not have an unconditional right to defer settlement of the liability for at least 12 months after the end of the reporting period.
Notes to the Financial Statements For the year ended 30 June 2012
Back ForwardBack Forward

6 0 Section 4 - Disclosures and Legal Compliance
Fire and Emergency Services Authority of Western Australia
2 Summary of significant accounting policies (continued)
(v) Provisions (continued)
Provisions - employee benefits (continued)
Long service leave
The liability for long service leave that is expected to be settled within 12 months after the end of the reporting period is recognised and measured at the undiscounted amounts expected to be paid when the liability is settled.
Long service leave that is not expected to be settled within 12 months after the end of the reporting period is recognised and measured at the present value of amounts expected to be paid when the liabilities are settled using the remuneration rate expected to apply at the time of settlement.
When assessing expected future payments consideration is given to expected future wage and salary levels including non-salary components such as employer superannuation contributions, as well as the experience of employee departures and periods of service. The expected future payments are discounted using market yields at the end of the reporting period on national government bonds with terms to maturity that match, as closely as possible, the estimated future cash outflows.
Unconditional long service leave provisions are classified as current liabilities as the Authority does not have an unconditional right to defer settlement of the liability for at least 12 months after the end of the reporting period. Pre-conditional and conditional long service leave provisions are classified as non-current liabilities because the Authority has an unconditional right to defer the settlement of the liability until the employee has completed the requisite years of service.
Purchased Leave
The provision for purchased leave relates to Public Service employees who have entered into an agreement to self-fund up to an additional 10 weeks leave per calendar year. The provision recognises the value of salary set aside for employees and is measured at the nominal amounts expected to be paid when the liabilities are settled. This liability is measured on the same basis as annual leave.
Deferred Leave
The provision for deferred leave relates to Public Service employees who have entered into an agreement to self-fund an additional 12 months leave in the fifth year of the agreement. The provision recognises the value of salary set aside for employees to be used in the fifth year. This liability is measured on the same basis as annual leave. Deferred leave is reported as a current provision as employees can leave the scheme at their discretion at any time.
Notes to the Financial Statements For the year ended 30 June 2012
Back ForwardBack Forward
6 1 Section 4 - Disclosures and Legal Compliance
Fire and Emergency Services Authority of Western Australia
Notes to the Financial Statements For the year ended 30 June 2012
2 Summary of significant accounting policies (continued)
(v) Provisions (continued)
Provisions - employee benefits (continued)
Superannuation
Contributions are made to the Fire and Emergency Services Superannuation Fund (FESSF) and the Government Employees Superannuation Board (GESB) to provide benefits for employees and their dependants on retirement, disability or death.
The FESSF is a superannuation fund available to employees of the Fire and Emergency Services Authority of Western Australia. Membership is also available to employees of the United Firefighters Union of Western Australia, the Western Australian Volunteer Fire Brigades Association (Inc), and the Fire and Emergency Services Superannuation Board (FESSB). The FESSB is a trustee of the fund and is responsible for managing the fund in the best interest of all members and for ensuring the fund is managed in accordance with its governing legislation; Fire and Emergency Services Superannuation Act 1985 and the Fire and Emergency Services (Superannuation Fund) Regulations 1986. The liability for superannuation charges is extinguished by payments of employer contributions to the FESSF.
Members can make additional voluntary contributions to an accumulation account and are payable in addition to any defined benefit entitlement. Contributing members who have reached the age of 55 or completed 30 years of contributing membership can elect to transfer their defined benefit into their accumulation account.
The Government Employees Superannuation Board (GESB) administers public sector superannuation arrangements in Western Australia in accordance with legislative requirements.
Eligible employees contribute to the Pension Scheme, a defined benefit pension scheme closed to new members since 1987, or the Gold State Superannuation Scheme (GSS), a defined benefit lump sum scheme closed to new members since 1995.
The GSS is a defined benefit scheme for the purposes of employees and whole-of-government reporting. However, it is a defined contribution plan for agency purposes because the concurrent contributions (defined contributions) made by the Authority to GESB extinguishes the Authority’s obligations to the related superannuation liability.
The Authority also makes employer contributions to the FESSF during the year. The FESSF is a defined benefit scheme for the purpose of employees and is a defined contribution plan for the Authority. The concurrent contributions (defined contributions) made by the Authority to the FESSF extinguishes the Authority’s obligations to the related superannuation liability.
Back Forward
6 2 Section 4 - Disclosures and Legal Compliance
Fire and Emergency Services Authority of Western Australia
2 Summary of significant accounting policies (continued)
(v) Provisions (continued)
Provisions - employee benefits (continued)
Superannuation (continued)
The Authority has no liabilities under the Pension Scheme or the GSS. The liabilities for the unfunded Pension Scheme and the unfunded GSS transfer benefits attributable to members who transferred from the Pension Scheme, are assumed by the Treasurer. All other GSS obligations are funded by concurrent contributions made by the Authority to the GESB. The concurrently funded part of the GSS is a defined contribution scheme as these contributions extinguish all liabilities in respect of the concurrently funded GSS obligations.
Employees commencing employment prior to 16 April 2007 who were not members of either the Pension Scheme or the GSS became non-contributory members of the West State Superannuation Scheme (WSS). Employees commencing employment on or after 16 April 2007 became members of the GESB Super Scheme (GESBS). From 30 March 2012, existing members of the WSS or GESBS and new employees became able to choose their preferred superannuation fund. The Authority makes concurrent contributions to GESB or other funds on behalf of employees in compliance with the Commonwealth Government’s Superannuation Guarantee (Administration) Act 1992. Contributions to these accumulation schemes extinguish the Authority’s liability for superannuation charges in respect of employees who are not members of the Pension Scheme or GSS.
The GESB makes all benefit payments in respect of the Pension Scheme and GSS, and is recouped from the Treasurer for the employer’s share. See note 2(w) ‘Superannuation expense’.
Provisions - other
Employment on-costs
Employment on-costs, including workers’ compensation insurance, are not employee benefits and are recognised separately as liabilities and expenses when the employment to which they relate has occurred. Employment on-costs are included as part of ‘Other expenses’ and are not included as part of the Authority’s ‘Employee benefits expense’. The related liability is included in ‘Employment on-costs provision’. See note 10 ‘Other expenses’ and note 30 ‘Provisions’.
(w) Superannuation expense
The superannuation expense in the Statement of Comprehensive Income comprises employer contributions paid to the GSS (concurrent contributions), the West State Superannuation (WSS), the GESB Super (GESBS) and the FESSF.
Notes to the Financial Statements For the year ended 30 June 2012
Back ForwardBack Forward
6 3 Section 4 - Disclosures and Legal Compliance
Fire and Emergency Services Authority of Western Australia
2 Summary of significant accounting policies (continued)
(x) Establishment of volunteer entities
(i) Volunteer Emergency Service Units Volunteer Emergency Service Units are formed in accordance with Part 3C of the Fire and Emergency Services Authority of Western Australia Act 1998.
(ii) Volunteer State Emergency Service Units Volunteer State Emergency Service Units are formed in accordance with Part 3A of the Fire and Emergency Services Authority of Western Australia Act 1998.
(iii) Volunteer Fire and Rescue Service Brigades Volunteer Fire and Rescue Service Brigades are formed in accordance with the Fire Brigades Act 1942.
(iv) Volunteer Fire Service Brigades Volunteer Fire Service Brigades are formed in accordance with Part 3C of the Fire and Emergency Services Authority of Western Australia Act 1998.
(v) Volunteer Marine Rescue Service Groups Volunteer Marine Rescue Service Groups are formed in accordance with Part 3B of the Fire and Emergency Services Authority of Western Australia Act 1998.
(vi) Indian Ocean Territories Services In accordance with the Indian Ocean Territories Law Reform Ordinance, the Authority provides capital and operating support for the Volunteer Fire and Emergency Service Brigades and Volunteer Marine Rescue Service Groups operating on Christmas Island and the Cocos (Keeling) Islands. The costs associated with this support are recouped from the Commonwealth Government.
(y) Comparative figures
Comparative figures are, where appropriate, reclassified to be comparable with the figures presented in the current financial year.
Notes to the Financial Statements For the year ended 30 June 2012
Back ForwardBack Forward
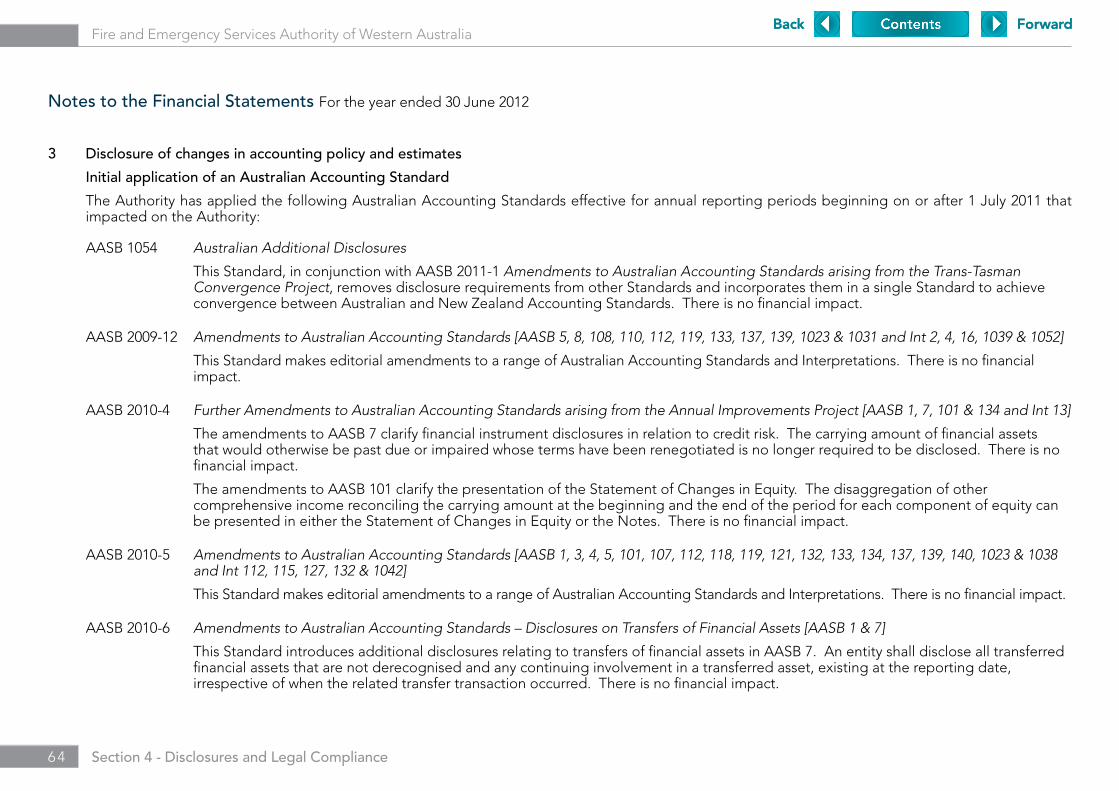
6 4 Section 4 - Disclosures and Legal Compliance
Fire and Emergency Services Authority of Western Australia
3 Disclosure of changes in accounting policy and estimates
Initial application of an Australian Accounting Standard
The Authority has applied the following Australian Accounting Standards effective for annual reporting periods beginning on or after 1 July 2011 that impacted on the Authority:
Notes to the Financial Statements For the year ended 30 June 2012
AASB 1054
Australian Additional Disclosures
This Standard, in conjunction with AASB 2011-1 Amendments to Australian Accounting Standards arising from the Trans-Tasman Convergence Project, removes disclosure requirements from other Standards and incorporates them in a single Standard to achieve convergence between Australian and New Zealand Accounting Standards. There is no financial impact.
AASB 2009-12
Amendments to Australian Accounting Standards [AASB 5, 8, 108, 110, 112, 119, 133, 137, 139, 1023 & 1031 and Int 2, 4, 16, 1039 & 1052]
This Standard makes editorial amendments to a range of Australian Accounting Standards and Interpretations. There is no financial impact.
AASB 2010-4
Further Amendments to Australian Accounting Standards arising from the Annual Improvements Project [AASB 1, 7, 101 & 134 and Int 13]
The amendments to AASB 7 clarify financial instrument disclosures in relation to credit risk. The carrying amount of financial assets that would otherwise be past due or impaired whose terms have been renegotiated is no longer required to be disclosed. There is no financial impact.
The amendments to AASB 101 clarify the presentation of the Statement of Changes in Equity. The disaggregation of other comprehensive income reconciling the carrying amount at the beginning and the end of the period for each component of equity can be presented in either the Statement of Changes in Equity or the Notes. There is no financial impact.
AASB 2010-5
Amendments to Australian Accounting Standards [AASB 1, 3, 4, 5, 101, 107, 112, 118, 119, 121, 132, 133, 134, 137, 139, 140, 1023 & 1038 and Int 112, 115, 127, 132 & 1042]
This Standard makes editorial amendments to a range of Australian Accounting Standards and Interpretations. There is no financial impact.
AASB 2010-6
Amendments to Australian Accounting Standards – Disclosures on Transfers of Financial Assets [AASB 1 & 7]
This Standard introduces additional disclosures relating to transfers of financial assets in AASB 7. An entity shall disclose all transferred financial assets that are not derecognised and any continuing involvement in a transferred asset, existing at the reporting date, irrespective of when the related transfer transaction occurred. There is no financial impact.
Back ForwardBack Forward
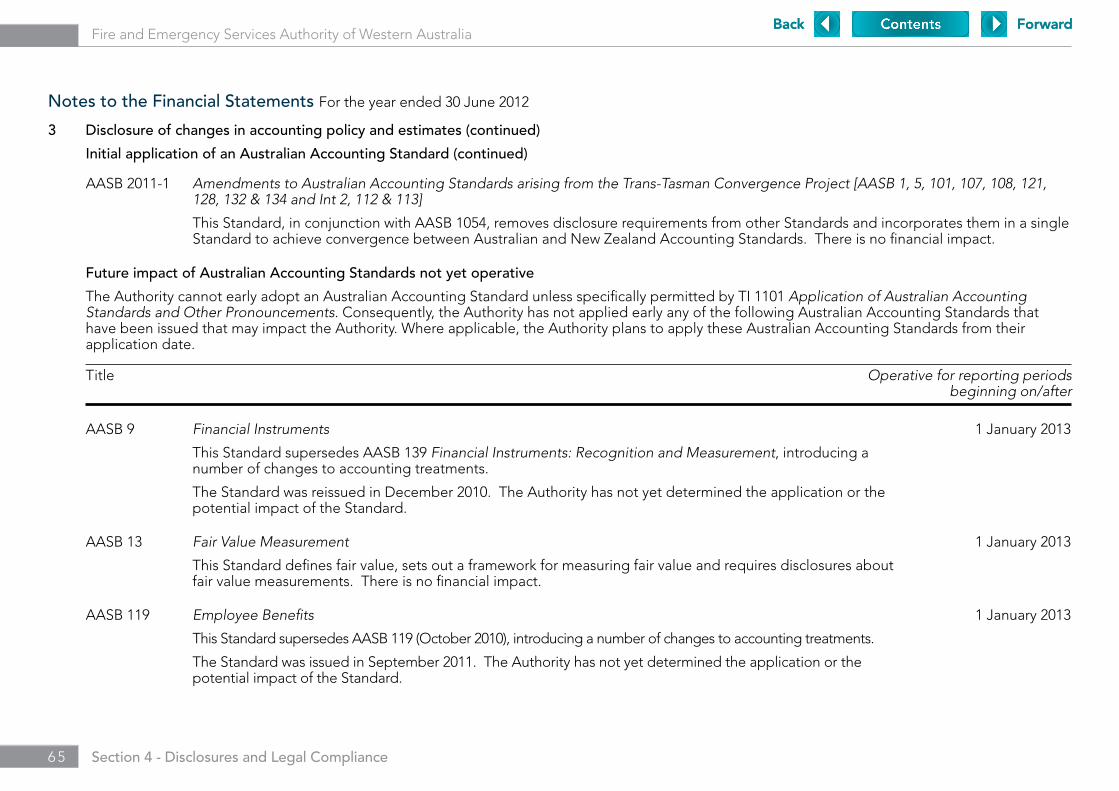
6 5 Section 4 - Disclosures and Legal Compliance
Fire and Emergency Services Authority of Western Australia
3 Disclosure of changes in accounting policy and estimates (continued)
Initial application of an Australian Accounting Standard (continued)
Future impact of Australian Accounting Standards not yet operative
The Authority cannot early adopt an Australian Accounting Standard unless specifically permitted by TI 1101 Application of Australian Accounting Standards and Other Pronouncements. Consequently, the Authority has not applied early any of the following Australian Accounting Standards that have been issued that may impact the Authority. Where applicable, the Authority plans to apply these Australian Accounting Standards from their application date.
Title Operative for reporting periods beginning on/after
Notes to the Financial Statements For the year ended 30 June 2012
AASB 2011-1
Amendments to Australian Accounting Standards arising from the Trans-Tasman Convergence Project [AASB 1, 5, 101, 107, 108, 121, 128, 132 & 134 and Int 2, 112 & 113]
This Standard, in conjunction with AASB 1054, removes disclosure requirements from other Standards and incorporates them in a single Standard to achieve convergence between Australian and New Zealand Accounting Standards. There is no financial impact.
AASB 9
Financial Instruments
This Standard supersedes AASB 139 Financial Instruments: Recognition and Measurement, introducing a number of changes to accounting treatments.
The Standard was reissued in December 2010. The Authority has not yet determined the application or the potential impact of the Standard.
1 January 2013
AASB 13
Fair Value Measurement
This Standard defines fair value, sets out a framework for measuring fair value and requires disclosures about fair value measurements. There is no financial impact.
1 January 2013
AASB 119
Employee Benefits
This Standard supersedes AASB 119 (October 2010), introducing a number of changes to accounting treatments.
The Standard was issued in September 2011. The Authority has not yet determined the application or the potential impact of the Standard.
1 January 2013
Back ForwardBack Forward

6 6 Section 4 - Disclosures and Legal Compliance
Fire and Emergency Services Authority of Western Australia
3 Disclosure of changes in accounting policy and estimates (continued)
Future impact of Australian Accounting Standards not yet operative (continued)
Title Operative for reporting periods beginning on/after
Notes to the Financial Statements For the year ended 30 June 2012
AASB 1053 Application of Tiers of Australian Accounting Standards
This Standard establishes a differential financial reporting framework consisting of two tiers of reporting requirements for preparing general purpose financial statements. There is no financial impact.
1 July 2013
AASB 2010-2 Amendments to Australian Accounting Standards arising from Reduced Disclosure Requirements [AASB 1, 2, 3, 5, 7, 8, 101, 102, 107, 108, 110, 111, 112, 116, 117, 119, 121, 123, 124, 127, 128, 131, 133, 134, 136, 137, 138, 140, 141, 1050 & 1052 and Int 2, 4, 5, 15, 17, 127, 129 & 1052]
This Standard makes amendments to Australian Accounting Standards and Interpretations to introduce reduced disclosure requirements for certain types of entities. There is no financial impact.
1 July 2013
AASB 2010-7 Amendments to Australian Accounting Standards arising from AASB 9 (December 2010) [AASB 1, 3, 4, 5, 7, 101, 102, 108, 112, 118, 120, 121, 127, 128, 131, 132, 136, 137, 139, 1023 & 1038 and Int 2, 5, 10, 12, 19 & 127]
This Standard makes consequential amendments to other Australian Accounting Standards and Interpretations as a result of issuing AASB 9 in December 2010. The Authority has not yet determined the application or the potential impact of the Standard.
1 January 2013
AASB 2011-2
Amendments to Australian Accounting Standards arising from the Trans-Tasman Convergence Project – Reduced Disclosure Requirements [AASB 101 & 1054]
This Standard removes disclosure requirements from other Standards and incorporates them in a single Standard to achieve convergence between Australian and New Zealand Accounting Standards for reduced disclosure reporting. There is no financial impact. .
1 July 2013
Back ForwardBack Forward

6 7 Section 4 - Disclosures and Legal Compliance
Fire and Emergency Services Authority of Western Australia
3 Disclosure of changes in accounting policy and estimates (continued)
Future impact of Australian Accounting Standards not yet operative (continued)
Title Operative for reporting periods beginning on/after
Changes in Accounting EstimatesThere were no changes in accounting estimates that will have an effect on the current reporting period.
Notes to the Financial Statements For the year ended 30 June 2012
AASB 2011-8
Amendments to Australian Accounting Standards arising from AASB 13 [AASB 1, 2, 3, 4, 5, 7, 9, 2009-11, 2010-7, 101, 102, 108, 110, 116, 117, 118, 119, 120, 121, 128, 131, 132, 133, 134, 136, 138, 139, 140, 141, 1004, 1023 & 1038 and Int 2, 4, 12, 13, 14, 17, 19, 131 & 132]
This Standard replaces the existing definition and fair value guidance in other Australian Accounting Standards and Interpretations as the result of issuing AASB 13 in September 2011. There is no financial impact.
1 January 2013
AASB 2011-9
Amendments to Australian Accounting Standards – Presentation of Items of Other Comprehensive Income [AASB 1, 5, 7, 101, 112, 120, 121, 132, 133, 134, 1039 & 1049]
This Standard requires to group items presented in other comprehensive income on the basis of whether they are potentially reclassifiable to profit or loss subsequently (reclassification adjustments). The Authority has not yet determined the application or the potential impact of the Standard.
1 July 2012
AASB 2011-10
Amendments to Australian Accounting Standards arising from AASB 119 (September 2011) [AASB 1, 8, 101, 124, 134, 1049 & 2011-8 and Int 14]
This Standard makes amendments to other Australian Accounting Standards and Interpretations as a result of issuing AASB 119 Employee Benefits in September 2011. The Authority has not yet determined the application or the potential impact of the Standard.
1 January 2013
AASB 2011-11
Amendments to AASB 119 (September 2011) arising from Reduced Disclosure Requirements
This Standard gives effect to Australian Accounting Standards – Reduced Disclosure Requirements for AASB 119 (September 2011). There is no financial impact.
1 January 2013
Back ForwardBack Forward

6 8 Section 4 - Disclosures and Legal Compliance
Fire and Emergency Services Authority of Western Australia
2012 2011 $000 $000
4 Employee benefits expense
Wages and salaries (a) 136,106 120,735 Protective clothing and uniforms 7,065 3,734 Superannuation - defined contribution plans: (b)
Fire and Emergency Services Superannuation Board 13,271 12,366 Government Employees Superannuation Board 1,522 1,364
Other related expenses 426 358 158,390 138,557
(a) Includes the value of the fringe benefit to the employee plus the fringe benefits tax component, leave entitlements including superannuation contribution component.
(b) Defined contribution plans include West State, Gold State, GESB Super Scheme (contribution paid) and FESSB Fund (contribution paid).
Employment on-costs expenses such as workers’ compensation insurance are included at note 10 ‘Other expenses’.
Employment on-costs liability is included at note 30 ‘Provisions’.
5 Supplies and services
Administration 4,141 4,228 Advertising and promotion expense 594 433 Communications 3,252 2,781 Consultants and contractors 24,962 36,639 Electricity and water expense 1,928 1,674 Insurance premiums and claims 9,064 5,399 Leases 25,223 24,033 Maintenance 25,215 22,059 Travel 4,285 3,527 98,664 100,773
Notes to the Financial Statements For the year ended 30 June 2012
Back ForwardBack Forward
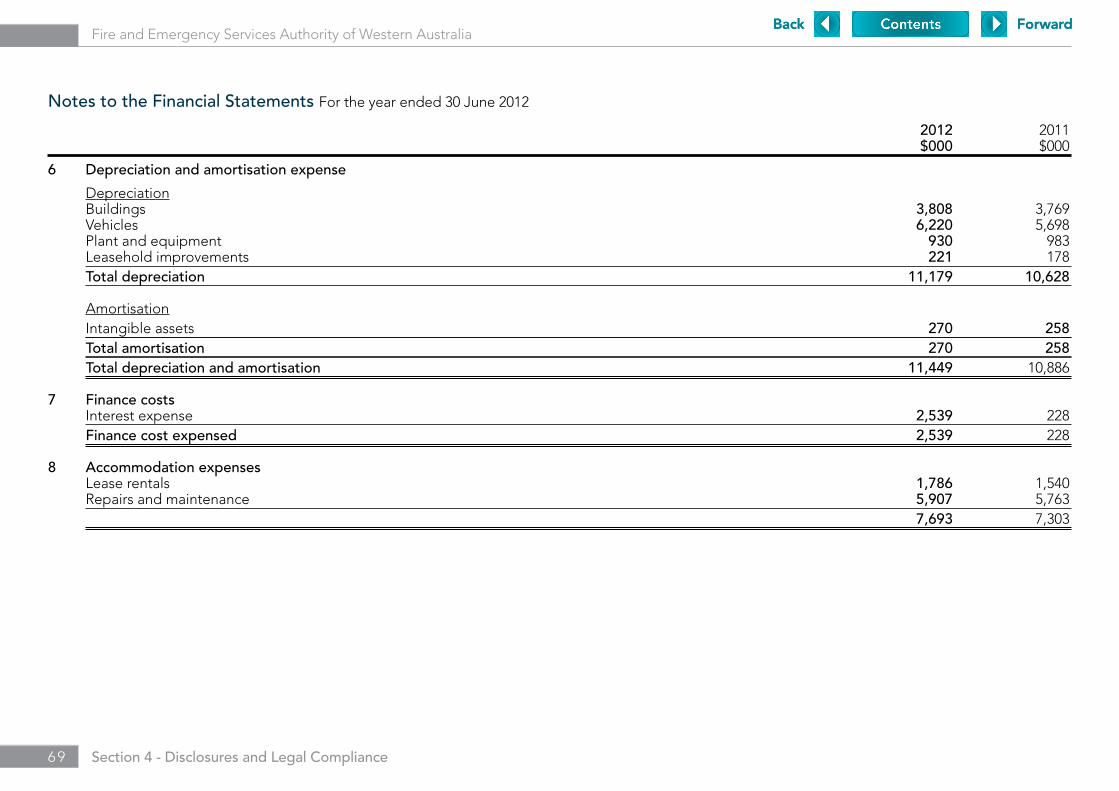
6 9 Section 4 - Disclosures and Legal Compliance
Fire and Emergency Services Authority of Western Australia
2012 2011 $000 $000
6 Depreciation and amortisation expense
Depreciation Buildings 3,808 3,769 Vehicles 6,220 5,698 Plant and equipment 930 983 Leasehold improvements 221 178 Total depreciation 11,179 10,628
Amortisation Intangible assets 270 258 Total amortisation 270 258 Total depreciation and amortisation 11,449 10,886
7 Finance costs Interest expense 2,539 228 Finance cost expensed 2,539 228
8 Accommodation expenses Lease rentals 1,786 1,540 Repairs and maintenance 5,907 5,763 7,693 7,303
Notes to the Financial Statements For the year ended 30 June 2012
Back ForwardBack Forward
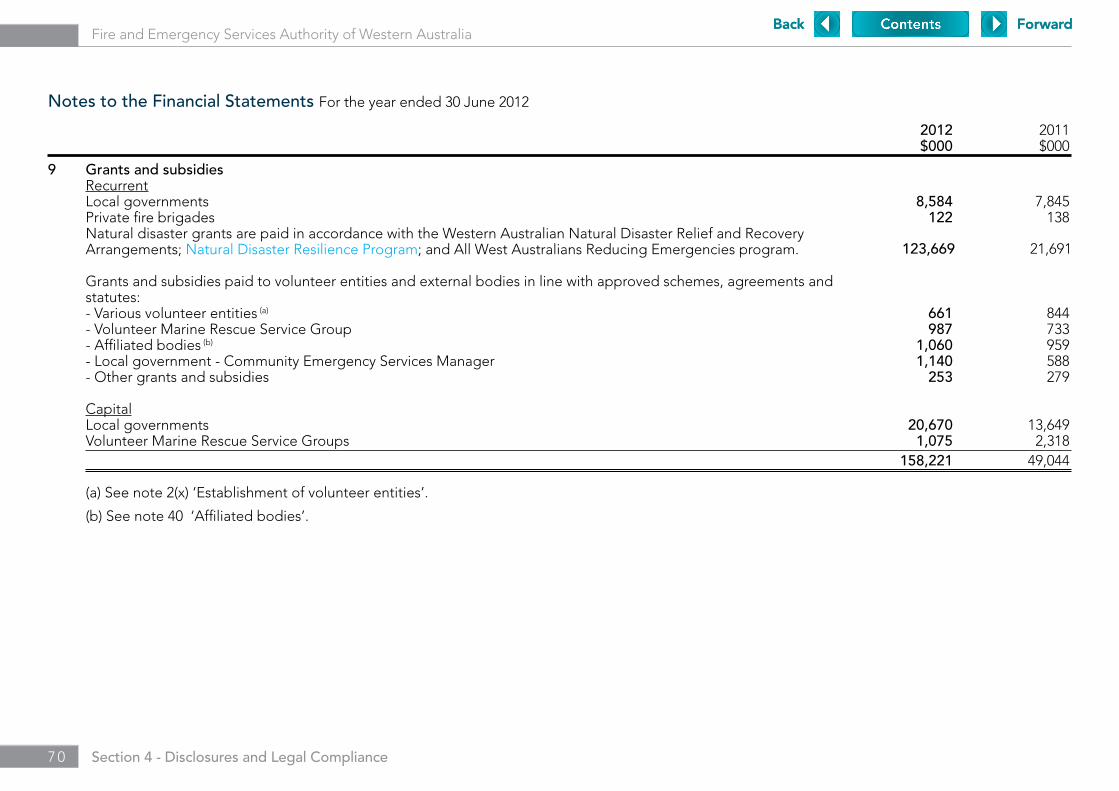
7 0 Section 4 - Disclosures and Legal Compliance
Fire and Emergency Services Authority of Western Australia
2012 2011 $000 $000
9 Grants and subsidies Recurrent Local governments 8,584 7,845 Private fire brigades 122 138 Natural disaster grants are paid in accordance with the Western Australian Natural Disaster Relief and Recovery
Arrangements; Natural Disaster Resilience Program; and All West Australians Reducing Emergencies program. Grants and subsidies paid to volunteer entities and external bodies in line with approved schemes, agreements and statutes:
- Various volunteer entities (a) 661 844 - Volunteer Marine Rescue Service Group 987 733 - Affiliated bodies (b) 1,060 959 - Local government - Community Emergency Services Manager 1,140 588 - Other grants and subsidies 253 279
Capital Local governments 20,670 13,649 Volunteer Marine Rescue Service Groups 1,075 2,318 158,221 49,044 (a) See note 2(x) ‘Establishment of volunteer entities’.
(b) See note 40 ‘Affiliated bodies’.
Notes to the Financial Statements For the year ended 30 June 2012
123,669 21,691
Back ForwardBack Forward

7 1 Section 4 - Disclosures and Legal Compliance
Fire and Emergency Services Authority of Western Australia
2012 2011 $000 $000
10 Other expenses Doubtful debts expense 27 - Employment on-costs 3,441 3,573 Audit fees 125 137 3,593 3,710
11 User charges and fees User charges 6,145 4,983 Emergency services levy 232,842 218,803 238,987 223,786
See note 2(e) ‘Income’.
12 Commonwealth grants and contributions Recurrent 8,082 6,855 Capital - 259 Other 109 14 8,191 7,128
Commonwealth grants are received for various purposes including non-repayable grants that contribute towards FESA operational capabilities such as the state support package, aerial fire fighting and the Indian Ocean Territories.
FESA administers the Commonwealth Government’s Natural Disaster Resilience Program (NDRP); a single funding program aimed at developing safer, more sustainable communities that are better able to withstand the effects of natural disasters by reducing the risks of loss and damage caused by such events.
The total Commonwealth contribution for the NDRP is shown in the 2009 National Partnership Agreement between the Commonwealth and each jurisdiction. The Agreement expires on 30 June 2013.
For the reporting period ending 30 June 2012, FESA received $3.1 million to allocate to successful projects. This amount was increased by a further $67,000 which related to a saving on the previous Natural Disaster Mitigation Program. Thirty-one projects were funded and at the end of the reporting period $2.9m remained unallocated in the Program.
Notes to the Financial Statements For the year ended 30 June 2012
Back ForwardBack Forward
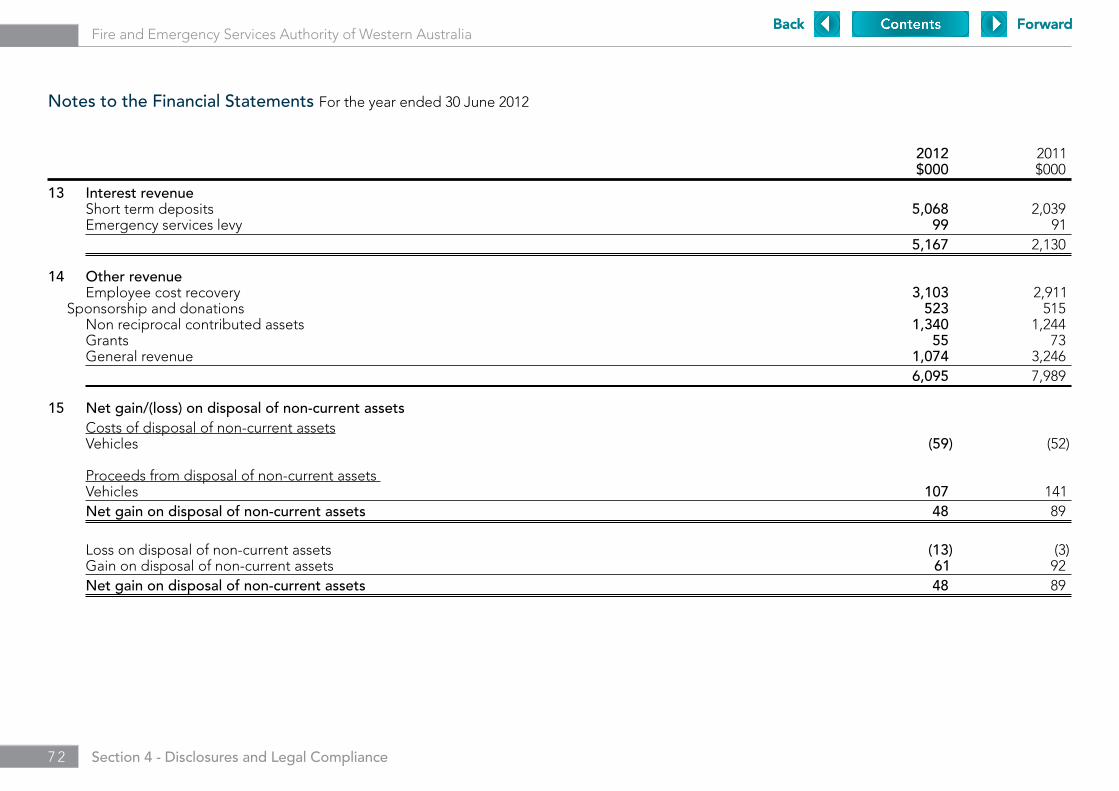
7 2 Section 4 - Disclosures and Legal Compliance
Fire and Emergency Services Authority of Western Australia
2012) 2011) $000) $000)
13 Interest revenue Short term deposits 5,068) 2,039) Emergency services levy 99) 91) 5,167) 2,130)
14 Other revenue Employee cost recovery 3,103) 2,911) Sponsorship and donations 523) 515) Non reciprocal contributed assets 1,340) 1,244) Grants 55) 73) General revenue 1,074) 3,246) 6,095) 7,989)
15 Net gain/(loss) on disposal of non-current assets Costs of disposal of non-current assets Vehicles (59) (52) Proceeds from disposal of non-current assets Vehicles 107) 141) Net gain on disposal of non-current assets 48) 89)
Loss on disposal of non-current assets (13) (3) Gain on disposal of non-current assets 61) 92) Net gain on disposal of non-current assets 48) 89)
Notes to the Financial Statements For the year ended 30 June 2012
Back ForwardBack Forward
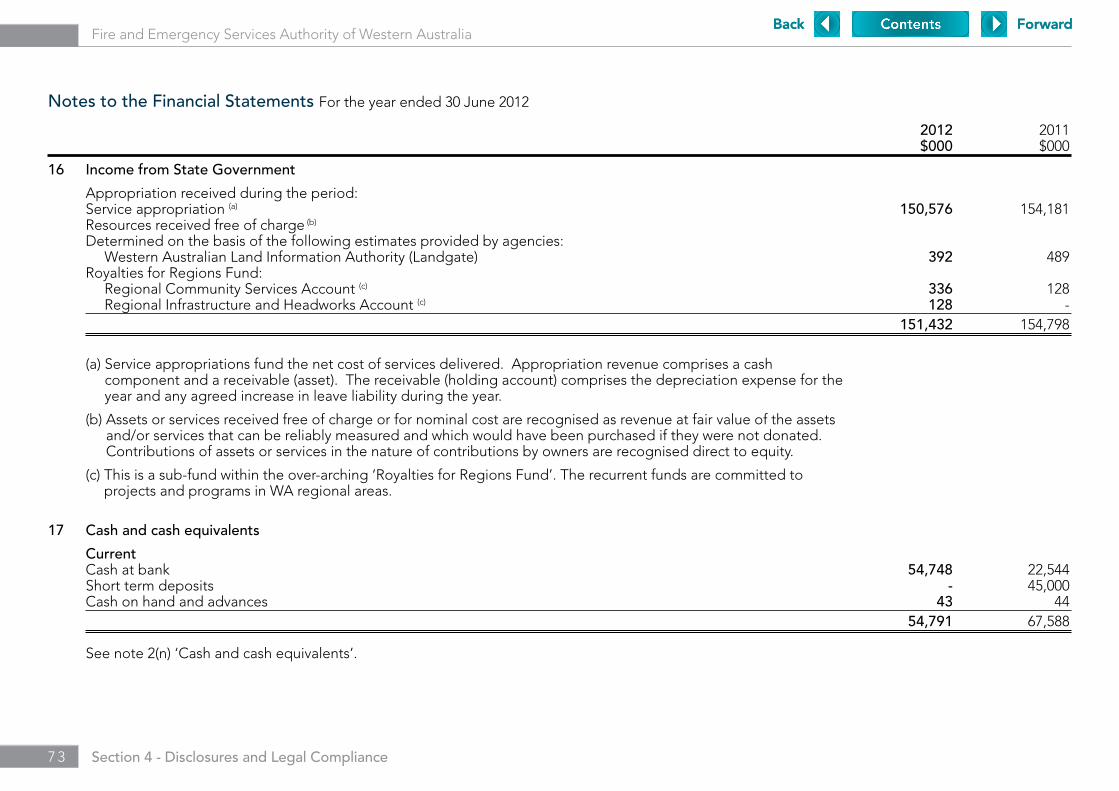
7 3 Section 4 - Disclosures and Legal Compliance
Fire and Emergency Services Authority of Western Australia
2012 2011 $000 $000
16 Income from State Government
Appropriation received during the period: Service appropriation (a) 150,576 154,181 Resources received free of charge (b)
Determined on the basis of the following estimates provided by agencies: Western Australian Land Information Authority (Landgate) 392 489 Royalties for Regions Fund: Regional Community Services Account (c) 336 128 Regional Infrastructure and Headworks Account (c) 128 - 151,432 154,798
(a) Service appropriations fund the net cost of services delivered. Appropriation revenue comprises a cash
component and a receivable (asset). The receivable (holding account) comprises the depreciation expense for the year and any agreed increase in leave liability during the year.
(b) Assets or services received free of charge or for nominal cost are recognised as revenue at fair value of the assets and/or services that can be reliably measured and which would have been purchased if they were not donated. Contributions of assets or services in the nature of contributions by owners are recognised direct to equity.
(c) This is a sub-fund within the over-arching ‘Royalties for Regions Fund’. The recurrent funds are committed to projects and programs in WA regional areas.
17 Cash and cash equivalents
Current Cash at bank 54,748 22,544 Short term deposits - 45,000 Cash on hand and advances 43 44 54,791 67,588
See note 2(n) ‘Cash and cash equivalents’.
Notes to the Financial Statements For the year ended 30 June 2012
Back ForwardBack Forward
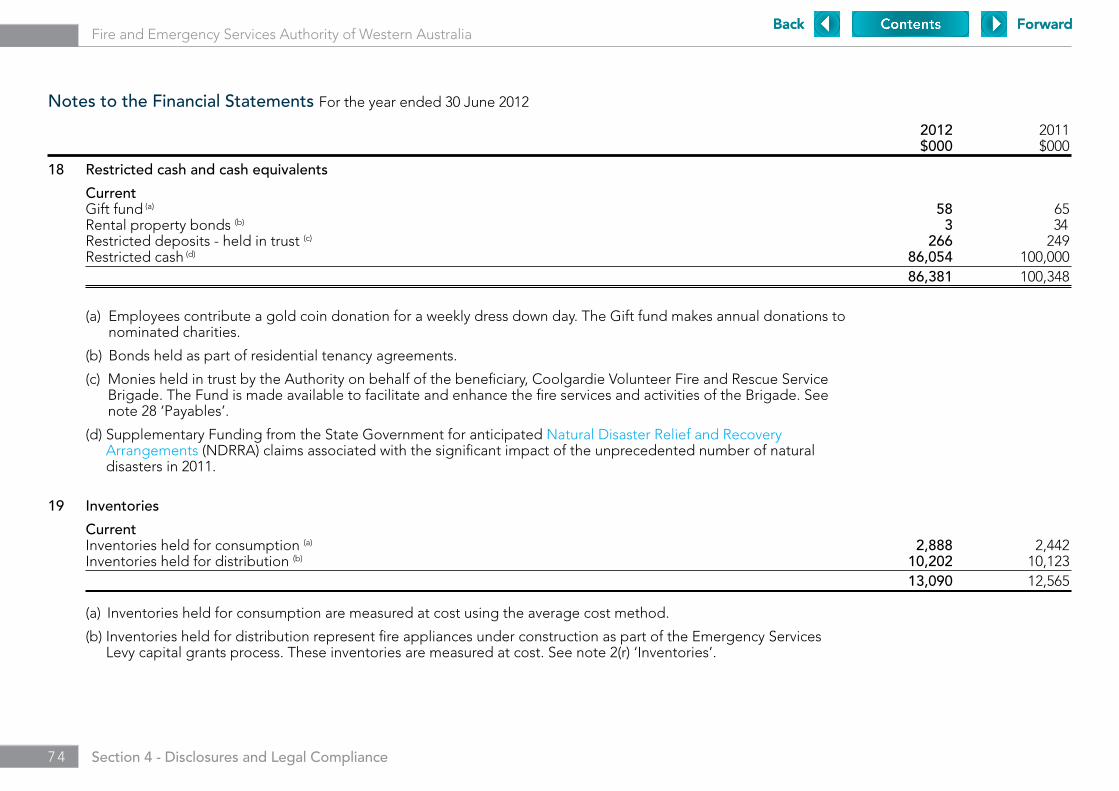
7 4 Section 4 - Disclosures and Legal Compliance
Fire and Emergency Services Authority of Western Australia
2012 2011 $000 $000
18 Restricted cash and cash equivalents
Current Gift fund (a) 58 65 Rental property bonds (b) 3 34 Restricted deposits - held in trust (c) 266 249 Restricted cash (d) 86,054 100,000 86,381 100,348
(a) Employees contribute a gold coin donation for a weekly dress down day. The Gift fund makes annual donations to nominated charities.
(b) Bonds held as part of residential tenancy agreements.
(c) Monies held in trust by the Authority on behalf of the beneficiary, Coolgardie Volunteer Fire and Rescue Service Brigade. The Fund is made available to facilitate and enhance the fire services and activities of the Brigade. See note 28 ‘Payables’.
(d) Supplementary Funding from the State Government for anticipated Natural Disaster Relief and Recovery Arrangements (NDRRA) claims associated with the significant impact of the unprecedented number of natural disasters in 2011.
19 Inventories
Current Inventories held for consumption (a) 2,888 2,442 Inventories held for distribution (b) 10,202 10,123 13,090 12,565
(a) Inventories held for consumption are measured at cost using the average cost method.
(b) Inventories held for distribution represent fire appliances under construction as part of the Emergency Services Levy capital grants process. These inventories are measured at cost. See note 2(r) ‘Inventories’.
Notes to the Financial Statements For the year ended 30 June 2012
Back ForwardBack Forward
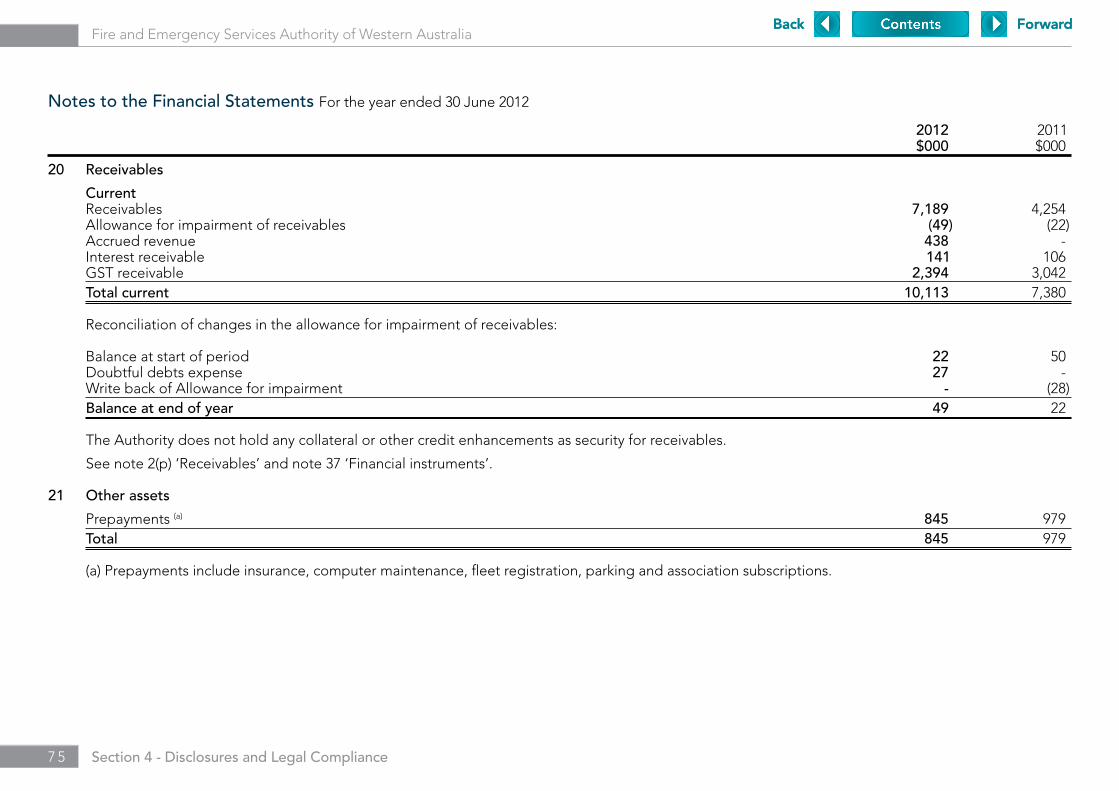
7 5 Section 4 - Disclosures and Legal Compliance
Fire and Emergency Services Authority of Western Australia
2012) 2011) $000) $000)
20 Receivables
Current Receivables 7,189) 4,254) Allowance for impairment of receivables (49) (22) Accrued revenue 438) -) Interest receivable 141) 106) GST receivable 2,394) 3,042) Total current 10,113) 7,380)
Reconciliation of changes in the allowance for impairment of receivables:
Balance at start of period 22) 50) Doubtful debts expense 27) -) Write back of Allowance for impairment -) (28) Balance at end of year 49) 22)
The Authority does not hold any collateral or other credit enhancements as security for receivables.
See note 2(p) ‘Receivables’ and note 37 ‘Financial instruments’.
21 Other assets
Prepayments (a) 845) 979) Total 845) 979)
(a) Prepayments include insurance, computer maintenance, fleet registration, parking and association subscriptions.
Notes to the Financial Statements For the year ended 30 June 2012
Back ForwardBack Forward

7 6 Section 4 - Disclosures and Legal Compliance
Fire and Emergency Services Authority of Western Australia
2012 2011 $000 $000
22 Non-current assets classified as held for sale
Opening balance Land - - Buildings - - - - Assets reclassified as held for sale Land 6,993 - Buildings 21,643 - 28,636 - Total assets classified as held for sale Land 6,993 - Buildings 21,643 - 28,636 - Less assets sold Land - - Buildings - - - - Closing balance Land 6,993 - Buildings 21,643 - 28,636 - FESA’s headquarters is relocating to the Emergency Services Complex at Cockburn Central in October 2012 with the result the current headquarters,
FESA House, located at 480 Hay Street, Perth will become vacant. The building does not meet the requirements for listing on the State Heritage Register and has been released to the market through a registration of interest process for its sale. The Fire and Emergency Services Education and Heritage Centre adjacent to FESA House is a heritage listed building. It will continue to provide hazard, safety and emergency education and information to the community. See note 2(j) ‘Non-current assets (or disposal groups) classified as held for sale’.
23 Amounts receivable for services (holding account)
Non-current 17,355 13,630 Total 17,355 13,630
Represents the non-cash component of service appropriations. It is restricted in that it can only be used for asset replacement or payment of leave liability. See note 2(q) ‘Amounts receivable for services (holding account)’.
Notes to the Financial Statements For the year ended 30 June 2012
Back ForwardBack Forward
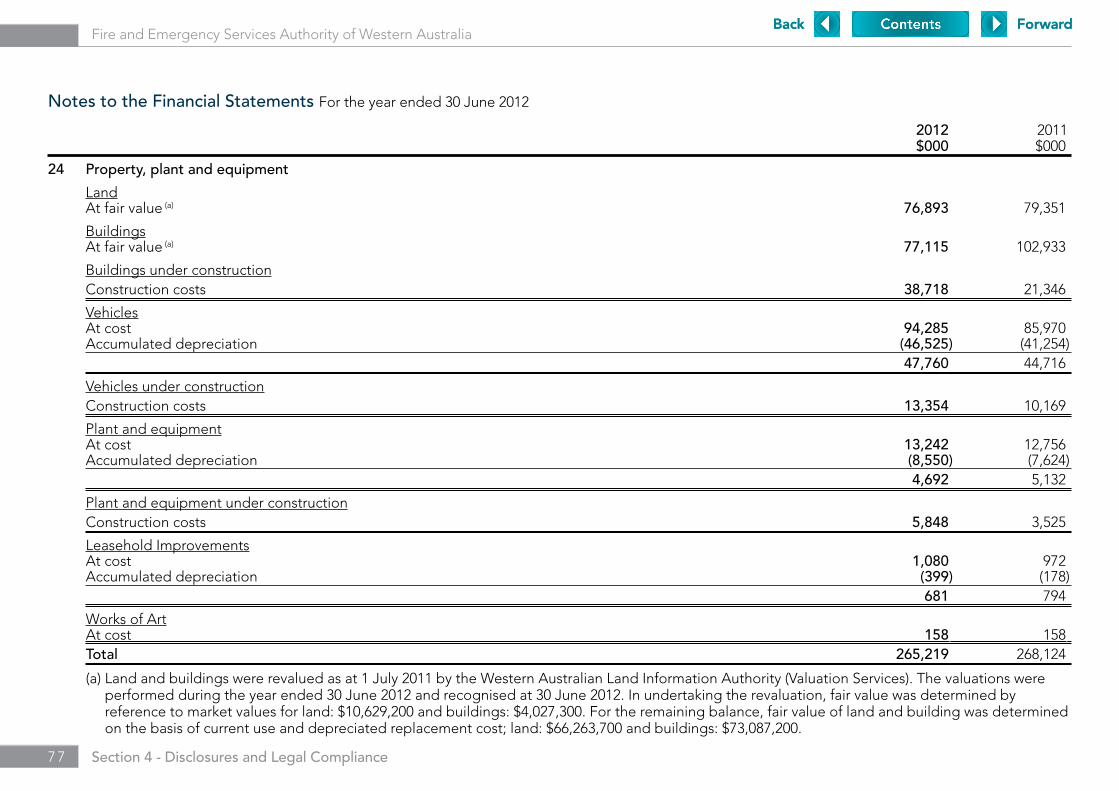
7 7 Section 4 - Disclosures and Legal Compliance
Fire and Emergency Services Authority of Western Australia
2012) 2011) $000) $000)
24 Property, plant and equipment
Land At fair value (a) 76,893) 79,351)
Buildings At fair value (a) 77,115) 102,933)
Buildings under construction Construction costs 38,718) 21,346)
Vehicles At cost 94,285) 85,970) Accumulated depreciation (46,525) (41,254) 47,760) 44,716)
Vehicles under construction Construction costs 13,354) 10,169)
Plant and equipment At cost 13,242) 12,756) Accumulated depreciation (8,550) (7,624) 4,692) 5,132)
Plant and equipment under construction Construction costs 5,848) 3,525)
Leasehold Improvements At cost 1,080) 972) Accumulated depreciation (399) (178) 681) 794)
Works of Art At cost 158) 158) Total 265,219) 268,124)
(a) Land and buildings were revalued as at 1 July 2011 by the Western Australian Land Information Authority (Valuation Services). The valuations were performed during the year ended 30 June 2012 and recognised at 30 June 2012. In undertaking the revaluation, fair value was determined by reference to market values for land: $10,629,200 and buildings: $4,027,300. For the remaining balance, fair value of land and building was determined on the basis of current use and depreciated replacement cost; land: $66,263,700 and buildings: $73,087,200.
Notes to the Financial Statements For the year ended 30 June 2012
Back ForwardBack Forward
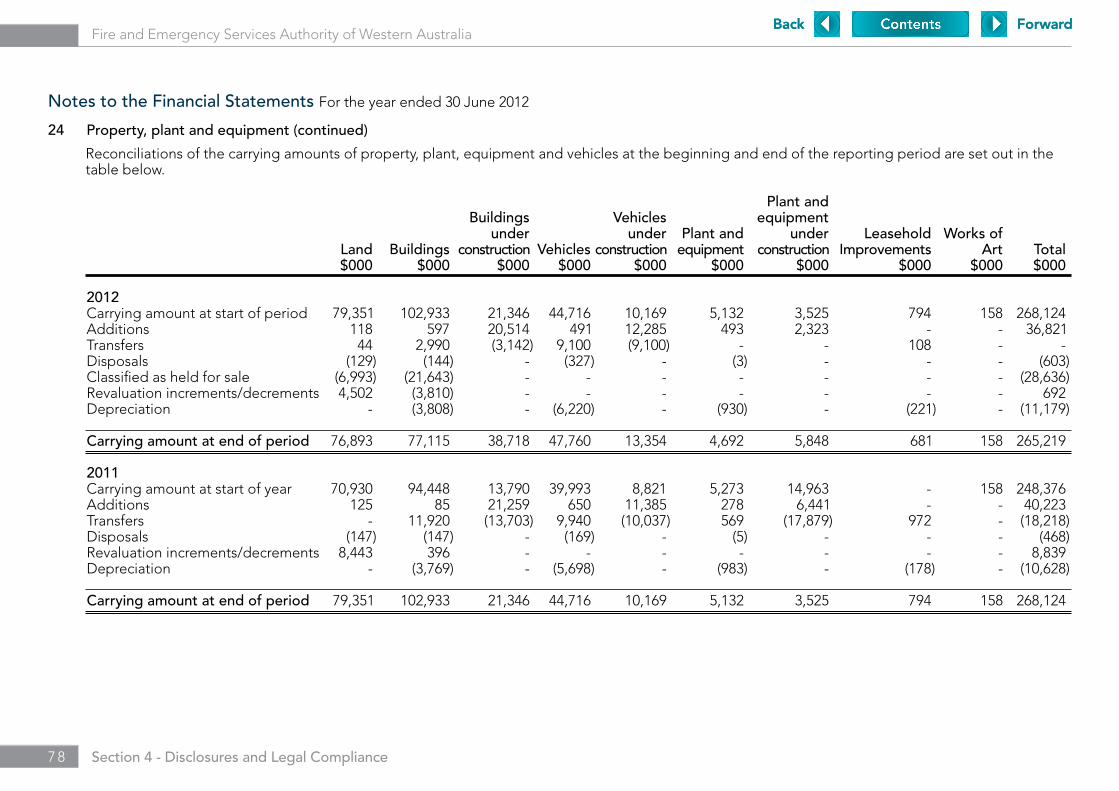
7 8 Section 4 - Disclosures and Legal Compliance
Fire and Emergency Services Authority of Western Australia
24 Property, plant and equipment (continued)
Reconciliations of the carrying amounts of property, plant, equipment and vehicles at the beginning and end of the reporting period are set out in the table below.
Plant and) Buildings) Vehicles) equipment) under) under) Plant and) under) Leasehold) Works of Land) Buildings) construction) Vehicles) construction) equipment) construction) Improvements) Art Total) $000) $000) $000) $000) $000) $000) $000) $000) $000 $000)
2012 Carrying amount at start of period 79,351) 102,933) 21,346) 44,716) 10,169) 5,132) 3,525) 794) 158 268,124) Additions 118) 597) 20,514) 491) 12,285) 493) 2,323) -) - 36,821) Transfers 44) 2,990) (3,142) 9,100) (9,100) -) -) 108) - -) Disposals (129) (144) -) (327) -) (3) -) -) - (603) Classified as held for sale (6,993) (21,643) -) -) -) -) -) -) - (28,636) Revaluation increments/decrements 4,502) (3,810) -) -) -) -) -) -) - 692) Depreciation -) (3,808) -) (6,220) -) (930) -) (221) - (11,179)
Carrying amount at end of period 76,893) 77,115) 38,718) 47,760) 13,354) 4,692) 5,848) 681) 158 265,219)
2011 Carrying amount at start of year 70,930) 94,448) 13,790) 39,993) 8,821) 5,273) 14,963) -) 158 248,376) Additions 125) 85) 21,259) 650) 11,385) 278) 6,441) -) - 40,223) Transfers -) 11,920) (13,703) 9,940) (10,037) 569) (17,879) 972) - (18,218) Disposals (147) (147) -) (169) -) (5) -) -) - (468) Revaluation increments/decrements 8,443) 396) -) -) -) -) -) -) - 8,839) Depreciation -) (3,769) -) (5,698) -) (983) -) (178) - (10,628)
Carrying amount at end of period 79,351) 102,933) 21,346) 44,716) 10,169) 5,132) 3,525) 794) 158 268,124)
Notes to the Financial Statements For the year ended 30 June 2012
Back ForwardBack Forward

7 9 Section 4 - Disclosures and Legal Compliance
Fire and Emergency Services Authority of Western Australia
2012) 2011) $000) $000)
25 Intangible assets Computer software At cost 2,489) 2,252) Accumulated amortisation (2,048) (1,890) 441) 362) Reconciliations: Computer software Carrying amount at start of period 362) 541) Additions 349) 79) Amortisation expense (270) (258) Carrying amount at end of period 441) 362)
26 Other financial assets Current Held-to-maturity investments (a) 500) -) Total 500) -)
Non current Held-to-maturity investments (a) -) 500) Total -) 500)
(a) See note 2(s) ‘Other financial assets’.27 Impairment of assets There were no indications of impairment to property, plant and equipment or intangible assets at 30 June 2012. The Authority held no goodwill or intangible assets with an indefinite useful life during the reporting period. At the end of the reporting period there
were no intangible assets not yet available for use. See note 2(i) ‘Impairment of assets’. 28 Payables Current Trade payables 7,933) 8,890) Accrued interest 696) 219) Accrued salaries 888) 23) Client account - trust fund 266) 249) Income received in advance -) 145) GST payable 754) 387) Total current 10,537) 9,913)
See note 2(t) ‘Payables’, note 2(o) ‘Accrued salaries’, note 18 ‘Restricted cash and cash equivalents’ and note 37 ‘Financial instruments’.
Notes to the Financial Statements For the year ended 30 June 2012
Back ForwardBack Forward

8 0 Section 4 - Disclosures and Legal Compliance
Fire and Emergency Services Authority of Western Australia
2012 2011 $000 $000
29 Borrowings Current
Western Australian Treasury Corporation Loans 33,407 2,356
Non-current
Western Australian Treasury Corporation Loans 42,416 44,773
30 Provisions Current Employee benefits provision Annual leave (a) 8,518 7,548 Long service leave (b) 9,095 8,556 Deferred salary scheme (c) 122 152 17,735 16,256
Other provisions Employment on-costs (d) 2,431 2,514 20,166 18,770
Non - current Employee benefits provision Long service leave (b) 7,237 7,268
Other provisions Employment on-costs (d) 1,010 1,058 8,247 8,326
(a) Annual leave liabilities have been classified as current as there is no unconditional right to defer settlement for at least 12 months after the end of the reporting period. Assessments indicate that actual settlement of the liabilities is expected to occur as follows:
Within 12 months of the end of the reporting period 7,783 5,936 More than 12 months after the reporting period 735 1,612
8,518 7,548
Notes to the Financial Statements For the year ended 30 June 2012
Back ForwardBack Forward

8 1 Section 4 - Disclosures and Legal Compliance
Fire and Emergency Services Authority of Western Australia
2012) 2011 $000) $000
30 Provisions (continued)
(b) Long service leave liabilities have been classified as current where there is no unconditional right to defer settlement for at least 12 months after the end of the reporting period. Assessments indicate that actual settlement of the liabilities is expected to occur as follows:
Within 12 months of the end of the reporting period 2,449) 2,127 More than 12 months after the end of the reporting period 13,883) 13,697
16,332) 15,824
(c) Deferred salary scheme liabilities have been classified as current where there is no unconditional right to defer settlement for at least 12 months after the end of the reporting period. Actual settlement of the liabilities is expected to occur as follows: Within 12 months of the end of the reporting period -) - More than 12 months after the end of the reporting period 122) 152
122) 152
(d) The settlement of annual and long service leave liabilities gives rise to the payment of employment on-costs including workers’ compensation insurance. The provision is the present value of expected future payments. The associated expense, apart from the unwinding of the discount (finance cost), is disclosed in note 10 ‘Other expenses’.
Movements in other provisions Movements in each class of provisions during the financial year, other than employee benefits, are set out below. Employment on-cost provision Carrying amount at start of period 3,572) 2,713 Additional / (reversals) provisions recognised (131) 859 Carrying amount at end of period 3,441) 3,572
See note 2(v) ‘Provisions’.
Notes to the Financial Statements For the year ended 30 June 2012
Back ForwardBack Forward
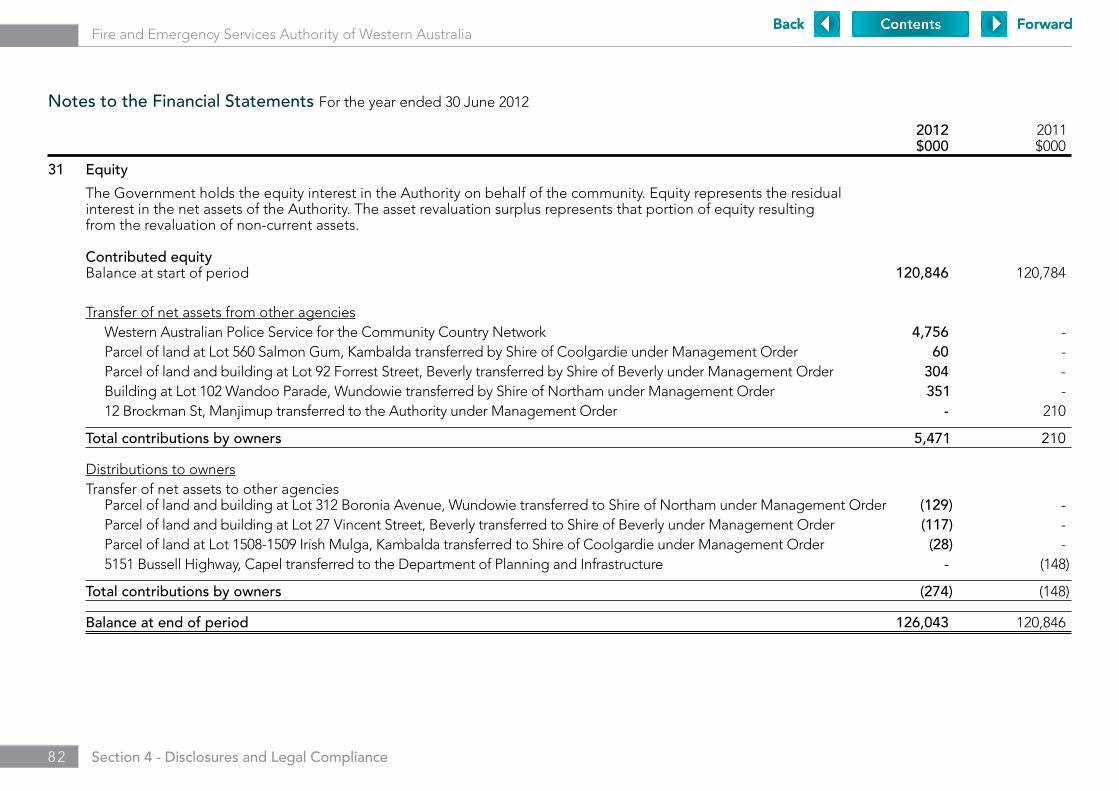
8 2 Section 4 - Disclosures and Legal Compliance
Fire and Emergency Services Authority of Western Australia
2012) 2011) $000) $000)
31 Equity
The Government holds the equity interest in the Authority on behalf of the community. Equity represents the residual interest in the net assets of the Authority. The asset revaluation surplus represents that portion of equity resulting from the revaluation of non-current assets.
Contributed equity Balance at start of period 120,846) 120,784)
Transfer of net assets from other agencies Western Australian Police Service for the Community Country Network 4,756) -) Parcel of land at Lot 560 Salmon Gum, Kambalda transferred by Shire of Coolgardie under Management Order 60) -) Parcel of land and building at Lot 92 Forrest Street, Beverly transferred by Shire of Beverly under Management Order 304) -) Building at Lot 102 Wandoo Parade, Wundowie transferred by Shire of Northam under Management Order 351) -) 12 Brockman St, Manjimup transferred to the Authority under Management Order -) 210)
Total contributions by owners 5,471) 210)
Distributions to owners Transfer of net assets to other agencies Parcel of land and building at Lot 312 Boronia Avenue, Wundowie transferred to Shire of Northam under Management Order (129) -) Parcel of land and building at Lot 27 Vincent Street, Beverly transferred to Shire of Beverly under Management Order (117) -) Parcel of land at Lot 1508-1509 Irish Mulga, Kambalda transferred to Shire of Coolgardie under Management Order (28) -) 5151 Bussell Highway, Capel transferred to the Department of Planning and Infrastructure -) (148)
Total contributions by owners (274) (148)
Balance at end of period 126,043) 120,846)
Notes to the Financial Statements For the year ended 30 June 2012
Back ForwardBack Forward

8 3 Section 4 - Disclosures and Legal Compliance
Fire and Emergency Services Authority of Western Australia
2012) 2011 $000) $000
31 Equity (continued)
Reserves Asset revaluation surplus Balance at start of period 79,845) 71,006 Net revaluation increments/(decrements): Land 4,502) 8,443 Buildings (3,810) 396 Balance at end of period 80,537) 79,845
Accumulated surplus/(deficit) Balance at start of period 186,647) 101,228 Result for the period (30,629) 85,419 Balance at end of period 156,018) 186,647
Notes to the Financial Statements For the year ended 30 June 2012
Back ForwardBack Forward
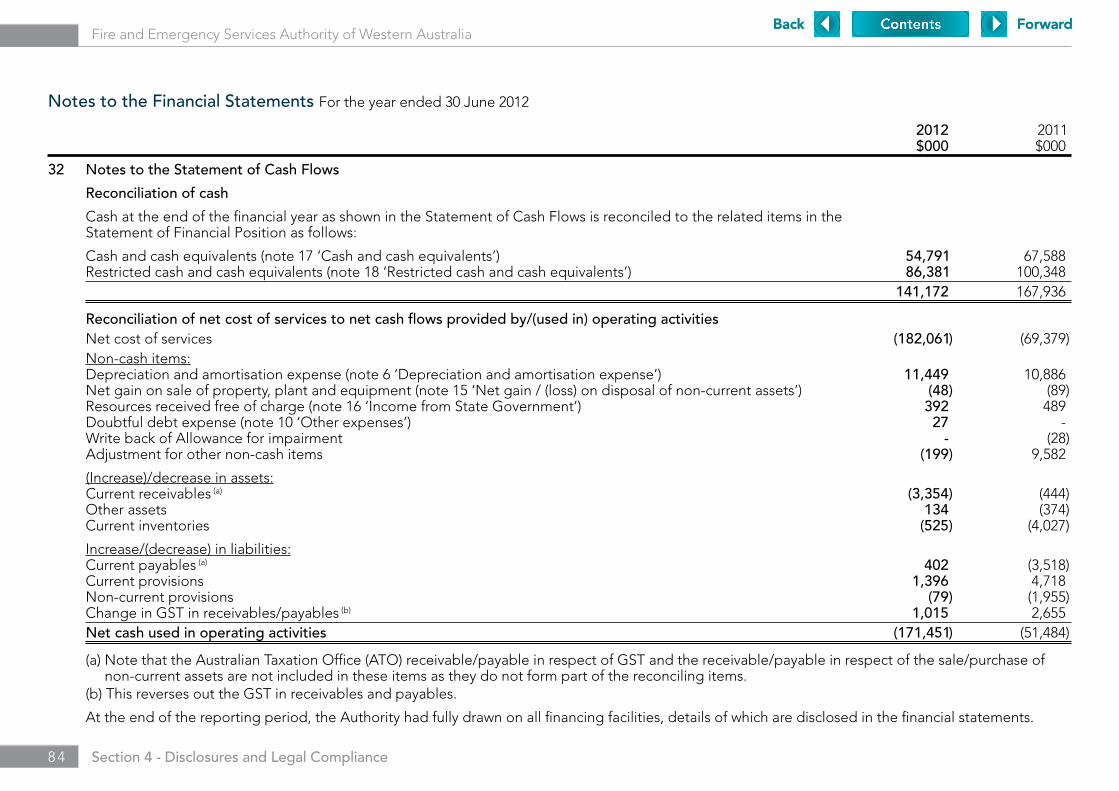
8 4 Section 4 - Disclosures and Legal Compliance
Fire and Emergency Services Authority of Western Australia
2012) 2011) $000) $000)
32 Notes to the Statement of Cash Flows
Reconciliation of cash
Cash at the end of the financial year as shown in the Statement of Cash Flows is reconciled to the related items in the Statement of Financial Position as follows:
Cash and cash equivalents (note 17 ‘Cash and cash equivalents’) 54,791) 67,588) Restricted cash and cash equivalents (note 18 ‘Restricted cash and cash equivalents’) 86,381) 100,348) 141,172) 167,936)
Reconciliation of net cost of services to net cash flows provided by/(used in) operating activities Net cost of services (182,061) (69,379) Non-cash items: Depreciation and amortisation expense (note 6 ‘Depreciation and amortisation expense’) 11,449) 10,886) Net gain on sale of property, plant and equipment (note 15 ‘Net gain / (loss) on disposal of non-current assets’) (48) (89) Resources received free of charge (note 16 ‘Income from State Government’) 392) 489) Doubtful debt expense (note 10 ‘Other expenses’) 27) -) Write back of Allowance for impairment -) (28) Adjustment for other non-cash items (199) 9,582)
(Increase)/decrease in assets: Current receivables (a) (3,354) (444) Other assets 134) (374) Current inventories (525) (4,027)
Increase/(decrease) in liabilities: Current payables (a) 402) (3,518) Current provisions 1,396) 4,718) Non-current provisions (79) (1,955) Change in GST in receivables/payables (b) 1,015) 2,655) Net cash used in operating activities (171,451) (51,484)
(a) Note that the Australian Taxation Office (ATO) receivable/payable in respect of GST and the receivable/payable in respect of the sale/purchase of non-current assets are not included in these items as they do not form part of the reconciling items.
(b) This reverses out the GST in receivables and payables.
At the end of the reporting period, the Authority had fully drawn on all financing facilities, details of which are disclosed in the financial statements.
Notes to the Financial Statements For the year ended 30 June 2012
Back ForwardBack Forward

8 5 Section 4 - Disclosures and Legal Compliance
Fire and Emergency Services Authority of Western Australia
2012 2011 $000 $000
33 Commitments
The commitments below are inclusive of GST where relevant.
Capital expenditure commitments
Capital expenditure commitments, being contracted capital expenditure additional to the amounts reported in the financial statements, are payable as follows:
Within 1 year 32,379 26,882 32,379 26,882 The capital commitments include amounts for: Buildings 26,531 22,734 Plant and equipment 5,848 4,148 32,379 26,882
Non-cancellable operating lease commitments
Commitments in relation to non-cancellable operating leases for accommodation and motor vehicles contracted for at the reporting period but not recognised in the financial statements are payable as follows:
Within 1 year 3,989 6,389 Later than 1 year and not later than 5 years 3,363 4,003 Later than 5 years 23 367 7,375 10,759
FESA’s fleet, commercial and residential leases account for the majority of the non-cancellable operating lease commitments. The fleet lease term varies depending on the vehicle. The lease payments are fixed for the term of the lease and are payable monthly. There is no option to renew the lease at the end of the lease term.
The commercial and residential lease commitments are calculated and forecast based on the information available at the reporting date and do not take into consideration any impacts of future changes arising from market conditions or rental reviews.
Notes to the Financial Statements For the year ended 30 June 2012
Back ForwardBack Forward
8 6 Section 4 - Disclosures and Legal Compliance
Fire and Emergency Services Authority of Western Australia
34 Contingent liabilities and contingent assets
Contingent liabilities
The following contingent liabilities are additional to the liabilities included in the financial statements.
Contaminated sitesUnder the Contaminated Sites Act 2003, the Authority is required to report known and suspected contaminated sites to the Department of Environment and Conservation (DEC). In accordance with the Act, DEC classifies these sites on the basis of the risk to human health, the environment and environmental values. Where sites are classified as contaminated - remediation required or possibly contaminated - investigation required, the Authority may have a liability in respect of investigation or remediation expenses.
In 2006/07 the Authority reported one contaminated site to DEC. The site is a former drum storage area at the FESA Training Centre located at Dundas Road, Forrestfield. The Authority is unable to assess the likely outcome of the classification process. It is not practicable to estimate the potential financial effect or to identify the uncertainties relating to the amount or timing of any outflows. The Authority has applied and received funding from the Contaminated Sites Management Account to undertake further investigative work.
In August 2008, a contract was awarded to a qualified consultant to undertake a Detailed Site Investigation (DSI) including soil and gas vapour surveys. In October 2008, an accredited contaminated sites auditor was also appointed to provide a mandatory audit report as part of the DSI. The DSI was completed late 2009 and the comprehensive report delivered to FESA mid 2011. The report indicates no immediate need for site remediation, but this may be a consideration in future depending on site development plans.
Golder Associates was commissioned by FESA to develop a Site Management Plan that can be referenced when conducting future works on the site. This plan is currently with Landcorp for comment. Once this is finalised it will complete the works required under the original contract.
35 Events occurring after the end of the reporting period
The Economic and Expenditure Reform Committee (EERC) approved the transfer of the responsibility for the installation, removal and maintenance of fire hydrants from the Fire and Emergency Services Authority (FESA) to Water Corporation. The Water Corporation will assume responsibility from 1 July 2012, however the responsibility for fire hydrant maintenance in areas connected to the reticulated mains managed by AgWest and Busselton Water will remain with FESA and Local Government until the legislative process for the Water Services Bill currently before Parliament has been finalised.
Notes to the Financial Statements For the year ended 30 June 2012
Back ForwardBack Forward
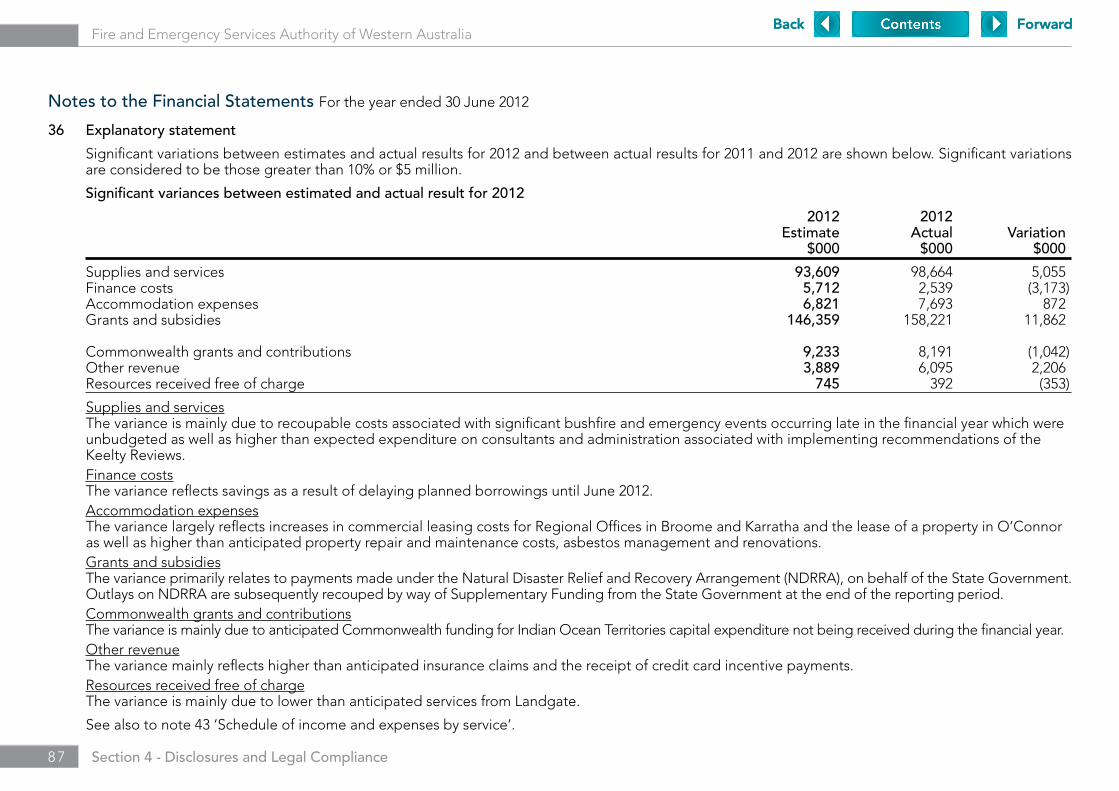
8 7 Section 4 - Disclosures and Legal Compliance
Fire and Emergency Services Authority of Western Australia
36 Explanatory statement
Significant variations between estimates and actual results for 2012 and between actual results for 2011 and 2012 are shown below. Significant variations are considered to be those greater than 10% or $5 million.
Significant variances between estimated and actual result for 2012
2012 2012 Estimate Actual Variation) $000 $000 $000)
Supplies and services 93,609 98,664 5,055) Finance costs 5,712 2,539 (3,173) Accommodation expenses 6,821 7,693 872) Grants and subsidies 146,359 158,221 11,862)
Commonwealth grants and contributions 9,233 8,191 (1,042) Other revenue 3,889 6,095 2,206) Resources received free of charge 745 392 (353)
Supplies and services The variance is mainly due to recoupable costs associated with significant bushfire and emergency events occurring late in the financial year which were
unbudgeted as well as higher than expected expenditure on consultants and administration associated with implementing recommendations of the Keelty Reviews.
Finance costs The variance reflects savings as a result of delaying planned borrowings until June 2012. Accommodation expenses The variance largely reflects increases in commercial leasing costs for Regional Offices in Broome and Karratha and the lease of a property in O’Connor
as well as higher than anticipated property repair and maintenance costs, asbestos management and renovations. Grants and subsidies The variance primarily relates to payments made under the Natural Disaster Relief and Recovery Arrangement (NDRRA), on behalf of the State Government.
Outlays on NDRRA are subsequently recouped by way of Supplementary Funding from the State Government at the end of the reporting period. Commonwealth grants and contributions The variance is mainly due to anticipated Commonwealth funding for Indian Ocean Territories capital expenditure not being received during the financial year. Other revenue The variance mainly reflects higher than anticipated insurance claims and the receipt of credit card incentive payments. Resources received free of charge The variance is mainly due to lower than anticipated services from Landgate.
See also to note 43 ‘Schedule of income and expenses by service’.
Notes to the Financial Statements For the year ended 30 June 2012
Back ForwardBack Forward

8 8 Section 4 - Disclosures and Legal Compliance
Fire and Emergency Services Authority of Western Australia
36 Explanatory statement (continued)
Significant variances between actual results for 2011 and 2012
2012 2011 Variation) $000 $000 $000)
Employee benefits expense 158,390 138,557 19,833) Depreciation and amortisation expense 11,449 10,886 563) Finance costs 2,539 228 2,311) Grants and subsidies 158,221 49,044 109,177) Loss on disposal of non-current assets 13 3 10)
User charges and fees 238,987 223,786 15,201) Commonwealth grants and contributions 8,191 7,128 1,063) Interest revenue 5,167 2,130 3,037) Other revenue 6,095 7,989 (1,894) Gain on disposal of non-current assets 61 92 (31) Resources received free of charge 392 489 (97) Royalties for Regions Fund 464 128 336)
Employee benefits expenses Employee benefits expenses are higher than last financial year mainly due to increased staffing primarily to boost frontline emergency services, an increase in
overtime associated with CHOGM, delays in making permanent appointments in training related positions, wage negotiations finalised for the Western Australian Fire Service Enterprise Bargaining Agreement, effective 9 June 2011, and the Government Officers Salaries, Allowance and Conditions Award, effective 9 April 2011, the rollout of level 2 protective clothing for career firefighters and by the additional annual and long service leave provisions resulting from higher levels of accrued leave by existing employees and actuarial assumptions.
Depreciation and amortisation expenseThe increase is in line with expected results of capitalising new fire appliances and building assets including the purchases of new fitness equipment.
Finance costsThe increase relates to increased borrowings from the WATC to fund approved capital works programs.
Grants and subsidiesThe increase in grants and subsidies is mainly due to payments made for the NDRRA for damage associated with the severe bushfire weather event in Margaret River in November 2011, severe thunderstorms and associated flooding in the South West land division, Eastern Central Wheatbelt and north eastern Great Southern region, Tropical Cyclone Heidi and associated flooding in the Pilbara, Western Kimberley, inland Gascoyne and Goldfield regions. The increase also reflects ESL grants made to the Local Government Authorities for distribution to Bush Fire Brigades and State Emergency Service Units.
Notes to the Financial Statements For the year ended 30 June 2012
Back ForwardBack Forward

8 9 Section 4 - Disclosures and Legal Compliance
Fire and Emergency Services Authority of Western Australia
36 Explanatory statement (continued)
Significant variances between actual results for 2011 and 2012 (continued)
Loss on disposal of non-current assets The increase in the loss is due to proceeds received for some disposed assets being lower than their written-down value. User charges and fees The variance is primarily due to an increase in the Emergency Services Levy collections to boost frontline emergency services, capital funding for local
governments and emergency service volunteers and an increase in the number of direct brigade alarm clients receiving alarm monitoring services.
Commonwealth grants and contributions The increase in Commonwealth grants and contributions is mainly due to additional funding from the National Aerial Firefighting Centre to ensure
adequate coverage during anticipated periods of high demand.
Interest revenue The increase in interest revenue mainly reflects the additional $100 million appropriation received from the State Government to fund the considerable
costs of expected declared natural disaster recovery and relief claims.
Other revenue The decrease in other revenue is largely due to the reduction of the Fringe Benefits Tax (FBT) provision created for FESA’s emergency service vehicles. Gain on disposal of non-current assets The variance is due to a reduced number of asset disposals. Resources received free of charge The variance in resources received free of charge is mainly due to an decrease in services provided by Landgate. Royalties for Regions Fund The increase reflects the State Government’s appropriation of Royalties for Regions program for FESA’s district allowance in regional WA.
Notes to the Financial Statements For the year ended 30 June 2012
Back ForwardBack Forward

9 0 Section 4 - Disclosures and Legal Compliance
Fire and Emergency Services Authority of Western Australia
37 Financial instruments
(a) Financial risk management objectives and policies
Financial instruments held by the Authority are cash and cash equivalents, restricted cash and cash equivalents, borrowings from the Western Australian Treasury Corporation (WATC), receivables and payables. The Authority has limited exposure to financial risks. The Authority’s overall risk management program focuses on managing the risks identified below.
Credit riskCredit risk arises when there is the possibility of the Authority’s receivables defaulting on their contractual obligations resulting in financial loss to the Authority.
The maximum exposure to credit risk at the end of the reporting period in relation to each class of recognised financial assets is the gross carrying amount of those assets inclusive of any allowance for impairment as shown in the table at note 37(c) ‘Financial instruments disclosures’ and note 20 ‘Receivables.’
Credit risk associated with the Authority’s financial assets is minimal because the main receivable is the amounts receivable for services (holding account). For receivables other than government, the Authority trades only with recognised, creditworthy third parties. The Authority has policies in place to ensure that sales of services are made to customers with an appropriate credit history. In addition, receivable balances are monitored on an ongoing basis with the result that the Authority’s exposure to bad debts is minimal. At the end of the reporting period there were no significant concentrations of credit risk.
Liquidity riskLiquidity risk arises when the Authority is unable to meet its financial obligations as they fall due.
The Authority is exposed to liquidity risk through its trading in the normal course of business.
The Authority has appropriate procedures to manage cash flows including drawdown of appropriations by monitoring forecast cash flows to ensure that sufficient funds are available to meet its commitments.
Notes to the Financial Statements For the year ended 30 June 2012
Back ForwardBack Forward
9 1 Section 4 - Disclosures and Legal Compliance
Fire and Emergency Services Authority of Western Australia
2012 2011 $000 $000
37 Financial instruments (continued)
(a) Financial risk management objectives and policies (continued)
Market riskMarket risk is the risk that changes in market prices such as foreign exchange rates and interest rates will affect the Authority’s income or the value of its holdings of financial instruments. The Authority does not trade in foreign currency and is not materially exposed to other price risks. The Authority’s exposure to market risk for changes in interest rates relate primarily to short-term investments and long-term debt obligations.
All borrowings are due to the Western Australian Treasury Corporation (WATC) and are repayable at fixed rates with varying maturities. The risk is managed by WATC through portfolio diversification and variation in maturity dates. Other than as detailed in the interest rate sensitivity analysis table at note 37(c), the Authority is not exposed to interest rate risk because apart from minor amounts of restricted cash, all other cash and cash equivalents and restricted cash are non-interest bearing and it has no borrowings other than WATC borrowings and short-term investments.
(b) Categories of financial instruments
The carrying amounts of each of the following categories of financial assets and financial liabilities at the end of the reporting period are as follows:
Financial Assets Cash and cash equivalents 54,791 67,588 Restricted cash and cash equivalents 86,381 100,348 Held to maturity investments - 500 Loans and receivables (a) 25,074 17,968 Financial Liabilities Financial liabilities measured at amortised cost 85,606 56,655
(a) The amount of receivables excludes GST recoverable from the ATO (statutory receivable).
Notes to the Financial Statements For the year ended 30 June 2012
Back ForwardBack Forward

9 2 Section 4 - Disclosures and Legal Compliance
Fire and Emergency Services Authority of Western Australia
37 Financial instruments (continued)
(c) Financial instrument disclosures
Credit risk The following table discloses the Authority’s maximum exposure to credit risk and the ageing analysis of financial assets. The Authority’s maximum
exposure to credit risk at the end of the reporting period is the carrying amount of financial assets as shown below. The table discloses the ageing of financial assets that are past due but not impaired and impaired financial assets. The table is based on information provided to senior management of the Authority.
The Authority does not hold any collateral as security or other credit enhancements relating to the financial assets it holds.
Ageing analysis of financial assets
Past due but not impaired
Carrying Not past Up to 1 1 - 3 3 - 12 1 - 5 More Impaired Amount due and not month months months years than 5 financial impaired years assets $000 $000 $000 $000 $000 $000 $000 $000
2012 Cash and cash equivalents 54,791 54,791 - - - - - - Restricted cash and cash equivalents 86,381 86,381 - - - - - - Receivables (a) 7,719 7,619 46 8 6 40 - - Amounts receivable for services 17,355 17,355 - - - - - - Other financial assets 500 500 - - - - - - 166,746 166,646 46 8 6 40 - -
2011 Cash and cash equivalents 67,588 67,588 - - - - - - Restricted cash and cash equivalents 100,348 100,348 - - - - - - Receivables (a) 4,338 2,869 41 - 1,311 97 20 - Amounts receivable for services 13,630 13,630 - - - - - - Other financial assets 500 500 - - - - - - 186,404 184,935 41 - 1,311 97 20 -
(a) The amount of receivables excludes the GST recoverable from the ATO (statutory receivable).
Notes to the Financial Statements For the year ended 30 June 2012
Back ForwardBack Forward
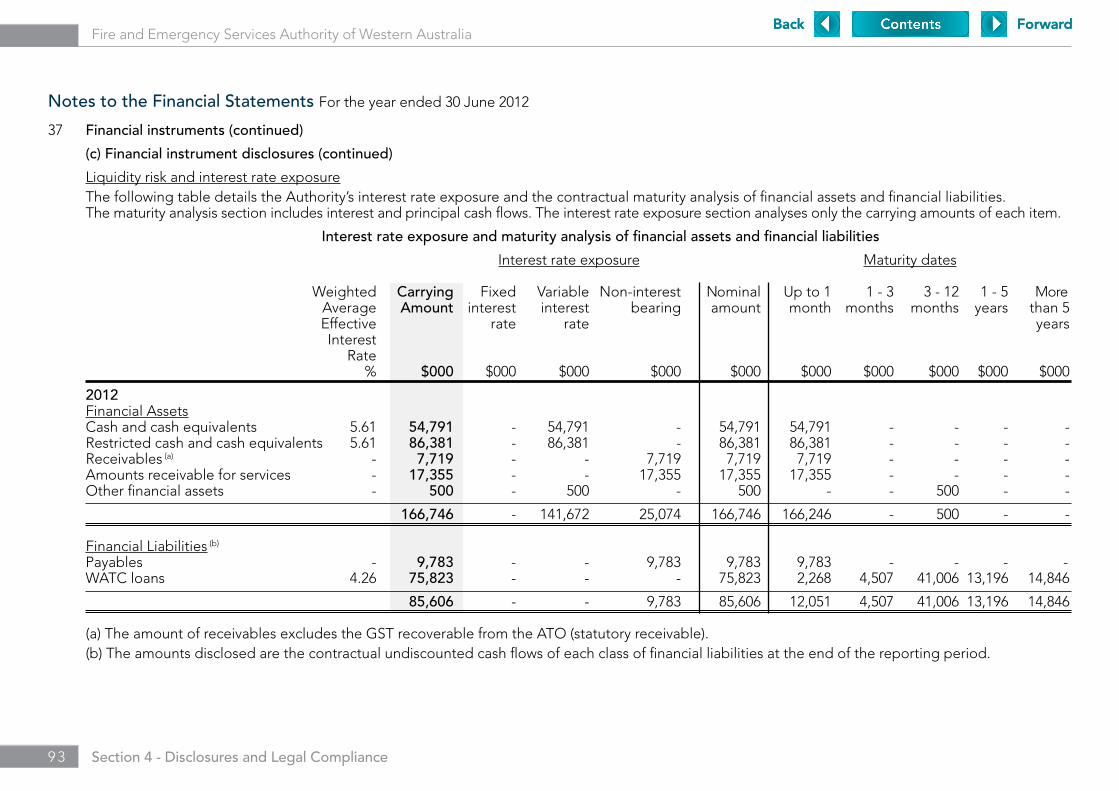
9 3 Section 4 - Disclosures and Legal Compliance
Fire and Emergency Services Authority of Western Australia
37 Financial instruments (continued)
(c) Financial instrument disclosures (continued)
Liquidity risk and interest rate exposure The following table details the Authority’s interest rate exposure and the contractual maturity analysis of financial assets and financial liabilities.
The maturity analysis section includes interest and principal cash flows. The interest rate exposure section analyses only the carrying amounts of each item.
Interest rate exposure and maturity analysis of financial assets and financial liabilities
Interest rate exposure Maturity dates Weighted Carrying Fixed Variable Non-interest Nominal Up to 1 1 - 3 3 - 12 1 - 5 More Average Amount interest interest bearing amount month months months years than 5 Effective rate rate years Interest Rate % $000 $000 $000 $000 $000 $000 $000 $000 $000 $000
2012 Financial Assets Cash and cash equivalents 5.61 54,791 - 54,791 - 54,791 54,791 - - - - Restricted cash and cash equivalents 5.61 86,381 - 86,381 - 86,381 86,381 - - - - Receivables (a) - 7,719 - - 7,719 7,719 7,719 - - - - Amounts receivable for services - 17,355 - - 17,355 17,355 17,355 - - - - Other financial assets - 500 - 500 - 500 - - 500 - -
166,746 - 141,672 25,074 166,746 166,246 - 500 - -
Financial Liabilities (b)
Payables - 9,783 - - 9,783 9,783 9,783 - - - - WATC loans 4.26 75,823 - - - 75,823 2,268 4,507 41,006 13,196 14,846
85,606 - - 9,783 85,606 12,051 4,507 41,006 13,196 14,846
(a) The amount of receivables excludes the GST recoverable from the ATO (statutory receivable). (b) The amounts disclosed are the contractual undiscounted cash flows of each class of financial liabilities at the end of the reporting period.
Notes to the Financial Statements For the year ended 30 June 2012
Back ForwardBack Forward

9 4 Section 4 - Disclosures and Legal Compliance
Fire and Emergency Services Authority of Western Australia
37 Financial instruments (continued)
(c) Financial instrument disclosures (continued)
Interest rate exposure and maturity analysis of financial assets and financial liabilities
Interest rate exposure Maturity dates Weighted Carrying Fixed Variable Non-interest Nominal Up to 1 1 - 3 3 - 12 1 - 5 More Average Amount interest interest bearing amount month months months years than 5 Effective rate rate years Interest Rate % $000 $000 $000 $000 $000 $000 $000 $000 $000 $000
2011 Financial Assets Cash and cash equivalents 5.34 67,588 45,000 22,588 - 67,588 67,588 - - - - Restricted cash and cash equivalents 5.34 100,348 - 100,348 - 100,348 100,348 - - - - Receivables (a) - 4,338 - - 4,338 4,338 4,338 - - - - Amounts receivable for services - 13,630 - - 13,630 13,630 13,630 - - - - Other financial assets - 500 - 500 - 500 - - 500 - -
186,404 45,000 123,436 17,968 186,404 185,904 - 500 - -
Financial Liabilities (b)
Payables - 9,526 - - 9,526 9,526 9,526 - - - - WATC loans 5.31 47,129 - - - 47,129 589 - 1,767 9,426 35,347
56,655 - - 9,526 56,655 10,115 - 1,767 9,426 35,347
(a) The amount of receivables excludes the GST recoverable from the ATO (statutory receivable). (b) The amounts disclosed are the contractual undiscounted cash flows of each class of financial liabilities at the end of the reporting period.
Notes to the Financial Statements For the year ended 30 June 2012
Back ForwardBack ForwardBack Forward
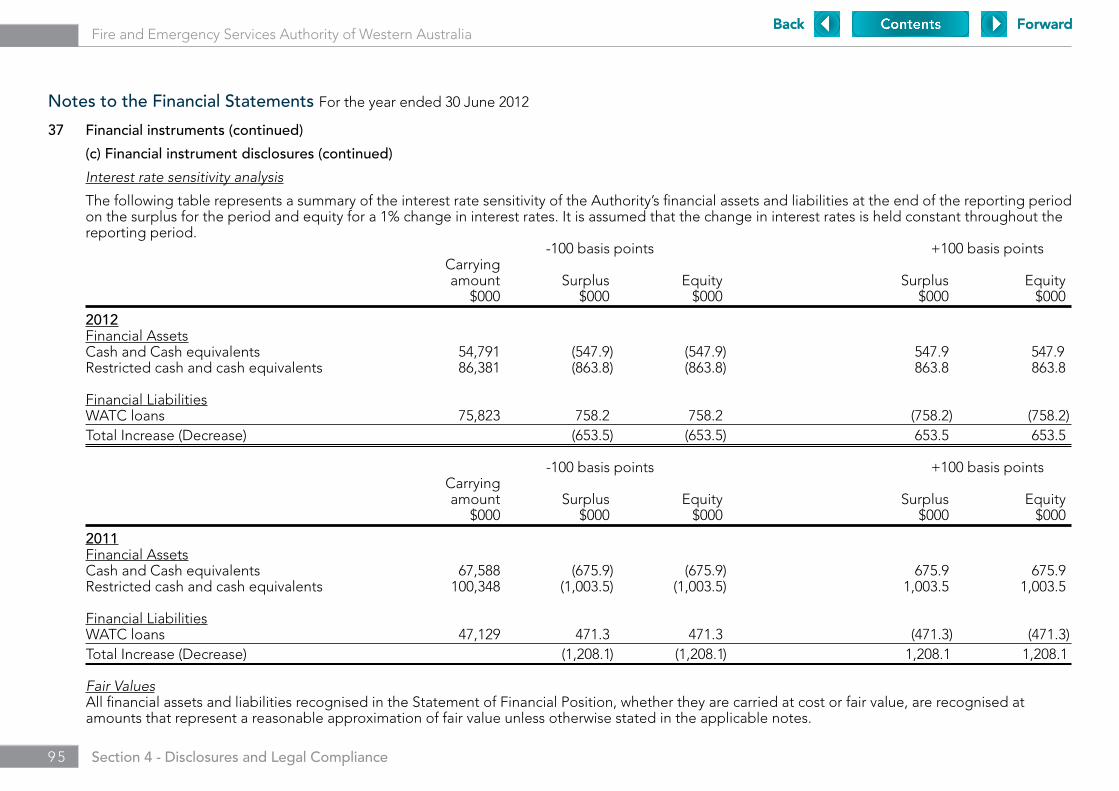
9 5 Section 4 - Disclosures and Legal Compliance
Fire and Emergency Services Authority of Western Australia
37 Financial instruments (continued)
(c) Financial instrument disclosures (continued)
Interest rate sensitivity analysis
The following table represents a summary of the interest rate sensitivity of the Authority’s financial assets and liabilities at the end of the reporting period on the surplus for the period and equity for a 1% change in interest rates. It is assumed that the change in interest rates is held constant throughout the reporting period.
-100 basis points +100 basis points Carrying amount Surplus) Equity) Surplus) Equity) $000 $000) $000) $000) $000)
2012 Financial Assets Cash and Cash equivalents 54,791 (547.9) (547.9) 547.9) 547.9) Restricted cash and cash equivalents 86,381 (863.8) (863.8) 863.8) 863.8)
Financial Liabilities WATC loans 75,823 758.2) 758.2) (758.2) (758.2) Total Increase (Decrease) (653.5) (653.5) 653.5) 653.5)
-100 basis points +100 basis points Carrying amount Surplus) Equity) Surplus) Equity) $000 $000) $000) $000) $000)
2011 Financial Assets Cash and Cash equivalents 67,588 (675.9) (675.9) 675.9) 675.9) Restricted cash and cash equivalents 100,348 (1,003.5) (1,003.5) 1,003.5) 1,003.5)
Financial Liabilities WATC loans 47,129 471.3) 471.3) (471.3) (471.3) Total Increase (Decrease) (1,208.1) (1,208.1) 1,208.1) 1,208.1)
Fair Values All financial assets and liabilities recognised in the Statement of Financial Position, whether they are carried at cost or fair value, are recognised at
amounts that represent a reasonable approximation of fair value unless otherwise stated in the applicable notes.
Notes to the Financial Statements For the year ended 30 June 2012
Back ForwardBack Forward
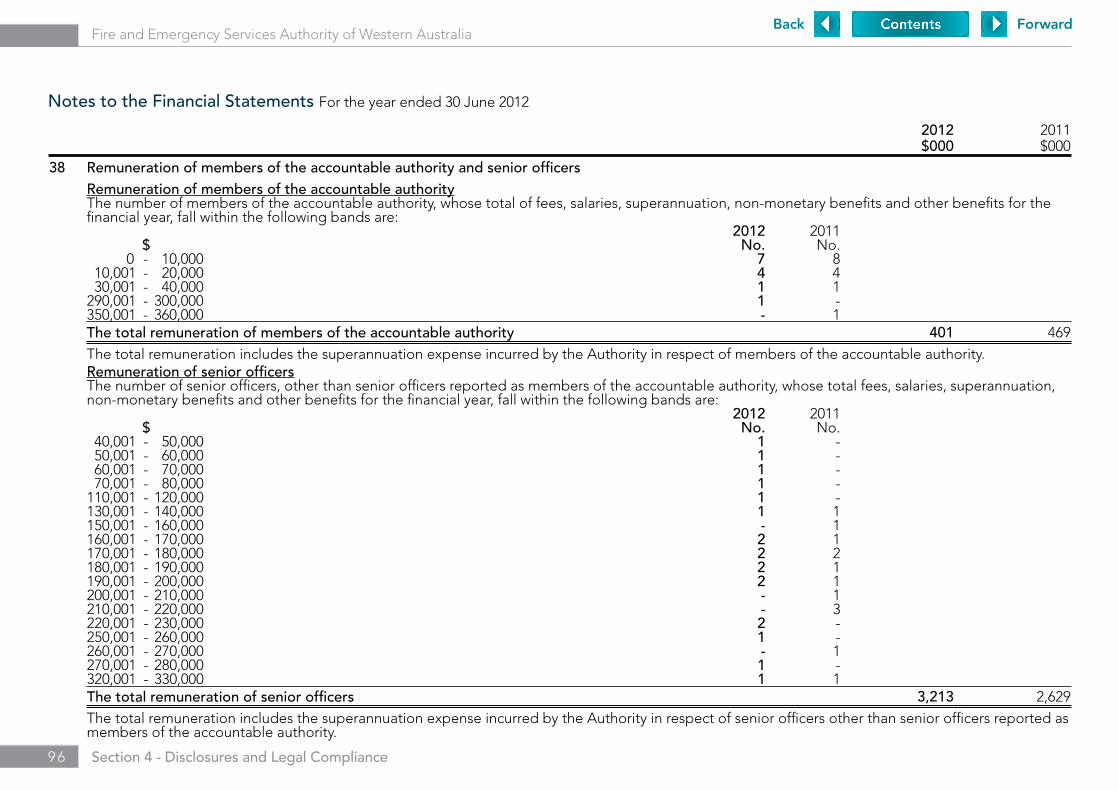
9 6 Section 4 - Disclosures and Legal Compliance
Fire and Emergency Services Authority of Western Australia
2012 2011 $000 $000
38 Remuneration of members of the accountable authority and senior officers Remuneration of members of the accountable authority The number of members of the accountable authority, whose total of fees, salaries, superannuation, non-monetary benefits and other benefits for the
financial year, fall within the following bands are: 2012 2011 $ No. No. 0 - 10,000 7 8 10,001 - 20,000 4 4 30,001 - 40,000 1 1 290,001 - 300,000 1 - 350,001 - 360,000 - 1 The total remuneration of members of the accountable authority 401 469 The total remuneration includes the superannuation expense incurred by the Authority in respect of members of the accountable authority. Remuneration of senior officers The number of senior officers, other than senior officers reported as members of the accountable authority, whose total fees, salaries, superannuation,
non-monetary benefits and other benefits for the financial year, fall within the following bands are: 2012 2011 $ No. No. 40,001 - 50,000 1 - 50,001 - 60,000 1 - 60,001 - 70,000 1 - 70,001 - 80,000 1 - 110,001 - 120,000 1 - 130,001 - 140,000 1 1 150,001 - 160,000 - 1 160,001 - 170,000 2 1 170,001 - 180,000 2 2 180,001 - 190,000 2 1 190,001 - 200,000 2 1 200,001 - 210,000 - 1 210,001 - 220,000 - 3 220,001 - 230,000 2 - 250,001 - 260,000 1 - 260,001 - 270,000 - 1 270,001 - 280,000 1 - 320,001 - 330,000 1 1 The total remuneration of senior officers 3,213 2,629 The total remuneration includes the superannuation expense incurred by the Authority in respect of senior officers other than senior officers reported as
members of the accountable authority.
Notes to the Financial Statements For the year ended 30 June 2012
Back Forward
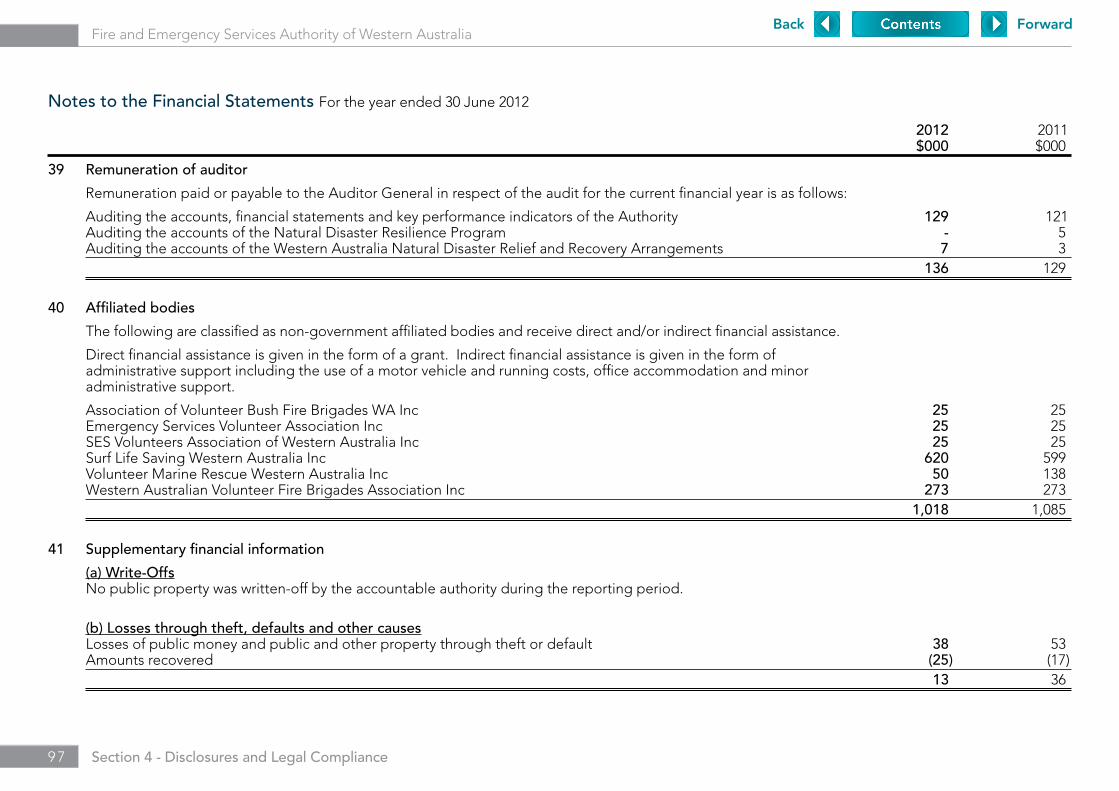
9 7 Section 4 - Disclosures and Legal Compliance
Fire and Emergency Services Authority of Western Australia
2012) 2011) $000) $000)
39 Remuneration of auditor
Remuneration paid or payable to the Auditor General in respect of the audit for the current financial year is as follows:
Auditing the accounts, financial statements and key performance indicators of the Authority 129) 121) Auditing the accounts of the Natural Disaster Resilience Program -) 5) Auditing the accounts of the Western Australia Natural Disaster Relief and Recovery Arrangements 7) 3) 136) 129)
40 Affiliated bodies
The following are classified as non-government affiliated bodies and receive direct and/or indirect financial assistance.
Direct financial assistance is given in the form of a grant. Indirect financial assistance is given in the form of administrative support including the use of a motor vehicle and running costs, office accommodation and minor administrative support.
Association of Volunteer Bush Fire Brigades WA Inc 25) 25) Emergency Services Volunteer Association Inc 25) 25) SES Volunteers Association of Western Australia Inc 25) 25) Surf Life Saving Western Australia Inc 620) 599) Volunteer Marine Rescue Western Australia Inc 50) 138) Western Australian Volunteer Fire Brigades Association Inc 273) 273) 1,018) 1,085)
41 Supplementary financial information
(a) Write-Offs No public property was written-off by the accountable authority during the reporting period.
(b) Losses through theft, defaults and other causes Losses of public money and public and other property through theft or default 38) 53) Amounts recovered (25) (17) 13) 36)
Notes to the Financial Statements For the year ended 30 June 2012
Back Forward

9 8 Section 4 - Disclosures and Legal Compliance
Fire and Emergency Services Authority of Western Australia
Notes to the Financial Statements For the year ended 30 June 2012
2012) 2011) $000) $000)
42 Indian Ocean Territories
Funds are provided by the Commonwealth Department of Regional Australia, Local Government, Arts and Sport to provide services to the Indian Ocean Territories as specified in the Service Delivery Arrangements entered into between the State and Commonwealth.
Opening Balance 425) 374) Total Receipts 628) 819) Total Expenditure (397) (768) Closing Balance 656) 425)
Back Forward
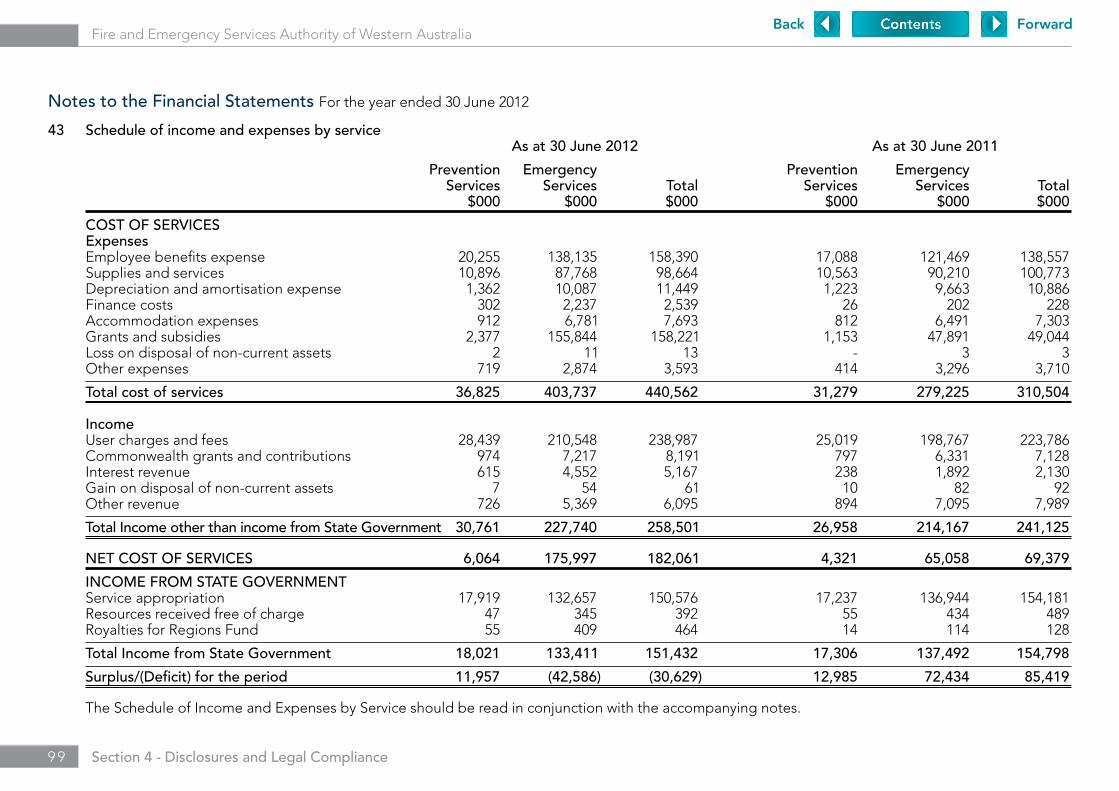
9 9 Section 4 - Disclosures and Legal Compliance
Fire and Emergency Services Authority of Western Australia
43 Schedule of income and expenses by service As at 30 June 2012 As at 30 June 2011
Prevention Emergency) Prevention Emergency Services Services) Total) Services Services Total $000 $000) $000) $000 $000 $000
COST OF SERVICESExpensesEmployee benefits expense 20,255 138,135) 158,390) 17,088 121,469 138,557Supplies and services 10,896 87,768) 98,664) 10,563 90,210 100,773Depreciation and amortisation expense 1,362 10,087) 11,449) 1,223 9,663 10,886Finance costs 302 2,237) 2,539) 26 202 228Accommodation expenses 912 6,781) 7,693) 812 6,491 7,303Grants and subsidies 2,377 155,844) 158,221) 1,153 47,891 49,044Loss on disposal of non-current assets 2 11) 13) - 3 3 Other expenses 719 2,874) 3,593) 414 3,296 3,710
Total cost of services 36,825 403,737) 440,562) 31,279 279,225 310,504
IncomeUser charges and fees 28,439 210,548) 238,987) 25,019 198,767 223,786Commonwealth grants and contributions 974 7,217) 8,191) 797 6,331 7,128Interest revenue 615 4,552) 5,167) 238 1,892 2,130Gain on disposal of non-current assets 7 54) 61) 10 82 92Other revenue 726 5,369) 6,095) 894 7,095 7,989
Total Income other than income from State Government 30,761 227,740) 258,501) 26,958 214,167 241,125
NET COST OF SERVICES 6,064 175,997) 182,061) 4,321 65,058 69,379
INCOME FROM STATE GOVERNMENTService appropriation 17,919 132,657) 150,576) 17,237 136,944 154,181Resources received free of charge 47 345) 392) 55 434 489 Royalties for Regions Fund 55 409) 464) 14 114 128
Total Income from State Government 18,021 133,411) 151,432) 17,306 137,492 154,798
Surplus/(Deficit) for the period 11,957 (42,586) (30,629) 12,985 72,434 85,419
The Schedule of Income and Expenses by Service should be read in conjunction with the accompanying notes.
Notes to the Financial Statements For the year ended 30 June 2012
Back Forward

1 0 0 Section 4 - Disclosures and Legal Compliance
Fire and Emergency Services Authority of Western Australia
Key Performance Indicators
Certification of Key Performance Indicators
We hereby certify that the performance indicators are based on proper records, are relevant and appropriate for assisting users to assess the Fire and Emergency Services Authority of Western Australia’s performance, and fairly represent the performance of the Fire and Emergency Services Authority of Western Australia for the financial year ended 30 June 2012.
A Skinner PSM, FAIM, FIPAA W Gregson APM, MBA, BAChairman of Accountable Authority Member of Accountable Authority
27 August 2012 27 August 2012
Back ForwardBack Forward

1 0 1 Section 4 - Disclosures and Legal Compliance
Fire and Emergency Services Authority of Western Australia
Number of Accidental Residential Fires per 100,000 Households
Structure fires, especially accidental residential fires, can have a devastating effect on the community. During 2011/12, six fatalities and property damage estimated at $21,907,050 resulted from accidental residential fires.
While the number of structure fires has remained stable over the previous four years, in 2011/12 there were 1,442 structure fires which is eight per cent fewer than the previous year. This reduction is a result of improvements in data coding and a real decrease in structure fire incidents.
In 2011/12, 570 structure fires were coded as accidental residential fires. FESA’s target for this indicator is a maximum of 70 fires per 100,000 households. Our 2011/12 result of 63.87 was 8.93 per 100,000 households fewer accidental residential fires in 2011/12 compared to the previous year. The decrease in the number of accidental residential fires, together with a small increase since 2010/11 in the number of households in Western Australia
(2.47 per cent), has contributed to an improvement in this indicator result. The improvement can be attributed to increased community awareness of the risk of fires through our prevention and mitigation programs such as Working Smoke Alarms and Fire Safety in Your Home.
The accuracy of this indicator depends on the ability of fire officers to determine the cause of fires and correctly code the data. In 2011/12, 73 residential fires were not coded as either accidental or deliberate.
National Benchmarking
In the 2012 Report on Government Services (RoGS)1, Western Australia recorded the third lowest rate of accidental residential fires behind the Northern Territory and Queensland. The current national average for this indicator is 100 fires per 100,000 households.
Caution should be taken when comparing figures across jurisdictions as data reporting is not always based on common criteria and different jurisdictional conditions will affect results in any given year.
Figure 1.1: Number of Accidental Residential Fires per 100,000 Households
100.00
90.00
80.00
70.00
60.00
50.00
40.00
30.00
20.00
10.00
0.002007/08 2008/09 2009/10 2010/11 2011/12
1 Source: Report on Government Services 2012, Accidental Residential Fires per 100,000 households
Fires per 100k H/H 75.83 77.73 75.70 72.80 63.873 year rolling avg 73.18 76.25 76.42 75.41 72.53Target 90 70 70 70 70
Effectiveness Indicators
Back ForwardBack Forward

1 0 2 Section 4 - Disclosures and Legal Compliance
Fire and Emergency Services Authority of Western Australia
Proportion of structure fires confined to the room or object of origin
The objective of this indicator is to measure the effectiveness of community fire safety education programs and fire service response. Higher levels of confinement are likely to reduce the dollar value loss and trauma associated with fire.
Results for this indicator can vary as a result of a range of uncontrollable factors that affect firefighters’ ability to contain fires. For example, weather conditions, types of household furnishings and chemicals stored on site will all affect the rate at which fire spreads. In addition, the time taken to report the emergency and traffic conditions at the time of response will affect the time between the fire’s ignition and arrival of emergency service crews. Prompt detection and early notification are likely to increase the percentage of fires confined and are the focus of community awareness campaigns.
Our target for 2011/12 was 70 percent for this indicator and our result was 77.74 percent, which is better than last year’s performance (75.9 percent). The five year rolling average as at the end of 2011/12 was 76.53 percent. This improvement can be attributed to increased community awareness through our ongoing prevention and mitigation programs such as Working Smoke Alarms and Fire Safety in Your Home. These have resulted in a greater proportion of small fires, for example those that originate in cooking areas, being confined before they spread.
The target for this indicator in 2012/13 is 72 percent.
National Benchmarking
Confinement data are also published in the Report on Government Services (RoGS).
Figure 2.1 – Proportion of Structure Fires Confined to Room or Object of Origin
110%
100%
90%
80%
70%
60%
50%
40%
30%
20%
10%
0%2007/08 2008/09 2009/10 2010/11 2011/12
Not Confined % 24.63 23.00 23.38 24.10 22.26
Confined to Room % 46.53 48.19 47.98 44.44 38.99
Confined to Non Combustible Container %
28.83 28.81 28.64 31.47 38.75
Total Confinement % 75.37 77.00 76.62 75.90 77.74
Target % 80.70 68.00 68.00 68.00 70.00
Back ForwardBack Forward
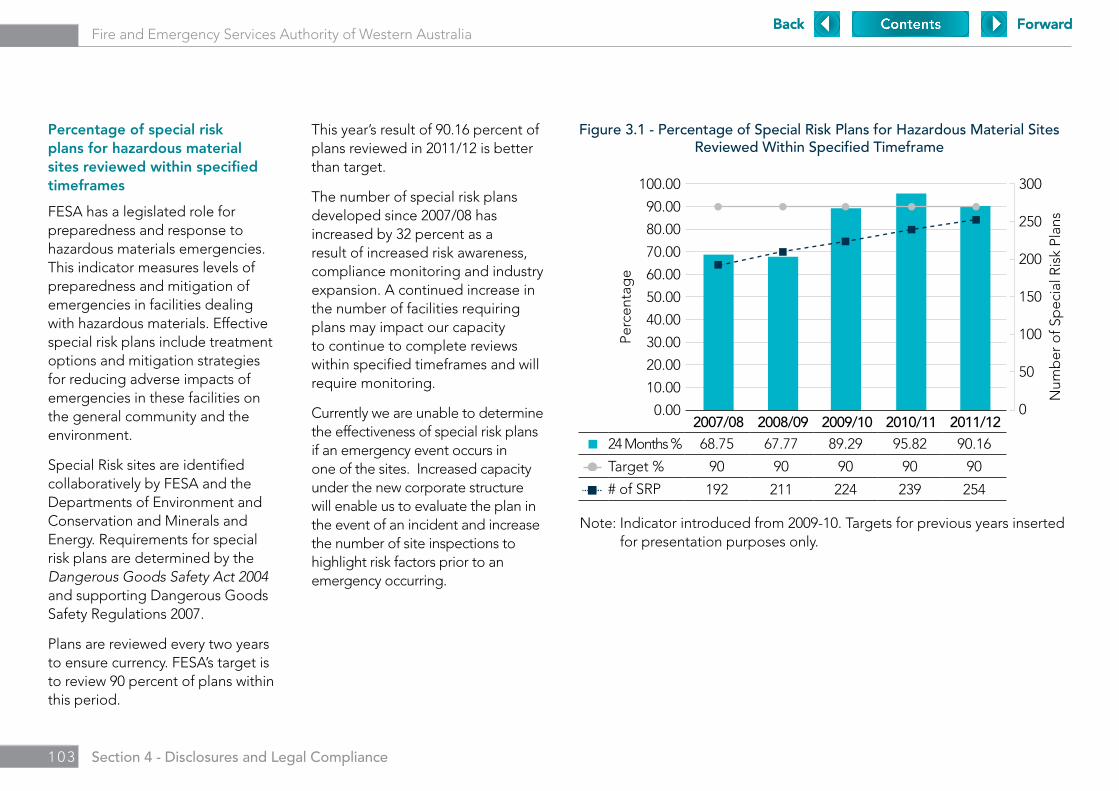
1 0 3 Section 4 - Disclosures and Legal Compliance
Fire and Emergency Services Authority of Western Australia
Percentage of special risk plans for hazardous material sites reviewed within specified timeframes
FESA has a legislated role for preparedness and response to hazardous materials emergencies. This indicator measures levels of preparedness and mitigation of emergencies in facilities dealing with hazardous materials. Effective special risk plans include treatment options and mitigation strategies for reducing adverse impacts of emergencies in these facilities on the general community and the environment.
Special Risk sites are identified collaboratively by FESA and the Departments of Environment and Conservation and Minerals and Energy. Requirements for special risk plans are determined by the Dangerous Goods Safety Act 2004 and supporting Dangerous Goods Safety Regulations 2007.
Plans are reviewed every two years to ensure currency. FESA’s target is to review 90 percent of plans within this period.
This year’s result of 90.16 percent of plans reviewed in 2011/12 is better than target.
The number of special risk plans developed since 2007/08 has increased by 32 percent as a result of increased risk awareness, compliance monitoring and industry expansion. A continued increase in the number of facilities requiring plans may impact our capacity to continue to complete reviews within specified timeframes and will require monitoring.
Currently we are unable to determine the effectiveness of special risk plans if an emergency event occurs in one of the sites. Increased capacity under the new corporate structure will enable us to evaluate the plan in the event of an incident and increase the number of site inspections to highlight risk factors prior to an emergency occurring.
Figure 3.1 - Percentage of Special Risk Plans for Hazardous Material Sites Reviewed Within Specified Timeframe
100.00
90.00
80.00
70.00
60.00
50.00
40.00
30.00
20.00
10.00
0.00
300
250
200
150
100
50
02007/08 2008/09 2009/10 2010/11 2011/12
Num
ber
of S
pec
ial R
isk
Plan
s
Perc
enta
ge
Note: Indicator introduced from 2009-10. Targets for previous years inserted for presentation purposes only.
24 Months % 68.75 67.77 89.29 95.82 90.16
Target % 90 90 90 90 90
# of SRP 192 211 224 239 254
Back ForwardBack Forward
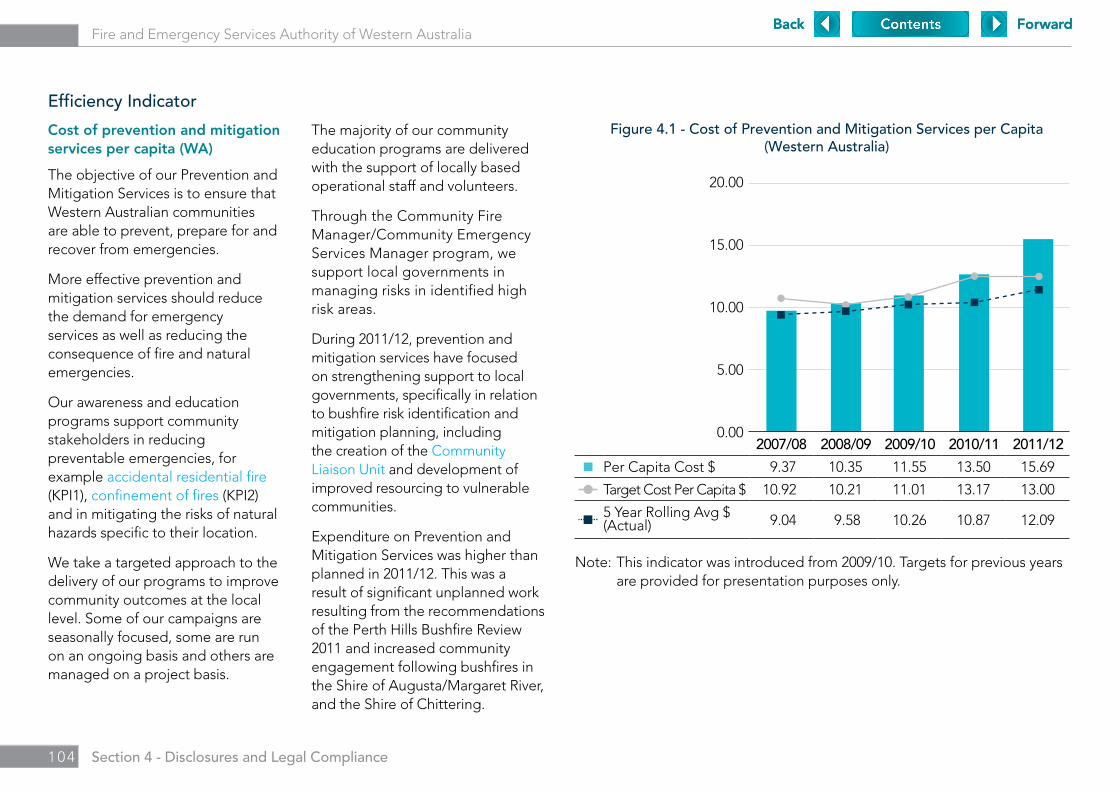
1 0 4 Section 4 - Disclosures and Legal Compliance
Fire and Emergency Services Authority of Western Australia
Efficiency Indicator
Cost of prevention and mitigation services per capita (WA)
The objective of our Prevention and Mitigation Services is to ensure that Western Australian communities are able to prevent, prepare for and recover from emergencies.
More effective prevention and mitigation services should reduce the demand for emergency services as well as reducing the consequence of fire and natural emergencies.
Our awareness and education programs support community stakeholders in reducing preventable emergencies, for example accidental residential fire (KPI1), confinement of fires (KPI2) and in mitigating the risks of natural hazards specific to their location.
We take a targeted approach to the delivery of our programs to improve community outcomes at the local level. Some of our campaigns are seasonally focused, some are run on an ongoing basis and others are managed on a project basis.
The majority of our community education programs are delivered with the support of locally based operational staff and volunteers.
Through the Community Fire Manager/Community Emergency Services Manager program, we support local governments in managing risks in identified high risk areas.
During 2011/12, prevention and mitigation services have focused on strengthening support to local governments, specifically in relation to bushfire risk identification and mitigation planning, including the creation of the Community Liaison Unit and development of improved resourcing to vulnerable communities.
Expenditure on Prevention and Mitigation Services was higher than planned in 2011/12. This was a result of significant unplanned work resulting from the recommendations of the Perth Hills Bushfire Review 2011 and increased community engagement following bushfires in the Shire of Augusta/Margaret River, and the Shire of Chittering.
Note: This indicator was introduced from 2009/10. Targets for previous years are provided for presentation purposes only.
Figure 4.1 - Cost of Prevention and Mitigation Services per Capita (Western Australia)
20.00
15.00
10.00
5.00
0.002007/08 2008/09 2009/10 2010/11 2011/12
Per Capita Cost $ 9.37 10.35 11.55 13.50 15.69
Target Cost Per Capita $ 10.92 10.21 11.01 13.17 13.00
5 Year Rolling Avg $ (Actual) 9.04 9.58 10.26 10.87 12.09
Back ForwardBack Forward

1 0 5 Section 4 - Disclosures and Legal Compliance
Fire and Emergency Services Authority of Western Australia
Effectiveness Indicators
Percentage of 000 calls answered within the target timeframe
The time taken to answer a 000 call is important for ensuring that emergency crews are mobilised quickly. This indicator refers to the time taken for the initial emergency call to be transferred from Telstra’s central emergency call centre to the relevant jurisdictional emergency service organisation. The time is measured from the point of connection (ringing) to the point of disconnection (handover) from Telstra to the emergency service organisation.
A change in the call transfer process since February 2011, which now includes allocation of a call reference number has extended the time to hand over the call from Telstra to FESA. This change was implemented following a process review of response to the Roleystone fire and ensures that FESA can identify whether 000 calls during significant events are related to an existing or new emergency. The target for 2011/12 was revised to reflect the change in procedures.
During 2011/12, operational personnel responded to 29,757 incidents, a five percent increase compared to 2010/11. The major increase was in system initiated false alarms, which comprised more than 35 percent of FESA response compared to 32 percent in 2010/11. Whilst operational responses increased, the FESA Communications Centre received significantly fewer calls, recording a reduction of more than 13 percent compared to the previous year. This is likely to be a consequence of improved community information resulting in fewer duplicate calls.
FESA’s target for 2011/12 was to answer 95 percent of 000 calls within 20 seconds. Our result for 2011/12 is 96.63 percent.
Figure 5.1 - Percentage of 000 Calls Answered Within 20 Seconds
120.00
100.00
80.00
60.00
40.00
20.00
0.002007/08 2008/09 2009/10 2010/11 2011/12
20 sec % 2.21 2.71 2.81 4.93 6.65
15 sec % 6.97 7.12 7.97 21.67 31.91
10 sec % 33.18 31.72 38.81 53.05 56.66
5 sec % 55.97 56.27 48.05 17.24 1.41
Total % 98.33 97.82 97.64 96.90 96.63
Target % 97 97 97 97 95
Back ForwardBack Forward
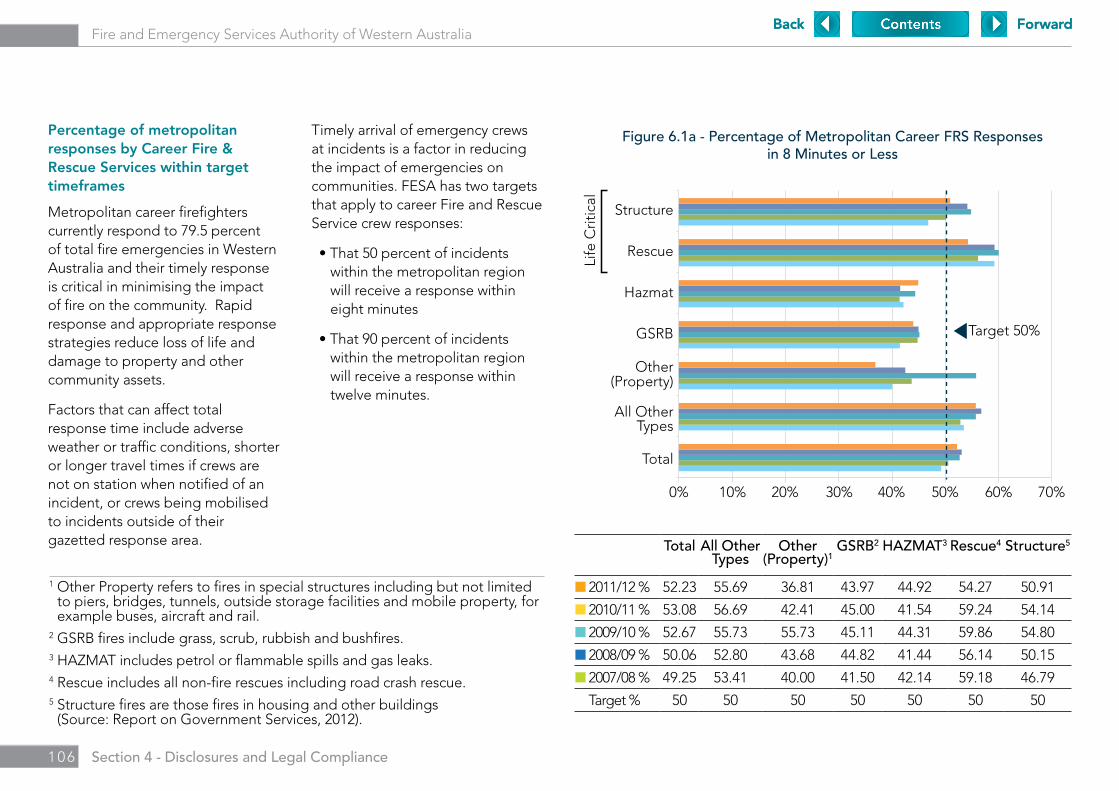
1 0 6 Section 4 - Disclosures and Legal Compliance
Fire and Emergency Services Authority of Western Australia
Percentage of metropolitan responses by Career Fire & Rescue Services within target timeframes
Metropolitan career firefighters currently respond to 79.5 percent of total fire emergencies in Western Australia and their timely response is critical in minimising the impact of fire on the community. Rapid response and appropriate response strategies reduce loss of life and damage to property and other community assets.
Factors that can affect total response time include adverse weather or traffic conditions, shorter or longer travel times if crews are not on station when notified of an incident, or crews being mobilised to incidents outside of their gazetted response area.
Timely arrival of emergency crews at incidents is a factor in reducing the impact of emergencies on communities. FESA has two targets that apply to career Fire and Rescue Service crew responses:
•That50percentofincidentswithin the metropolitan region will receive a response within eight minutes
•That90percentofincidentswithin the metropolitan region will receive a response within twelve minutes.
Figure 6.1a - Percentage of Metropolitan Career FRS Responses in 8 Minutes or Less
Structure
Rescue
Hazmat
GSRB
Other(Property)
All OtherTypes
Total
0% 10% 20% 30% 40% 50% 60% 70%
Target 50%
Life
Crit
ical
1 Other Property refers to fires in special structures including but not limited to piers, bridges, tunnels, outside storage facilities and mobile property, for example buses, aircraft and rail.
2 GSRB fires include grass, scrub, rubbish and bushfires. 3 HAZMAT includes petrol or flammable spills and gas leaks.4 Rescue includes all non-fire rescues including road crash rescue.5 Structure fires are those fires in housing and other buildings
(Source: Report on Government Services, 2012).
Total All Other Types
Other (Property)1
GSRB2 HAZMAT3 Rescue4 Structure5
n 2011/12 % 52.23 55.69 36.81 43.97 44.92 54.27 50.91
n 2010/11 % 53.08 56.69 42.41 45.00 41.54 59.24 54.14
n 2009/10 % 52.67 55.73 55.73 45.11 44.31 59.86 54.80
n 2008/09 % 50.06 52.80 43.68 44.82 41.44 56.14 50.15
n 2007/08 % 49.25 53.41 40.00 41.50 42.14 59.18 46.79
Target % 50 50 50 50 50 50 50
Back ForwardBack Forward
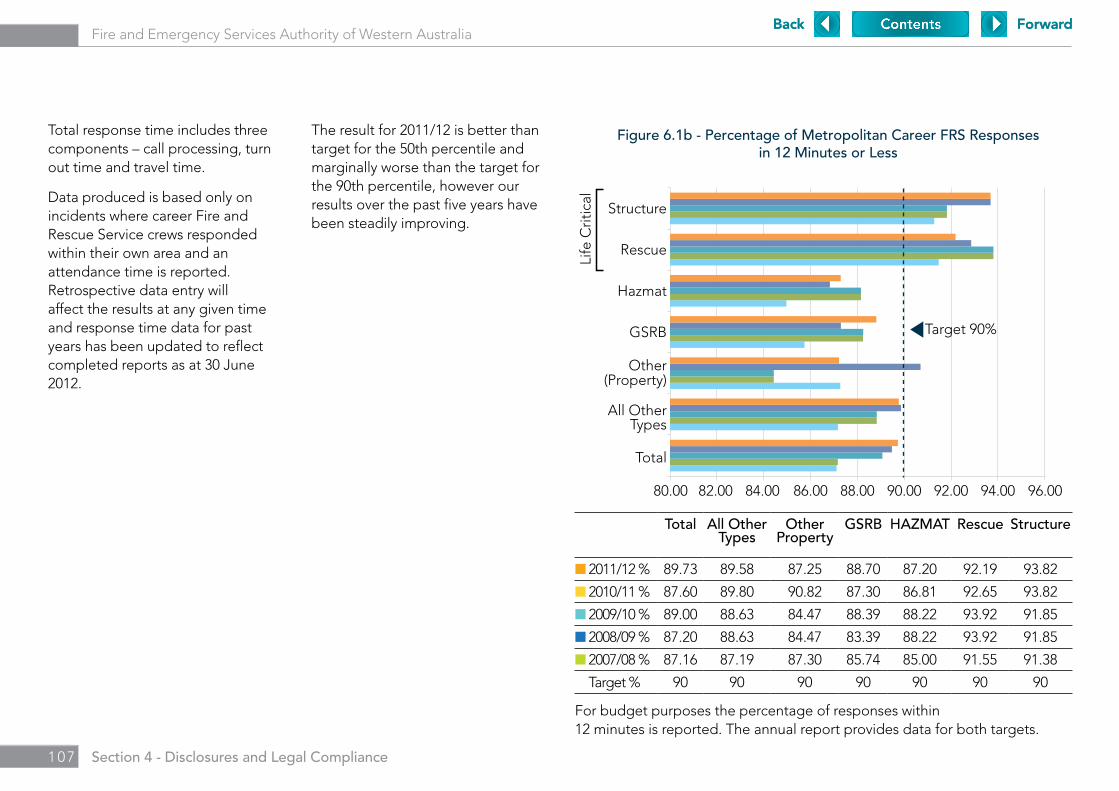
1 0 7 Section 4 - Disclosures and Legal Compliance
Fire and Emergency Services Authority of Western Australia
Total response time includes three components – call processing, turn out time and travel time.
Data produced is based only on incidents where career Fire and Rescue Service crews responded within their own area and an attendance time is reported. Retrospective data entry will affect the results at any given time and response time data for past years has been updated to reflect completed reports as at 30 June 2012.
The result for 2011/12 is better than target for the 50th percentile and marginally worse than the target for the 90th percentile, however our results over the past five years have been steadily improving.
Figure 6.1b - Percentage of Metropolitan Career FRS Responses in 12 Minutes or Less
Structure
Rescue
Hazmat
GSRB
Other(Property)
All OtherTypes
Total
80.00 82.00 84.00 88.0086.00 90.00 92.00 94.00 96.00
Target 90%
Life
Crit
ical
Total All Other Types
Other Property
GSRB HAZMAT Rescue Structure
n 2011/12 % 89.73 89.58 87.25 88.70 87.20 92.19 93.82
n 2010/11 % 87.60 89.80 90.82 87.30 86.81 92.65 93.82
n 2009/10 % 89.00 88.63 84.47 88.39 88.22 93.92 91.85
n 2008/09 % 87.20 88.63 84.47 83.39 88.22 93.92 91.85
n 2007/08 % 87.16 87.19 87.30 85.74 85.00 91.55 91.38
n Target % 90 90 90 90 90 90 90
For budget purposes the percentage of responses within 12 minutes is reported. The annual report provides data for both targets.
Back ForwardBack Forward

1 0 8 Section 4 - Disclosures and Legal Compliance
Fire and Emergency Services Authority of Western Australia
Figures 6.2 to 6.6 provide response time information for specific incident types.
Structure
Structure fires are categorised as ‘life critical’ incidents and receive the highest priority for response. In 2011/12 the total number of structure fires attended by career firefighters in the metropolitan area (825) was 17.7 percent fewer than last year (1,003).
We met both our 50th and 90th percentile targets this year. There were also fewer responses that took more than 12 minutes compared to last year.
Major anomalies in the data have
been reviewed and cleansed where appropriate. Incidents where an ‘in attendance’ time has not been recorded are excluded from the calculation.
Retrospective data entry will affect the results and data for past years has been updated to reflect completed reports as at 30 June 2012.
Response times for structure fire incidents are also reported through the Report on Government Services (RoGS). However, data in the RoGS includes responses by all services, which in Western Australia includes volunteers, and is not comparable with data published in this annual report.
1 All services data includes responses by career Fire and Rescue Service, volunteer Fire and Rescue Service, Volunteer Fire Services, Volunteer Emergency Services and local government volunteer Bush Fire Brigades.
2 Minimum response times of 0.00 minutes occur when fire crews notice and respond to an emergency before it has been reported to the Communications Centre by a 000 call.
Figure 6.2 - Response Times 50th and 90th Percentile -Structure Fire Incidents
14
12
10
8
6
4
2
02007/08 2008/09 2009/10 2010/11 2011/12
Min
utes
(Dec
imal
)
Times in this table are expressed in minutes
Response Time (50th Percentile)
Response Time (90th Percentile)
Number of Incidents Above
12 Minutes
Total Structure
Fire Incidents
Minimum Total
Response Times2
Maximum Total
Response Time
2007/08 8.25 11.61 86 998 0.00 70.23
2008/09 7.98 11.59 78 1,023 0.00 88.50
2009/10 7.72 11.25 79 969 0.10 35.00
2010/11 7.77 11.18 62 1,003 0.02 46.90
2011/12 7.97 11.33 51 825 0.00 26.60
5 Year Average 7.94 11.39 76 963 - -
Response Time (50th Percentile) 8.25 7.98 7.72 7.77 7.97
Response Time (90th Percentile) 11.61 11.59 11.25 11.18 11.33
Target 50th Percentile (Minutes) 8.00 8.00 8.00 8.00 8.00
Target 90th Percentile (Minutes) 12.00 12.00 12.00 12.00 12.00
Back ForwardBack Forward
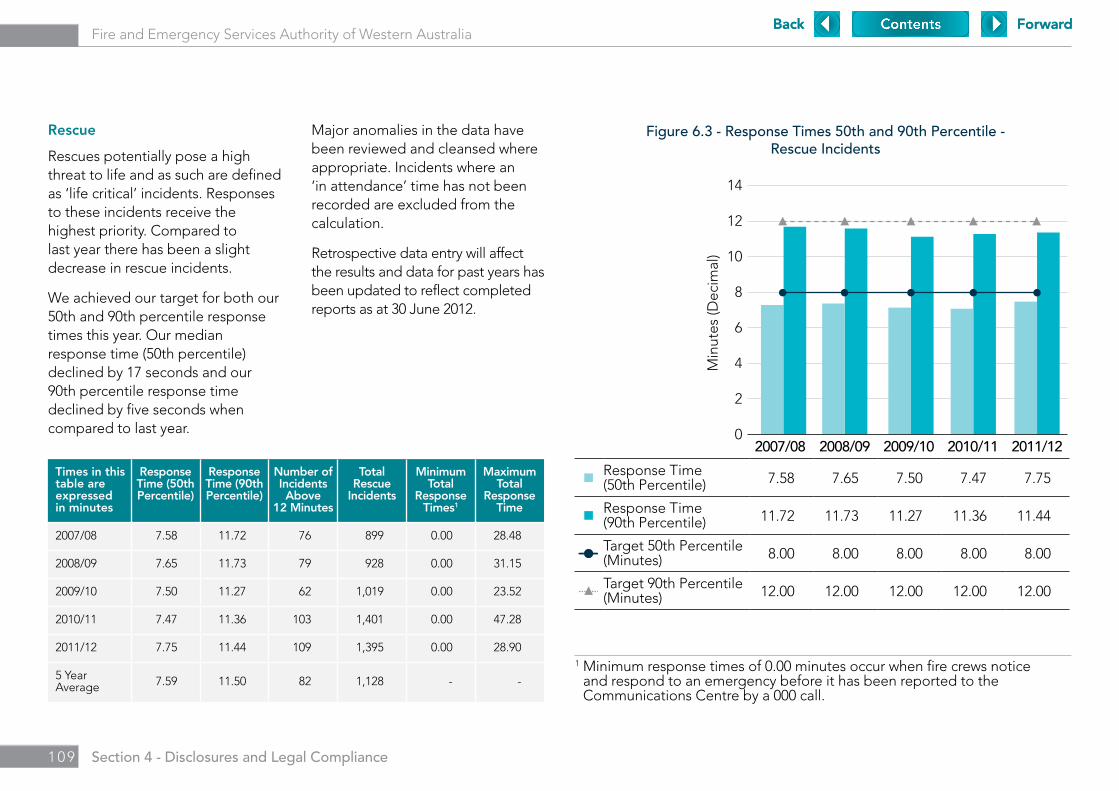
1 0 9 Section 4 - Disclosures and Legal Compliance
Fire and Emergency Services Authority of Western Australia
Rescue
Rescues potentially pose a high threat to life and as such are defined as ‘life critical’ incidents. Responses to these incidents receive the highest priority. Compared to last year there has been a slight decrease in rescue incidents.
We achieved our target for both our 50th and 90th percentile response times this year. Our median response time (50th percentile) declined by 17 seconds and our 90th percentile response time declined by five seconds when compared to last year.
Major anomalies in the data have been reviewed and cleansed where appropriate. Incidents where an ‘in attendance’ time has not been recorded are excluded from the calculation.
Retrospective data entry will affect the results and data for past years has been updated to reflect completed reports as at 30 June 2012.
Figure 6.3 - Response Times 50th and 90th Percentile -Rescue Incidents
14
12
10
8
6
4
2
02007/08 2008/09 2009/10 2010/11 2011/12
Min
utes
(Dec
imal
)
Times in this table are expressed in minutes
Response Time (50th Percentile)
Response Time (90th Percentile)
Number of Incidents Above
12 Minutes
Total Rescue
Incidents
Minimum Total
Response Times1
Maximum Total
Response Time
2007/08 7.58 11.72 76 899 0.00 28.48
2008/09 7.65 11.73 79 928 0.00 31.15
2009/10 7.50 11.27 62 1,019 0.00 23.52
2010/11 7.47 11.36 103 1,401 0.00 47.28
2011/12 7.75 11.44 109 1,395 0.00 28.90
5 Year Average 7.59 11.50 82 1,128 - -
Response Time (50th Percentile) 7.58 7.65 7.50 7.47 7.75
Response Time (90th Percentile) 11.72 11.73 11.27 11.36 11.44
Target 50th Percentile (Minutes) 8.00 8.00 8.00 8.00 8.00
Target 90th Percentile (Minutes) 12.00 12.00 12.00 12.00 12.00
1 Minimum response times of 0.00 minutes occur when fire crews notice and respond to an emergency before it has been reported to the Communications Centre by a 000 call.
Back ForwardBack Forward
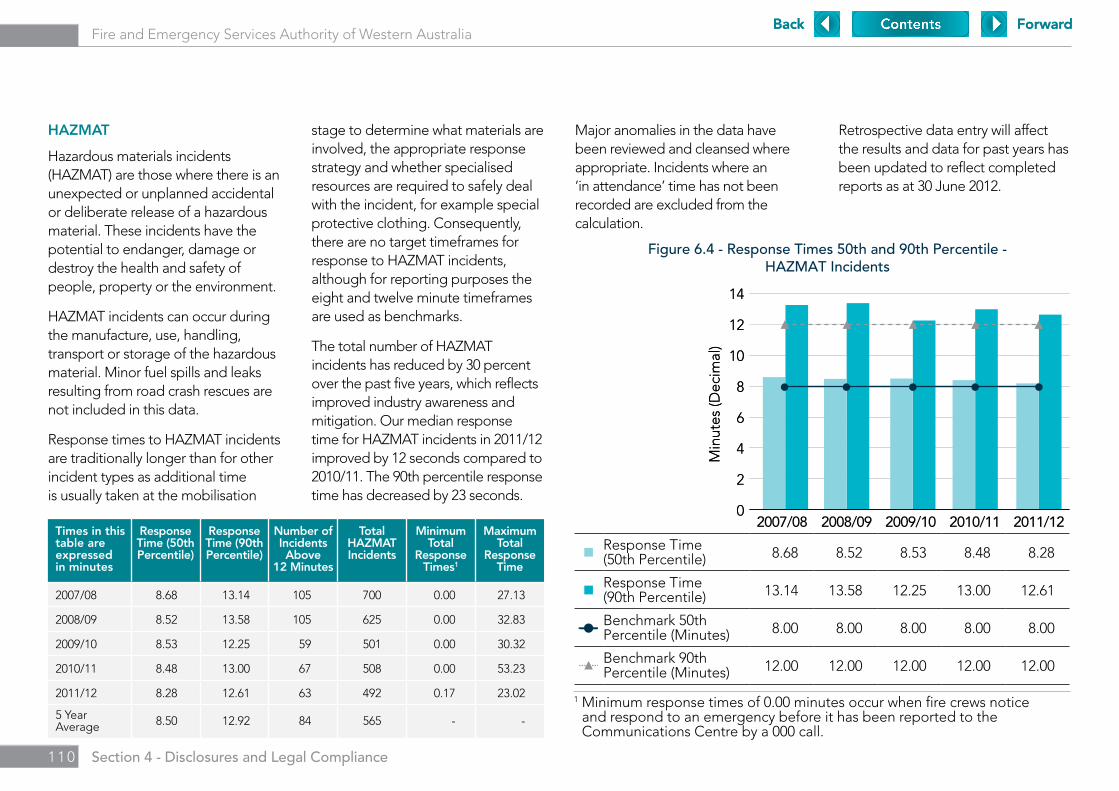
1 1 0 Section 4 - Disclosures and Legal Compliance
Fire and Emergency Services Authority of Western Australia
Figure 6.4 - Response Times 50th and 90th Percentile -HAZMAT Incidents
14
12
10
8
6
4
2
02007/08 2008/09 2009/10 2010/11 2011/12
Min
utes
(Dec
imal
)
14
12
10
8
6
4
2
0
Min
utes
(Dec
imal
)
HAZMAT
Hazardous materials incidents (HAZMAT) are those where there is an unexpected or unplanned accidental or deliberate release of a hazardous material. These incidents have the potential to endanger, damage or destroy the health and safety of people, property or the environment.
HAZMAT incidents can occur during the manufacture, use, handling, transport or storage of the hazardous material. Minor fuel spills and leaks resulting from road crash rescues are not included in this data.
Response times to HAZMAT incidents are traditionally longer than for other incident types as additional time is usually taken at the mobilisation
stage to determine what materials are involved, the appropriate response strategy and whether specialised resources are required to safely deal with the incident, for example special protective clothing. Consequently, there are no target timeframes for response to HAZMAT incidents, although for reporting purposes the eight and twelve minute timeframes are used as benchmarks.
The total number of HAZMAT incidents has reduced by 30 percent over the past five years, which reflects improved industry awareness and mitigation. Our median response time for HAZMAT incidents in 2011/12 improved by 12 seconds compared to 2010/11. The 90th percentile response time has decreased by 23 seconds.
Major anomalies in the data have been reviewed and cleansed where appropriate. Incidents where an ‘in attendance’ time has not been recorded are excluded from the calculation.
Retrospective data entry will affect the results and data for past years has been updated to reflect completed reports as at 30 June 2012.
Times in this table are expressed in minutes
Response Time (50th Percentile)
Response Time (90th Percentile)
Number of Incidents Above
12 Minutes
Total HAZMAT Incidents
Minimum Total
Response Times1
Maximum Total
Response Time
2007/08 8.68 13.14 105 700 0.00 27.13
2008/09 8.52 13.58 105 625 0.00 32.83
2009/10 8.53 12.25 59 501 0.00 30.32
2010/11 8.48 13.00 67 508 0.00 53.23
2011/12 8.28 12.61 63 492 0.17 23.02
5 Year Average 8.50 12.92 84 565 - -
Response Time (50th Percentile) 8.68 8.52 8.53 8.48 8.28
Response Time (90th Percentile) 13.14 13.58 12.25 13.00 12.61
Benchmark 50th Percentile (Minutes) 8.00 8.00 8.00 8.00 8.00
Benchmark 90th Percentile (Minutes) 12.00 12.00 12.00 12.00 12.00
1 Minimum response times of 0.00 minutes occur when fire crews notice and respond to an emergency before it has been reported to the Communications Centre by a 000 call.
Back ForwardBack Forward

1 1 1 Section 4 - Disclosures and Legal Compliance
Fire and Emergency Services Authority of Western Australia
Other (Property) Fires
Other property incidents include fires in special structures such as piers, bridges or tunnels; outside storage facilities and mobile property, for example buses, aircraft and rail transport. The total number of other fires increased from 316 last year to 345 this year.
The median response time for other property incidents was 8.7 minutes, which is consistent with results from previous years.
Major anomalies in the data have been reviewed and cleansed where appropriate. Incidents where an ‘in attendance’ time has not been recorded are excluded from the calculation.
Retrospective data entry will affect the results and data for past years has been updated to reflect completed reports as at 30 June 2012.
These times expressed in this able are in minutes
Response Time (50th Percentile)
Response Time (90th Percentile)
Number of Incidents Above 12 Minutes
Total Other Property
Fires
Minimum Total
Response Times1
Maximum Total
Response Time
2007/08 8.69 12.58 47 370 0.00 27.75
2008/09 8.44 12.57 43 348 2.00 63.35
2009/10 8.76 13.08 59 380 0.00 57.07
2010/11 8.66 11.89 29 316 0.13 18.48
2011/12 8.70 12.53 44 345 0.70 23.72
5 Year Average 8.65 12.53 44 352 - -
Figure 6.5 - Response Times 50th and 90th Percentile - Other (Property) Fire Incidents
14
12
10
8
6
4
2
02007/08 2008/09 2009/10 2010/11 2011/12
Min
utes
(Dec
imal
)
Response Time (50th Percentile) 8.69 8.44 8.76 8.66 8.70
Response Time (90th Percentile) 12.58 12.57 13.08 11.89 12.53
Benchmark 50th Percentile (Minutes) 8.00 8.00 8.00 8.00 8.00
Benchmark 90th Percentile (Minutes) 12.00 12.00 12.00 12.00 12.00
1 Minimum response times of 0.00 minutes occur when fire crews notice and respond to an emergency before it has been reported to the Communications Centre by a 000 call.
Back ForwardBack Forward

1 1 2 Section 4 - Disclosures and Legal Compliance
Fire and Emergency Services Authority of Western Australia
Figure 6.6 - Response Times 50th and 90th Percentile - Grass, Scrub, Rubbish and Bushfire Incidents
14
12
10
8
6
4
2
02007/08 2008/09 2009/10 2010/11 2011/12
Min
utes
(Dec
imal
)
Response Time (50th Percentile) 8.60 8.42 8.33 8.35 8.38
Response Time (90th Percentile) 12.98 12.91 12.41 12.55 12.30
Benchmark 50th Percentile (Minutes) 8.00 8.00 8.00 8.00 8.00
Benchmark 90th Percentile (Minutes) 12.00 12.00 12.00 12.00 12.00
Grass, Scrub, Rubbish and Bushfires
This incident category includes landscape or bush fires and outside rubbish fires, including those in landfill or construction sites.
Extra time is often required with landscape or bushfires for crews to determine the severity or potential impact of the incident and to reach the exact location of the fire, especially if they are required to move off road. This can result in delays in notification that the crew has arrived on scene, which will overstate travel times.
In 2011/12, 89% of these fire incidents received a response within 12 minutes.
Total incidents recorded for this category increased slightly compared to last year. Our median response time in 2011/12 was 8.38 minutes which is comparable to last year.
Major anomalies in the data have been reviewed and cleansed where appropriate. Incidents where an ‘in attendance’ time has not been recorded are excluded from the calculation.
Times in this table are expressed in minutes
Response Time (50th Percentile)
Response Time (90th Percentile)
Number of Incidents Above
12 Minutes
Total Grass, Scrub,
Rubbish & Bushfire Incidents
Minimum Total
Response Times1
Maximum Total
Response Time
2007/08 8.60 12.98 698 4,894 0.00 53.67
2008/09 8.42 12.91 630 4,706 0.00 123.83
2009/10 8.33 12.41 435 3,746 0.00 32.72
2010/11 8.35 12.55 509 4,009 0.00 76.32
2011/12 8.38 12.30 358 3,168 0.00 37.08
5 Year Average 8.42 12.73 525 4,105 - -
Retrospective data entry will affect the results and data for past years has
been updated to reflect completed reports as at 30 June 2012.
1 Minimum response times of 0.00 minutes occur when fire crews notice and respond to an emergency before it has been reported to the Communications Centre by a 000 call.
Back ForwardBack Forward

1 1 3 Section 4 - Disclosures and Legal Compliance
Fire and Emergency Services Authority of Western Australia
Percentage of volunteer Fire & Rescue Service turnouts within target timeframes – HMA roles only
In regional areas, total response times can be affected by extended distance to incident sites and availability of volunteers.
For volunteer services the turnout time is the most useful indicator for measuring service delivery. FESA has limited, or no control over responses for non-HMA roles. Therefore, this indicator provides turnout times for volunteer Fire and Rescue Service only and excludes incidents attended by other volunteer services – Bush Fire Service, State Emergency Service and Volunteer Marine Rescue Services, Volunteer Emergency Services and Volunteer Fire Service.
The result for 2011/12 is 94.95 percent of turnouts within 14 minutes, which is better than the target of 90 percent.
The indicator trend shows that VFRS turnout times have remained fairly static.
The perceived improvement in performance for 2010/11 was related to improved reporting processes. In 2009/10 as part of the ongoing data quality improvements, it was identified that the default code “travelling under emergency road conditions” was not being updated to reflect the incident situation. The inclusion of non time critical turnouts impacted on results. The default was removed in late December 2009 and the officers are now required to record the appropriate travelling conditions. This has resulted in more accurate and relevant data.
Figure 7.1 - Percentage of Volunteer Fire and Rescue Service Turnouts Within Target Timeframes – HMA Roles Only
100%
90%
80%
70%
60%
50%
40%
30%
20%
10%
0%
Target 90%
2007/08 2008/09 2009/10 2010/11 2011/12
% 87.61 86.41 87.75 95.23 94.95
Back ForwardBack Forward
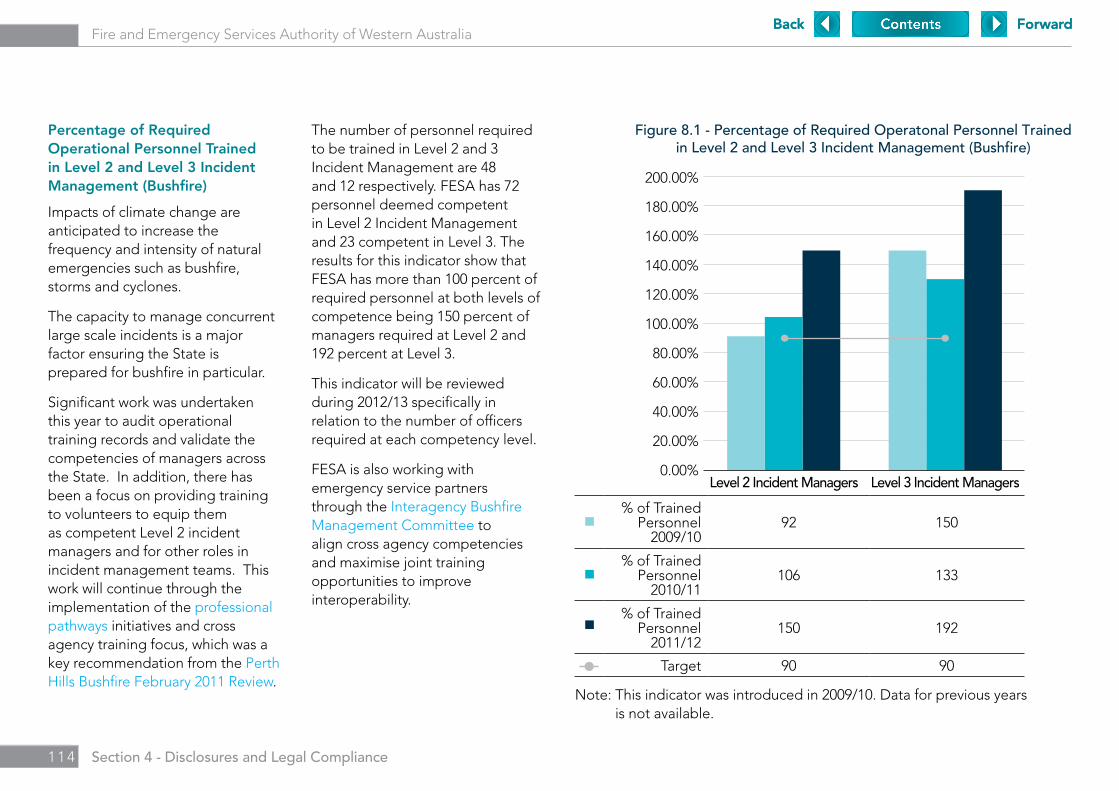
1 1 4 Section 4 - Disclosures and Legal Compliance
Fire and Emergency Services Authority of Western Australia
Percentage of Required Operational Personnel Trained in Level 2 and Level 3 Incident Management (Bushfire)
Impacts of climate change are anticipated to increase the frequency and intensity of natural emergencies such as bushfire, storms and cyclones.
The capacity to manage concurrent large scale incidents is a major factor ensuring the State is prepared for bushfire in particular.
Significant work was undertaken this year to audit operational training records and validate the competencies of managers across the State. In addition, there has been a focus on providing training to volunteers to equip them as competent Level 2 incident managers and for other roles in incident management teams. This work will continue through the implementation of the professional pathways initiatives and cross agency training focus, which was a key recommendation from the Perth Hills Bushfire February 2011 Review.
The number of personnel required to be trained in Level 2 and 3 Incident Management are 48 and 12 respectively. FESA has 72 personnel deemed competent in Level 2 Incident Management and 23 competent in Level 3. The results for this indicator show that FESA has more than 100 percent of required personnel at both levels of competence being 150 percent of managers required at Level 2 and 192 percent at Level 3.
This indicator will be reviewed during 2012/13 specifically in relation to the number of officers required at each competency level.
FESA is also working with emergency service partners through the Interagency Bushfire Management Committee to align cross agency competencies and maximise joint training opportunities to improve interoperability.
Figure 8.1 - Percentage of Required Operatonal Personnel Trained in Level 2 and Level 3 Incident Management (Bushfire)
200.00%
180.00%
160.00%
140.00%
120.00%
100.00%
80.00%
60.00%
40.00%
20.00%
0.00%Level 3 Incident ManagersLevel 2 Incident Managers
Note: This indicator was introduced in 2009/10. Data for previous years is not available.
% of Trained Personnel
2009/1092 150
% of Trained Personnel
2010/11106 133
% of Trained Personnel
2011/12150 192
Target 90 90
Back ForwardBack Forward
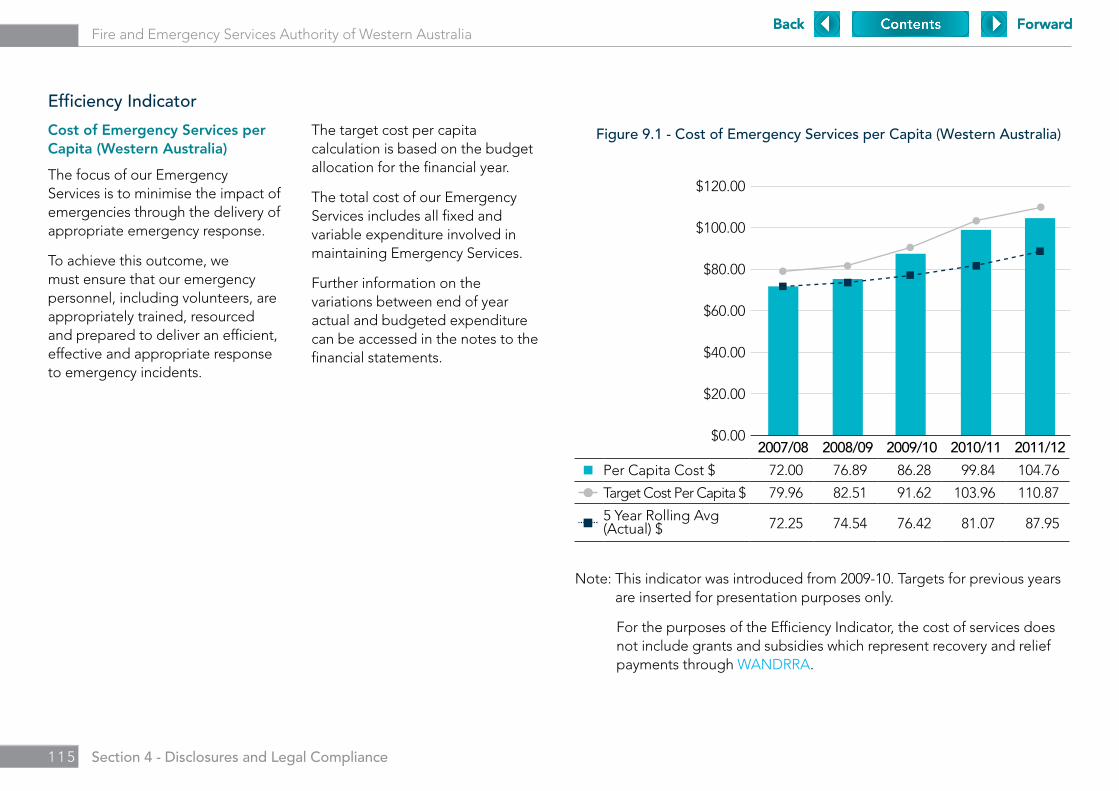
1 1 5 Section 4 - Disclosures and Legal Compliance
Fire and Emergency Services Authority of Western Australia
Efficiency Indicator
Cost of Emergency Services per Capita (Western Australia)
The focus of our Emergency Services is to minimise the impact of emergencies through the delivery of appropriate emergency response.
To achieve this outcome, we must ensure that our emergency personnel, including volunteers, are appropriately trained, resourced and prepared to deliver an efficient, effective and appropriate response to emergency incidents.
The target cost per capita calculation is based on the budget allocation for the financial year.
The total cost of our Emergency Services includes all fixed and variable expenditure involved in maintaining Emergency Services.
Further information on the variations between end of year actual and budgeted expenditure can be accessed in the notes to the financial statements.
Figure 9.1 - Cost of Emergency Services per Capita (Western Australia)
$120.00
$100.00
$80.00
$60.00
$40.00
$20.00
$0.002007/08 2008/09 2009/10 2010/11 2011/12
Note: This indicator was introduced from 2009-10. Targets for previous years are inserted for presentation purposes only.
For the purposes of the Efficiency Indicator, the cost of services does not include grants and subsidies which represent recovery and relief payments through WANDRRA.
Per Capita Cost $ 72.00 76.89 86.28 99.84 104.76
Target Cost Per Capita $ 79.96 82.51 91.62 103.96 110.87
5 Year Rolling Avg (Actual) $ 72.25 74.54 76.42 81.07 87.95
Back ForwardBack Forward
1 1 6 Section 4 - Disclosures and Legal Compliance
Fire and Emergency Services Authority of Western Australia
Independent Auditor’s Report
To the Parliament of Western Australia
FIRE AND EMERGENCY SERVICES AUTHORITY OF WESTERN AUSTRALIA
Report on the Financial Statements
I have audited the accounts and financial statements of the Fire and Emergency Services Authority of Western Australia.
The financial statements comprise the Statement of Financial Position as at 30 June 2012, the Statement of Comprehensive Income, Statement of Changes in Equity and Statement of Cash Flows for the year then ended, and Notes comprising a summary of significant accounting policies and other explanatory information.
Board’s Responsibility for the Financial Statements
The Board is responsible for keeping proper accounts, and the preparation and fair presentation of the financial statements in accordance with Australian Accounting Standards and the Treasurer’s Instructions, and for such internal control as the Board determines is necessary to enable the preparation of financial statements that are free from material misstatement, whether due to fraud or error.
Auditor’s Responsibility
As required by the Auditor General Act 2006, my responsibility is to express an opinion on the financial statements based on my audit. The audit was conducted in accordance with Australian Auditing Standards. Those Standards require compliance with relevant ethical requirements relating to audit engagements and that the audit be planned and performed to obtain reasonable assurance about whether the financial statements are free from material misstatement.
An audit involves performing procedures to obtain audit evidence about the amounts and disclosures in the financial statements. The procedures selected depend on the auditor’s judgement, including the assessment of the risks of material misstatement of the financial statements, whether due to fraud or error. In making those risk assessments, the auditor considers internal control relevant to the Authority’s preparation and fair presentation of the financial statements in order to design audit procedures that are appropriate in the circumstances. An audit also includes evaluating the appropriateness of the accounting policies used and the reasonableness of accounting estimates made by the Board, as well as evaluating the overall presentation of the financial statements.
I believe that the audit evidence obtained is sufficient and appropriate to provide a basis for my audit opinion.
Opinion
In my opinion, the financial statements are based on proper accounts and present fairly, in all material respects, the financial position of the Fire and Emergency Services Authority of Western Australia at 30 June 2012 and its financial performance and cash flows for the year then ended. They are in accordance with Australian Accounting Standards and the Treasurer’s Instructions.
Auditor General7th Floor Albert Facey House 469 Wellington Street Perth MAIL TO: Perth BC PO Box 8489 Perth WA 6849 TEL: 08 6557 7500 FAX: 08 6557 7600
Back ForwardBack Forward
1 1 7 Section 4 - Disclosures and Legal Compliance
Fire and Emergency Services Authority of Western Australia
Report on Controls
I have audited the controls exercised by the Fire and Emergency Services Authority of Western Australia during the year ended 30 June 2012.
Controls exercised by the Fire and Emergency Services Authority of Western Australia are those policies and procedures established by the Board to ensure that the receipt, expenditure and investment of money, the acquisition and disposal of property, and the incurring of liabilities have been in accordance with legislative provisions.
Board’s Responsibility for Controls
The Board is responsible for maintaining an adequate system of internal control to ensure that the receipt, expenditure and investment of money, the acquisition and disposal of public and other property, and the incurring of liabilities are in accordance with the Financial Management Act 2006 and the Treasurer’s Instructions, and other relevant written law.
Auditor’s Responsibility
As required by the Auditor General Act 2006, my responsibility is to express an opinion on the controls exercised by the Fire and Emergency Services Authority of Western Australia based on my audit conducted in accordance with Australian Auditing and Assurance Standards.
An audit involves performing procedures to obtain audit evidence about the adequacy of controls to ensure that the Authority complies with the legislative provisions. The procedures selected depend on the auditor’s judgement and include an evaluation of the design and implementation of relevant controls.
I believe that the audit evidence obtained is sufficient and appropriate to provide a basis for my audit opinion.
Opinion
In my opinion, the controls exercised by the Fire and Emergency Services Authority of Western Australia are sufficiently adequate to provide reasonable assurance that the receipt, expenditure and investment of money, the acquisition and disposal of property, and the incurring of liabilities have been in accordance with legislative provisions during the year ended 30 June 2012.
Report on the Key Performance Indicators
I have audited the key performance indicators of the Fire and Emergency Services Authority of Western Australia for the year ended 30 June 2012.
The key performance indicators are the key effectiveness indicators and the key efficiency indicators that provide information on outcome achievement and service provision.
Board’s Responsibility for the Key Performance Indicators
The Board is responsible for the preparation and fair presentation of the key performance indicators in accordance with the Financial Management Act 2006 and the Treasurer’s Instructions and for such controls as the Board determines necessary to ensure that the key performance indicators fairly represent indicated performance.
Back Forward
1 1 8 Section 4 - Disclosures and Legal Compliance
Fire and Emergency Services Authority of Western Australia
Auditor’s Responsibility
As required by the Auditor General Act 2006, my responsibility is to express an opinion on the key performance indicators based on my audit conducted in accordance with Australian Auditing and Assurance Standards.
An audit involves performing procedures to obtain audit evidence about the key performance indicators. The procedures selected depend on the auditor’s judgement, including the assessment of the risks of material misstatement of the key performance indicators. In making these risk assessments the auditor considers internal control relevant to the Board’s preparation and fair presentation of the key performance indicators in order to design audit procedures that are appropriate in the circumstances. An audit also includes evaluating the relevance and appropriateness of the key performance indicators for measuring the extent of outcome achievement and service provision.
I believe that the audit evidence obtained is sufficient and appropriate to provide a basis for my audit opinion.
Opinion
In my opinion, the key performance indicators of the Fire and Emergency Services Authority of Western Australia are relevant and appropriate to assist users to assess the Authority’s performance and fairly represent indicated performance for the year ended 30 June 2012.
Independence
In conducting this audit, I have complied with the independence requirements of the Auditor General Act 2006 and Australian Auditing and Assurance Standards, and other relevant ethical requirements.
Matters Relating to the Electronic Publication of the Audited Financial Statements and Key Performance Indicators
This auditor’s report relates to the financial statements and key performance indicators of the Fire and Emergency Services Authority of Western Australia for the year ended 30 June 2012 included on the Authority’s website. The Authority’s management is responsible for the integrity of the Authority’s website. This audit does not provide assurance on the integrity of the Authority’s website. The auditor’s report refers only to the financial statements and key performance indicators described above. It does not provide an opinion on any other information which may have been hyperlinked to/from these financial statements or key performance indicators. If users of the financial statements and key performance indicators are concerned with the inherent risks arising from publication on a website, they are advised to refer to the hard copy of the audited financial statements and key performance indicators to confirm the information contained in this website version of the financial statements and key performance indicators.
COLIN MURPHY AUDITOR GENERAL FOR WESTERN AUSTRALIAPerth, Western Australia19 September 2012
Back ForwardBack Forward
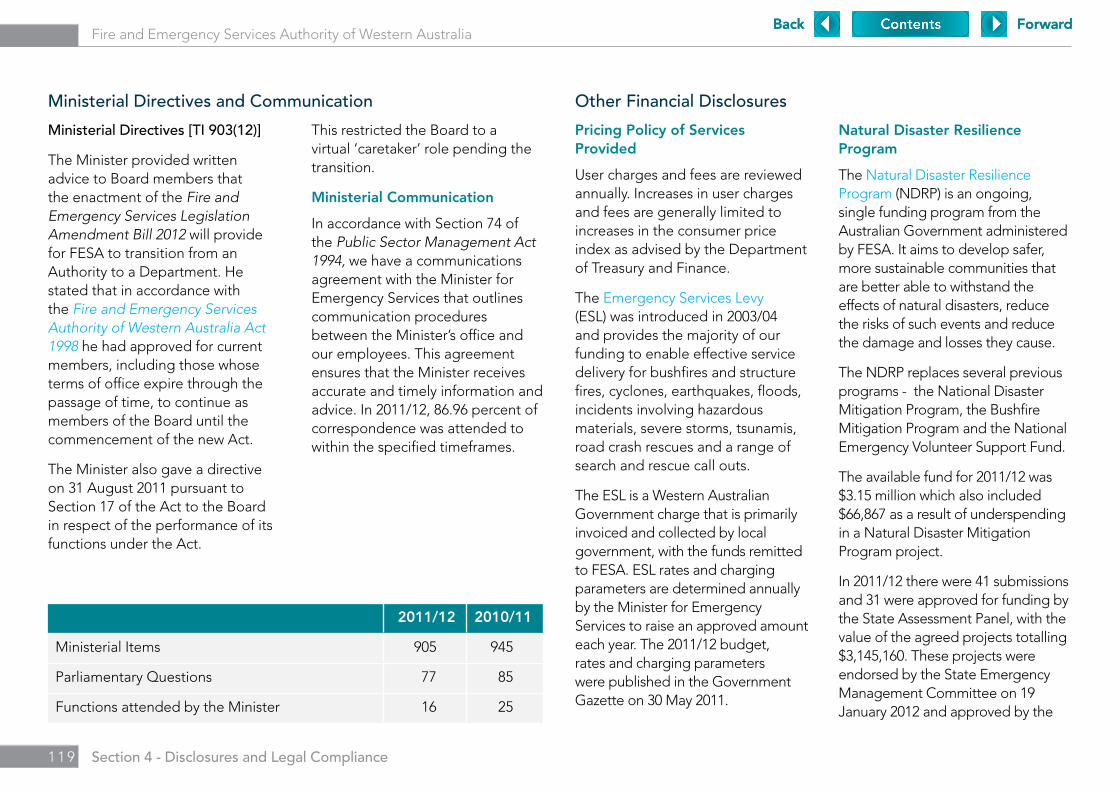
1 1 9 Section 4 - Disclosures and Legal Compliance
Fire and Emergency Services Authority of Western Australia
Other Financial Disclosures
Pricing Policy of Services Provided
User charges and fees are reviewed annually. Increases in user charges and fees are generally limited to increases in the consumer price index as advised by the Department of Treasury and Finance.
The Emergency Services Levy (ESL) was introduced in 2003/04 and provides the majority of our funding to enable effective service delivery for bushfires and structure fires, cyclones, earthquakes, floods, incidents involving hazardous materials, severe storms, tsunamis, road crash rescues and a range of search and rescue call outs.
The ESL is a Western Australian Government charge that is primarily invoiced and collected by local government, with the funds remitted to FESA. ESL rates and charging parameters are determined annually by the Minister for Emergency Services to raise an approved amount each year. The 2011/12 budget, rates and charging parameters were published in the Government Gazette on 30 May 2011.
Natural Disaster Resilience Program
The Natural Disaster Resilience Program (NDRP) is an ongoing, single funding program from the Australian Government administered by FESA. It aims to develop safer, more sustainable communities that are better able to withstand the effects of natural disasters, reduce the risks of such events and reduce the damage and losses they cause.
The NDRP replaces several previous programs - the National Disaster Mitigation Program, the Bushfire Mitigation Program and the National Emergency Volunteer Support Fund.
The available fund for 2011/12 was $3.15 million which also included $66,867 as a result of underspending in a Natural Disaster Mitigation Program project.
In 2011/12 there were 41 submissions and 31 were approved for funding by the State Assessment Panel, with the value of the agreed projects totalling $3,145,160. These projects were endorsed by the State Emergency Management Committee on 19 January 2012 and approved by the
2011/12 2010/11
Ministerial Items 905 945
Parliamentary Questions 77 85
Functions attended by the Minister 16 25
Ministerial Directives and Communication
Ministerial Directives [TI 903(12)]
The Minister provided written advice to Board members that the enactment of the Fire and Emergency Services Legislation Amendment Bill 2012 will provide for FESA to transition from an Authority to a Department. He stated that in accordance with the Fire and Emergency Services Authority of Western Australia Act 1998 he had approved for current members, including those whose terms of office expire through the passage of time, to continue as members of the Board until the commencement of the new Act.
The Minister also gave a directive on 31 August 2011 pursuant to Section 17 of the Act to the Board in respect of the performance of its functions under the Act.
This restricted the Board to a virtual ‘caretaker’ role pending the transition.
Ministerial Communication
In accordance with Section 74 of the Public Sector Management Act 1994, we have a communications agreement with the Minister for Emergency Services that outlines communication procedures between the Minister’s office and our employees. This agreement ensures that the Minister receives accurate and timely information and advice. In 2011/12, 86.96 percent of correspondence was attended to within the specified timeframes.
Back ForwardBack Forward
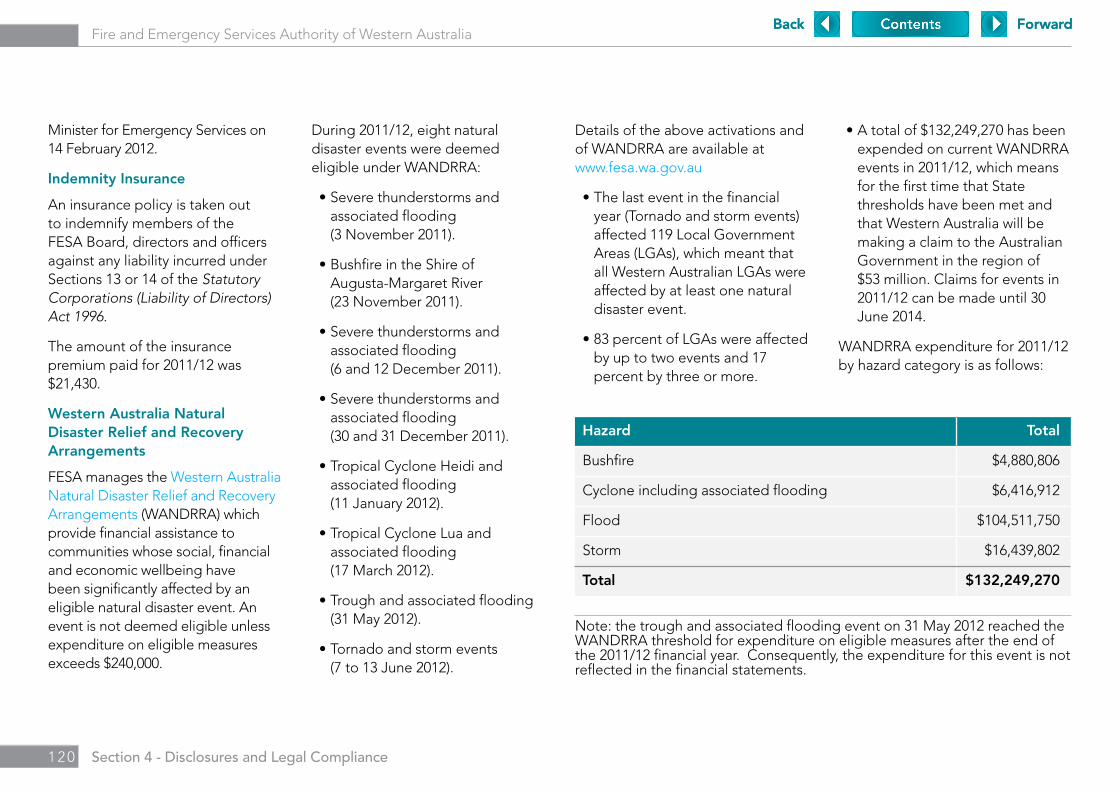
1 2 0 Section 4 - Disclosures and Legal Compliance
Fire and Emergency Services Authority of Western Australia
Minister for Emergency Services on 14 February 2012.
Indemnity Insurance
An insurance policy is taken out to indemnify members of the FESA Board, directors and officers against any liability incurred under Sections 13 or 14 of the Statutory Corporations (Liability of Directors) Act 1996.
The amount of the insurance premium paid for 2011/12 was $21,430.
Western Australia Natural Disaster Relief and Recovery Arrangements
FESA manages the Western Australia Natural Disaster Relief and Recovery Arrangements (WANDRRA) which provide financial assistance to communities whose social, financial and economic wellbeing have been significantly affected by an eligible natural disaster event. An event is not deemed eligible unless expenditure on eligible measures exceeds $240,000.
During 2011/12, eight natural disaster events were deemed eligible under WANDRRA:
•Severethunderstormsandassociated flooding (3 November 2011).
•BushfireintheShireof Augusta-Margaret River (23 November 2011).
•Severethunderstormsandassociated flooding (6 and 12 December 2011).
•Severethunderstormsandassociated flooding (30 and 31 December 2011).
•TropicalCycloneHeidiandassociated flooding (11 January 2012).
•TropicalCycloneLuaandassociated flooding (17 March 2012).
•Troughandassociatedflooding(31 May 2012).
•Tornadoandstormevents (7 to 13 June 2012).
Details of the above activations and of WANDRRA are available at www.fesa.wa.gov.au
•Thelasteventinthefinancialyear (Tornado and storm events) affected 119 Local Government Areas (LGAs), which meant that all Western Australian LGAs were affected by at least one natural disaster event.
•83percentofLGAswereaffectedby up to two events and 17 percent by three or more.
•Atotalof$132,249,270hasbeenexpended on current WANDRRA events in 2011/12, which means for the first time that State thresholds have been met and that Western Australia will be making a claim to the Australian Government in the region of $53 million. Claims for events in 2011/12 can be made until 30 June 2014.
WANDRRA expenditure for 2011/12 by hazard category is as follows:
Hazard Total
Bushfire $4,880,806
Cyclone including associated flooding $6,416,912
Flood $104,511,750
Storm $16,439,802
Total $132,249,270
Note: the trough and associated flooding event on 31 May 2012 reached the WANDRRA threshold for expenditure on eligible measures after the end of the 2011/12 financial year. Consequently, the expenditure for this event is not reflected in the financial statements.
Back ForwardBack Forward
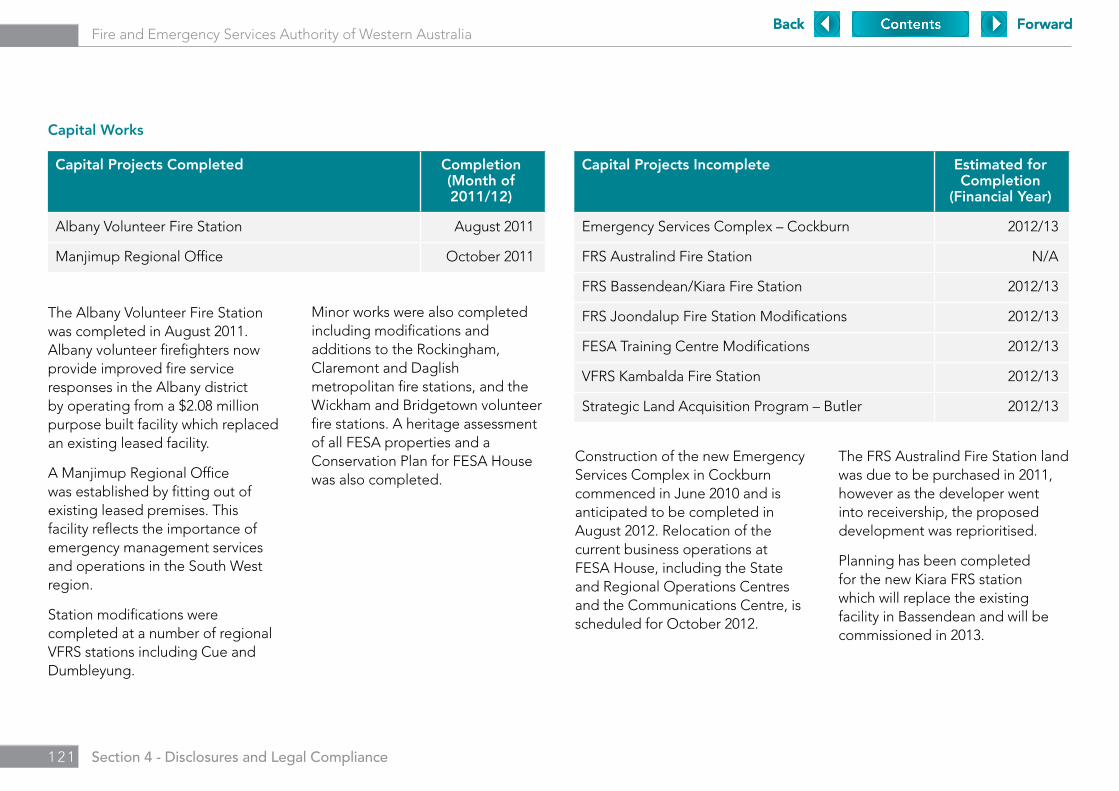
1 2 1 Section 4 - Disclosures and Legal Compliance
Fire and Emergency Services Authority of Western Australia
Capital Works
The Albany Volunteer Fire Station was completed in August 2011. Albany volunteer firefighters now provide improved fire service responses in the Albany district by operating from a $2.08 million purpose built facility which replaced an existing leased facility.
A Manjimup Regional Office was established by fitting out of existing leased premises. This facility reflects the importance of emergency management services and operations in the South West region.
Station modifications were completed at a number of regional VFRS stations including Cue and Dumbleyung.
Minor works were also completed including modifications and additions to the Rockingham, Claremont and Daglish metropolitan fire stations, and the Wickham and Bridgetown volunteer fire stations. A heritage assessment of all FESA properties and a Conservation Plan for FESA House was also completed.
Construction of the new Emergency Services Complex in Cockburn commenced in June 2010 and is anticipated to be completed in August 2012. Relocation of the current business operations at FESA House, including the State and Regional Operations Centres and the Communications Centre, is scheduled for October 2012.
The FRS Australind Fire Station land was due to be purchased in 2011, however as the developer went into receivership, the proposed development was reprioritised.
Planning has been completed for the new Kiara FRS station which will replace the existing facility in Bassendean and will be commissioned in 2013.
Capital Projects Incomplete Estimated for Completion
(Financial Year)
Emergency Services Complex – Cockburn 2012/13
FRS Australind Fire Station N/A
FRS Bassendean/Kiara Fire Station 2012/13
FRS Joondalup Fire Station Modifications 2012/13
FESA Training Centre Modifications 2012/13
VFRS Kambalda Fire Station 2012/13
Strategic Land Acquisition Program – Butler 2012/13
Capital Projects Completed Completion (Month of 2011/12)
Albany Volunteer Fire Station August 2011
Manjimup Regional Office October 2011
Back ForwardBack Forward
1 2 2 Section 4 - Disclosures and Legal Compliance
Fire and Emergency Services Authority of Western Australia
Modifications to the FRS Joondalup Fire Station were planned for completion in 2012, however, funding for this project was redirected for preliminary work on modifications to the FRS Wangara Fire Station. This work was planned to commence in 2012/13. The Joondalup modifications are now planned for completion in 2013.
Modifications to the FESA Training Centre in Forrestfield to provide additional classrooms and office accommodation are being finalised.
A land swap was completed with the Shire of Coolgardie to acquire a site for a new Kambalda Volunteer Fire Station to replace the ageing existing facility. The new station is expected to be completed in December 2012.
The Beverley Volunteer Fire Station was transferred to FESA by the Shire of Beverley in September 2011 and the Wundowie Volunteer Fire Station was transferred to FESA by the Shire of Northam in November 2011.
FESA is in the process of finalising the acquisition of land for the career Fire Station at Butler.
A total of 117 new or replacement vehicles were approved in FESA’s capital works program (47) and the Emergency Services Levy Capital Grants process (70). A significant amount of work in progress was also carried over from the previous year.
Capital works (appliance) programs that commenced or continued in 2011/12 included:
•Careerandvolunteerlighttankerreplacement.
•Supplementarysummerseasonbush fire tankers.
•Careerandvolunteermediumpump replacement.
•BushFireBrigadeappliancereplacement.
•SESunitvehiclereplacement.
During the year, 113 new fire appliances and emergency service vehicles were commissioned.
Back ForwardBack Forward
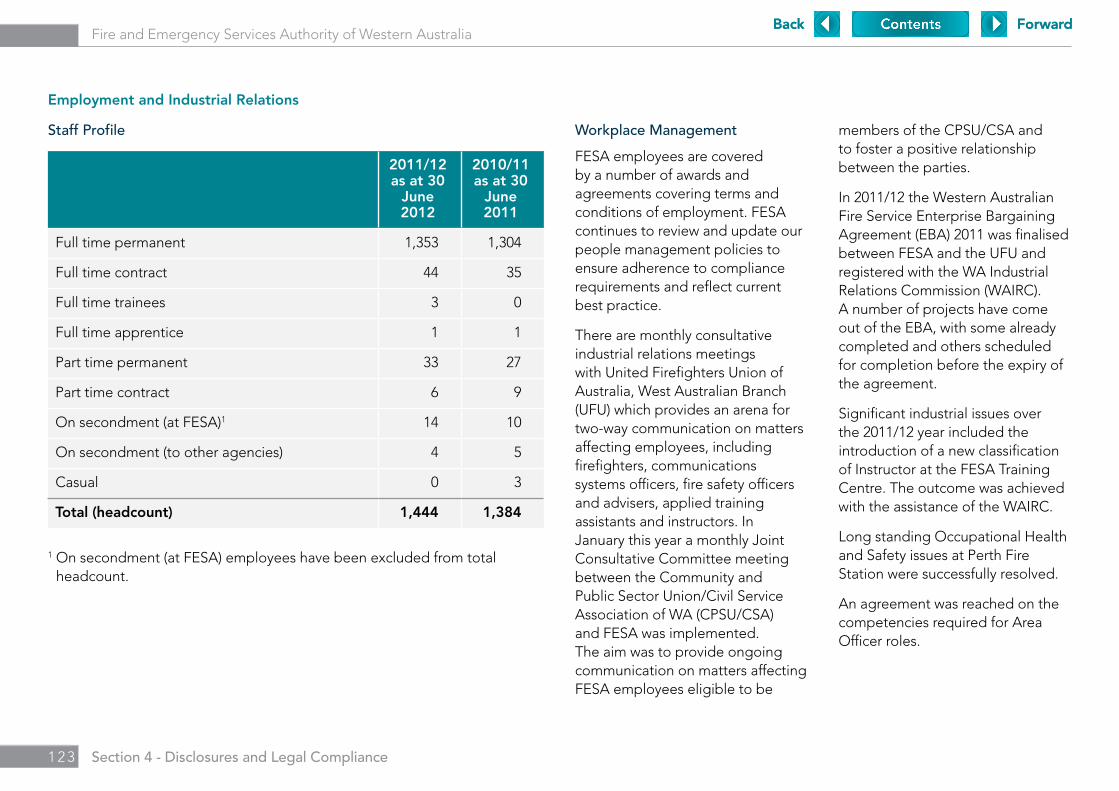
1 2 3 Section 4 - Disclosures and Legal Compliance
Fire and Emergency Services Authority of Western Australia
Employment and Industrial Relations
Staff Profile Workplace Management
FESA employees are covered by a number of awards and agreements covering terms and conditions of employment. FESA continues to review and update our people management policies to ensure adherence to compliance requirements and reflect current best practice.
There are monthly consultative industrial relations meetings with United Firefighters Union of Australia, West Australian Branch (UFU) which provides an arena for two-way communication on matters affecting employees, including firefighters, communications systems officers, fire safety officers and advisers, applied training assistants and instructors. In January this year a monthly Joint Consultative Committee meeting between the Community and Public Sector Union/Civil Service Association of WA (CPSU/CSA) and FESA was implemented. The aim was to provide ongoing communication on matters affecting FESA employees eligible to be
members of the CPSU/CSA and to foster a positive relationship between the parties.
In 2011/12 the Western Australian Fire Service Enterprise Bargaining Agreement (EBA) 2011 was finalised between FESA and the UFU and registered with the WA Industrial Relations Commission (WAIRC). A number of projects have come out of the EBA, with some already completed and others scheduled for completion before the expiry of the agreement.
Significant industrial issues over the 2011/12 year included the introduction of a new classification of Instructor at the FESA Training Centre. The outcome was achieved with the assistance of the WAIRC.
Long standing Occupational Health and Safety issues at Perth Fire Station were successfully resolved.
An agreement was reached on the competencies required for Area Officer roles.
2011/12 as at 30
June 2012
2010/11 as at 30
June 2011
Full time permanent 1,353 1,304
Full time contract 44 35
Full time trainees 3 0
Full time apprentice 1 1
Part time permanent 33 27
Part time contract 6 9
On secondment (at FESA)1 14 10
On secondment (to other agencies) 4 5
Casual 0 3
Total (headcount) 1,444 1,384
1 On secondment (at FESA) employees have been excluded from total headcount.
Back ForwardBack Forward
1 2 4 Section 4 - Disclosures and Legal Compliance
Fire and Emergency Services Authority of Western Australia
Recruitment
FESA aims to continually improve in all areas of recruitment to attract and retain quality applicants. This will be achieved by evaluating past and present recruitment processes, monitoring current trends, and implementing changes. Increased use of online recruitment will assist in the streamlining of processes.
The relocation of FESA headquarters to Cockburn Central in late 2012 continues to change the geographical demographics of applicants, with a higher proportion coming from the immediate proximity of the new location.
In 2011/12, FESA externally advertised 86 vacancies, including 11 recruitment pools, some of which resulted in the appointment of multiple employees. The number of applicants for those vacancies totalled 890.
Two firefighter recruitment campaigns were run in 2011/12. A total of 1,000 applications were received for the 72 positions available.
Equity and Diversity
As previously noted, the 2011/12 firefighter recruitment campaigns attracted 1,000 applicants. Of those applicants, nine identified themselves as Aboriginal, 49 were female, and 69 were from a non-English speaking background. In all other externally advertised recruitment processes, 34 percent of applicants were female and 3.4 percent identified as being from non-English speaking backgrounds.
Our Equity and Diversity Committee will continue to develop initiatives and strategies to promote opportunities within FESA to applicants from diverse backgrounds. Strategies include:
•Theutilisationofspecificmediatargeted to diverse groups.
•Thedevelopmentandpromotionof flexible work practices to enable people to meet any applicable cultural and traditional obligations.
•Appropriatelyusingconsultativelinks with community groups to stay informed of relevant issues affecting diverse groups.
The creation of a new fulltime Equity and Diversity Programs Coordinator role to develop and promote strategies to attract, retain and support a diverse workforce.
Staff Development
FESA is committed to the development of its employees and volunteers. Our strategies aim to build a highly skilled, professional and fair workforce with the ability to meet a challenging and changing operating environment.
During 2011/12 staff and volunteers received both operational and professional development training, delivered internally by FESA as a Registered Training Organisation, and external providers:
•Atotalof1,781coursesweredelivered across Western Australia, involving 1,391 FESA staff, 4,085 volunteers and 1,948 external personnel.
•Ofthe1,781coursesdelivered,341 were conducted at the FESA Training Centre and involved 2,609 FESA staff, 966 volunteers and 134 external personnel.
Back ForwardBack Forward

1 2 5 Section 4 - Disclosures and Legal Compliance
Fire and Emergency Services Authority of Western Australia
Governance Disclosures
Contracts with Senior Officers
At the date of reporting, other than normal contracts of employment of service, no senior officers, or firms of which senior officers are members, or entities in which senior officers have any substantial interests, had any interest in existing or proposed contracts with FESA
FESA Board Members as at 30 June 2011
Chairman
Mr Allan Skinner, PSM, FAIM, FIPAA
A retired career State public servant, Mr Skinner was a former Chief Executive Officer of the Department of Land Administration and Chair of the Bush Fires Board. Since his retirement in 2001, he has undertaken several consulting assignments for Government. He is a National Fellow of the Institute of Public Administration Australia (FIPAA) and a Fellow of the Australian Institute of Management (FAIM). Mr Skinner was awarded the Public Service Medal in 2001 and the Centenary Medal in 2003.
First appointed: 31 December 2002.
Appointed as Chairman: 28 April 2008.
State Emergency Service Volunteer Representative
Mr John Capes, OAM
Mr Capes has been involved in the State Emergency Service Volunteer Association in many capacities for the past 20 years. After leaving the Australian Government, he established his own business, Capes Consultancy Services, which supplies expertise on security and the facilitation of emergency management exercises.
First appointed: 2 November 1999.
Appointed Deputy Chairman: 22 February 2010.
Deputy Chairman
Bush Fire Services Consultative Committee Chairman
Mr Bruce Brennan, APM
Mr Brennan had a long and distinguished career with Western Australia Police (WAPOL), rising to the rank of Deputy Commissioner before his retirement in 2003. Mr Brennan represented WAPOL on many committees, including the State Emergency Management Committee. In 1998, he was awarded the Australian Police Medal.
First Appointed: 6 February 2006.
Deputy Chairman: 28 April 2008 – 22 February 2010.
Back ForwardBack Forward

1 2 6 Section 4 - Disclosures and Legal Compliance
Fire and Emergency Services Authority of Western Australia
Chief Executive Officer (Ex-Officio Member)
Ms Jo Harrison-Ward
Jo Harrison-Ward was appointed as FESA Chief Executive Officer in August 2006 and stepped down from her position on 17 August 2011. She had previously occupied the position of Executive Director of Western Australia Police from January 2005. Jo joined the Public Service in 1993 working as senior adviser on emergency services to the Minister for Emergency Services for five years. From 1998 to 2005 she held a number of FESA senior management positions including Executive Director, Emergency Management.
Chief Executive Officer (Ex-Officio Member)
Mr Wayne Gregson, APM, MBA, BA
Mr Gregson was appointed as the Chief Executive Officer of FESA in September 2011 for a period of 12 months. Mr Gregson joined FESA from Western Australia Police (WAPOL), where he was Assistant Commissioner Judicial Services. He joined WAPOL as a cadet in 1979 and operated at the Assistant Commissioner level for seven years. Mr Gregson holds a Master of Business Administration from Edith Cowan University, Graduate Certificate in Applied Management from the Australian Institute of Police Management and a Bachelor of Arts from the University of Western Australia.
Bush Fire Brigade Volunteer Representative
Mr Eddie van Rijnswoud
Mr van Rijnswoud has 17 years experience as a Bush Fire Brigade volunteer and was the Secretary of the Association of Volunteer Bush Fire Brigades Western Australia Inc. for six years. For many years Mr van Rijnswoud has been involved in a variety of other voluntary community organisations and committees and also has 37 years experience in the public sector.
First appointed: 7 December 2001.
FESA Employee Representative
Mr Iain Agnew
Mr Agnew has been an employee of FESA since 1979. He is a Senior Firefighter in the Fire and Rescue Service and is currently on secondment to the Staff Deployment Branch. In 2000 he was appointed a member of the Fire and Rescue Service Consultative Committee and has also been a committee member of the United Firefighters Union of Australia, West Australian Branch.
First appointed: 25 November 2003.
Back ForwardBack Forward

1 2 7 Section 4 - Disclosures and Legal Compliance
Fire and Emergency Services Authority of Western Australia
Fire and Rescue Service Consultative Committee Chairwoman
Mrs Penelope Valentine
Mrs Valentine was a FESA staff member for seven years before leaving in July 2005 to pursue private business interests. Her professional career spans more than 40 years, commencing in journalism and more recently in management positions in media and public affairs, strategic planning and corporate governance with FESA. She currently serves in a voluntary capacity on several local government and community committees.
First appointed: 6 February 2006.
Volunteer Fire and Rescue Service Representative
Mr Trevor Jones
Mr Jones has a long association with the Volunteer Fire and Rescue Service (VFRS) in regional Western Australia. He has been a member of the South Kalgoorlie VFRS since 1977, including a five year term as Captain, and the Kalgoorlie VFRS since its inauguration in 2005, where he holds the position of Secretary. Mr Jones is currently the Goldfields Zone representative for the WA Volunteer Fire and Rescue Services Association.
First appointed: 6 February 2006.
State Emergency Service Consultative Committee Chairwoman
Ms Sandra Gregorini
Ms Gregorini has been a volunteer with Swan Communications Brigade since 1996. She has 37 years experience in property development and management and was elected a Councillor of the City of Swan in 2009.
First Appointed: 19 March 2002.
Volunteer Marine Rescue Services Consultative Committee Chairman
Mr Ross Monger
Mr Monger was a public servant for 43 years, mostly in State court administration. On his retirement in 2007, he was appointed Director of Magistrates Courts Western Australia. Mr Monger also spent 10 years with WorkCover Western Australia as the director responsible for workers’ compensation dispute resolution. He is currently a Justice of the Peace and a lay member of two ethics committees.
First appointed: 28 April 2008.
Back ForwardBack Forward
1 2 8 Section 4 - Disclosures and Legal Compliance
Fire and Emergency Services Authority of Western Australia
Volunteer Marine Rescue Services Volunteer Representative
Mr Eliot Fisher, ESM
Mr Fisher is the Commander Bunbury Sea Rescue and has had many years’ experience as a volunteer with the Bunbury and York State Emergency Service units, Bunbury Volunteer Marine Rescue and the York Bush Fire Brigade. He is the former National Commander of the Australian Navy Cadets and is currently the Chairman of the Fairness and Resolution Authority (ANC). Mr Fisher has also served in the Citizen Military Forces and spent more than 20 years as a leader in the Scout Association of Australia. Formerly a local government CEO, he retains an active interest in rural communities as Western Australian Local Government Association Zone Executive Officer for the South West.
First appointed: 28 April 2003.
Western Australian Local Government Association Representative
Councillor Christine Thompson
Cr Thompson is a Councillor of the Shire of Murray and the Chair of the Shire of Murray Local Emergency Management Committee. She also represents local government on the Peel Region District Emergency Management Committee. Cr Thompson has a wealth of experience in emergency services, is a current volunteer firefighter and has served on a number of advisory committees and boards.
First appointed: 30 May 2000.
Independent Member
Ms Jenny Sales
Ms Sales has more than 20 years experience at senior levels in the Government of Western Australia. Her extensive public service career included working with the Department of the Premier and Cabinet in the role of Assistant Director General. Since 2007 Ms Sales has provided management consultancy services to the Western Australian public sector. More recently, she has been involved in relocation consultancy for the resources sector.
First appointed: 19 April 2011.
Back ForwardBack Forward

1 2 9 Section 4 - Disclosures and Legal Compliance
Fire and Emergency Services Authority of Western Australia
Number of meetings attended in 2011/12.
There were 11 Board meetings held during the year.
The record of attendance is as follows:
Allan Skinner PSM 10
Iain Agnew 9
Bruce Brennan APM 10
John Capes OAM 8
Elliot Fisher ESM 9
Sandra Gregorini 10
Wayne Gregson APM 9
Jo Harrison-Ward 1
Trevor Jones 9
Ross Monger 9
Jenny Sales 8
Christine Thompson 11
Penny Valentine 8
Eddie Van Rijnswoud 9
* Frank Pasquale attended one meeting as acting Chief Executive Officer in place of Ms Harrison-Ward.
The term of appointment for each of the Board Members has been formally extended pending the transition of FESA from an Authority to a Department. This is expected to occur during the 2012/13 financial year.
Finance and Audit Committee
During 2011/12, the committee held four meetings. Attendance was as follows:
Jenny Sales – Chair 3
John Capes 4
Eliot Fisher 3
Eddie van Rijnswoud 3
Meetings were also attended by:
•ExecutiveDirectorCorporateServices.
•DirectorBusinessServices (Chief Finance Officer).
•ManagerFinancialServices.
•ExecutiveManagerOfficeof the CEO.
•SutherlandRose(InternalAuditors).
•OfficeoftheAuditorGeneraland/or its representative, Deloitte.
The management of the internal audit function is the responsibility of the Office of the CEO.
FESA’s internal audit is conducted by an outsourced provider, Sutherland Rose, in accordance with the Financial Management Act 2006 and the Institute of Internal Auditors International Standards for the Professional Practice of Internal Auditing. The internal audit provides independent, objective assurance and consulting that is designed to add value and improve FESA operations.
The following internal audits were conducted in 2011/12:
•CompliancewithStateSupplyCommission (SSC): To assess compliance with the terms and conditions of FESA’s exemption against relevant SSC policies and applicable competitive requirements.
•CapitalWorks:Toensurethecapital works program has formal processes in place and all projects are appropriately approved and reflective of the FESA Strategic Plan; individual capital works projects are conducted, capitalised and completed in accordance with FESA policies and procedures, the Financial Management Act 2006, Treasurer’s Instructions; ownership of completed capital works projects is clearly identified; and reporting clearly reflects the progress of capital works projects and provides sufficient information to allow appropriate management decisions.
•RevenueandAccountsReceivable: To assess the effectiveness and efficiency of controls and processes in place to ensure revenue is completely and accurately collected and recorded in FESA’s general ledger, procedures are in place to monitor and follow up accounts receivable, and practices comply with the Financial Management Act 2006, Treasurer’s Instructions and FESA policies and procedures.
Back ForwardBack Forward

1 3 0 Section 4 - Disclosures and Legal Compliance
Fire and Emergency Services Authority of Western Australia
•Taxation:Toensureproceduresin relation to taxation are efficient and effective. To determine whether FESA has established effective procedures in respect of recording and reporting Goods and Services Tax transactions and timely lodgement of the monthly Business Activity Statement, capturing and assessing all Fringe Benefits Tax (FBT) liabilities and the timely lodgement of the annual FBT return. To ensure practices comply with the Fringe Benefits Tax Assessment Act 1986, A New Tax System (Goods and Services Tax) Act 1999, Financial Management Act 2006, Treasurer’s Instructions and FESA policies and procedures.
•CoolgardieVolunteerFireandRescue Service (VFRS) Brigade Trust Fund: To determine whether FESA administration, accounting and recording of the Coolgardie VFRS Brigade Trust Fund is in accordance with the Financial Management Act 2006, Treasurer’s Instructions, Financial Management Regulations 2007 and any other legal requirements, and that Trust Fund monies are spent in accordance with the purpose of the Fund.
•DirectBrigadeAlarms(DBA):To determine whether FESA contract management processes ensure DBA networks are delivered in accordance with relevant standards and regulations and the requirements of the contract between FESA and Chubb Fire Safety, represent value for money and whether Chubb Fire Safety are delivering services to FESA in accordance with the provisions of the contract and related service level agreement.
•FESARegisteredTrainingOrganisation (RTO): To ensure all recommendations made as a result of the 2009 Training Accreditation Council Compliance Audit and recent self-audits (against AQTF Standards and Conditions), have been, or are being, addressed. To ensure business processes, practices and policies employed by the FESA Training Centre are appropriately documented, provide a robust control framework for compliance with AQTF RTO requirements and identify any areas of non-compliance.
•VolunteerEmployerRecognitionProgram (VERP): To assess whether the VERP complies with the FESA VERP Quality Manual and ISO9001:2008 and whether VERP QMS is being effectively implemented and maintained.
•LocalGovernment’sAcquittalof the Emergency Services Levy (ESL) payment: To ensure local government authorities acquit the annual ESL payment in accordance with the ESL grant scheme arrangements.
•OperationalImprovementDatabase (OID): To review the OID for efficiency and effectiveness, including: processes and controls to ensure that the OID is complete, accurate and relevant and operational improvement performance reporting is complete, accurate, relevant and timely; and processes and controls to ensure continuous improvement is monitored.
•BroomeRegionalOffice:Toensure the Kimberley Regional and District Offices operate in accordance with an operational plan that aligns with FESA strategy, management uses appropriate financial and operational information for decision making and financial and administrative processes are in accordance with FESA policy and procedures.
Back ForwardBack Forward
1 3 1 Section 4 - Disclosures and Legal Compliance
Fire and Emergency Services Authority of Western Australia
•VolunteerMarineRescueServices (VMRS): To determine the effectiveness of the current governance arrangements in place between FESA and the VMRS Branch with a particular focus on the support provided by FESA; assess FESA processes relating to the allocation of Operational and Capital grants to VMRS Groups; and assess whether records of expenditure are supplied to FESA by the VMRS Groups and include appropriate evidence that funds are expended in accordance with VMRS funding provisions.
•StaffDeploymentSystem(SDS):To review SDS upgrades to determine whether upgrades made to the SDS are efficient and effective and identify any potential areas for improvement.
•JuvenileandFamilyFireAwareness (JAFFA): To determine whether appropriate FESA procedures are in place for the management of referrals and collection, storage and retrieval of case evidence as a result of the JAFFA program, and to ensure the confidentiality and integrity of the Program for key stakeholders and families involved.
(Fire and Emergency Services Authority of Western Australia Act 1988, S36)
The FESA Consultative Committees represent staff and volunteer stakeholders from the operational services.
They provide input on strategic issues and advice in relation to policy and planning within the FESA Operations portfolio. They also maintain a communication channel, through the committee Chairs, between staff and volunteers in the field, and the FESA Board.
Bush Fire Service Consultative Committee
The Bush Fire Service Consultative Committee (BFSCC), chaired by Mr Bruce Brennan, comprises 15 members with a diverse range of bushfire experience. FESA, Department of Environment and Conservation, Western Australian Local Government Association and Association of Volunteer Bush Fire Brigades of WA (Inc) are represented, as are all regions, by District Operations Advisory Committee (DOAC) members.
During the year, Mr Graham Pritchard resigned from the committee. His dedicated efforts and input were acknowledged and greatly appreciated.
The BFSCC met four times in 2011/12 and was a key stakeholder supporting the Department of the Premier and Cabinet’s implementation of recommendations arising from the Perth Hills Bushfire February 2011 Review and the Report of the Special Inquiry into the November 2011 Margaret River Bushfire.
Other key issues covered during the year included community vulnerability, the WA Fire and Emergency Services Conference, Automatic Weather Stations, equipment issues, radio communications, Public Alert System Review, and training and safety incidents.
Consultative Committees
Back ForwardBack Forward

1 3 2 Section 4 - Disclosures and Legal Compliance
Fire and Emergency Services Authority of Western Australia
Fire and Rescue Service Consultative Committee
The Fire and Rescue Service Consultative Committee (FRSCC), chaired by Mrs Penelope Valentine, comprises eight members and represents FESA Fire and Rescue Service staff and volunteers.
The FRSCC met three times in 2011/12 and received reports from major incident reviews, changes to emergency management legislation, data reporting requirements, operations doctrine, training and equipment.
State Emergency Service Consultative Committee
The State Emergency Service Consultative Committee (SESCC), chaired by Ms Sandra Gregorini, comprises eight members including three FESA representatives. Members from across the State represent volunteers in SES response districts.
During the year, Mr Adam Owen resigned from the committee. His dedicated efforts and input were acknowledged and greatly appreciated.
The SESCC met three times during the year and continued to work towards its goal of representing and promoting SES volunteers at a strategic level. Members received presentations on various topics and provided comment and input on a broad range of operational issues including National SES Week, appliances and equipment, training, system upgrades and major incidents.
Volunteer Marine Rescue Services Consultative Committee
The Volunteer Marine Rescue Services Consultative Committee (VMRSCC), chaired by Mr Ross Monger, comprises 10 members who represent marine rescue service volunteers across the State. Membership is closely linked to the executives and regional representatives of Volunteer Marine Rescue Western Australia (VMRWA). Support is provided by VMRS officers from FESA. It represents marine rescue services volunteers across the State with membership closely linked to the executive and regional representatives of Volunteer Marine Rescue Western Australia (VMRWA).
The VMRSCC met four times during 2011/12 and members provided advice and input on a range of issues including the endorsement of capital grant funding, the web-based incident reporting system known as WAMSAR, the Annual Sea Rescue Conference, the VMRS Cadet Program, the Volunteer Employer Recognition Program, training resources, operational checklists and operational standards policy.
Back ForwardBack Forward
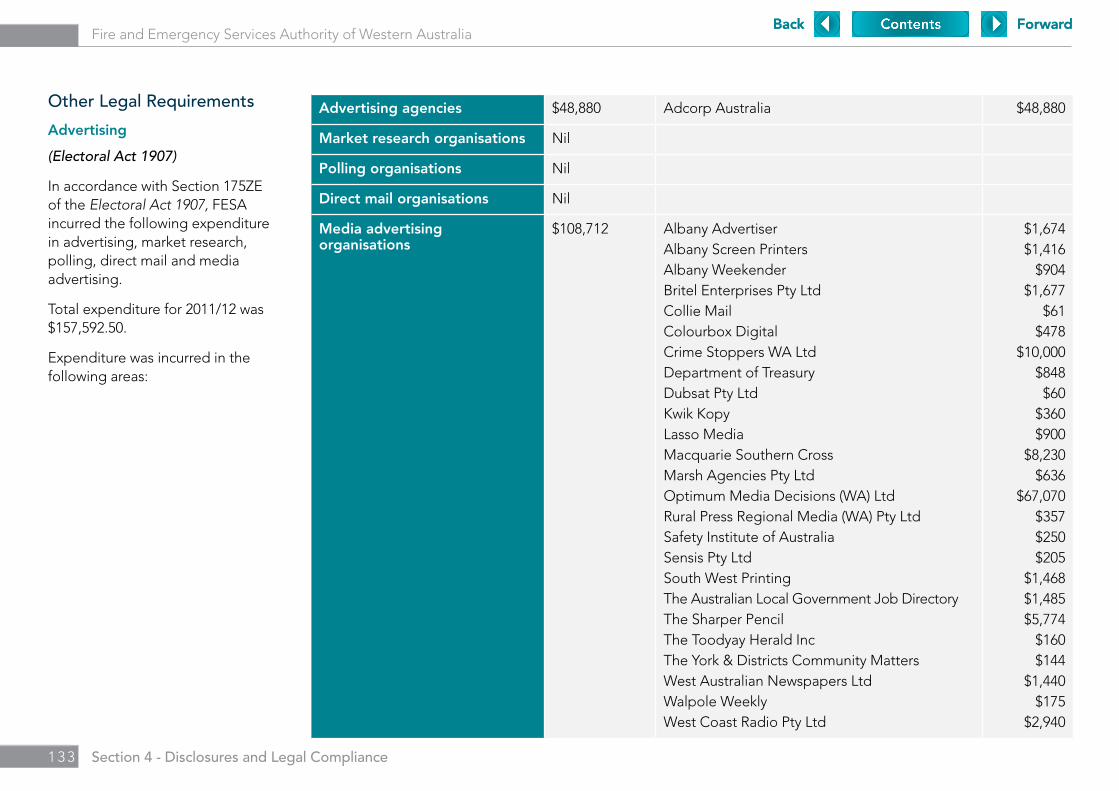
1 3 3 Section 4 - Disclosures and Legal Compliance
Fire and Emergency Services Authority of Western Australia
Other Legal Requirements
Advertising
(Electoral Act 1907)
In accordance with Section 175ZE of the Electoral Act 1907, FESA incurred the following expenditure in advertising, market research, polling, direct mail and media advertising.
Total expenditure for 2011/12 was $157,592.50.
Expenditure was incurred in the following areas:
Advertising agencies $48,880 Adcorp Australia $48,880
Market research organisations Nil
Polling organisations Nil
Direct mail organisations Nil
Media advertising organisations
$108,712 Albany AdvertiserAlbany Screen PrintersAlbany WeekenderBritel Enterprises Pty LtdCollie MailColourbox DigitalCrime Stoppers WA LtdDepartment of TreasuryDubsat Pty LtdKwik KopyLasso MediaMacquarie Southern CrossMarsh Agencies Pty LtdOptimum Media Decisions (WA) LtdRural Press Regional Media (WA) Pty LtdSafety Institute of AustraliaSensis Pty LtdSouth West PrintingThe Australian Local Government Job DirectoryThe Sharper PencilThe Toodyay Herald IncThe York & Districts Community MattersWest Australian Newspapers LtdWalpole WeeklyWest Coast Radio Pty Ltd
$1,674$1,416
$904$1,677
$61$478
$10,000$848$60
$360$900
$8,230$636
$67,070$357$250$205
$1,468$1,485$5,774
$160$144
$1,440$175
$2,940
Back ForwardBack Forward
1 3 4 Section 4 - Disclosures and Legal Compliance
Fire and Emergency Services Authority of Western Australia
Disability Access and Inclusion Plan Outcomes
(Disability Services Act 1933, S29)
During 2011/12, our Disability Access Committees achieved the following:
•AppointmentofaSeniorProjectOfficertoaddresstherisksofbushfirewithatriskpeopleandcommunities,includingpeoplewithadisability.
•Undertakingconsultationworkshopswiththedisabilitysectortofacilitateitsinputintobushfiresafety.
•Providingcommunityeducationmaterialinalternativeformats.
•Improvedwebsitedesignforimprovedaccess.
•DeliveryoffiresafetyeducationtoEducationSupportGroups.
The FESA Education and Heritage Centre provides a modified Home Fire Safety Program for students and community groups with special needs such as cognitive and learning delays, physical disabilities and hearing and visual impairment. The program was modified by coordinators and facilitators to include visual support tools and use clear and simple language to enhance learning. The program also facilitates discussion around home fire escape plans and action with particular emphasis on this group’s physical and cognitive issues. The FESA Education and Heritage Centre has provided this program to 20 groups during 2011/12.
We intend to review our Disability Access and Inclusion Plan in 2012/13.
Back ForwardBack Forward
1 3 5 Section 4 - Disclosures and Legal Compliance
Fire and Emergency Services Authority of Western Australia
Compliance with Public Sector Standards and Ethical Codes
(Public Sector Management Act 1994, S31(1))
In the administration of FESA during 2011/12, I have complied with the Public Sector Standards in Human Resource Management, the Western Australian Public Sector Code of Ethics and our Code of Conduct.
I have established procedures designed to ensure such compliance and conducted appropriate internal assessments to satisfy myself that the statement made in point one above is correct.
FESA revised and updated its Code of Conduct in 2011. FESA staff are required to complete Accountable and Ethical Decision Making training which is now available online. References to the FESA Code of Conduct are made throughout this training which provides an effective method of advising staff about its application to expected workforce behaviour. To date 1,217 staff members or approximately 82 per cent of FESA total staff have completed the training. FESA will continue to manage the completion of the mandatory training in 2012-13 for all staff.
The applications made for breach of standards review and the corresponding outcomes for the reporting period are:
Number lodged: Three
Number of breaches found: Nil
Number of multiple breaches: Nil
Number still under review: Nil
W Gregson APM, MBA, BAChief Executive Officer
27 August 2012
Back ForwardBack Forward
1 3 6 Section 4 - Disclosures and Legal Compliance
Fire and Emergency Services Authority of Western Australia
(State Records Act 2000 and State Records Commission Standard 2, Principle 6)
Record Keeping System
The current FESA Record Keeping Plan will be reviewed following the move to Cockburn Central in 2012.
Over the past 12 months FESA has developed a plan to upgrade from Tower Records and Information Management (TRIM) 6.2 to TRIM 7.1. As part of this upgrade, FESA will move from a Thesaurus based titling system to a classification system. This led to an extensive review of:
•TherecordkeepingprocessesofFESA business units.
•Filetitlingpractices.
•FESAThesaurus.
•FESARetentionandDisposalschedule.
A survey has been undertaken to determine current recordkeeping practices within FESA and to assist with the management of information into the future.
Survey results will form the basis of a report on the current records management practices and processes within FESA and considering options for managing FESA corporate knowledge.
The use of TRIM to capture and manage electronic information has dramatically increased over the past four years, in particular the capture of emails. In 2008/09 there were 545 emails captured. In 2012/13, over 15,546 emails were captured in TRIM.
The FESA Training Centre underwent major restructure during the year, however, this did not halt the progression towards Electronic Document Management within the facility. Staff were trained in both records management and TRIM and are actively participating in the development of a classification system to meet their specific needs as a Registered Training Organisation.
Training Program
The TRIM training manual is continually being updated. Regular audits of the TRIM system are undertaken to ensure compliance, quality of indexing and understanding of recordkeeping practices across FESA, which has an established TRIM training program.
The online records management program introduced in early 2011 has become an integral part of the FESA records management policy and TRIM training. Online records management training will be included in the FESA induction program.
Move to New Emergency Services Complex
FESA will relocate to the new Emergency Services Complex in Cockburn in 2012. Over the past 12 months, Information Resources has assisted work units across FESA to prepare their information for the move.
The management plan clearly identifies records that are essential for business continuity and will minimise the risk of any corporate records being inappropriately disposed of or lost. It also ensures a controlled transfer of records held by staff in offices and on shared and personal drives during the relocation
Disposal Program
The disposal program which commenced in 2010/11 continued with over 400 boxes sent to offsite storage. Of these, an estimated 40 boxes contain information of archival value.
The Retention and Disposal Schedule is under review to ensure it aligns with the new FESA classification system.
A review of the records held in district and regional offices will commence during the 2012/13 financial year.
Record Keeping Plans
Back ForwardBack Forward

1 3 7 Section 4 - Disclosures and Legal Compliance
Fire and Emergency Services Authority of Western Australia
Freedom of Information
(Freedom of Information Act 1992 (FOI Act) – Section 111)
The Freedom of Information Statistical Return for 2011/12 has been submitted to the Information Commissioner as prescribed in Section 111 of the Freedom of Information Act (FOI Act) 1992. A summary follows.
A total of 98 valid applications were received in 2011/12, an increase of seven applications from 2010/11. Six were carried over from 2010/11. During the first quarter we received a higher number of applications (32) than during any other quarter.
Most applications sought access to non personal information from Operational Services (including Fire Incident Reports and Fire Investigation Reports) in relation to domestic and commercial structural fires. There were also a number of requests for information relating to major incidents such as the Margaret River bushfire.
Twelve applications were received from the media and five from Members of Parliament, up from three from each in the previous reporting period.
Full access was granted to three applications and 76 were granted edited access. Four applications were either denied or the information was unavailable. Nine were deferred and four transferred in full to another Government agency. Eight applications were carried over to the 2012/13 reporting period.
The average processing time for each application rose to 30 days, up from 25 days for 2010/11 though still well within the maximum period of 45 days permitted under the Act. The 20 percent increase in processing times is attributable to the increase in applications from Members of Parliament and the media. These applications tend to be quite broad in scope and require additional resources to process.
One internal review was received and the original decision was varied to provide edited access to a further two documents.
The FESA Information Statement, which is required under Part 5 – Publication of Information about Agencies of the FOI Act, was last updated in December 2010.
The Information Statement and Application Form are both available on the FESA website.
Freedom of Information Applications 2011/12
Applications carried over from previous reporting period 6
New valid applications received within this reporting period 98
Total applications for 2011/12 104
Applications withdrawn or invalid 0
Applications transferred in full to another Government Agency 4
Applications denied access or access deferred 13
Edited access granted 76
Full access granted 3
Total applications dealt with in 2011/12 96
Applications carried over to 2012/13 8
Freedom of Information Fees and Charges 2011/12
Application fees collected $3,060.00
Actual charges collected $1,104.20
Charges waived (when processing costs are less than $20.00) $1,001.28
Back ForwardBack Forward

1 3 8 Section 4 - Disclosures and Legal Compliance
Fire and Emergency Services Authority of Western Australia
Government Policy Requirements
Occupational Safety, Health And Injury Management
(Public Sector Commissioner’s Circular 2009-11: Code of Practice: Occupational Safety and Health in the Western Australian Public Sector)
The safety and health of our staff, volunteers, contractors and visitors is an important value for FESA. Our commitment to safety, health and injury management was demonstrated this year with a decision to move responsibility for health and safety management to the Office of the CEO and communication of a clear strategic direction for addressing safety reform initiatives identified in the Safety Management Audit conducted in 2009/10.
Safety and Health Reform Platform
We are changing our safety and health direction to ensure effective governance and the development of an integrated organisational safety management system.
An external safety consultant is assisting us to determine strategic priorities and develop tailored corporate safety systems. Our renewed focus on safety and health requires:
•Aclearandeffectivereportingandgovernance structure for safety.
•Uniformadoptionofcorporatesafety management processes across FESA.
•Determinationofcriticalsafetypriorities and the allocation of adequately skilled resources to these areas.
•Suitablyqualified,competentand experienced safety resources within the organisation.
•Aclearunderstandingbystakeholders as to the roles and responsibilities of safety resources.
•Aclearcorporatemandatewhichsupports an integrated approach to safety management and the engagement of stakeholders at different levels within the organisation.
Our Safety and Health Reform project will deliver the foundations for safety management and systems appropriate to the nature and breadth of emergency services operations and aligned to FESA values and culture. It is anticipated that full implementation of the project will take until 2014.
By the end of 2011/12 FESA had successfully completed approximately 10 percent of the agreed actions which arose from the 2009/10 Safety Management System Audit. Work planned for 2012/13 will continue progress towards identified safety objectives.
FESA also commissioned a ‘gap analysis’ in anticipation of proposed harmonised Western Australian safety legislation. This will continue to inform safety reform within FESA.
Structure, Role and Function of Safety and Health Service Provision
A new operational model for FESA safety and health will align with, and provide strategic support for, corporate safety objectives and priorities. It provides personnel with appropriate specialist safety skills, competencies and experience to assist the development and integration of FESA Safety Management System within core business activities.
The safety and health function will be split to enable:
•Highlyvisiblestrategicsafetyand specialist functions with close links to senior executive management.
•Transactionalsafetyrelatedfunctions (including workers’ compensation, injury management, medical retirement and personal accident claims) at the operational level.
Back ForwardBack Forward
1 3 9 Section 4 - Disclosures and Legal Compliance
Fire and Emergency Services Authority of Western Australia
The restructure of the safety and health function will:
•Signalpositivechangeintheway FESA values, plans for and manages safety.
•Enablesafetygovernanceandassurance roles to be performed by the safety and health function.
•EnableFESAtomaintainacorporate and strategic focus on safety.
•Enabletransactionalsafetyrelated activities to be delivered without detracting from strategic safety management activities.
Safety Governance Framework and Risk Management
FESA safety and health governance contribute to the objectives of a broader FESA enterprise risk and governance framework. This is facilitated by monthly reporting to executive management on the safety and health performance of business units.
Future work will refine reporting to include positive performance indicators to meet corporate safety and health objectives and targets.
Our commitment to effectively addressing and controlling safety related risks has resulted in an extensive review of key organisational safety and health risks and the compilation of a safety risk register. The hazards identified in the safety risk register have been rated and will form the platform for a priority body of work commencing in 2012/13 to ensure the adequacy of controls and risk mitigation.
Focus Areas for 2011/12
Our focus areas in 2011/12 were:
•Strategicplanningforhealthandsafety reform within FESA.
•Promotingandincreasingknowledge and awareness of safety and health issues through consultation, communication and the FESA Health, Safety and Welfare Summit.
•Strengtheningorganisationalcapacity and capability through targeted safety and health training.
•Usinginformationfromouronline hazard reporting system to identify priority projects and trends.
•Reviewingissuesrelatedtofitness for work, preventing and managing fatigue, and alcohol and other drugs.
•Monitoringfirefighterhealth.
Consultation, Communication and Awareness
We use a variety of formal consultative methods such as safety committees, tool box meetings, work groups, focus groups and risk assessment teams. Recent training for safety and health committee members focused on improving the quality and output of our meetings.
The introduction of the online hazard reporting system has enhanced employee contributions to decision making that may affect their safety and health at work. It also provides them with relevant feedback.
Nearly 100 attendees including management, safety and health representatives, volunteers and corporate staff participated in our second Health Safety and Welfare Summit. Topics included the FESA Safety Management System, the relationship between sleep and fatigue, and physiological responses to extreme stress.
Health and Safety Training
Training is essential in developing competent safety and health leadership. In collaboration with Edith Cowan University, FESA delivered a two-day health and safety training program to 97 (30 percent) of our managers who now have enhanced knowledge in safety, health and injury management systems and their obligations.
FESA also offered Certificate IV Occupational Safety and Health training to our safety and health representatives and management. To date 20 participants have successfully completed this course.
Providing emergency services can be stressful. During 2011/12, we offered 85 stress management training sessions to staff and volunteers.
Back ForwardBack Forward
1 4 0 Section 4 - Disclosures and Legal Compliance
Fire and Emergency Services Authority of Western Australia
The sessions aim to destigmatise mental health issues and assist in the identification of depression and post-traumatic stress, and raise awareness of the treatment and services available to sufferers, their families and colleagues. Some of these sessions were also attended by representatives from St John Ambulance and other community groups.
Reporting and Investigation
The FESA online hazard reporting system delivers an improved information flow to those involved with the hazard or incident, management and specialist areas. During 2011/12, 1,385 staff received training in the system to ensure that hazards, near misses and workplace injuries are reported and managed appropriately.
We began refining our safety and health investigation framework to improve guidance for investigation teams and better inform future decision making.
Fitness for Work
In recognition of the serious safety and health risks associated with fatigue, a draft Fatigue Management Policy and procedures were trialled over the fire season. The trial encouraged feedback from those who felt that they were fatigued while undertaking work for FESA. The results of the initial trial and survey will be collated, and a revised draft policy and procedures will be in place early in the next fire season.
A working party representing a cross section of the workforce is developing a program to assist members with the prevention and management of issues related to alcohol and other drug misuse from a fitness for work perspective.
Firefighter Health Monitoring
The FESA firefighter health monitoring program has two components – health surveillance of firefighters, volunteers and staff who attended the Bellevue fire in 2001, and a general health surveillance program.
The periodic health monitoring program consists of a health questionnaire, physical examination and pathology testing. To date a total of 278 people have participated in the health monitoring programs and analysis of the results are due in early 2013.
Injury Management and Workers’ Compensation
The RiskCover report: Fire and Emergency Services Authority (FESA) Workers’ Compensation and Injury Management Review completed in June 2010 found our “… workers’ compensation and injury management system is mature and generally meets the needs of the agency, employees and volunteers. There are no major areas of concern.”
Specifically, RiskCover found our system performs well for legislative compliance, effectiveness, value for money and the ability to measure outcomes. There is some opportunity for improvement in increasing transparency, fair and ethical treatment of employees (in the provision of early return to work opportunities) and levels of support
and engagement for line managers.
The strengths of the system include a knowledgeable and committed health, safety and welfare team delivering high quality services to FESA employees, volunteers and managers. There are commitments to inhouse injury management rather than relying on external rehabilitation providers, using preferred medical specialists, work hardening programs, the provision of psychological support for injured workers and a focus on education of managers and employees.
Injury management is supported by the development and use of return to work programs by an experienced and dedicated injury management team. The recent RiskCover audit indicated the need for consistent application of return to work plans. This important aspect of injury management has been included in the Human Resources Annual Plan for 2012/13.
Our belief, supported by RiskCover, is that our FESA culture is clearly supportive of injury management. This is fundamental to its current performance and future growth.
Back ForwardBack Forward

1 4 1 Section 4 - Disclosures and Legal Compliance
Fire and Emergency Services Authority of Western Australia
Table of Results:
Public Sector Commissioner’s OSH Performance requirements 2012-14
These statistics have been achieved using data from RiskCover and FESA Human Resources Directorate full time equivalent averages.
Indicator Result Target Comment on Result
2009/10 2010/11 2011/12
Number of Fatalities 0 0 0 Zero (0) Achieved
Lost time injury/disease (LTI/D) incidence rate 11.01 10.05 6.96 Zero (0) or 10% improvement on the previous three (3) years
Achieved
Lost time injury severity rate 8.9 6.67 9.18 Zero (0) or 10% improvement on the previous three (3) years
Not Achieved
Percentage of injured workers returned to work within (i) 13 weeks
89% 90% 85% Greater than or equal to 80%
Achieved
Percentage of injured workers returned to work within (ii) 26 weeks
88% 93% 92% Greater than or equal to 80%
Achieved
Percentage of managers and supervisors trained in occupational safety, health and injury management responsibilities
Not previously reported
30% Greater than or equal to 80%
A program has been developed to train all managers
Back ForwardBack Forward
1 4 2 Section 4 - Disclosures and Legal Compliance
Fire and Emergency Services Authority of Western Australia
FESA Reconciliation Action Plan
In 2011/12, FESA’s Reconciliation Action Plan progressed its Focus Area Actions:
•Relationships.
•Respect.
•Opportunity.
A yearly review of the plan has been undertaken and a progress report provided to the Corporate Leadership Team.
Significant achievements have been made during 2011/12:
Focus Area – Relationships
•Crossculturalworkshopswillnowform part of the FESA Training Centre calendar.
Focus Area – Respect
•TheAboriginalflagcontinuesto be flown during times of Aboriginal significance such as NAIDOC Week.
•FESAparticipatedininternaland external community events during NAIDOC Week celebrations.
•WelcometoCountryprotocolsare in place either through Acknowledgement to Country or Welcome to Country ceremonies conducted by local Aboriginal Elders.
Focus Area – Opportunity
During natural hazards such as floods or tropical cyclones an Indigenous Liaison Officer ensures Aboriginal communities are kept informed.
BackBack