government of the district of columbia muriel bowser mayor … · 2016-02-01 · government of the...
TRANSCRIPT

Government of the
District of Columbia
Muriel Bowser Mayor
Jeffrey DeWitt
Chief Financial Officer
Tax Rates and Tax Burdens
Washington Metropolitan Area
Including: Washington, D.C. Maryland Virginia Charles Co. Alexandria Montgomery Co. Arlington Co. Prince George's Co. Fairfax City Fairfax Co. Falls Church Loudoun Co. Prince William Co.
2014
Issued December 2015

i
A Comparison of Tax Rates and Burdens in
the Washington Metropolitan Area
Table of Contents
List of Major Charts, Maps, and Tables ............................................................................. ii
Executive Summary ............................................................................................................ iv
Acknowledgments ................................................................................................................ vii
Part I: A Comparison of Tax Burdens in Selected Washington Metropolitan Area Jurisdictions, 2014
Overview ................................................................................................................ 2
Individual Income Tax ........................................................................................... 4
Real Property Tax .................................................................................................. 8
Sales Tax .............................................................................................................. 11
Automobile Tax.. ................................................................................................. 12
Part II: A Comparison of Tax Rates in the Washington Metropolitan Area as of January 1, 2015
Alcoholic Beverage Tax ....................................................................................... 22
Cigarette Tax ......................................................................................................... 23
Financial Institution Taxes .................................................................................... 24
Income Taxes
Corporate Franchise ........................................................................................ 25
Individual Income ........................................................................................... 26
Unincorporated Business Franchise ................................................................ 29
Inheritance and Estate Taxes ................................................................................. 31
Insurance Premiums Tax....................................................................................... 33
Motor Vehicle Taxes…………………………………………………..................35
Motor Vehicle Excise Tax .............................................................................. 35
Motor Vehicle Registration............................................................................. 35
Motor Vehicle Fuel Tax .................................................................................. 37

ii
A Comparison of Tax Rates and Burdens in
the Washington Metropolitan Area
Table of Contents, continued
Property Taxes
Real Property .................................................................................................. 38
Property Tax Relief Programs ........................................................................ 41
Tangible Personal Property ............................................................................. 46
Public Utilities Tax ............................................................................................... 49
Recordation and Transfer Taxes ........................................................................... 52
Sales and Use Taxes.............................................................................................. 54
Water and Sewerage User Charges (Residential) ................................................. 57
Miscellaneous Taxes ............................................................................................. 60
Appendix A: Additional Tax Burden Maps……………………………………………….63
Office Locations and Telephone Numbers ............................................................................... 70
List of Major Charts, Maps, and Tables
Part I: A Comparison of Tax Burdens in Selected
Washington Metropolitan Area Jurisdictions, 2014
Table 1 Individual Income Tax, Washington Metropolitan Area………………...6
Chart 1 2014 Metro Area Individual Income Tax Burdens, $................................7
Table 2 Housing Value Assumptions for Major
Washington Metropolitan Area Jurisdictions, Calendar Year 2014……...9
Chart 2 Nominal Property Tax Rates for Select Jurisdictions in the Metro
Area……………………………………………………………………..10
Chart 3 2014 Metro Area Property Tax Burdens, $....…………………………..11
Table 3 Selected Sales Tax Rates ……………………………………………….11
Table 4 Automobile Tax Assumptions, 2014 ....................................................... 14
Table 5 Major 2014 State & Local Tax Burdens for a Family of Three
in Selected Washington Metro Area Jurisdictions ................................. 15
Table 6 Summary of Average Major Tax Burdens for Selected
Washington Metropolitan Area Jurisdictions and D.C., Calendar Year
2014 ......................................................................................................... 16

iii
A Comparison of Tax Rates and Burdens in
the Washington Metropolitan Area
Table of Contents, continued
Chart 4 2014 Estimated Burdens of Major Taxes for Five Hypothetical
Families……………………………………………………………........17
Map 1 Total 2014 Metro Area Combined Tax Burden (Income, Property, Sales,
& Auto) as a % of Income (Family Earning $75,000/Year)……………19
Table 7 Selected State and Local Tax Rates in the D.C.
Metro Area, Fiscal Year 2014 - 2015 ..………………………………… 20
Part II: A Comparison of Tax Rates in the Washington Metropolitan Area as of January 1, 2015
Table 8 Individual Income Tax, Washington Metropolitan Area, January 1,
2015…………………………………………………………………......28
Table 9 Unincorporated Business Franchise and Business License Taxes,
2014……………………………………………………………………..30
Table 10 Insurance Premiums Tax Rates ............................................................... 34
Table 11 Annual Registration Fees for Passenger Cars ......................................... 36
Table 12 Real Property Tax Rates, Property Tax Year 2014 - 2015 ...................... 40
Table 13 Property Tax Relief Programs ................................................................. 44
Table 14 Tangible Personal Property, Tax Year 2014 - 2015 ................................ 48
Table 15 Public Utilities Tax to Residential Consumers ........................................ 50
Table 16 Public Utilities Tax to Suppliers ............................................................. 51
Table 17 Sales and Use Tax Rates ......................................................................... 56
Table 18 Water and Sewerage User Charges (Residential), 2014………………...58
Map 2 D.C. Metro Area Map……………………………………………….......64
Map 3 Total 2014 Metro Area Tax Burdens (Income, Property, Sales, &
Auto) as a % of Income (Family Earning $25,000/Year)…..…………..65
Map 4 Total 2014 Metro Area Tax Burdens (Income, Property, Sales, & Auto)
as a % of Income (Family Earning $50,000/Year)…………………….. 66
Map 5 Total 2014 Metro Area Tax Burdens (Income, Property, Sales, & Auto)
as a % of Income (Family Earning $75,000/ Year)……………………. 67
Map 6 Total 2014 Metro Area Tax Burdens (Income, Property, Sales, & Auto)
as a % of Income (Family Earning $100,000/ Year)…………………... 68
Map 7 Total 2014 Metro Area Tax Burdens (Income, Property, Sales, & Auto)
as a % of Income (Family Earning $150,000/ Year) …………………...69

iv
Executive Summary
Overview
This publication contains two studies: (I) the Washington, D.C. Metropolitan Area tax
burden comparison, and (II) the Washington, D.C. Metropolitan Area comparison of tax rates.
Hypothetical state and local tax burdens for a family of three, at five income levels, are
presented in Part I of this publication. These burdens reflect individual income, real property,
sales, and automotive taxes in the District of Columbia and selected jurisdictions in the
Washington metropolitan area.
Taxation of individuals is an important factor in considering the competitiveness of a
given jurisdiction within a major metropolitan area. Simply comparing nominal tax rates,
however, does not provide an accurate picture of how one location compares to other
jurisdictions, and can be misleading given that statutory rates do not reflect the wide array of
adjustments and provisions made to the tax base, such as tax deductions, credits, and other
preferences.
In order to compare different locations within the major metropolitan Washington area,
this study estimates hypothetical state and local tax burdens for a family of three in eight
Washington-area jurisdictions: the District of Columbia, the Maryland counties of Montgomery
and Prince George’s; the Virginia counties of Arlington and Fairfax; and the Virginia cities of
Alexandria, Fairfax, and Falls Church. The hypothetical family comparison accounts for
differences in tax base as well as tax rates across jurisdictions, and can be conducted at a variety
of income levels.
In this study, the hypothetical family consists of two wage-earning spouses and one
school-age child. The gross family income levels used are $25,000, $50,000, $75,000, $100,000
and $150,000. The wage and salary split is assumed to be 70-30 between the two spouses. All
other income is assumed to be split evenly. The family at each income level is assumed to own a
single family home, with the exception of families at the $25,000 income level, who are assumed
to occupy rental housing. All families are assumed to reside within the confines of the
jurisdiction, and all wage and salary income is assumed to have been earned in the jurisdiction.
The four taxes used in the comparison are the individual income tax; the real property tax
on residential property; the general sales and use tax; and automobile taxes, including the
gasoline tax, registration fees, and personal property tax for tax year 2014.
This study is not intended to measure the overall level of taxation in a jurisdiction; rather,
it attempts to measure a hypothetical tax burden for a family given assumptions identified for
each tax. There is no single “best” way of measuring tax burdens. To estimate tax payments, the
study makes critical assumptions about typical households, their sources of income, and
consumption patterns. Property tax liabilities are particularly difficult to measure accurately
because of varying assessment practices, property characteristics, and relief mechanisms. The
methodology used to derive the estimated tax burden for each tax is presented in the section
pertaining to that tax.

v
Findings
The main results of the study are presented in Table 5, page 15, and are also illustrated in
Chart 4 on pages 17-18. Looking at the combined tax burdens of each of the four taxes studied
the District of Columbia taxes its residents lower relative to neighboring jurisdictions at each
income level. At the $25,000/year income level, the five Virginia jurisdictions rank highest in the
combined tax burdens, with Alexandria’s burden being the highest. The same holds at the
$50,000 income level, although in this income category, Falls Church ranks first, with
Alexandria’s tax burden ranking second. At the $75,000 income level, Falls Church again has the
highest combined burden, and Montgomery County, Maryland, has the second highest burden.
At the $100,000 and $150,000 income levels, Falls Church, Virginia, and Montgomery County,
Maryland, again share the top ranks.
Individual Income Tax: The District’s individual income tax burden is lower than the
metropolitan average at all levels except at the $100,000 and $150,000 income levels, illustrating
the more progressive nature of its income tax structure. The District’s income tax burden ranges
from less than 0 percent (-$732) at the $25,000 income level to 4.77 percent ($7,158) at the
$150,000 income level, (see Table 6, page 16). Montgomery County and Prince George’s
County rank highest for all of the income categories except at $25,000/year. At the lowest
income level, the two Maryland counties have an Earned Income Tax Credit, as does D.C. At the
four higher income levels, the hypothetical families in these Maryland jurisdictions have a higher
income tax burden than D.C. and Northern Virginia because these two counties levy their own
income tax, in addition to the income tax levied by the state of Maryland.
Property Tax: The real property tax burden for District of Columbia residents falls
below the area-wide averages for homeowners at all income levels, a result of its lower property
tax rate and homestead deduction. For homeowners (those families earning $50,000 or more) the
tax burden ranges from 1.52 percent ($759) of income at the $50,000 income level to 2.31
percent ($3,472) at the $150,000 income level. For the District, the 2014 effective rate of $0.85
is applied to the assessed market value of a home, minus a $70,200 homestead deduction for
eligible homeowners. For homeowners at all income levels, Falls Church, Virginia, has the
highest property tax burden. In this study, those families earning $25,000/year are assumed to
rent instead of own, and based on the way that the property tax equivalent of rent is calculated
for the study, the property tax burden at this income level is assumed to be the same for all of the
metro jurisdictions. The high property tax equivalent of rent reflects the high cost of rental
housing in the metro region.
Sales and Use Tax: The District’s sales tax burden is higher than the metropolitan area
average at all income levels. The general sales tax rate in the District of Columbia is 5.75 percent
(lower than Maryland and Northern Virginia’s 6 percent general rates). However, because of a
multiple rate system in D.C. in which the District’s sales tax rates on restaurant meals, alcohol,
transient accommodations, and commercial parking services are higher than the general rate, the
total tax burden is more than 5.75 percent of total taxable sales.
Automotive Taxes: The District of Columbia automotive tax burden is lower than the
metropolitan area average at all income levels. Unlike Virginia localities, the District and
Maryland jurisdictions do not levy a personal property tax on automobiles. The combined state
and local registration fees in Virginia are comparable to the sole state rate in Maryland. The
highest registration fee in the metropolitan area is imposed in the District of Columbia, ranging

vi
from $72 for a vehicle weight under 3,500 pounds to $155 for vehicles of 5,000 pounds or more.
The District of Columbia gasoline tax rate of 23.5 cents per gallon at the end of 2014 is
the same rate as in Maryland and is higher than Virginia. Effective July 1, 2013, Virginia’s state
gasoline tax rate changed from 17.5 cents per gallon to 3.5 percent of the statewide average
wholesale price per gallon. In July 2014, this equated to 11.1 cents per gallon. Virginia
jurisdictions also levy a special 2.1 percent sales tax on gasoline.
See Map 1 (page 19) for an illustration of selected metro area jurisdiction’s combined tax
burdens (income, property, auto, and sales) as a percentage of income, for a family earning
$75,000/year. At all income levels, D.C. has the lowest combined tax burden of the surrounding
jurisdictions. For maps illustrating combined metro area burdens for the other income levels, see
Appendix A on page 63.
This report is organized in two sections. Part I presents the Washington, D.C.
Metropolitan Area tax burden comparisons; and Part II contains a comparison of tax rates across
the Washington, D.C. Metropolitan Area.

vii
Acknowledgments
Each year the Government of the District of Columbia, Office of the Chief Financial
Officer, Office of Revenue Analysis publishes Tax Rates and Tax Burdens: Washington
Metropolitan Area as required by D.C. Code 47-817. Taxpayers and government officials in the
District of Columbia have a significant interest in the relative tax position of the District
compared to the surrounding jurisdictions.
The Office of Revenue Analysis acknowledges and sincerely appreciates the time, effort,
and courtesy of officials in the Washington metropolitan area who cooperated in providing
information for this report. In order to properly compare tax rates and tax burdens, uniform and
reliable data must be utilized. Officials from the area jurisdictions provide the data included in
this report. Part I of this volume compares tax burdens for the 2014 tax year and Part II
compares tax rates effective as of January 1, 2015.
I would also like to thank Lori Metcalf, who prepared this document, and Bob Zuraski
and Farhad Niami, who offered editing assistance.
Questions and/or comments relating to this publication should be addressed to Lori
Metcalf, Fiscal Analyst, Office of Revenue Analysis, 1101 4th
Street, SW, Suite 770 West,
Washington, D.C. 20024, or call (202) 727-7775.
Fitzroy Lee,
Chief Economist &
Deputy Chief Financial Officer
December 2015

1
Part I
A Comparison of Tax Burdens in Selected Washington
Metropolitan Area Jurisdictions
2014

Part I: A Comparison of Tax Burdens in Selected Washington Metropolitan Area Jurisdictions
2014 Tax Rates and Tax Burdens – Washington Metropolitan Area
Page 2
Overview
There is a wide diversity in state and local tax systems in the United States. The fifty
states and the District of Columbia employ a broad range of taxes and fees to fund state and local
government operations. The combination of taxes and fees utilized by a particular jurisdiction is
dependent upon many factors, including its revenue needs, the local government tax base, the
fiscal relationships between the state and the local government, constitutional and legal
limitations on the powers of taxation, and the jurisdiction’s philosophy of government taxation.
The District’s tax structure includes taxes typically imposed by local governments, such
as real and personal property taxes, deed taxes, and others. At the same time, the District also
levies taxes usually associated with the state level of government, such as individual and
corporate income taxes, excise taxes, and motor vehicle related taxes. About two-thirds of the
District’s locally generated revenues come from taxes usually administered by a state.
The District is often compared to other cities, or states, independently, without taking into
account its unique situation of having to charge taxes that both a city and a state normally levy.
Therefore, the Office of Revenue Analysis produces a report comparing District tax burdens on a
hypothetical family to the combined state and local tax burdens the family would face if it lived
in the largest city in each state. As a companion to that nationwide study, the present study
compares the state and local tax burdens of a hypothetical family of three in the eight major
Washington metropolitan area jurisdictions: the District of Columbia; the Maryland counties of
Montgomery and Prince George's; the Virginia counties of Arlington and Fairfax; and the
Virginia cities of Alexandria, Fairfax, and Falls Church. Each jurisdiction provides its own level
of services and imposes various taxes to raise funds to pay for those services. The study does not
attempt to compare the level of services provided by each jurisdiction.
Further, this study defines the term ‘tax burden’ as the dollar amount of taxes owed if the
final incidence of each major tax examined (income, property, sales, and auto) is on the
individual.1 Similar to the assumptions in the nationwide study, the hypothetical family in this
study consists of two wage-earning spouses and one school-age child. Families with annual
gross income levels of $25,000, $50,000, $75,000, $100,000, and $150,000 for each jurisdiction
are analyzed. The wage and salary split is assumed to be 70-30 between the two spouses. All
other income is assumed to be split evenly.
The family at each income level over $25,000 is assumed to own a single family home
and to reside within the confines of the city or county. However, at the $25,000 income level,
the study assumes that the household renter-occupies and not owner-occupies its housing unit,
and owns one automobile. Families with annual income of $50,000 are presumed to own their
home and one automobile; and families with annual incomes of $75,000, $100,000 and $150,000
are assumed to own their own home and two automobiles. This study compares the tax burden
in each jurisdiction for the hypothetical family for four major tax categories: individual income
1 This approach differs from the use of the phrase ‘tax burden’ that may be more common in the field of economics, which includes an economic analysis of which group bears the ‘burden’ of a tax by ultimately having to pay it, also known as the ‘incidence’ of a tax.
Part I: A Comparison of Tax Burdens in Selected Washington Metropolitan Area Jurisdictions
2014 Tax Rates and Tax Burdens – Washington Metropolitan Area
Page 3
tax, real property tax, sales tax, and automobile-related taxes.
This study does not intend to measure the overall level of taxation in a jurisdiction;
rather, it attempts to measure a hypothetical tax burden for a family given the assumptions noted.
There is no single "best" way of measuring tax burdens. To estimate tax payments, the study
makes critical assumptions about typical households, their sources of income, and consumption
patterns. Property tax liabilities are particularly difficult to compare accurately because of
varying assessment practices, property characteristics, and relief mechanisms.
The methodology used to derive the estimated tax burden for each tax is presented in the
section pertaining to that tax. The methodology used in this report is best suited to provide a
relative comparison of tax burdens, within a single tax type and within a single year, across each
of the jurisdictions studied. Comparisons across the different types of taxes or across years
should be made with caution. As in past years, readers are advised not to compare the
hypothetical tax burdens across years; any number of small changes in the assumptions of the
study can result in misleading information under such comparisons. The purpose of the study
remains to compare tax burdens on a hypothetical household in different jurisdictions in a
specific year, and not over time.
The individual income tax rates, exemptions, and deductions in effect for calendar year
2014 in the District of Columbia, Maryland, and Virginia are shown in Table 1, on page 6. Table
5, page 15, presents detailed data on state and local tax burdens for each type of tax by income
level for each selected metropolitan area jurisdiction. The District's tax burden is compared with
the average for the metropolitan area at each income level for the four tax categories, separately
and combined, in Table 6, page 16.
Factors used in the housing value assumptions are detailed in the property tax section, and
the assumed housing values by income level for each jurisdiction are shown in Table 2, page 9.
The assumptions used to derive the automobile tax burdens are contained in Table 4, page
14. Finally, selected state and local tax rates in the Washington metropolitan area for fiscal year
2014 - 2015 are outlined in Table 7, page 20.

Part I: A Comparison of Tax Burdens in Selected Washington Metropolitan Area Jurisdictions
2014 Tax Rates and Tax Burdens – Washington Metropolitan Area
Page 4
Individual Income Tax
Income Tax Calculations
The income tax burden of a hypothetical family is estimated using the actual income tax
system in each jurisdiction and assumptions about the sources of income for families at different
income levels. The features of the individual income tax systems used in the Washington, D.C.
Metropolitan Area are presented in Table 1 (page 6).
The five income levels used in this study are divided between wage and salary income
and other types of income. The table below shows the wages and salaries, interest income and
capital gains for Washington, D.C. married filers who itemize deductions. The following data
have been updated from the previous year for all of the income categories using 2013 tax year
data from the IRS.
Gross
Income Wages and
Salaries Interest
Long-Term
Capital
Gains 1/
$25,000 Spouse 1
Spouse 2
$16,215
6,946
$411 $1,424
$50,000 Spouse 1
Spouse 2
$34,282
14,692
$416 $610
$75,000 Spouse 1
Spouse 2 $49,317
21,136
$568 $3,979
$100,000 Spouse 1
Spouse 2 $68,649
29,421
$551 $1,378
$150,000 Spouse 1
Spouse 2
$101,175
43,361
$714 $4,750
1/ Assumes a three-year holding period
Because the Federal Earned Income Tax credit (EITC) at the $25,000 income level in
some states will determine the state’s EITC, and because several states allow the deduction of all
or part of an individual's federal income tax liability in computing the state income tax, it is
necessary to compute the 2014 federal individual income tax at each income level using the
above assumptions. Many states in 2014 allowed taxpayers to begin their state income tax
computations with federal adjusted gross income (AGI) or federal taxable income. Other states
do not use either of these two measures of federal income as a starting point.
Total itemized deductions, which were also used in the federal tax computation, were
assumed to be equal to the following, where the deductions have been adjusted to reflect
Washington, D.C. Statistics of Income (SOI) income levels for tax year 2013.

Part I: A Comparison of Tax Burdens in Selected Washington Metropolitan Area Jurisdictions
2014 Tax Rates and Tax Burdens – Washington Metropolitan Area
Page 5
Gross Income Level
Deduction $ 25,000 $ 50,000 $ 75,000 $100,000 $150,000
Medical (Gross) 7,154 7,584 8,619 9,574 12,258
Nondeductible Medical 1/ -1,875 -3,750 -5,625 -7,500 -11,250
Net Medical Deduction 5,279 3,834 2,994 2,074 1,008
Deductible Taxes 2/ 2/ 2/ 2/ 2/
Mortgage Interest 3/ 3/ 3/ 3/ 3/
Contribution Deduction 2,462 3,359 4,726 4,441 4,048
Gross Miscellaneous 3,140 4,503 4,120 3,707 4,491
Nondeductible 4/ -500 -1,000 -1,500 -2,000 -3,000
Net Miscellaneous Deduction 2,640 3,503 2,620 1,707 1,491
Other Miscellaneous Deductions 287 164 325 225 123
Total Deductions-without taxes
And mortgage interest 10,670 10,862 10,667 8,448 6,671
1/ Nondeductible medical equal 7.5 percent of federal A.G.I. All or part of medical deductions may be allowed in
some states.
2/ The tax deduction varies from state to state and is based on real and personal property taxes computed in the
2014 study and individual income taxes computed in the 2013 study.
3/ Mortgage interest is based on 5th year interest paid on a home purchased in 2009 at an interest rate of 4.17%.
4/ Nondeductible miscellaneous deductions equal 2 percent of A.G.I.
The itemized deductions shown above are used in the calculation of the 2014 tax burdens.
The 2014 deductible real and personal property taxes computed in the current study are used for
the 2014 property tax deduction. For the 2014 state and local individual income tax deduction,
2013 data were used as a proxy. These figures were used in computing the 2014 federal income
tax burden.
Except at the $25,000 income level, the Maryland individual income tax tends to be less
progressive because the local tax rates are added to the state tax liability. The highest rate in
Maryland is 5.75 percent and is not reached until taxable income exceeds $250,000 for single
filers ($300,000 for joint filers). In addition, Maryland local tax rates in the Washington
Metropolitan Area range from 3.03 percent in Charles County, to 3.2 percent in Montgomery and
Prince George’s Counties. At the $25,000 income level, one-half of the federal earned income
credit is deducted from state tax liability. In contrast, Virginia's maximum 5.75 percent tax rate is
reached when taxable income exceeds $17,000 and 20 percent of the federal earned income
credit is deducted from Virginia’s tax liability; and the District's maximum rate of 8.95 percent is
not reached until the $350,000 taxable income level is exceeded. At the $25,000 income level,
40 percent of the federal earned income credit is deducted from the District’s tax liability.

Part I: A Comparison of Tax Burdens in Selected Washington Metropolitan Area Jurisdictions
2014 Tax Rates and Tax Burdens – Washington Metropolitan Area
Page 6
Table 1: Individual Income Tax Washington Metropolitan Area
January 1, 2014
PERSONAL EXEMPTIONS
EXEMPTIONS
TAXABLE
INCOME 5/
RATES
DISTRICT OF COLUMBIA
Single $1,725 $0 - $10,000
$10,001-$40,000
$40,001-$350,000
Over $350,000
4.0%
$ 400 + 6.00% of excess > $ 10,000
$ 2,200 + 8.50% of excess > $ 40,000
$28,550 + 8.95% of excess > $350,000
Married Filing Separately $1,725
Married Filing Jointly $3,450
Head of Household $3,450
Dependent (additional) $1,725
Blind (additional) $1,725
Age 65 and over (additional) $1,725
Standard Deduction 1/
MARYLAND 2/
Single $3,200 $0 - $1,000
$1,001-$2,000
$2,001-$3,000
$3,001-$150,000
$150,001-$175,000
$175,001-$225,000
$225,001-$300,000
Over $300,001
2.0%
$ 20 + 3.00% of excess > $1,000
$ 50 + 4.00% of excess > $2,000
$ 90 + 4.75% of excess > $3,000
$7,072.50 + 5% of excess > $150,000
$8,322.50 + 5.25% of excess > $175,000
$10,947.50 + 5.5% of excess > $225,000
$15,072.50 + 5.75% of excess> $300,000
Married Filing Separately $3,200
Married Filing Jointly $6,400
Head of Household $3,200
Dependent (additional) $3,200
Blind (additional) $1,000
Age 65 and over (additional) $1,000
Standard Deduction 3/
VIRGINIA
Single $ 930 $0 - $3,000
$3,001-$5,000
$5,001-$17,000
Over $17,000
2.0%
$ 60 + 3.00% of excess > $ 3,000
$ 120 + 5.00% of excess > $ 5,000
$ 720 + 5.75% of excess > $17,000
Married Filing Separately $ 930
Married Filing Jointly $1,860
Head of Household $ 930
Dependent (additional) $ 930
Blind (additional) $ 800
Age 65 and over (additional) $ 800
Standard Deduction 4/
Source: Survey of State Revenue Department Officials; State Web Sites.
1/ Married persons filing separately - $2,075; all others - $4,150.
2/ Maryland rates do not include local rates that may be as low as 1.25% in Worcester County and as much as 3.2% in Howard, Montgomery and
Prince George’s Counties. 3/ 15% of Maryland AGI not to exceed $2,000 ($4,000 for joint and head of household returns and those filing as qualifying widow(er) with
dependent child). The minimum is $1,500 for single, married filing separately and dependent taxpayers. All others are allowed a minimum of
$3,000. 4/ Single - $3,000; married persons filing separately - $3,000; and married persons filing jointly or combined separate - $6,000.
5/ Brackets and rates are for married filing jointly.
Part I: A Comparison of Tax Burdens in Selected Washington Metropolitan Area Jurisdictions
2014 Tax Rates and Tax Burdens – Washington Metropolitan Area
Page 7
Income Tax Burdens
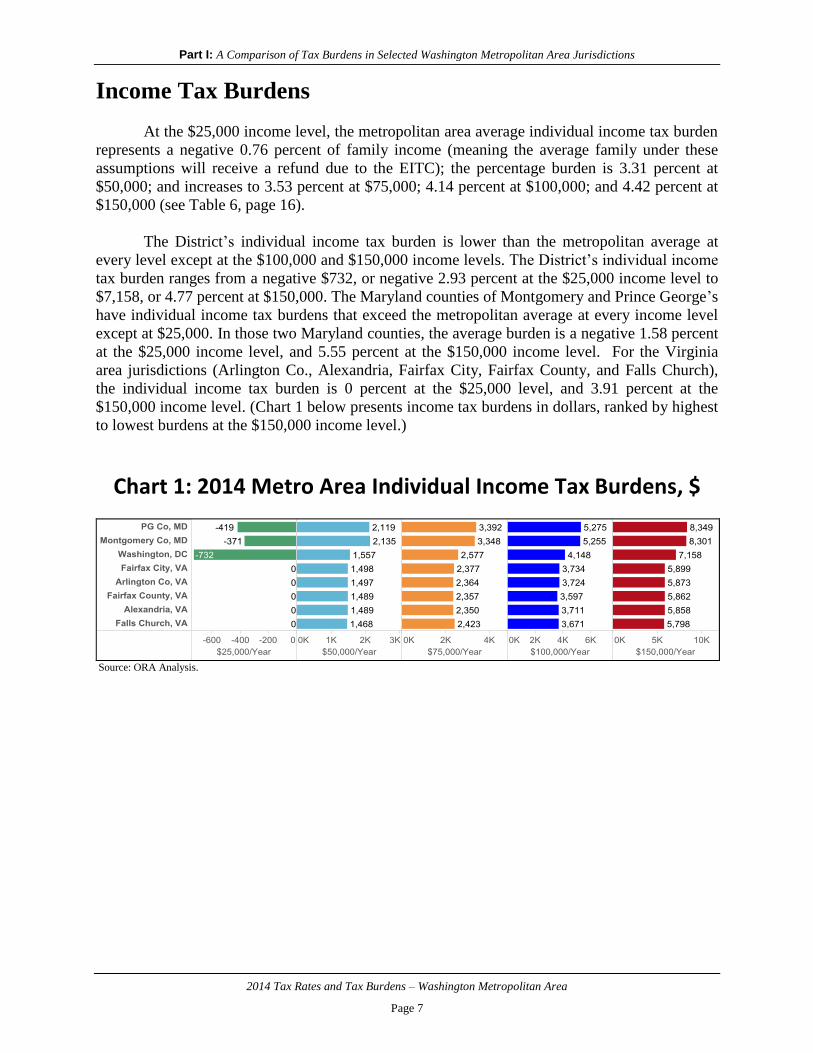
At the $25,000 income level, the metropolitan area average individual income tax burden
represents a negative 0.76 percent of family income (meaning the average family under these
assumptions will receive a refund due to the EITC); the percentage burden is 3.31 percent at
$50,000; and increases to 3.53 percent at $75,000; 4.14 percent at $100,000; and 4.42 percent at
$150,000 (see Table 6, page 16).
The District’s individual income tax burden is lower than the metropolitan average at
every level except at the $100,000 and $150,000 income levels. The District’s individual income
tax burden ranges from a negative $732, or negative 2.93 percent at the $25,000 income level to
$7,158, or 4.77 percent at $150,000. The Maryland counties of Montgomery and Prince George’s
have individual income tax burdens that exceed the metropolitan average at every income level
except at $25,000. In those two Maryland counties, the average burden is a negative 1.58 percent
at the $25,000 income level, and 5.55 percent at the $150,000 income level. For the Virginia
area jurisdictions (Arlington Co., Alexandria, Fairfax City, Fairfax County, and Falls Church),
the individual income tax burden is 0 percent at the $25,000 level, and 3.91 percent at the
$150,000 income level. (Chart 1 below presents income tax burdens in dollars, ranked by highest
to lowest burdens at the $150,000 income level.)
Chart 1: 2014 Metro Area Individual Income Tax Burdens, $
Source: ORA Analysis.

Part I: A Comparison of Tax Burdens in Selected Washington Metropolitan Area Jurisdictions
2014 Tax Rates and Tax Burdens – Washington Metropolitan Area
Page 8
Real Property Tax
Property Tax Calculations
Real property tax burdens in the metropolitan area are a function of residential real estate
values, the ratio of assessed value to market value, and the tax rate. The District allows a
homestead deduction from the value of residential property before the tax is calculated on owner-
occupied properties, while the Maryland and Virginia jurisdictions do not allow any deductions
for the typical homeowner.
The property tax rates for each of the metropolitan jurisdictions, presented in Chart 2,
page 10, indicate a variety of ranges in these rates. This information is based upon data received
from the various local government research agencies and/or local assessors. In addition to tax
rate differences, data presented in Table 2, page 9, show assumed market value differences of a
residence for purposes of this study at the different income levels. The $25,000 income level
families are assumed to reside in a rental unit and the $50,000, $75,000, $100,000 and $150,000
income families are assumed to live in an owner-occupied house. A series of assumptions and
calculations were made in order to estimate the median house value for the Washington, D.C.
metropolitan area for each income level used in the report.
Data for the area’s median house value and median income were retrieved from the
Census Bureau’s American Community Survey 2014. A linear multiplier was calculated by
dividing the area’s median house value by its median household income of mortgage holders.
This multiplier was used to scale the house values to the various income levels in the report (by
multiplying it by each income level). This assumption serves as an input for both the property tax
burden calculations and the mortgage interest deduction for the income tax burden. This method,
which was also used in the 2012 and 2013 studies, makes the assumption that house values
increase in a linear fashion with income.
A modification for this 2014 study is the use of median household income of mortgage
holders, rather than the median income of all households, in order to calculate the linear
multiplier. This change results in a lower multiplier, in general, which moderates the increase in
house values as incomes rise. This change generally leads to lower property tax burdens overall
than in the two previous years. However, any analysis should focus on the relative rankings
within a given year. Table 2 on the following page presents the metro area house value
assumptions used in this study.
The mortgage interest amount (for use as an itemized deduction in the income tax) in the
2014 study is derived by calculating an amortization schedule for the estimated value of a house
purchased in 2009 for each income level in each city.

Part I: A Comparison of Tax Burdens in Selected Washington Metropolitan Area Jurisdictions
2014 Tax Rates and Tax Burdens – Washington Metropolitan Area
Page 9
Table 2: Housing Value Assumptions For Major Washington Metropolitan Area Jurisdictions
Calendar Year 2014 1/
FAMILY
INCOME
DISTRICT OF COLUMBIA,
MONTGOMERY COUNTY, MD
PRINCE GEORGE’S COUNTY, MD
ALEXANDRIA, VA
ARLINGTON COUNTY, VA
FAIRFAX COUNTY, VA
FALLS CHURCH, VA
FAIRFAX CITY, VA
$ 50,000
$159,544
$ 75,000
$239,317
$100,000
$319,089
$150,000
$478,633
Source: ORA Analysis.
1/ For the $50,000 income levels and above, data on 2014 median household incomes for mortgage holders and median
house values for the Washington D.C., MSA were retrieved from the Census Bureau's ACS 2014. A multiplier was
then applied to each income based on the relationship of median income to median home value.
As stated previously, the hypothetical family at the $25,000 income level in this year’s
study is assumed to rent, rather than own a home. Given the high real estate values in the metro
area, the assumption that families earning $25,000 per year rent is likely more realistic than the
assumption that they own a home.
Because renters pay property tax indirectly through their rent, it was necessary to
compute a percentage of said rent constituting property taxes. States with property tax circuit
breaker programs estimate a “property tax rent equivalent” in order to calculate the amount that
renters are paying in property taxes. On average, states assume that about 20 percent of rent
goes toward paying property taxes. The property tax equivalent of rent in each city was first
calculated by obtaining data on median rents for the Washington, D.C., MSA from the U.S.
Department of Housing and Urban Development.2
2 U.S. Department of Housing and Urban Development, “2014 50th Percentile Rent Estimates.” Data for studio apartments used.

Part I: A Comparison of Tax Burdens in Selected Washington Metropolitan Area Jurisdictions
2014 Tax Rates and Tax Burdens – Washington Metropolitan Area
Page 10
Chart 2: Nominal Property Tax Rates (Per $100 of Assessed Value)
For Select Jurisdictions in the Metro Area
Source: Survey of local revenue officials and local government web sites.
Property Tax Burdens
Real property tax burdens for District of Columbia residents fall below the area wide
averages at all income levels, except at the $25,000 income level (tax burdens at this level are
assumed to be the same across the region). The real property tax burdens reflect differences
among the metropolitan area jurisdictions in both real property tax rates and property tax relief
provisions. The metropolitan area average burden for the real property tax is 2.96 percent of
income at the $50,000 income level; 3.23 percent at the $75,000 level; 3.27 percent at the
$100,000 level; and 3.32 percent at the $150,000 level (Table 6, page 16). Chart 3 on the
following page presents property tax burdens in dollars, by income level, for each jurisdiction.
Multiplying the nominal real estate tax rate for each jurisdiction by its announced or
statutorily prescribed assessment level derived the effective property tax rates (these effective tax
rates do not include homestead, or other deductions or exemptions). The effective property tax
rate is then multiplied by the housing values to determine the real property tax due at each
income level for each jurisdiction.
For the District of Columbia, the effective tax rate of $0.85 per $100 of assessed value is
applied to the assessed market value of the home, less $70,200 for the 2014 homestead
exemption. Therefore, the owner/occupant, with $50,000 in income would pay tax on $89,344
of value; on $169,117 at the $75,000 income level; on $248,889 of value at the $100,000 income
level; and on $408,433 at the $150,000 income level (each of these amounts represents the
median house value at that income level, minus $70,200 for the homestead deduction).
Because Virginia's property tax relief program is targeted toward the elderly (age 65 or

Part I: A Comparison of Tax Burdens in Selected Washington Metropolitan Area Jurisdictions
2014 Tax Rates and Tax Burdens – Washington Metropolitan Area
Page 11
older), and to persons permanently and totally disabled whose incomes do not exceed $72,000,
no adjustments are made in the property tax burdens for the hypothetical family of three in the
Virginia jurisdictions.
In calculating the real property tax burdens in the Maryland jurisdictions, $1.10 per $100
of value in Montgomery County and $1.072 per $100 of value in Prince George’s County were
used. These rates include the countywide rate, plus the state rate ($0.112 per $100 of value), but
do not include all special taxing district rates that are presented in Table 12 (page 40).
Chart 3: 2014 Metro Area Real Property Tax Burdens, $
Source: ORA Analysis.
Sales Tax
Sales Tax Calculations
The sales tax burdens differ among the jurisdictions because different items are included
under the general sales tax. Sales tax rates for the metropolitan area for calendar year 2014 are
presented below.
Table 3: Selected Sales Tax Rates
JURISDICTION
GENERAL
RATE
GROCERIES
RESTAURANT
MEALS
ALCOHOLIC
BEVERAGES
DISTRICT OF COLUMBIA
5.75%
Exempt
10.0%
10.0%
MARYLAND
6.0%
Exempt
6.0%
9.0%
VIRGINIA
6.0% 1/
2.5% 1/
6.0%-9.0%
6.0%-7.5%
1/ Combined local and state rate.
The estimated sales tax burdens for hypothetical households at each of the five income
levels are reported in Table 5, page 15. These burdens are derived from data supplied by the
District of Columbia, Maryland, and Virginia. Tax officials in each area completed a survey

Part I: A Comparison of Tax Burdens in Selected Washington Metropolitan Area Jurisdictions
2014 Tax Rates and Tax Burdens – Washington Metropolitan Area
Page 12
detailing the taxable status and the applicable sales tax rate of a listing of expenditure items.
These items represent average consumption expenditures as determined by the U.S. Department
of Labor.
Maryland has the highest general sales tax rate in the area, with a 6.0 percent general rate.
However, factoring in local rates for the jurisdictions in this study, Virginia ties with Maryland
as its combined state and local general sales tax rate is 6.0 percent. The District lowered its
general sales tax rate from 6.0 to 5.75 percent at the end of 2013, but has higher rates for
alcoholic beverages, restaurant meals, parking, and hotel rooms, than do Maryland and Virginia.
The District, like Maryland, exempts all non-snack food purchased in grocery stores from the
general sales tax. Virginia levies a 2.5 percent sales tax on all food purchased in grocery stores.
Residential usage of utilities is not in the general sales and use tax base in the District and
the State of Maryland. However, Montgomery and Prince George's Counties do tax the use of
utilities through a utility tax. While Montgomery County's energy tax is levied upon the
distributor, its cost is effectively borne by the customer. Prince George's County sets the tax
rates annually based on a formula driven by total consumption and revenue for each type of
energy in prior years.
Sales Tax Burdens
The District’s sales tax burden is higher than the metropolitan area average at all income
levels. As noted above, the general sales tax rate in the District of Columbia is 5.75 percent
(lower than Maryland and Northern Virginia’s 6 percent general rates). However, because of a
multiple rate system in D.C. in which the District’s sales tax rates on restaurant meals, alcohol,
transient accommodations, and commercial parking services are higher than the general rate, the
total tax burden is more than 5.75 percent of total taxable sales.
Sales tax burdens at each income level are the same in Alexandria, Arlington, Fairfax
City, and Falls Church, and also represent the second highest burdens behind the District. Fairfax
County, Virginia, has sales tax burdens that are slightly lower than its Virginia neighbors at each
income level, though still higher than those in Maryland. Montgomery and Prince George’s
County in Maryland have the same sales tax burdens at each income level and are the lowest in
this study.
Automobile Tax
Auto Tax Calculations
The taxes related to ownership of automobiles include the gasoline tax, motor vehicle
registration fees, and, where applicable, personal property taxes. The assumptions used to
calculate the automobile tax burdens are shown in Table 4, page 14.
Virginia localities are the only area jurisdictions that levy a personal property tax on
automobiles. The personal property tax rates for the seven Virginia jurisdictions included in this
study vary from $3.70 to $5.00 per $100 of value and are presented in Table 7 (page 20). Since
Part I: A Comparison of Tax Burdens in Selected Washington Metropolitan Area Jurisdictions
2014 Tax Rates and Tax Burdens – Washington Metropolitan Area
Page 13
1999, the Commonwealth of Virginia has reimbursed all localities in Virginia for the vehicle
portion of the Personal Property Tax as part of the Personal Property Tax Relief (PPTRA). From
2002 to 2005, the reimbursement amount was 70 percent of the first $20,000 of a vehicle’s
assessed tax bill. Beginning in 2007, Virginia began to reimburse localities a fixed amount
based on the 2004 level of state reimbursement. Unless the General Assembly provides
additional funding, that reimbursement is not expected to increase, and with no increases, it will
cover a gradually decreasing portion of the tax on vehicles. For 2014, the reimbursement to
Alexandria covered 61 percent of the tax bill. In Arlington County, vehicles that are valued at
$3,000 or less, and are PPTR eligible, have no tax liability and pay only an annual decal fee. In
Fairfax County, the resident’s tax bill is reduced by 62 percent of the first $20,000 of assessed
value in calendar year 2014.
The basis for assessing the tax also differs among the Virginia area jurisdictions.
Alexandria, Fairfax County, and Prince William County use the trade-in value; the clean loan
value is used in Arlington and Loudoun Counties. For both methods, however, values are
obtained from the January 2014 National Automobile Dealers Association Used Car Pricing
Guide, Eastern Division.
The District of Columbia’s registration fee is the highest in the metropolitan area. In the
District, the fee for a vehicle weighing less than 3,500 pounds (Class I) is $72; for vehicles
weighing 3,501 pounds to 4,999 pounds (Class II), the District imposes a fee of $115; for
vehicles 5,000 pounds and over (Class III), the fee is $155; and for Class IV, clean fuel or
electric vehicle, the fee is $36 (See Table 11, page 36). For tax year 2014, Maryland’s fees are
slightly lower than the District’s; the fee for vehicles less than 3,700 pounds is $135.00 for two
years ($67.50 for one year), and for vehicles over $3,700 pounds it is $187.00 for two years
($93.50 for 1 year).
The District of Columbia gasoline tax rate of 23.5 cents per gallon at the end of 2014 is
the same rate as in Maryland and is higher than Virginia. Effective July 1, 2013, Virginia’s state
gasoline tax rate changed from 17.5 cents per gallon to 3.5 percent of the statewide average
wholesale price per gallon. In July 2014, this equated to 11.1 cents per gallon. There is also a
special 2.1 percent sales tax levied by all the Northern Virginia jurisdictions.

Part I: A Comparison of Tax Burdens in Selected Washington Metropolitan Area Jurisdictions
2014 Tax Rates and Tax Burdens – Washington Metropolitan Area
Page 14
Table 4: Automobile Tax Assumptions, 2014
Market
Values
Estimated
Estimated
Engine Mileage Annual
Income Size Retail Trade-In Loan Per Gasoline
Level Description Of
Auto
Liters
1/
Weight
2/
Year Price 2/ Value 2/ Value 2/ Gallon 1/ Usage 3/
$ 25,000 Sedan, 4 Door 2.0 2,875 lbs 2011 $11,350 $9,050 $10,215 24 625 gallons
4 cylinder, Manual
$ 50,000 Sedan, 4 Door 2.0 2,804 lbs 2011 $11,800 $9,600 $10,620 24 625 gallons
4 Cylinder, Manual
$ 75,000 Sedan, 4 Door 2.5 3,190 lbs 2012 $17,475 $14,825 $15,728 25 600 gallons
4 Cylinder, Automatic
4WD Utility, 4 Door 3.3 3,935 lbs 2006 $12,875 $10,125 $11,588 18 417 gallons*
6 Cylinder, Automatic
$100,000 Sedan, 4 Door 3.6 4,026 lbs 2012 $20,175 $17,300 $18,158 17 882 gallons
6 Cylinder, Automatic
4WD Utility, 4 Door 4.0 4,615 lbs 2007 $12,775 $8,875 $11,497 15 500 gallons*
6 Cylinder, Automatic
$150,000 Sedan, 4 Door 6.2
4,220 lbs 2013 $46,925 $42,800 $42,233 14
1,071
gallons
6 Cylinder, Automatic
AWD Utility, 4 Door 3.5 4,288 lbs 2010 $17,675 $15,000 $15,908 15 441 gallons*
6 Cylinder, Automatic
1/ Gas Mileage Guide, EPA fuel economy estimates for city driving, U.S. Department of Energy. http://www.fueleconomy.gov/.
2/ National Automobile Dealers Association Used Car Guide. http://www.nadaguides.com.
3/ Assumes 15,000 miles driven for primary car; 7,500 for secondary car (denoted with an asterisk).
Auto Tax Burdens
Virginia localities had the highest auto tax burdens at all income levels, with Alexandria
ranking highest. At the $25,000 and $50,000 income levels, Montgomery and Prince George’s
Counties in Maryland had the lowest auto tax burden (at $214), only $5.00 lower than the
District (at $219). At $75,000, the District’s auto tax burden was of $426 was $52 higher than the
Maryland counties’ burden of $374. The District and Maryland jurisdictions do not levy a
personal property tax on automobiles, as in Virginia localities.

Part I: A Comparison of Tax Burdens in Selected Washington Metropolitan Area Jurisdictions
2014 Tax Rates and Tax Burdens – Washington Metropolitan Area
Page 15
Table 5: Major 2014 State & Local Tax Burdens for a Family of Three In Selected Washington Metro Area Jurisdictions
CALENDAR YEAR 2013
TAX
DISTRICT
OF
COLUMBIA
MONTGOMERY
COUNTY
PRINCE
GEORGE’S
COUNTY
ALEXANDRIA
ARLINGTON
COUNTY
FAIRFAX
COUNTY
FAIRFAX
CITY
FALLS
CHURCH
$25,000 INCOME LEVEL
Income 1/ (732) (371) (419) 0 0 0 0 0
Real Estate 3,053 3,053 3,053 3,053 3,053 3,053 3,053 3,053
Sales and Use 749 497 497 645 645 560 645 645
Automobile 219 214 214 432 370 313 298 383
TOTAL 3,289 3,393 3,345 4,130 4,068 3,926 3,996 4,081
RANK 8 6 7 1 3 5 4 2
$50,000 INCOME LEVEL
Income 1,557 2,135 2,119 1,489 1,497 1,489 1,498 1,468
Real Estate 759 1,033 1,230 1,664 1,589 1,819 1,659 2,082
Sales and Use 946 603 603 777 777 669 777 777
Automobile 219 214 214 448 390 322 306 397
TOTAL 3,481 3,985 4,166 4,378 4,253 4,299 4,240 4,724
RANK 8 7 6 2 4 3 5 1
$75,000 INCOME LEVEL
Income 2,577 3,348 3,392 2,350 2,364 2,357 2,377 2,423
Real Estate 1,437 2,630 2,085 2,496 2,384 2,728 2,489 3,123
Sales and Use 1,115 707 707 909 909 767 909 909
Automobile 426 374 374 1,042 953 714 672 909
TOTAL 5,555 7,059 6,558 6,797 6,610 6,566 6,447 7,364
RANK 8 2 6 3 4 5 7 1
$100,000 INCOME LEVEL
Income 4,148 5,255 5,275 3,711 3,724 3,597 3,734 3,671
Real Estate 2,116 3,507 2,941 3,328 3,178 3,638 3,319 4,164
Sales and Use 1,291 846 846 1,066 1,066 911 1,066 1,066
Automobile 555 512 512 1,137 1,055 803 749 997
TOTAL 8,110 10,120 9,574 9,242 9,023 8,949 8,868 9,898
RANK 8 1 3 4 5 6 7 2
$150,000 INCOME LEVEL
Income 7,158 8,301 8,349 5,858 5,873 5,862 5,899 5,798
Real Estate 3,472 5,260 4,651 4,992 4,767 5,456 4,978 6,246
Sales and Use 1,588 1,056 1,056 1,272 1,272 1,097 1,272 1,272
Automobile 529 486 486 2,532 2,494 1,984 1,815 2,309
TOTAL 12,747 15,103 14,542 14,654 14,406 14,399 13,964 15,625
RANK 8 2 4 3 5 6 7 1
Source: ORA Analysis. Note: Numbers may not add to totals due to rounding.
1/ Negative numbers result from a refundable Earned Income Tax Credit.

Part I: A Comparison of Tax Burdens in Selected Washington Metropolitan Area Jurisdictions
2014 Tax Rates and Tax Burdens – Washington Metropolitan Area
Page 16
Table 6: Summary of Average Major Tax Burdens for Selected Washington Metropolitan Area Jurisdictions and D.C., Calendar Year 2014
INCOME
TAX BURDENS PERCENT OF INCOME
AREA
AVERAGE 1/
$
DISTRICT
OF
COLUMBIA
$
AREA
AVERAGE 1/
%
DISTRICT
OF
COLUMBIA
%
OVERALL BURDEN
$ 25,000 $3,778 $3,289 15.11% 13.16%
$ 50,000 4,191 3,481 8.38% 6.96%
$ 75,000 6,620 5,555 8.83% 7.41%
$100,000 9,223 8,110 9.22% 8.11%
$150,000 14,430 12,747 9.62% 8.50%
INDIVIDUAL INCOME
$ 25,000 (190) (732) (0.76) (2.93)
$ 50,000 1,657 1,557 3.31 3.11
$ 75,000 2,649 2,577 3.53 3.44
$100,000 4,139 4,148 4.14 4.15
$150,000 6,637 7,158 4.42 4.77
PROPERTY
$ 25,000 3,053 3,053 12.21 12.21
$ 50,000 1,480 759 2.96 1.52
$ 75,000 2,422 1,437 3.23 1.92
$100,000 3,274 2,116 3.27 2.12
$150,000 4,978 3,472 3.32 2.31
SALES AND USE
$ 25,000 610 749 2.44 2.99
$ 50,000 741 946 1.48 1.89
$ 75,000 866 1,115 1.16 1.49
$100,000 1,020 1,291 1.02 1.29
$150,000 1,235 1,588 0.82 1.06
AUTOMOBILE
$ 25,000 305 219 1.22 0.88
$ 50,000 314 219 0.63 0.44
$ 75,000 683 426 0.91 0.57
$100,000 790 555 0.79 0.55
$150,000 1,580 529 1.05 0.35
Source: ORA Analysis.
Note: Numbers may not add to totals due to rounding.
1/ Negative numbers result from a refundable Earned Income Tax Credit.

Part I: A Comparison of Tax Burdens in Selected Washington Metropolitan Area Jurisdictions
2014 Tax Rates and Tax Burdens – Washington Metropolitan Area
Page 17
Chart 4: 2014 Estimated Burdens of Major Taxes For Five Hypothetical Families
Income = $25,000/Year
Income = $50,000/Year
Income = $75,000/Year
Legend:
0
0
0
0
0

Part I: A Comparison of Tax Burdens in Selected Washington Metropolitan Area Jurisdictions
2014 Tax Rates and Tax Burdens – Washington Metropolitan Area
Page 18
Chart 4: 2014 Estimated Burdens of Major Taxes For Five Hypothetical Families, Continued
Income = $100,000/Year
Income = $150,000/Year
Source: ORA Analysis.
Legend:

Part I: A Comparison of Tax Burdens in Selected Washington Metropolitan Area Jurisdictions
2014 Tax Rates and Tax Burdens – Washington Metropolitan Area
Page 19
Map 1: Total 2014 Metro Area Combined Tax Burden as a % of Income (Income, Property, Sales, & Auto Taxes)
(Family Earning $75,000/Year)
Source: ORA Analysis. The lighter the green in the map, the lower the tax burden as a percentage of income.
DC
Montgomery County
Fairfax County
Fairfax City
Alexandria
Falls Church
Arlington Prince George’s County

Part I: A Comparison of Tax Burdens in Selected Washington Metropolitan Area Jurisdictions
2014 Tax Rates and Tax Burdens – Washington Metropolitan Area
Page 20
TABLE 7: SELECTED STATE AND LOCAL TAX RATES IN THE D.C. METRO AREA, FY 2014 - 2015
TAX
DISTRICT
OF
COLUMBIA
CHARLES
COUNTY
1/
MONT-
GOMERY
COUNTY 1/
PRINCE
GEORGE’S
COUNTY 1/
ALEX-
ANDRIA
ARLING-
TON
COUNTY
FAIR-
FAX
CO.
FALLS
CHURCH
LOU-
DOUN
CO.
PRINCE
WILLIAM
CO
FAIRFAX
CITY
PROPERTY
Nominal Rate
(/$100 of value) $0.850 $1.317 $1.10 $1.072 $1.043 $0.996 $1.114 $1.305 $1.155 $1.2212 $1.04
Assessment
Level 100.0% 100.0% 100.0% 100.0% 100.0% 100.0% 100.0% 100.0% 100.0% 100.0% 100.0%
Effective Rate
(per $100 of
value) 2/
$0.850
3/ $1.317 $1.10 $1.072 $1.043 $0.996 $1.114 $1.305 $1.155 $1.2212
$1.04
SALES AND USE
General Rate
5.75% 6.0% 6.0% 6.0%
6.0%
4/
6.0%
4/
6.0%
4/
6.0%
4/
6.0%
4/
6.0%
4/
6.0%
4/
INDIVIDUAL
INCOME
(State Rates)
4.0% - 8.95%
(Total)
2% -5.75%
2% -5.75%
2% -5.75%
2% - 5.75%
2% - 5.75%
2% -
5.75%
2% - 5.75%
2% -
5.75%
2% - 5.75%
2% - 5.75%
(Local Rates) 3.03% 3.2% 3.2% 0% 0% 0% 0% 0% 0% 0%
PERSONAL
PROPERTY 5/
(per $100 of
value)
$3.40
6/
$3.0125
$2.468
$2.40
$5.00
7/
$5.00
7/
$4.57
7/
$4.84
7/
$4.20
7/
$3.70
7/
$4.13
AUTO REGISTRATION
3,499 lbs. Or less $72.00
8/
$67.50 $67.50 $67.50 $73.75
9/
$73.75
9/
$73.75
9/
$73.75
9/
$65.75
9/
$64.75
9/
$73.00
9/
3,500 –4,000 lbs.
$115.00 $67.50/$93.
50
$67.50/$93.50
$67.50/$93.5
0
$73.75
9/
$73.75
9/
$73.75
9/
$73.75
9/
$65.75
9/
$64.75
9/
$73.00
9/
4,001– 4,999 lbs. $115.00 $93.50 $93.50 $93.50 $78.75
9/
$78.75
9/
$83.75
9/
$90.75
9/
$70.75
9/
$69.75
9/
$78.75
9/
Over 4,999 lbs. $155.00 $93.50 $93.50 $93.50 $78.75
9/
$78.75
9/
$83.75
9/
$90.75
9/
$70.75
9/
$69.75
9/
$78.75
9/
GASOLINE TAX
(Cents/ Gallon) 23.5 23.5 23.5 23.5 10/ 10/ 10/ 10/ 10/ 10/ 10/
Source: Survey of local government officials and local government web sites. 1/ Real estate rates shown include the Maryland state real property tax rate of 11.2 cents per $100 of assessed value. 2 year auto registration is $135 up to
3,700 lbs, and $187 over 3,700 lbs.
2/ Effective tax rates listed here are net of assessment value and do not reflect any exemptions or credits.
3/ There is a $70,200 homestead exemption for property that is owner-occupied. The exemption amount increased to $71,400 on October, 1, 2014 (effective for
D.C.'s Real Property Tax Year 2015).
4/ State rate is 5% and local rate is 1%.
5/ Effective rate per $100. Applicable to private autos in Northern Virginia jurisdictions. Also, boats, trailers and motorcycles.
6/ First $225,000 of value is exempt from tax.
7/ NADA Used Car Guide trade-in value used as basis for assessing the tax. Fairfax City, and Arlington, Fairfax, and Loudon Counties use the NADA Used Car
Guide clean trade-in value as basis for assessing tax.
8/ Class IV, clean fuel or electric vehicle, the fee is $36.
9/ Includes $40.75 state registration fee for vehicles 4,000 pounds or less; $45.75 for vehicles over 4,000 pounds; and $28.75 for cycles.
10/ 3.5% of the statewide average wholesale price/gallon. In July 2014, the price in VA was 11.1 cents/gallon. There is also a 2.1 percent sales tax on the total sales price.

2014 Tax Rates and Tax Burdens – Washington Metropolitan Area
Page 21
Part II
A Comparison of Tax Rates in the Washington Metropolitan
Area as of January 1, 2015

Part II: A Comparison of Tax Rates in the Washington Metropolitan Area as of January 1, 2015
2014 Tax Rates and Tax Burdens – Washington Metropolitan Area
Page 22
ALCOHOLIC BEVERAGE TAX
District of Columbia
The tax is imposed on all alcoholic beverages manufactured by a holder of a
manufacturer’s license and on all alcoholic beverages brought into the District by the holder of a
wholesaler’s or retailer's license.
Maryland
The tax is imposed on all alcoholic beverages sold by manufacturers and wholesalers to
retail dealers and sold by out-of-state dealers to wholesalers. The tax also applies to seized
liquors.
Virginia
The tax is imposed on the sale of all alcoholic beverages in Virginia. Persons who have a
mixed beverage carrier license are subject to tax on mixed drinks sold.
ITEMS
DISTRICT OF
COLUMBIA 1/
MARYLAND 1/
VIRGINIA 2/
Beer (per barrel)
$2.79
$2.79
$8.06
Spirits (per gallon)
1.50
1.50
20%
of retail price
Wine (per gallon)
14% or less alcohol
More than 14% alcohol
.30
.40
.40
.40
1.51 3/
1.51 3/
Champagne and Sparkling
Wine (per gallon)
.45
.40
1.51 3/
Source: Survey of local government officials and local government web sites.
1/ An additional 10% sales tax applies in DC, and an additional 9% sales tax applies in MD.
2/ Sales at ABC Stores are subject to the 5.0 percent sales tax rate in addition to the rate below.
3/ An additional state tax of 4 percent of the price charged is imposed on wine sold to persons other than licensees.

Part II: A Comparison of Tax Rates in the Washington Metropolitan Area as of January 1, 2015
2014 Tax Rates and Tax Burdens – Washington Metropolitan Area
Page 23
CIGARETTE TAX
District of Columbia
The District's cigarette tax is imposed on the sale or possession of all cigarettes in the
District. Exemptions from the tax are as follows: (1) cigarette sales to or by the federal or
District governments; (2) possession of cigarettes by licensed wholesalers for sale outside the
District or to licensed wholesalers; (3) possession of cigarettes bearing stamps of other
jurisdictions by vending machine operators who are licensed in the other jurisdictions; (4)
possession by a consumer of up to 200 cigarettes which were transported into or manufactured in
the District by the consumer; and (5) possession of cigarettes being transported under conditions
such that the cigarettes are not deemed to be contraband.
Maryland
The Maryland tax is imposed on all cigarettes possessed or held in the state by any
person. Cigarettes for sale to Army, Air Force, Navy, or Coast Guard exchanges or
commissaries are exempt.
Virginia
The Virginia tax is imposed upon the sale, storage or receipt of cigarettes for purposes of
distribution within the state. In addition to the state tax, certain Virginia localities impose a
cigarette tax. An exemption from taxation is provided for the free distribution of sample
cigarettes in packages containing five or fewer cigarettes and for cigarettes customarily donated
by manufacturers to cigarette factory employees (where such cigarettes are not subject to federal
taxation).
RATE PER 20 CIGARETTES
JURISDICTION STATE LOCAL COMBINED RATE
District of Columbia $2.90 ---- $2.90
Maryland $2.00 ---- $2.00
Virginia $0.30 ---- ----
Alexandria $1.00 $1.30
Arlington County $0.30 $0.60
Fairfax $0.85 $1.15
Fairfax County $0.30 $0.60
Falls Church $0.75 $1.05
Prince William County $0.00 $0.30 Source: Survey of local government officials and local government web sites.
Part II: A Comparison of Tax Rates in the Washington Metropolitan Area as of January 1, 2015
2014 Tax Rates and Tax Burdens – Washington Metropolitan Area
Page 24
FINANCIAL INSTITUTION TAXES
District of Columbia
Financial institutions are subject to the corporate franchise tax. The tax is imposed at a
rate of 9.5 percent of taxable income. In addition, there is a total surtax of 5 percent, for a total
effective rate of 9.975 percent. Financial institutions also are subject to both the personal and
real property taxes.
Maryland
In the past, Maryland imposed a franchise tax on the net earnings of financial institutions
in lieu of the Maryland Corporate Income Tax. Financial institutions formerly subject to the
financial institution franchise tax are now subject to the corporate income tax, with special
apportionment rules based on a three-factor formula of property, payroll, and receipts. Financial
institutions are not subject to personal property taxes except on property leased to others.
Virginia
The Commonwealth of Virginia imposes a tax on the net taxable capital of banks and
trust companies at the rate of $1 per $100 of net capital, with a prorated schedule for new banks.
Net capital is determined in two steps. First, capital, surplus, and undivided profits of the
institution are added. Next, the following are subtracted from this amount: the assessed value of
real estate; the book value of tangible personal property; the pro rata share of government
obligations; the capital accounts of any bank subsidiaries; the amount of any reserve for loan
losses allowed by the Internal Revenue Service for income tax purposes (which amount is
included in the definition of capital, surplus and undivided profits); and the amount of any
reserve for marketable securities valuation that is included in capital, surplus and undivided
profits to the extent that such reserve reflects the difference between the book value and the
market value of such marketable securities.
Virginia has authorized its cities and counties to levy a tax not to exceed 80 percent of the
state rate. The counties of Arlington, Fairfax, Loudoun, and Prince William, and the cities of
Alexandria, Fairfax, and Falls Church levy the maximum of 80 cents per $100 of net capital.
The local tax is not in addition to the state tax, but rather creates a redistribution of 80 percent of
the state tax to the localities.
Part II: A Comparison of Tax Rates in the Washington Metropolitan Area as of January 1, 2015
2014 Tax Rates and Tax Burdens – Washington Metropolitan Area
Page 25
INCOME TAXES
CORPORATE FRANCHISE
District of Columbia
Foreign and domestic corporations and financial institutions engaging in a trade or
business within the District or receiving income from District sources are subject to tax at a rate
of 9.5 percent on their taxable income. In addition, a total surtax of 5.0 percent is charged, for a
total effective rate of 9.975 percent. The minimum franchise tax is $250.
Businesses that do not operate entirely within the District and/or receive income from
sources not entirely within the District must allocate or apportion their income in accordance
with general allocation or apportionment rules and regulations. Apportionment is based upon an
equally weighted three-factor formula (sales, payroll, and property). Special formulas are
applied to businesses where the three-factor formula does not fairly represent the corporation's
business within the District.
Federal conformity is maintained pursuant to Public Law 105-100.
Maryland
In Maryland a tax is imposed upon the net income of corporations and financial
institutions at the rate of 8.25 percent.
The net income of a corporation is allocated as detailed in state rules and regulations, and
that portion of the business income of the corporation allocable to Maryland is determined in
accordance with a three-factor formula based on property, payroll, and double-weighted sales.
Virginia
A tax of 6 percent is imposed on the Virginia taxable income of corporations.
Professional corporations are also subject to the tax. Corporations having income from business
activity taxable both within and outside of Virginia must allocate and apportion their Virginia
taxable income as detailed by state rules and regulations. Multi-state corporate income is
apportioned to Virginia by an equally weighted formula based on property, payroll, and sales.

Part II: A Comparison of Tax Rates in the Washington Metropolitan Area as of January 1, 2015
2014 Tax Rates and Tax Burdens – Washington Metropolitan Area
Page 26
INCOME TAXES
INDIVIDUAL INCOME
District of Columbia
Individuals who maintain a permanent home in the District at any time during the taxable
year, or who maintain a place of residence for an accumulative total of 183 days or more, are
subject to the individual income tax. Nonresidents who are employed in the District are not
liable for the tax.
Because the District of Columbia selectively conforms to federal provisions, legislative
action is required whenever federal law changes with respect to federal individual income
taxation. The latest conformity legislation is Public Law 105-100.
A credit to relieve property tax burdens is provided under the D.C. income tax law. This
credit authorizes qualified homeowners and renters to claim a credit against their income tax
liability, or a refund if no tax is due, for a portion of property taxes or rent paid when these
payments exceed a certain percentage of household income. Renters use 20 percent of rent paid
as a property tax equivalency figure. To qualify for the credit or refund, the homeowner or renter
must have lived in the District during the entire taxable year, and the household income cannot
exceed $40,000. The maximum real property tax credit is $1,000.
Other personal income tax credits are those for: individual income taxes required to be
paid to another state on income derived from sources outside the District and child and
dependent care (32 percent of federal credit for full-year residents, or qualified expenses divided
by number of months on returns filed for less than calendar year or fiscal year).
In addition, the District instituted an earned income tax credit. For tax years 2013 and
2014, this credit is 40 percent of the federal credit.
The District exempts all income of U.S. Senators, Representatives, Presidential
Appointees, and Supreme Court Justices, provided such officials primary residence is not in the
District. Also exempted is the income of personal staff and employees of members of Congress
who remain bona fide residents of the congressperson's home state. Presidential appointees, to
be exempt, must be subject to approval by the Senate and serve at the pleasure of the President.
However, appointees are not exempt if they live in the District on the last day of the taxable year,
even though they meet the other conditions. Congressional staff members are not exempt if their
salaries are paid from committee funds.
Maryland
Persons who are Maryland residents on the last day of the tax year, or who have lived in
the state for at least six months, are subject to the individual income tax. In addition,
nonresidents are taxed on income earned in Maryland. Maryland's income tax law with regard to
income and deductions conforms closely to that of the federal government. Individuals carrying
on business in a partnership are responsible for the tax only on their individual positions, that is,

Part II: A Comparison of Tax Rates in the Washington Metropolitan Area as of January 1, 2015
2014 Tax Rates and Tax Burdens – Washington Metropolitan Area
Page 27
no tax is assessed on the partnership entity.
In addition to the state individual income tax, Charles, Montgomery, Prince George's, and
other Maryland counties impose a local income tax. Until tax year 1998, this local tax
(piggyback) was a share of the state tax. However, effective for tax year 1999, counties levy a
tax using an income tax rate and state taxable income. The local rate generally ranges between
3.2 percent in Montgomery and Prince George’s Counties to 3.03 percent in Charles County.
In addition, Montgomery County passed legislation making it the first local jurisdiction
in the country with a local refundable earned income credit. This credit went into effect for tax
year 1998.
Virginia
Virginia residents are subject to the individual income tax. In addition, nonresidents are
taxed on income earned in Virginia, but a credit is allowed for taxes paid to their home states.
Members of the armed forces are not subject to the tax on their active duty military income when
stationed in Virginia, if they had no place of domicile in the state. A spouse of a servicemember
shall neither lose nor acquire a residence or domicile for purposes of taxation with respect to the
person, personal property, or income of the spouse by reason of being absent or present in any
tax jurisdiction of the United States solely to be with the service member in compliance with the
servicemember’s military orders if the residence or domicile, as the case may be, is the same for
the servicemember and the spouse.
Virginia's income tax law conforms very closely to that of the federal government. The
tax is based on an individual's federal adjusted gross income with modifications, if applicable,
personal exemptions and standard or itemized deductions. In Virginia, as in the District of
Columbia, if taxpayers use itemized deductions on their federal return, they must itemize on their
state return. If they use the standard deduction for federal purposes, then they must use it for
state purposes.
Virginia generally allows the same itemized deductions as the federal government.
However, no deduction is allowed for income taxes imposed by the state or any other taxing
jurisdiction in determining the amount of the taxpayer's income subject to tax. Instead of
allowing a credit for child and dependent care expenses (necessary for gainful employment),
Virginia provides for a deduction equal to the amount allowed under federal law in computing
the child and dependent care credit.
Individuals receive the same income tax credit that corporations do for renewable energy
source expenditures. The Urban Enterprise Zone and the Neighborhood Assistance Act credits
also are applicable to individuals.
Table 8 on the following page compares tax rates, personal exemption amounts, and
deduction amounts for the District, Maryland, and Virginia as of January 1, 2015.

Part II: A Comparison of Tax Rates in the Washington Metropolitan Area as of January 1, 2015
2014 Tax Rates and Tax Burdens – Washington Metropolitan Area
Page 28
Table 8: Individual Income Tax Washington Metropolitan Area
January 1, 2015
PERSONAL EXEMPTIONS
EXEMPTIONS
TAXABLE
INCOME 5/
RATES
DISTRICT OF COLUMBIA
Single $1,775 $0 - $10,000
$10,001-$40,000
$40,001-$60,000
$60,001-$350,000
Over $350,000
4.0%
$400 + 6.0% of excess > $10,000
$2,200 + 7.0% of excess > $40,000
$3,600 + 8.5% of excess > $60,000
$28,250 + 8.95% of excess > $350,000
Married Filing Separately $3,550
Married Filing Jointly $3,550
Head of Household $1,775
Dependent (additional) $1,775
Blind (additional) $1,775
Age 65 and over (additional) $1,775
Standard Deduction 1/
MARYLAND 2/
Single $3,200 $0 - $1,000
$1,001-$2,000
$2,001-$3,000
$3,001-$150,000
$150,001-$175,000
$175,001-$225,000
$225,001-$300,000
Over $300,001
2.0%
$ 20 + 3.00% of excess > $1,000
$ 50 + 4.00% of excess > $2,000
$ 90 + 4.75% of excess > $3,000
$7,072.50 + 5% of excess > $150,000
$8,322.50 + 5.25% of excess > $175,000
$10,947.50 + 5.5% of excess > $225,000
$15,072.50 + 5.75% of excess> $300,000
Married Filing Separately $6,400
Married Filing Jointly $6,400
Head of Household $3,200
Dependent (additional) $3,200
Blind (additional) $1,000
Age 65 and over (additional) $1,000
Standard Deduction 3/
VIRGINIA
Single $ 930 $0 - $3,000
$3,001-$5,000
$5,001-$17,000
Over $17,000
2.0%
$60 + 3.00% of excess > $ 3,000
$120 + 5.00% of excess > $ 5,000
$720 + 5.75% of excess > $17,000
Married Filing Separately $ 930
Married Filing Jointly $1,860
Head of Household $ 930
Dependent (additional) $ 930
Blind (additional) $ 800
Age 65 and over (additional) $ 800
Standard Deduction 4/
Source: Survey of State Revenue Department Officials; State Web Sites; and 2015 State Tax Handbook, Wolters Kluwer/ CCH Group, 2014.
1/ Married persons filing separately - $5,200; Married filing jointly - $8,350; Head of household - $6,500.
2/ Maryland rates do not include local rates that may be as low as 1.25% in Worcester County and as much as 3.2% in Howard, Montgomery and Prince George’s Counties, among others.
3/ 15% of Maryland AGI not to exceed $2,000 ($4,000 for joint and head of household returns and those filing as qualifying widow(er) with
dependent child). The minimum is $1,500 for single, married filing separately and dependent taxpayers. All others are allowed a minimum of $4,000.
4/ Single - $3,000; married persons filing separately - $3,000; and married persons filing jointly or combined separate - $6,000.
5/ Brackets and rates are for married filing jointly.

Part II: A Comparison of Tax Rates in the Washington Metropolitan Area as of January 1, 2015
2014 Tax Rates and Tax Burdens – Washington Metropolitan Area
Page 29
INCOME TAXES
UNINCORPORATED BUSINESS FRANCHISE
District of Columbia
The District's franchise tax on unincorporated businesses is imposed on enterprises with
gross income over $12,000. The rate is 9.5 percent on the taxable income derived from sources
within the District. In addition, a total surtax of 5.0 percent of the base rate is charged, for a total
rate of 9.975 percent. The minimum tax is $250. The tax is payable by the person or persons
jointly or severally conducting the unincorporated business.
Unincorporated businesses pay the franchise tax on 70 percent of net profits, less a
$5,000 exemption. Owners who participate in the operation of the business are allowed 30
percent of the net profit as a salary deduction. When 80 percent or more of income is derived
from services, the unincorporated business income is taxed under the individual income tax.
Maryland
Unincorporated business income is taxed under the individual income tax.
Virginia
Unincorporated business income is taxed under the individual income tax.
Several Virginia jurisdictions also levy a license tax on the gross receipts derived from
various businesses. Table 9 on the following page details the business license tax rates per $100
of gross receipts imposed by metropolitan area jurisdictions on several occupations.

Part II: A Comparison of Tax Rates in the Washington Metropolitan Area as of January 1, 2015
2014 Tax Rates and Tax Burdens – Washington Metropolitan Area
Page 30
Table 9: Unincorporated Business Franchise And Business License Taxes*
OCCUPATION 1/
DISTRICT
OF
COLUMBIA
ALEXANDRIA
2/
ARLINGTON
COUNTY 3/
FAIRFAX
4/
FAIRFAX
COUNTY
4/
FALLS
CHURCH
5/
LOUDOUN
COUNTY 6/
PRINCE
WILLIAM
COUNTY 7/
AMUSEMENTS/
RECREATIONAL SERVICES
8/ $.36/$100 $.25/$100 $.27/$100 $.26/$100 $.36/$100 $30 or
$.21/$100
$.21/$100
BUSINESS SERVICES 8/ $.35/$100 $.35/$100 $.27/$100 $.19/$100 $.36/$100 $30 or
$.17/$100
$.21/$100
PERSONAL SERVICES 8/ $.35/$100 $.35/$100 $.27/$100 $.19/$100 $.36/$100 $30 or
$.23/$100
$.21/$100
PROFESSIONALS --- $.58/$100 $.36/$100 $.40/$100 $.31/$100 $.52/$100 $30 or
$.33/$100
$.33/$100
REPAIR SERVICES 8/ $.35/$100 $.35/$100 $.27/$100 $.19/$100 $.36/$100 $30 or
$.16/$100
$.21/$100
RETAIL SERVICES 8/ $.20/$100 $.20/$100 $.20/$100 $.17/$100 $.19/$100 $30 or
$.17/$100
$.17/$100
WHOLESALE MERCHANTS 8/ $.05/$100
on gross
purchases
$.08/$100 $.05/$100
on gross
purchases
$.04/$100
on gross
purchases
$.08/$100 $30 or
$.05/$100
on gross
purchases
$.05/$100
on gross
purchases
FILLING STATIONS 8/ $.20/$100 $.10/$100 $.20/$100 $.17/$100 $.19/$100 $30 or
$.17/$100
$.17/$100
CONTRACTORS 8/ $.16/$100 $.16/$100 $.16/$100 $.11/$100 $.16/$100 $30 or
$.13/$100
$.13/$100
VENDING MACHINE SALES 8/ $.20/$100 $.20/$100 $.20/$100 $.17/$100 $.19/$100 $30 or
$.17/$100
$.17/$100
FEDERAL CONTRACTORS 8/ --- 9/ $.03/$100 $.03/$100 $.03/$100 $30 or
$.03/$100
---
FINANCIAL AND REAL
ESTATE SERVICES
8/ $.35/$100
10/
$.36/$100 $.40/$100 $.31/$100 $.50/$100 $30 or
$.33/$100
$.33/$100
RENTAL BY OWNER –
RESIDENTIAL
8/ $.50/$100 $.28/$100 $.50/$100 $.26/$100 $.38/$100 $30 or
$.16/$100
---
RENTAL BY OWNER –
COMMERCIAL
8/ $.35/$100 $.43/$100 $.23/$100 $.26/$100 $.52/$100 $30 or
$.16/$100
---
*Rates are for Calendar Year 2014.
Source: Survey of local government officials and local government web sites. 1/ Categories shown are not a comprehensive listing.
2/ Less than $10,000 gross receipts-no tax; greater than $10,000, but less than $100,000-$50.00 minimum.
3/ Rates apply to businesses having gross receipts exceeding $100,000. Businesses having gross receipts less than $10,000 owe no tax; businesses grossing between $10,000-$50,000 pay $30.00;
between $50,001 and $100,000 pay $50.00.
4/ If gross receipts are less than $10,000, there is no fee or license requirement; businesses with gross receipts from $10,001 to $50,000, a flat fee of $30 is assessed; businesses with gross receipts
from $50,001 to $100,000, a flat fee of $50 is assessed; and businesses with gross receipts of $100,001 or greater, the tax rate is determined by the business classification.
5/ Less than $10,000 gross receipts-no tax; $10,000-$50,000 pays $30.00.
6/ $30 fee when gross receipts are under $200,000. The rate applies to total of gross receipts.
7/ Rates apply to business gross receipts of $250,000 or more for the license year. No license tax shall be imposed when gross receipts are less than $250,000.
8/ A 9.975% rate is imposed on the taxable income of businesses, if not incorporated, with gross receipts over $12,000. A 30% salary allowance for owners and a $5,000 exemption are deductible
from net income to arrive at taxable income
9/ No separate category for federal contractors, they are taxed according to service provided.
10/ Financial only.

Part II: A Comparison of Tax Rates in the Washington Metropolitan Area as of January 1, 2015
2014 Tax Rates and Tax Burdens – Washington Metropolitan Area
Page 31
INHERITANCE AND ESTATE TAXES
INHERITANCE TAX
District of Columbia
The District of Columbia's inheritance tax was abolished for any deaths after April 1,
1987.
Maryland
Effective for decedents who died on or after July 1, 2000, Maryland does not tax property
passing to a child or other lineal descendant, spouse of a child or other lineal descendant, spouse,
parent, grandparent, stepchild or stepparent, siblings or a corporation having only certain of these
persons as stockholders. The rate of 10 percent applies to property passing to all others.
Effective July 1, 1989, the tax on commissions of executors and administrators of the
estates of those dying on or after July 1, 1989 was repealed.
Virginia
Virginia does not levy an inheritance tax. However, Virginia does levy a tax on the
probate of wills and grants of administration equal to 10 cents per $100 of the value of the estate
in excess of $15,000.
ESTATE TAX
District of Columbia
The estate tax is imposed on the estate of every decedent who died while still a resident
of the District, and on the estate of every nonresident decedent owning property having a taxable
situs in the District at the time of his or her death.
The District’s estate tax is no longer in conformity with the federal estate tax. The
Federal Economic Growth and Tax Relief Reconciliation Act (EGTRRA) of 2001 changed the
conformity with the federal estate tax. This legislation gradually eliminates the federal estate tax
over the next several years.
District law, however, stipulates that existing District estate tax laws are automatically
decoupled from recent and forthcoming federal estate tax law changes. For example, while the
federal threshold was $2 million in FY’s 2006 and 2007, the District threshold was $1 million.
Part II: A Comparison of Tax Rates in the Washington Metropolitan Area as of January 1, 2015
2014 Tax Rates and Tax Burdens – Washington Metropolitan Area
Page 32
Furthermore, when the federal threshold was raised to $3.5 million in FY 2009, the District
threshold remained $1 million. Hence, some District estate tax payers may be required to file
and pay District estate taxes even when no federal filing or tax is due. Federal estate tax forms
must be filled out completely in order to calculate District estate tax liability, even when no
federal estate tax is due, but District estate tax is due. Essentially, the District does not have a
standalone estate tax structure.
Maryland and Virginia
The Maryland estate tax is based on the maximum credit for state death taxes allowable
under § 2011 of the Internal Revenue Code. The credit used to determine the Maryland estate tax
cannot exceed 16 percent of the amount by which the decedent’s taxable estate exceeds the
Maryland estate tax exemption amount for the year of the decedent’s death.
Legislation enacted by the 2006 General Assembly, House Bill 5018, repeals the Virginia
estate tax for the estates of decedents whose date of death occurs on or after July 1, 2007. The
estates of decedents whose date of death occurs before July 1, 2007 remain subject to the estate
tax provisions.

Part II: A Comparison of Tax Rates in the Washington Metropolitan Area as of January 1, 2015
2014 Tax Rates and Tax Burdens – Washington Metropolitan Area
Page 33
INSURANCE PREMIUMS TAX
District of Columbia
All domestic and foreign insurance companies, except those specified below, pay tax on
the premiums received in lieu of all other taxes, except taxes upon real property. The basis of
this tax is gross premiums received less the following items: dividends paid to policyholders;
premiums received for reinsurance assumed; and returned premiums.
Nonprofit relief associations composed solely of members of the armed services or
employees of the United States, District of Columbia, or of any individual company, as well as
fraternal organizations that issue contracts of insurance exclusively to their own members, are
exempt from the tax.
Maryland
All insurance companies except nonprofit hospital service plan corporations, fraternal
beneficiary associations, and domestic mutual fire insurance companies pay an annual tax on
gross direct premiums. The tax is based on all new and renewal gross premiums allocable to
Maryland. Deductions are allowed for returned premiums, dividends paid to policyholders, and
refunds made to policyholders.
Virginia
A tax is imposed on all insurance companies transacting insurance business in Virginia,
except local mutual fire insurance and fraternal beneficiary companies. The tax replaces all
other taxes, except the tax on real estate and tangible personal property. No tax is imposed on
premiums received by an insurer to provide group insurance for its employees. The basis of the
tax is gross premiums from business in Virginia, except premiums received for reinsurance
assumed from licensed insurance companies. The basis is reduced for premiums returned upon
canceled or reduced policies; however, deduction for dividends paid or deduction for any other
account is not allowed.
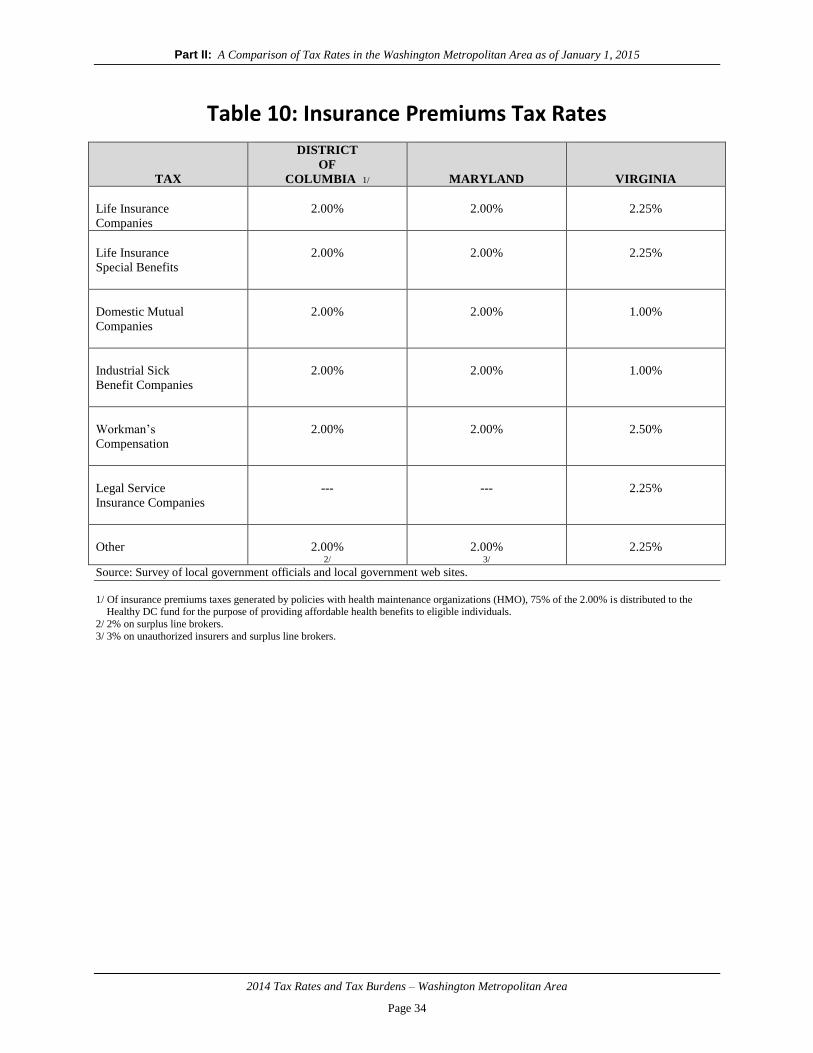
Part II: A Comparison of Tax Rates in the Washington Metropolitan Area as of January 1, 2015
2014 Tax Rates and Tax Burdens – Washington Metropolitan Area
Page 34
Table 10: Insurance Premiums Tax Rates
TAX
DISTRICT
OF
COLUMBIA 1/
MARYLAND
VIRGINIA
Life Insurance
Companies
2.00%
2.00%
2.25%
Life Insurance
Special Benefits
2.00%
2.00%
2.25%
Domestic Mutual
Companies
2.00%
2.00%
1.00%
Industrial Sick
Benefit Companies
2.00%
2.00%
1.00%
Workman’s
Compensation
2.00%
2.00%
2.50%
Legal Service
Insurance Companies
---
---
2.25%
Other
2.00% 2/
2.00% 3/
2.25%
Source: Survey of local government officials and local government web sites.
1/ Of insurance premiums taxes generated by policies with health maintenance organizations (HMO), 75% of the 2.00% is distributed to the Healthy DC fund for the purpose of providing affordable health benefits to eligible individuals.
2/ 2% on surplus line brokers.
3/ 3% on unauthorized insurers and surplus line brokers.

Part II: A Comparison of Tax Rates in the Washington Metropolitan Area as of January 1, 2015
2014 Tax Rates and Tax Burdens – Washington Metropolitan Area
Page 35
MOTOR VEHICLE TAXES
MOTOR VEHICLE EXCISE
All three jurisdictions impose fees on cars, trucks, buses, and trailers based on weight.
District of Columbia
The District imposes a titling tax based on the manufacturer’s shipping weight at the time
the title is issued at the following rates: up to 3,499 pounds - 6 percent of fair market value;
3,500 pounds to 4,999 pounds – 7 percent of fair market value; and 5,000 pounds and over – 8
percent. Since October 1, 1998, vehicles previously titled by individuals moving into the District
are no longer subject to the motor vehicle excise tax.
Maryland
Maryland imposes an excise tax of 6 percent of fair market value on each motor vehicle
at the time the title is issued.
Virginia
Virginia taxes motor vehicles at the time of sale at 4.05 percent.
MOTOR VEHICLE REGISTRATION
Annual registration fees for the District of Columbia, Maryland, and Virginia are
presented on the following page in Table 11.

Part II: A Comparison of Tax Rates in the Washington Metropolitan Area as of January 1, 2015
2014 Tax Rates and Tax Burdens – Washington Metropolitan Area
Page 36
Table 11: Annual Registration Fees for Passenger Cars
JURISDICTION
WEIGHT
FEES
DISTRICT OF COLUMBIA 1/2/ Vehicles
0 to 3,499 pounds
3,500 to 4,999 pounds
5,000 pounds or more
Motorcycles
$ 72.00
$115.00
$155.00
$ 52.00
MARYLAND Vehicles
3,700 pounds or less
Over 3,700 pounds
$ 67.50
$ 93.50
VIRGINIA (State) Vehicles
4,000 pounds or less
Over 4,000 pounds
Motorcycles
$ 40.75
$ 45.75
$ 28.75
Alexandria Vehicles 3/
Motorcycles
+$ 33.00
+$ 21.00
Arlington County Vehicles 3/
Motorcycles
+$ 33.00
+$ 18.00
Fairfax Vehicles 3/
Motorcycles
+$ 33.00
+$ 18.00
Fairfax County 4/ Vehicles
4,000 pounds or less
Over 4,000 pounds
Motorcycles
+$ 33.00
+$ 38.00
+$ 18.00
Falls Church Vehicles
4,000 pounds or less
Over 4,000 pounds
Motorcycles
+$ 33.00
+$ 45.00
+$ 28.00
Loudoun County Vehicles 3/
Motorcycles
+$ 25.00
+$ 16.00
Prince William County 5/ Vehicles 3/
Motorcycles
+$ 24.00
+$ 12.00
+ In addition to state rate.
Source: Survey of local government officials and local government web sites.
1/ The fee for motorized bicycles is $25.00.
2/ An additional fee of $35.00 is charged for vehicle inspection every two years.
3/ Flat rate applied regardless of weight.
4/ Businesses and citizens residing in the towns of Vienna, Herndon, and Clifton pay vehicle registration fees set by those jurisdictions in lieu of the Fairfax County
fee.
5/ Taxpayers who satisfy certain household gross income and net worth limitations (these requirements are the same as those applicable to the county's real property
tax relief program) may exempt one vehicle from the annual registration fee.

Part II: A Comparison of Tax Rates in the Washington Metropolitan Area as of January 1, 2015
2014 Tax Rates and Tax Burdens – Washington Metropolitan Area
Page 37
MOTOR VEHICLE FUEL TAX
District of Columbia
This tax is imposed on every importer or user of motor vehicle fuels, including gasoline,
diesel fuel, benzol, benzene, naphtha, kerosene, heating oils, all liquefied petroleum gases, and
all combustible gases and liquids suitable for the generation of power for motor vehicles. Fuel
exported from the District is exempt.
Maryland
Every dealer pays a tax on all motor vehicle fuels sold or used in Maryland. Motor
carriers with commercial vehicles having seats for more than nine passengers or having more
than two axles are subject to a tax on the amount of motor fuel used in their operations in
Maryland. Credit is allowed for taxes paid on all motor fuel purchased in Maryland.
Virginia
A motor fuel tax is imposed on all dealers and other persons selling motor fuel in the
Commonwealth.
A 2.1 percent sales tax is imposed on retail sales of fuels sold within a city or county that
is a member of any transportation district in which a commuter mass transportation system is
operated.
RATE PER GALLON
DISTRICT
MARYLAND
VIRGINIA
23.5 cents
23.5 cents 1/
3.5% of the statewide average
wholesale price/gallon 2/
1/ Tax on special fuels (diesel/kerosene) used as a motor fuel is 24.25 cents per gallon.
2/ From July 2013 to December 2014, the tax in Virginia was 11.1 cents per gallon. From January 2015 December 2015, it was 16.2 cents per gallon. An additional 2.1 percent local tax is applied in the Northern Virginia
Jurisdictions of Alexandria, Arlington County, Fairfax, Fairfax County, Falls Church, Manassas, Loudoun County, Prince William County, and
Stafford County. This is charged by fuel distributors to retail dealers in the Northern Virginia Transportation District for commuter mass transit system.

Part II: A Comparison of Tax Rates in the Washington Metropolitan Area as of January 1, 2015
2014 Tax Rates and Tax Burdens – Washington Metropolitan Area
Page 38
PROPERTY TAXES
REAL PROPERTY
District of Columbia
All real and personal property is subject to taxation unless expressly exempt by statute.
The District of Columbia real property tax is based on four classifications:
(a) Class One Property - improved residential real property that contains five or
fewer dwelling units (whether as a row, detached, or semi-detached structure), or
a single dwelling unit owned as a condominium and used exclusively for
non-transient residential dwelling purposes. Improved residential real property
owned by a cooperative housing association also shall be classified as Class One
Property, provided that at least 50 percent of the dwelling units are occupied by
the shareholders or members of the cooperative housing association.
Unimproved (vacant) property that abuts and has identical ownership with a Class
One Property also shall be considered Class One Property. A $70,200 homestead
exemption is applied to property that is owner-occupied.
(b) Class Two Property - improved commercial property. Hotels, motels, and inns
are included in this class. The first $3 million in assessed value rate is $1.65 per
$100 of assessed value and the remaining assessed value is assessed at $1.85 per
$100.
(c) Class Three Property - vacant real property.
(d) Class Four Property – improved blighted property.
All property in the District is annually assessed at a statutory level of 100 percent of its
estimated market value.
In an effort to limit the increase of real property taxes for homeowners, eligible
homeowners are provided an Assessment Cap Credit. The Assessment Cap Credit provides that
a real property tax bill will not increase by more than 10 percent above the prior year’s real
property tax bill. The credit only applies to the principal residence of the property owner
(homestead property) and is based on the total assessment for the dwelling and land associated
with the dwelling.

Part II: A Comparison of Tax Rates in the Washington Metropolitan Area as of January 1, 2015
2014 Tax Rates and Tax Burdens – Washington Metropolitan Area
Page 39
Maryland
The state property tax rate of 11.2 cents per $100 of assessed market value applies to real
property only. It is imposed annually on all taxable land and improvements. The tax is applied
to an assessed value.
The Maryland Department of Assessments and Taxation makes assessments. Real
property for state and county tax purposes is assessed according to a three-year assessment
schedule. A physical review of each property is made every three years. Reassessments are
updated on the basis of an analysis of sales, cost, and rental data in the area. The amount of the
increase in the established market value of one-third of the properties reassessed each year is
phased in over a three-year period. A decline in assessed value, however, becomes effective in
the first year. Real property is assessed at 100 percent of its value.
Residential property owners are entitled to an assessment limitation tax credit. For state
tax purposes, this is a credit against property taxes equal to the tax rate, times that part of the
2014 total assessment greater than 110 percent of the 2013 assessment. County and municipal
governments may choose a percentage amount lower than 110 percent of assessment.
Virginia
The Commonwealth of Virginia does not levy a real property tax. However, local
jurisdictions are required to tax real property at 100 percent of estimated market value.
Tax rates for the jurisdictions of the Washington Metropolitan Area are presented in
Table 12.
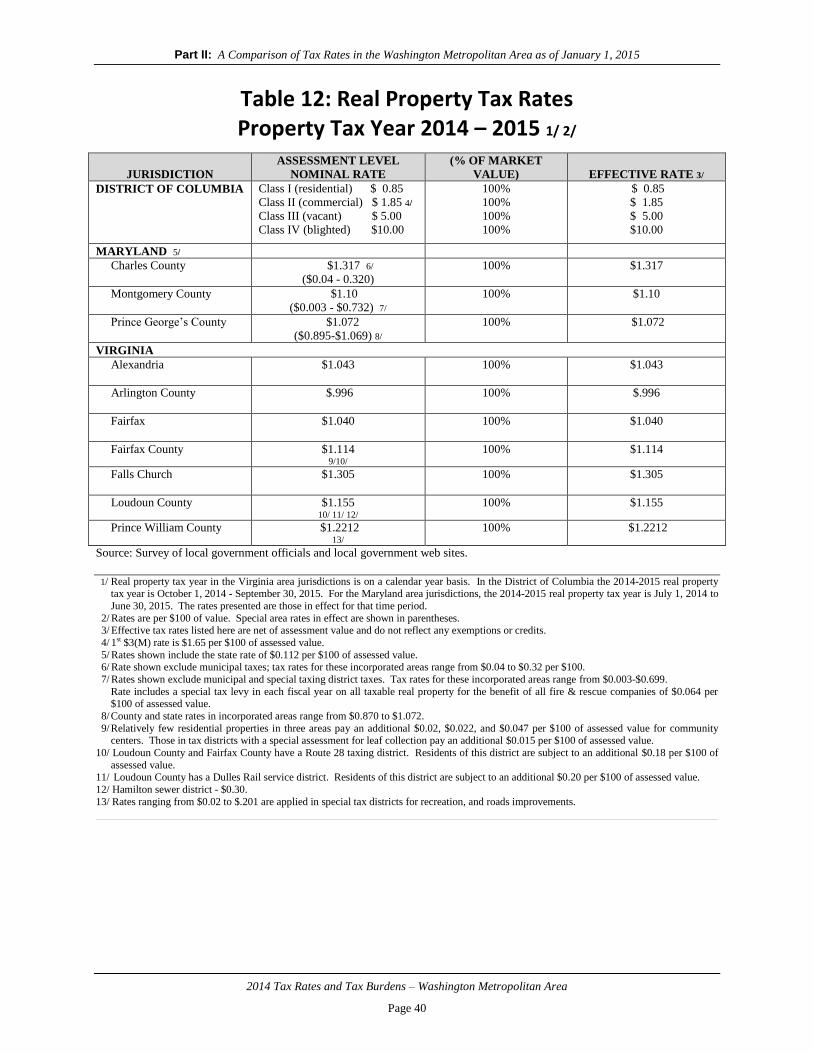
Part II: A Comparison of Tax Rates in the Washington Metropolitan Area as of January 1, 2015
2014 Tax Rates and Tax Burdens – Washington Metropolitan Area
Page 40
Table 12: Real Property Tax Rates Property Tax Year 2014 – 2015 1/ 2/
JURISDICTION
ASSESSMENT LEVEL
NOMINAL RATE
(% OF MARKET
VALUE)
EFFECTIVE RATE 3/
DISTRICT OF COLUMBIA Class I (residential) $ 0.85
Class II (commercial) $ 1.85 4/
Class III (vacant) $ 5.00
Class IV (blighted) $10.00
100%
100%
100%
100%
$ 0.85
$ 1.85
$ 5.00
$10.00
MARYLAND 5/
Charles County $1.317 6/
($0.04 - 0.320)
100% $1.317
Montgomery County $1.10
($0.003 - $0.732) 7/
100% $1.10
Prince George’s County $1.072
($0.895-$1.069) 8/
100% $1.072
VIRGINIA
Alexandria $1.043
100% $1.043
Arlington County $.996
100% $.996
Fairfax $1.040
100% $1.040
Fairfax County $1.114 9/10/
100% $1.114
Falls Church $1.305
100% $1.305
Loudoun County $1.155 10/ 11/ 12/
100% $1.155
Prince William County $1.2212 13/
100% $1.2212
Source: Survey of local government officials and local government web sites.
1/ Real property tax year in the Virginia area jurisdictions is on a calendar year basis. In the District of Columbia the 2014-2015 real property tax year is October 1, 2014 - September 30, 2015. For the Maryland area jurisdictions, the 2014-2015 real property tax year is July 1, 2014 to
June 30, 2015. The rates presented are those in effect for that time period.
2/ Rates are per $100 of value. Special area rates in effect are shown in parentheses. 3/ Effective tax rates listed here are net of assessment value and do not reflect any exemptions or credits.
4/ 1st $3(M) rate is $1.65 per $100 of assessed value.
5/ Rates shown include the state rate of $0.112 per $100 of assessed value. 6/ Rate shown exclude municipal taxes; tax rates for these incorporated areas range from $0.04 to $0.32 per $100.
7/ Rates shown exclude municipal and special taxing district taxes. Tax rates for these incorporated areas range from $0.003-$0.699.
Rate includes a special tax levy in each fiscal year on all taxable real property for the benefit of all fire & rescue companies of $0.064 per $100 of assessed value.
8/ County and state rates in incorporated areas range from $0.870 to $1.072.
9/ Relatively few residential properties in three areas pay an additional $0.02, $0.022, and $0.047 per $100 of assessed value for community centers. Those in tax districts with a special assessment for leaf collection pay an additional $0.015 per $100 of assessed value.
10/ Loudoun County and Fairfax County have a Route 28 taxing district. Residents of this district are subject to an additional $0.18 per $100 of
assessed value. 11/ Loudoun County has a Dulles Rail service district. Residents of this district are subject to an additional $0.20 per $100 of assessed value.
12/ Hamilton sewer district - $0.30.
13/ Rates ranging from $0.02 to $.201 are applied in special tax districts for recreation, and roads improvements.

Part II: A Comparison of Tax Rates in the Washington Metropolitan Area as of January 1, 2015
2014 Tax Rates and Tax Burdens – Washington Metropolitan Area
Page 41
PROPERTY TAXES
PROPERTY TAX RELIEF PROGRAMS
District of Columbia
Class One (owner-occupied residential) property owners may obtain a homestead
deduction. D.C. Law 4-129, effective July 24, 1982, requires the filing of the homestead
deduction application once every five years. This deduction eliminates property taxes on the
first $70,200 of assessed value for homeowners, and has been indexed annually (by the CPI)
since October 1, 2012. In addition to the homestead deduction, senior citizens age 65 or older
with total household adjusted gross income below $100,000 may have their real property tax
payments reduced by half.
Owner-occupied residential properties are also subject to a 10 percent property tax cap
whereby the property tax paid on the property is limited to at most 10 percent more than the tax
paid the previous year.
The District provides two "circuit-breaker" property tax relief programs for qualified
homeowners and renters who live in the District during the entire taxable year. A credit can be
claimed against their individual income tax liability (a refund if the credit exceeds any tax due)
for a portion of the property taxes paid or rent paid constituting property taxes that exceeds a
stated percentage of household income. The specific percentages are presented in Table 13, page
44-45.
In addition, the District has a tax deferral program. All owner-occupied residential
property taxpayers may apply to defer real property taxes that exceed 110 percent of the previous
year's liability. Deferred real property taxes may not exceed 10 percent of the current year's
assessed value.
Eligible homeowners who meet the income level requirement and whose property is less
than $367,200 in value may be eligible for abatement of real property taxes for a 5 year period
beginning October 1 following the recordation of the homeowner's deed as well as abatement of
deed recordation and transfer taxes. Application must be made at the time the deed conveying
the real property involved is offered for recordation with the Recorder of Deeds.
The District also has a special tax relief program for qualified historic properties
approved by the Joint Committee on Landmarks of the National Capital. Owners of the property
must be willing to enter into an agreement with the D.C. government to preserve the building as
historic property for at least 20 years.
Maryland
The Maryland homeowner's property tax credit program (circuit breaker) is designed to
provide relief for property tax burdens in excess of a certain percentage of income. The
maximum assessment that can be used to calculate the credit is $300,000. Applications must be
Part II: A Comparison of Tax Rates in the Washington Metropolitan Area as of January 1, 2015
2014 Tax Rates and Tax Burdens – Washington Metropolitan Area
Page 42
filed by September 1 of each year.
The state of Maryland also makes available a refundable renter's tax credit of up to $750 a
year for renters who are age 60 or over, or who are permanently and totally disabled and will
qualify on the basis of income. The applicant's entitlement to the credit is tied to a flexible scale
that relates the annual rent paid to the applicant's annual gross income. In comparing the
applicant's gross income to his or her annual rent paid, an allowance is made for utilities paid by
the renter. For example, if the renter pays for gas only, it is assumed that 6 percent of his or her
gross income is dedicated to that item. By way of contrast, if the renter must pay for heat, gas,
and electricity, it is assumed that 18 percent of income is devoted to these items. Renters under
60 years of age, with at least one dependent under the age of 18, who receive no federal or state
housing subsidies or reside in public housing, and meet certain income limits may be eligible.
The Renter's Tax Credit Program is independent of the state individual income tax.
Applications must be filed by September 1 of each year. The applicant must, however, submit a
copy of his or her most recent Federal Tax Form 1040 and all the accompanying forms with the
renter's tax credit application.
Charles County, Montgomery County, and Prince George’s County each provide a county
supplemental to the State Homeowner Property Tax Credit Program.
Virginia
In Arlington County each owner of property for which exemption or deferral or both are
claimed must be age 65 or older during the current taxable year and occupy such property as
their sole dwelling, or be permanently and totally disabled. A dwelling jointly held by a husband
and wife shall qualify if either spouse is or becomes 65 years old or is or becomes permanently
and totally disabled during the current taxable year.
The total combined financial worth of the owner(s) as of December 31 of the year
immediately preceding the taxable year shall be determined in an amount not to exceed
$540,000. Total financial worth shall include the value of all assets, including equitable interest,
of the owner(s) and the owner’s relatives living in the dwelling for which the exemption or
deferral or both are claimed, and shall exclude the fair market value of the dwelling and the land
upon which it is situated, not exceeding one acre, for which the exemption is claimed.
Fairfax County, Prince William County, and Falls Church provide an exemption from, or
deferral of, real property taxes on dwellings owned and occupied by persons who are age 65 or
older, or who are permanently and totally disabled and whose income is not more than $72,000
(Fairfax County), $81,490 (Prince William County), and $68,000 (Falls Church). Income of
$7,500 may be excluded by an applicant who is permanently and totally disabled. Household
gross income includes the income of all relatives residing therein. From this amount, the
homeowner excludes the first $6,500 of income for each relative residing in the household other
than the spouse of the owner. The combined financial net worth of the owner and spouse cannot
exceed $340,000 up to one acre of land in Fairfax County and $340,000 in Prince William
County, up to 25 acres of land, excluding the value of the home.

Part II: A Comparison of Tax Rates in the Washington Metropolitan Area as of January 1, 2015
2014 Tax Rates and Tax Burdens – Washington Metropolitan Area
Page 43
Loudoun County provides a tax relief program that exempts real property taxes on the
dwelling and up to three acres of land on which the dwelling is situated. The dwelling must be
owned and occupied as the full-time residence of the applicant(s) seeking tax relief. Applicants
must be 65 years or older or certified permanently and totally disabled by January 1st of the
current tax year. Loudoun County’s gross household income limitation is $72,000. The first
$7,500 of disability income may be excluded by applicants who are permanently and totally
disabled. Not including the spouse of the applicant, the first $10,000 of income of each relative
residing in the dwelling may be excluded when computing gross household income. Loudoun
County’s net worth limitation is $440,000, which does not include the value of the dwelling, and
up to ten acres of land on which the dwelling is situated. The value of land in excess of three
acres is not eligible for tax relief.
The City of Alexandria has two programs for real estate tax relief: First, tax relief for the
elderly and permanently and totally disabled. This program allows for both exemption from and
deferral of real estate taxes. To qualify for an exemption, the total household income of the
applicant cannot exceed $72,000 for the calendar year immediately preceding the year in which
the application is made. For household incomes up to $40,000, taxes are exempted in full. For
household incomes between $40,001 and $55,000, up to 50 percent of the applicant’s real estate
tax bill is exempted. For household incomes between $55,001 and $72,000, up to 25 percent of
the applicant’s real estate bill is exempt. Up to $10,000 in income of any relative (not a spouse)
living in the property is excluded, as well as up to $10,000 in income of any owner residing in
the property who is permanently disabled is also excluded. To qualify for deferral, the total
household income of Alexandria city applicants cannot exceed $72,000 for the calendar year
immediately preceding the year in which the application is made. The date of deferral of taxes is
the date the taxes would ordinarily be due.
The second program provides a full real estate tax exemption for veterans with 100
percent service-connected disability: The veteran must be rated at 100 percent or service-
connection is rated at less than 100 percent, but the veteran is paid at the 100 percent disability
rate due to unemployability under either standard. The disability must be considered total and
permanent. Veterans with temporary disability, no matter how severe, do not qualify.

Part II: A Comparison of Tax Rates in the Washington Metropolitan Area as of January 1, 2015
2014 Tax Rates and Tax Burdens – Washington Metropolitan Area
Page 44
Table 13: Property Tax Relief Programs
HOUSEHOLD
GROSS INCOME
TAX CREDIT EQUALS: 1/
DISTRICT OF COLUMBIA Regular Property Tax Circuit Breaker
$ 0-$ 24,999
100% of property tax exceeding 3.0% of household income – up to $1,000
$ 25,000-$ 40,000
100% of property tax exceeding 4.0% of household income – up to $1,000
Age 70 and Over, Blind or Disabled Circuit-Breaker Relief
$ 0-$ 60,000
3.0% of household gross income – up to $1,000
JURISDICTION
HOUSEHOLD
GROSS INCOME
LESS THAN:
NET WORTH
LESS THAN:
RELIEF
AMOUNT: 2/
TAX LIMIT:
MARYLAND
Rates
Charles County
$60,000 $200,000 $ 828 $4,380
Montgomery County 3/
$60,000 $200,000 $1,130 $4,380
Prince George’s County
$60,000 $200,000 $1,500 $4,380
1/ Renters use 20 percent of rent paid as a property tax equivalency.
2/ The maximum tax credit for the first $50,000 of the assessed value of the property.
3/ In addition to the state circuit breaker, Montgomery County introduced a county supplement that allows for an additional credit for a taxpayer with no more than $40,000 of income (versus $30,000 at state level). Taxpayers must apply for this credit to become eligible to
receive grant.

Part II: A Comparison of Tax Rates in the Washington Metropolitan Area as of January 1, 2015
2014 Tax Rates and Tax Burdens – Washington Metropolitan Area
Page 45
Table 13: Property Tax Relief Programs, Continued
JURISDICTION
HOUSEHOLD
GROSS
INCOME
LESS THAN:
NET WORTH
LESS THAN:
RELIEF AMOUNT:
VIRGINIA
Rates:
Alexandria 4/7/8/
$72,000 $430,000 4/
Arlington County 5/
$99,472 $340,000 for exemption
$540,000 for deferral
6/
Fairfax 7/
$62,000 $340,000 9/
Fairfax County 7/9/
$72,000 $340,000 10/
Falls Church 7/
$68,000 $540,000 11/
Loudoun County $72,000 $440,000 12/
Prince William County 7/
$81,490 $340,000 13/
Source: Survey of local government officials and local government web sites.
4/ Household income less than $40,000 receives full exemption, income $40,001 to $72,000 receives partial exemption; income not more than $72,000 can receive deferral of tax.
5/ For deferrals, net worth cannot exceed $195,000; for deferrals with interest, income cannot exceed $52,000; for deferrals without interest,
income cannot exceed $47,000; for exemptions, net worth cannot exceed $100,000 and income cannot exceed $20,000. 6/ The asset level excludes the value of the residence. The amount of relief received, if eligible, is based on household income and the value of
the household's assets.
7/ Tax relief program is for residents 65 years of age or older, or permanently and totally disabled. Disabled applicants may exclude the first $10,000 of income. For each relative other than a spouse residing in the household, the first $6,500 may be excluded.
8/ Excludes home and two acres of land from net worth calculation.
9/ Excludes home and one acre of land from net worth calculations. 10/ Income less than $52,000, receive a 100% tax relief; from $52,001 to $62,000, receive a 50% tax relief; and from $62,001 to $72,000 receive
a 25% tax relief.
11/ Incomes from $0 up to $22,950 receive a $4,000 of relief, with a deferral of the balance; incomes from $22,951 to $38,250 receive up to $3,000 in relief, with a deferral of the balance; incomes between $38,251 to $68,000 receive $1,000, and the balance may be deferred.
Incomes between $47,601 and $75,000 may receive deferral only. Note: these eligibility limits based on a 1 person household.
12/ Total exemption is granted for home and up to three acres. 13/ Total exemption of the tax on a home and up to one acre of land it occupies is granted to applicants whose gross household income does not
exceed $48,000 annually. Partial exemption of the tax on a home and up to twenty-five acres of land it occupies is granted to applicants
whose gross household income is greater than $48,000, but does not exceed $81,490.

Part II: A Comparison of Tax Rates in the Washington Metropolitan Area as of January 1, 2015
2014 Tax Rates and Tax Burdens – Washington Metropolitan Area
Page 46
PROPERTY TAXES
TANGIBLE PERSONAL PROPERTY
District of Columbia
The tax is imposed on all tangible personal property, except inventories, used in a trade or
business. Such property includes machinery, equipment, furniture, fixtures and supplies.
Tangible personal property leased to another business or individual located in the District of
Columbia is taxable to the owner. Tangible personal property must be assessed at full and true
value. Renters under a "lease purchase" or a "security purchase" agreement who are obligated to
become the owner must report the property on the personal property tax return. The first
$225,000 of taxable value is exempt from tax.
Maryland
The county rates of tax on tangible personal property are 2.5 times those for real property.
The state rate is not levied on personal property. A county rate may apply to commercial and
manufacturing inventories. The state is responsible for the assessment, at full cash value, of
corporate tangible personal property.
Virginia
The tax on tangible personal property is a local tax in Virginia. The rates shown in Table
14, page 48 are nominal. Counties and cities impose different rates on tangible personal property
and classify certain items separately from other tangible personal properties. Virginia
jurisdictions are the only ones in the Washington Metropolitan Area that tax automobiles (as well
as motorcycles, recreational vehicles, boats, airplanes, and trailers) under the tangible personal
property tax. However, in Prince William County, the tax rate for recreational vehicles, boats,
and airplanes is taxed at $0.00001 per $100 of assessed value, resulting in no tax liability.
Mobile homes are taxed at the real property tax rate. Motor vehicles must be listed separately
and are assessed at trade-in value according to the January 1 (of each year) National Automobile
Dealers Association handbook in Alexandria, Falls Church, Fairfax City, Fairfax County, and
Prince William County. The clean loan value is the basis used in Arlington County and Loudoun
County. All Northern Virginia jurisdictions included in the report prorate vehicle personal
property taxes based on the length of time the vehicle is in their locality. Beginning in 1999,
Virginia adopted a personal property tax relief program on the first $20,000 of a vehicle’s
assessed value. For calendar year 2013, personal property taxes paid by citizens were reduced
by various percentages based on the 2012 level of state reimbursement in which the state
reimbursed the locality for that reduced assessment amount. Owners of vehicles valued at less
than $1,000 pay no tax (the state pays 100 percent). In Arlington County, vehicles that are
valued at $3,000 or less, and are PPTR eligible have no tax liability and pay only an annual decal
fee. Each vehicle that is PPTR eligible pays no tax on the first $3,000 of value.

Part II: A Comparison of Tax Rates in the Washington Metropolitan Area as of January 1, 2015
2014 Tax Rates and Tax Burdens – Washington Metropolitan Area
Page 47
Prince William County also allows an exemption of personal property taxes on one
automobile per qualifying applicant for the low-income elderly and the permanently and totally
disabled. County tax relief applicants who meet the income and net worth requirements may
qualify for a reduced tax rate on one vehicle per qualifying applicant. Qualifications for personal
property tax relief for the low-income elderly and disabled are as follows:
Gross income of the applicant may not exceed $81,490.
The combined net assets of the applicant and spouse may not exceed $340,000.
Personal property relief for this program is limited to one vehicle.
Disabled applications may exclude the 1st $7,500 of income from the calculation of total
income, i.e., an effective gross income of $29,500.
Loudoun County provides an alternative personal property tax rate on one vehicle per
qualified applicant who is age 65 or over or declared permanently and totally disabled by
January 1st of the current year. The vehicle must be used primarily by or for the applicant, and if
co-owned, the gross income limitation includes income from all sources of the owners of the
vehicle and the spouse of the applicant. The gross income limit for the alternative tax rate is
$52,000. The applicant’s net worth cannot exceed $195,000, which may exclude the value of the
applicant’s Loudoun County residence and up to one acre of land on which it is situated. The
alternative tax rate is established annually by the Board of Supervisors. The current rate is $2.10
per $100 of assessed value for qualified applicant’s vehicles.
Falls Church allows an exemption of up to the first $25.00 of personal property taxes on
one automobile per household for the low-income elderly and the permanently and totally
disabled.
The City of Alexandria provides personal property tax relief for persons that meet the
following requirements:
Eligibility Requirements:
The vehicle for which the relief is requested must be owned, or be partially owned and
used by or for the applicant. Lease vehicles do not qualify for tax relief.
The vehicle for which the tax relief is requested must be currently assessed by the City at
less than $30,000. (Only one vehicle per household shall be granted tax relief.)
The applicant must be at least 65 years of age, or permanently and totally disabled. The
applicant must provide proof of age or certification of disability if under 65.
Income requirements:
Total combined income of the applicant and his/her spouse shall not exceed $20,000 for
calendar year 2014.
The net combined financial worth (all assets, including vehicles) of the applicant and
his/her spouse, excluding the value of the principal residence and a lot of up to two acres
in the City, shall not exceed $75,000 as of December 31, 2014.

Part II: A Comparison of Tax Rates in the Washington Metropolitan Area as of January 1, 2015
2014 Tax Rates and Tax Burdens – Washington Metropolitan Area
Page 48
Table 14: Tangible Personal Property Tax Year 2014 – 2015 1/
RATE PER $100 OF VALUE
DISTRICT OF COLUMBIA $3.40 2/
MARYLAND 3/
Charles County
$3.0125
Montgomery County
$1.8075 (general county rate); $2.468 (weighted rate
inclusive of local special service area taxes)
Prince George’s County
$2.40 4/
VIRGINIA
Alexandria
$5.00 5/ ($4.50) 6/ ($3.55) 7/
Arlington County
$5.00 5/
Fairfax
$4.13 5/
Fairfax County
$4.57 5/ ($1.085) 8/ ($0.01) 9/
Falls Church
$4.84 5/
Loudoun County
$4.20 5/ 10/ ($2.75) 6/ ($1.205) 8/ ($1.00) 11/
($0.01) 9/ ($4.00) 12/ ($2.10) 13/
Prince William County
$3.70 4/ 12/ ($0.00) 14/ ($1.25) 15/ ($1.00) 16/
($1.181) 17/
Source: Survey of local government officials and local government web sites.
1/ The personal property tax year in Virginia area jurisdictions is on a calendar year basis. The rates submitted by Virginia jurisdictions for this report are applicable to calendar year 2014. In the District of Columbia and the Maryland area jurisdictions, the 2014 personal property tax
year is July 1, 2013 to June 30, 2014. The rates presented are those in effect for this period.
2/ First $225,000 of value is exempt from tax. 3/ Maryland property tax rate is not levied against personal property.
4/ Rate applies to non-town businesses. The county rate for incorporated town businesses ranges from $2.012 to $2.294.
5/ Rate applied to regular individual personal property and business tangible personal property. For 2013, Personal Property Tax Relief of 51% of the first $30,000 assessed (100% relief for vehicles assessed at $1,000 or less). Alexandria implemented a new personal property tax relief
structure, effective July 1, 2013, which offers 61% relief on the total assessed value of vehicles valued between $1,000 and $20,000; 50%
relief on the first $20,000 of assessed value for vehicles valued between $20,001 and $25,000; and 40% relief of the first $20,000 of assessed value for vehicles valued at $25,001 or higher.
6/ Rate applied to machinery and tools, and personal property used in a research and development business.
7/ Vehicles with special equipment designed to aid the handicapped are assessed at a rate of $3.55 per $100 of value. 8/ Rate applied to mobile homes and public service corporation non-vehicular personal property.
9/ Rate applied to aircraft and flight simulators, eligible vehicles of volunteers and auxiliary and Sheriff’s auxiliary, and aircraft public utility
personal property. Mobile homes are taxed at the real estate rate of $1.205 per $100. 10/ Vehicles using clean special fuels.
11/ Rate applied to four-wheeled electrically powered low-speed vehicles.
12/ Rate applied to heavy construction machinery. 13/ Rate applied to vehicles specially equipped for use by the handicapped and vehicles owned by certain elderly and disabled individuals.
14/ Rate applied to aircraft, volunteer fire and rescue member’s vehicle, farmer’s machinery and tools, personal property owned by certain
elderly and handicapped persons, privately owned recreational campers/motor homes/recreational travel trailers/horse trailers, van pool vans, vehicles modified for disabled, and watercraft.
15/ Rate applied to computer equipment and peripherals used in a trade/business.
16/ Rate applied to property used for research and development. 17/ Rate applied to mobile homes.
Part II: A Comparison of Tax Rates in the Washington Metropolitan Area as of January 1, 2015
2014 Tax Rates and Tax Burdens – Washington Metropolitan Area
Page 49
PUBLIC UTILITIES TAX
District of Columbia
The District imposes a gross receipts tax on utilities operating in the District of Columbia.
The rate is 10 percent of gross receipts from sales to residential customers and 11 percent of
gross receipts from sales to nonresidential customers. In addition, similar taxes are assessed on
heating oil companies, natural and artificial gas marketers, long distance telephone companies,
and subscription television, video, and radio service providers. Under provisions of the
Telecommunications Competition Act of 1996, the District assesses an 11 percent gross receipts
tax on local telephone companies, including wireless telecommunications providers. The
regulated utilities pay the bulk of the revenues associated with these taxes.
Maryland
The tax applies to any company engaged in a telegraph, telephone, oil pipeline, electric,
or gas business in the state. The tax is based on gross receipts for the preceding calendar year.
The rate is 2.04 percent and receipts subject to this tax are not subject to state income tax except
for long distance phone companies, which surcharge the tax to their customers.
In addition, retail sales of natural or artificial gas, oil, electricity, coal, nuclear fuel
assemblies, and steam for nonresidential use are also taxed by several local subdivisions.
Virginia
Electric and gas; water or heat; light and power companies; and telegraph and telephone
companies are subject to the tax at different rates. Telephone and telegraph taxes are based on
mileage of poles or conduits, including mileage of buried cable; an additional charge is
applicable to gross receipts from intrastate business.
A special tax not to exceed ½ of 1 percent is imposed on gross receipts for business done
in Virginia.
Virginia exempts consumers from tax for the use or consumption of gas, electricity, and
water delivered through mains, lines, or pipes. However, some Virginia localities do tax
consumers for these services at different rates.
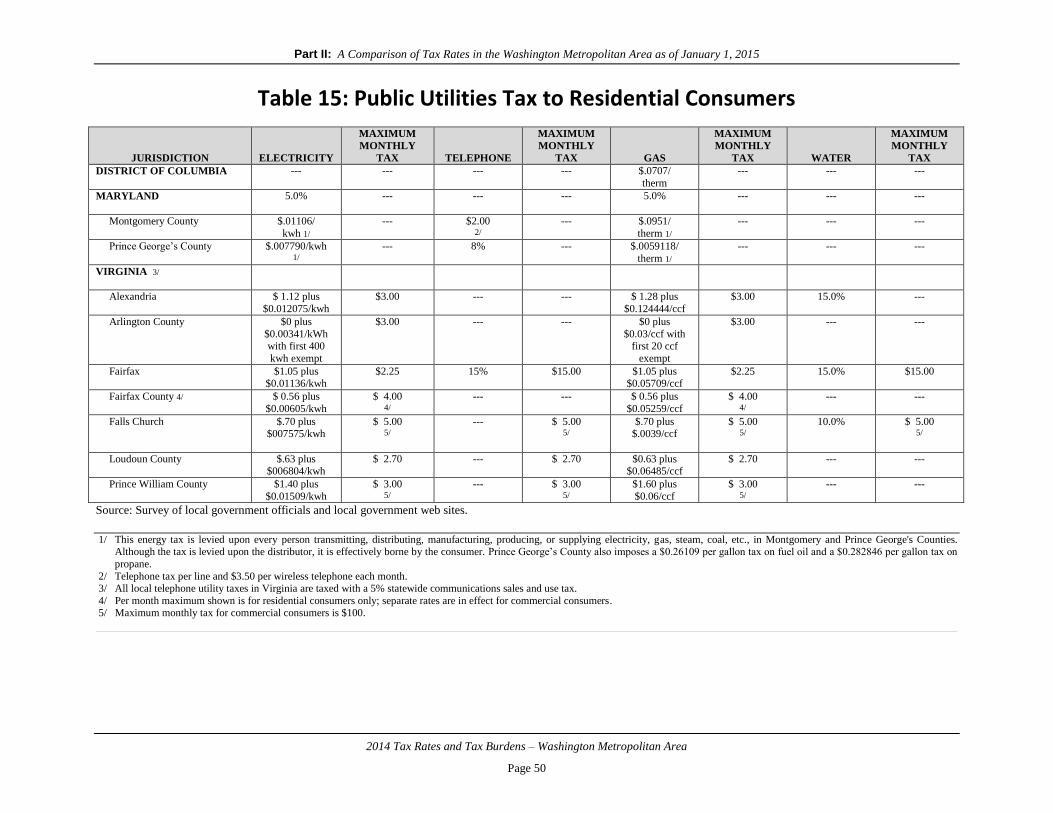
Part II: A Comparison of Tax Rates in the Washington Metropolitan Area as of January 1, 2015
2014 Tax Rates and Tax Burdens – Washington Metropolitan Area
Page 50
Table 15: Public Utilities Tax to Residential Consumers
JURISDICTION
ELECTRICITY
MAXIMUM
MONTHLY
TAX
TELEPHONE
MAXIMUM
MONTHLY
TAX
GAS
MAXIMUM
MONTHLY
TAX
WATER
MAXIMUM
MONTHLY
TAX
DISTRICT OF COLUMBIA
--- --- --- --- $.0707/
therm
--- --- ---
MARYLAND
5.0% --- --- --- 5.0% --- --- ---
Montgomery County $.01106/
kwh 1/
--- $2.00 2/
--- $.0951/
therm 1/
--- --- ---
Prince George’s County $.007790/kwh 1/
--- 8% --- $.0059118/
therm 1/
--- --- ---
VIRGINIA 3/
Alexandria $ 1.12 plus
$0.012075/kwh
$3.00 --- --- $ 1.28 plus
$0.124444/ccf
$3.00 15.0% ---
Arlington County
$0 plus
$0.00341/kWh with first 400
kwh exempt
$3.00 --- --- $0 plus
$0.03/ccf with first 20 ccf
exempt
$3.00 --- ---
Fairfax
$1.05 plus $0.01136/kwh
$2.25 15% $15.00 $1.05 plus $0.05709/ccf
$2.25 15.0% $15.00
Fairfax County 4/
$ 0.56 plus
$0.00605/kwh
$ 4.00 4/
--- --- $ 0.56 plus
$0.05259/ccf
$ 4.00 4/
--- ---
Falls Church $.70 plus $007575/kwh
$ 5.00 5/
--- $ 5.00 5/
$.70 plus $.0039/ccf
$ 5.00 5/
10.0% $ 5.00 5/
Loudoun County
$.63 plus $006804/kwh
$ 2.70 --- $ 2.70 $0.63 plus $0.06485/ccf
$ 2.70 --- ---
Prince William County $1.40 plus
$0.01509/kwh
$ 3.00 5/
--- $ 3.00 5/
$1.60 plus
$0.06/ccf
$ 3.00 5/
--- ---
Source: Survey of local government officials and local government web sites.
1/ This energy tax is levied upon every person transmitting, distributing, manufacturing, producing, or supplying electricity, gas, steam, coal, etc., in Montgomery and Prince George's Counties. Although the tax is levied upon the distributor, it is effectively borne by the consumer. Prince George’s County also imposes a $0.26109 per gallon tax on fuel oil and a $0.282846 per gallon tax on
propane.
2/ Telephone tax per line and $3.50 per wireless telephone each month. 3/ All local telephone utility taxes in Virginia are taxed with a 5% statewide communications sales and use tax.
4/ Per month maximum shown is for residential consumers only; separate rates are in effect for commercial consumers. 5/ Maximum monthly tax for commercial consumers is $100.

Part II: A Comparison of Tax Rates in the Washington Metropolitan Area as of January 1, 2015
2014 Tax Rates and Tax Burdens – Washington Metropolitan Area
Page 51
Table 16: Public Utilities Tax to Suppliers
JURISDICTION
UTILITIES
SUBJECT TO TAX
RATE
BASIS
DISTRICT OF COLUMBIA
Natural Gas
Residential
Non-residential
$.07070
$.07777
Per Therm
Electric distribution
Residential
Non-residential
$.0070
$.0077
Per Kilowatt Hour
Telecommunications
Residential
Non-residential
10.0%
11.0%
Gross receipts
Residential
Non-residential
MARYLAND
Telegraph, telephone,
oil pipeline, electric, or gas
companies
2.04%
Gross Receipts
VIRGINIA
Water
2.0%
Gross Receipts
Electric 1/
2,500 – 5,000 kWh
5,000 – 50,000 kWh
Above 50,000 kWh
Gas 1/
Below 500 CCF
$0.00155/kWh
$0.00099/kWh
$0.00075/kWh
$0.0135 /CCF
Utility Consumption
Telephone
2/
Source: “D.C. Tax Facts, 2015.” Government of the District of Columbia, Office of the Chief Financial Officer, Office of Revenue Analysis,
p. 22.
1/ Local consumption tax rates and a special regulatory tax rate may also apply.
2/ Telephone companies are subject to the corporate income tax, not the utility gross receipts tax.

Part II: A Comparison of Tax Rates in the Washington Metropolitan Area as of January 1, 2015
2014 Tax Rates and Tax Burdens – Washington Metropolitan Area
Page 52
RECORDATION AND TRANSFER TAXES
District of Columbia
A tax of 1.1 percent of the consideration is imposed on each deed when it is submitted for
recording if the fair market value is under $400,000; otherwise, the rate is 1.45 percent on fair
market value $400,000 and above. The minimum recordation tax is $1.00.
Another tax of 1.1 percent of the consideration paid is imposed on each transferor for
each transfer if the fair market value is under $400,000 and is payable at the time the deed is
submitted for recording; otherwise, the rate is 1.45 percent on fair market value $400,000 and
above. The minimum transfer tax is $1.00.
Transfers of economic interests in the District of Columbia are subject to a 2.9 percent tax
based on consideration paid.
Maryland
Instruments conveying title to real and personal property in Maryland are taxed at 0.11
percent of actual consideration paid. Instruments securing a debt are taxed at 0.11 percent of the
principal amount of the debt secured.
The Maryland state realty transfer tax is 0.5 percent of the consideration.
Charles County
The recordation tax in Charles County is 1.00 percent.
Montgomery County
Montgomery County's recordation tax is imposed at the rate of 0.69 percent.
The county transfer tax rate depends upon the type of real property involved. The tax is
1.0 percent of consideration on transfers of all unimproved realty; 1.0 percent on improved
residential and commercial realty value at $70,000 or more; 0.5 percent on transfers of improved
residential realty valued between $40,000 and $70,000 and 0.25 percent on improved residential
property valued under $40,000; from 0 percent to 6 percent (depending upon how long owned)
on transfers of farmland; and 6 percent on some transfers of property rezoned for a more
intensive use. There is an overall 6 percent limit on the total state agricultural and local transfer
taxes.

Part II: A Comparison of Tax Rates in the Washington Metropolitan Area as of January 1, 2015
2014 Tax Rates and Tax Burdens – Washington Metropolitan Area
Page 53
Prince George's County
The recordation tax rate in Prince George's County is 0.50 percent. In addition, the
county imposes a transfer tax of 1.4 percent of the selling price.
Virginia
The state recordation tax is $0.25 per $100, or fraction thereof, of the consideration of the
deed or the actual value of the property conveyed, whichever is greater. In addition, the state
allows cities and counties to impose a recordation tax of up to one-third of the state tax. The
cities of Alexandria, Fairfax, Falls Church, and the counties of Arlington, Fairfax, Loudoun, and
Prince William impose this tax at the rate of $0.0833 per $100.
The state realty conveyance tax is $0.50 for each $500, or fraction thereof, exclusive of
any lien or encumbrance remaining thereon when the consideration or the value of the interest
exceeds $100. One half of the conveyance tax collected is returned to the state treasury and one
half goes into the treasury of the locality of the property. The land transfer fee is one dollar and
is collected whenever improved or unimproved land of any amount of acreage is transferred
between two parties.

Part II: A Comparison of Tax Rates in the Washington Metropolitan Area as of January 1, 2015
2014 Tax Rates and Tax Burdens – Washington Metropolitan Area
Page 54
SALES AND USE TAXES
District of Columbia
The District of Columbia has five tax categories that fall under the general sales and use
tax. The retail sales tax rate of 5.75% is imposed on all tangible personal property sold or rented
at retail in the District and on certain selected services. Grocery-type foods, prescription and non-
prescription drugs, and professional services such as consulting, engineering, legal, and
physician services, are among the items exempt from the sales tax. Construction materials and
business purchases of public utility services are among those included. The Tax Revision
Commission Implementation Amendment Act of 2014 (BSA Subtitle (VII) (B)) expanded the
sales tax base to include some services not taxed in the District of Columba. These include
bottled water delivery services and other direct selling establishments, carpet and upholstery
cleaning services, fitness and recreational sports centers, and other personal care services such as
tanning, car washes, bowling centers and billiard parlors. The other rate categories apply to
goods and services as indicated below.
The use tax is imposed at the same rate on property sold or purchased outside the District
and then brought into the District to be used, stored, or consumed. Vendors who are subject to
the jurisdiction of the District are required to collect and pay the sales or use tax. When the
vendor is not subject to the jurisdiction of the District, or when the purchaser brings the property
into the District, the purchaser is required to pay the tax.
ITEMS SALES TAX RATE
Tangible personal property, selected services, and food sold in vending machines 5.75%
Medical marijuana 6.0%
Restaurant meals, liquor sold for consumption on and off the premises, rental
vehicles, prepaid telephone cards, tickets sold for baseball games, merchandise sold
at the baseball stadium, tickets sold for events at the Verizon Center, and merchandise
sold at the Verizon Center.
10.0%
Transient accommodations 14.5%
Parking motor vehicles in commercial lots 18.0% Source: “D.C. Tax Facts 2015.” Government of the District of Columbia, Office of the Chief Financial Officer, Office of Revenue Analysis,
p.27.

Part II: A Comparison of Tax Rates in the Washington Metropolitan Area as of January 1, 2015
2014 Tax Rates and Tax Burdens – Washington Metropolitan Area
Page 55
Maryland
A six percent tax is imposed on retail sales, including the rental, lease or royalty of
tangible personal property, including: (a) sales of food and drink on purchases over $1.00; (b)
production, fabrication or printing of tangible personal property on special order; (c) sales of
tangible personal property to contractors, builders or landowners for use or resale in the form of
real estate; (d) lodgings or accommodations; and (e) sales of tangible personal property and/or
services to persons who will use them as facilities, tools, machinery or equipment, even though
the intention is to transfer title to the property. Alcoholic beverage sales are subject to a 9 percent
tax.
Rental of passenger cars for 180 days or less is taxed at the rate of 11½ percent, while
certain short-term truck rentals are taxed at 8 percent.
Residential public utilities (natural or artificial gas, electricity, steam, and coal) are
exempt from the sales tax. This exemption covers residential properties containing not more
than four units, including cooperative housing, condominiums, and other similar residential
living arrangements.
In addition to the state rate of 6 percent, Maryland localities impose a tax ranging from
0.5 percent to 10 percent on admissions to movie theaters, concerts, amusement parks, and
various other events.
Virginia
A 5.0 percent state tax and a state-administered 1.0 percent local tax is imposed on retail
sales, proceeds from leases and rentals, and proceeds from transient accommodations. Among
the exempt items are gas, electricity, home heating fuel, water, alcoholic beverages sold by the
state, certain medical supplies, and charitable purchases.
Vending machine dealers are taxed at 6.3 percent (there is an additional 0.7 percent state
tax imposed in the localities that make up Northern Virginia and Hampton Roads, making the
rate in these regions 7 percent, and the sales tax rate on groceries is 2.5 percent.

Part II: A Comparison of Tax Rates in the Washington Metropolitan Area as of January 1, 2015
2014 Tax Rates and Tax Burdens – Washington Metropolitan Area
Page 56
Table 17: Sales and Use Tax Rates
JURISDICTION
GENERAL RATE
ADMISSIONS
TRANSIENT
ACCOMMODATIONS
RESTAURANT
MEALS
STATE LOCAL STATE LOCAL STATE LOCAL STATE LOCAL
DISTRICT OF
COLUMBIA
5.75% --- 10.0% --- 14.5% --- 10.0% ---
MARYLAND
6.0% --- 10.0% --- 6.0% --- 6.0% ---
Charles County --- --- --- +5-10% --- +5.0% 1/
--- ---
Montgomery County --- --- --- 7% 2/
--- +7.0% 3/ 4/
--- ---
Prince George’s County --- --- --- +0.5-
10%
--- +5.0%
--- ---
VIRGINIA
5.0% --- 10.0% --- 4.0% --- --- ---
Alexandria --- +1.0% --- 10%
5/
--- +6.5% plus
$1.00 per
night/room
--- +4.0%
Arlington County --- +1.0% --- --- --- +5.0% 6/
--- +4.0%
Fairfax --- +1.0% --- --- --- +4.0% --- +4.0%
Fairfax County --- +1% plus
0.7% for
transport-
ation
--- --- --- +6.0%
--- ---
Falls Church --- +1.0% --- --- --- +7.0%
--- +4.0%
Loudoun County --- +1.0% --- --- --- +7.0%
--- ---
Prince William County
--- +1.0% --- --- --- +7.0%
--- ---
Source: Survey of local government officials and local government web sites.
+ In addition to state rate.
1/ Permanent residents of 120 days or more are exempt from the tax.
2/ Rates are generally 7%, but are limited to 5% when the state sales tax is applied, since the combination of the two taxes may not exceed 10%.
3/ Rates range from 5 to 10%. 4/ 3.5% is allocated to the Montgomery County Conference and Visitors Bureau, and Convention Center.
5/ Alexandria admissions tax not to exceed $.50 per person.
6/ Tax not imposed on residents of more than 30 consecutive days.

Part II: A Comparison of Tax Rates in the Washington Metropolitan Area as of January 1, 2015
2014 Tax Rates and Tax Burdens – Washington Metropolitan Area
Page 57
WATER AND SEWERAGE USER CHARGES (RESIDENTIAL)
Charges for water and sanitary sewerage and basic rates for each jurisdiction are
presented in Table 18, on the following page. Average cost per 1,000 gallons is the common
standard used. Special charges for service connections, availability, demand and account service
and frontfoot (a foot measured along the front of a piece of property) assessments are not
included in Table 18.
The rates for Loudoun and Prince William Counties are those that exist in the town of
Leesburg. This is done to simplify the rates because rates differ throughout these counties
according to the city or town of residency.
In Virginia and Maryland jurisdictions, billing is quarterly, while the District of Columbia
bills monthly.
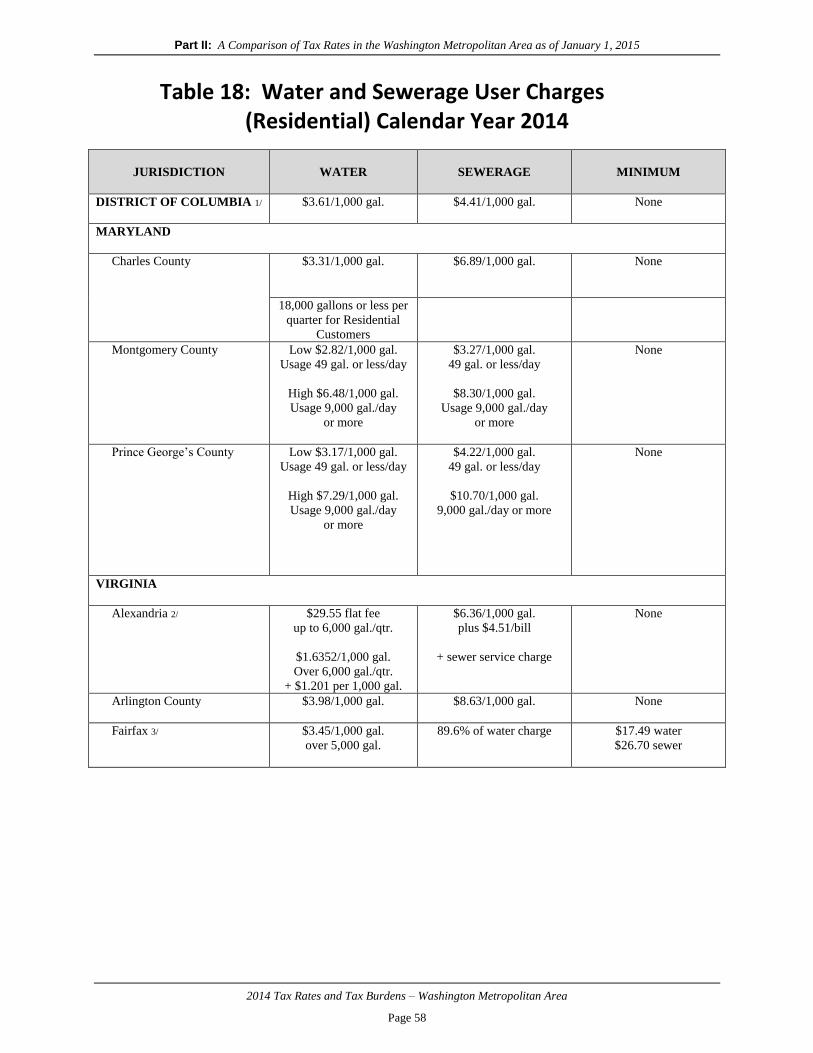
Part II: A Comparison of Tax Rates in the Washington Metropolitan Area as of January 1, 2015
2014 Tax Rates and Tax Burdens – Washington Metropolitan Area
Page 58
Table 18: Water and Sewerage User Charges (Residential) Calendar Year 2014
JURISDICTION
WATER
SEWERAGE
MINIMUM
DISTRICT OF COLUMBIA 1/ $3.61/1,000 gal.
$4.41/1,000 gal. None
MARYLAND
Charles County $3.31/1,000 gal. $6.89/1,000 gal. None
18,000 gallons or less per
quarter for Residential
Customers
Montgomery County Low $2.82/1,000 gal.
Usage 49 gal. or less/day
High $6.48/1,000 gal.
Usage 9,000 gal./day
or more
$3.27/1,000 gal.
49 gal. or less/day
$8.30/1,000 gal.
Usage 9,000 gal./day
or more
None
Prince George’s County Low $3.17/1,000 gal.
Usage 49 gal. or less/day
High $7.29/1,000 gal.
Usage 9,000 gal./day
or more
$4.22/1,000 gal.
49 gal. or less/day
$10.70/1,000 gal.
9,000 gal./day or more
None
VIRGINIA
Alexandria 2/ $29.55 flat fee
up to 6,000 gal./qtr.
$1.6352/1,000 gal.
Over 6,000 gal./qtr.
+ $1.201 per 1,000 gal.
$6.36/1,000 gal.
plus $4.51/bill
+ sewer service charge
None
Arlington County $3.98/1,000 gal.
$8.63/1,000 gal. None
Fairfax 3/ $3.45/1,000 gal.
over 5,000 gal.
89.6% of water charge $17.49 water
$26.70 sewer

Part II: A Comparison of Tax Rates in the Washington Metropolitan Area as of January 1, 2015
2014 Tax Rates and Tax Burdens – Washington Metropolitan Area
Page 59
Table 18: Water and Sewerage User Charges (Residential) Calendar Year 2014, Continued
JURISDICTION
WATER
SEWERAGE
MINIMUM
Fairfax County 4/ $2.29/1,000 gal.
$6.55/1,000 gal. None
Falls Church 3/ $4.99/1,000 gal. $8.62/1,000 gal. None
Loudoun County 5/ $4.02/1,000 gal.
$5.37/1,000 gal. None
Prince William County
(Service Authority)
$3.35/1,000 gal. $6.55/1,000 gal. None
Source: Survey of local government officials and local government web sites.
1/ Additional $0.58 per month is charged for residential storm water fee. These rates cover FY2014, beginning on Oct. 1, 2014. FY2013 rates were: $3.42/1,000 gal.for water and $4.18/1,000 gal. for sewerage.
2/ The water in Alexandria is supplied by "Virginia American Water Company", a private company. 3/ Water and sewerage services are primarily provided by the Fairfax County Water Authority and Fairfax County, respectively. A small
number of County residents on an exception-only basis receive their water and sewerage services from one of the following: Fairfax City,
Falls Church, Herndon and Vienna. These residents pay the rates set by the supplier, which may differ from the rates set forth above. 4/ Established customers are subject to a peak usage rate of $3.45/1,000 gallons during the summer quarters on water consumption that exceeds
winter quarter usage by 6,000 gallons or 30 percent, whichever is higher.
5/ Rates shown are for the Town of Leesburg, excludes the Towns of Hamilton, Hillsboro, Lovettsville, Middleburg, Purcellville, and Round Hill.

Part II: A Comparison of Tax Rates in the Washington Metropolitan Area as of January 1, 2015
2014 Tax Rates and Tax Burdens – Washington Metropolitan Area
Page 60
MISCELLANEOUS TAXES
District of Columbia
Uniform Disposition of Unclaimed Property
The District of Columbia is authorized to act as conservator over property presumed
abandoned and held by businesses and financial corporations by mandating the reporting and
delivery of such property into the custody of the Mayor.
The Uniform Disposition of Unclaimed Property Act includes all tangible and/or
intangible personal property and requires that reports be filed annually. Banks, businesses and
other financial corporations must report on or before November 1 for property abandoned by the
preceding June 30. Life insurance companies must report by May 1 for property abandoned by
the preceding December 31.
Other Miscellaneous Taxes
911 Emergency
Wireless/Wireline Subscribers $0.76 per line per month
Centrex Lines $0.62 per line per month
Private Branch Exchange (PBX) Station $0.62 per line per month
Maryland
Uniform Disposition of Abandoned Property
Maryland's unclaimed property law is custodial in nature. The law covers tangible and
intangible personal property and requires holders to file a report annually.
The reporting period for an insurance company is from January 1 through December 31,
of each year and the report is due no later than April 30 of the following year. Reports for all
other entities (banks, financial organizations, utilities and corporations) cover the period of July
1 through June 30 of each year and must be filed no later than October 31 of that year.
Other Miscellaneous Taxes
Montgomery County:
911 Emergency $1.00 per bill per month
Telephone Service $0.75 to county
Charge $0.25 to state trust fund

Part II: A Comparison of Tax Rates in the Washington Metropolitan Area as of January 1, 2015
2014 Tax Rates and Tax Burdens – Washington Metropolitan Area
Page 61
Other Miscellaneous Taxes-continued
Prince George's County:
911 Emergency $1.00 per line per month
Telephone Service $0.75 to county
Charge $0.25 to state trust fund
Charles County:
911 Emergency $1.00 per line per month
Telephone Service $0.75 to county
Charge $0.25 to state trust fund
Virginia
Business Litter Tax
Virginia imposes an annual $10 litter tax on each business establishment that produces
litter. An additional $15 tax is levied on each business operating as a manufacturer, wholesaler,
distributor, or retailer of groceries, soft drinks, carbonated water, beer, or other malt beverages.
Uniform Disposition of Unclaimed Property
All unclaimed property is subject to the custody of the Commonwealth of Virginia,
including funds or other property, tangible and intangible, including any income or increments
thereon, less any lawful charges that are held, issued or owing in the ordinary course of the
holder's business and have remained unclaimed by the owner.
Banking organizations, business associations and financial organizations must file an
unclaimed property report before November 1 of each year as of June 30 preceding. Insurance
corporations must file a report before May 1 of each year as of the preceding December 31.
Other Miscellaneous Taxes
VA E-911 All local E-911 fees have been
replaced with a statewide $0.50
per line per month fee. Also, all
local mobile telecommunications
taxes in Virginia have been
replaced with a 5 percent
statewide communications sales
and use tax.
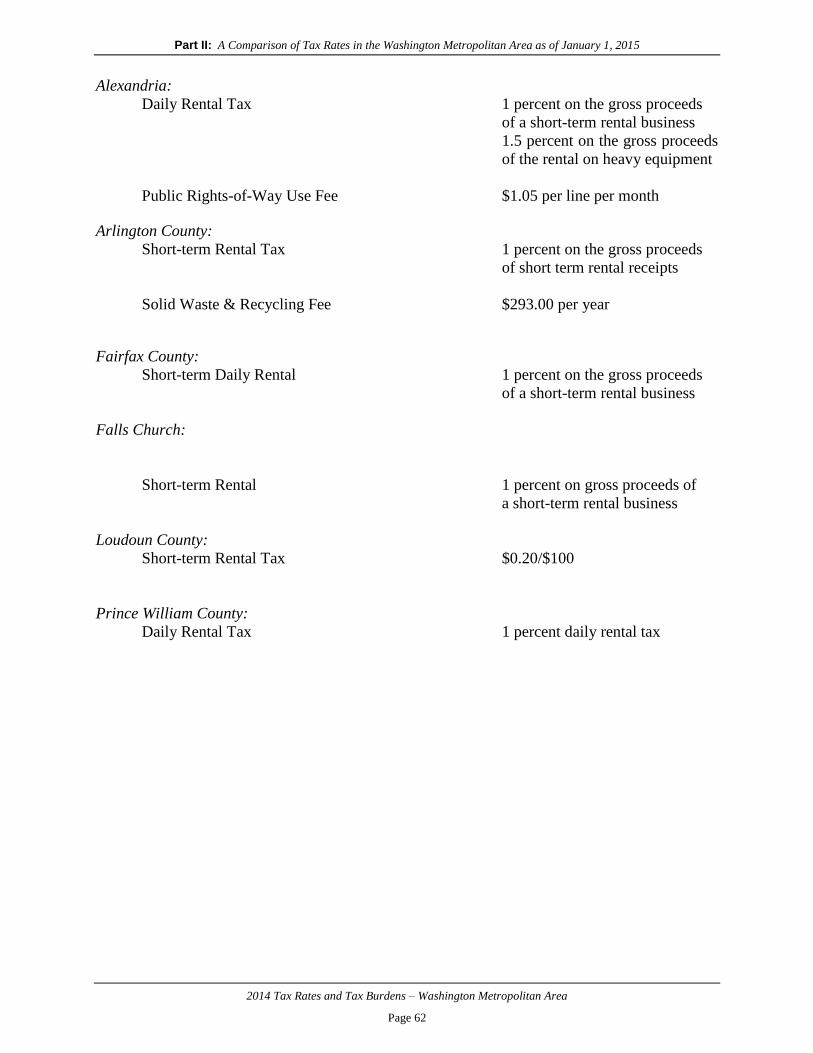
Part II: A Comparison of Tax Rates in the Washington Metropolitan Area as of January 1, 2015
2014 Tax Rates and Tax Burdens – Washington Metropolitan Area
Page 62
Alexandria:
Daily Rental Tax 1 percent on the gross proceeds
of a short-term rental business
1.5 percent on the gross proceeds
of the rental on heavy equipment
Public Rights-of-Way Use Fee $1.05 per line per month
Arlington County:
Short-term Rental Tax 1 percent on the gross proceeds
of short term rental receipts
Solid Waste & Recycling Fee $293.00 per year
Fairfax County:
Short-term Daily Rental 1 percent on the gross proceeds
of a short-term rental business
Falls Church:
Short-term Rental 1 percent on gross proceeds of
a short-term rental business
Loudoun County:
Short-term Rental Tax $0.20/$100
Prince William County:
Daily Rental Tax 1 percent daily rental tax

Appendix
2014 Tax Rates and Tax Burdens – Washington Metropolitan Area
Page 63
Appendix A: Additional Tax Burden Maps

Appendix
2014 Tax Rates and Tax Burdens – Washington Metropolitan Area
Page 64
Map 2: DC Metro Area Map
Montgomery County, MD
DC
Arlington,
VA
Alexandria,
VA
Fairfax County, VA
Fairfax
City, VA
Falls Church,
VA
Prince George’s
County, MD
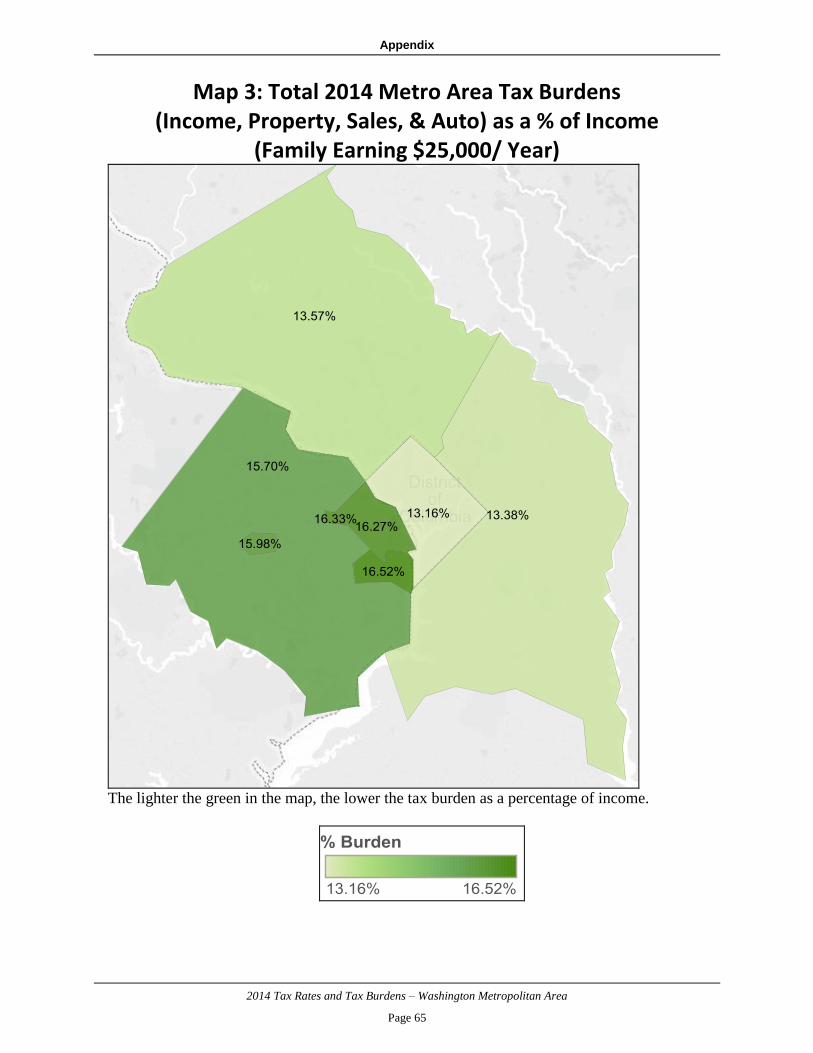
Appendix
2014 Tax Rates and Tax Burdens – Washington Metropolitan Area
Page 65
Map 3: Total 2014 Metro Area Tax Burdens (Income, Property, Sales, & Auto) as a % of Income
(Family Earning $25,000/ Year)
The lighter the green in the map, the lower the tax burden as a percentage of income.
DC

Appendix
2014 Tax Rates and Tax Burdens – Washington Metropolitan Area
Page 66
Map 4: Total 2014 Metro Area Tax Burdens (Income, Property, Sales, & Auto) as a % of Income
(Family Earning $50,000/ Year)
The lighter the green in the map, the lower the tax burden as a percentage of income.
DC
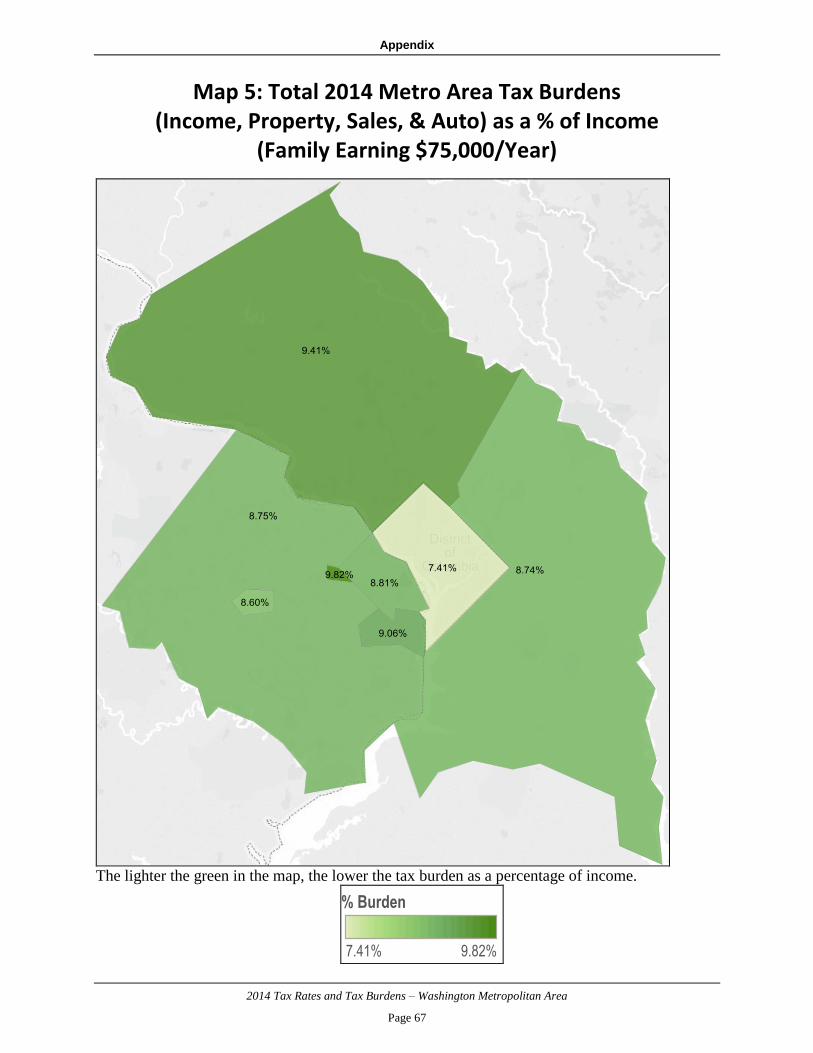
Appendix
2014 Tax Rates and Tax Burdens – Washington Metropolitan Area
Page 67
Map 5: Total 2014 Metro Area Tax Burdens (Income, Property, Sales, & Auto) as a % of Income
(Family Earning $75,000/Year)
The lighter the green in the map, the lower the tax burden as a percentage of income.
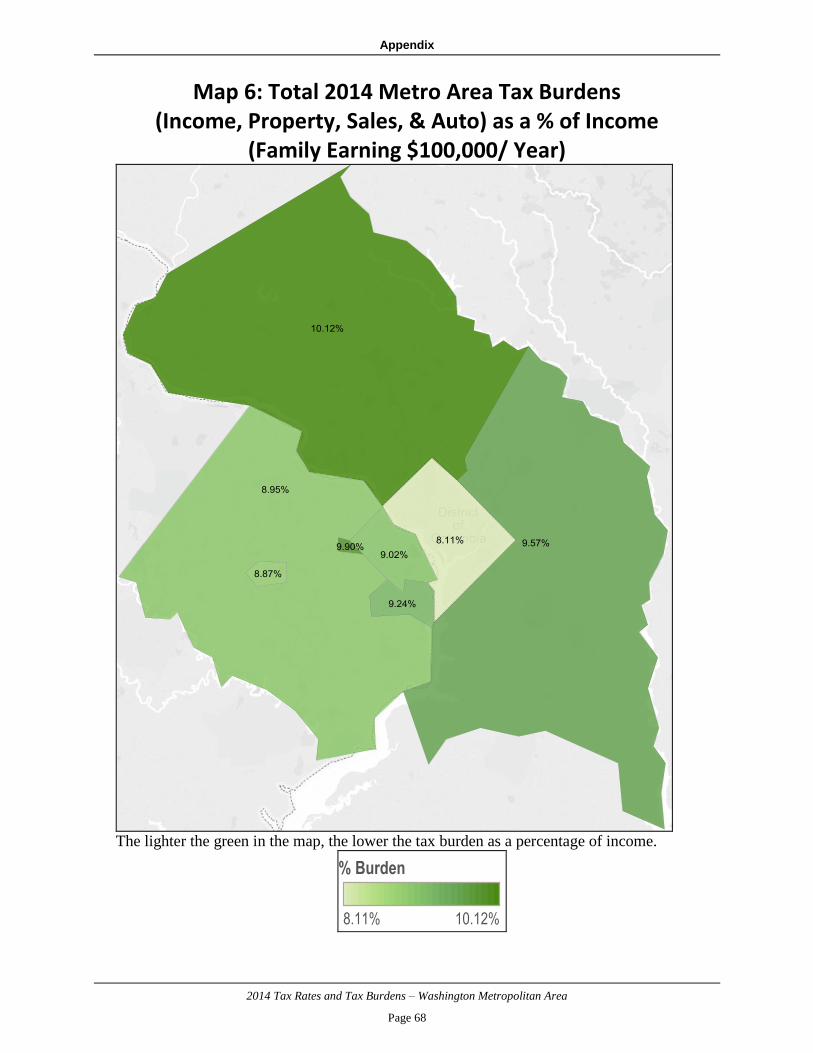
Appendix
2014 Tax Rates and Tax Burdens – Washington Metropolitan Area
Page 68
Map 6: Total 2014 Metro Area Tax Burdens (Income, Property, Sales, & Auto) as a % of Income
(Family Earning $100,000/ Year)
The lighter the green in the map, the lower the tax burden as a percentage of income.

Appendix
2014 Tax Rates and Tax Burdens – Washington Metropolitan Area
Page 69
Map 7: Total 2014 Metro Area Tax Burdens (Income, Property, Sales, & Auto) as a % of Income
(Family Earning $150,000/ Year)
The lighter the green in the map, the lower the tax burden as a percentage of income.

2014 Tax Rates and Tax Burdens – Washington Metropolitan Area
Page 70
OFFICE LOCATIONS AND TELEPHONE NUMBERS
Office of the Chief Financial Officer
The John A. Wilson Building
1350 Pennsylvania Avenue, NW, Suite 203
Washington, D.C. 20004
Office hours: Monday through Friday, 8:00 a.m. – 6:00 p.m.
(202) 727-2476
Office of the Chief Financial Officer
Jeffrey DeWitt, Chief Financial Officer
Angell Jacobs, Chief of Staff and Deputy Chief Financial Officer
David Tseng, General Counsel
Richard Weil, Chief Information Officer
Paul Lundquist, Executive Director for Management and Administration
David Umansky, Public Affairs Officer
Timothy Barry, Executive Director for Integrity & Oversight
John P. Ross, Director of Economic Development Finance
Marshelle Richardson, Chief Risk Officer
Office of Revenue Analysis (ORA)
Fitzroy Lee, Deputy Chief Financial Officer
1101 4th Street, SW, Suite W770, Washington, D.C. 20024
(202) 727-7775
Office of Budget and Planning (OBP)
Gordon McDonald, Deputy Chief Financial Officer
1350 Pennsylvania Avenue, NW, Suite 229, Washington, D.C. 20004
(202) 727-6234
Office of Finance and Treasury (OFT)
Jeffrey Barnette, Deputy Chief Financial Officer and Treasurer
1101 4th Street, SW, Suite W800, Washington, D.C. 20024
(202) 727-6055
Office of Financial Operations and Systems (OFOS)
Bill Slack, Deputy Chief Financial Officer
1100 4th Street, SW, Suite E800, Washington, D.C. 20024
(202) 442-8200
Office of Tax and Revenue (OTR)
Stephen M. Cordi, Deputy Chief Financial Officer
1101 4th Street, SW, Suite W750, Washington, D.C. 20024
(202) 442-6200
D.C. Lottery Tracy Cohen, (Interim) Executive Director
Economic Development and Regulation Cyril O. Byron, Jr., Associate Chief Financial Officer
EventsD.C. Henry Mosley, Associate Chief Financial Officer
Government Operations Mohamed Mohamed, Associate Chief Financial Officer
Government Services George Dines, Associate Chief Financial Officer
Health Benefits Exchange Authority Keith Fletcher, Associate Chief Financial Officer
Human Support Services Delicia Moore, Associate Chief Financial Officer
Not-for-Profit Hospital Corporation Barbara Roberson, Associate Chief Financial Officer
Primary and Secondary Education Deloras Shepherd, Associate Chief Financial Officer
Public Safety and Justice Angelique Hayes, Associate Chief Financial Officer

Prepared By:
Government of the District of Columbia
Office of Revenue Analysis
1101 4th Street, S.W.
Suite W770
Washington, D.C. 20024
(202) 727-7775